Final audit - executive summary - The Liebe Group
16
Liebe Group Technical Audit Results ~ Executive Summary GRDC Funded Liebe Group Project LIE 00005 ‘Growers Critically Analysing New Technologies For Improved Farming Systems’ The Liebe Group sincerely thanks the project supporter GRDC and the growers involved in the technical audit process. Evaluating the implementation of new technologies in the Northern Agricultural Region of Western Australia.
Transcript of Final audit - executive summary - The Liebe Group
Liebe Group Technical Audit Results ~
Executive Summary
GRDC Funded Liebe Group Project LIE 00005‘Growers Critically Analysing New Technologies For Improved Farming Systems’
The Liebe Group sincerely thanks the project supporter
GRDC and the growers involved in the technical
audit process.
Evaluating the implementation of new technologies in the Northern Agricultural Region of Western Australia.
2 Liebe Group Technical Audit Results - Executive Summary
Funding from the Grains Research and Development Corporation (GRDC) has enabled the Liebe Group to undertake a three year project that has benchmarked, investigated and improved the adoption of various technologies and management practices throughout the Liebe Group region (Coorow, Dalwallinu, Perenjori and Wongan-Ballidu shires). The project commenced in July 2006 and is titled ‘Growers critically analysing new technologies for improved farming systems’.
The project focuses on three technologies/management strategies that were chosen by local growers as the most likely factors to influence their farming enterprise in the medium term (approximately five years). The three focus technologies are;
1. Variation of management strategies - includes the use of map-based yield, soil and biomass information and input-control technologies to efficiently match agronomy with paddock variability,
2. Soil management strategies - includes proactive management practices to address physical, chemical and biological constraints of the soil, and
3. Innovative enterprise analysis - includes strategic decision making processes which lead to the adoption of new enterprises or management practices.
The membership rationale for focusing on these areas of research was that ‘growers making more effective adoption decisions will result in their businesses being more profitable, productive and ensuring their farming systems are sustainable’.
This executive summary details the results obtained from the initial and final technical audit surveys. Results from members and non-members have been combined to show all responses gained from the audits. The figures are averages derived from all growers who were surveyed. For the full technical audit reports and analysis of the results please contact the Liebe Group.
ContentsContentsContentsContents ______________________________________________________________________________________________ Title Page number _____________________________________________________________________________________
Technical Audit Background 3
General Socio-Economic Information 3
Variation of Management Strategies 4
Soil Management Practices 7
Innovative Enterprise Analysis 11
General Information 13
Feedback 14
Technical Audit Process Summary 15
Acknowledgments and Further Information 16
Disclaimer: All information in this booklet is believed to be true and correct. No responsibility is taken for any incorrect information printed.
Project Background Project Background Project Background Project Background
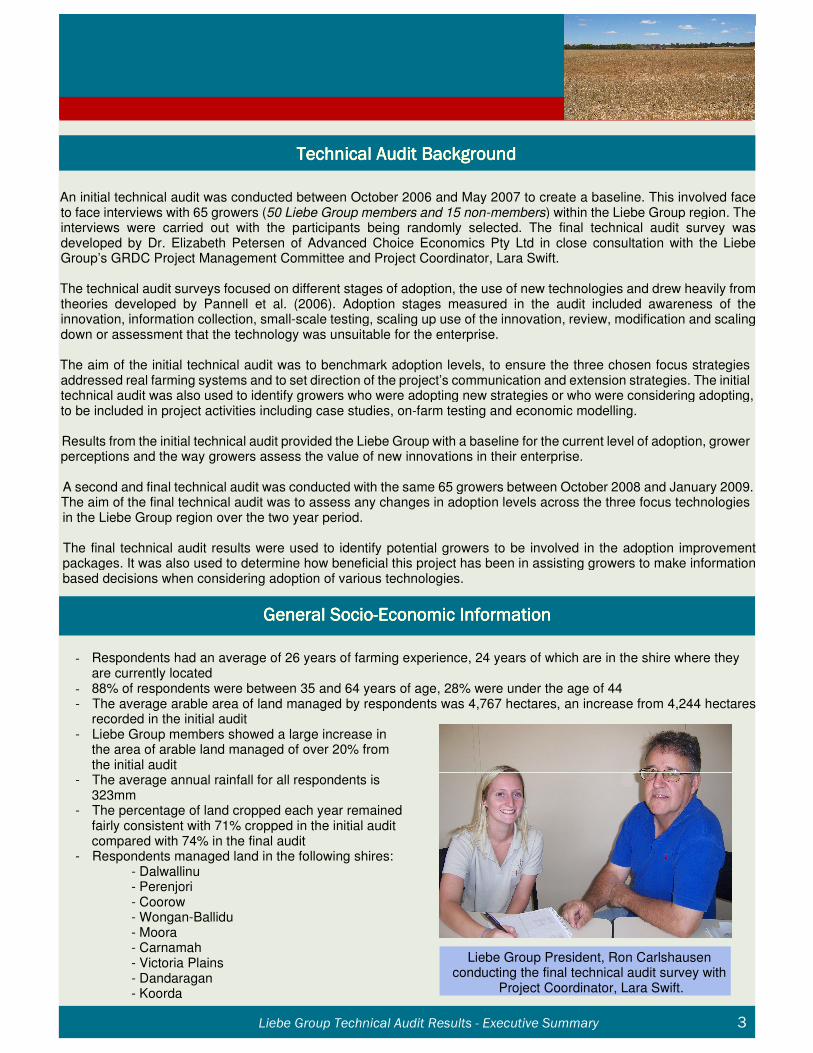
Liebe Group President, Ron Carlshausen conducting the final technical audit survey with
Project Coordinator, Lara Swift.
An initial technical audit was conducted between October 2006 and May 2007 to create a baseline. This involved face to face interviews with 65 growers (50 Liebe Group members and 15 non-members) within the Liebe Group region. The interviews were carried out with the participants being randomly selected. The final technical audit survey was developed by Dr. Elizabeth Petersen of Advanced Choice Economics Pty Ltd in close consultation with the Liebe Group’s GRDC Project Management Committee and Project Coordinator, Lara Swift.
The technical audit surveys focused on different stages of adoption, the use of new technologies and drew heavily from theories developed by Pannell et al. (2006). Adoption stages measured in the audit included awareness of the innovation, information collection, small-scale testing, scaling up use of the innovation, review, modification and scaling down or assessment that the technology was unsuitable for the enterprise.
The aim of the initial technical audit was to benchmark adoption levels, to ensure the three chosen focus strategies addressed real farming systems and to set direction of the project’s communication and extension strategies. The initial technical audit was also used to identify growers who were adopting new strategies or who were considering adopting, to be included in project activities including case studies, on-farm testing and economic modelling.
Results from the initial technical audit provided the Liebe Group with a baseline for the current level of adoption, grower perceptions and the way growers assess the value of new innovations in their enterprise.
A second and final technical audit was conducted with the same 65 growers between October 2008 and January 2009. The aim of the final technical audit was to assess any changes in adoption levels across the three focus technologies in the Liebe Group region over the two year period.
The final technical audit results were used to identify potential growers to be involved in the adoption improvement packages. It was also used to determine how beneficial this project has been in assisting growers to make information based decisions when considering adoption of various technologies.
- Respondents had an average of 26 years of farming experience, 24 years of which are in the shire where they are currently located
- 88% of respondents were between 35 and 64 years of age, 28% were under the age of 44 - The average arable area of land managed by respondents was 4,767 hectares, an increase from 4,244 hectares recorded in the initial audit- Liebe Group members showed a large increase in the area of arable land managed of over 20% from the initial audit- The average annual rainfall for all respondents is 323mm- The percentage of land cropped each year remained fairly consistent with 71% cropped in the initial audit compared with 74% in the final audit- Respondents managed land in the following shires:
- Dalwallinu - Perenjori - Coorow - Wongan-Ballidu - Moora - Carnamah - Victoria Plains - Dandaragan - Koorda
General Socio-Economic InformationGeneral Socio-Economic InformationGeneral Socio-Economic InformationGeneral Socio-Economic Information
Technical Audit BackgroundTechnical Audit BackgroundTechnical Audit BackgroundTechnical Audit Background
Liebe Group Technical Audit Results - Executive Summary 3
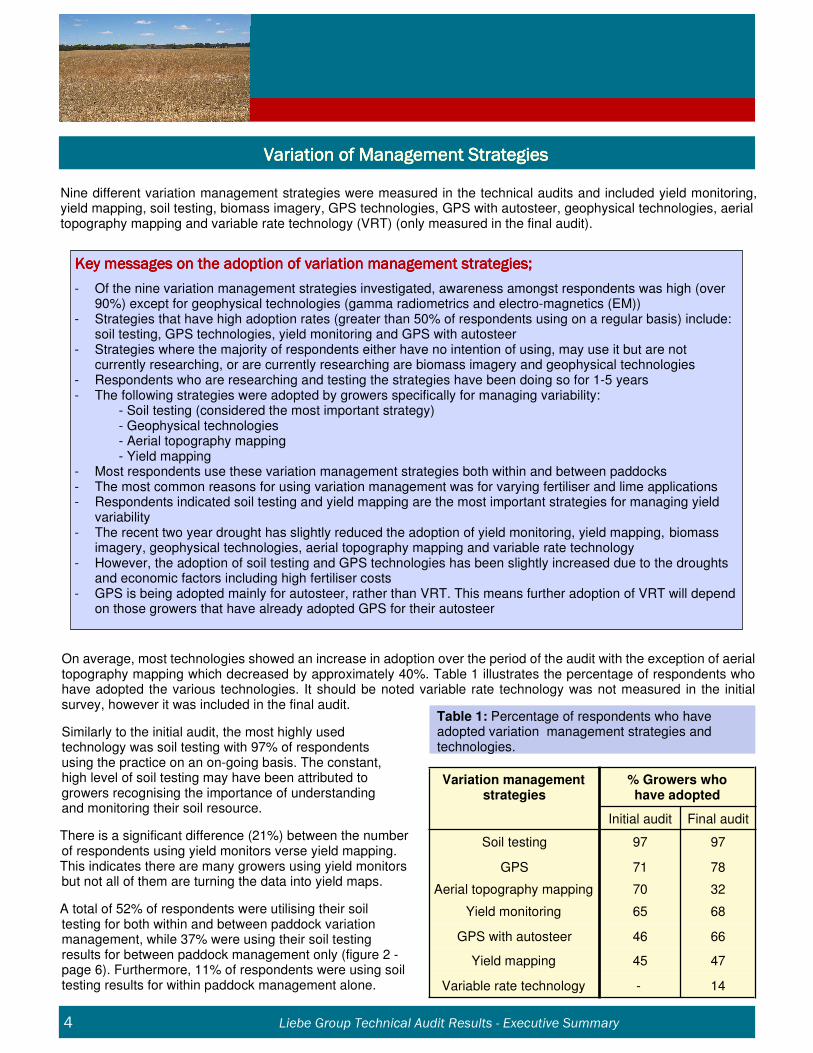
On average, most technologies showed an increase in adoption over the period of the audit with the exception of aerial topography mapping which decreased by approximately 40%. Table 1 illustrates the percentage of respondents who have adopted the various technologies. It should be noted variable rate technology was not measured in the initial survey, however it was included in the final audit.
Similarly to the initial audit, the most highly used technology was soil testing with 97% of respondents using the practice on an on-going basis. The constant, high level of soil testing may have been attributed to growers recognising the importance of understanding and monitoring their soil resource.
There is a significant difference (21%) between the numberof respondents using yield monitors verse yield mapping. This indicates there are many growers using yield monitors but not all of them are turning the data into yield maps.
A total of 52% of respondents were utilising their soil testing for both within and between paddock variation management, while 37% were using their soil testing results for between paddock management only (figure 2 - page 6). Furthermore, 11% of respondents were using soil testing results for within paddock management alone.
4 Liebe Group Technical Audit Results - Executive Summary
Variation management strategies
% Growers who have adopted
Initial audit Final audit
Soil testing 97 97
GPS 71 78
Aerial topography mapping 70 32
Yield monitoring 65 68
GPS with autosteer 46 66
Yield mapping 45 47
Variable rate technology - 14
Table 1: Percentage of respondents who have adopted variation management strategies and technologies.
Variation of Management StrategiesVariation of Management StrategiesVariation of Management StrategiesVariation of Management Strategies
Key messages on the adoption of variation management strategies; Key messages on the adoption of variation management strategies; Key messages on the adoption of variation management strategies; Key messages on the adoption of variation management strategies;
- Of the nine variation management strategies investigated, awareness amongst respondents was high (over 90%) except for geophysical technologies (gamma radiometrics and electro-magnetics (EM)) - Strategies that have high adoption rates (greater than 50% of respondents using on a regular basis) include: soil testing, GPS technologies, yield monitoring and GPS with autosteer - Strategies where the majority of respondents either have no intention of using, may use it but are not currently researching, or are currently researching are biomass imagery and geophysical technologies - Respondents who are researching and testing the strategies have been doing so for 1-5 years - The following strategies were adopted by growers specifically for managing variability: - Soil testing (considered the most important strategy) - Geophysical technologies - Aerial topography mapping - Yield mapping - Most respondents use these variation management strategies both within and between paddocks - The most common reasons for using variation management was for varying fertiliser and lime applications - Respondents indicated soil testing and yield mapping are the most important strategies for managing yield variability - The recent two year drought has slightly reduced the adoption of yield monitoring, yield mapping, biomass imagery, geophysical technologies, aerial topography mapping and variable rate technology - However, the adoption of soil testing and GPS technologies has been slightly increased due to the droughts and economic factors including high fertiliser costs - GPS is being adopted mainly for autosteer, rather than VRT. This means further adoption of VRT will depend on those growers that have already adopted GPS for their autosteer
Nine different variation management strategies were measured in the technical audits and included yield monitoring, yield mapping, soil testing, biomass imagery, GPS technologies, GPS with autosteer, geophysical technologies, aerial topography mapping and variable rate technology (VRT) (only measured in the final audit).
Participants recorded within and between paddock variation management was largely used for varying fertiliser, herbicide and lime applications, followed by the management of seeding rates, culling poor performing areas within a paddock and for crop species choice.
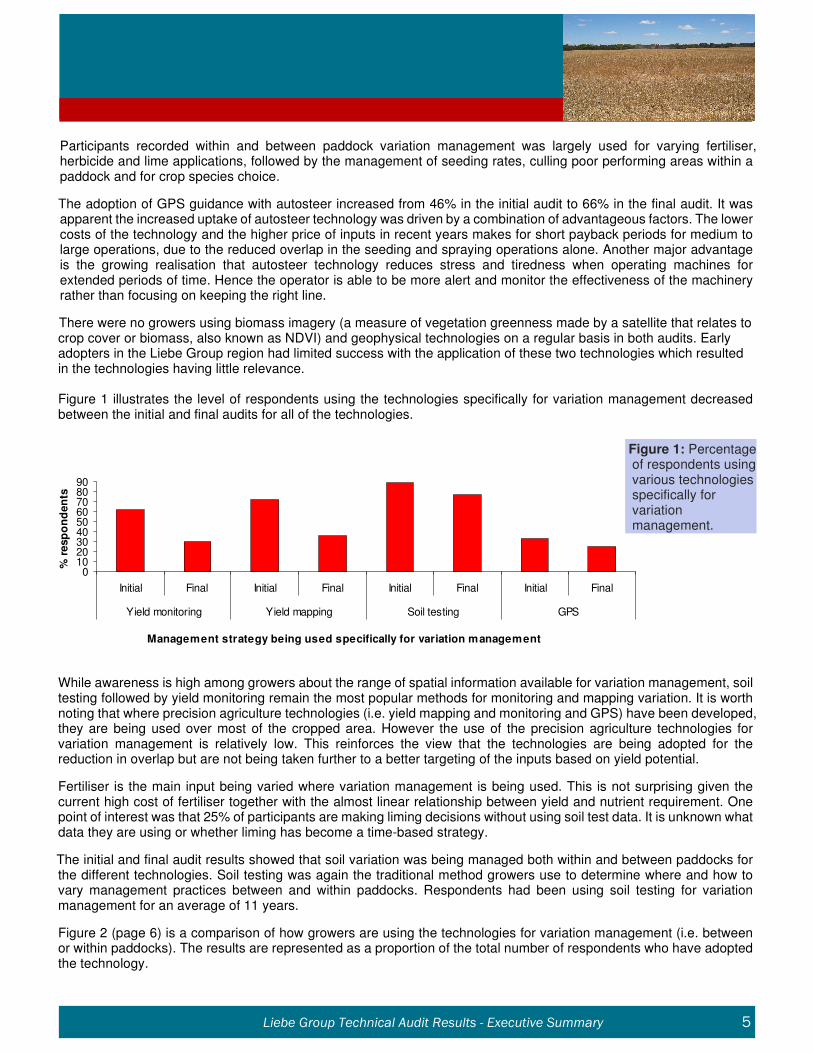
The adoption of GPS guidance with autosteer increased from 46% in the initial audit to 66% in the final audit. It was apparent the increased uptake of autosteer technology was driven by a combination of advantageous factors. The lower costs of the technology and the higher price of inputs in recent years makes for short payback periods for medium to large operations, due to the reduced overlap in the seeding and spraying operations alone. Another major advantage is the growing realisation that autosteer technology reduces stress and tiredness when operating machines for extended periods of time. Hence the operator is able to be more alert and monitor the effectiveness of the machinery rather than focusing on keeping the right line.
There were no growers using biomass imagery (a measure of vegetation greenness made by a satellite that relates to crop cover or biomass, also known as NDVI) and geophysical technologies on a regular basis in both audits. Early adopters in the Liebe Group region had limited success with the application of these two technologies which resulted in the technologies having little relevance.
Figure 1 illustrates the level of respondents using the technologies specifically for variation management decreased between the initial and final audits for all of the technologies.
While awareness is high among growers about the range of spatial information available for variation management, soil testing followed by yield monitoring remain the most popular methods for monitoring and mapping variation. It is worth noting that where precision agriculture technologies (i.e. yield mapping and monitoring and GPS) have been developed, they are being used over most of the cropped area. However the use of the precision agriculture technologies for variation management is relatively low. This reinforces the view that the technologies are being adopted for the reduction in overlap but are not being taken further to a better targeting of the inputs based on yield potential.
Fertiliser is the main input being varied where variation management is being used. This is not surprising given the current high cost of fertiliser together with the almost linear relationship between yield and nutrient requirement. One point of interest was that 25% of participants are making liming decisions without using soil test data. It is unknown what data they are using or whether liming has become a time-based strategy.
The initial and final audit results showed that soil variation was being managed both within and between paddocks for the different technologies. Soil testing was again the traditional method growers use to determine where and how to vary management practices between and within paddocks. Respondents had been using soil testing for variation management for an average of 11 years.
Figure 2 (page 6) is a comparison of how growers are using the technologies for variation management (i.e. between or within paddocks). The results are represented as a proportion of the total number of respondents who have adopted the technology.
Figure 1: Percentage of respondents using various technologies specifically for variation management.
Liebe Group Technical Audit Results - Executive Summary 5
Management strategy being used specifically for variation management
0102030405060708090
Initial Final Initial Final Initial Final Initial Final
Yield monitoring Yield mapping Soil testing GPS
% r
esp
on
den
ts
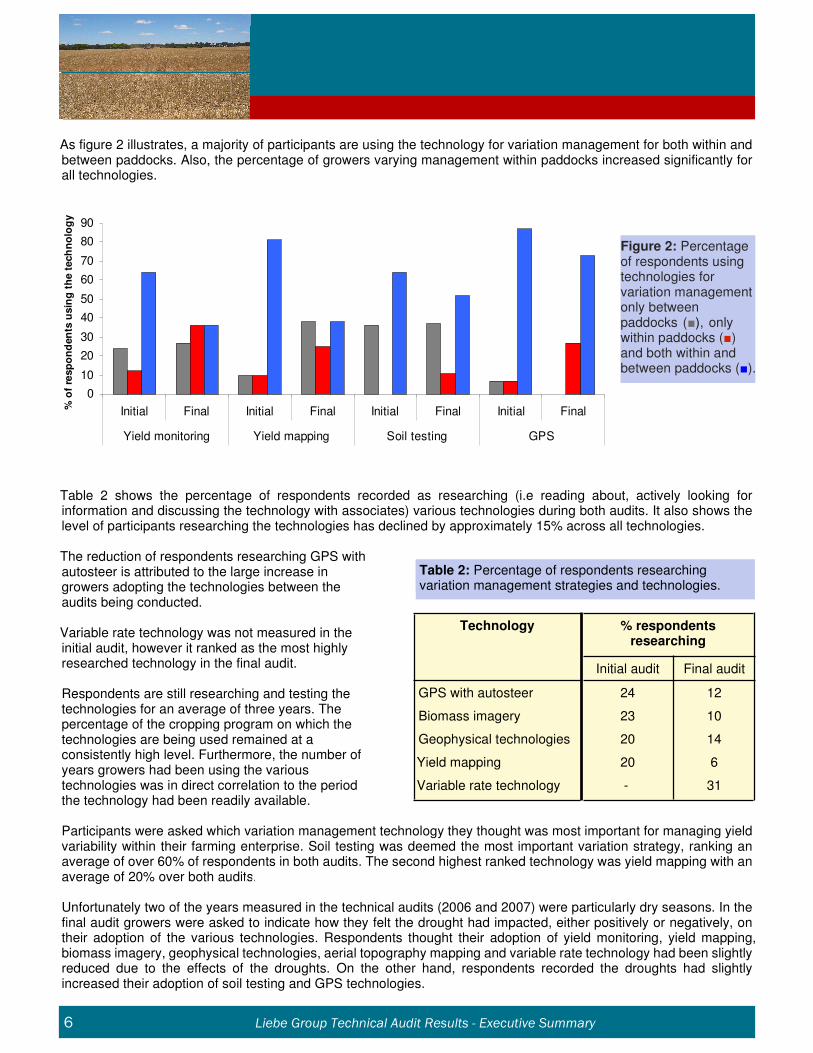
As figure 2 illustrates, a majority of participants are using the technology for variation management for both within and between paddocks. Also, the percentage of growers varying management within paddocks increased significantly for all technologies.
Table 2 shows the percentage of respondents recorded as researching (i.e reading about, actively looking for information and discussing the technology with associates) various technologies during both audits. It also shows the level of participants researching the technologies has declined by approximately 15% across all technologies.
The reduction of respondents researching GPS with autosteer is attributed to the large increase in growers adopting the technologies between the audits being conducted.
Variable rate technology was not measured in theinitial audit, however it ranked as the most highlyresearched technology in the final audit.
Respondents are still researching and testing thetechnologies for an average of three years. Thepercentage of the cropping program on which the technologies are being used remained at aconsistently high level. Furthermore, the number ofyears growers had been using the various technologies was in direct correlation to the periodthe technology had been readily available.
Participants were asked which variation management technology they thought was most important for managing yield variability within their farming enterprise. Soil testing was deemed the most important variation strategy, ranking an average of over 60% of respondents in both audits. The second highest ranked technology was yield mapping with an average of 20% over both audits.
Unfortunately two of the years measured in the technical audits (2006 and 2007) were particularly dry seasons. In the final audit growers were asked to indicate how they felt the drought had impacted, either positively or negatively, on their adoption of the various technologies. Respondents thought their adoption of yield monitoring, yield mapping, biomass imagery, geophysical technologies, aerial topography mapping and variable rate technology had been slightly reduced due to the effects of the droughts. On the other hand, respondents recorded the droughts had slightly increased their adoption of soil testing and GPS technologies.
Liebe Group Technical Audit Results Executive Summary 3
6 Liebe Group Technical Audit Results - Executive Summary
Table 2: Percentage of respondents researching variation management strategies and technologies.
Technology % respondents researching
Initial audit Final audit
GPS with autosteer 24 12
Biomass imagery 23 10
Geophysical technologies 20 14
Yield mapping 20 6
Variable rate technology - 31
Figure 2: Percentage of respondents using technologies for variation management only between paddocks ( ), only within paddocks ( ) and both within and between paddocks ( ).
0
10
20
30
40
50
60
70
80
90
Initial Final Initial Final Initial Final Initial Final
Yield monitoring Yield mapping Soil testing GPS
% o
f re
sp
on
den
ts u
sin
g t
he t
ech
no
log
y
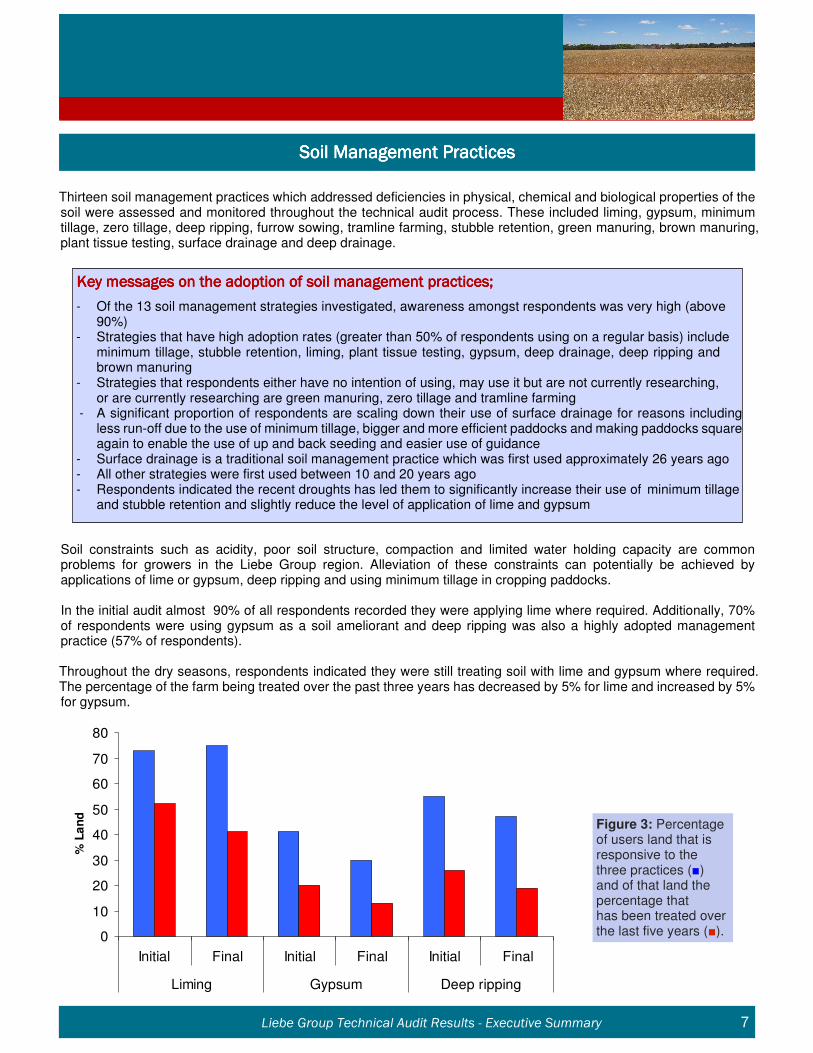
Soil constraints such as acidity, poor soil structure, compaction and limited water holding capacity are common problems for growers in the Liebe Group region. Alleviation of these constraints can potentially be achieved by applications of lime or gypsum, deep ripping and using minimum tillage in cropping paddocks.
In the initial audit almost 90% of all respondents recorded they were applying lime where required. Additionally, 70% of respondents were using gypsum as a soil ameliorant and deep ripping was also a highly adopted management practice (57% of respondents).
Throughout the dry seasons, respondents indicated they were still treating soil with lime and gypsum where required. The percentage of the farm being treated over the past three years has decreased by 5% for lime and increased by 5% for gypsum.
Liebe Group Technical Audit Results - Executive Summary 7
Soil Management PracticesSoil Management PracticesSoil Management PracticesSoil Management Practices
Key messages on the adoption of soil management practices; Key messages on the adoption of soil management practices; Key messages on the adoption of soil management practices; Key messages on the adoption of soil management practices;
- Of the 13 soil management strategies investigated, awareness amongst respondents was very high (above 90%) - Strategies that have high adoption rates (greater than 50% of respondents using on a regular basis) include minimum tillage, stubble retention, liming, plant tissue testing, gypsum, deep drainage, deep ripping and brown manuring - Strategies that respondents either have no intention of using, may use it but are not currently researching, or are currently researching are green manuring, zero tillage and tramline farming - A significant proportion of respondents are scaling down their use of surface drainage for reasons including less run-off due to the use of minimum tillage, bigger and more efficient paddocks and making paddocks square again to enable the use of up and back seeding and easier use of guidance - Surface drainage is a traditional soil management practice which was first used approximately 26 years ago - All other strategies were first used between 10 and 20 years ago - Respondents indicated the recent droughts has led them to significantly increase their use of minimum tillage and stubble retention and slightly reduce the level of application of lime and gypsum
Thirteen soil management practices which addressed deficiencies in physical, chemical and biological properties of the soil were assessed and monitored throughout the technical audit process. These included liming, gypsum, minimum tillage, zero tillage, deep ripping, furrow sowing, tramline farming, stubble retention, green manuring, brown manuring, plant tissue testing, surface drainage and deep drainage.
Figure 3: Percentage of users land that is responsive to the three practices ( ) and of that land the percentage that has been treated over the last five years ( ). 0
10
20
30
40
50
60
70
80
Initial Final Initial Final Initial Final
Liming Gypsum Deep ripping
% L
an
d
8 Liebe Group Technical Audit Results - Executive Summary
These usage levels may be linked with the consistent, high level of growers soil testing in the Liebe Group region over the past three years. It is suggested growers’ recognise the importance of maintaining soil health, structure and pH and ensuring their soil is equipped to deal with the impacts of drier seasons.
The reduction in the percentage of the farm treated with lime may be the result of growers getting on top of their liming requirements. The second audit indicates they have been able to reduce the liming program back to the longer term rotations according to paddock soil type, history and indicators. The drought conditions also increased the financial risk of lime applications. During these years funds were tight for many businesses and the risk of lime loss due to wind erosion was higher.
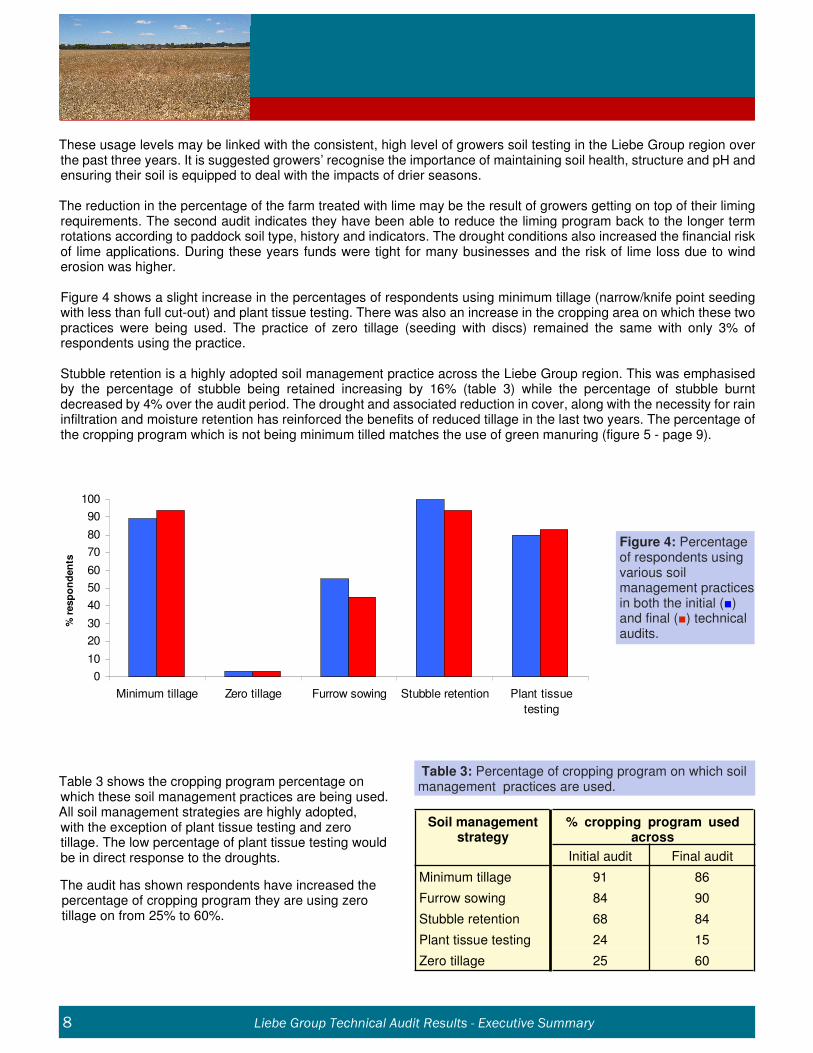
Figure 4 shows a slight increase in the percentages of respondents using minimum tillage (narrow/knife point seeding with less than full cut-out) and plant tissue testing. There was also an increase in the cropping area on which these two practices were being used. The practice of zero tillage (seeding with discs) remained the same with only 3% of respondents using the practice.
Stubble retention is a highly adopted soil management practice across the Liebe Group region. This was emphasised by the percentage of stubble being retained increasing by 16% (table 3) while the percentage of stubble burnt decreased by 4% over the audit period. The drought and associated reduction in cover, along with the necessity for rain infiltration and moisture retention has reinforced the benefits of reduced tillage in the last two years. The percentage of the cropping program which is not being minimum tilled matches the use of green manuring (figure 5 - page 9).
Table 3 shows the cropping program percentage on which these soil management practices are being used.All soil management strategies are highly adopted, with the exception of plant tissue testing and zero tillage. The low percentage of plant tissue testing would be in direct response to the droughts.
The audit has shown respondents have increased the percentage of cropping program they are using zero tillage on from 25% to 60%.
0
10
20
30
40
50
60
70
80
90
100
Minimum tillage Zero tillage Furrow sowing Stubble retention Plant tissue
testing
% r
esp
on
den
ts
Figure 4: Percentage of respondents using various soil management practices in both the initial ( ) and final ( ) technical audits.
Soil management strategy
% cropping program used across
Initial audit Final audit
Minimum tillage 91 86
Furrow sowing 84 90
Stubble retention 68 84
Plant tissue testing 24 15
Zero tillage 25 60
Table 3: Percentage of cropping program on which soil management practices are used.
0
10
20
30
40
50
60
Initial Final Initial Final Initial Final Initial Final Initial Final Initial Final
Deep ripping Tramlining Zero tillage Surface
drainage
Green
manuring
Brown
manuring
% r
esp
on
den
ts
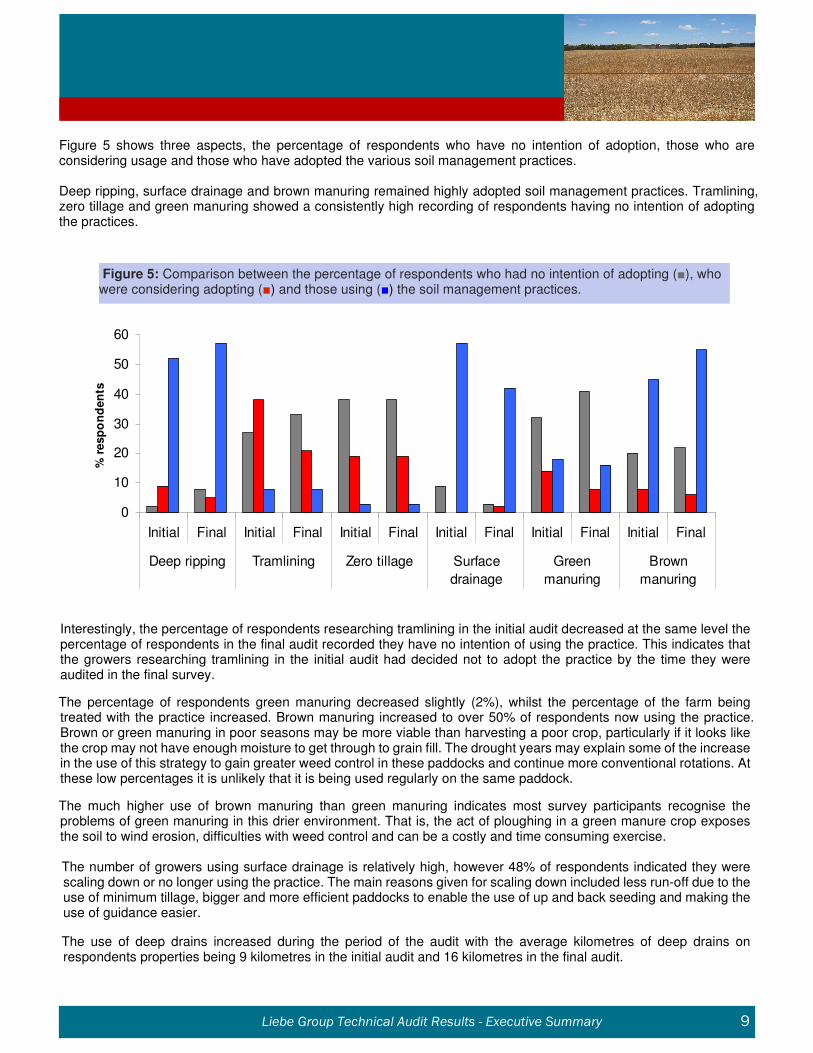
Figure 5: Comparison between the percentage of respondents who had no intention of adopting ( ), who were considering adopting ( ) and those using ( ) the soil management practices.
Interestingly, the percentage of respondents researching tramlining in the initial audit decreased at the same level the percentage of respondents in the final audit recorded they have no intention of using the practice. This indicates that the growers researching tramlining in the initial audit had decided not to adopt the practice by the time they were audited in the final survey.
The percentage of respondents green manuring decreased slightly (2%), whilst the percentage of the farm being treated with the practice increased. Brown manuring increased to over 50% of respondents now using the practice. Brown or green manuring in poor seasons may be more viable than harvesting a poor crop, particularly if it looks like the crop may not have enough moisture to get through to grain fill. The drought years may explain some of the increase in the use of this strategy to gain greater weed control in these paddocks and continue more conventional rotations. At these low percentages it is unlikely that it is being used regularly on the same paddock.
The much higher use of brown manuring than green manuring indicates most survey participants recognise the problems of green manuring in this drier environment. That is, the act of ploughing in a green manure crop exposes the soil to wind erosion, difficulties with weed control and can be a costly and time consuming exercise.
The number of growers using surface drainage is relatively high, however 48% of respondents indicated they were scaling down or no longer using the practice. The main reasons given for scaling down included less run-off due to the use of minimum tillage, bigger and more efficient paddocks to enable the use of up and back seeding and making the use of guidance easier.
The use of deep drains increased during the period of the audit with the average kilometres of deep drains on respondents properties being 9 kilometres in the initial audit and 16 kilometres in the final audit.
Liebe Group Technical Audit Results - Executive Summary 9
Figure 5 shows three aspects, the percentage of respondents who have no intention of adoption, those who are considering usage and those who have adopted the various soil management practices.
Deep ripping, surface drainage and brown manuring remained highly adopted soil management practices. Tramlining, zero tillage and green manuring showed a consistently high recording of respondents having no intention of adopting the practices.
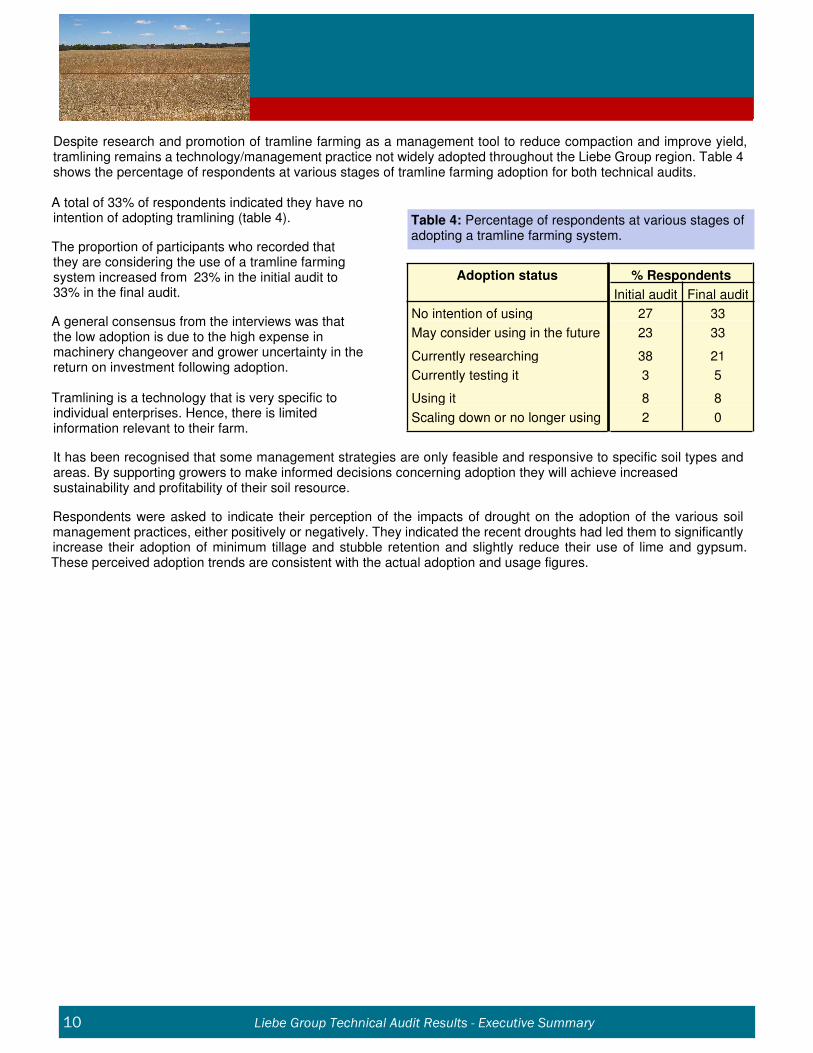
Despite research and promotion of tramline farming as a management tool to reduce compaction and improve yield, tramlining remains a technology/management practice not widely adopted throughout the Liebe Group region. Table 4 shows the percentage of respondents at various stages of tramline farming adoption for both technical audits.
A total of 33% of respondents indicated they have no intention of adopting tramlining (table 4).
The proportion of participants who recorded that they are considering the use of a tramline farming system increased from 23% in the initial audit to 33% in the final audit.
A general consensus from the interviews was that the low adoption is due to the high expense in machinery changeover and grower uncertainty in the return on investment following adoption.
Tramlining is a technology that is very specific to individual enterprises. Hence, there is limited information relevant to their farm.
It has been recognised that some management strategies are only feasible and responsive to specific soil types and areas. By supporting growers to make informed decisions concerning adoption they will achieve increased sustainability and profitability of their soil resource.
Respondents were asked to indicate their perception of the impacts of drought on the adoption of the various soil management practices, either positively or negatively. They indicated the recent droughts had led them to significantly increase their adoption of minimum tillage and stubble retention and slightly reduce their use of lime and gypsum. These perceived adoption trends are consistent with the actual adoption and usage figures.
Adoption status % Respondents
Initial audit Final audit
No intention of using 27 33
May consider using in the future 23 33
Currently researching 38 21
Currently testing it 3 5
Using it 8 8
Scaling down or no longer using 2 0
Table 4: Percentage of respondents at various stages of adopting a tramline farming system.
10 Liebe Group Technical Audit Results - Executive Summary
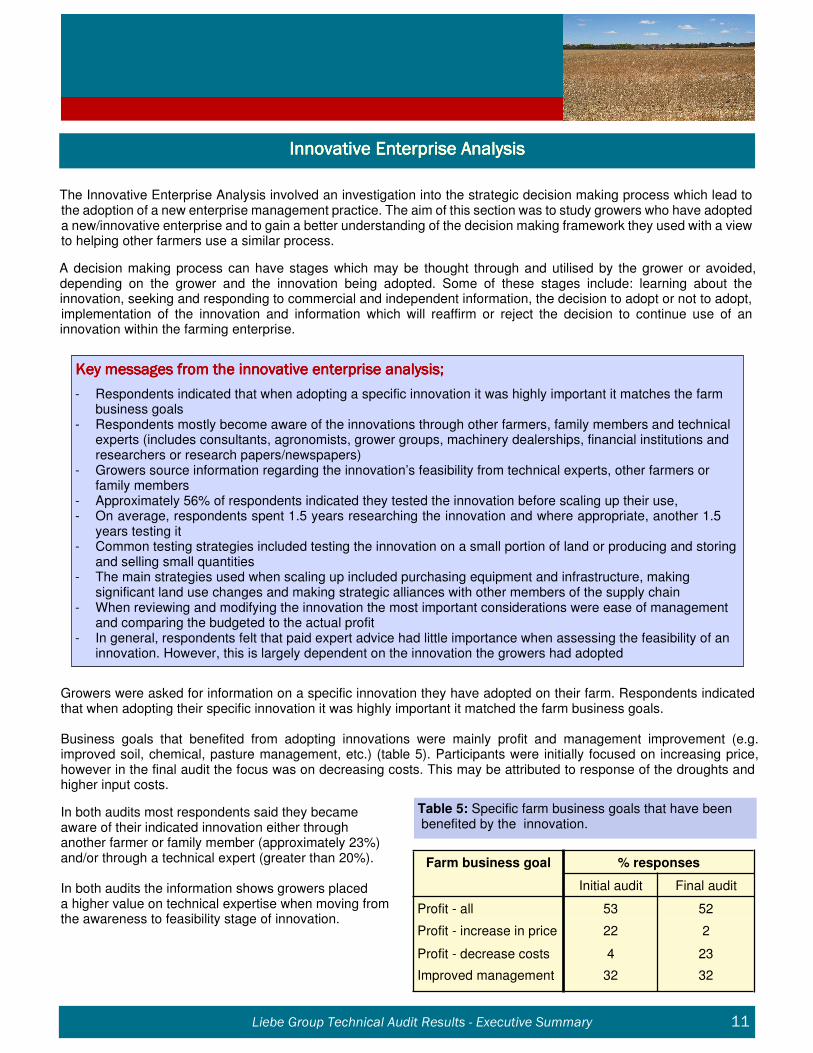
Growers were asked for information on a specific innovation they have adopted on their farm. Respondents indicated that when adopting their specific innovation it was highly important it matched the farm business goals.
Business goals that benefited from adopting innovations were mainly profit and management improvement (e.g. improved soil, chemical, pasture management, etc.) (table 5). Participants were initially focused on increasing price, however in the final audit the focus was on decreasing costs. This may be attributed to response of the droughts and higher input costs.
In both audits most respondents said they became aware of their indicated innovation either through another farmer or family member (approximately 23%) and/or through a technical expert (greater than 20%).
In both audits the information shows growers placed a higher value on technical expertise when moving from the awareness to feasibility stage of innovation.
Liebe Group Technical Audit Results - Executive Summary 11
Farm business goal % responses
Initial audit Final audit
Profit - all 53 52
Profit - increase in price 22 2
Profit - decrease costs 4 23
Improved management 32 32
Table 5: Specific farm business goals that have been benefited by the innovation.
Innovative Enterprise AnalysisInnovative Enterprise AnalysisInnovative Enterprise AnalysisInnovative Enterprise Analysis
The Innovative Enterprise Analysis involved an investigation into the strategic decision making process which lead to the adoption of a new enterprise management practice. The aim of this section was to study growers who have adopted a new/innovative enterprise and to gain a better understanding of the decision making framework they used with a view to helping other farmers use a similar process.
A decision making process can have stages which may be thought through and utilised by the grower or avoided, depending on the grower and the innovation being adopted. Some of these stages include: learning about the innovation, seeking and responding to commercial and independent information, the decision to adopt or not to adopt, implementation of the innovation and information which will reaffirm or reject the decision to continue use of an innovation within the farming enterprise.
Key messages from the innovative enterprise analysis; Key messages from the innovative enterprise analysis; Key messages from the innovative enterprise analysis; Key messages from the innovative enterprise analysis;
- Respondents indicated that when adopting a specific innovation it was highly important it matches the farm business goals - Respondents mostly become aware of the innovations through other farmers, family members and technical experts (includes consultants, agronomists, grower groups, machinery dealerships, financial institutions and researchers or research papers/newspapers) - Growers source information regarding the innovation’s feasibility from technical experts, other farmers or family members - Approximately 56% of respondents indicated they tested the innovation before scaling up their use, - On average, respondents spent 1.5 years researching the innovation and where appropriate, another 1.5 years testing it - Common testing strategies included testing the innovation on a small portion of land or producing and storing and selling small quantities - The main strategies used when scaling up included purchasing equipment and infrastructure, making significant land use changes and making strategic alliances with other members of the supply chain - When reviewing and modifying the innovation the most important considerations were ease of management and comparing the budgeted to the actual profit - In general, respondents felt that paid expert advice had little importance when assessing the feasibility of an innovation. However, this is largely dependent on the innovation the growers had adopted
12 Liebe Group Technical Audit Results - Executive Summary
Use farm consultants on a regularly basis
% responses
Initial audit Final audit
76 75
Table 7: Percentage of respondents currently using farm consultants on a regular basis.
Table 6: Main issues considered when assessing the feasibility of the new innovation.
Main issues considered
% responses
Initial audit Final audit
Expected profit 62 45
Ease of management 22 10
Rate of return 6 8
The audit found a big difference between Liebe Group members and non-members when becoming aware of innovations. Liebe Group members used technical experts and research papers whereas non-members were more reliant on themselves with 30% indicating they are using their own initiative and trial and error.
Results from the initial audit showed 62% respondents saw ‘expected profit’ to be the most important issue considered when adopting an innovation. This was followed by ‘ease of management’ which averaged 22%.
A higher weighting was placed on profit related issues inthe final audit (i.e. expected profit, rate of return, etc.).The importance placed on ‘ease of management’ reduce from 22% in the initial audit to 10% in the final audit due to the emphasis on productivity.
When reviewing and modifying factors of the innovation, the main issues considered were ‘ease of management’ and ‘achieving profitability’. These issues remained consistent through both audits. Liebe Group members showed an increase in their consideration of monitoring the likely impact on the environment, measuring management hours and the effects on lifestyle.
These innovation results reflect the reality for many farmers that in seasons of surplus cash flow they consider ease of management a priority, however when cash flow is limited making profit is the important consideration. Once a new innovation has been implemented the ease of management becomes a greater importance. This shows farmers are focusing on the profitability of their business.
In both audits, approximately 56% of respondents tested the innovations on a small scale to assist with the decision of whether to adopt or not, the other 44% went straight into extensive adoption. Small scale testing mainly included testing it on a small portion of arable land, producing or storing the innovation in small quantities and having an expert demonstrate it on-farm. If respondents conducted small-scale testing of the innovation, on average they spent 1.6 years researching the issue before testing it for another 1.7 years.
If respondents did not conduct small-scale testing, the average time from becoming aware of the innovation and its implementation was 3.4 years. This is an increase from the initial audit when the average was 2.7 years. The most common ways in which respondents scaled up their use of the innovation to their current levels included purchasing equipment and infrastructure, making significant land use changes and forming strategic alliances with other members of the supply chain.
In the final audit 66% of respondents indicated gaining paid expert advice when assessing the feasibility of the new innovation was of little importance, an increase from 41% in the initial audit. Liebe Group members placed a higher level of important on gaining paid expert advice in the final audit which may be related back to non-membersusing their own initiative and learning about new innovations through ‘trial and error’.
Table 7 highlights 75% of growers are using farm consultants on an on-going basis. This is despite participants placing a low level of importance on paid expert advice when assessing the feasibility of a newinnovation.
Table 8 shows the average amount of paid expert advice respondents are purchasing annually has increased from 52 hours to 66 hours. The increase in hours may be a result of growers valuing technical and economic information to make informed adoption and management decisions.
Hours of paid expert advice
Initial audit Final audit
52 66
Table 8: Average number of paid expert advice respondents are purchasing during a one year period.
Liebe Group Technical Audit Results - Executive Summary 13
The average response for participant’s perception on their own innovativeness was neutral at three (table 9).
44% of Liebe Group members and 25% of non-membersrated themselves as above average in terms of innovativeness.
Participant’s current perception of the long term future of farming in the area was 3.8 (table 10), down slightlycompared to their estimated perception of 4.3 three years ago. This indicates growers are still relatively optimistic about the future of farming in the area. LiebeGroup members were considerably more optimistic about the long term future of farming in the area than non-members.
Respondents were asked to indicate any farming enterprises or management practices they have adopted or are considering adopting in the near future (table 11).
It is not surprising there are more participants who are considering cropping innovations in comparison to livestock innovations. This is due to income generated from a cropping enterprise often being more than 90% of the farms income base. Therefore, small changes in the cropping enterprise can have a big effect on the businesses profit.
An important business management practice was growing high value varieties. The number of respondents growing bio-diesel crops and manufacturing bio-diesel both decreased significantly. It can be assumed this was influenced by the fall in the price of oil since the initial audit was conducted.
When asked to list the most important on-farm limiting factors in the near future, 29% of respondents listed weather related issues (i.e rainfall, drought, seasons, climate change). Other high ranked factors were cost of production (mainly inputs), general profitability (including cash flow and financing) and commodity prices and marketing. This shows growers are identifying increasing business risk.
Type of innovation % of respondents
Initial audit Final audit
Cropping Innovations 69 66
Livestock Innovations 33 31
Table 11: Percentage of respondents considering using or who have adopted different innovations.
Respondent’s perception Average response
Estimated ranking 3 years ago 4.3
Current recording 3.8
Table 10: Respondents perception of the long term future of farming in the area where 1 is very pessimistic and 5 is very optimistic.
Table 9: Respondents perception of their innovativeness where 1 is not very innovative and 5 is very innovative.
Respondent’s perception Average response
Initial audit 3.2
Final audit 3.0
General InformationGeneral InformationGeneral InformationGeneral Information
Respondents were asked about their perception of their own innovativeness, the long-term future of farming in the area, what they saw as the most important factors that will limit their farming business in the future, how they distribute their time and what innovations they have plans to remain using and/or adopt in the near future.
Key general information messages; Key general information messages; Key general information messages; Key general information messages;
- Respondents are quite optimistic about the long term future of farming in their area, although their current perceptions are slightly less optimistic than what they estimated their response to be three years ago - Respondents perceived the most important limiting factors on their businesses in the future would be variability of seasons and cost of production - A majority of respondent’s time is spent on field work
14 Liebe Group Technical Audit Results - Executive Summary
Participants were asked about the usefulness of the Liebe Group’s technical audit process and the case study booklets produced through the project. Half of all respondents ranked the technical audit process a three on a scale where one was not helpful and five was very helpful. Furthermore, 39% of respondents gave a ranking of four or five.
The dominant reasons for valuing the audit process wereit provided information and ideas, encouraged critical analysis of their farming system and indicated what othergrowers were doing (table 12).
Respondents were asked to indicate which individual case studies in the 2007 and 2008 LiebeGroup Grower Adoption Case Study Booklets(Frameworks for Forward Farming) had an influence on their on-farm decision making.
The case studies most often identified as having an influence were:
2007 Liebe Group Grower Adoption Case Study Booklet; - Digging deep to get benefits – Michael Dodd, and- Keeping an open mind to soil biology management – Colin Cail.
2008 Liebe Group Grower Adoption Case Study Booklet; - New alternatives for weeds and fertilisers are ‘entwined’ – Michael and Graham Shields, and - Soil management for the future – Mark and Suzanne Wilson.
It is noted not all respondents had received or read the 2008 booklet at the time of the final audit.
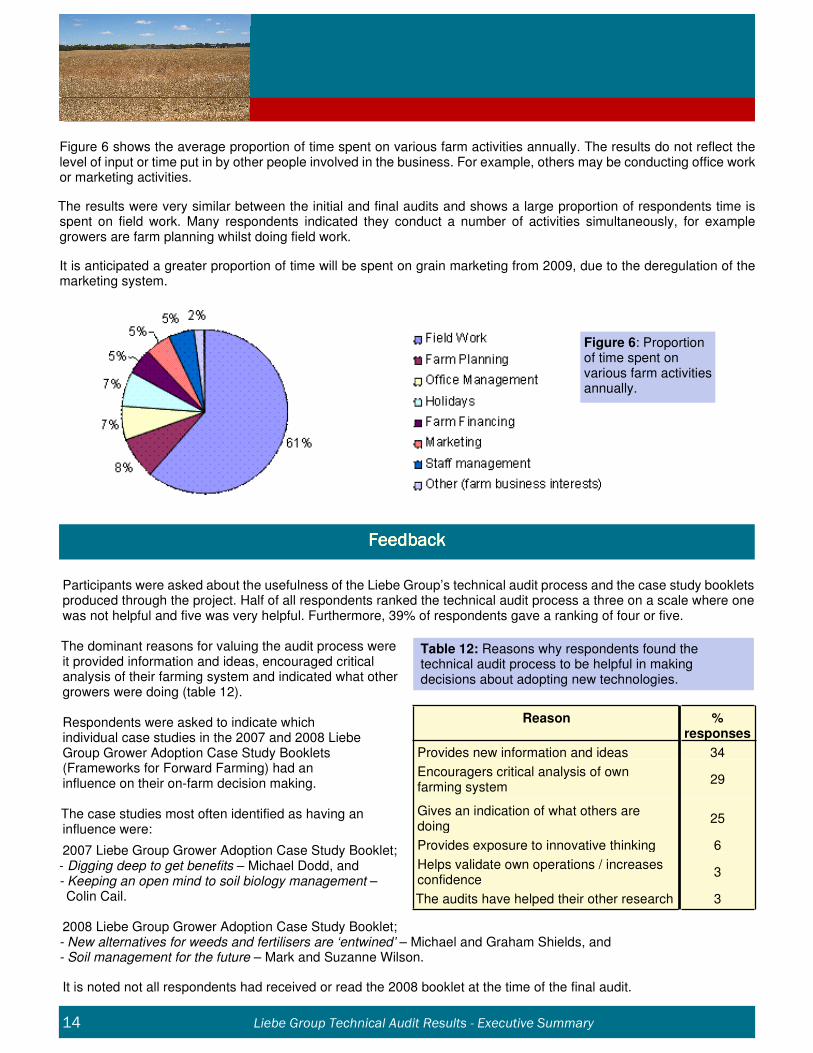
Figure 6: Proportion of time spent on various farm activities annually.
Figure 6 shows the average proportion of time spent on various farm activities annually. The results do not reflect the level of input or time put in by other people involved in the business. For example, others may be conducting office work or marketing activities.
The results were very similar between the initial and final audits and shows a large proportion of respondents time is spent on field work. Many respondents indicated they conduct a number of activities simultaneously, for example growers are farm planning whilst doing field work.
It is anticipated a greater proportion of time will be spent on grain marketing from 2009, due to the deregulation of the marketing system.
FeedbackFeedbackFeedbackFeedback
Reason % responses
Provides new information and ideas 34
Encouragers critical analysis of own farming system
29
Gives an indication of what others are doing
25
Provides exposure to innovative thinking 6
Helps validate own operations / increasesconfidence
3
The audits have helped their other research 3
Table 12: Reasons why respondents found the technical audit process to be helpful in making decisions about adopting new technologies.
The technical audit process was a valuable method of benchmarking adoption levels and measuring any changes and trends in adoption levels throughout the Liebe Group region over the life of the project.
The detail of information obtained throughout the technical audit process (face to face interviews) was far greater than the information that may have been received through an on-line, mail or fax survey. Respondents indicated the interviews were of some use, especially for providing new information and ideas, encouraging critical analysis of their business and indicating what other growers in the region are doing.
It was positive to see the adoption and usage of a majority of the variation and soil management practices were not largely affected by the droughts in 2006 and 2007. It can be suggested the growers involved recognise the importance of maintaining their soils so they are better equipped to deal with the impacts of the drier seasons.
The aim of the innovative enterprise analysis was to understand decision making frameworks used by effective innovators. This was done with the view to enable other farmers with examples of decision making processes used for adoption. This method is also being explored through the project’s next stage of adoption improvement packages.
Another positive message to come out of the audit results is a majority of respondents are scrutinising their management decisions and placing more emphasis on the economic impacts of their decisions. This technique will lead to growers making more informed decisions leading to sustainable farming systems, business progress, addressing of environmental concerns, a balance of lifestyle and healthy communities for growers in the Liebe Group region.
The results from the technical audits are the first of a kind for benchmarking and measuring adoption levels of the three focus technologies within the Liebe Group region. Experience and information gained from the technical audit process has shown the many complexities in the process of adoption. The Liebe Group is in a position to unfold more of these in the future to increase effective adoption of technologies and practices to ensure grain growers are competitive in the global industry.
Reference
Pannell, D.J., Marshall, G.R., Barr, N., Curtis, A., Vanclay, F. and Wilkinson, R. 2006, Understanding and promoting adoption of conservation practices by rural landholders.
Liebe Group Technical Audit Results - Executive Summary 15
Technical Audit Process - SummaryTechnical Audit Process - SummaryTechnical Audit Process - SummaryTechnical Audit Process - Summary
Development of the Technical Audit Executive SummaryDevelopment of the Technical Audit Executive SummaryDevelopment of the Technical Audit Executive SummaryDevelopment of the Technical Audit Executive Summary
This technical audit executive summary was compiled by Liebe Group Project Coordinator, Lara Swift in consultation with the GRDC Project Management Committee.
The technical results presented in this document is a combination of the raw data collected from the technical audit questionnaires and information presented in the complete audit analysis reports developed by Dr. Elizabeth Petersen from Advanced Choice Economics Pty Ltd.
This publication is a component of the Liebe Group’s GRDC funded project 'Growers Critically Analysing New Technologies for Improved Farming Systems'.
AcknowledgementsAcknowledgementsAcknowledgementsAcknowledgements
Thank you to our project partner, the Grains Research and Development Corporation.
The time contributed by all of the growers involved in the technical audit process was greatly appreciated, thank you.
A sincere thank you for the assistance and support from the project committee;
- Local growers; Mr. Blayn Carlshausen, Mr. Brian McAlpine and Mr. Harry Hyde - Mr. Rob Sands of Farmanco - Dr. Elizabeth Petersen of Advanced Choice Economics Pty Ltd - Dr. Michael Robertson of CSIRO - Mr. Peter Tozer of Muresk Institute, Curtin University of Technology - Mr. Erin Cahill of CSBP - Dr. Francis Hoyle of the Department of Agriculture and Food Western Australia - Dr. Daniel Murphy of the University of Western Australia - Mr. Andrew Wherrett of the Department of Agriculture and Food Western Australia
Thank you to Emma Wilson (formerly Liebe Group) for developing, conducting and reporting on the initial technical audit.
Further InformationFurther InformationFurther InformationFurther Information
To obtain a copy of the complete technical audit results please contact the Liebe Group office by phoning (08) 9664 2030 or emailing [email protected] .
For further information on the Liebe Group’s GRDC funded adoption project visit the Liebe websitewww.liebegroup.asn.au .
The Liebe Group sincerely thanks its project partner GRDC.