Fiber Reinforcemtn in Prestressed Concrete Beams · PDF fileFiber Reinforcement in Prestressed...
158
Fiber Reinforcement in Prestressed Concrete Beams Performed in Cooperation with the Texas Department of Transportation and the Federal Highway Administration Project 0-4819 By Hemant B. Dhonde Research Assistant Y.L. Mo Professor and Thomas T.C. Hsu Moores Professor Department of Civil & Environmental Engineering University of Houston Houston, Texas December 2005 Technical Report 0-4819-1
Transcript of Fiber Reinforcemtn in Prestressed Concrete Beams · PDF fileFiber Reinforcement in Prestressed...

Fiber Reinforcement in PrestressedConcrete Beams
Performed in Cooperation with theTexas Department of Transportation
and the Federal Highway AdministrationProject 0-4819
By
Hemant B. DhondeResearch Assistant
Y.L. MoProfessor
and
Thomas T.C. HsuMoores Professor
Department of Civil & Environmental EngineeringUniversity of Houston
Houston, Texas
December 2005
Technical Report 0-4819-1


Technical Report Documentation Page 1. Report No. FHWA/TX-06/ 0-4819-1
2. Government Accession No.
3. Recipient's Catalog No.
5. Report Date December, 2005
4. Title and Subtitle Fiber Reinforcement in Prestressed Concrete Beams
6. Performing Organization Code
7. Author(s) Hemant B. Dhonde, Y.L. Mo and Thomas T. C. Hsu
8. Performing Organization Report No. 0-4819-1 10. Work Unit No. (TRAIS)
9. Performing Organization Name and Address Department of Civil & Environmental Engineering Cullen College of Engineering University of Houston 4800 Calhoun Road Houston, TX 77204-4003
11. Contract or Grant No. 0-4819
13. Type of Report and Period Covered Technical Report September 2003 – August 2005
12. Sponsoring Agency Name and Address Texas Department of Transportation Research and Technology Implementation Office P. O. Box 5080 Austin, Texas 78763-5080
14. Sponsoring Agency Code
15. Supplementary Notes
16. Abstract
Prestressed concrete I-beams are used extensively as the primary superstructure elements in Texas highway bridges. A commonly observed problem in these beams is the appearance of end zone cracking due to the prestressing forces, thermal effects of hydration, shrinkage and temperature variation. Even though a large quantity of transverse steel reinforcement is provided in the end zone, the cracking problem persists. The research described in this report was targeted to develop a workable steel fiber reinforced concrete mix that would be capable of partially or completely replacing the dense traditional reinforcement and eliminating cracking in the end zones.
The research work was divided into three phases: Phase One consisted of developing TxDOT Traditional Fiber Reinforced Concrete (TTFRC) and Self-Consolidating Fiber Reinforced Concrete (SCFRC) mixes with steel fibers. Four TTFRC and three SCFRC mixes with two different types and variable amounts of hook-ended steel fibers were tested for their workability and hardened properties. Based on their performance, suitable TTFRC and SCFRC mixes with optimum fiber contents were selected to cast full-scale beams.
Phase Two research dealt with the casting and end zone monitoring of seven 25-ft.-long (AASHTO Type-A) I-beams using optimized TTFRC and SCFRC mixes. Conventionally used equipment and techniques were applied for mixing, transporting, placing and steam curing the beams at the precast plant. Strain gauges and temperature loggers installed inside the beams measured strains and temperatures, respectively, during steam curing and release of prestressing force. This instrumentation was aimed at finding the influence of steel fibers on controlling/eliminating the end zone cracks.
Phase Three research consisted of load testing the seven beams to failure to determine the effects of steel fibers on the structural performance of the beams. Both ends of the simply supported beams were tested to failure using four hydraulic actuators with strain controlled capability. For the first time, descending branches of load-deformation curves were obtained for the end zones of prestressed concrete beams to assess the ductility.
The research findings proved that the end zone cracking would be eliminated by completely or partially replacing the traditional transverse steel reinforcement by steel fibers. Additionally, steel fibers enhanced the ductility and crack resistance of the prestressed TxDOT I-beams. This report also provides design guidelines and recommendations for producing, testing and casting steel fiber reinforced concrete mixes for successful application in the end zones of prestressed concrete I-beams.
17. Key Words Beams, concrete, cracking, ductility, full-scale tests, prestressed, self-consolidating concrete, shear, steel fibers.
18. Distribution Statement No restrictions. This document is available to the public through NTIS: National Technical Information Service 5285 Port Royal Road, Springfield, Virginia 22161. www.ntis.gov and University of Houston, Houston, Texas 77204 www.egr.uh.edu/structurallab/
19. Security Classif.(of this report)
Unclassified
20. Security Classif.(of this page)
Unclassified
21. No. of Pages 156
22. Price
Form DOT F 1700.7 (8-72) Reproduction of completed page authorized


Fiber Reinforcement in Prestressed Concrete Beams
by
Hemant B. Dhonde Research Assistant
Y.L. Mo Professor
and
Thomas T. C. Hsu Moores Professor
Technical Report 0-4819-1
Research Project Number 0-4819 Project Title: Fiber Reinforcement in Prestressed Concrete Beams
Performed in cooperation with the
Texas Department of Transportation and the
Federal Highway Administration
December 2005
Department of Civil and Environmental Engineering
University of Houston
Houston, Texas


v
Disclaimer
This research was performed in cooperation with the Texas Department of Transportation and
the U.S. Department of Transportation, Federal Highway Administration. The contents of this
report reflect the views of the authors, who are respons ible for the facts and accuracy of the data
presented herein. The contents do not necessarily reflect the official view or policies of the
FHWA or TxDOT. This report does not constitute a standard, specification, or regulation, nor is
it intended for construction, bidding, or permit purposes. Trade names were used solely for
information and not product endorsement.

vi

vii
Acknowledgments
This research, Project 0-4819, was conducted in cooperation with the Texas Department
of Transportation and the U.S. Department of Transportation, Federal Highway Administration.
The project monitoring committee consisted of Peter Chang (Program Coordinator), Andy
Naranjo (Project Director), Dacio Marin (Project Advisor), Gilbert Sylva (Project Advisor), John
Vogel (Project Advisor) and Stanley Yin (Project Advisor).
The researchers would like to thank the Texas Concrete Company, Victoria, Texas, for
continued co-operation during this project. The researchers are grateful to Bekaert Corporation
(USA) for supplying the steel fibers for this research. Master Builders Inc. (USA) and Engius
(USA) are also appreciated for providing the chemical admixtures and temperature loggers,
respectively, for this project.

viii

ix
TABLE OF CONTENTS
Page
CHAPTER 1 Introduction 1
1.1 Prestressed Concrete Beams 1
1.2 End Blocks of Prestressed-I-Beams 2
1.3 Problem Statement 3
1.4 Project Objectives 5
CHAPTER 2 TxDOT Traditional Fiber Reinforced Concrete and
Self-Consolidating Fiber Reinforced Concrete 7
2.1 Introduction 7
2.2 Fiber Reinforced Concrete 7
2.3 Self-Consolidating Concrete 11
2.4 Self-Consolidating Fiber Reinforced Concrete 22
2.5 Materials Used in the Research Project 23
2.6 Mixing Procedure 30
2.7 Results of Workability Tests of Concrete Mixes 30
2.8 SCC-Texas Workshop Demonstration 35
2.9 Results of Hardened Properties of Concrete Mixes 36
CHAPTER 3 Early-Age Cracking in Prestressed Concrete I-Beams 47
3.1 Analysis of End Zone Stresses Due to Prestress Forces 47
3.1.1 OpenSees Analytical Model 47
3.1.2 Results of End Zone Analysis under Prestress Forces 50
3.2 Analysis of End Zone Stresses Due to Thermal Load 53
3.2.1 SAP 2000 Analytical Model 53
3.2.2 Results of End Zone Analysis under Thermal Load 53
3.3 Summary of Stresses Due to Prestress and Thermal Loading 56
CHAPTER 4 Prestressed Concrete Beams: Test Specimens and Early-Age
Measurements 57
4.1 Test Specimens 57

x
4.2 Test Program 62
4.3 Casting of Test Specimens 64
4.4 Instrumentations for Early Age Measurements 66
4.5 Results of Early Age Measurements 71
CHAPTER 5 Load Tests of Prestressed Concrete Beams 81
5.1 Load Test Set-up 81
5.2 Load Test Variables 85
5.3 Load Test Results 86
5.3.1 Ultimate Shear Strengths 86
5.3.2 Ductility Observed in Shear Forces Vs. Deflection Curves 89
5.3.3 Ductility Observed in Shear Forces–Rebar Strains Curves (Strain Gauge) 93
5.3.4 Ductility Observed in Shear Forces–Rebar Strains Curves (LVDTs) 97
5.3.5 Cracking, Crack Widths and Failure of Beams 101
5.3.6 Comparison of Experimental and Analytical Shear Capacities 114
CHAPTER 6 Conclusions and Guidelines 117
6.1 Conclusions 117
6.2 Guidelines 119
6.2.1 End Zone Crack Control 119
6.2.2 Structural Performance of Beams 120
6.2.3 Overall Performance of Beams 121
Draft Specifications for Using TxDOT Traditional Fiber Reinforced Concrete
in Prestressed Concrete Beams 123
Draft Specifications for Using Self-Consolidating Fiber Reinforced Concrete
in Prestressed Concrete Beams 129
References 135
xi
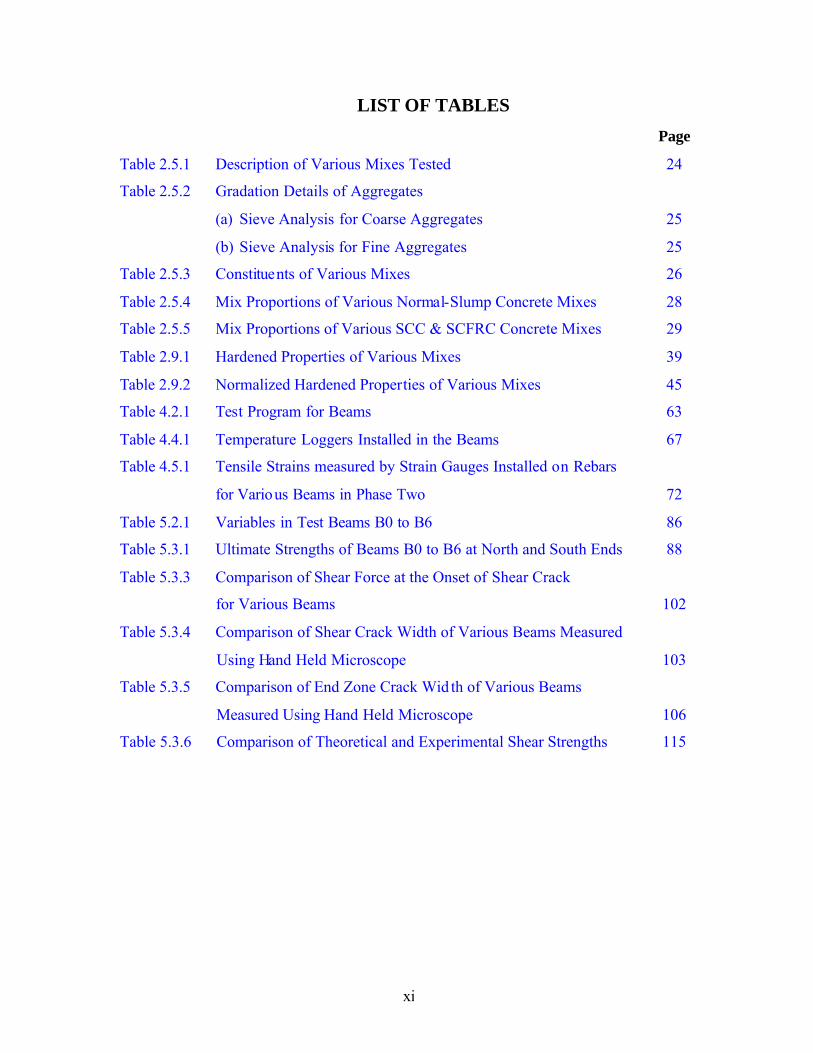
LIST OF TABLES
Page
Table 2.5.1 Description of Various Mixes Tested 24
Table 2.5.2 Gradation Details of Aggregates
(a) Sieve Analysis for Coarse Aggregates 25
(b) Sieve Analysis for Fine Aggregates 25
Table 2.5.3 Constituents of Various Mixes 26
Table 2.5.4 Mix Proportions of Various Normal-Slump Concrete Mixes 28
Table 2.5.5 Mix Proportions of Various SCC & SCFRC Concrete Mixes 29
Table 2.9.1 Hardened Properties of Various Mixes 39
Table 2.9.2 Normalized Hardened Properties of Various Mixes 45
Table 4.2.1 Test Program for Beams 63
Table 4.4.1 Temperature Loggers Installed in the Beams 67
Table 4.5.1 Tensile Strains measured by Strain Gauges Installed on Rebars
for Various Beams in Phase Two 72
Table 5.2.1 Variables in Test Beams B0 to B6 86 Table 5.3.1 Ultimate Strengths of Beams B0 to B6 at North and South Ends 88
Table 5.3.3 Comparison of Shear Force at the Onset of Shear Crack
for Various Beams 102
Table 5.3.4 Comparison of Shear Crack Width of Various Beams Measured
Using Hand Held Microscope 103
Table 5.3.5 Comparison of End Zone Crack Wid th of Various Beams
Measured Using Hand Held Microscope 106
Table 5.3.6 Comparison of Theoretical and Experimental Shear Strengths 115

xii
LIST OF FIGURES
Page
Fig. 1.1.1 Prestressed Concrete I-Beam 1
Fig. 1.2.1 Stress Isobars in End Zone 2
Fig. 1.3.1 End Zone Cracking in a Prestressed I-Beam 4
Fig. 1.3.2 Typical End Zone Reinforcement Details of a Prestressed I-Beam 4
Fig. 2.2.1 Different Shapes of Steel Fibers 8
Fig. 2.2.2 ‘Bridging’ Action of Fibers across Concrete Crack 9
Fig. 2.2.3 Load–Deflection Curves for Plain and Fibrous Concrete 9
Fig. 2.2.4 Effect of Steel Fiber Content on Compressive Stress-Strain
Curve of FRC 10
Fig. 2.3.1 Slump Flow Test 13
Fig. 2.3.2 Visual Stability Index (VSI) Rating for SCC 15
Fig. 2.3.3 J-ring Apparatus 16
Fig. 2.3.4 J-ring Test Photos 17
Fig. 2.3.5 V-funnel Apparatus 18
Fig. 2.5.1 Steel Fiber RC80/60 BN 26
Fig. 2.5.2 Steel Fiber ZP305 26
Fig. 2.6.1 Concrete Mixer at the Precast Plant-Texas Concrete Co. Victoria,
Texas 30
Fig. 2.7.1 Results of Slump and Slump Flow Test 32
Fig. 2.7.2 Results of T-20in. Time for Different Mixes 33
Fig. 2.7.3 V-funnel Time for Different Mixes 34
Fig. 2.7.4 J-ring Values for Different Mixes 35
Fig. 2.8.1 SCC-Texas Workshop Demonstration at University of Houston 36
Fig. 2.9.1 Cylinder Compression Test
(a) Failed Cylinders 37
(b) Measurement of Elastic Modulus and Poisson’s Ratio 37
Fig. 2.9.2 Split Cylinder Test Specimens 37
Fig. 2.9.3 Beam Flexure Test (Modulus of Rapture) Specimens 38
Fig. 2.9.4 Average Residual Stress Test 38

xiii
Fig. 2.9.5 Variation of Compressive Strength of Various Mixes with Age 40
Fig. 2.9.6 Variation of Split Tensile Strength of Various Mixes with Age 41
Fig. 2.9.7 Variation of Modulus of Rapture Strength of Various Mixes
with Age 42
Fig. 2.9.8 Variation of Average Residual Strength of Various Mixes
with Age 43
Fig. 2.9.9 Variation of Modulus of Elasticity of Various Mixes with Age 44
Fig. 2.9.10 Variation of Average Normalized Tensile Strength with Fiber Factor 46
Fig. 3.1.1 Schematic Modified Cross-Section of Beam for SRCS Analysis 48
Fig. 3.1.2 Finite Element Mesh for End Zone of Beam (OpenSees Analysis) 49
Fig. 3.1.3 Modeling of Prestress Load Distribut ion along the Transfer Length 49
Fig. 3.1.4 End-Zone Stress Distribution for TTC1 51
Fig. 3.1.5 End-Zone Stress Distribution for SCFRC3 Mix 52
Fig. 3.2.1 Finite Element Model for Thermal Analysis of Beam Using
SAP 2000 54
Fig. 3.2.2 Stresses Due to Thermal Loads in Type-A Beam Cross-Section 55
Fig. 4.1.1 Cross Section of Type-A beam 58
Fig. 4.1.2 Elevation and Reinforcement Details of Beams B1 and B6 59
Fig. 4.1.3 Elevation and Reinforcement Details of Beams B2, B3, B4 and B5 59
Fig. 4.1.4 Reinforcement and Instrumentation Details of Beam B1
(a) Beam B1-North (4.2 % steel) 60
(b) Beam B1-Center (0.82 % steel) 60
(c) Beam B1-South (1 % steel) 60
Fig. 4.1.5 Reinforcement and Instrumentation Details of Beams B2, B3,
B4 & B5
(a) Beam North (1 % steel) 61
(b) Beam-Center (0.42 % steel) 61
(c) Beam-South (0.42 % steel) 61
Fig. 4.3.1 Casting of Beams
(a) Compaction using Vibrators in Beam B1 65
(b) Concrete Placed in Beam B2 by a Hopper 65

xiv
Fig. 4.4.1 Location of temperature loggers in the beam
(a) For B1-South, B2-South, B3-South and B5-South Ends 68
(b) For B1-Center, B4-South and B6-South. 68
Fig. 4.4.2 Position of Strain Gauges and LVDT Studs on R and S Rebars 69
Fig. 4.4.3 Position of Strain gauges and LVDT Studs on Y bar and V bar 70
Fig. 4.5.1 Variation of Rebar Strains measured by Strain Gauges with Time
at the End Zone for Beam B1-North 73
Fig 4.5.2 Variation of Rebar Strains measured by Strain Gauges with Time
at the End Zone for Beam B2-North 74
Fig. 4.5.3 Variation of Rebar Strains measured by Strain Gauges with Time
at the End Zone for Beam B3-South 75
Fig. 4.5.4 Variation of Rebar Strains measured by Strain Gauges with Time
at the End Zone for Beam B5-South 76
Fig. 4.5.5 Variation of Concrete Temperature with Age at Beam B1-South 78
Fig. 4.5.6 Variation of Concrete Temperature with Age at Beam B2-South 78
Fig. 4.5.7 Variation of Concrete Temperature with Age at Beam B5-South 79
Fig. 4.5.8 Variation of Concrete Temperature with Age at Beam B6-South 79
Fig. 5.1.1 Load Test Setup 81
Fig. 5.1.2 Plan View of Loading Frame 82
Fig. 5.1.3 Load Points on Test Beam 82
Fig. 5.1.4 Position of LVDTs on the Web of the Test Beam 84
Fig. 5.1.5 Tracking and Measuring Shear Cracks on the Web of Test Beam 85
Fig. 5.3.1 Shear Force–Deflection Curves for Beams B0 to B6 90
Fig. 5.3.2 Shear Force–Deflection Curves for South Ends of Beams B0 to B6 91
Fig. 5.3.3 Shear Force–Deflection Curves for North Ends of Beams B0 to B6 92
Fig. 5.3.4 Shear Force Vs. Rebar Tensile Strains Measured by Strain Gauge
for Beams B1 to B5 at a Distance of H/2 from Support 94
Fig. 5.3.5 Shear Force Vs. Rebar Tensile Strains Measured by Strain Gauge
for South Ends of Beams B1 to B5 at a Distance of H/2 from Support 95
Fig. 5.3.6 Shear Force Vs. Rebar Tensile Strains Measured by Strain Gauge
for North Ends of Beams B1 to B5 at a Distance of H/2 from Support 96

xv
Fig. 5.3.7 Shear Force Vs. Rebar Tensile Strains Measured by LVDT for
Beams B0 to B5 at a Distance of H/2 from Support 98
Fig. 5.3.8 Shear Force Vs. Rebar Tensile Strains Measured by LVDT for
South Ends of Beams B0 to B5 at a Distance of H/2 from Support 99
Fig. 5.3.9 Shear Force Vs. Rebar Tensile Strains Measured by LVDT for
North Ends of Beams B0 to B5 at a Distance of H/2 from Support 100
Fig. 5.3.10 Variation of Shear Crack Width with Shear Force Measured
Using Microscope for Beams B0 to B6 105
Fig. 5.3.11 Load Test Photographs of North and South Ends of Beam B1
(a) Cracking of Beam B1-North End 107
(b) Flexure Failure of Beam B1-North End 107
(c) Cracking of Beam B1-South End 107
(d) Shear Failure of Beam B1-South End 107
Fig. 5.3.12 Load Test Photographs of North and South Ends of Beam B2
(a) Cracking of Beam B2-North End 108
(b) Shear Failure of Beam B2-North End 108
(c) Cracking of Beam B2-South End 108
(d) Shear Failure of Beam B2-South End 108
Fig. 5.3.13 Load Test Photographs of North and South Ends of Beam B3
(a) Cracking of Beam B3-North End 109
(b) Shear Failure of Beam B3-North End 109
(c) Cracking of Beam B3-South End 109
(d) Shear Failure of Beam B3-South End 109
Fig. 5.3.14 Load Test Photographs of North and South Ends of Beam B4
(a) Cracking of Beam B4-North End 110
(b) Shear Failure of Beam B4-North End 110
(c) Cracking of Beam B4-South End 110
(d) Shear Failure of Beam B4-South End 110
Fig. 5.3.15 Load Test Photographs of North and South Ends of Beam B5
(a) Cracking of Beam B5-North End 111
(b) Shear Failure of Beam B5-North End 111
xvi
(c) Cracking of Beam B5-South End 111
(d) Shear Failure of Beam B5-South End 111
Fig. 5.3.16 Load Test Photographs of North and South Ends of Beam B0
(a) Cracking of Beam B0-North End 112
(b) Shear Failure of Beam B0-North End 112
(c) Cracking of Beam B0-South End 112
(d) Shear Failure of Beam B0-South End 112
Fig. 5.3.17 Load Test Photographs of North and South Ends of Beam B6
(a) Cracking of Beam B6-North End 113
(b) Flexure Failure of Beam B6-North End 113
(c) Cracking of Beam B6-South End 113
(d) Shear Failure of Beam B6-South End 113

1
CHAPTER 1
INTRODUCTION
1.1 Prestressed Concrete Beams
In prestressed concrete construction, very high-strength steel (such as seven-wire strands
of 270 ksi) are prestressed to reduce the cracking of concrete, to control the deflection and
camber, to enhance the strength of the structures, and to lighten the dead weight. Because of
these advantages, prestressed concrete has, in a short span of 50 years, become the predominant
construction material. For example, 60 % of all the bridges built during the 1990-99 period in the
United States are prestressed concrete bridges (others being reinforced concrete, steel and
timber).
The developments in new materials and technology in recent years have made it possible
to construct and assemble long-span prestressed concrete structural systems. Standardization in
the design and manufacturing of the precast bridge components has optimized bridge design.
Bridge superstructure elements such as the I-beams, double tee and box beams are generally
plant-produced precast and prestressed concrete products inheriting the advantages of economy,
durability, low maintenance and assured quality. The most commonly used precast/prestressed
concrete beam for short-to-medium-spans is the I-beam (PCI 1999) as shown in Fig. 1.1.1.
Fig. 1.1.1 Prestressed Concrete I-Beam

2
An I-beam consists of a top and bottom flange with a slender web joining the flanges.
The bottom flange and some portion of the web-bottom are reinforced with prestressing tendons;
thus the bottom and top flanges build up the flexural strength. The web is reinforced with
vertical/transverse deformed steel reinforcement bars (rebars) that contribute towards the shear
strength of the beam.
1.2 End Blocks of Prestressed I-Beams
Before casting a precast, pretensioned beam, prestressing tendons are pulled and stressed
to a designed prestress level. The tendons are then released after the concrete has matured to a
required strength, which is usually 16 to 24 hours after casting. Thus, prestressing involves
application of large concentrated tendon forces into the end regions of the beam called the “end
block.” At these end blocks, prestress is gradually transferred to the concrete over a certain
length of the beam known as the “transfer length.” The region affected by the concentrated force
is called the “anchorage zone,” which encounters two critical tensile stresses as shown in Fig.
1.2.1; the spalling stress near the edges of the anchorage and the bursting stress along the transfer
length (Breen et al 1994). Since the tensile strength of concrete is small in comparison to its
compressive strength, cracks frequently occur due to the bursting and the spalling stresses. Large
amounts of transverse deformed steel rebars are placed in the anchorage zone to arrest these
cracks.
Fig. 1.2.1 Stress Isobars in End Zone (Breen et al 1994)
Bursting Stress
Spalling Stress
Prestressing Force

3
Adequate reinforcement should be present in the anchorage zone and placed in the
vicinity of the expected cracks to retard or to eliminate the propagation and opening of the
cracks. If, on the other hand, the anchorage zone reinforcement is inadequate or inappropriately
located, the cracks will propagate in the structure until failure of the anchorage zone occurs. End
zone cracking is commonly observed during the stressing of tendons (Breen et al 1994). The
cracks occur as a result of the combination of residual stresses produced due to curing or
hydration of the concrete and the transfer of the prestressing force (Earney 2000, Gopalaratnam
et al 2001). Even if cracks do not appear after the tendons have been released, they may appear
at a later stage due to creep, shrinkage, temperature effects and other such secondary causes.
In addition to giving the uncomfortable appearance of structural distress, excessive
cracking can lead to the corrosion of reinforcement, thereby reducing the service life of bridges.
Therefore, it is imperative to properly design and provide the end zone reinforcement in the
anchorage zone.
1.3 Problem Statement
The Texas Department of Transportation (TxDOT) and other such agencies throughout
the United States extensively use the precast/prestressed concrete I-beams as the primary
superstructure element in highway bridges. Various superimposed live, dead and vehicular loads
are applied on the beams through an overlying deck-slab. A commonly observed problem in the
prestressed concrete beams is the appearance of end zone cracking either just after the release of
the prestressing force or after some time due to secondary effects of creep, shrinkage and
temperature (Fig. 1.3.1). Typically, cracks occur at the intersection of the web and flange. The
cracks usually begin at the end face, propagate horizontally along the length of the beam, and
then incline towards the web region. Sometimes, the cracks initiate from the web center and
horizontally extend towards the beam interior. To control this cracking, TxDOT provides a large
quantity of transverse stirrups in the anchorage zone (Fig. 1.3.2). This end zone reinforcement
amounts to a staggering 4.2 % by volume of concrete. Even with such a high percentage of
reinforcing steel in the anchorage zone, cracking still occurs at the end zone and the problem
persists.

4
Fig. 1.3.1 End Zone Cracking in a Prestressed I-Beam
Fig. 1.3.2 Typical End Zone Reinforcement Details of a Prestressed I-Beam
In general, prestressed concrete bridge beams are optimized in their cross-section
dimensions to limit the dead weight of the structure. The slender web makes it even more
difficult to place the large amount of rebars required for shear strength, confinement of concrete
and anchorage zone reinforcement. Thus the anchorage zone reinforcement becomes quite
congested, which leads to difficulty in consolidating the concrete properly. Hence, the quality of
concrete degrades at the end zones, again making it susceptible to cracking. Moreover, it is also
labor- intensive to produce and place the large amount of steel reinforcement in the end zone.

5
Highway bridges are exposed to potentially corrosive environments. The onset of any
crack would initiate corrosion of the reinforcement and degrade the concrete structure. This
problem becomes more critical at the beam ends. Therefore, it is desirable to reduce the end zone
cracking by using unconventional means offered by the latest technological advancements.
1.4 Project Objectives
The large amount of the reinforcement (4.2 % by volume) in the anchorage zone makes
the casting and vibration of concrete very difficult and tends to degrade the quality of concrete,
yet the cracks still tend to appear. Thus, a solution must be developed which would not only
control the end zone cracking, but would also help to enhance the quality of concrete and the
ease of placement.
When steel fibers of high tensile strength are added to the concrete mix, the tensile and
shear resistance of the composite system is enhanced. Fiber reinforced concrete is also known to
posses better properties than traditional concrete. These properties include bond strength,
residual flexural toughness, low shrinkage and ductility. It would be desirable to find out whether
steel fibers could be used to enhance the properties of Texas traditional concrete.
Fibers are known to reduce the workability and the flow characteristics of plain concrete.
To improve the workability, an idea was developed to place fibers in Self-Consolidating
Concrete (SCC). Self-Consolidating Fiber Reinforced Concrete (SCFRC) appears to be a logical
material for application to the end regions of prestressed concrete I-beams and is expected to
control cracking as well as to improve casting performance.
The objectives of this research are:
(a) To develop TxDOT Traditional Fiber Reinforced Concrete (TTFRC) and Self-
Consolidating Fiber Reinforced Concrete (SCFRC) mixes having optimized
performance with regard to its workability, fiber content, types of fibers and
mechanical strengths suited to cast I-beams. The purpose is to control end zone
cracking and to eliminate partially or completely the conventional transverse
reinforcement in the anchorage zone.
(b) To investigate and establish an effective construction procedure for casting full-
scale I-beams with the optimized TTFRC and SCFRC mixes. To provide the
6
instrumentation necessary to collect data of concrete temperatures, stresses and
strains that will help us to understand the mechanism of end zone cracking.
(c) To conduct full-scale load tests of the I-beams to study the effect of steel fibers on
their structural behavior with regards to ultimate shear strength, ductility and failure
mechanisms.
(d) To prescribe design recommendations for the end regions and construction
guidelines for manufacturing and placing TTFRC and SCFRC mixes in the I-
beams.

7
CHAPTER 2
TXDOT TRADITIONAL FIBER REINFORCED CONCRETE AND SELF-
CONSOLIDATING FIBER REINFORCED CONCRETE
2.1 Introduction
At the end regions of a prestressed concrete beam, prestress forces, concrete hydration-
thermal loading and shrinkage are collectively responsible for generating end zone cracks. To
prevent the occurrence of end zone cracks, dense and intricate reinforcement of steel deformed
bars amounting to 4.2 % by volume of concrete is provided in the TxDOT I-beams. However,
observations show tha t such a heavy reinforcement cannot completely eliminate the cracking in
end regions. A potential alternative solution is to replace the conventional web reinforcement
with steel fibers. This alternative solution could prevent the cracking at the end region, as well as
allow easy placement of TxDOT traditional concrete.
Portland cement concrete is a relatively brittle material that is expected to crack under
relatively small tensile stress. Fiber Reinforced Concrete (FRC) has the potential to increase the
tensile and shear strengths of concrete and to reduce or eliminate traditional reinforcement
(Noghabai 1998, 2000, Ashour et al 1992, Imam 1995, Casanova 1996). However, fibers are also
known to impede the workability and the rheological characteristics of plain concrete. To
enhance the workability of FRC, an idea was developed to place fibers in Self-Consolidating
Concrete (SCC). Self-Consolidating Fiber Reinforced Concrete (SCFRC) appears to be an
appropriate solution for application to the end regions of prestressed concrete I-beams to control
cracking.
2.2 Fiber Reinforced Concrete
Fiber Reinforced Concrete (FRC) has gained world-wide popularity in the construction
industry. It is widely used in manufacturing slabs, road pavements, machine foundations, seismic
structures, precast concrete elements and shotcrete. In 1910, Porter first suggested the use of
steel fibers in concrete (Naaman 1985). However, the first scientific investigation of FRC in
United States was done in 1963 (Romualdi and Baston 1963). FRC is produced using the
conventional hydraulic cements, fine and coarse aggregates, water and discrete discontinuous

8
reinforcing fibers. To enhance the workability and stability of FRC, superplasticizers (chemical
admixtures) may also be added in the concrete. Fibers are commercially available and
manufactured from steel, plastic, glass and other natural materials. Engineering specifications of
fiber address its shape, material, length, diameter and type of cross-section (Fig. 2.2.1). Steel
fibers can be defined as discrete, short lengths of steel having a ratio of its length to diameter (i.e.
aspect ratio) in the range of 20 to 100 with any of the several cross-sections, and that are
sufficiently small to be easily and randomly dispersed in fresh concrete mix using conventional
mixing procedures (ACI 318 1996).
Fig. 2.2.1 Different Shapes of Steel Fibers (ACI 544.1R 1996)
Fibers act as multi-directional uniformly dispersed micro-reinforcement in the concrete
matrix. As shown in Fig. 2.2.2, fibers bridge across a crack and prevent it from growing by
transferring the tension across the crack. They help in carrying and redistributing the applied
stresses in concrete by undergoing shear strains (Beaudoin 1990). Thus, shrinkage and thermal
cracking during the plastic stage and micro-cracking in the concrete matrix during the loading
stage are controlled by the presence of fibers in concrete. These characteristics of fiber impart
post-cracking ductility to FRC. Fibers enhance the mechanical performance of concrete with
regard to its tensile and shear strength, toughness, ductility, durability, fatigue and shrinkage
resistance (Shah 1991). The beneficial influence of fibers in concrete depends on many factors
such as type, shape, length and cross-section of fibers, strength and bond characteristics of fiber,

9
fiber content, matrix strength and mix design and mixing of concrete. Typical load-deflection
curves for plain and fiber reinforced concrete are depicted in Fig. 2.2.3.
Fig. 2.2.2 ‘Bridging’ Action of Fibers across Fig. 2.2.3 Load–Deflection Curves for
Concrete Crack (Beaudoin 1990) Plain and Fibrous Concrete
The replacement of traditional steel reinforcement with fibers has the following
advantages:
(a) Fibers increase the tensile strength of the matrix, thereby improving the flexural
and shear strengths of concrete.
(b) The bridging mechanism of fibers and its tendency to redistribute stress evenly
throughout the matrix contribute to post-cracking resistance, restrain crack growth
and impart ductility to concrete.
(c) FRC is more durable and serviceable than conventional reinforced concrete
(Grzybowski 1989, Rapoport et al 2001, Grzybowski and Shah 1990).
(d) Producing and placing conventional reinforcement requires costly labor and time.
Thus, use of fibers in concrete saves labor costs and time.
Fibers have an effect on the mechanical performance of concrete in all failure modes
(Gopalaratnam and Shah 1987). In FRC, an addition of up to 1.5 % of fibers by volume increases
the compressive strength from 0 to 15 % (Johnston 1974, Dixon and Mayfield 1971). A gradual
slope in the descending portion of the FRC stress-strain curve indicates improved spalling
resistance, ductility and toughness as shown in Fig. 2.2.4 (Padmarajaiah and Ramaswamy 2002).

10
[1 MPa = 145 psi]
Hence, fibers marginally improve the compressive strength but significantly enhance the post-
peak strain and ductility of FRC. Fibers have the ability to improve the direct tensile strength of
concrete up to 40 % when 1.5 % volume of fibers is used in FRC (Williamson 1974). Previous
research has shown that fibers substantially increase the shear strength of concrete (Narayanan
and Darwish 1987, Barr 1987, Oh et al 1999, Noghabai 2000). FRC having 1 % volume of fibers
can increase up to 170 % of the ultimate shear strength (Narayanan and Darwish 1987). Steel
fibers have been shown to be an effective mean to completely replace traditional transverse shear
reinforcement (Williamson 1978, Noghabai 2000). Rather than using a single type of fiber, a
combination of fibers with various aspect ratios can prove to be more efficient in improving the
mechanical performance of FRC (Noghabai 2000). The enhanced performance of FRC over its
unreinforced counterpart comes from its improved capacity to absorb energy during and after
fracture.
Fig. 2.2.4 Effect of Steel Fiber Content on Compressive Stress-Strain Curve of
FRC (Padmarajaiah and Ramaswamy 2002)
The following advantages of FRC were reported by Narayanan and Darwish (1987);
(a) The spacing of cracks in FRC beams was reduced to a fifth of that in the control beams
with or without conventional stirrups.

11
(b) The mode of failure changed from shear to flexure type when the volume of fibers (Vf)
was increased beyond an optimum value of Vf = 1.0 %.
(c) More uniform redistribution of stresses was observed in the fiber concrete beams in
comparison to the traditional beams.
The only disadvantages of FRC would be its decreased workability and accelerated
stiffening of fresh concrete due to the addition of fibers. This increases construction labor and
time due to the excess vibration that is required to make the FRC workable. The problem could
be partially overcome with the use of newly developed high range superplasticizers that not only
enhance the workability of FRC but also maintain the plasticity of the mix for a longer time.
The influence of steel fibers on the flexural strength of concrete is much grater than for
direct tension and compression (Hannant 1978). The flexural strength of FRC is increased by
about 55 % with a Vf = 2 % as reported by Oh et al (1999). The presence of coarse aggregate in
the concrete coupled with mixing and placing constraints, limits the maximum fiber content to
1.5 %. It has been determined that balling of fibers in concrete during mixing and placing
increases as the aspect ratio increases. An aspect ratio of 100 for steel fibers was found to be
optimum. Fibers aligned in the longitudinal direction of a beam produce improved flexural
strengths of up to 150 % (Johnston 1974, Snyder and Lankard 1972, Watrehouse and Luke 1972,
Johnston 1989). The influence of a particular fiber on the hardened properties of FRC depends
on the product of volume of fiber (fiber content) and its aspect ratio (length/diameter). This
parameter is termed the ‘fiber factor.’ If the fiber factor is less than 25, the fibers would not
significantly effect the mechanical properties of FRC (Johnston 1980).
Concrete is prone to shrinkage when subjected to a drying environment. During
shrinkage, if concrete is restrained, tensile stresses are induced leading to cracking. Short and
randomly distributed fibers can reduce shrinkage cracking in concrete (Hoff 1987). Research has
shown that a well compacted FRC will limit the corrosion of fibers close to the surface skin of
the concrete even when concrete is highly saturated with chloride ions (Schupack 1985).
2.3 Self-Consolidating Concrete
Self-Consolidating Concrete (SCC), also referred to as self-compacting concrete, is a
highly workable concrete that can flow through densely reinforced or complex structural
elements under its own weight and adequately fill voids without segregation or excessive

12
bleeding, without the need of vibration (PCI 2003). SCC is not only designed to consolidate but
also flow under its own weight. It provides slick finished surfaces without vibration. SCC has
substantial commercial benefits because of ease of placement in complex forms with congested
reinforcement. This is in contrast to traditional concrete, where the difficulties in compaction
could cause entrapped air voids, which could severely reduce the strength and durability of
concrete (Gaimster and Foord 2000, Khayat et al 1999). SCC has gained widespread attention in
the United States in the last few years for its obvious advantages of savings in labor costs,
shortened construction time, better finish and improved work environment (Gaimster and Foord
2000, Khayat et al 1999).
SCC, which does not need vibration to achieve full consolidation, necessitates it to be a
high-performance concrete that demonstrates high fluidity and possesses good cohesiveness at
the same time, in a plastic state. SCC mix constituents and their proportions are to be carefully
selected so as to achieve a concrete with lower rheological shear stress and viscosity that would
remain homogenous during its use. Thus, rheological properties, i.e. properties dealing with the
deformation and flow characteristics of fresh concrete, are important for successful production
and use of SCC. Advancement in SCC technology was primarily possible due to the introduction
of a new generation of chemical admixtures that improved and controlled the rheological
properties of SCC. Better performing SCC mixes were produced on the advent of melamine,
naphthalene and acrylic based High Range Water Reducing superplasticizers (HRWR) and
Viscosity Modifying Agents (VMA).
SCC must satisfy the following workability criteria stipulated by the PCI guidelines (PCI
2003):
(a) Filling ability – The property which determines how fast SCC flows under its own weight
and completely fills intricate spaces with obstacles, such as reinforcement, without losing
its stability.
(b) Passing ability – the ability of SCC to pass through congested reinforcement and adhere to
it without application of external energy.
(c) Stability – the ability of SCC to remain homogenous by resisting segregation, bleeding and
air popping during transport and placing as well as after placement.
These properties provide SCC with a unique rheology that distinguishes it from conventional
concrete. Producing such a special concrete requires an improved work environment and strict

13
quality control measures. The quality of SCC can be ascertained with the aid of numerous
workability tests.
All workability tests should preferably be conducted near the mixer, after about 60
seconds of mixing. This allows the SCC mix to stabilize after the agitation of mixing. Visual
inspection of SCC mix in the mixer would help to gauge the probable degree of workability.
Both quantitative and qualitative measurements should be taken to judge the workability of the
mixes in accordance with the PCI guidelines (PCI 2003). Mentioned below are some of the
important workability tests for SCC:
(a) Slump flow test – Filling ability and flowability of the mix can be tested using
the slump flow test, which is similar to the conventional slump test used for traditional concretes
with regards to the testing apparatus. The ‘slump flow’ is the mean diameter of the horizontal
spread of the concrete mass, after lifting Abram’s cone (Fig. 2.3.1). As a ‘rule of thumb,’ any
concrete having a slump flow value greater than 25 inches can be classified as SCC. A slump
flow test is simple, rapid and can easily be performed on site. It is therefore the most commonly
used test. The test gives a good assessment of filling ability, and may give some indication of
resistance to segregation. The test can be used effectively to control the consistency of SCC on
site from batch-to-batch (PCI 2003).
Fig. 2.3.1 Slump Flow Test (PCI 2003)

14
SCC having satisfactory slump flow could be produced easily with high coarse aggregate
content suitable for large depths of casting. The slump cone test can also be performed by
inverting the cone, i.e. up-side down, with almost the same results. But only one of the two types
of slump flow tests shall be used to control and compare the SCC mixes; switching between the
two tests is not recommended (PCI 2003). T-20in is the time required by the concrete mass to
spread to 20 inches diameter, indicating the filling ability of the mix. Slump flow is the static
measure of the extent of flowability of SCC, while T-20in time is the dynamic part that depicts
how fast the SCC would flow and fill the form.
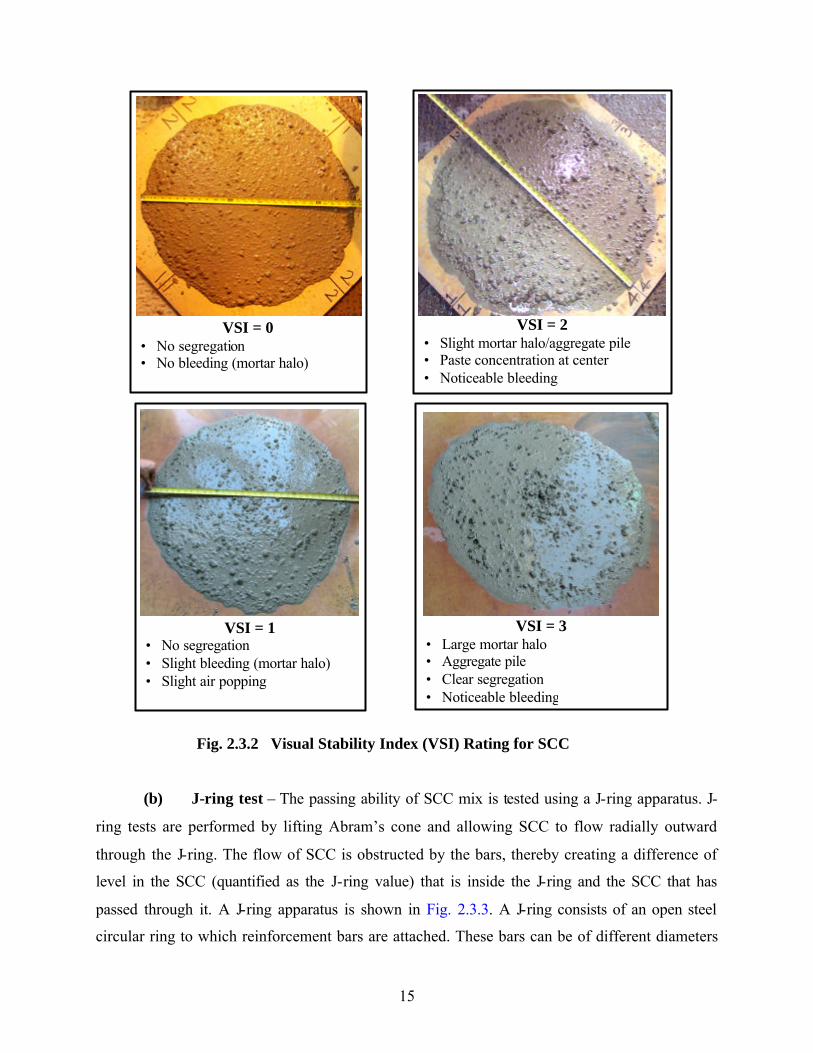
Visual Stability Index (VSI) is a qualitative test performed by observing the SCC in the
mixer, in the wheelbarrow and during other tests and is also to be recorded during the slump flow
test. It rates the quality of SCC in terms of segregation and bleeding. Fig. 2.3.2 shows the
detailed description of VSI ratings along with photos for SCC mix. 0-VSI rating suggests a stable
SCC, whereas 3-VSI rating means severe segregation and bleeding indicating a very poor quality
of SCC. The VSI ratings could be done in increments of 0.5 of the stability of the mix (Daczko
2002). VSI is quite useful for quality control and consistency testing of SCC. During the slump
flow test, there is no restriction offered to the freely flowing SCC. Hence, the flow spread and T-
20in time recorded during this test will be referred to as unrestricted slump flow and unrestricted
T-20in time. A T-20in time between 3 to 7 seconds and a VSI rating of zero is recommended
(PCI 2003).
15
Fig. 2.3.2 Visual Stability Index (VSI) Rating for SCC
(b) J-ring test – The passing ability of SCC mix is tested using a J-ring apparatus. J-
ring tests are performed by lifting Abram’s cone and allowing SCC to flow radially outward
through the J-ring. The flow of SCC is obstructed by the bars, thereby creating a difference of
level in the SCC (quantified as the J-ring value) that is inside the J-ring and the SCC that has
passed through it. A J-ring apparatus is shown in Fig. 2.3.3. A J-ring consists of an open steel
circular ring to which reinforcement bars are attached. These bars can be of different diameters
VSI = 1 • No segregation • Slight bleeding (mortar halo) • Slight air popping
VSI = 0 • No segregation • No bleeding (mortar halo)
VSI = 2 • Slight mortar halo/aggregate pile • Paste concentration at center • Noticeable bleeding
VSI = 3 • Large mortar halo • Aggregate pile • Clear segregation • Noticeable bleeding

16
and spaced at different intervals, depending on the actual reinforcement spacing and size used at
the site. Generally, a spacing of three times the maximum aggregate size will be satisfactory
(PCI 2003).
The J-ring attempts to simulate the congestion of reinforcement in an actual structure.
Desired J-ring values for a good SCC mix lie within the vertical offset of 0.4 to 0.6 inch. Slump
flow and T-20in time can also be measured during the J-ring test, which indicates the restricted
slump flow and restricted T-20in time. It should be noted that flowability and passing ability are
interdependent. The restricted slump flow is affected by the degree to which the concrete
movement is blocked by the reinforcing bars. The extent of blocking is much less affected by the
flow characteristics. Hence, it can be stated that the greater the difference in height, i.e. the
higher the J-ring value, the lower the passing ability of the SCC (EFNARC 2002). The J-ring
value is the difference between the heights of the SCC inside and outside the ring. The J-ring
value is calculated by measuring the heights of the SCC from the top of the J-ring at various
points orthogonal to each other, as shown in Fig. 2.3.3, and then averaging out the measured
difference in height. Fig. 2.3.4 shows the J-ring apparatus used in this project and the
measurements taken during one of the tests. Blocking can best be detected visually, which is
often more reliable than calculations.
Fig. 2.3.3 J-ring Apparatus (PCI 2003)
17
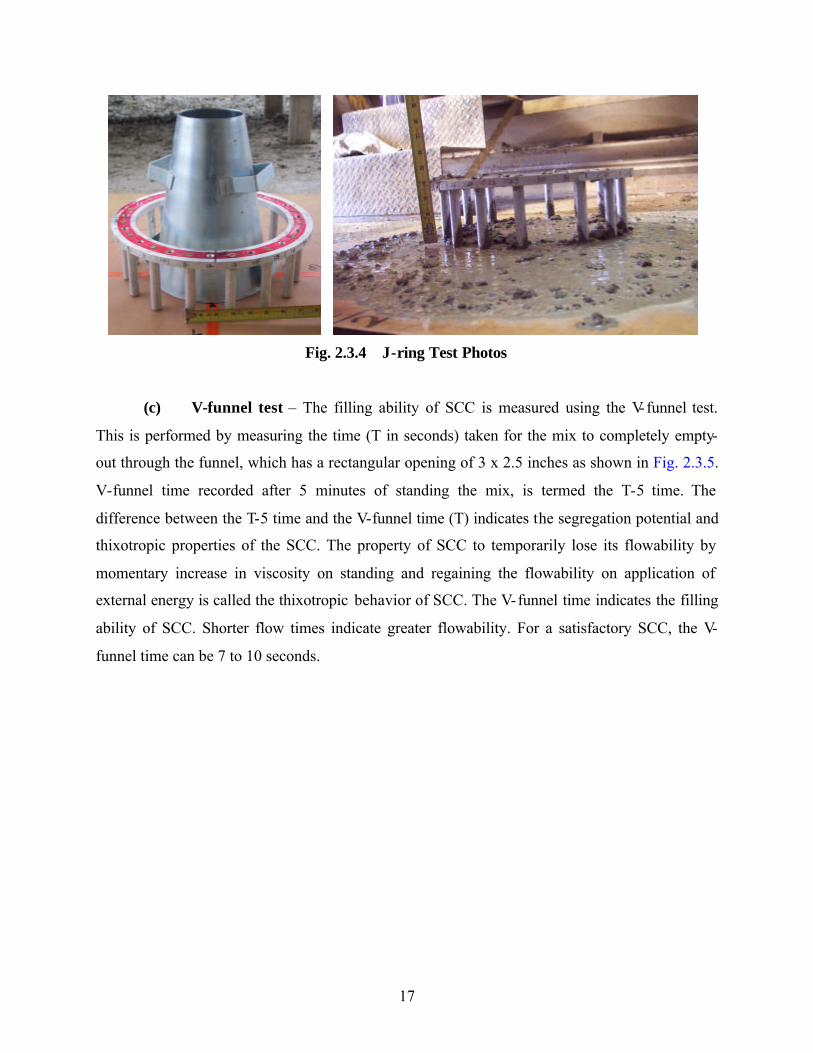
Fig. 2.3.4 J-ring Test Photos
(c) V-funnel test – The filling ability of SCC is measured using the V-funnel test.
This is performed by measuring the time (T in seconds) taken for the mix to completely empty-
out through the funnel, which has a rectangular opening of 3 x 2.5 inches as shown in Fig. 2.3.5.
V-funnel time recorded after 5 minutes of standing the mix, is termed the T-5 time. The
difference between the T-5 time and the V-funnel time (T) indicates the segregation potential and
thixotropic properties of the SCC. The property of SCC to temporarily lose its flowability by
momentary increase in viscosity on standing and regaining the flowability on application of
external energy is called the thixotropic behavior of SCC. The V-funnel time indicates the filling
ability of SCC. Shorter flow times indicate greater flowability. For a satisfactory SCC, the V-
funnel time can be 7 to 10 seconds.

18
(1 in = 25.4 mm)
Fig. 2.3.5 V-funnel Apparatus (PCI 2003)
The basic ingredients used to make SCC are the same as those used in making
conventional concrete. The only difference is that SCC has a comparatively high fine-to-coarse
aggregate ratio, a low water-cement ratio and good aggregate grading. The addition of High
Range Water Reducing agents (HRWR) is required to impart flowability and passing ability to
the mix. But excessive HRWR may result in segregation and bleeding. To alienate segregation
and bleeding, a viscosity modifying agent (VMA) is added to the concrete (Okamura and Ozawa
1995). Numerous research findings have shown that it is no longer a dream to make a flowable
yet stable SCC, tailored for any application.
SCC uses a higher proportion of ultra- fine materials and effective admixtures. Unlike the
normal vibrated concrete, SCC has a ratio of fine aggregate to coarse aggregates slightly above
unity. Normal vibrated concrete has a coarse to fine aggregate ratio generally in the range of 1.6
to 2.5 (Holschemacher et al 2002). SCC is a special concrete and hence requires new mix design
procedures. Various mix design methods are proposed for SCC. To understand the design
principles, the workability concepts and mechanisms of SCC should first be studied. SCC
requires high flowability and a low yield value of the rheological characteristics. High

19
flowability can be obtained by decreasing the yield value of the mortar paste and increasing the
plastic viscosity of the concrete to resist segregation. Superplasticizers reduce the yield value of
the mortar paste by a pronounced dispersion effect. It is also known that the plastic viscosity of
mortar governs the compactibility of concrete. There is an optimum value of plastic viscosity for
which there exists maximum flowability and stability.
If the powder content is increased, the viscosity increases while the yield value decreases,
resulting in a highly flowable SCC (Toyoharu et al 1998). The flowability of SCC is affected by
the degree of dispersion of the cement particles due to the physiochemical effect of the
admixtures. Belite (C2S) rich cement brings out the dispersing action of superplasticizers quite
effectively (Nawa et al 1993). High early strength cement and ordinary Portland cement produce
high yield values in SCC, whereas moderate heat cement and belite (C2S) cement are best for
SCC. Mechanically stabilized cements using fly ash, silica fume, slag and limestone powder
having high-fineness are best suited for SCC (Nawa et al 1989 and Edamatsu et al 1997).
The effects of coarse and fine aggregates on the rheological, static and kinetic properties
of SCC are critical. When the amount of coarse aggregate is increased, the flowability and
compactibility of SCC decreases as the internal friction between aggregates increases.
Flowability falls as the maximum size of coarse aggregate increases. Fine aggregates help in
lowering the yield value of concrete to a certain point. Large amounts of fine aggregates lower
the compactibility of SCC as the thickness of the mortar paste covering the fines decreases
(Toyoharu et al 1998).
Based on the method of preventing segregation, i.e. by increasing the plastic viscosity of
paste, SCC may be classified into three groups:
(a) Powder-based SCC in which a large amount of powder is added.
(b) Chemical-based SCC in which VMA is used to resist segregation.
(c) Combination types of SCC in which a combination of the above-mentioned types
is used.
Powder-based SCC is the first generation of SCC which has generally high strength and good
durability. Chemical-based SCC was an extension of the anti-washout underwater concrete. The
advantage of this type of SCC is that it develops high flowability even with low powder contents
and offers a better quality control of the mix. The new generation of combination types of SCC

20
benefits from the advantages of the previous two types. Combination types of SCC have a wide
range of flowability along with a better control on the stability of the mix (Toyoharu et al 1998).
SCC mix design procedures proposed by the Japan Society of Civil Engineers (JSCE
1998), Prof. Okamura and others, aim at determining the proportions of various ingredients to
fulfill the performance requirements of self-consolidation, flowability, stability, strength and
durability. The mix design procedure consists of three stages: consideration of mix proportion,
mix proportion design and verification of mix proportions.
The first step determines the target performance requirements of SCC, considering the
structural, constructional and environmental conditions. A preliminary mix design is developed
in the second step based on the various empirical mix design charts and guidelines. The final step
involves verifying the preliminary mix design by actually preparing a trial mix and checking its
performance at all levels. If the trial mix does not work, it is modified and again tested, until
success is achieved (Toyoharu et al 1998).
SCC is gaining popularity in the United States for its obvious advantages of savings in
labor costs, shortened construction time, better finish and improved work environment.
Following are the advantages of SCC:
(a) SCC can be placed efficiently without the need of any mechanical vibration,
since SCC can flow and fill the form on virtue of its self-weight.
(b) SCC can save considerable construction labor and time involved in concrete
placement and finishing work. Hence, SCC creates opportunities to reallocate
labor and time for other jobs.
(c) SCC eliminates vibration and hence the associated machinery noise at the
work place.
(d) Concreting in intricately shaped structural forms and dense reinforcement is
effectively possible with SCC. The filling capacity of SCC is high, making
the placement easy and fast.
(e) The self-consolidating nature of SCC ensures that the concrete is more
homogenous and uniform, thereby reducing permeability and improving
durability of the concrete.
(f) SCC has an improved interfacial transition zone between the cement paste
and aggregate or reinforcement. This increases the bond characteristics of the

21
aggregates and reinforcement with the matrix, resulting in better strengths
and durability.
SCC has the following disadvantages:
(a) Special and expensive admixtures such as HRWR and VMA are required to
produce SCC.
(b) Considerable experience and skill is essential to manufacture SCC
successfully.
(c) Strict quality control is to be maintained during the production, testing and
placing of SCC.
(d) SCC has a relatively high cement paste content generating more heat of
hydration which may result in excess drying shrinkage. The fact that SCC
has a lower aggregate content makes it even more susceptible to drying
shrinkage.
(e) Forms are required to be relatively tight and stronger for SCC (Bury et al
2002).
Many of the above mentioned drawbacks of SCC could be reduced or eliminated. The
cost of expensive admixtures could be counter-balanced with the savings in construction labor
and time. An appropriate SCC mix design method that blends optimum amounts of admixtures
and powder will eventually control the excess use of admixtures. SCC awareness programs,
workshops, seminars and demonstrations would help the construction industry gain confidence,
skills and expertise in manufacturing and using SCC.
In SCC, cement could be partially replaced by various supplementary powders such as fly
ash, silica fume, lime fines, finely ground slag, etc. (Toyoharu et al 1998). This would reduce the
cost as well as the problem of drying shrinkage. The use of expansive additives such as belite
(C2S) in cement is very effective in compensating the shrinkage of SCC (Akihiro et al 1998).
Moreover, SCC with high aggregate contents, almost approaching that used in conventional
concretes, has been successfully produced (Grünewald and Walraven 2001). Studies have shown
that the relatively viscous SCC mix does not require leak-proof forms (Bury et al 2002).

22
2.4 Self-Consolidating Fiber Reinforced Concrete
Fiber Reinforced Concrete (FRC) requires a high degree of vibration to get good
compactness. This increases the labor costs and noise pollution at the work site. Moreover, if the
reinforcement is dense or the form is intricate in shape, it becomes even more difficult to place
and vibrate the concrete. Unfortunately, when one tries to enhance the workability of FRC by
adding more superplasticizers or intensifying the degree of vibration, segregation invariably
occurs. Hence, the development of a Self-Consolidating Fiber Reinforced Concrete (SCFRC)
should make for easier placement of concrete, save labor and avoid noise pollution. Self-
Consolidating Concrete (SCC) offers several economic and technical benefits; the use of steel
fibers extends its possibilities (Grünewald and Walraven 2001).
SCFRC appears to be a logical material for application to the end region of prestressed
concrete I-beams. When steel fibers are added to the concrete mix, the tensile and shear
resistance of the composite material is enhanced. However, fibers are also known to impede the
workability of plain concrete. Moreover, the end zones are densely reinforced, making it
necessary to use a highly workable concrete with steel fibers that would not only reduce or
completely eliminate the conventional reinforcement but also make it easier to place concrete.
The use of SCFRC for the end zone of prestressed girders would guarantee the following
advantages:
(a) Fibers in SCFRC are expected to partially or fully replace the dense
reinforcement of the end region and also control the end zone cracking.
(b) SCFRC would be easier to place and finish than the conventional FRC
when used in the prestressed girders.
(c) The shear and flexural strength of prestressed girders is expected to be
improved with the use of SCFRC mixes. Additionally, the ductility of
prestressed girders will also increase if SCFRC is utilized.
(d) SCFRC might prove to be more economical in the long run, owing to the
fact that both labor and time are saved with the use of SCFRC.
Some research experiments as well as field applications have been successfully carried
out on SCFRC. The mix design of SCFRC could be based on the mix design of an existing SCC
mix (Petersson 1998). The workability of SCFRC is affected by fibers as they posses high
23
surface area. The degree to which workability decreases depends on the type and content of
fibers, the matrix composition and the properties of the constituents of the matrix on their own.
The higher the fiber content in SCFRC, more difficult it becomes to uniformly distribute the
fibers in the matrix (Grünewald and Walraven 2001). Concrete with satisfactory workability
could be made self-consolidating even with a large fiber content of up to 1.3 % by volume
(Ambroise et al 2001).
2.5 Materials Used in the Research Project
Phase One of this research project involved the development of Self-Consolidating
Concrete (SCC), TxDOT Traditional Fiber Reinforced Concrete (TTFRC) and Self-
Consolidating Fiber Reinforced Concrete (SCFRC). In Phase Two of this research work, full
scale I-girders were cast using suitable mixes from Phase One. All the mixes were produced and
tested for their fresh properties at the Texas Concrete Company precast plant in Victoria, Texas.
Thus, traditionally available construction materials that were used to manufacture the TxDOT
girders had been utilized to develop the various mixes. As shown in Table 2.5.1, a total of ten
different mixes were tested for their fresh and hardened properties. The table also states the
nomenclature and importance of various mixes that were tested. The purpose of testing these
mixes was to arrive at an optimized fiber content that would yield maximum workability and
strengths.
(a) Cement – High early strength cement was used in all the mixes, since it was necessary to
develop high release strengths at an early age in the beams. Portland cement (Type-III)
conforming to ASTM C150-2002 and fly ash (Type-C) conforming to ASTM C618-2003 were
the only powder materials used for the experiments. Fly ash was added to the mix to enhance
workability, curtail rise in temperature and reduce cost. The weight ratios of cement to fly ash
were 68:32 for TTC1 and TTFRC mixes and 69:31 and 70:30 for SCC and SCFRC mixes,
respectively. The corresponding cementitious contents were 767 lb/yd3 for TTC1 and TTFRC
mixes and 808 lb/yd3 and 837 lb/yd3 for SCC and SCFRC mixes. A relatively high cementitious
content was necessary in SCC to maintain its yield value and viscosity, thus imparting stability to
the fresh mixes (Khayat et al 1997, Sonebi and Bartos 2002).

24
Table 2.5.1 Description of Various Mixes Tested
* - Mix not tested for hardened properties.
(b) Coarse and Fine Aggregates –The mixes utilized uniformly-graded, rounded, river-bed,
coarse aggregates of 3/4 inch nominal size (AASHTO T27 1996) and well-graded, river-bed
sand with a fineness modulus of 2.55 (AASHTO M43 1998). The specific gravity of the coarse
aggregates was 2.6 and that of the fine aggregates was 2.63. Sieve analysis details for the coarse
and fine aggregates are shown in Table 2.5.2.
Description of Mix Mix
Nomenclature Significance
Texas department of
transportation Traditional
Concrete mix TTC1
This mix is tradit ionally used by TxDOT to cast
I-girders. This mix served as a ‘control-mix’ for
the TTFRC mixes.
TTFRC1
TTFRC2
TTFRC3
TxDOT Traditional Fiber
Reinforced Concrete mix
TTFRC4*
These were the FRC mixes with TTC1 as the
base mix, using various lengths and contents of
steel fibers (i.e. variable fiber factor).
SCC2-3 Self-Consolidating
Concrete SCC4
These SCC mixes were tested to provide
guidelines for the development of satisfactory
SCFRC mixes.
SCFRC1
SCFRC2 Self-Consolidating Fiber
Reinforced Concrete SCFRC3
These were the SCFRC mixes with different
lengths and contents of steel fibers (i.e. variable
fiber factor).

25
Table 2.5.2 Gradation Details of Aggregates (a) Coarse Aggregates (b) Fine Aggregates
(c) Admixtures - A Polycarboxylate-based HRWR (Master Builders-Glenium-3200HES)
conforming to ASTM C 494-1999, Type F was used to achieve a flowable and cohesive SCC
and SCFRC mix. An organic modified cellulose ether-based VMA (Master Builders-Rheomac-
450) was used as required to improve the stability of the mix. A retarder conforming to ASTM C
494-1999, Type-B was added to the mixes as required to delay the initial setting of the mix.
(d) Steel fibers – Two types of steel fibers manufactured by Bekaert-Dramix® were used.
RC80/60BN (Fig. 2.5.1) and ZP305, (Fig. 2.5.2) having a ‘trough’ shape with hooks at both
ends, were used in the TTFRC and SCFRC mixes. The RC80/60BN fibers had a length of 2.4
inch, a diameter of 0.03 inch (aspect ratio of 80) and possessed a tensile strength of 150 ksi. The
ZP305 fibers were 1.2 inches long and 0.022 inch in diameter (aspect ratio of 55) and possessed
a tensile strength of 160 ksi. The fibers were relatively stiff and glued into bundles. The glue
dissolved in the water during mixing, thus dispersing the fibers in the mix.
Sieve Size (in.) % Retained Specified -AASHTO T27 1996 1 0 0
0.75 3 0-10 0.375 62 45-80 0.187 95 90-100 0.093 99 95-100
Sieve Size (in.) % Retained Specified -AASHTO M43 1998 0.375 0 0 0.187 1.4 0-5 0.093 15 0-20 0.046 25.4 15-50 #30 44.4 35-75 #50 74.4 65-90 #100 94.8 90-100 #200 99.4 97-100
(a) Sieve Analysis for Coarse Aggregates
(b) Sieve Analysis for Fine Aggregates

26
Fig. 2.5.1 Steel Fiber RC80/60BN Fig. 2.5.2 Steel Fiber ZP305
(Bekaert-Dramix®) (Bekaert-Dramix®)
Table 2.5.3 Constituents of Various Mixes
Table 2.5.3 shows the details of various constituents used in the mixes. Table 2.5.4 and
Table 2.5.5 present the mix proportions of various mixes. Table 2.5.4 shows the mix proportions
of the traditionally used normal-slump concretes: TTC1 and various TTFRC mixes. The TTC1
Portland Cement Type -III ASTM C150
Fly Ash Type -C ASTM C618
Coarse Aggregates ¾ in. Rounded River - bed gravel AASHTO T 27
Fine Aggregates FM = 2.55, Well Graded, River -bed ASHTO M 43
HRWR Glenium3200HES Type - F (Polycarboxylate based) ASTM - C494 & Rheobuild1000
VMA Rheomac450 Organic Modified Cellulose Ether -
Retarder Type -B ASTM - C494
Steel Fi bers RC80/60BN ZP305
L = 2.4 in., D = 0.030 in.
L/D = 80 L = 1.2 in., D = 0.022 in.
L/D = 55 L
* Bekaert Dramix®
DL
* Hooked Ends
D
-
Components Description Reference Code

27
mix was the control mix for the different TTFRC mixes. Four TTFRC mixes were tested with
different types and amounts of fibers. The hardened properties of the TTFRC4 mix were not
tested as this mix was not planned in the initial stages, but was decided by the Texas Concrete
Company to be used to cast a beam in the final stage of the research. Table 2.5.5 shows the mix
proportions of various SCC and SCFRC mixes. Two SCC mixes were cast. SCC4 differed from
the SCC2-3 mix only in the proportions of coarse aggregates (CA) and fine aggregates (FA).
Because of the higher CA/FA ratio, SCC4 required the addition of VMA to maintain its stability.
Three SCFRC mixes were essentially the same apart from the use of different types and amounts
of steel fibers used. Besides the added fibers, the basic proportions of SCFRC mixes were very
similar to the control SCC2-3 mix. Slightly higher cement and fine aggregate contents were used
in the SCFRC mixes to stabilize the mixes due to the addition of fibers.

28
Table 2.5.4 Mix Proportions of Various Normal-Slump Concrete Mixes
Component
(lb/yd3)
TTC1
TTFRC1
TTFRC2
TTFRC3
TTFRC4*
Cement 519 519 519 519 519
Fly ash 248 248 248 248 248
Cementitious materials 767 767 767 767 767
Water/Cement ratio (w/c) 0.43 0.43 0.43 0.43 0.43
Water/Cementitious ratio 0.3 0.3 0.3 0.3 0.3
Coarse aggregate (CA) 1899 1899 1899 1899 1899
Fine aggregate (FA) 1156 1156 1156 1156 1156
CA / FA ratio 1.64 1.64 1.64 1.64 1.64
HRWR / Superplastizer
(fl.oz./cwt)
9.6 (R)
(20)
14 (R)
(30)
12 (R)
(24)
9.6 (R)
(20)
9.6 (R)
(20)
VMA (fl.oz./cwt) 0 0 0 0 0
RC80/60BN
Long Fiber [LF] 0 0
132 (1 %)
Vf = 80
66 (0.5 %)
Vf = 40 0
ZP305
Short Fiber [SF] 0
132 (1 %)
Vf = 55 0 0
198 (1.5 %)
Vf = 82.5
Retarder (fl.oz./cwt) 1.0 (3) 1.0 (3) 1.0 (3) 1.0 (3) 1.0 (3)
NOTE: R=Rheobuild-1000 Vf = Fiber Factor = (Vol. of fiber) x (Aspect ratio of fiber)
* - Hardened properties of this mix were not tested.

29
Table 2.5.5 Mix Proportions of Various SCC and SCFRC Concrete Mixes
Component
(lb/yd3)
SCC2-3*
SCC4
SCFRC1
SCFRC2
SCFRC3
Cement 555 555 587 587 587
Fly ash 253 253 250 250 250
Cementitious materials 808 808 837 837 837
Water/Cement ratio (w/c) 0.43 0.43 0.43 0.43 0.43
Water/Cementitious ratio 0.3 0.3 0.3 0.3 0.3
Coarse aggregate (CA) 1501 1794 1540 1540 1540
Fine aggregate (FA) 1514 1196 1580 1580 1580
CA / FA ratio 0.99 1.5 0.97 0.97 0.97
HRWR / Superplastizer
(fl.oz./cwt)
7.2 (GL)
(14)
7.2 (GL)
(14)
10.5 (GL)
(20)
10.5 (GL)
(20)
10.5 (GL)
(20)
VMA (fl.oz./cwt) 0 0.3 (2) 0 0 0
RC80/60BN
Long Fiber [LF] 0 0
66 (0.5 %)
Vf = 40 0 0
ZP305
Short Fiber [SF] 0 0 0
66 (0.5 %)
Vf = 28
132 (1 %)
Vf = 55
Retarder (fl.oz./cwt) 1.5 (4.4) 1.5 (4.4) 1.6 (4.4) 1.6 (4.4) 1.6 (4.4)
NOTE: GL = Glenium 3200 HES Vf = Fiber Factor = (Vol. of fiber) x (Aspect ratio of fiber)
* - SCC2 & SCC3 mixes were identical; hence the combination mix was represented as SCC2-3.

30
2.6 Mixing Procedure
All concrete mixes were mixed in a 6 yd3 drum mixer at the Texas Concrete Company’s
Victoria, Texas, precast plant (Fig. 2.6.1). The yield for each mix was 2 yd3. The following step-
by-step procedure was adopted to mix the concrete:
1. Fine and coarse aggregates were first fed into the mixer-drum using a conveyor belt.
2. Cement and fly ash were then added to the aggregates inside the drum and initial dry
mixing was carried out for 30 seconds.
3. Premixed water with HRWR was then introduced into the mix and mixed for 120 seconds.
4. SCC4 was mixed following steps 1 to 3 without any VMA dose. Preliminary workability
tests indicated SCC4 to be flowable but highly unstable. To rectify this instability, VMA
was separately introduced into the fresh SCC4 and mixed for an extra 60 seconds.
5. In the case of TTFRC and SCFRC mixes, fibers in the form of bundles were uniformly fed
along with the fine and coarse aggregates on the conveyor belt.
Fig. 2.6.1 Concrete Mixer at the Precast Plant-Texas Concrete Co., Victoria, Texas
2.7 Results of Workability Tests of Concrete Mixes
All workability tests were conducted near the mixer, after waiting for 60 seconds of
mixing, unless otherwise stated. Both quantitative and qualitative measurements were taken to
judge the workability of the mixes in accordance with the PCI-2003 guidelines. Slump tests were
conducted for traditional normal-slump concretes, TCC1 and various TTFRC mixes in

31
accordance with ASTM C143/C143-2003. A slump flow test, T-20in time measurement and VSI
rating were carried out for all the SCC/SCFRC mixes. The targeted minimum slump flow for the
research was 25 inches. The targeted T-20in and VSI for the research project were 3 to 7 seconds
and 0 to 1, respectively. During the slump flow test, there was no restriction offered to the freely
flowing SCC/SCFRC. Hence, the flow spread and T-20in time recorded during this test were
referred to as the unrestricted slump flow and unrestricted T-20in time.
Fig. 2.7.1 shows the results of slump and slump flow tests for various mixes. The figure
also depicts the values of unrestricted and restricted (with J-ring) slump flow for all the mixes.
All the mixes achieved the minimum target level of unrestricted slump flow, i.e. 25 inches. None
of the mixes showed segregation, bleeding or halo-formation, giving a satisfactory VSI, within
the targeted value of 0 to 1. The unrestricted slump flow for SCC4 was less than that for SCC2-3.
This was because SCC4 had a relatively higher CA/FA ratio, which made the mix harsher, and
also because VMA reduced the slump flow, as it increased the viscosity of the mix. Moreover,
SCC4 had a larger coarse aggregate content, which made the SCC4 mix more difficult to pass
through the J-ring. The unrestricted slump flows of SCFRC mixes were as good as that of the
SCC mixes. Comparatively larger slump flow could be attributed to the slightly more
cementitious material content in the SCFRC mixes. Apparently, fibers did not affect the
unrestricted slump flow. Restricted slump flow for SCFRC1 mix was considerably lower than its
unrestricted slump flow. Long fibers hindered the flow of SCFRC through the J-ring and thus
lowered the slump flow. TTFRC mixes in general had satisfactory workability. TTFRC2 with 1
% by volume of long fibers had low workability due to a large quantity of fibers.

32
Slump & Slump Flow Test Results for Various Concrete Mixes
8 7.5
29
25.5
30.5 31
27.5
2
8.5
6.75
26.5
2021
29.5
25
0
5
10
15
20
25
30
35
SCC2-3 SCC4 SCFRC1 SCFRC2 SCFRC3 TTC1 TTFRC1 TTFRC2 TTFRC3 TTFRC4
Mix Identification
Slu
mp
or S
lum
p F
low
(in
.)
Unrestricted Slump Flow (in.)
Restricted Slump Flow (in.)VSI = 1
VSI = 0.5
VSI = 0
VSI = 1.5
VSI = 0.5
Target Slump Flow = 25 in.Target Slump = 7 to 8 in.
Fig. 2.7.1 Results of Slump and Slump Flow Test
Fig. 2.7.2 shows the kinetic performance, i.e. T-20in time, measured during the slump
flow and J-ring tests for various mixes. All the SCC/SCFRC mixes performed satisfactorily with
regards to the T-20in time as they were within the targeted values. The restricted T-20in time for
SCC4 and SCFRC1 mix was considerably high. This was due to a high aggregate content in
SCC4 and the use of long fibers in SCFRC1. The SCFRC mixes with short fibers did not show
escalated values of restricted T-20in time, since the short fibers passed readily through the J-ring.

33
Kinetic Performance (T-20 in. Time) of Various SCC & SCFRC Mixes
4.64
2.9
5.4
3.5
7
4.2
12
11
4.25
0
2
4
6
8
10
12
14
SCC2-3 SCC4 SCFRC1 SCFRC2 SCFRC3Mix Identification
T-2
0 in
. Tim
e (s
)
Unrestricted T-20 in. Time (sec.)
Restricted T-20 in. Time (sec.)
Target Unrestricted T-20 in. Time Value 3 to 7 sec.
Fig. 2.7.2 Results of T-20in Time for Different Mixes
The filling ability of various mixes was measured using the V-funnel by noting the time
(T sec) taken for the mix to completely empty-out through the funnel, which had a rectangular
opening of 3 x 2.5 inches. The targeted V-funnel time was between 7 and 10 seconds. After this,
the funnel was refilled with the recently tested mix and left standing for 5 minutes. The V-funnel
time recorded after 5 minutes of standing was the T-5 time. The SCC mixes showed good filling
ability, whereas the SCFRC mixes had comparatively lower filling abilities as shown in Fig.
2.7.3. Fibers blocked the opening of the V-funnel causing extended time delays in emptying the
V-funnel.

34
Kinetic Performance (V-funnel Time) of Variious SCC & SCFRC Mixes
0
11
7
22
6
0
5
10
15
20
25
30
35
SCC2-3 SCC4 SCFRC1 SCFRC2 SCFRC3
Mix Identification
V-F
unne
l Tim
e (s
ec.)
V-funnel Time (s)
V-funnel T-5min Time (s)
Target Value 7 to 10 sec.
93
107
29
89.5
243
Fig. 2.7.3 V-funnel Time for Different Mixes
The passing ability of various SCC/SCFRC mixes was evaluated using the J-ring
apparatus with a clear bar spacing of 1.75 inches, to simulate actual congestion of reinforcement
in beams. The desired J-ring value was the vertical offset of 0.4 to 0.6 inch. Slump flow and T-
20in time was also measured during the J-ring test, which indicated the restricted slump flow and
restricted T-20in time which were already discussed. SCC2-3 mix was the only mix that
measured a J-ring value within the targeted range of 0.4 to 0.6 in. as seen in Fig. 2.7.4. Thus,
large amounts of aggregates or fibers were found to be detrimental to the passing ability of
SCC/SCFRC. Long fibers drastically reduced the passing ability of SCFRC due to the blocking
effect.

35
J-Ring Values for Various SCC & SCFRC Mixes
2.57
3.22
1
0.6
1
0
0.5
1
1.5
2
2.5
3
3.5
SCC2-3 SCC4 SCFRC1 SCFRC2 SCFRC3
Mix Identification
J-ri
ng V
alue
(in.
)
J-ring Value (in.)
Target Value 0.4 to 0.6 in.
Fig. 2.7.4 J-ring Values for Different Mixes
2.8 SCC-Texas Workshop Demonstration
The SCC-Texas Workshop took place at University of Houston on March 11, 2004. A
total of 175 participants attended the workshop. In addition to the eight presentations and two
panel discussions, the casting of the end region of a Type-A beam using a plexiglass mold (Fig.
2.8.1) and SCFRC2 mix was demonstrated to the participants. It is also to be noted that vibration
was not used in this demonstration. The demonstration revealed that the SCFRC mix flowed and
filled the mould quite efficiently without any signs of instability or fiber blocking. The passing
ability of SCFRC2 mix measured by the J-ring was much lower than the actual passing ability of
the mix observed in the demonstration. Hence, it was decided to disregard the passing ability
values measured by the J-ring dur ing the preliminary workability tests of SCFRC1 and SCFRC3
mixes, as being too conservative, and select these SCFRC mixes to cast the I-beams. It can be

36
seen from Fig. 2.8.1 that the application of SCFRC to the end region with dense reinforcements
is promising due to the enhanced workability.
Fig. 2.8.1 SCC-Texas Workshop Demonstration at University of Houston
2.9 Results of Hardened Properties of Concrete Mixes
Hardened properties of the mixes were tested at 1, 3, 7 and 28 days after casting. The
specimens were air cured and tested at the University of Houston testing laboratory. Cylinder
compressive strength, split tensile strength, beam flexure-Modulus Of Rapture (MOR) strength
and Average Residual Strength (ARS) tests were conducted to determine the hardened properties
of the mixes. The density of the concrete was also measured during these tests. Along with the
compressive strength tests, the stress-strain curve, modulus of elasticity and Poisson’s ratio were
also experimentally determined.

37
(a) (b)
Fig. 2.9.1 (a) & (b) Cylinder Compression Test: (a) Failed Cylinders (b) Measurement of
Elastic Modulus and Poisson’s Ratio
Fig. 2.9.2 Split Cylinder Test Specimens

38
Fig. 2.9.3 Beam Flexure Test (Modulus of Rapture) Specimens
Fig. 2.9.4 Average Residual Stress Test (ASTM C1399-1999)
As shown in Fig. 2.9.1 (a), 6 x 12 in. cylinder specimens were tested for compressive
strengths as per ASTM C39/39M-2003 procedure. Cylinder specimens of 4 x 8 in. size were also
tested for compressive and split tensile strengths. The modulus of elasticity and Poisson’s ratio
were determined in accordance with the ASTM C469-2002 guidelines. Split cylinder tests were
(1 in. = 25.4 mm)
Bridging of Fibers
Beam-Bottom
Beam-Side
Beam-Bottom
Beam-Side

39
carried out as per ASTM C496-1996. Fig. 2.9.2 shows the failed split cylinder specimens. ASTM
C78-2002 procedures were followed to conduct the MOR test, and the failed specimens are
shown in Fig. 2.9.3. ARS (Fig.2.9.4) tests were carried out in accordance with ASTM C1399-
1999. Table 2.9.1 presents the hardened properties of the mixes in detail.
Table 2.9.1 Hardened Properties of Various Mixes Hardened Properties of Various Concrete Mixes
Properties Days TTC1 TTFRC1 TTFRC2 TTFRC3 SCC2-3 SCC4 SCFRC1 SCFRC2 SCFRC31 6405 6601 4383 5562 4916 6162 6950 6691 7500
Compresive 3 7648 8608 7002 7747 5771 8154 8884 8553 9056Strength (psi) 7 9321 9703 8420 9109 6525 10298 9455 9724 10223
28 11550 11883 10294 11337 8367 12346 12021 12271 130701 446 668 727 497 383 377 733 711 878
Split Tensile 3 561 787 900 629 479 436 898 866 977Strength (psi) 7 695 878 1015 680 566 529 935 1100 1139
28 918 1050 1120 748 667 631 1082 1154 12261 845 976 1492 1175 580 754 1250 1190 1588
Modulus of 3 933 1278 2338 1500 769 840 1558 1412 1867Rupture (psi) 7 1009 1424 2742 1640 911 967 1649 1547 1944
28 1181 1563 3294 1814 1146 1069 1801 1664 22251 0 959 1417 864 0 0 1055 756 1368
Avg. Residual 3 0 1092 1660 920 0 0 1330 1110 1713Strength (psi) 7 0 1171 1918 1002 0 0 1621 1339 2061
28 0 1286 2265 1150 0 0 1809 1490 22401 5693 4967 4381 5801 3105 3576 5650 5453 5731
Elastic 3 6050 5752 5236 5933 3700 4300 5995 5810 6100Modulus (ksi) 7 6488 6090 5681 6074 4730 5448 6225 6030 6377
28 6909 6641 6086 6598 5800 6600 6550 6317 67501 0.170 0.166 0.180 0.180 0.175 0.180 0.170 0.186 0.173
Poisson's 3 0.168 0.182 0.190 0.190 0.180 0.130 0.176 0.182 0.179Ratio 7 0.190 0.174 0.195 0.195 0.182 0.140 0.190 0.175 0.206
28 0.188 0.205 0.200 0.200 0.200 0.230 0.196 0.173 0.191Release fc (psi) 0.75 6790 6860 5000 5800 6175 6900 7020 6950 7850
Density (pcf) 1 154 156 156 156 149 155 154 152 154 Note: Release fc was the compressive strength of cylinders at release of prestress, about 18-hours after casting.
The cylinders under compression failed mostly in the “shear-type” failure mode for all
mixes. As depicted in Fig.2.9.5, there was a steady increase in the compressive strength for all
the mixes as each mix aged. SCC4, which had a higher CA/FA ratio, was much stronger than
the SCC2-3 mix. In general, the compressive strength at various ages for SCC2-3 was about 43
% less than SCC4, but the 18-hour compressive strength of steam cured cylinders for SCC4 was
only about 12 % more than SCC2-3. The steel fibers seem to have improved the compressive
strength of TTFRC and SCFRC, in comparison with SCC2-3. Release strengths tested about18
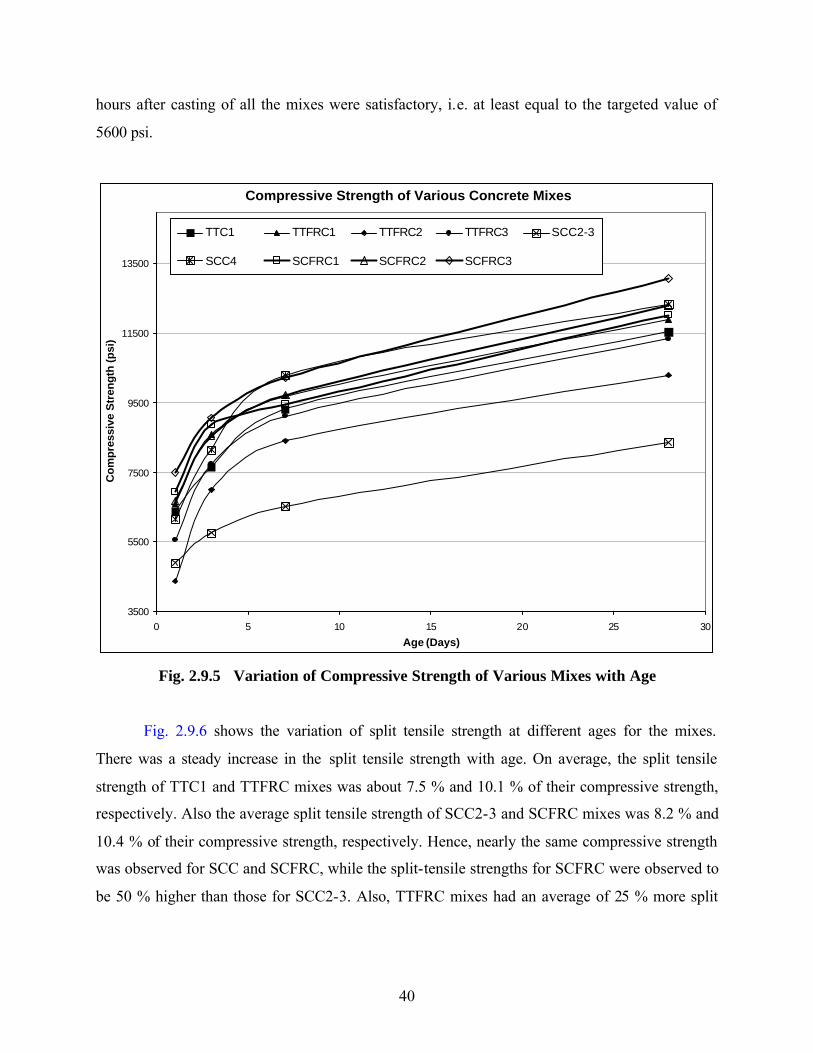
40
hours after casting of all the mixes were satisfactory, i.e. at least equal to the targeted value of
5600 psi.
Compressive Strength of Various Concrete Mixes
3500
5500
7500
9500
11500
13500
0 5 10 15 20 25 30
Age (Days)
Co
mp
ress
ive
Str
eng
th (p
si)
TTC1 TTFRC1 TTFRC2 TTFRC3 SCC2-3
SCC4 SCFRC1 SCFRC2 SCFRC3
Fig. 2.9.5 Variation of Compressive Strength of Various Mixes with Age
Fig. 2.9.6 shows the variation of split tensile strength at different ages for the mixes.
There was a steady increase in the split tensile strength with age. On average, the split tensile
strength of TTC1 and TTFRC mixes was about 7.5 % and 10.1 % of their compressive strength,
respectively. Also the average split tensile strength of SCC2-3 and SCFRC mixes was 8.2 % and
10.4 % of their compressive strength, respectively. Hence, nearly the same compressive strength
was observed for SCC and SCFRC, while the split-tensile strengths for SCFRC were observed to
be 50 % higher than those for SCC2-3. Also, TTFRC mixes had an average of 25 % more split

41
tensile strength than the control TTC1 mix. Thus, clearly fibers substantially increased the tensile
strength of concrete.
Split Tensile Strength of Various Concrete Mixes
0
200
400
600
800
1000
1200
1400
1600
0 5 10 15 20 25 30
Age (Days)
Sp
lit C
ylin
der
Ten
sile
Str
eng
th (p
si)
TTC1 TTFRC1 TTFRC2 TTFRC3 SCC2-3
SCC4 SCFRC1 SCFRC2 SCFRC3
Fig. 2.9.6 Variation of Split Tensile Strength of Various Mixes with Age
Fig. 2.9.7 shows the variation of MOR values for various concrete mixes with age. The
TTFRC and SCFRC beams demonstrated more ductility with fibers that bridged the cracks (Fig.
2.9.3) and failed in bond. The fibers were rarely broken. The TTFRC2 mix had the greatest MOR
value. This was due to the use of 1 % long fibers having a maximum fiber factor of 80.
Equivalent TTFRC and SCFRC mixes had almost the same MOR value. For SCFRC the MOR
value was about 18 % of its compressive strength. MOR values for SCFRC were almost twice as
large as those for SCC2-3. This proves that the fibers do increase the tensile strength of

42
concrete. MOR values for SCFRC2 were slightly less than that of SCFRC1, as the fiber factor of
the former was comparatively less.
Modulus of Rapture Strength of Various Concrete Mixes
0
400
800
1200
1600
2000
2400
2800
3200
3600
4000
0 5 10 15 20 25 30
Age (Days)
Mo
du
lus
of R
aptu
re S
tren
gth
(psi
)
TTC1 TTFRC1 TTFRC2 TTFRC3 SCC2-3
SCC4 SCFRC1 SCFRC2 SCFRC3
Fig. 2.9.7 Variation of Modulus of Rapture Strength of Various Mixes with Age
ARS test results (Fig. 2.9.8) show the residual strength in the fiber reinforced beams after
the first crack. ARS values for all the fiber mixes continued to increase steadily with age.
SCFRC3 and TTFRC2 mixes had the maximum and almost the same residual strength. The least
ARS strength was for TTFRC3 and TTFRC1 mixes as they had comparatively smaller fiber
factors.

43
Average Residual Strength of Various Concrete Mixes
0
200
400
600
800
1000
1200
1400
1600
1800
2000
2200
2400
2600
2800
3000
0 5 10 15 20 25 30
Age (Days)
Ave
rag
e R
esid
ual
Str
eng
th (p
si)
TTFRC1 TTFRC2 TTFRC3
SCFRC1 SCFRC2 SCFRC3
Fig. 2.9.8 Variation of Average Residual Strength of Various Mixes with Age
The modulus of elasticity gradually increased for the concrete mixes as shown in Fig.
2.9.9. Fibers considerably enhanced the modulus of elasticity in the case of the SCFRC mixes.
The TTFRC mixes had slightly smaller values for the modulus of elasticity than the non-fiber
TTC1 mix. This may be due to the decreased workability and stability of the TTFRC mixes. SCC
mixes had the smallest modulus of elasticity of all the mixes.

44
Modulus of Elasticity of Various Concrete Mixes
2800
3200
3600
4000
4400
4800
5200
5600
6000
6400
6800
7200
7600
8000
0 5 10 15 20 25 30
Age (Days)
Mod
ulus
of E
last
icit
y (k
si)
TTC1 TTFRC1 TTFRC2 TTFRC3 SCC2-3
SCC4 SCFRC1 SCFRC2 SCFRC3
Fig. 2.9.9 Variation of Modulus of Elasticity of Various Mixes with Age
To get a better idea and to compare the mixes for their mechanical strengths, normalized
hardened property values were calculated. The normalized value of a mix at a particular age is
the ratio of its individual hardened property value and its respective compressive strength. Table
2.9.2 presents the normalized strength values for various mixes at different ages.

45
Table 2.9.2: Normalized Hardened Properties of Various Mixes
Properties Days TTC1 TTFRC1 TTFRC2 TTFRC3 SCC2-3 SCC4 SCFRC1 SCFRC2 SCFRC3
1 7.0 10.1 16.6 8.9 7.8 6.1 10.6 10.6 11.7
Split
Tensile 3 7.3 9.1 12.9 8.1 8.3 5.4 10.1 10.1 10.8
Strength
(%) 7 7.5 9.0 12.0 7.5 8.7 5.1 9.9 11.3 11.1
28 8.0 8.8 10.9 6.6 8.0 5.1 9.0 9.4 9.4
Average 7.5 9.3 13.1 7.8 8.2 5.4 10.0 10.4 10.8
1 13.2 14.8 34.0 21.1 11.8 12.2 18.0 17.8 21.2
Modulus
of 3 12.2 14.9 33.4 19.4 13.3 10.3 17.5 16.5 20.6
Rupture
(%) 7 10.8 14.7 32.6 18.0 14.0 9.4 17.4 16.0 19.0
28 10.2 13.2 32.0 16.0 13.7 8.7 15.0 13.6 17.0
Average 11.6 14.4 33.0 18.6 13.2 10.2 17.0 16.0 19.5
1 0.0 14.5 32.3 15.5 0.0 0.0 15.2 11.3 18.2
Avg.
Residual 3 0.0 12.7 23.7 11.9 0.0 0.0 15.0 13.0 19.0
Strength
(%) 7 0.0 12.1 22.8 11.0 0.0 0.0 17.1 13.8 20.2
28 0.0 10.8 22.0 10.1 0.0 0.0 15.0 12.1 17.1
Average 0.0 12.5 25.2 12.1 0.0 0.0 15.6 12.6 18.6
TTFRC2 mix had exceptional tensile strength, but the mix had poor workability and
caused problems in mixing due to a high fiber content. Hence, the mix was discarded and was
not to be used in casting of the beams. The normalized hardened property values suggest that the
tensile strength of TTFRC (excluding TTFRC2) was increased by about 31 % with the use of
fibers, if compared to the control non-fibrous TTC1 mix. Similarly, on average the tensile
strength of SCFRC was increased by about 30 % with the use of fibers, in comparison to the

46
control SCC2-3 mix. Fig. 2.9.10 presents the variation of average normalized tensile strength
with fiber factor for the fiber reinforced mixes. The average normalized tensile strength for fiber
mixes with fiber factors of 40 (0.5 % by volume long fibers) and 55 (1 % by volume short fibers)
were almost the same. As the fiber factor increases from 30 to 55, the average normalized tensile
strength increased slightly; but significant increase in the average normalized tensile strength
was observed when the fiber factor reached 80. Nevertheless, the workability of the mix with
such a high fiber content was unsatisfactory. Hence, the optimum fiber contents selected to be
used to cast the beams in the later part of this research project were:
(1) Short Fibers – 1 % by volume (Fiber Factor = 55)
and (2) Long Fibers – 0.5 % by volume (Fiber Factor = 40)
Avg. Normalized Tensile Strength Vs. Fiber Factor
0
5
10
15
20
25
20 25 30 35 40 45 50 55 60 65 70 75 80 85
Fiber Factor
Avg
. No
rmal
ized
Ten
sile
Str
eng
th
0.5 % Short Fibers
1 % Long
Fibers1 % Short
Fibers
0.5 % Long
Fibers
Optimum Fiber Contentconsidering Workability andMechanical Performance
Fig. 2.9.10 Variation of Average Normalized Tensile Strength with Fiber Factor

47
CHAPTER 3
EARLY-AGE CRACKING IN PRESTRESSED CONCRETE I-BEAMS
In this chapter, an analysis was performed to study the cracking of the end zone in the I-
beams caused by the prestress and the thermal loadings. First, the stresses developed under
prestress were analyzed in Section 3.1 by a nonlinear finite element program SRCS based on the
OpenSees framework (Fenves 2001). Second, the stresses developed under thermal loading were
analyzed in Section 3.2 by performing a finite element analysis using SAP 2000. Finally, the
total stresses due to prestress and thermal loading were added together in Section 3.3.
3.1 Analysis of End Zone Stresses Due to Prestress Forces
3.1.1 OpenSees Analytical Model
OpenSees stands for Open System for Earthquake Engineering Simulation (Fenves
2001). OpenSees has been developed in the Pacific Earthquake Engineering Center at UC
Berkeley (PEER) and is an object-oriented framework for simulation applications in earthquake
engineering using finite element methods. An object-oriented framework is a set of cooperating
classes that can be used to generate software for a specific class of problem, such as finite
element analysis. The framework dictates the overall program structure by defining the abstract
classes, their responsibilities, and how these classes interact. OpenSees is a communication
mechanism for exchanging and building upon research accomplishments, and has the potential
for a community code for earthquake engineering because it is open source.
Using OpenSees as the finite element framework, a nonlinear finite element program
titled Simulation of Reinforced Concrete Structures (SRCS) was developed at the University of
Houston for the simulation of reinforced concrete structures subjected to monotonic and reversed
cyclic loading. Two material modules, SteelZ01 and ConcreteZ01, have been developed and
incorporated into OpenSees to model the materials required for the analysis of the reinforced
concrete plane stress elements. The program SRCS has been validated by Zhong (2005) with
full-scale structural tests.

48
Each end zone of a test beam was modeled by two-dimensional reinforced concrete plane
stress elements. The end zone lengths of 36 inches from the ends of the beams were modeled by
9 columns and 7 rows of plane stress elements as shown in Fig. 3.1.2. The idealized schematic
cross-section of the beam is shown in Fig 3.1.1. The longitudinal and transverse reinforcements
of the beam at the location of the elements were smeared over the area of the elements. The
nodes at the bottom and the inner edges of the beam were restrained against movement in both
the vertical as well as horizontal directions. The prestress loads have been applied at the nodes
corresponding to the level of application of the prestress. The loads have been distributed among
the nodes over the transfer length of the beam as shown in Fig 3.1.3.
Fig 3.1.1 Schematic Modified Cross-Section of Beam for SRCS Analysis
12 ”
24 ”
7 ”
7 ”
6 ”
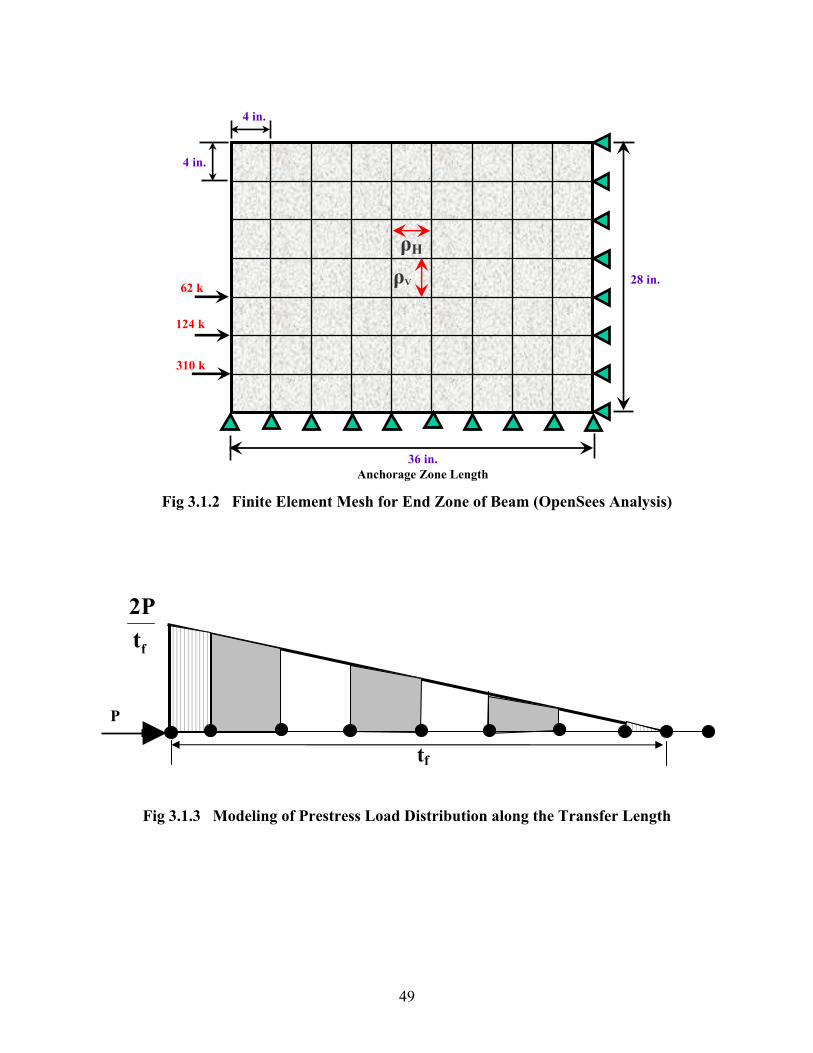
49
Fig 3.1.2 Finite Element Mesh for End Zone of Beam (OpenSees Analysis)
Fig 3.1.3 Modeling of Prestress Load Distribution along the Transfer Length
tf
62 k
124 k
310 k
Anchorage Zone Length 36 in.
4 in.
4 in.
28 in.ρV
ρH
ftP2
P

50
3.1.2 Results of End Zone Analysis under Prestress Forces
The stress distribution under prestress loads for beams with TxDOT Traditional Concrete
(TTC1) and Self Consolidating Fiber Reinforced Concrete (SCFRC3) is shown in Figures 3.1.4
and 3.1.5, respectively. Different colors have been used to shade the different regions having
stresses with certain ranges. It was observed that the maximum stresses occur at regions
immediately surrounding the location of the prestressing strands at the end of the beams. The
stresses at distances greater than 20 inches from the end of the beams were found to be within
safe limits.
Fig. 3.1.4 shows that an end zone with TTC1 mix is subjected to a maximum tensile
stress of about 800 psi. This tensile stress is very close to the tensile strength of 895 psi for TTC1
mix. That means that the possibility of cracking is quite large in this case. In contrast, Fig. 3.1.5
shows that an end zone with SCFRC3 mix is subjected to a maximum tensile stress of about 700
psi. This tensile stress is much smaller than the tensile strength of 1662 psi for SCFRC3 mix. In
other words, the possibility of cracking is very small.

51
Fig 3.1.4 End-Zone Stress Distribution for TTC1 mix
Case (I): TTC1
f t = 800 psi f t = 500 psi f t = 300psi f c = 1296psi fcr = 895 psi fc
18 hrs= 6790 psi εcr = 8 x 10⁻⁵
Safe Zone
62 k
124 k
310 k

52
Case (II): SCFRC3
εt= 0.5εcr εt = 0.25 εcr εc = 0.00023 f t= 795 psi f t = 400 psi f c = 865 psi fcr = 1588 psi f ’c = 7500 psi εcr = 8 x 10⁻⁵
Case (II): SCFRC3
f t = 700 psi f t = 400 psi f c = 905 psi fcr = 1100 psi fc
18 hrs= 6790 psi εcr = 8 x 10⁻⁵
Fig 3.1.5 End-Zone Stress Distribution for SCFRC3 Mix
1662 psi 7850 psi
62 k
124 k
310 k
Safe Zone
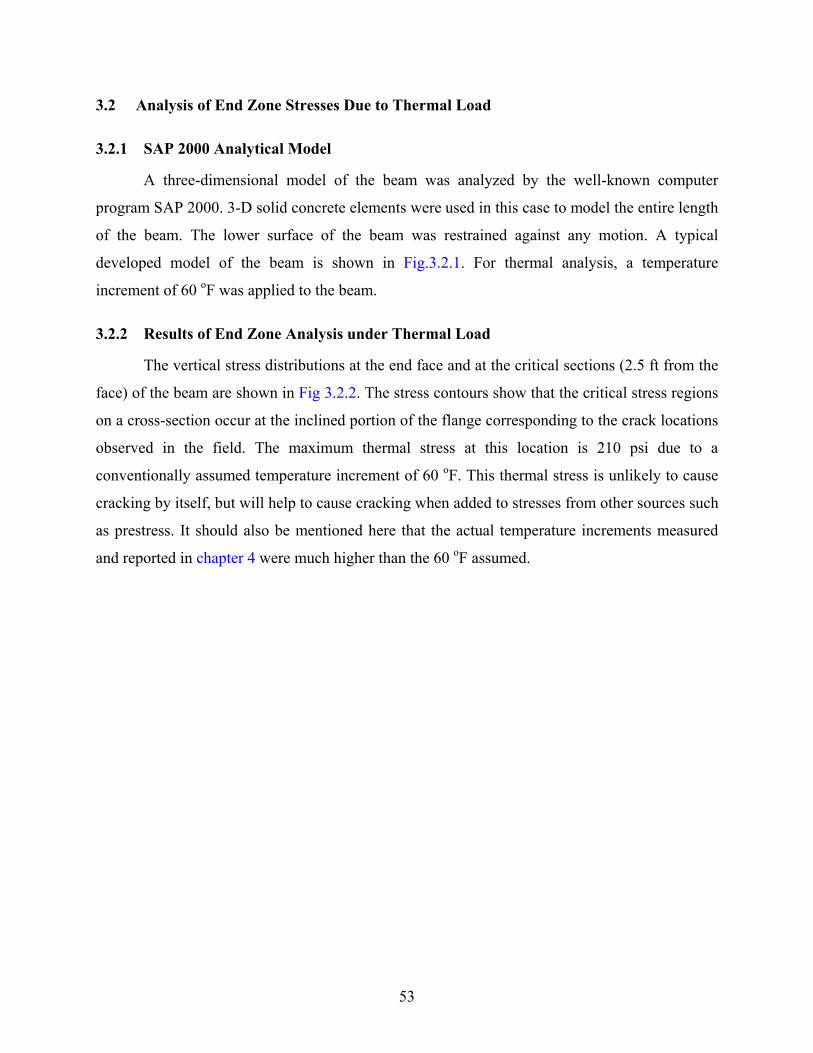
53
3.2 Analysis of End Zone Stresses Due to Thermal Load
3.2.1 SAP 2000 Analytical Model
A three-dimensional model of the beam was analyzed by the well-known computer
program SAP 2000. 3-D solid concrete elements were used in this case to model the entire length
of the beam. The lower surface of the beam was restrained against any motion. A typical
developed model of the beam is shown in Fig.3.2.1. For thermal analysis, a temperature
increment of 60 oF was applied to the beam.
3.2.2 Results of End Zone Analysis under Thermal Load
The vertical stress distributions at the end face and at the critical sections (2.5 ft from the
face) of the beam are shown in Fig 3.2.2. The stress contours show that the critical stress regions
on a cross-section occur at the inclined portion of the flange corresponding to the crack locations
observed in the field. The maximum thermal stress at this location is 210 psi due to a
conventionally assumed temperature increment of 60 oF. This thermal stress is unlikely to cause
cracking by itself, but will help to cause cracking when added to stresses from other sources such
as prestress. It should also be mentioned here that the actual temperature increments measured
and reported in chapter 4 were much higher than the 60 oF assumed.

54
Fig. 3.2.1 Finite Element Model for Thermal Analysis of Beam Using SAP 2000
25 ft.

55
Fig. 3.2.2 Stresses Due to Thermal Loads in Type-A Beam Cross-Section
Max. Tensile Stress = 210 psi
End Face @ x=0 ft.
Section @ 2.5 ft. from End Face

56
3.3 Summary of Stresses Due to Prestress and Thermal Loading
From the above two analyses of stresses caused by prestress and thermal loading, the
total tensile stress due to prestress force and thermal loading can be calculated. In the case of
TTC1 beams, the total maximum tensile stress in the end region was 800 psi (prestress) + 210 psi
(thermal) = 1010 psi. This total stress was greater than the cracking strength of 895 psi for TTC1
mix. This means that the end zone was very likely to crack. The locations with the greatest total
stresses were also found to match the crack locations observed in the beams on-site.
In the case of SCFRC3 mix, the total maximum tensile stress in the end region was 700
psi (prestress) + 210 psi (thermal) = 910 psi. This total stress was much less than the cracking
strength of 1662 psi for SCFRC3 mix. This means that the end zone was unlikely to crack.

57
CHAPTER 4
PRESTRESSED CONCRETE BEAMS: TEST SPECIMENS
AND EARLY-AGE MEASUREMENTS
4.1 Test Specimens
TxDOT Type-A beams were selected, cast and tested to study the behavior of prestressed
concrete beams reinforced with steel fibers. The cross-section of the TxDOT Type-A beams used
in this research is shown in Fig. 4.1.1. The total height of the beam was 28 inches and the widths
of the top and bottom flange were 12 inches and 16 inches, respectively. The width of the web
was 6 inches. The position of the prestressing tendons and the type of the reinforcing bars are
also shown. # 3 rebars were used for X rebars, # 4 rebars were used for R and V rebars, # 5
rebars were used for U , W and S rebars, and # 6 rebars were used for Y rebars. X and V rebars
were designed to confine the concrete and act as secondary reinforcements in the top and bottom
flange, respectively. R and S rebars served as transverse reinforcement for shear strength. The W
and Y bars were installed to resist the end zone bearing, spalling and bursting stresses, whereas
the U rebars ran all along the beam to support the R, S, X, W and Y rebars. Sixteen 0.5 inch
diameter-7 wire low relaxation strands were used as the prestressing steel. The prestressing
strands had ultimate strength of 270 ksi.
The elevation of the TxDOT Type-A beams is shown in Fig. 4.1.2 and Fig. 4.1.3. The
total length of the beams tested was 25 feet. Fig. 4.1.4 and Fig. 4.1.5 show the reinforcement and
instrumentation details of Beam B1 and Beams B2, B3, B4 and B5, respectively. It should be
noted that two additional Type-A beams (Beams B0 and B6), sponsored by the Texas Concrete
Company, were also studied in this research project. In Beam B0, transverse reinforcement had
been completely replaced by 1.5 % by volume of short steel fibers and the concrete mix design
used was TTFRC4. The reinforcement of Beam B6 was the same as that of Beam B1, but the
mix design used was SCC2-3 instead of TxDOT traditional concrete.

58
R(#4)
S(#5)
Y(#6)
V(#4)
W(#5)
0.5"Ø LRS
C/S TYPE-A I-BEAM All Dim. In Inches
X(#3)
U(#5)
Fig. 4.1.1 Cross-section of Type-A Beam
R (# 4)
U (# 5)
X (# 3)
S (# 5)
Y (# 6)
16-1/2 in. dia. LRS
V (# 4)
(All dimensions are in inches)
W (# 5)

59
NORTH END SOUTH END9-R(#4)8sp.@4"
8-S(#5)7sp.@4"
15.R(#4)14sp.@8" 3.S(#5)2sp.@16"
BEAM-B1Instrumentation Details All Dim. In Inches
1" Strain Guage (33)
LVDT (10)
Temp.Logger
1" Strain Guage (24)
LVDT (7)
1" Strain Guage (9)
LVDT (3)
15-R(#4)14sp.@8"
Fig.4.1.2 Elevation and Reinforcement Details of Beams B1 and B6
NORTH END SOUTH END3-R(#4)2sp.@16"
3-S(#5)2sp.@16"
8-R(#4)7sp.@16" 10-R(#4)9sp.@16"
BEAM-B2,B3,B4 & B5Instrumentation Details All Dim. In Inches
1" Strain Guage (24)
LVDT (7)
Temp.Logger
1" Strain Guage (15)
LVDT (4)
1" Strain Guage (9)
LVDT (3)
3-R(#4)2sp.@16"
Fig. 4.1.3 Elevation and Reinforcement Details of Beams B2, B3, B4 and B5
1 % Transverse
Steel
0.42 % Transverse
Steel
(All dimensions are in inches)
4.2 % Transverse
Steel
1 % Transverse
Steel
(All dimensions are in inches)

60
(a) Beam B1-North (4.2 % steel)
(b) Beam B1-Center (0.82 % steel)
(c) Beam B1-South (1 % steel)
Fig. 4.1.4 Reinforcement and Instrumentation Details of Beam B1
Strain Gauges
Strain Gauges
Temperature Loggers
Strain Gauges
Temperature Loggers

61
(a) Beam-North (1 % steel)
(b) Beam-Center (0.42 % steel)
(c) Beam-South (0.42 % steel)
Fig. 4.1.5 Reinforcement and Instrumentation Details of Beams B2, B3, B4 and B5
Strain Gauges
Strain Gauges
Temperature Loggers
Strain Gauges
62
4.2 Test Program
As mentioned previously, seven TxDOT Type-A beams were designed to study the
following variables: the type of concrete mix, the type and volume of steel fibers and the amount
of transverse reinforcement. The aim was to evaluate the effects of steel fibers on the casting
procedure, the control of the end region cracking and the increase in shear strength and ductility
of the beams.
Table 4.2.1 shows the test program for all of the five beams. Beam B1 was designed as
the conventional TxDOT Type-A beam which served as a reference specimen. A TxDOT
traditional concrete mix (TTCI) was used in this beam. The reinforcement details of the beam
followed the standard design from TxDOT except at the south end where the reinforcement was
reduced to 1 % (about 25 % of the traditional value of 4.2 %). This reduction can be observed
from the spacing of R and S rebar, which was 4 inches at the north end and 16 inches at the south
end. The transverse steel at midspan was R rebars @ 8 in. spacing, the same as used in the
midspans of the conventional TxDOT beams.
Beams B2 and B3 were designed with the same concrete mix as beam B1 but with an
addition of 1 % of ZP305 short fibers for Beam B2 and 0.5 % of RC80/60BN long fibers for
Beam B3. Beams B4 and B5 were designed with a self-consolidating concrete (SCC2-3) mix
with an addition of 0.5 % of RC80/60BN long fibers for Beam B4 and 1 % of ZP305 short fibers
for Beam B5. Beam B0 was designed without any transverse reinforcement; instead, a 1.5 %
volume of ZP305 short steel fibers was used with TTFRC4 concrete mix. Beam B6 had the same
design as beam B1, but the mix used was self-consolidating concrete (SCC2-3) instead of
TxDOT traditional concrete (TTC1).

63
Table 4.2.1 Test Program for Beams
23th March 2005
10%R rebar @ 16 in. ρv = 0.42%
50%R rebar @ 16 in.
ρv = 0.42%
25%R & S rebar @ 16 in.
ρv = 1.0%
SCFRC31% ZP305 Fibers
B5
18th March 2005000TTFRC4
1.5% ZP305 FibersB0
South EndCenterNorth End
23th March 2005
25%R & S rebar @ 16 in.
ρv = 1.0%
100%R rebar @ 8 in. ρv = 0.84%
100%R & S rebar @ 4 in.
ρv = 4.2%
SCC2-3Control Mix: Self-
Consolidating ConcreteB6
23th March 2005
10%R rebar @ 16 in. ρv = 0.42%
50%R rebar @ 16 in.
ρv = 0.42%
25%R & S rebar @ 16 in.
ρv = 1.0%
SCFRC10.5% RC80/60BN Fibers
B4
18th March 2005
10%R rebar @ 16 in. ρv = 0.42%
50%R rebar @ 16 in.
ρv = 0.42%
25%R & S rebar @ 16 in.
ρv = 1.0%
TTFRC30.5% RC80/60BN Fibers
B3
18th March 2005
10%R rebar @ 16 in. ρv = 0.42%
50%R rebar @ 16 in.
ρv = 0.42%
25%R & S rebar @ 16 in.
ρv = 1.0%
TTFRC11% ZP305 Fibers
B2
18th March 2005
25%R & S rebar @ 16 in.
ρv = 1.0%
100%R rebar @ 8 in. ρv = 0.84%
100%R & S rebar @ 4 in.
ρv = 4.2%
TTC1Control Mix: TXDOT Traditional Concrete
B1
Casting Schedule
Transverse Steel*MixBeam
I.D.
23th March 2005
10%R rebar @ 16 in. ρv = 0.42%
50%R rebar @ 16 in.
ρv = 0.42%
25%R & S rebar @ 16 in.
ρv = 1.0%
SCFRC31% ZP305 Fibers
B5
18th March 2005000TTFRC4
1.5% ZP305 FibersB0
South EndCenterNorth End
23th March 2005
25%R & S rebar @ 16 in.
ρv = 1.0%
100%R rebar @ 8 in. ρv = 0.84%
100%R & S rebar @ 4 in.
ρv = 4.2%
SCC2-3Control Mix: Self-
Consolidating ConcreteB6
23th March 2005
10%R rebar @ 16 in. ρv = 0.42%
50%R rebar @ 16 in.
ρv = 0.42%
25%R & S rebar @ 16 in.
ρv = 1.0%
SCFRC10.5% RC80/60BN Fibers
B4
18th March 2005
10%R rebar @ 16 in. ρv = 0.42%
50%R rebar @ 16 in.
ρv = 0.42%
25%R & S rebar @ 16 in.
ρv = 1.0%
TTFRC30.5% RC80/60BN Fibers
B3
18th March 2005
10%R rebar @ 16 in. ρv = 0.42%
50%R rebar @ 16 in.
ρv = 0.42%
25%R & S rebar @ 16 in.
ρv = 1.0%
TTFRC11% ZP305 Fibers
B2
18th March 2005
25%R & S rebar @ 16 in.
ρv = 1.0%
100%R rebar @ 8 in. ρv = 0.84%
100%R & S rebar @ 4 in.
ρv = 4.2%
TTC1Control Mix: TXDOT Traditional Concrete
B1
Casting Schedule
Transverse Steel*MixBeam
I.D.
Notes: * - Represents percentage of the traditional reinforcement in Type-A beam at respective locations.
The transverse reinforcement of Beams B2, B3, B4 and B5 was reduced from the
standard design of the TxDOT Type-A beam. At the north end, the transverse reinforcement was
reduced to 25 %. As shown in Table 4.2.1, R & S rebar spacing was reduced from 4 inches to 16
inches. At the south end of the beam, the transverse reinforcement was reduced to 10 % (from R
& S rebar spacing of 4 inches to only R rebar with the spacing of 16 inches). Transverse steel at
midspan for these beams was reduced to 50 % of the conventional beam, i.e. R rebar @ 16 in.
spacing. The reductions in transverse reinforcement were done to determine the effect of adding
steel fibers on the properties of beams such as end zone cracking, shear and flexural strength,
ductility and workability of concrete mixes during casting. Beam B6 had similar reinforcement

64
details as beam B1. Beams B1 and B6 served as control beams for TTFRC and SCFRC beams,
respectively.
The beam design and test plan (Table 4.2.1) were made such that the test results of
Beams B0 and Beam B6 could be compared to the conventional TxDOT Beam B1, serving as a
reference beam.. The test results of Beam B0 can be compared to those of Beam B1 to study how
much transverse reinforcement can be replaced by the steel fibers. Also, the test results of Beam
B6 can be compared to those of Beam B1 to study the effects of using SCC2-3 as the
replacement to traditional concrete.
In order to study the effect of the different types of concrete mixes (traditional concrete
and self consolidating concrete), test results of Beam B2 can be compared to those of Beam B5,
and Beam B3 can be compared to Beam B4. In order to study the effect of the different types of
steel fibers (ZP305 and RC80/60BN steel fibers), the test results of Beam B2 can be compared
with those of Beams B3, B4 and B5.
4.3 Casting of Test Specimens
The general procedure for mixing the respective concrete mixes for all the beam
specimens was similar to the one discussed in Chapter 2 (Section 2.6) of this report. Two cubic
yards of concrete was mixed for each beam. Just after mixing, normal slump tests were carried
out for TTC1/TTFRC mixes and slump flow tests were done for SCC/SCFRC mixes. The
workability test results were similar to the results obtained in the material testing research phase
as shown in Fig. 2.7.1 and Fig. 2.7.2.
The seven beams were cast in two groups on two different days. The four beams, B0 to
B3 with TTC1/TTFRC mixes, were cast together, with beam B1-North end placed nearest to the
prestressing jack, followed by B2, B3 and B0. The second group of three beams, B4, B5 and B6
with SCC/SCFRC mixes, were cast after a few days with B4-North end placed closest to the
prestressing jack, followed by B5 and B6. Fig. 4.3.1 (a) shows the casting and compaction of
beams. Concrete was transported from the plant mixer and delivered into the beams using a
mobile hopper as shown in Fig. 4.3.1 (b). The rate of casting concrete was about 5 ft3 per min.
for both groups of beams.
Beams were cast from south end to north end. Three needle vibrators were used for TTC1
and TTFRC mixes, i.e. for beams B1, B2 and B3. The vibration energy required for beams B2

65
and B3 was slightly more than that for beam B1, because the presence of fibers along with the
beam transverse reinforcement made the concrete harsher and hard to work with.
Casting and compaction of beam B0 was relatively fast and easy even if the mix used the
largest amount (1.5 % by volume) of fibers. This was because transverse reinforcement in beam
B0 was totally absent, causing no hindrance to the compaction of the fiber reinforced mix. Thus,
fiber reinforced concretes would be relatively easy to compact in the absence of any
conventional reinforcement.
In the second group of SCC/SCFRC beams, B4 to B6, concrete mixes were deposited in
the beams and allowed to flow. To achieve a satisfactory workability of the SCC mix, beam B6
with SCC was cast first with the fastest time and least effort. SCC flowed from the south end to
the north end of beam B6, and filled the form without any vibration. With the successful SCC
mix as the base mix, SCFRC mixes were prepared for the casting of beams B4 and B5.
(a) (b)
Fig. 4.3.1 Casting of Beams: (a) Compaction Using Vibrators in Beam B1 (b) Concrete
Placed in Beam B2 by a Hopper
The SCFRC1 mix (0.5 % by volume of long fibers) in Beam B4 could not flow freely
without the use of partial vibration. One vibrator was used to dislodge bulks of fibers caught
around the top rebar (U-rebar). Casting rate of SCFRC1 mix was too fast, thus causing the

66
blocking of the mix at the top rebars and the air-pockets to form at the north ends and the center
span of beam B4. This restricted filling ability problem of SCFRC1 mix could be avoided if the
traditional transverse reinforcement was absent or the casting rate was reduced.
A similar problem was met with the flow of SCFRC3 mix (1 % by volume of short
fibers) in beam B5 without using vibrators. The accelerated casting rate for this beam was also
too high near the center span, which caused air-pocket formation in this portion of the beam. The
two ends of the beam B5 were solid without any air-pockets since SCFRC3 was cast at a slower
rate near the beam ends. No vibrator was used in casting beam B5.
The air pockets in beams B4 and B5 were repaired with a special high strength repair
grout-‘EMACO S88.’
4.4 Instrumentations for Early Age Measurements
The beam testing plan was divided into two stages based on the objectives sought from
the testing. The first stage is reported in this chapter, consisting of monitoring the beams
continuously during casting, curing and release of prestress. The second stage of the research,
dealing with the load testing of the beams untill failure, will be reported in Chapter 5.
Beams were cast in two groups at the precast plant of Texas Concrete Company in
Victoria, Texas, on two different days as recorded in Table 4.1.1. Beams B1, B2, B3 and B0 with
TTC1/TTFRC mixes were cast first on a single prestressing bed. A total of eighty strain gauges
were installed on the rebars in these beams. The strains were continuously monitored and
recorded using data acquisition system during the casting stage, the curing stage and the release
of prestress. Along with the strain measurements, the concrete temperatures were recorded
continuously. The temperature data not only provided an insight into the thermal loading of a
beam, but also tracked the variations in temperature of different types of concrete mixes.
The concrete temperatures were measured using IntelliRockTM temperature loggers
attached to the reinforcing bars inside the beam. The IntelliRockTM system consisted of three
major components: loggers, readers, and windows software. The loggers are a totally self-
contained measurement and computing system that had a precision temperature measurement
system, microprocessor, memory and a battery. The reader was used to communicate with the
logger (i.e. start loggers, download data, etc.) as well as “shuttle” data from the loggers in the
field to a PC. A software was used to download logger data from the hand-held reader to a PC.

67
There were two types of loggers, namely, TPL-02-5M7D Temperature Logger which logged data
every 5 minutes for 7 days, and MAT-02-1H28D Maturity Logger which logged data every 1
hour for 28 days.
The number and type of temperature loggers used in each beam are shown in Table
4.4.1. Fig. 4.4.1 shows the location of the temperature loggers inside the beam. Fig. 4.4.1 (a)
shows the locations of the temperature loggers at the south ends of beams B1, B2, B3 and B5,
and Fig. 4.4.1 (b) shows the locations of the temperature loggers at the center of beam B1 and
south end of beams B4 and B6 (except logger #11 was not installed for B6-South). Loggers were
placed at critical locations where maximum temperature would be expected and in the vicinity of
the probable locations of the end zone cracking.
Table 4.4.1 Temperature Loggers Installed in the Beams
Beam/Location Number of Loggers Type of Loggers
B1-South 10 TPL-02-5M7D
B1-Center 5 TPL-02-5M7D
B2-South 10 TPL-02-5M7D
B3-South 10 TPL-02-5M7D
B4-South 5 TPL-02-5M7D
B5-South 10 TPL-02-5M7D
B6-South 4 MAT-02-1H28D
External 1 MAT-02-1H28D
Total 55

68
LOGGER
#4 REBAR
Vibrato
r
Warning
CRACKS
CRACKS
1
2
3
4
5
LOGGER
#4 REBAR
Vibrato
r
Warning
CRACKS
CRACKS
11
12
13
14
15
6
7
8
9
10
Fig. 4.4.1 (a) & (b) Location of temperature loggers in the beam: (a) B1-South, B2-South,
B3-South and B5-South Ends; (b) B1-Center, B4-South and B6-South
Foil type strain gauges were used to measure the strain in the transverse rebars. The
length and width of strain gauges were 1.2 inches and ¼ inch, respectively. The strain gauges
had a maximum strain limit of 3 % (i.e. 3 x 10⁻² in/in). The positions of strain gauges on different
types of rebars placed inside the beam are shown in Fig. 4.4.2 and Fig. 4.4.3.
(* #11 not installed for beam B6)
*
(a) (b)
(All dimensions are in inches)

69
8.
7512.5
19.7
5
10.7
5 17.7
5LVDT
LVDT
SG
SG
SG
SG:Strain GaugeLVDT: Linear Voltage Displacement Transducer
7.00
8.7512
.5
19.7
5
10.7
5 17.7
5LVDT
LVDT
SG
SG
SG
7.00
R Bar (#4) S Bar (#5)
Fig. 4.4.2 Positions of Strain Gauges and LVDT Studs on R and S Rebars
(All dimensions are in inches)

70
3.38
3.38SG
SG:Strain Gauge
V Bar (#4)
SG:Strain GaugeLVDT: Linear Voltage Displacement Transducer
5.008.
75
16.0
0
7.00
14.0
0LVDT
LVDT
SG
SG
SG
Y Bar (#6)
Fig. 4.4.3 Positions of Strain Gauges and LVDT Studs on Y and V Rebar
The purpose of installing the strain gauges, as can be observed in Fig. 4.4.2 and Fig.
4.4.3, was:
(a) To measure the strains developed in the rebars during casting, curing and
release of the prestressing tendons.
(b) To track the strains in rebars at the expected initial crack locations at the end
zone of the beams.
(c) To measure rebar strains during the load tests (see Chapter 5, Sections 5.3.3
and 5.3.4).
The purpose of positioning the temperature loggers at specific locations was to determine the
correlation between the strains and the temperatures developed during various stages.
Fig. 4.4.2 and Fig.4.4.3 also show the positions of Linear Voltage Displacement
Transducer (LVDT) studs on the rebars. The studs were welded on the rebars at important
(All dimensions are in inches)

71
locations to mount the LVDTs on the beam web. LVDTs were used to record the displacements
(strains) of the rebars during the load testing as mentioned in Chapter 5. It is noteworthy to
observe that the strains recorded by the strain gauges were the local strains on the rebars,
whereas the strains recorded by the LVDTs were the average strains in the rebars within the web
of the beam. LVDT studs could not be installed in Beam B6, since it was decided to cast the
beam at the last moment.
The researchers had the opportunity to install LVDT studs, which ran the whole length of
the web inside Beam B0, at the same positions as the other beams. Since there were no rebars in
Beam B0, the LVDT studs were cast and embedded in concrete. Hence, unlike the LVDT studs
in other beams that measured the average strains in the rebars, the LVDT studs in Beam B0
measured the average strains in the concrete.
End zone cracks were observed continuously during the curing process of the beams.
Visible cracks were not developed during curing, during the demolding process, during the
release of the prestressing strands, and throughout the early age of the beams. Most of the end
zone cracks were found 90 days after the beams were cast.
4.5 Results of Early Age Measurements
The maximum and average strains measured by the strain gauges installed on rebars at
the end zone for all the beams are shown in Table 4.5.1. Typical plots of strain gauge readings
and corresponding time for beam B1-North (TTC1), B2-North (TTFRC1), B3-South (TTFRC3)
and B5-South (SCFRC3) are shown in Fig. 4.5.1 to 4.5.4, respectively.

72
Table 4.5.1 Tensile Strains Measured by Strain Gauges Installed on Rebars
for Various Beams in Phase Two
Note: # - In general all rebars recovered strains to the original level.
* - No data available due to instrumentation malfunction.
Beam-End
Tensile Strain
During Curing
Tensile Strain
At Prestress
Release
(x 10-2 in/in)
Residual Tensile
Strain 10-hrs after
Prestress Release #
(x 10-2 in/in) Max. 0.80 Max. 1.16
B1-North Avg. 0.08 Avg. 0.76
0.13
Max. 0.95 Max. 1.80 B1- South
Avg. 0.10 Avg. 0.14 0.90
Max. 0.70 Max. 1.28 B2- North
Avg. 0.10 Avg. 0.10 0.11
Max. 0.04 Max. 1.90 B2- South
Avg. 0.01 Avg. 0.15 0.10
Max. 0.06 Max. 1.15 B3- North
Avg. 0.01 Avg. 0.16 0.03
Max. 0.12 Max. 1.3 B3- South
Avg. 0.10 Avg. 0.35 0.06
Max. 0.25 Max. 0.40 B4- North
Avg. 0.05 Avg. 0.33 0.05
Max. - * Max. - * B4- South
Avg. - * Avg. - * 0.03
Max. 0.30 Max. 0.80 B5- North
Avg. 0.01 Avg. 0.10 0.50
Max. 0.10 Max. 0.55 B5- South
Avg. 0.015 Avg. 0.25 0.10
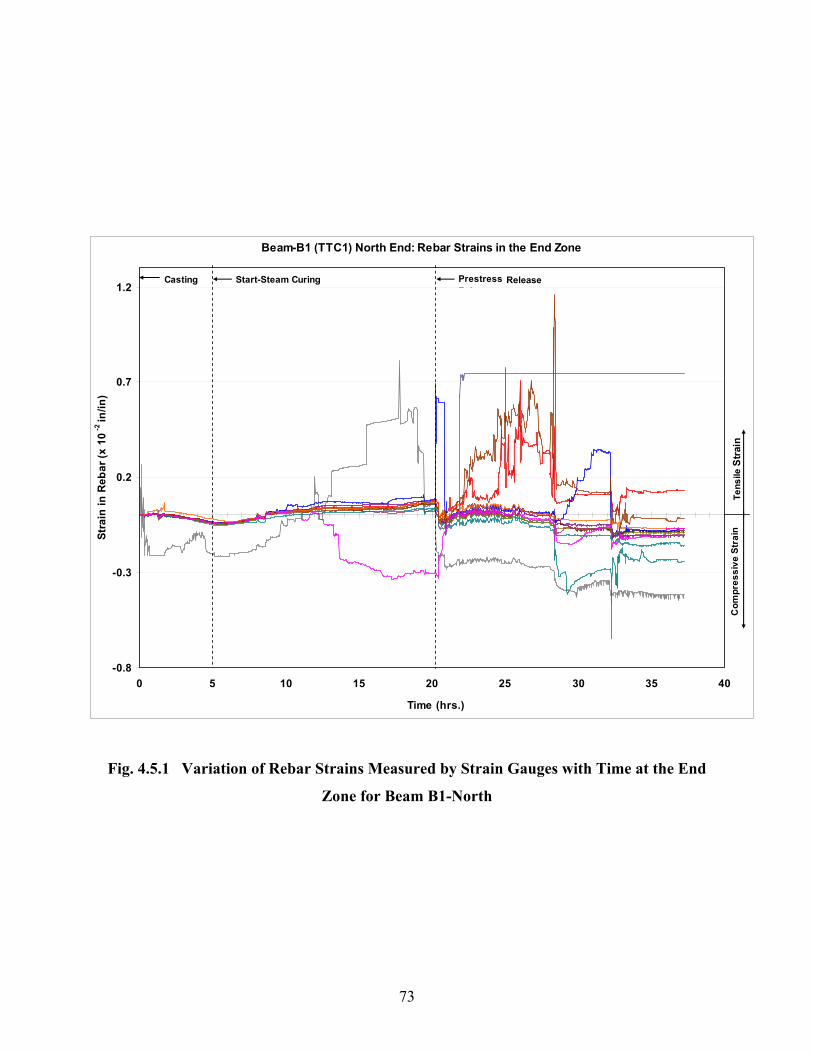
73
Beam-B1 (TTC1) North End: Rebar Strains in the End Zone
-0.8
-0.3
0.2
0.7
1.2
0 5 10 15 20 25 30 35 40
Time (hrs.)
Stra
in in
Reb
ar (x
10
-2 in
/in)
Prestress R l
Casting Start-Steam Curing
Tens
ile S
trai
nC
ompr
essi
ve S
trai
n
Fig. 4.5.1 Variation of Rebar Strains Measured by Strain Gauges with Time at the End
Zone for Beam B1-North
Release

74
Beam-B2 (TTFRC1) North End: Rebar Strains in the End Zone
-0.3
-0.1
0.1
0.3
0.5
0.7
0.9
1.1
1.3
1.5
0 5 10 15 20 25 30 35 40
Time (hrs.)
Str
ain
in R
ebar
(x 1
0-2 in
/in)
Prestress ReleaseCasting Start-Steam Curing
Tens
ile S
trai
nC
ompr
essi
ve S
trai
n
Fig. 4.5.2 Variation of Rebar Strains Measured by Strain Gauges with Time at the End
Zone for Beam B2-North

75
Beam-B3 (TTFRC3) South End: Rebar Strains in the End Zone
-0.4
-0.2
0
0.2
0.4
0.6
0.8
1
1.2
1.4
0 5 10 15 20 25 30 35 40
Time (hrs.)
Str
ain
in R
ebar
(x 1
0-2 in
/in)
Prestress ReleaseCasting Start-Steam Curing
Tens
ile S
train
Com
pres
sive
Str
ain
Fig. 4.5.3 Variation of Rebar Strains Measured by Strain Gauges with Time at the End
Zone for Beam B3-South

76
Beam-B5 (SCFRC3) South End: Rebar Strains in the End Zone
-0.20
-0.10
0.00
0.10
0.20
0.30
0.40
0.50
0.60
0.70
0 5 10 15 20 25 30 35 40 45
Time (hrs.)
Str
ain
in R
ebar
(x 1
0-2
in/in
)
Prestress ReleaseCasting Start-Steam Curing
Tens
ile S
train
Com
pres
sive
Stra
in
Fig. 4.5.4 Variation of Rebar Strains Measured by Strain Gauges with Time at the End
Zone for Beam B5-South
The maximum tensile strains during curing were much pronounced in beam B1, while the
average tensile strains developed in the rebars of fiber reinforced beams, B2 to B5, and were
considerably smaller than that in beam B1. Hence, fibers effectively reduced the tensile strains
due to thermal loading in the concrete matrix.
Similarly, the average tensile strains developed during the release of prestress in fiber
reinforced beams are considerably less than that in beam B1. In other words, fibers have
contributed substantially towards enhancing not only the tensile strength but also the end zone
stress redistribution. Long fibers (RC80/60BN) have structurally performed slightly better than
the short fibers (ZP305) in the end region of the beams. It can also be noted that fibers have

77
shown a little more effectiveness in beams with SCFRC than in TTFRC mixes with regard to its
performance in the end region.
As observed from Fig. 4.5.1 to 4.5.4, the strain gauge data also revealed a very interesting
finding. About 10-hours after release of prestress, when the rebar strains gradually recovered to
the original level, very few rebars showed residual tensile strains at this point. As shown in Table
4.5.1, the average residual strains of 0.90 x 10⁻² recorded in beam B1-South end were much
higher than the residual strains of (0.03 to 0.5) x 10-2 in the North ends of all the fiber reinforced
beams. Hence, fibers were very effective as end zone reinforcement - much better than the
traditional transverse reinforcement.
Figs. 4.5.5 through Fig. 4.5.8 show the typical graphs of the variation of concrete
temperature with concrete age for beams with different types of concrete mixes. Thermal loading
of concrete for the beams, i.e. the difference between maximum temperature and minimum
temperature in concrete, could be calculated from the above mentioned figures. The average
maximum temperature loading for TxDOT traditional concrete was 84.15 oF, while the average
maximum thermal loading for SCC was 102.6 oF. This result shows that SCC has higher thermal
loading than traditional concrete. This is due to the higher cement contents of SCC when
compared to the traditional concrete. The maximum thermal loading from all beams was 120.6 oF at the south end of beam B5.
The measured temperature data also revealed that the traditionally assumed thermal
loading for concrete, i.e. 60 oF, was much lower than the actually measured thermal loading of 84
oF in case of traditional concrete and 120 oF for SCC. This may be the reason for the discrepancy
between the analytical results and the actual observations in the beams. While no cracks may be
predicted in the beams from the analytical results in Chapter 3, cracks actually did occurr in the
beams at a later date, i.e. at the end of three months from casting. The regions of critical stresses
from the analysis always coincide with the regions of crack development in the actual beams.

78
B1 South
50
70
90
110
130
0 20 40 60 80 100 120 140 160 180
Time (hrs)
Tem
pera
ture
(deg
F)
#1
#2
#3
#4
#5
#6
#7
#8
#9
#10
Fig. 4.5.5 Variation of Concrete Temperature with Age at Beam B1-South (TTC1)
B2 SOUTH
50
60
70
80
90
100
110
120
130
140
150
0 20 40 60 80 100 120 140 160 180
Time (hrs)
Tem
pera
ture
(deg
F)
#1#2#3#4#5#6#7#8#9#10
Fig. 4.5.6 Variation of Concrete Temperature with Age at Beam B2-South (TTFRC1)
Casting
Steam Curing
Logger ID
Casting
Steam Curing Logger ID

79
B5 SOUTH
40
60
80
100
120
140
160
180
0 20 40 60 80 100 120 140 160 180Time (hrs)
Tem
pera
ture
(deg
F)
#1#2#3#4#5#6#7#8#9#10
Fig. 4.5.7 Variation of Concrete Temperature with Age at Beam B5-South (SCFRC3)
B6 SOUTH
40
60
80
100
120
140
0 100 200 300 400 500 600 700 800
Time (hrs)
Tem
pera
ture
(deg
F)
#2
#3
#4
#5
Fig. 4.5.8 Variation of Concrete Temperature with Age at Beam B6-South (SCC)
Casting
Steam Curing
Logger ID
Casting
Steam Curing Logger ID

80

81
CHAPTER 5
LOAD TESTS OF PRESTRESSED CONCRETE BEAMS
5.1 Load Test Set-Up
In the load tests, the beams were subjected to vertical loading up to their maximum shear
or moment capacity in a specially built steel loading frame as shown in Fig. 5.1.1. Four
actuators, attached to the steel frame, were used to provide vertical loads on the beams. Actuators
A, B, C and D each has a capacity of 220 kips, 320 kips, 320 kips and 146 kips, respectively.
Fig. 5.1.1 Load Test Setup

82
H SOUTH END
FRAME-AFRAME-B FRAME-CFRAME-D
PEDESTAL-1 PEDESTAL-2
W18X97
W18X97
W18
X97
FRAME SETUP LAYOUT
W18
X97
2MC18X51.9
W10X33
Fig. 5.1.2 Plan View of Loading Frame
ELEVATION OF I-BEAM
320 K 220 KD CB A
ity (kips) -
146 K 320 K
South SupportNorth Support
Moved South Support
3 ft. 2 ft. 2 ft. 3 ft.
(25 ft.)
(20 ft.)
Fig. 5.1.3 Load Points on Test Beam
The steel frame layout, showing the position of each actuator frame and the beam, is
shown in Fig. 5.1.2 and Fig. 5.1.3. Actuator frames A and B were installed side by side near the
north end of the beam while actuator frames C and D were installed side by side near the south
end of the beam. This configuration of frames would insure that the maximum shear load
capacity of the frame would be more than 450 kips. These actuator steel frames were sitting on
(All dimensions are in inches)
North End
South End
Capacity-
Actuators-
(All dimensions are in inches)

83
top of two WF18 X 97 beams with a length of 20 feet. The spacing between the two WF18 X 97
beams was 87 inches center to center. The beam specimen was positioned in the middle of this
spacing width on top of two load cells placed at each end. The load cells were sitting on top of
the steel pedestals fixed to the strong floor. Each load cell was of 500 kips capacity. On top of
the load cells, bearing plates to support the beams were placed with a roller on North end and
fixed roller on South end. Thus, a beam was simply supported on a roller at North end and a
hinge on the South end; allowing the beam to rotate freely and translate horizontally. Lateral
bracings were provided on the actuators for their lateral stability.
The position of vertical loadings on the beam together with the support positions is
shown in Fig. 5.1.3. The loads from actuators B and C were positioned at 3 feet from the north
support and south support, respectively. The loads from actuators A and D were positioned at 2
feet to the right of actuator B and to the left of actuator C, respectively. Actuator loads were
applied through two 6 in. x 12 in. x 2 in. bearing plates and a roller assembly, so as to ensure
uniform and frictionless load transfer from actuators on to the beam surface. Lead sheets were
also used between the load bearing plates and beam surface. All the bearing plates and rollers
were hardened to maximum possible hardness, in order to minimize local deformations.
Actuators were precisely controlled by the MTS ‘MultiFlex’ System. The first step of the
loading procedure was to load the beam at point B and C (3 feet from support) with the same
load at the same time. Actuators B and C were first programmed with a load control of 5
kips/min. This step was followed by changing the program to a displacement control of 0.2
inch/hour when the slope of the load-displacement curve approached to horizontal, i.e. the
yielding of the beam. This displacement control was applied to actuator C at south end while the
load from actuator B was kept constant under a very small displacement control rate. This step
continued until the shear failure at the south end of the beam occurred. Some of the beams which
had a higher capacity than the load capacity of actuator C had to be additionally loaded with
actuator D (2 feet apart from actuator C) with the same displacement-control as actuator C. The
displacement control allowed us to trace the post-peak load-deflection curve of the beams. This
feature was essential in grasping the ductility/brittleness behavior of the beam reinforced with
steel fibers.
After the south end failed, the south end support was moved 5 feet towards the north in
order to avoid the failure zone at the south end and to provide a fixed support for testing the

84
north end to failure. Fig. 5.1.3 shows the position of the moved south support by the dashed
arrow. The north end of the beam was then loaded by actuator B, programmed with a load
control of 5 kips/min. Then, when the slope of load deflection curve approached the horizontal,
the loading program was switched to a displacement control of 0.2 inches/hour. When the
capacity of the north end of the beam was higher than the load capacity of actuator B, actuator A
(2 feet from actuator B) was activated with the same displacement control procedure. The testing
was stopped when the north end failed.
During the load testing, Linear Voltage Displacement Transducers (LVDTs) were used to
measure displacements at several critical points on the web in the end zone of the beam, as
shown in Fig. 5.1.4. Several LVDTs were also placed under the beam at the point of loading to
measure the actual total and net displacements of the beam. Strain gauges installed on the rebars
inside the beams (used previously in the early-age measurements) were also used to monitor the
rebar strains during the load test. On an average, each beam was instrumented by about 30
LVDTs and 25 strain gauges to record the structural behavior of the beam. Data from these
sensors were continuously monitored and stored by the HBM ‘Spider-8’ Data Acquisition
System. Shear cracks formed on the beam web during the load test were regularly marked on the
grid as shown in Fig. 5.1.5. The crack widths were measured using a hand-held microscope
having a 0.001 in. measuring precision.
Fig. 5.1.4 Position of LVDTs on the Web of Test Beam
LVDT

85
Fig. 5.1.5 Tracking and Measuring Shear Cracks on the Web of Test Beam
5.2 Load Test Variables
The seven test specimens, B0 to B6, involve five variables: type of concrete mixes, type and
volume of steel fibers (short fiber or long fiber), and transverse steel (at north end and at south end).
These variables are listed in Table 5.2.1. The cylinder strengths of the concrete used in the test
beams are also recorded. It should be noted that the strengths indicated in this table are not
measured at 28 days but on the day of the beam test. It can be seen from the table that the
compressive strengths of the concrete varied between 9 ksi and 14.5 ksi. This variation in the
concrete strengths may be useful in explaining the variation of behavior of different beams to be
reported hereafter.

86
Table 5.2.1 Variables in Test Beams B0 to B6
Beams Concrete
Mixes
Steel
Fibers
Transverse
Steel
North End
Transverse
Steel
South End
Concrete
Cylinder Strength
(ksi)
B0 TTFRC4 1.5 % SF -0- -0- 14.5
B1 TTC1 -0- 4.2 % 1 % 12.2
B2 TTFRC1 1 % SF 1 % 0.42 % 10.3
B3 TTFRC3 0.5 % LF 1 % 0.42 % 11.2
B4 SCFRC1 0.5 % LF 1 % 0.42 % 10.9
B5 SCFRC3 1 % SF 1 % 0.42 % 8.9
B6 SCC2-3 -0- 4.2 % 1 % 10.6
NOTE:
TTC-TxDOT Traditional Concrete Mix TTFRC-TTC + Fibers Mix SCC -Self-Consolidating Concrete Mix
SCFRC- SCC + Fibers Mix SF-Short Fiber ZP305 LF-Long Fiber RC80/60BN TS - Transverse Steel
5.3 Load Test Results
Table 5.3.2 shows the ultimate strengths at failure for each of the two ends of the beam
specimens. It can be seen that only the north ends of Beams B1 and B6 failed in flexure. This is
due to the fact that the beam ends had a high percentage of shear reinforcement (4.2 %)
contributing to the high shear capacities. Thus, these beams reached their flexure capacities
before reaching their shear capacities. For all other end regions, the ultimate shear capacity
governed the failure.
5.3.1 Ultimate Shear Strengths
The effect of steel fibers on the shear strength of test beams can be observed by
examining Table 5.3.1. First, the shear strength of the south ends of Beams B1 made of TTC was

87
294 kips, while that of B6, made of SCC was 290 kips. It can be seen that the concrete mixes
(TTC vs. SCC) has negligible effect on the shear capacity of the beams. Second, the comparison
of the south end shear strength of Beam B1 with those of Beams B2 and B3 shows that the shear
capacity of the beams can be significantly increased due to the addition of steel fibers in
concrete, even though the amount of shear steel in the south ends of beams B2 and B3 are lower
than that in Beam B1. Third, the south end shear capacities of beams B4 and B5 with steel fibers
(276 and 248 kips) were less than that of Beam B1 (294 kips). This may be due to the fact that
Beams B4 and B5 had much lower concrete strength (10.9 and 8.9 ksi) in comparison to the
concrete in Beam B1 (12.2 ksi). Also, the transverse steel was mush less (0.42 % vs. 1 %).
Finally, the south end of Beam B0 had a shear capacity of 375 kips, much higher than that of 294
kips for Beam B1, even though Beam B0 had no traditional shear reinforcement. In short, the
significance of steel fibers in contributing to the shear strengths is evident.

88
Table 5.3.1 Ultimate Strengths of Beams B0 to B6 at North and South Ends
NOTE: TTC-TxDOT Traditional Concrete Mix TTFRC-TTC + Fibers Mix SCC -Self-Consolidating Concrete Mix
SCFRC - SCC + Fibers Mix SF - Short Fiber ZP305 LF - Long Fiber RC80/60BN TS - Transverse Steel
Beam
(Mix)
Steel
Fibers
(% vol)
(Type)
Transverse
Steel
(%vol)
Concrete
Strength
(ksi)
Failure
Type
Ultimate
Shear
Capacity
at Failure
V (kips)
Ultimate
Moment
Capacity at
Failure
M (kips-ft.)
Max. Shear
at Ultimate
Moment
(kips)
Max.
Moment at
Ultimate
Shear
(kips-ft.)
B1-North
(TTC1) 0 4.2 12.2 Flexure - 1048 329 -
B1-South
(TTC1) 0 1.0 12.2 Shear 294 - - 882
B2-North
(TTFRC1)
1
(SF) 1.0 10.3 Shear 330 - - 1078
B2-South
(TTFRC1)
1
(SF) 0.42 10.3 Shear 349 - - 1151
B3-North
(TTFRC3)
0.5
(LF) 1.0 11.2 Shear 253 - - 759
B3-South
(TTFRC3)
0.5
(LF) 0.42 11.2 Shear 342 - - 1079
B4-North
(SCFRC1)
0.5
(LF) 1.0 10.9 Shear 265 - - 795
B4-South
(SCFRC1)
0.5
(LF) 0.42 10.9 Shear 276 - - 828
B5-North
(SCFRC3)
1
(SF) 1.0 8.9 Shear 257 - - 771
B5-South
(SCFRC3)
1
(SF) 0.42 8.9 Shear 248 - - 777
B6-North
(SCC2-3) 0 4.2 10.6 Flexure - 1077 325 -
B6-South
(SCC2-3) 0 1.0 10.6 Shear 290 - - 897
B0-North
(TTFRC4)
1.5
(SF) 0 14.5 Shear 301 - - 903
B0-South
(TTFRC4)
1.5
(SF) 0 14.5 Shear 375 - - 1243

89
5.3.2 Ductility Observed in Shear Forces vs. Deflection Curves
Fig. 5.3.1 shows the plot of shear force acting on the beams against the beam deflections.
The shear force plotted in this figure was obtained from the reading of the load cells placed
under the end supports of the beams. The deflection was obtained from the readings of the
LVDT placed under the individual beams at the location of the end actuator. From this figure, it
can be seen that the behavior of the two ends of the beams can be easily distinguished. Hence for
better comparison the plots for the south and north ends of the different beams have been shown
separately in Figures 5.3.2 and 5.3.3, respectively.
From Fig 5.3.2, it can be seen that Beam B0 carried higher shear loads than the other
beams, as stated before. The amount of inelastic deformation of this beam was also higher and
was only comparable with Beam B2. This shows that replacement of shear steel with steel fibers
increases the ductility of the structure. This can also be observed from the higher inelastic
deformation of the north end of Beam B0 in Fig 5.3.3.

90
0
25
50
75
100
125
150
175
200
225
250
275
300
325
350
375
400
0 0.1 0.2 0.3 0.4 0.5 0.6 0.7 0.8 0.9 1 1.1 1.2 1.3 1.4
Deflection of Beam Under Actuator-C/B (in.)
Shea
r For
ce a
t Sou
th/N
orth
End
(kip
s.)
B1-SOUTH
B1-NORTH
B2-SOUTH
B2-NORTH
B3-SOUTH
B3-NORTH
B4-SOUTH
B4-NORTH
B5-SOUTH
B5-NORTH
B0-SOUTH
B0-NORTH
B6-SOUTH
B6-NORTH
B1S
B1N
B2SB2N
B3S
B3N
B4S
B4N
B0S
B0N
B6N
B5S
B5N
B6S
Fig. 5.3.1 Shear Force - Deflection Curves for Beams B0 to B6

91
0
25
50
75
100
125
150
175
200
225
250
275
300
325
350
375
400
0 0.1 0.2 0.3 0.4 0.5 0.6 0.7 0.8 0.9 1 1.1 1.2 1.3 1.4
Deflection of Beam Under Actuator-C (in.)
Shea
r For
ce a
t Sou
th E
nd (k
ips.
)
B1-SOUTH
B2-SOUTH
B3-SOUTH
B4-SOUTH
B5-SOUTH
B0-SOUTH
B6-SOUTH
B1S
B2S
B3S
B4S
B0S
B5S
B6S
Fig. 5.3.2 Shear Force - Deflection Curves for South Ends of Beams B0 to B6
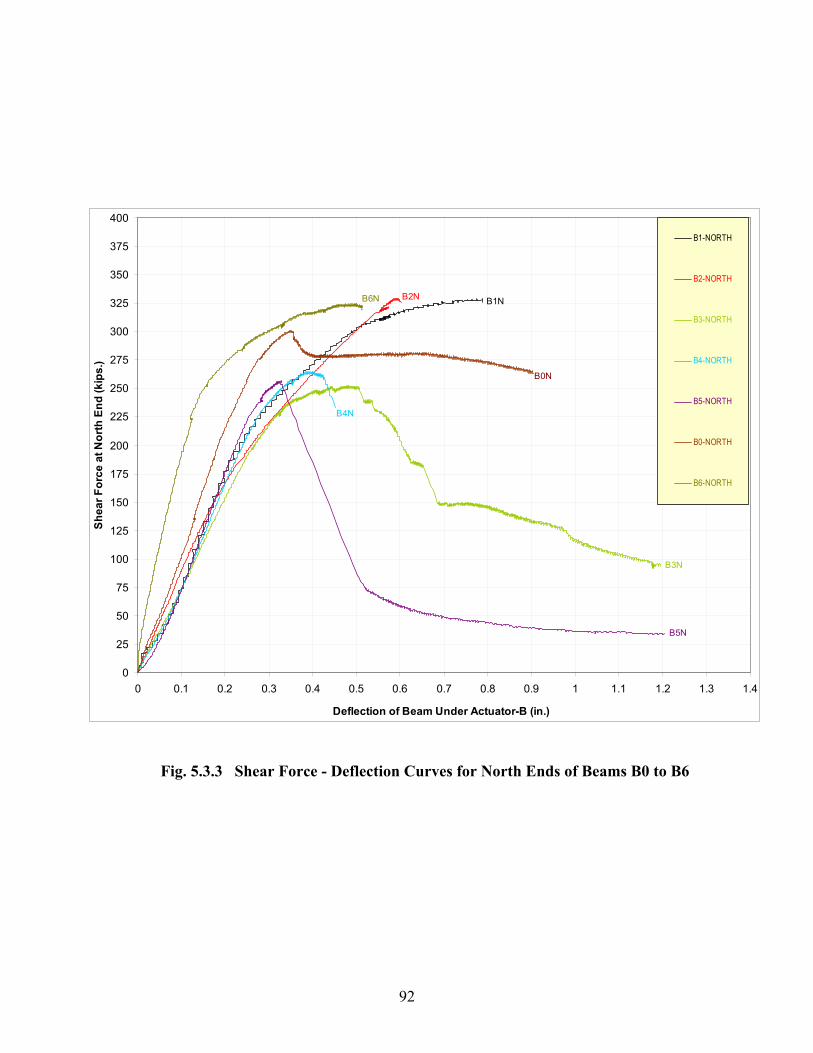
92
0
25
50
75
100
125
150
175
200
225
250
275
300
325
350
375
400
0 0.1 0.2 0.3 0.4 0.5 0.6 0.7 0.8 0.9 1 1.1 1.2 1.3 1.4
Deflection of Beam Under Actuator-B (in.)
Shea
r For
ce a
t Nor
th E
nd (k
ips.
)
B1-NORTH
B2-NORTH
B3-NORTH
B4-NORTH
B5-NORTH
B0-NORTH
B6-NORTH
B1NB2N
B3N
B4N
B0N
B6N
B5N
Fig. 5.3.3 Shear Force - Deflection Curves for North Ends of Beams B0 to B6

93
It could also be observed from Fig. 5.3.2 and Fig. 5.3.3 that the ductility of beams is
enhanced with the use of steel fibers. In general, SCFRC beams have demonstrated higher
ductility than the other beams with steel fibers. The failure of beams B1 and B6 were quite
sudden and brittle; without any warnings even in a very low displacement control rate. On the
other hands, almost all the fiber reinforced beams failed in a ductile fashion with prior warnings.
From the ultimate shear capacities of all the fiber reinforced beams, it could be noted that the
beams with short fibers performed better than the beams with long fibers. This was because the
fiber factors for beams with short fiber were 55 and 82.5 whereas the fiber factor for the beams
with long fiber was comparatively smaller, i.e. 40.
5.3.3 Ductility Observed in Shear Forces–Rebar Strains Curves (Strain Gauges)
Figure 5.3.4 shows the plots of shear force at the beam ends against the percentage tensile
strains. The tensile strains plotted in this figure have been obtained from strain gauges attached
to shear reinforcements at critical sections. Like the previous case, the plots for the south and
north ends of the different beams are shown separately in Figures 5.3.5 and 5.3.6, respectively, to
facilitate better comparison of the results. It should be noted that Beams B0 and B6 could not be
included in this comparative study. This was due to the fact that Beam B0 did not have any shear
reinforcement to which strain gauges could be instrumented and Beam B6 did not have any
strain gauges instrumented before hand on its reinforcement, as the decision to fabricate this
specimen was taken on-site.
From Figures 5.3.5 and 5.3.6 it can be seen that the amount of inelastic shear deformation
was higher for Beams B2 and B3 with steel fiber reinforced traditional concrete. The shear
strengths for Beams B2 and B3 were also comparatively higher than the other beams. It can be
seen from Fig. 5.3.6 that the strain developed in rebars of beam B1 at north end are the least.
This means that the steel has not yielded even when the shear load was over the service limit,
suggesting that the 4.2 % steel is quite excessive and hence uneconomical.

94
0
25
50
75
100
125
150
175
200
225
250
275
300
325
350
375
400
0 0.2 0.4 0.6 0.8 1 1.2 Tensile Strain in R-Rebar Located at 16 in. (@H/2) from Support Measured
by Strain-Gauge at Web Center (10-2 in./in.)
Shea
r For
ce a
t Sou
th/N
orth
End
(kip
s.)
B1-SOUTH
B1-NORTH
B2-SOUTH
B2-NORTH
B3-SOUTH
B3-NORTH
B4-SOUTH
B4-NORTH
B5-SOUTH
B5-NORTH
B1S
B1NB2S
B2N
B3S
B3N
B4S
B4N
B5SB5N
Fig. 5.3.4 Shear Force Vs. Rebar Tensile Strains Measured by Strain Gauge
for Beams B1 to B5 at a Distance of H/2 from Support

95
0
25
50
75
100
125
150
175
200
225
250
275
300
325
350
375
400
0 0.2 0.4 0.6 0.8 1 1.2 Tensile Strain in R-Rebar Located at 16 in. (@H/2) from Support Measured
by Strain-Gauge at Web Center of South End (10-2 in./in.)
She
ar F
orce
at S
outh
End
(kip
s.)
B1-SOUTH
B2-SOUTH
B3-SOUTH
B4-SOUTH
B5-SOUTH
B1S
B2S
B3S
B4S
B5S
Fig. 5.3.5 Shear Force Vs. Rebar Tensile Strains Measured by Strain Gauge
for South Ends of Beams B1 to B5 at a Distance of H/2 from Support

96
0
25
50
75
100
125
150
175
200
225
250
275
300
325
350
375
400
0 0.2 0.4 0.6 0.8 1 1.2 Tensile Strain in R-Rebar Located at 16 in. (@H/2) from Support Measured
by Strain-Gauge at Web Center of North End (10-2 in./in.)
She
ar F
orce
at N
orth
End
(kip
s.)
B1-NORTH
B2-NORTH
B3-NORTH
B4-NORTH
B5-NORTH
B1NB2N
B3N
B4N
B5N
Fig. 5.3.6 Shear Force Vs. Rebar Tensile Strains Measured by Strain Gauge
for North Ends of Beams B1 to B5 at a Distance of H/2 from Support
97
5.3.4 Ductility Observed in Shear Forces-Rebar Strain Curves (LVDTs)
Figure 5.3.7 also shows the plots of shear force at the beam ends against the percentage
tensile strains. However the tensile strains plotted in this figure have been obtained from LVDTs
attached to the shear reinforcement at critical sections. Here also the plots for the south and north
ends of the different beams have been shown separately in Figures 5.3.8 and 5.3.9, respectively,
to facilitate better comparison of the results. It should be noted that Beam B0 and B6 could not
be included in this comparative study. This was due to the fact that Beam B0 did not have any
shear reinforcement to which LVDTs could be attached, and B6 was not instrumented.
From Figures 5.3.8 it can be seen that the shear strength and amount of inelastic shear
deformation was much higher for Beam B0 in comparison to the others. Figure 5.3.9 also shows
higher amounts of inelastic deformation in Beam B0. Although the shear strength of the beam at
this end was not the largest, it compared well to those beams with higher strengths.

98
0
25
50
75
100
125
150
175
200
225
250
275
300
325
350
375
400
0 0.2 0.4 0.6 0.8 1 1.2 1.4 1.6 1.8 2 2.2 2.4 2.6 2.8 3 3.2 3.4 3.6 3.8
Tensile Strain in R-Rebar Located at 16 in. (@H/2) from Support Measured by LVDT (10-2 in./in.)
Shea
r For
ce a
t Sou
th/N
orth
End
(kip
s.)
B1-SOUTH
B1-NORTH
B2-SOUTH
B2-NORTH
B3-SOUTH
B3-NORTH
B4-SOUTH
B4-NORTH
B5-SOUTH
B5-NORTH
B0-SOUTH
B0-NORTH
B1S
B1N
B2S
B2N
B3S
B3N
B4S
B4N
B0S
B0N
B5S
B5N
*
*
Fig. 5.3.7 Shear Force Vs. Rebar Tensile Strains Measured by LVDT for Beams B0 to B5
at a Distance of H/2 from Support
* - Represents measured average tensile strains in concrete

99
0
25
50
75
100
125
150
175
200
225
250
275
300
325
350
375
400
0 0.2 0.4 0.6 0.8 1 1.2 1.4 1.6 1.8 2 2.2 Tensile Strain in R-Rebar Located at 16 in. (@H/2) from Support Measured by LVDT at South Ends (10-2 in./in.)
Shea
r For
ce a
t Sou
th E
nd (k
ips.
)
B1-SOUTH
B2-SOUTH
B3-SOUTH
B4-SOUTH
B5-SOUTH
B0-SOUTH
B1S
B2SB3S
B4S
B0S
B5S
*
Fig. 5.3.8 Shear Force Vs. Rebar Tensile Strains Measured by LVDT for South End of
Beams B0 to B5 at a Distance of H/2 from Support
* - Represents measured average tensile strains in concrete

100
0
25
50
75
100
125
150
175
200
225
250
275
300
325
350
375
400
0 0.2 0.4 0.6 0.8 1 1.2 1.4 1.6 1.8 2 2.2 2.4 2.6 2.8 3 3.2 3.4 3.6
Tensile Strain in R-Rebar Located at 16 in. (@H/2) from Support Measured by LVDT at North End (10-2 in./in.)
Shea
r For
ce a
t Nor
th E
nd (k
ips.
)
B1-NORTH
B2-NORTH
B3-NORTH
B4-NORTH
B5-NORTH
B0-NORTH
B1NB2N
B3N
B4N
B0N
B5N
*
Fig. 5.3.9 Shear Force Vs. Rebar Tensile Strains Measured by LVDT for North End of
Beams B0 to B5 at a Distance of H/2 from Support
* - Represents measured average tensile strains in concrete

101
5.3.5 Cracking, Crack Widths and Failures of Beams
Table 5.3.3 compares the shear forces at both ends of each of all the different beams at
the onset of cracking. Cracking has been considered to initiate when the crack width reaches
0.001 inch (i.e. the minimum reading possible with the microscope used for measuring crack
width). It can be seen that in this case cracking for Beam B0 initiates at the maximum shear
force. The cracking at the south ends of all the fiber reinforced beams were found to be at higher
shear forces than that in Beam B1, which did not contain fibers. This indicates that the addition
of steel fibers in beams is notably helpful in preventing the development of initial cracks. Also,
the results of Beam B0 indicate that the replacement of steel reinforcement with steel fibers
greatly increases the resistance of the beams to initial cracks. Fibers have effectively delayed the
onset of cracks in fiber reinforced beams.
Table 5.3.4 shows the width of shear cracks in different beams at a shear force of 250
kips. It also shows the maximum shear crack widths at shear forces close to the failure of the
different beams. Comparing the shear crack widths at the south ends of all the beams, for a shear
force of 250 k, it can be seen that the shear crack width was minimum for Beam B0. This
emphasizes the previously stated capability of steel fibers to control the development of cracks.
For most beams, the cracks at the north ends were found to be wider than the south ends.
However, in Beams B1 and B6, the case was just the opposite. This may be due to the fact that
the shear reinforcement at the north ends of these two beams was too high (4.2 %).

102
Table 5.3.3 Comparison of Shear Force at the Onset of Shear Crack for Various Beams
Beam
(Mix)
Steel
Fibers
(% vol)
(Type)
Transverse
Steel
(% vol)
Concrete
Strength
(ksi)
Shear Force at Onset of Shear Crack
(Crack Width = 0.001 in.)
(kips.)
B1-North
(TTC1) 0 4.2 12.2 140
B1-South
(TTC1) 0 1.0 12.2 100
B2-North
(TTFRC1)
1
(SF) 1.0 10.3 160
B2-South
(TTFRC1)
1
(SF) 0.42 10.3 150
B3-North
(TTFRC3)
0.5
(LF) 1.0 11.2 115
B3-South
(TTFRC3)
0.5
(LF) 0.42 11.2 130
B4-North
(SCFRC1)
0.5
(LF) 1.0 10.9 145
B4-South
(SCFRC1)
0.5
(LF) 0.42 10.9 145
B5-North
(SCFRC3)
1
(SF) 1.0 8.9 125
B5-South
(SCFRC3)
1
(SF) 0.42 8.9 125
B6-North
(SCC2-3) 0 4.2 10.6 115
B6-South
(SCC2-3) 0 1.0 10.6 120
B0-North
(TTFRC4)
1.5
(SF) 0 14.5 160
B0-South
(TTFRC4)
1.5
(SF) 0 14.5 175
NOTE:
TTC-TxDOT Traditional Concrete Mix TTFRC-TTC + Fibers Mix SCC -Self-Consolidating Concrete Mix
SCFRC- SCC + Fibers Mix SF-Short Fiber ZP305 LF-Long Fiber RC80/60BN TS - Transverse Steel

103
Table 5.3.4 Comparison of Shear Crack Width of Various Beams Measured Using Hand
Held Microscope
Beam
(Mix)
Steel
Fibers
(% vol)
(Type)
Transverse
Steel
(%vol)
Concrete
Strength
(ksi)
Shear Crack
Width at
Shear Force
= 250 kips.
(in.)
Maximum
Shear
Crack
Width
(in.)
Shear Force
Corresponding
to Maximum
Crack Width
(kips)
B1-North
(TTC1) 0 4.2 12.2 0.0040 0.010 320
B1-South
(TTC1) 0 1.0 12.2 0.0142 0.023 290
B2-North
(TTFRC1)
1
(SF) 1.0 10.3 0.0045 0.015 320
B2-South
(TTFRC1)
1
(SF) 0.42 10.3 0.0032 0.027 345
B3-North
(TTFRC3)
0.5
(LF) 1.0 11.2 0.0140 0.014 240
B3-South
(TTFRC3)
0.5
(LF) 0.42 11.2 0.0115 0.021 330
B4-North
(SCFRC1)
0.5
(LF) 1.0 10.9 0.0150 0.018 260
B4-South
(SCFRC1)
0.5
(LF) 0.42 10.9 0.0140 0.015 260
B5-North
(SCFRC3)
1
(SF) 1.0 8.9 0.0100 0.010 245
B5-South
(SCFRC3)
1
(SF) 0.42 8.9 0.0120 0.012 245
B6-North
(SCC2-3) 0 4.2 10.6 0.0063 0.015 320
B6-South
(SCC2-3) 0 1.0 10.6 0.0120 0.014 270
B0-North
(TTFRC4)
1.5
(SF) 0 14.5 0.0140 0.025 305
B0-South
(TTFRC4)
1.5
(SF) 0 14.5 0.0030 0.010 350
NOTE:
TTC-TxDOT Traditional Concrete Mix TTFRC-TTC + Fibers Mix SCC -Self-Consolidating Concrete Mix
SCFRC- SCC + Fibers Mix SF-Short Fiber ZP305 LF-Long Fiber RC80/60BN TS - Transverse Steel

104
The maximum shear crack widths recorded before failure of the beams were also low for
the south end of Beam B0. However, the crack width at the north end of this beam before failure
was higher in comparison to other beams. This may be due to the fact that the beam was loaded
to such a high level while failing the south end, and then reloaded again for failing the north end.
Beams with short fibers seemed to have performed a more effectively than the beams with long
fibers in controlling the shear crack width. This was expected as the beams with short fibers had
a higher fiber factor (55 and 82.5) than that of the beams with long fibers (40).
Fig. 5.3.10 shows the development of shear cracks with applied shear force for each of
the two ends of the different beams. The crack width for Beam B0 has been found to be lowest
throughout the loading stage. Most of the fiber reinforced beams have performed better in
controlling shear crack widths than the south end of beam B1. All the above studies clearly
indicate that the replacement of shear reinforcement with steel fibers plays an important role in
the crack control of the beams.
Table 5.3.5 shows number, width and lengths of cracks developed at each of the two end
regions of the different beams, 90 days after casting. These cracks occurred far later than
expected. Hence, prestress and thermal loading may not be the only causes of the end zone
cracking; secondary time dependent effects such as drying shrinkage, creep etc. might have
contributed to the development of these cracks. Beam B0 did not show any crack development at
the end region. The cracks in Beams B3, B4 and B5 were of very small widths. The cracks
developed in Beams B1, B2 and B6 during this period were found to be comparatively more
prominent.

105
0
0.005
0.01
0.015
0.02
0.025
0.03
0 50 100 150 200 250 300 350Shear Force (kips)
Shea
r Cra
ck W
idth
(in.
)
B1-SOUTH B1-NORTH B2-SOUTH B2-NORTH B3-SOUTH B3-NORTH B4-SOUTH
B4-NORTH B5-SOUTH B5-NORTH B0-SOUTH B0-NORTH B6-SOUTH B6-NORTH
B1S
B5N
B4N
B0N
B5S
B0S
B4S
B3N
B3S
B2N
B2S
B1N
B6NB6S
Fig. 5.3.10 Variation of Shear Crack Width with Shear Force Measured Using Microscope
for Beams BO to B6
Considering the north and south ends of B1, it can be found that the width of crack was
not influenced by the amount of end region reinforcement. The transverse steel has only helped
in reducing the number of cracks. It seems that long fibers are more efficient in controlling the
end zone cracks than the short fibers.
Fig. 5.3.11 to Fig. 5.3.17 shows the photographs of the crack patterns developed during
loading of various beams and also shows the photographs of failed beam specimens.

106
Table 5.3.5 Comparison of End Zone Crack Width of Various Beams Measured Using
Hand Held Microscope
Beam
(Mix)
Steel
Fibers
(% vol)
(Type)
Transverse
Steel
(% vol)
Concrete
Strength
(ksi)
Number
of
Cracks
Maximum End Zone
Crack Width at 90
Days after Casting
(in.)
Maximum
Crack
Length
(in.) B1-North
(TTC1) 0 4.2 12.2 1 0.001 5
B1-South
(TTC1) 0 1.0 12.2 1 0.001 10
B2-North
(TTFRC1)
1
(SF) 1.0 10.3 1 0.001 12
B2-South
(TTFRC1)
1
(SF) 0.42 10.3 3 0.003 11
B3-North
(TTFRC3)
0.5
(LF) 1.0 11.2 0 No Crack -
B3-South
(TTFRC3)
0.5
(LF) 0.42 11.2 2 < 0.001 10
B4-North
(SCFRC1)
0.5
(LF) 1.0 10.9 5 < 0.001 17
B4-South
(SCFRC1)
0.5
(LF) 0.42 10.9 2 < 0.001 10
B5-North
(SCFRC3)
1
(SF) 1.0 8.9 2 < 0.001 3
B5-South
(SCFRC3)
1
(SF) 0.42 8.9 1 < 0.001 1.5
B6-North
(SCC2-3) 0 4.2 10.6 9 0.005 25
B6-South
(SCC2-3) 0 1.0 10.6 3 0.001 10
B0-North
(TTFRC4)
1.5
(SF) 0 14.5 0 No Crack -
B0-South
(TTFRC4)
1.5
(SF) 0 14.5 0 No Crack -
NOTE:
TTC-TxDOT Traditional Concrete Mix TTFRC-TTC + Fibers Mix SCC -Self-Consolidating Concrete Mix
SCFRC- SCC + Fibers Mix SF-Short Fiber ZP305 LF-Long Fiber RC80/60BN TS - Transverse Steel

107
(a) Cracking of Beam B1-North End (b) Flexure Failure of Beam B1-North End
(c) Cracking of Beam B1-South End (d) Shear Failure of Beam B1-South End
Fig. 5.3.11 Load Test Photographs of North and South Ends of Beam B1

108
(a) Cracking of Beam B2-North End (b) Shear Failure of Beam B2-North End
(a) Cracking of Beam B2-South End (b) Shear Failure of Beam B2-South End
Fig. 5.3.12 Load Test Photographs of North and South Ends of Beam B2

109
(a) Cracking of Beam B3-North End (b) Shear Failure of Beam B3-North End
(a) Cracking of Beam B3-South End (b) Shear Failure of Beam B3-South End
Fig. 5.3.13 Load Test Photographs of North and South Ends of Beam B3
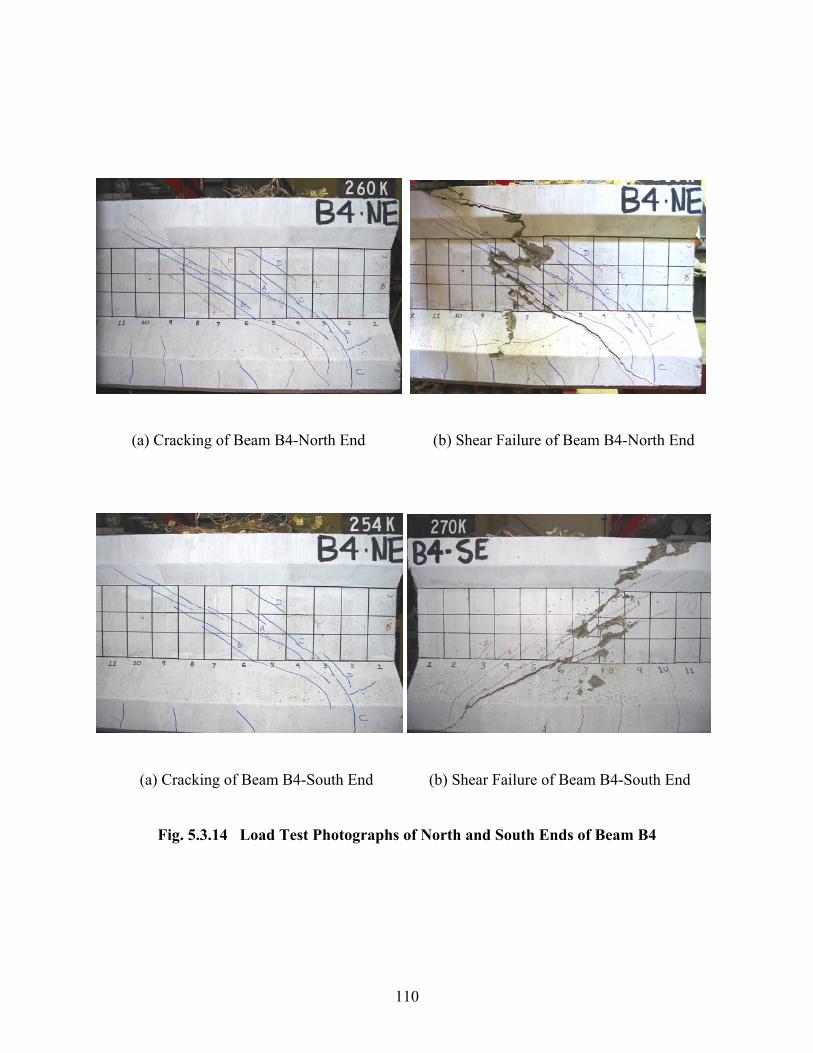
110
(a) Cracking of Beam B4-North End (b) Shear Failure of Beam B4-North End
(a) Cracking of Beam B4-South End (b) Shear Failure of Beam B4-South End
Fig. 5.3.14 Load Test Photographs of North and South Ends of Beam B4

111
(a) Cracking of Beam B5-North End (b) Shear Failure of Beam B5-North End
(a) Cracking of Beam B5-South End (b) Shear Failure of Beam B5-South End
Fig. 5.3.15 Load Test Photographs of North and South Ends of Beam B5

112
(a) Cracking of Beam B0-North End (b) Shear Failure of Beam B0-North End
(a) Cracking of Beam B0-South End (b) Shear Failure of Beam B0-South End
Fig. 5.3.16 Load Test Photographs of North and South Ends of Beam B0
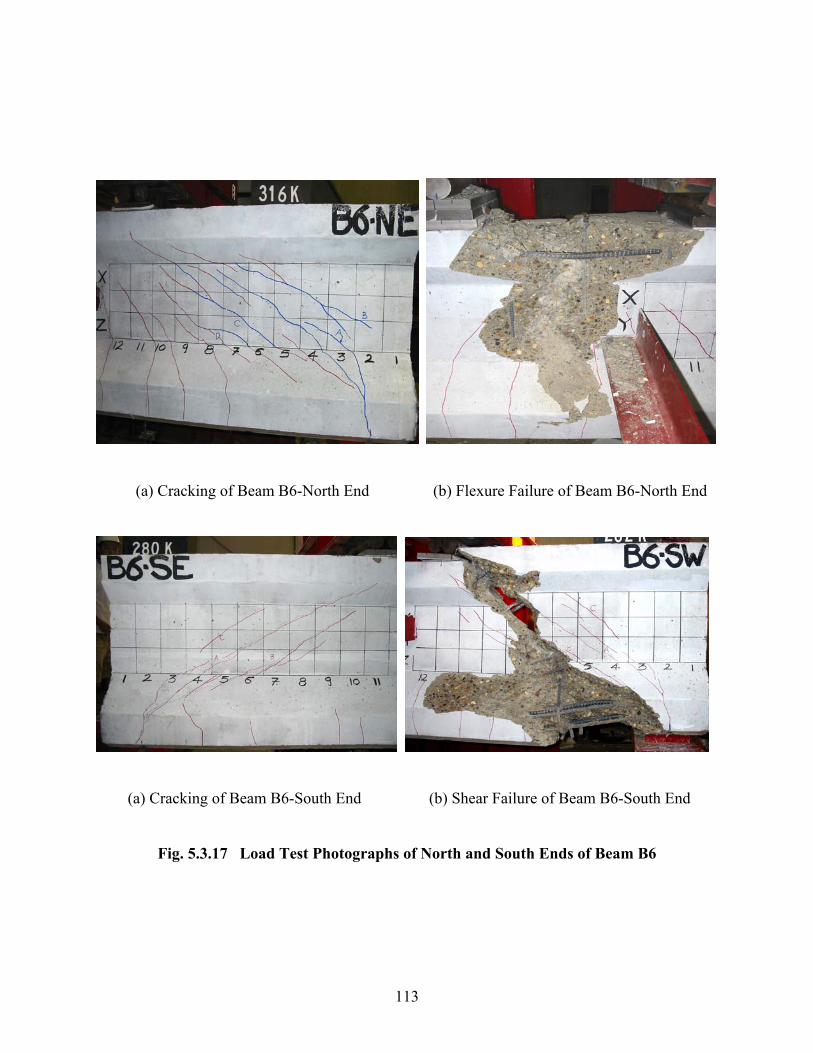
113
(a) Cracking of Beam B6-North End (b) Flexure Failure of Beam B6-North End
(a) Cracking of Beam B6-South End (b) Shear Failure of Beam B6-South End
Fig. 5.3.17 Load Test Photographs of North and South Ends of Beam B6

114
5.3.6 Comparison of Experimental and Analytical Shear Capacities
Table 5.3.6 presents the comparison of the experimental shear capacities of beams B0 to
B6 with analytical provisions. In this table, the code shear capacities contributed by concrete
(Vc) and steel (Vs) are estimated by AASHTO LRFD 2000 and the ultimate shear strengths of
fiber reinforced beams are calculated by the Fracture-Based Design method (Casanova et al
1997) for an average concrete strength (fc’) of 12 ksi. It can be seen that the experimental results
are greater than the analytical capacities. It is also observed that beam B0–South end has the
greatest shear capacity even though it has no transverse reinforcement. This indicates that steel
fibers are very effective in resisting shear force.

115
Table 5.3.6 Comparison of Theoretical and Experimental Shear Strengths
NOTE: TTC-TxDOT Traditional Concrete Mix TTFRC-TTC + Fibers Mix SCC - Self-Consolidating Concrete
SCFRC- SCC + Fibers Mix SF - Short Fiber ZP305 LF - Long Fiber RC80/60BN TS -Transverse Steel
Vc – Concrete Shear Strength (AASHTO LRFD 2000) Vs – Steel Shear Strength (AASHTO LRFD 2000) #– AASHTO LRFD 2000 * - Casanova 1997
Beam
(Mix)
Steel
Fibers
(% vol)
(Type)
Transverse
Steel
(%vol)
Concrete
Strength
(ksi)
Vc
(kips)
Vs
(kips)
Theoretical
Ultimate Shear
Capacity
(kips)
Experimental
Ultimate Shear
Capacity
(kips)
B1-North
(TTC1) 0 4.2 12.2 124 336 460 # -
B1-South
(TTC1) 0 1.0 12.2 124 81 205 # 294
B2-North
(TTFRC1)
1
(SF) 1.0 10.3 124 81 232 * 330
B2-South
(TTFRC1)
1
(SF) 0.42 10.3 124 33 184 * 349
B3-North
(TTFRC3)
0.5
(LF) 1.0 11.2 124 81 225 * 253
B3-South
(TTFRC3)
0.5
(LF) 0.42 11.2 124 33 177 * 242
B4-North
(SCFRC1)
0.5
(LF) 1.0 10.9 124 81 225 * 265
B4-South
(SCFRC1)
0.5
(LF) 0.42 10.9 124 33 177 * 276
B5-North
(SCFRC3)
1
(SF) 1.0 8.9 124 81 232 * 257
B5-South
(SCFRC3)
1
(SF) 0.42 8.9 124 33 184 * 248
B6-North
(SCC2-3) 0 4.2 10.6 124 336 460 # -
B6-South
(SCC2-3) 0 1.0 10.6 124 81 294 # 290
B0-North
(TTFRC4)
1.5
(SF) 0 14.5 124 0 - 301
B0-South
(TTFRC4)
1.5
(SF) 0 14.5 124 0 - 375

116

117
CHAPTER 6
CONCLUSIONS AND GUIDELINES
6.1 Conclusions
The following conclusions can be drawn from this research work:
(1) TxDOT Traditional Fiber Reinforced Concrete (TTFRC) was developed in this
research work. In general, all the TTFRC mixes had satisfactory workability and stability,
suitable to be used in the casting of end zones of prestressed I-beams.
(2) Highly workable and stable Self-Consolidating Fiber Reinforced Concrete
(SCFRC) can be made from locally available construction materials. Most of the workability
tests for the SCFRC are easy to perform on site. The SCFRC mixes tested during this research
had satisfactory workability and were found suitable for application to the end regions of I-
beams.
(3) Preliminary test results of hardened properties of TTFRC and SCFRC mixes have
confirmed the effectiveness of steel fibers in enhancing the tensile strength, flexural strength, and
ductility of the concrete. The mechanical performance of SCFRC mixes was much better than
that of the corresponding TTFRC mixes. On average, fibers increased the tensile strength of the
concrete mix by about 50 % in case of SCFRC mixes and about 25 % in case of TTFRC mixes.
(4) Optimum fiber contents for SCFRC mixes to be used in casting the end regions of
the I-beam were: 1 % by volume of short fibers (ZP305) and 0.5 % by volume of long fibers
(RC80/60BN). The optimum fiber content was based on the workability requirements.
(5) Casting was relatively easy in the case of SCFRC mixes. The SCFRC mixes were
highly workable without any signs of fiber blocking when placed in the beam form. SCFRC was
observed to flow from one end of the beam to the other without losing its stability. The rate of
casting for an SCFRC mix should be less than that for traditional concrete to avoid the formation
of air-pockets in the beam. Another solution to avert the formation of air-pockets while casting
SCFRC mixes is to completely eliminate the transverse reinforcement in the beam. This would
not only facilitate the unrestricted filling of SCFRC in the beam, but also increase the
workability performance of SCFRC.

118
(6) End zone cracking did not occur during the initial period of curing and prestress
release. The end region cracks appeared in most of the beams about three months after casting.
Hence, end zone cracking could be caused not only by the thermal and prestress forces, but also
by the time-dependent secondary effects of shrinkage and temperature variation. Most of the
TTFRC and SCFRC beams had end zone crack widths much smaller than the control traditional
beam. Moreover, beam B0 with TTFRC4 mix (1.5 % by volume short fibers) had no end region
cracks, even when the beam had absolutely zero traditional transverse steel reinforcement.
Additionally, TTFRC3 mix with 0.5 % by volume of long steel fibers (RC80/60BN, fiber factor
of 40) along with 1 % traditional transverse steel reinforcement was successful in averting the
end zone cracking.
(7) Rebar strains measured by strain gauges in the end zones during the initial period
of curing and release of prestress point out the advantageous utility of steel fibers in the end
zone. Results show that steel fibers have considerably reduced the tensile strains (i.e. also the
stresses) in the rebars during the initial stage of concrete curing and prestress release. This means
that the steel fibers were able to take up the tensile stress developed in the concrete due to
thermal and prestress loading, causing less tensile strains in the rebars.
(8) Temperature logger data revealed that the maximum thermal loading for the
traditional beam was about 84 oF, much more than the conventionally known value given in
literature of 60 oF. SCC produced more thermal loading (120 oF) due to a higher cement content.
Hence, it is prudent to incorporate steel fibers in SCC mixes to counteract the enhanced thermal
load in the matrix.
(9) Load tests of beams have shown that steel fibers were quite effective in increasing
the shear strength, crack resistance, and ductility of the beams. The tests proved the ability of
steel fibers to partially or completely replace traditional transverse steel reinforcement in the end
region of the beams. Steel fibers were also helpful in increasing the flexural capacity of the
beams. Most of the beams with steel fiber reinforced concrete were stiffer than the control beams
with non-fibrous mix. Furthermore, steel fiber reinforced beams demonstrated higher ductility
and energy absorption than the non-fibrous beams.
(10) Research findings of this project clearly show that the use of steel fibers in normal
slump concrete and self-consolidating concrete are effective to replace the traditional transverse
steel reinforcement, to control end zone cracking, to augment the shear strength, and to enhance

119
the ductility. The researchers would like to suggest for future research work the testing of 0.75 %
(RC80/60BN, fiber factor of 60) instead of 0.5 % by volume of long steel fibers in the traditional
concrete, which may result in complete elimination of the traditional transverse steel as well as
the end zone cracks. The absence of transverse rebars in the beam would ensure ease of
placement and better compaction of the TTFRC mix, thereby enhancing its workability and
mechanical performance.
6.2 Guidelines
The researchers have put forth the following tentative design guidelines for engineers to
aid them in designing, producing, testing and casting satisfactory steel fiber reinforced concrete
mixes for the application in the end zones of the prestressed concrete I-beams.
6.2.1 End Zone Crack Control
Present research has found out that both TxDOT Traditional steel Fiber Reinforced
Concrete (TTFRC) and Self-Consolidating Steel Fiber Reinforced Concrete (SCFRC) were
successful in either the reduction or complete elimination of the end zone cracking in the
prestressed concrete Type-A I-beam. TTFRC mix with satisfactory workability can be prepared
by adding the required amount and type of steel fibers to the traditional TxDOT concrete mix,
without modifying the prevalent mix design. Concrete mix proportions for TTFRC and SCFRC
mixes can be selected from Table 2.5.4 and Table 2.5.5 of this report, respectively.
Based on the results of the experimental work in Chapter 4 and Chapter 5, the
investigators advocate the use of TTFRC4 mix, i.e. TxDOT traditional concrete with 1.5 % by
volume of short steel fibers (ZP305, fiber factor of 82.5), at the end regions of prestressed I-
girders. TTFRC4 mix has the potential to completely eliminate the end zone cracks. Another
option would be the use of TTFRC3 mix with 0.5 % by volume of long steel fibers (RC80/60BN,
fiber factor of 40) along with 1 % traditional transverse steel reinforcement to avert the end zone
cracking.
Present research work has revealed that the maximum amount of steel fibers that could be
used in SCFRC mix is primarily governed by the workability criteria such as the stability and

120
passing ability of the mix. Based on their findings, the researchers would recommend the use of
SCFRC3 mix with 1 % by volume of short steel fibers (ZP305, fiber factor of 55) in the end
regions of the prestressed I-beams under the following conditions:
(a) The traditional transverse steel reinforcement should be completely eliminated if
SCFRC mix is to be used. The absence of traditional transverse steel
reinforcement would provide an unrestricted space for the SCFRC mix to flow
and fill more efficiently.
(b) Rate of casting/delivering the SCFRC mix should be comparatively lower than
that of the traditional concrete mix. Usually, the rate of casting a traditional
TxDOT beam is 5 ft3 of concrete per minute. The researchers suggest that this rate
be about 3 ft3 per minute for SCFRC mixes. Self-consolidation properties of
SCFRC mix would be improved and occurrence of air pockets would be avoided
if SCFRC mix were cast at a slower pace.
SCFRC3 mix with 1 % by volume of short steel fibers (ZP305, fiber factor of 55) might
not be enough to eliminate the end zone cracks, but it would reduce the crack width to a
minimum. It was found that steel fibers were more effective in controlling/eliminating the end
zone cracks than the traditional transverse steel in the prestressed concrete I-beams.
6.2.2 Structural Performance of Beams
Load testing of various TTFRC and SCFRC prestressed I-beams has proved the
advantageous effects of steel fibers on the shear strength, flexural strength and ductility of the
beams. Steel fibers were capable of changing the shear failure mode from brittle (traditional
beam) to ductile (TTFRC and SCFRC beams). Based on these test results, the investigators
advocate the use of TTFRC4 mix, i.e. TxDOT traditional concrete with 1.5 % by volume of short
steel fibers (ZP305, fiber factor of 82.5), which would completely replace the traditional
transverse steel in the prestressed concrete Type-A I-beam.
Another option recommended by the researchers considering the workability and
structural performance of the mixes would be the use of SCFRC3 mix with 1 % by volume of

121
short steel fibers (ZP305, fiber factor of 55) along with 0.5 % of transverse steel reinforcement.
Future tests may show that SCFRC mix with 1.5 % by volume of short steel fiber could
completely replace the traditional transverse steel.
6.2.3 Overall Performance of Beams
Considering the overall performance of the fiber reinforced concrete mixes such as the
workability of the mix, ease of casting, potential to eliminate the end zone cracks and structural
performance under loading, TTFRC4 mix, i.e. TxDOT traditional concrete with 1.5 % by volume
of short steel fibers (ZP305, fiber factor of 82.5) used in Beam B0 is highly recommended. Being
easy to cast, TTFRC4 mix has the potential to completely eliminate the end zone cracks and
totally replace the traditional transverse shear reinforcement in the prestressed beam.

122

123
Draft Specifications for Using
TxDOT Traditional
Fiber Reinforced Concrete
in Prestressed Concrete Beams

124

125
Draft Specifications for Using TxDOT Traditional Fiber Reinforced Concrete
in Prestressed Concrete Beams
Based on the research findings, the draft specifications for using TxDOT Traditional Fiber
Reinforced Concrete (TTFRC) in prestressed concrete beams are presented as follows:
1 Materials for TTFRC
As shown below, traditionally available construction materials that are currently being
used to manufacture the beams could be utilized to produce the TTFRC mixes.
Portland Cement Type-III ASTM C150
Fly Ash Type-C ASTM C618
Coarse Aggregates ¾ in. Rounded River-bed gravel AASHTO T 27
Fine Aggregates FM = 2.55, Well Graded, River-bed ASHTO M 43
Superplastizer Type-F
ASTM - C494
Rheobuild1000
Retarder Type-B ASTM- C494
Steel Fibers ZP305 Short Fiber
L = 1.2 in., D = 0.022 in.
L/D = 55L
* Bekaert Dramix®
D L
* Hooked Ends
D
-
Components Description Reference Code

126
2 Optimized TTFRC Mixes and Mix Proportions
The optimized TTFRC mix that would be suitable to be used in the prestressed concrete
beams is:
(a) TTFRC4 mix – TxDOT Traditional Fiber Reinforced Concrete with 1.5 % by
volume short steel fibers (ZP305)
The mix proportions for the above-optimized TTFRC mixes are given below:
NOTE: R = Rheobuild1000 Superplasticizer
Vf = Fiber Factor = (Vol. of fiber) x (Aspect ratio of fiber)
Optimized Mix Component
(lb/yd3) TTFRC4
Cement 519 Fly ash 248 Cementitious materials 767 Water/Cement ratio (w/c) 0.43 Water/Cementitious ratio 0.3 Coarse aggregate (CA) 1899 Fine aggregate (FA) 1156 CA / FA ratio 1.64
Superplastizer (R)
(fl.oz./cwt)
9.6 (R)
(20)
Steel Fiber - RC80/60BN (% vol.)
Long Fiber
0
Steel Fiber - ZP305 (% vol.)
Short Fiber
198 (1.5 %)
Vf = 82.5
Retarder (fl.oz./cwt) 1.0 (3)
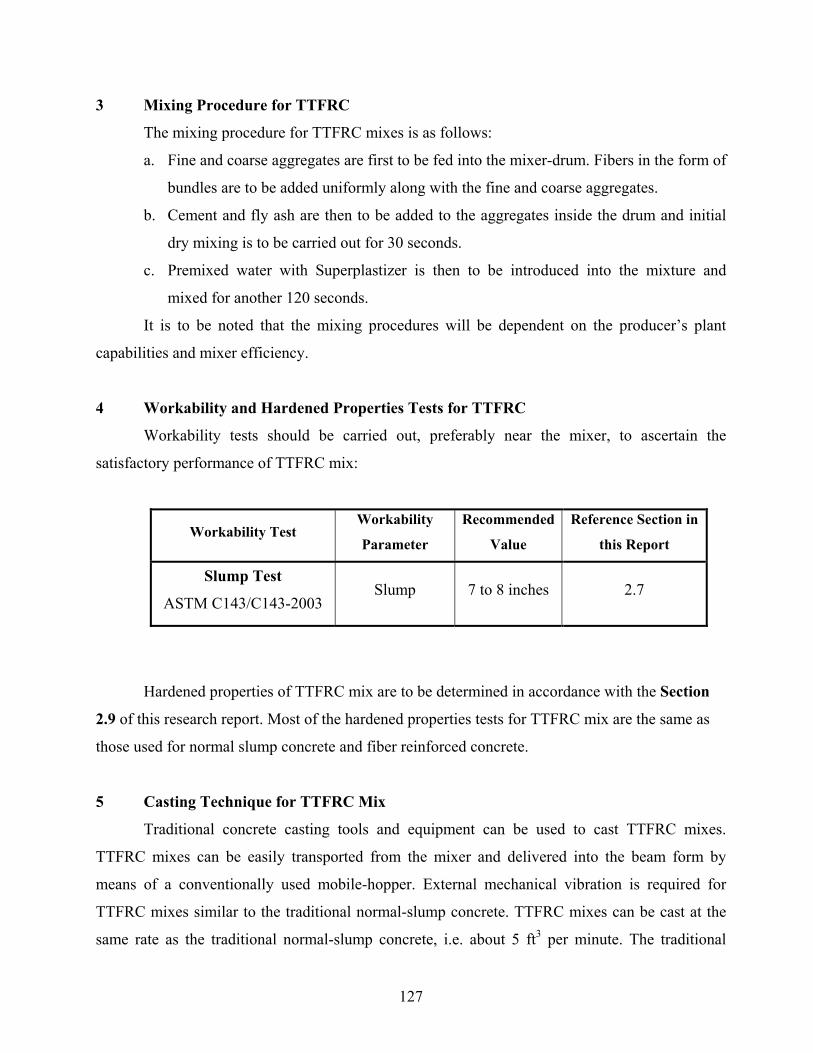
127
3 Mixing Procedure for TTFRC
The mixing procedure for TTFRC mixes is as follows:
a. Fine and coarse aggregates are first to be fed into the mixer-drum. Fibers in the form of
bundles are to be added uniformly along with the fine and coarse aggregates.
b. Cement and fly ash are then to be added to the aggregates inside the drum and initial
dry mixing is to be carried out for 30 seconds.
c. Premixed water with Superplastizer is then to be introduced into the mixture and
mixed for another 120 seconds.
It is to be noted that the mixing procedures will be dependent on the producer’s plant
capabilities and mixer efficiency.
4 Workability and Hardened Properties Tests for TTFRC
Workability tests should be carried out, preferably near the mixer, to ascertain the
satisfactory performance of TTFRC mix:
Workability Test Workability
Parameter
Recommended
Value
Reference Section in
this Report
Slump Test
ASTM C143/C143-2003 Slump 7 to 8 inches 2.7
Hardened properties of TTFRC mix are to be determined in accordance with the Section
2.9 of this research report. Most of the hardened properties tests for TTFRC mix are the same as
those used for normal slump concrete and fiber reinforced concrete.
5 Casting Technique for TTFRC Mix
Traditional concrete casting tools and equipment can be used to cast TTFRC mixes.
TTFRC mixes can be easily transported from the mixer and delivered into the beam form by
means of a conventionally used mobile-hopper. External mechanical vibration is required for
TTFRC mixes similar to the traditional normal-slump concrete. TTFRC mixes can be cast at the
same rate as the traditional normal-slump concrete, i.e. about 5 ft3 per minute. The traditional

128
transverse steel reinforcement in the beam should preferably be eliminated or reduced if TTFRC
mix is to be used. The absence of traditional transverse steel reinforcement would provide an
unrestricted space for the TTFRC mix to compact more efficiently with comparatively less
compaction energy.
The above specifications would be helpful in producing, testing and casting satisfactory
TxDOT Traditional Fiber Reinforced Concrete (TTFRC) for its application in the prestressed
concrete beams.

129
Draft Specifications for Using
Self-Consolidating
Fiber Reinforced Concrete
in Prestressed Concrete Beams

130

131
Draft Specifications for Using Self-Consolidating Fiber Reinforced Concrete in
Prestressed Concrete Beams
Based on the research findings, the draft specifications for using Self-Consolidating Fiber
Reinforced Concrete (SCFRC) in prestressed concrete beams are presented as follows:
1. Materials for SCFRC
As shown below, traditionally available construction materials that are currently being
used to manufacture the beams could be utilized to produce the SCFRC mixes.
Portland Cement Type-III ASTM C150
-
¾ River- -27
Fine Aggregates FM = 2.55, Well Graded, River-bed ASHTO M 43
Glenium3200HES - C494
Retarder -B ASTM - C494
L = 1.2 in., D = 0.022 in.
L
* Bekaert Dramix®
D L D
bed gravel AASHTO T
-
Fly Ash Type C ASTM C618
Coarse Aggregates in. Rounded
Superplasticizer/HRWR -Type F (Polycarboxylate based) ASTM
Type
Steel Fibers ZP305 Short Fiber
L/D = 55
* Hooked Ends
Components Description Reference Code

132
2 Optimized SCFRC Mixes and Mix Proportions
The optimized SCFRC mix that would be suitable to be used in the prestressed concrete
beams is:
(a) SCFRC3 mix – Self-Consolidating Fiber Reinforced Concrete with 1.0 % by
volume short steel fibers (ZP305)
The mix proportions for the above-optimized SCFRC mixes are given below:
NOTE: GL = Glenium 3200 HES Superplasticizer
Vf = Fiber Factor = (Vol. of fiber) x (Aspect ratio of fiber)
Optimized Mix Component
(lb/yd3) SCFRC3
Cement 587 Fly ash 250 Cementitious materials 837 Water/Cement ratio (w/c) 0.43 Water/Cementitious ratio 0.3 Coarse aggregate (CA) 1540 Fine aggregate (FA) 1580 CA / FA ratio 0.97 HRWR / Superplastizer (GL)
(fl.oz./cwt)
10.5
(20) Steel Fiber - RC 80/60 BN (% vol.)
Long Fiber
0
Steel Fiber - ZP305 (% vol.)
Short Fiber
132 (1 %)
Vf = 55
Retarder (fl.oz./cwt)
1.6 (4.4)

133
3 Mixing Procedure for SCFRC
The mixing procedure for SCFRC mixes is as follows:
a. Fine and coarse aggregates are first to be fed into the mixer-drum. Fibers in the form of
bundles are to be added uniformly along with the fine and coarse aggregates.
b. Cement and fly ash are then to be added to the aggregates inside the drum and initial
dry mixing is to be carried out for 30 seconds.
c. Premixed water with HRWR is then to be introduced into the mixture and mixed for
another 120 seconds.
It is to be noted that the mixing procedures will be dependent on the producer’s plant
capabilities and mixer efficiency. SCC/SCFRC is sensitive to mixing procedure, time of mixing
and type of mixer.
4 Workability and Hardened Properties Tests for SCFRC
Workability tests should be carried out, preferably near the mixer, to ascertain the
satisfactory performance of SCFRC mix:
Workability Test Workability
Parameter
Recommended
Value
Reference Section in
this Report
Slump Flow Test Flowability > 25 inches 2.3 (a)
Visual Stability Index
(VSI) Rating Stability ‘Zero’ Rating 2.3 (a)
T-20in Time Filling Ability 3 to 7 seconds 2.3 (a)
J-ring Value Passing Ability < 3 inches 2.3 (b)
Hardened properties of SCFRC mix are to be determined in accordance with the Section
2.9 of this research report. Most of the hardened properties tests for SCFRC mix are the same as
those used for normal slump concrete and fiber reinforced concrete.

134
5 Casting Technique for SCFRC Mix
Traditional concrete casting tools and equipment can be used to cast SCFRC mixes.
SCFRC mixes can be easily transported from the mixer and delivered into the beam form by
means of a conventionally used mobile-hopper. External mechanical vibration is not required for
SCFRC mixes.
Following measures should be taken while casting SCFRC mixes:
(a) Rate of casting should not be more than 3 ft3 per minute for SCFRC mixes to
enhance its restricted filling ability. Self-consolidation properties of SCFRC mix
would be improved and occurrence of air pockets would be avoided if SCFRC mix
is cast at a slower pace.
(b) The traditional transverse steel reinforcement in the beam should preferably be
eliminated if SCFRC mix is to be used. The absence of traditional transverse steel
reinforcement would provide an unrestricted space for the SCFRC mix to flow and
fill more efficiently. Hence, self-consolidation of SCFRC mix would best be
achieved by complete elimination of the traditional transverse steel reinforcement.
The above specifications would be helpful in producing, testing and casting satisfactory
Self-Consolidating Fiber Reinforced Concrete (SCFRC) for its application in the prestressed
concrete beams.

135
References
AASHTO LRFD (2000), American Association of State Highway Transportation
Officials “Bridge Design Specifications-U.S. Units,” Washington D.C.
AASHTO T27 (1996), American Association of State Highway Transportation Officials
“Sieve Analysis of Fine and Coarse Aggregates,” Washington D.C.
AASHTO M43 (1998), American Association of State Highway Transportation Officials
“Sizes of Aggregates for Road and Bridge Construction,” Washington D.C.
ACI 318-95 (1996), “Building Code Requirements for Structural Concrete,” American
Concrete Institute, Farmington Hills, Michigan.
ACI 544.1R (1996), “State-of-the-Art Report on Fiber Reinforced Concrete,” American
Concrete Institute, Farmington Hills, Michigan.
Akihiro, H., Kida, T., Tamaki, T., and Hagiwara, H. (1998), “Study on Self-Compacting
Concrete with Expansive Adhesive,” International Workshop on Self-Compacting Concrete, pp
218-227.
Ambroise, J., Rols, S., and Pera, J. (2001), “Properties of Self-Levelling Concrete
Reinforced by Steel Fibers,” IBRACON, Brazilian Concrete Institute, Brazil.
Ashour, S.A., Hasanain, G.S., and Wafa, F.F. (1992), “Shear Behavior of High-Strength
Fiber Reinforced Concrete Beams,” ACI Structural Journal, Vol. 89, No. 2, pp 176-184.
ASTM C1399 (1999), “Test Methods for Obtaining Average Residual Strength of Fiber-
Reinforced Concrete,” Annual Book of American Standards for Testing of Materials, Vol. 04.02,
ASTM International, West Conshohocken, PA, USA.
ASTM C496 (1996), “Standard Test Method for Splitting Tensile Strength of Cylindrical
Concrete Specimens,” ASTM International, West Conshohocken, PA, USA.
ASTM C494/C494M (1999), “Standard Specification for Chemical Admixtures for
Concrete,” ASTM International, West Conshohocken, PA, USA.
ASTM C150 (2002), “Standard Specification for Portland Cement,” ASTM International,
West Conshohocken, PA, USA.
ASTM C78 (2002), “Standard Test Method for Flexural Strength of Concrete (Using
Simple Beam with Third-Point Loading),” ASTM International, West Conshohocken, PA, USA.

136
ASTM C469 (2002), “Standard Test Method for Static Modulus of Elasticity and
Poisson’s Ratio of Concrete in Compression,” ASTM International, West Conshohocken, PA,
USA.
ASTM C618 (2003), “Standard Specification for Coal Fly Ash and Raw or Calcined
Natural Pozzolan for Use as a Mineral Admixture in Concrete,” ASTM International, West
Conshohocken, PA, USA.
ASTM C39/39M (2003), “Standard Test Method for Compressive Strength of Cylindrical
Concrete Specimens,” ASTM International, West Conshohocken, PA, USA.
ASTM C143/143M (2003), “Standard Test Method for Slump of Hydraulic Cement
Concrete,” ASTM International, West Conshohocken, PA, USA.
Barr, B. (1987), “Fracture Characteristics of FRC Materials in Shear,” Fiber Reinforced
Concrete Properties and Applications, ACI SP-105, American Concrete Institute, Farmington
Hills, Michigan.
Beaudoin, J.J. (1990), “Handbook of Fiber Reinforced Concrete. Principles, Properties,
Developments and Applications,” Noyes Publications, Park Ridge, NJ, pp 332.
Breen, J.E., Burdet, O., Roberts, C., Sanders, D., and Wollmann G. (1994), “Anchorage
Zone Reinforcement for Post-Tensioned Concrete Girders,” National Cooperative Highway
Research Program Report 356, Washington D.C.
Bury, M.A., and Buhler, E. (2002), “Methods and Techniques for Placing Self-
Consolidating Concrete – An Overview of Field Experiences in North American Applications,”
Proceedings, First North American Conference on the Design and Use of Self-Consolidating
Concrete, Rosemont, Illinois, USA.
Casanova, P. (1996), “Betons renforces de fibres metalliques du materiau a la structure,”
PhD thesis, Labaratoire Central de Ponts et Chaussees, Paris (in French).
Casanova, P., Rossi, P., and Schaller, I. (1997), “Can Steel Fibers Replace Transverse
Reinforcements in Reinforced Concrete Beams?” ACI Materials Journal, Vol. 94, No. 5, pp 341-
354.
Daczko, J.A. (2002), “Stability of Self-Consolidating Concrete, Assumed or Ensured?”
Proceedings, First North American Conference on the Design and Use of Self-Consolidating
Concrete, Rosemont, Illinois, USA.

137
Dixon, J., and Mayfield, B. (1971), “Concrete Reinforced with Fibrous Wire,” Journal of
the Concrete Society, Concrete, Vol. 5, No. 3, pp 73-76.
Earney, T.P. (2000), “Cracking in Prestressed I-Girder Bridges,” Master”s Thesis,
University of Missouri – Columbia.
Edamatsu, Y., Kobayashi, T., and Nagaoka, S. (1997), “Influence of Powder Properties
on Self-Compactibilty of Fresh Concrete,” JCA Proceedings of Cement and Concrete, No. 51, pp
394-399 (in Japanese).
EFNARC, (2002), “Specification and Guidelines for Self-Compacting Concrete,”
European Federation for Specialist Construction Chemicals and Concrete Systems, Surrey, UK.
Fenves, G. L. (2001). Annual workshop on Open System for earthquake engineering
Simulation. Pacific Earthquake Engineering Research Center, UC Berkeley, California, USA.
Gaimster, R., and Foord, C. (2000), “Self-compacting concrete,” Concrete, 34, pp 23-25.
Gopalaratnam, V.S., and Shah, S. (1987), “Failure Mechanisms and Fracture of Fiber
Reinforced Concrete,” Fiber Reinforced Concrete – Properties and Applications, SP 105, ACI,
Detroit, Michigan, pp 1-25.
Gopalaratnam, V.S., Earney, T.P., Myers, J., Nani, A., and Stone, D. (2001), “Precast I-
Girder Cracking: Phase II - Causes and Design Details,” Missouri Department of Transportation
Report No RDT 01-008.
Grünewald, S., and Walraven, J.C. (2001), “Parameter-Study on the Influence of Steel
Fibers and Coarse Aggregate Content on the Fresh Properties of Self-Compacting Concrete,”
Cement and Concrete Research, 31, pp 1793-1798.
Grzybowski, M. (1989), “Determination of Crack Arresting Properties of Fiber
Reinforced Cementitious Composites,” Chapter 12, Royal Institute of Technology, Stockholm,
Sweden.
Grzybowski, M., and Shah, S.P. (1990), “Shrinkage Cracking in Fiber Reinforced
Concrete,” ACI Materials Journal, Vol. 87, No2, pp 138-148.
Hannant, D.J. (1978), “Fiber Cements and Fiber Concrete,” John Wiley and Sons Ltd.,
Chichester, UK, pp 53.
Hoff, G. (1987), “Durability of Fiber Reinforced Concrete in a Severe Marine
Environment,” Fiber Reinforced Concrete Properties and Applications, SP-105, ACI, Detroit,
Michigan, pp 997-1041.

138
Holschemacher, K., and Klug, Y. (2002), “A Database for the Evaluation of Hardened
Properties of SCC,” LACER, No. 7, pp. 123-134.
Imam, M. (1995), “Shear-moment Interaction of Steel Fiber High Strength Concrete,”
PhD thesis, Katholieke Universiteit Leuven, Leuven, Belgium.
Johnston, C.D. (1974), “Steel Fiber Reinforced Mortar and Concrete – A Review of
Mechanical Properties,” Fiber Reinforced Concrete, SP-44, ACI, Detroit, Michigan, pp 127-142.
Johnston, C.D. (1980), “Properties of Steel Fiber Reinforced Mortar and Concrete – A
Review of Mechanical Properties,” Proceedings, International Symposium on Fibrous Concrete
(C1-80), Construction Press, Lancaster, pp 29-47.
Johnston, C.D. (1989), “Effect on Flexural Performance of Sawing Plain Concrete and of
Sawing and Other Methods of Altering Fiber Alignment in Fiber Reinforced Concrete,” Cement,
Concrete and Aggregate, ASTM, CCAGDP, Vol. 11, No. 1, pp 23-29.
JSCE Research Subcommittee on Self-Compacting Concrete (1998), “Recommendation
for Construction of Self-Compacting Concrete,” Japan Society of Civil Engineers (in Japanese),
Japan.
Khayat, K.H., Manai, K., and Trudel, A (1997), “In-Situ Mechanical Properties of Wall
Elements Cast Using Self-Consolidating Concrete,” ACI Materials Journal, 94(6), pp 491-500.
Khayat, K.H., Hu, C., and Monty, H. (1999), “Stability of Self-Consolidating Concrete,
Advantages, and Potential Applications,” Proceedings of First International RILEM Symposium
on Self-Compacting Concrete, Stockholm, Sweden, pp 143-152.
Naaman, A.E. (1985), “Fiber Reinforcement for Concrete,” Concrete International:
Design and Construction, Vol. 7, No. 3, pp 21-25.
Narayanan, R., and Darwish, I. (1987), “Use of Steel Fibers as Shear Reinforcement”,
ACI Structural Journal, Vol. 84, No. 3, pp 216-277.
Nawa, T., Eguchi, H., and Fukaya, Y. (1989), “Effect of Alkali Sulfate on the
Rheological Behavior of Cement Paste Containing a Superplasticizer,” ACI SP-119, pp 405-424.
Nawa, T. et al.(1993), “A Study on the Super Workable, High Strength Concrete with
Belite Rich Cement,” Proceedings of the Japan Concrete Institute, Vol. 15, No. 1, pp 143-148 (in
Japanese).

139
Noghabai, K. (1998), “Effect of Tensioning Softening on the Performance of Concrete
Structures: Experimental, Computational and Analytical Studies,” PhD thesis, Lulea University
of Technology, Lulea, Sweden.
Noghabai, K. (2000), “Beams of Fibrous Concrete in Shear and Bending: Experiment and
Model,” Journal of Structural Engineering, ASCE, Vol. 126, No. 2, pp 243-251.
Oh, S.G., Noguchi, T., and Tomosawa, F. (1999), “Evaluation of Rheological Constants
of High-Fluidity Concrete by Using the Thickness of Excess Paste,” Journal of the Society of
Materials Science, Aug., Japan.
Okamura, H., and Ozawa, K. (1995), “Mix-Design for Self-Compacting Concrete,”
Concrete Library of the Japanese Society of Civil Engineers, pp 107-120.
Padmarajaiah, S.K., and Ramaswamy, A. (2002), “Comparative Study on Flexural
Response of Full and Partial Depth Fiber-Reinforced High-Strength Concrete,” Journal of
Materials in Civil Engineering, Vol. 14, No. 2, pp 130-136.
PCI (1999), “PCI Design Handbook,” Precast/Prestressed Concrete Institute, 5th Edition,
Chicago, Illinois.
PCI, TR-6-03 (2003), “Interim Guidelines for the Use of Self-Consolidating Concrete in
Precast/Prestressed Concrete Institute Member Plants,” Precast/Prestressed Concrete Institute,
Chicago, Illinois.
Petersson, O. (1998), “SCC Task 9 Reseach Report,” Swedish Cement and Concrete
Research Institute, Stockholm, Sweden.
Rapoport, J., Aldea, C., Shah, S.P., Ankenman, B., and Karr, A.F. (2001), “Permeability
of Cracked Steel Fiber-Reinforced Concrete,” Technical Report No. 115, National Institute of
Statistical Sciences (NISS), Research Triangle Park, NC, USA.
Romualdi, J.P., and Batson, G.B. (1963), “Mechanics of Crack Arrest in Concrete,”
Journal of Engineering Mechanics Division, ASCE, Vol. 89, No. EM3, pp 147-168.
Schupack, M. (1985), “Durability of Steel Fiber Reinforced Concrete Exposed to Severe
Environments,” Steel Fiber Concrete, US-Sweden Joint Seminar (NSF-STU), Stockholm,
Sweden
Shah, S.P. (1991), “Do Fibers Increase the Tensile Strength of Cement-Based Matrixes?,”
ACI Materials Journal, Vol. 88, No. 6, pp 595-602.

140
Snyder, M.L., and Lankard, D.R. (1972), “Factors Affecting the Strength of Steel Fibrous
Concrete,” ACI Journal Proceedings, Vol. 69, No. 2, pp 96-100.
Sonebi, M., and Bartos, P.J.M. (2002), “Filling Ability and Plastic Settlement of Self-
Compacting Concrete,” Materials and Structures, 35 (252), pp 462-469.
Toyoharu, N., Tatsuo, I., and Yoshinobu, E. (1998), “State-of-the-art Report on Materials
and Design of Self-Compacting Concrete,” International Workshop on Self-Compacting
Concrete, Japan, pp 160-189.
Waterhouse, B.L., and Luke, C.E. (1972), “Steel Fiber Optimization,” Conference
Proceedings M-28, Fibrous Concrete – Construction Materials for the Seventies, pp 630-681.
Williamson, G.R. (1974), “The Effect of Steel Fibers on Compressive Strength of
Concrete,” Fiber Reinforced Concrete, SP-44, ACI, Detroit, Michigan, pp 195-207.
Williamson, G.R. (1978), “Steel Fibers as Reinforcement in Reinforced Concrete,”
Proceedings, US Army Science Conference, West Point, Vol. 3, pp 363-377.
Zhong, J. (2005). “Model-Based Simulation of Reinforced-Concrete Plane Stress
Structures,” Ph.D. Dissertation, Department of Civil and Environmental Engineering, University
of Houston, Houston, TX.