Fact Book - YU
13
Fact Book Fall 2017 Institutional Research & Assessment https://www.yu.edu/oir/
Transcript of Fact Book - YU

Fact Book
Fall 2017
Institutional Research & Assessment
https://www.yu.edu/oir/

Fall 2017 Fact Book
Table of Contents
____________________________________________________
I. STUDENT ENROLLMENT
Table 1. Student Enrollment by Level ……………………………………… 1
Table 2. Undergraduate Enrollment by School & Major …………………… 2
Table 3. Undergraduate Enrollment in Torah Studies by Program ………… 6
Table 4. Graduate Enrollment by School & Program ……………………… 7

Fall Enrollment by Level
Full- time
Part-time
Total Full- time
Part-time
Total Full- time
Part-time
Total Full- time
Part-time
Total
01. Undergraduate 2,725 89 2,814 2,643 97 2,740 2,628 86 2,714 2,646 86 2,732
02. Graduate
Manhattan Campus1,734 451 2,185 1,646 408 2,054 1,487 524 2,011 1,594 543 2,137
03. Sub-total: Manhattan Campus (01 + 02)
Both Undergraduate & Graduate4,459 540 4,999 4,289 505 4,794 4,115 610 4,725 4,240 629 4,869
04. Graduate: Einstein 1,062 471 1,533 1,019 466 1,485 983 537 1,520 993 526 1,519
05. Sub-total: Graduate
All Campuses (02 + 04)2,796 922 3,718 2,665 874 3,539 2,470 1,061 3,531 2,587 1,069 3,656
06. Grand Total:
All YU Undergraduate & Graduate
(01 + 05)
5,521 1,011 6,532 5,308 971 6,279 5,098 1,147 6,245 5,233 1,155 6,388
Table 1. Student Enrollment: 2014 – 2017
Level
Fall 2014 Fall 2015 Fall 2016 Fall 2017
Prepared by: Office of Institutional Research and Assessment (qs) 10/30/2017
1

Fall Enrollment by School
Full- time
Part-time
Total Full- time
Part-time
Total Full- time
Part-time
Total Full- time
Part-time
Total Full- time
Part-time
Total
01. Stern College for Women 935 20 955 864 12 876 801 15 816 759 8 767 801 8 809
02. SY SYMS School of Business - Women
137 0 137 143 3 146 137 1 138 150 1 151 169 2 171
03. SY SYMS School of Business - Men 397 18 415 463 19 482 525 26 551 523 23 546 517 31 548
04. SYMS School of Business Total 534 18 552 606 22 628 662 27 689 673 24 697 686 33 719
05. Yeshiva College 681 66 747 648 55 703 599 55 654 552 54 606 523 45 568
092. Katz AS Management- Men 23 0 23
093. Katz AS Management- Women 11 0 11
10. On-Campus Total 2,150 104 2,254 2,118 89 2,207 2,062 97 2,159 1,984 86 2,070 2,044 86 2,130
11. Israel 632 0 632 607 0 607 581 0 581 644 0 644 602 0 602
12. Undergrad Total 2,782 104 2,886 2,725 89 2,814 2,643 97 2,740 2,628 86 2,714 2,646 86 2,732
(Table 2 is continued on the next page)
Table 2. Undergraduate Enrollment: 2013 – 2017
School
Fall 2013 Fall 2014 Fall 2015 Fall 2016 Fall 2017
Prepared by: Office of Institutional Research and Assessment (qs) 10/30/2017
2

Full - time
Part - time
Total Full - time
Part - time
Total Full - time
Part - time
Total Full - time
Part - time
Total Full - time
Part - time
Total
01. Stern College for Women 935 20 955 864 12 876 801 15 816 759 8 767 801 8 809
ART: Art 1 0 1 1 0 1
BC: Biochemistry 19 0 19 18 0 18 16 0 16 19 0 19 8 1 9
BIO: Biology 194 4 198 193 4 197 191 0 191 189 3 192 188 4 192
CHE: Chemistry 7 0 7 9 0 9 11 0 11 2 0 2 3 0 3
COM: Computer Science 2 0 2 2 0 2 22 0 22
ECO: Economics 12 0 12 9 0 9 3 1 4 2 0 2 4 0 4
EDU: Education 39 1 40 44 1 45 38 0 38 26 1 27 19 0 19
ENG: English 59 1 60 50 1 51 47 1 48 36 0 36 41 0 41
HIS: History 14 0 14 15 0 15 9 1 10 6 1 7 5 0 5
JED: Jewish Education 17 1 18 10 0 10 4 0 4 2 0 2
JST: Jewish Studies 33 5 38 29 0 29 16 5 21 19 2 21 32 1 33
JUD: Judaic Studies 1 0 1 1 0 1
MAT: Mathematics 19 1 20 18 0 18 10 0 10 11 0 11 15 1 16
MUS: Music 3 0 3 5 0 5 1 0 1 2 0 2 3 0 3
PHI: Philosophy 1 0 1 3 0 3
PHY: Physics 4 0 4 4 0 4
POL: Political Science 18 0 18 22 0 22 19 0 19 19 0 19 25 0 25
PRE: Pre-Engineering 9 0 9 5 1 6 3 1 4 2 0 2 9 0 9
PSC: Physical Sciences 6 0 6 5 2 7 4 0 4 7 0 7 6 0 6
PSY: Psychology 105 2 107 114 1 115 102 1 103 95 0 95 122 0 122
SHA: Shaped Major 75 1 76 78 0 78 69 2 71 46 0 46 53 0 53
SOC: Sociology 20 1 21 16 0 16 9 1 10 12 0 12 6 0 6
SPAU: Speech Pathology & Audiology 29 0 29 31 0 31 32 0 32 31 0 31 26 0 26
UND: Undeclared 249 3 252 187 2 189 216 2 218 228 1 229 214 1 215
Fall 2017Table 2 (Continued)
Fall Enrollment by Major
Fall 2013 Fall 2014 Fall 2015 Fall 2016
Prepared by: Office of Institutional Research and Assessment (qs) 10/30/2017
3

Full - time
Part - time
Total Full - time
Part - time
Total Full - time
Part - time
Total Full - time
Part - time
Total Full - time
Part - time
Total
02. SY SYMS School of Business - Women
137 0 137 143 3 146 137 1 138 150 1 151 169 2 171
ACC: Accounting 37 0 37 34 0 34 28 0 28 22 0 22 23 0 23
BUS: Business & Management 97 0 97 107 2 109 109 1 110 128 1 129 146 2 148
UND: Undeclared 3 0 3 2 1 3 0 0 0 0 0 0 0 0 0
03. SY SYMS School of Business - Men 397 18 415 463 19 482 525 26 551 523 23 546 517 31 548
ACC: Accounting 125 4 129 141 3 144 140 3 143 124 1 125 104 4 108
BUS: Business & Management 252 5 257 275 8 283 351 11 362 384 10 394 335 9 344
UND: Undeclared 20 9 29 47 8 55 34 12 46 15 12 27 78 18 96
04. SYMS School of Business Total 534 18 552 606 22 628 662 27 689 673 24 697 686 33 719
Table 2 (Continued)Fall Enrollment by Major
Fall 2013 Fall 2014 Fall 2015 Fall 2016 Fall 2017
Prepared by: Office of Institutional Research and Assessment (qs) 10/30/2017
4

Full - time
Part - time
Total Full - time
Part - time
Total Full - time
Part - time
Total Full - time
Part - time
Total Full - time
Part -time
Total
05. Yeshiva College 681 66 747 648 55 703 599 55 654 552 54 606 523 45 568
BC: Biochemistry 1 0 1
BIO: Biology 125 8 133 117 2 119 125 4 129 130 7 137 119 6 125
CHE: Chemistry 13 2 15 12 1 13 13 1 14 9 1 10 10 1 11
CLA: Classical Languages 1 0 1 0 1 1
COM: Computer Science 24 0 24 25 2 27 25 0 25 23 1 24 46 0 46
ECO: Economics 39 3 42 43 3 46 39 2 41 32 0 32 29 0 29
ENG: English 18 1 19 20 2 22 20 1 21 18 0 18 15 0 15
HEB: Hebrew 2 0 2 0 1 1 0 1 1
HIS: History 14 3 17 19 2 21 18 2 20 8 0 8 5 1 6
JST: Jewish Studies 1 0 1
JHI: Jewish History 12 2 14 9 2 11 12 1 13 11 3 14 10 3 13
MAT: Mathematics 31 4 35 45 4 49 43 6 49 31 7 38 34 3 37
MUS: Music 4 0 4 7 0 7 7 0 7 6 0 6 5 1 6
PHI: Philosophy 12 1 13 8 1 9 13 0 13 10 5 15 8 1 9
PHY: Physics 12 3 15 11 3 14 13 2 15 13 2 15 11 1 12
POL: Political Science 33 1 34 19 1 20 15 1 16 22 1 23 32 1 33
PRE: Pre-Engineering 23 2 25 18 3 21 18 0 18 23 1 24 25 2 27
PSY: Psychology 78 6 84 77 6 83 62 8 70 55 1 56 55 7 62
SOC: Sociology 15 1 16 10 0 10 7 1 8 8 0 8 3 0 3
UND: Undeclared 225 29 254 208 21 229 169 25 194 153 25 178 114 18 132
Fall 2017Table 2 (Continued)
Fall Enrollment by Major
Fall 2013 Fall 2014 Fall 2015 Fall 2016
Prepared by: Office of Institutional Research and Assessment (qs) 10/30/2017
5

Sy Syms
Men
Yeshiva
College Other Total
Sy Syms
Men
Yeshiva
College Other Total
Sy Syms
Men
Yeshiva
College Other Total
060. IBC 121 115 0 236 120 116 0 236 108 124 9 241
070. JSS 81 46 0 127 82 42 0 124 76 46 14 136
080. MYP 184 346 4 534 196 305 2 503 194 293 5 492
090. SBMP 156 118 0 274 154 104 0 258 144 90 5 239
Total 542 625 4 1,171 552 567 2 1,121 522 553 33 1,108
Table 3. Undergraduate Enrollment in Torah Studies: 2015-2017
Fall Enrollment by
Program
Fall 2015 Fall 2016 Fall 2017
Prepared by: Office of Institutional Research and Assessment (qs) 10/25/2017
6

Fall Enrollment by School
Full-
time
Part-
time Total
Full-
time
Part-
time Total
Full-
time
Part-
time Total
Full-
time
Part-
time Total
Katz (YU Global before 2016) 12 1 13 21 0 21 52 19 71 84 26 110
Cardozo 1,022 136 1,158 943 118 1,061 889 126 1,015 915 149 1,064
Ferkauf 277 103 380 255 73 328 238 89 327 246 88 334
Syms 36 4 40 44 7 51 46 5 51 48 2 50
Azrieli 78 103 181 66 103 169 23 132 155 23 125 148
Bernard Revel 40 74 114 31 73 104 14 95 109 9 103 112
Stern 0 10 10 0 11 11 14 0 14 14 1 15
Wurzweiler 269 7 276 285 4 289 205 41 246 246 36 282
Yeshiva & Stern: Math 0 13 13 1 19 20 6 17 23 9 13 22
Total (above) 1,734 451 2,185 1,646 408 2,054 1,487 524 2,011 1,594 543 2,137
Einstein 1,062 471 1,533 1,019 466 1,485 983 537 1,520 993 526 1,519
Total Graduates 2,796 922 3,718 2,665 874 3,539 2,470 1,061 3,531 2,587 1,069 3,656
(Table 4 is continued on the next page)
Table 4. Graduate Enrollment: 2014 - 2017
School
Fall 2014 Fall 2015 Fall 2016 Fall 2017
Prepared by: Office of Institutional Research and Assessment (qs) 10/25/2017
7
Full- time
Part-time
Total Full- time
Part-time
Total Full- time
Part-time
Total Full- time
Part-time
Total
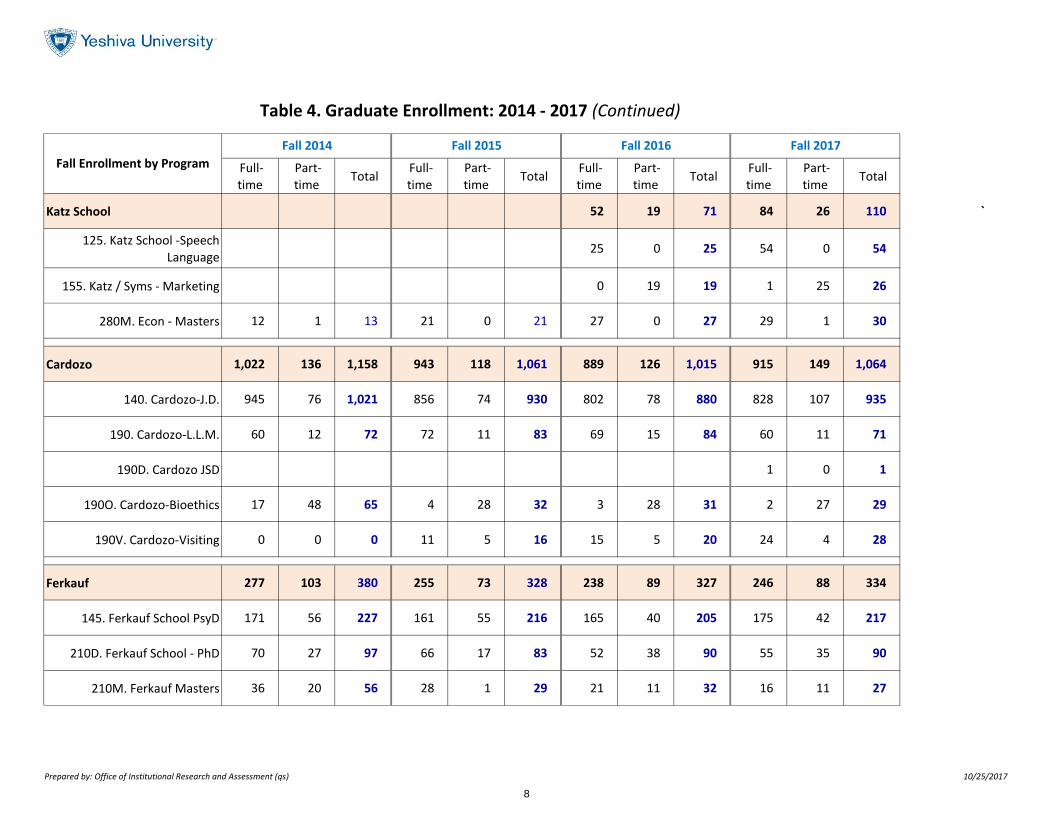
Katz School 52 19 71 84 26 110 `
125. Katz School -Speech Language
25 0 25 54 0 54
155. Katz / Syms - Marketing 0 19 19 1 25 26
280M. Econ - Masters 12 1 13 21 0 21 27 0 27 29 1 30
Cardozo 1,022 136 1,158 943 118 1,061 889 126 1,015 915 149 1,064
140. Cardozo-J.D. 945 76 1,021 856 74 930 802 78 880 828 107 935
190. Cardozo-L.L.M. 60 12 72 72 11 83 69 15 84 60 11 71
190D. Cardozo JSD 1 0 1
190O. Cardozo-Bioethics 17 48 65 4 28 32 3 28 31 2 27 29
190V. Cardozo-Visiting 0 0 0 11 5 16 15 5 20 24 4 28
Ferkauf 277 103 380 255 73 328 238 89 327 246 88 334
145. Ferkauf School PsyD 171 56 227 161 55 216 165 40 205 175 42 217
210D. Ferkauf School - PhD 70 27 97 66 17 83 52 38 90 55 35 90
210M. Ferkauf Masters 36 20 56 28 1 29 21 11 32 16 11 27
Table 4. Graduate Enrollment: 2014 - 2017 (Continued)
Fall Enrollment by Program
Fall 2014 Fall 2015 Fall 2016 Fall 2017
Prepared by: Office of Institutional Research and Assessment (qs) 10/25/2017
8

Full-time
Part-time
Total Full-time
Part-time
Total Full-time
Part-time
Total Full-time
Part-time
Total
Syms 36 4 40 44 7 51 46 5 51 48 2 50
150A. SYMS-MS ACC 24 4 28 30 7 37 24 4 28 23 0 23
150T. Syms- Taxation 14 2 16
150X. SYMS-MBA 12 0 12 14 0 14 22 1 23 11 0 11
Azrieli 78 103 181 66 103 169 23 132 155 23 125 148
180D. Azrieli - Doctoral 56 0 56 50 0 50 7 50 57 1 54 55
180M. Azrieli - Masters 21 81 102 12 76 88 11 59 70 16 49 65
180O. Azrieli - Other 1 22 23 4 27 31 5 23 28 6 22 28
Bernard Revel 40 74 114 31 73 104 14 95 109 9 103 112
200D. Bernard Revel - Doctoral 21 0 21 22 0 22 1 22 23 2 22 24
200M. Bernard Revel - Masters 14 36 50 8 39 47 6 24 30 5 28 33
200N. Bernard Revel - BA/MA 0 13 13 0 15 15 0 21 21 0 22 22
200O. Bernard Revel - Other (NM & Audit)
3 17 20 1 16 17 1 14 15 0 17 17
200R. Bernard Revel - RIETS 2 8 10 0 3 3 6 14 20 2 14 16
Table 4. Graduate Enrollment: 2014 - 2017 (Continued)
Fall Enrollment by Program
Fall 2014 Fall 2015 Fall 2016 Fall 2017
Prepared by: Office of Institutional Research and Assessment (qs) 10/25/2017
9
Full-time
Part-time
Total Full-time
Part-time
Total Full-time
Part-time
Total Full-time
Part-time
Total
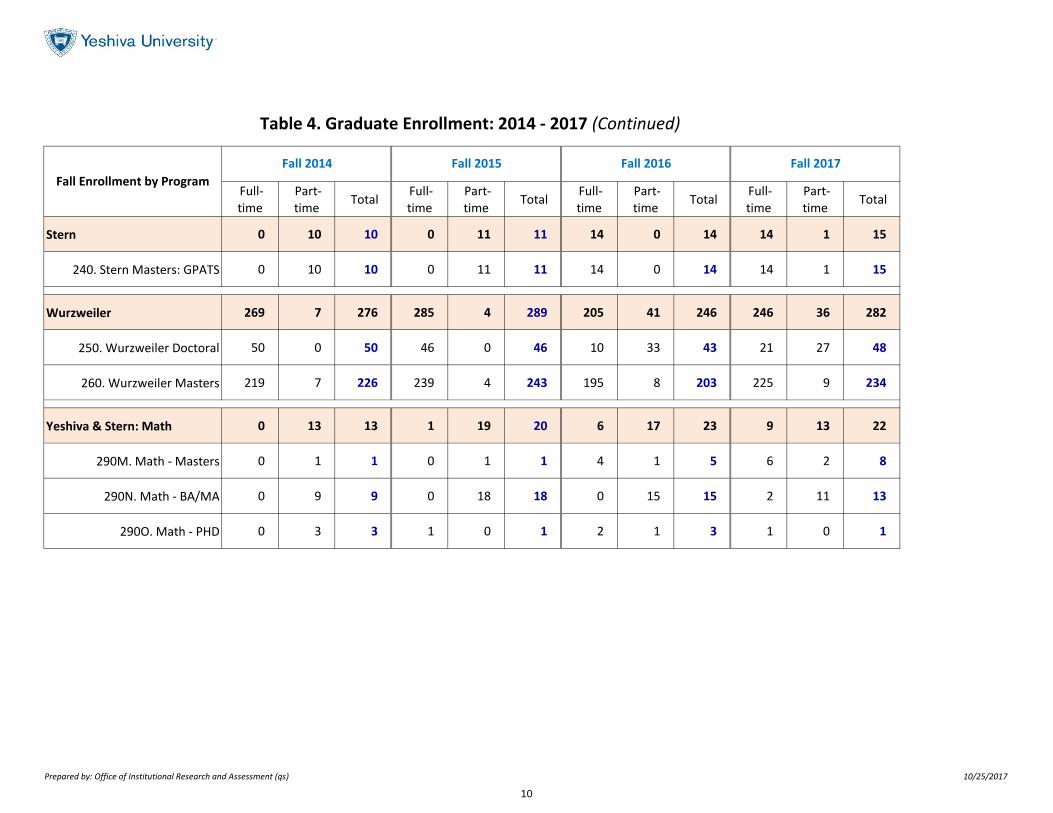
Stern 0 10 10 0 11 11 14 0 14 14 1 15
240. Stern Masters: GPATS 0 10 10 0 11 11 14 0 14 14 1 15
Wurzweiler 269 7 276 285 4 289 205 41 246 246 36 282
250. Wurzweiler Doctoral 50 0 50 46 0 46 10 33 43 21 27 48
260. Wurzweiler Masters 219 7 226 239 4 243 195 8 203 225 9 234
Yeshiva & Stern: Math 0 13 13 1 19 20 6 17 23 9 13 22
290M. Math - Masters 0 1 1 0 1 1 4 1 5 6 2 8
290N. Math - BA/MA 0 9 9 0 18 18 0 15 15 2 11 13
290O. Math - PHD 0 3 3 1 0 1 2 1 3 1 0 1
Table 4. Graduate Enrollment: 2014 - 2017 (Continued)
Fall Enrollment by Program
Fall 2014 Fall 2015 Fall 2016 Fall 2017
Prepared by: Office of Institutional Research and Assessment (qs) 10/25/2017
10

Full-time
Part-time
Total Full-time
Part-time
Total Full-time
Part-time
Total Full-time
Part-time
Total
Einstein 1,062 471 1,533 1,019 466 1,485 983 537 1,520 993 526 1,519
225. AECOM 743 0 743 732 0 732 718 0 718 715 0 715
225M. AECOM MD/PHD in MD phase
48 0 48 47 0 47 45 0 45 55 0 55
225V. AECOM-Visiting 0 440 440 0 430 430 0 504 504 0 494 494
226. CRTP 0 25 25 0 26 26 0 26 26 0 28 28
230D. SG - PHD 208 0 208 182 0 182 162 0 162 172 0 172
230M. SG - MSTP or CE 63 6 69 58 10 68 58 7 65 51 4 55
Table 4. Graduate Enrollment: 2014 - 2017 (Continued)
Fall Enrollment by Program
Fall 2014 Fall 2015 Fall 2016 Fall 2017
Prepared by: Office of Institutional Research and Assessment (qs) 10/25/2017
11