Fact Book 2015Fact Book Fact Book - ZEON · Fact Book May 2015 Fact Book 2015Fact Book ... are not...
28
May 2015 Fact Book 2015
Transcript of Fact Book 2015Fact Book Fact Book - ZEON · Fact Book May 2015 Fact Book 2015Fact Book ... are not...
Fact Book
May 2015
Fact BookFact BookFact Book 2015
FactBook_2015.indd 1FactBook_2015.indd 1 2015/04/29 20:08:352015/04/29 20:08:35
*Each Fiscal year is from April 1st to March 31st .4 1 3 31 1
I. FINANCIAL HIGHLIGHTS
II. COMMON STOCK INFORMATION
III. FINANCIAL SUMMARY
IV. CONSOLIDATED FINANCIAL STATEMENTS
V. SEGMENT INFORMATION
VI. PRODUCTION CAPACITY
CONTENTS
FACT BOOK 2015222222
FactBook_2015.indd 2FactBook_2015.indd 2 2015/04/29 20:08:362015/04/29 20:08:36
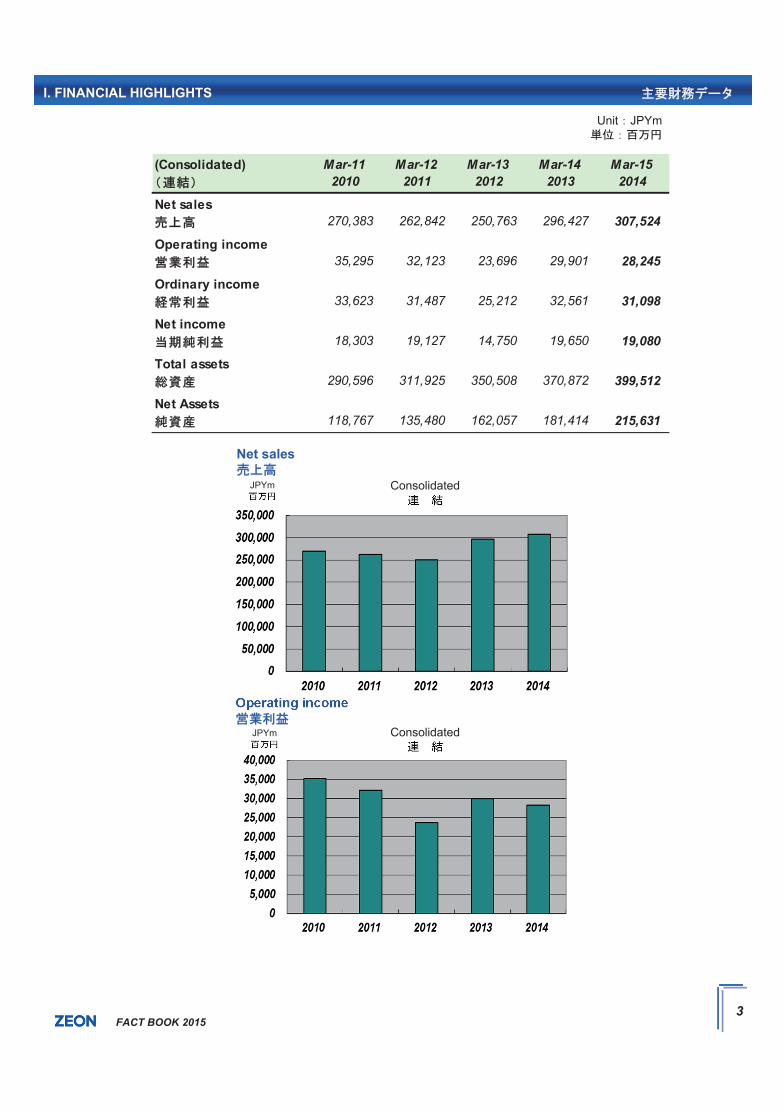
Unit JPYm
Net sales
ConsolidatedJPYm
ConsolidatedJPYm
Operating income
I. FINANCIAL HIGHLIGHTS
(Consolidated) Mar-11 Mar-12 Mar-13 Mar-14 Mar-152010 2011 2012 2013 2014
Net sales270,383 262,842 250,763 296,427 307,524
Operating income35,295 32,123 23,696 29,901 28,245
Ordinary income33,623 31,487 25,212 32,561 31,098
Net income18,303 19,127 14,750 19,650 19,080
Total assets290,596 311,925 350,508 370,872 399,512
Net Assets118,767 135,480 162,057 181,414 215,631
FACT BOOK 2015222223
FactBook_2015.indd 3FactBook_2015.indd 3 2015/04/29 20:08:372015/04/29 20:08:37
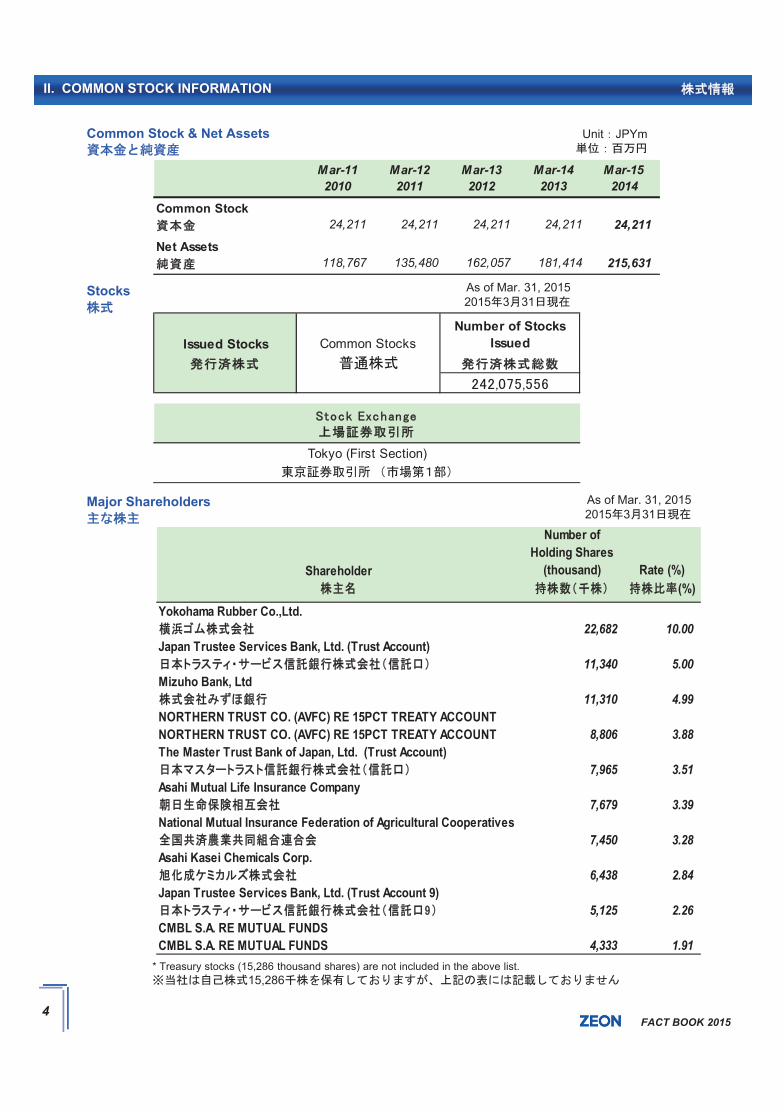
Common Stock & Net Assets Unit JPYm
Stocks As of Mar. 31, 20152015 3 31
Major Shareholders
II. COMMON STOCK INFORMATION
* Treasury stocks (15,286 thousand shares) are not included in the above list.15,286
Issued Stocks Common StocksNumber of Stocks
Issued
Tokyo (First Section)
As of Mar. 31, 20152015 3 31
(%)Yokohama Rubber Co.,Ltd.
22,682 10.00Japan Trustee Services Bank, Ltd. (Trust Account)
11,340 5.00Mizuho Bank, Ltd
11,310 4.99NORTHERN TRUST CO. (AVFC) RE 15PCT TREATY ACCOUNTNORTHERN TRUST CO. (AVFC) RE 15PCT TREATY ACCOUNT 8,806 3.88The Master Trust Bank of Japan, Ltd. (Trust Account)
7,965 3.51Asahi Mutual Life Insurance Company
7,679 3.39National Mutual Insurance Federation of Agricultural Cooperatives
7,450 3.28Asahi Kasei Chemicals Corp.
6,438 2.84Japan Trustee Services Bank, Ltd. (Trust Account 9)
5,125 2.26CMBL S.A. RE MUTUAL FUNDSCMBL S.A. RE MUTUAL FUNDS 4,333 1.91
Shareholder
Number ofHolding Shares
(thousand) Rate (%)
Mar-11 Mar-12 Mar-13 Mar-14 Mar-152010 2011 2012 2013 2014
Common Stock24,211 24,211 24,211 24,211 24,211
Net Assets118,767 135,480 162,057 181,414 215,631
FACT BOOK 2015222224
FactBook_2015.indd 4FactBook_2015.indd 4 2015/04/29 20:08:382015/04/29 20:08:38
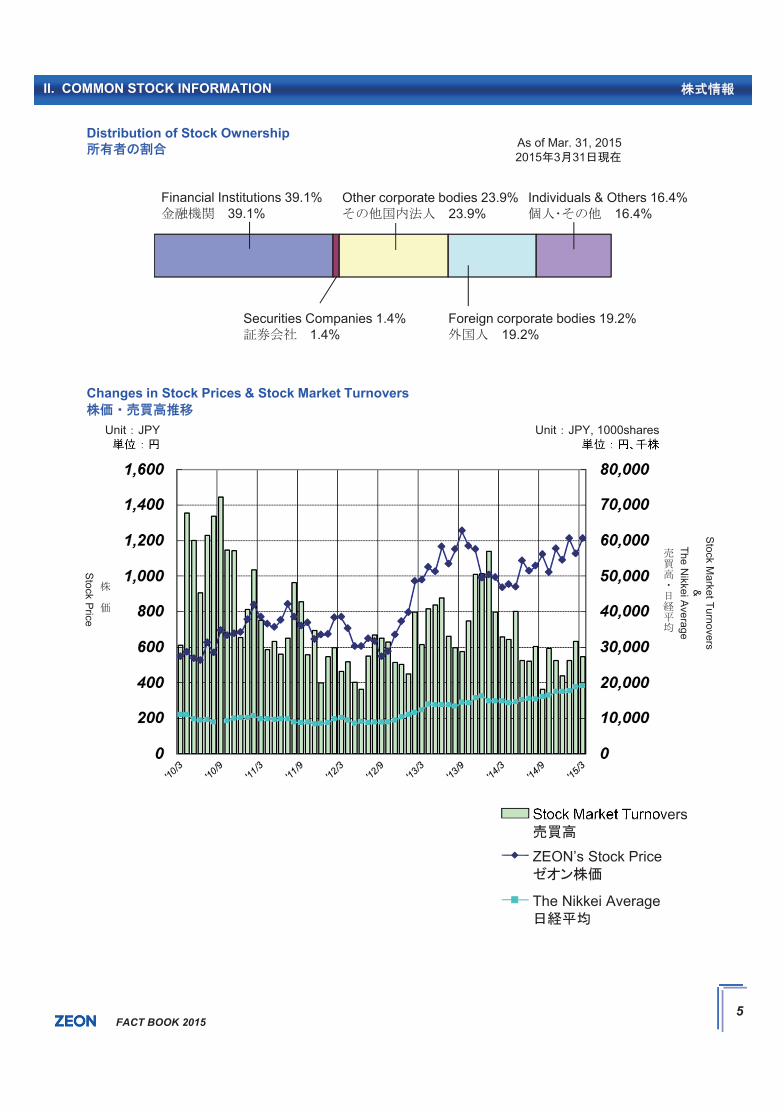
Changes in Stock Prices & Stock Market Turnovers
Unit JPY, 1000sharesUnit JPY
Financial Institutions 39.1%39.1%
Other corporate bodies 23.9%23.9%
Individuals & Others 16.4%16.4%
Securities Companies 1.4%1.4%
Foreign corporate bodies 19.2%19.2%
Distribution of Stock OwnershipAs of Mar. 31, 20152015 3 31
Stock M
arket Turnovers&
The Nikkei A
verage
Stock P
rice
Stock Market Turnovers
ZEON’s Stock Price
The Nikkei Average
II. COMMON STOCK INFORMATION
FACT BOOK 2015222225
FactBook_2015.indd 5FactBook_2015.indd 5 2015/04/29 20:08:402015/04/29 20:08:40
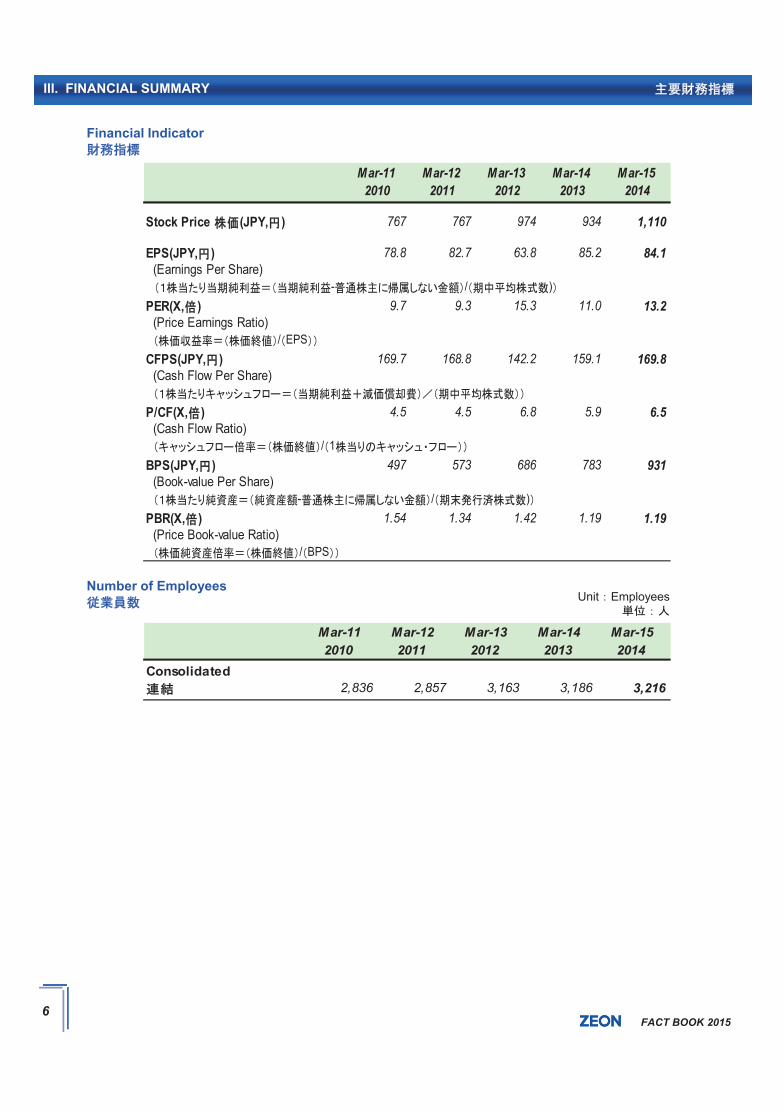
Financial Indicator
Number of EmployeesUnit Employees
III. FINANCIAL SUMMARY
Mar-11 Mar-12 Mar-13 Mar-14 Mar-152010 2011 2012 2013 2014
Consolidated2,836 2,857 3,163 3,186 3,216
Mar-11 Mar-12 Mar-13 Mar-14 Mar-152010 2011 2012 2013 2014
EPS(JPY, ) 78.8 82.7 63.8 85.2 84.1 (Earnings Per Share)
- / )PER(X, ) 9.7 9.3 15.3 11.0 13.2 (Price Earnings Ratio)
/ EPSCFPS(JPY, ) 169.7 168.8 142.2 159.1 169.8 (Cash Flow Per Share)
P/CF(X, ) 4.5 4.5 6.8 5.9 6.5 (Cash Flow Ratio)
/ 1BPS(JPY, ) 497 573 686 783 931 (Book-value Per Share)
- / )PBR(X, ) 1.54 1.34 1.42 1.19 1.19 (Price Book-value Ratio)
/ BPS
767Stock Price (JPY, ) 1,110974 934767
FACT BOOK 2015222226
FactBook_2015.indd 6FactBook_2015.indd 6 2015/04/29 20:08:412015/04/29 20:08:41
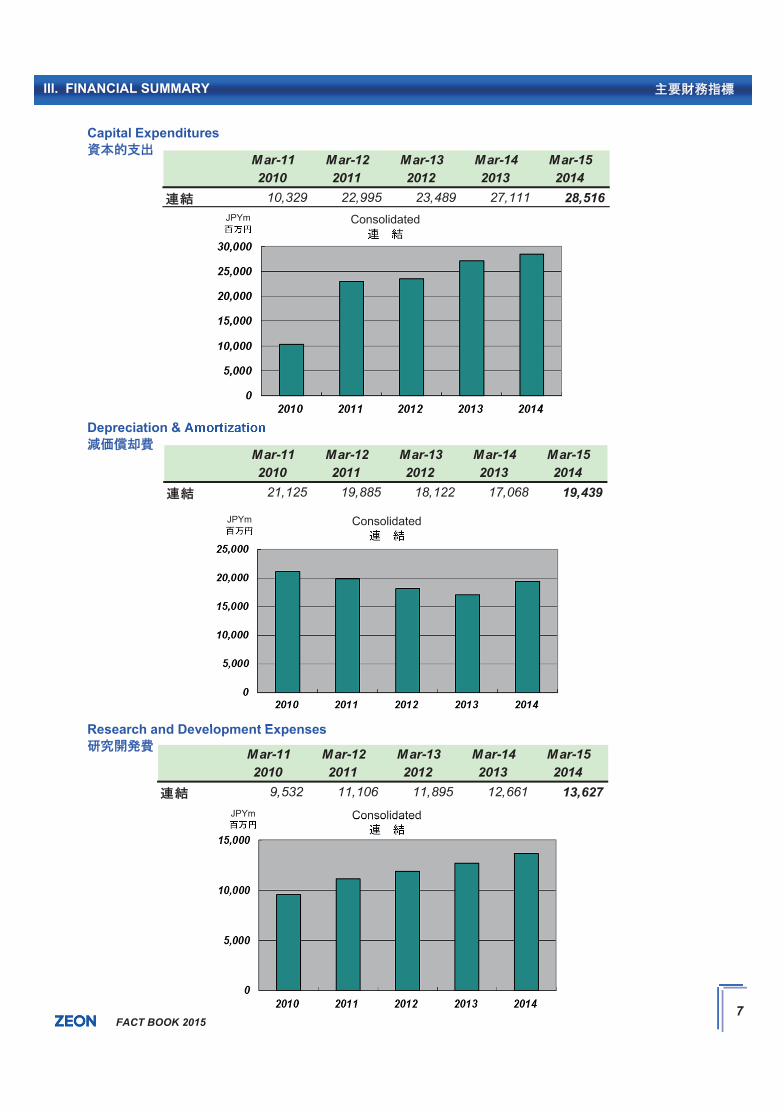
Capital Expenditures
ConsolidatedJPYm
Depreciation & Amortization
Research and Development Expenses
ConsolidatedJPYm
ConsolidatedJPYm
III. FINANCIAL SUMMARY
Mar-11 Mar-12 Mar-13 Mar-14 Mar-152010 2011 2012 2013 201410,329 22,995 23,489 27,111 28,516
Mar-11 Mar-12 Mar-13 Mar-14 Mar-152010 2011 2012 2013 20149,532 11,106 11,895 12,661 13,627
Mar-11 Mar-12 Mar-13 Mar-14 Mar-152010 2011 2012 2013 201421,125 19,885 18,122 17,068 19,439
FACT BOOK 2015222227
FactBook_2015.indd 7FactBook_2015.indd 7 2015/04/29 20:08:432015/04/29 20:08:43
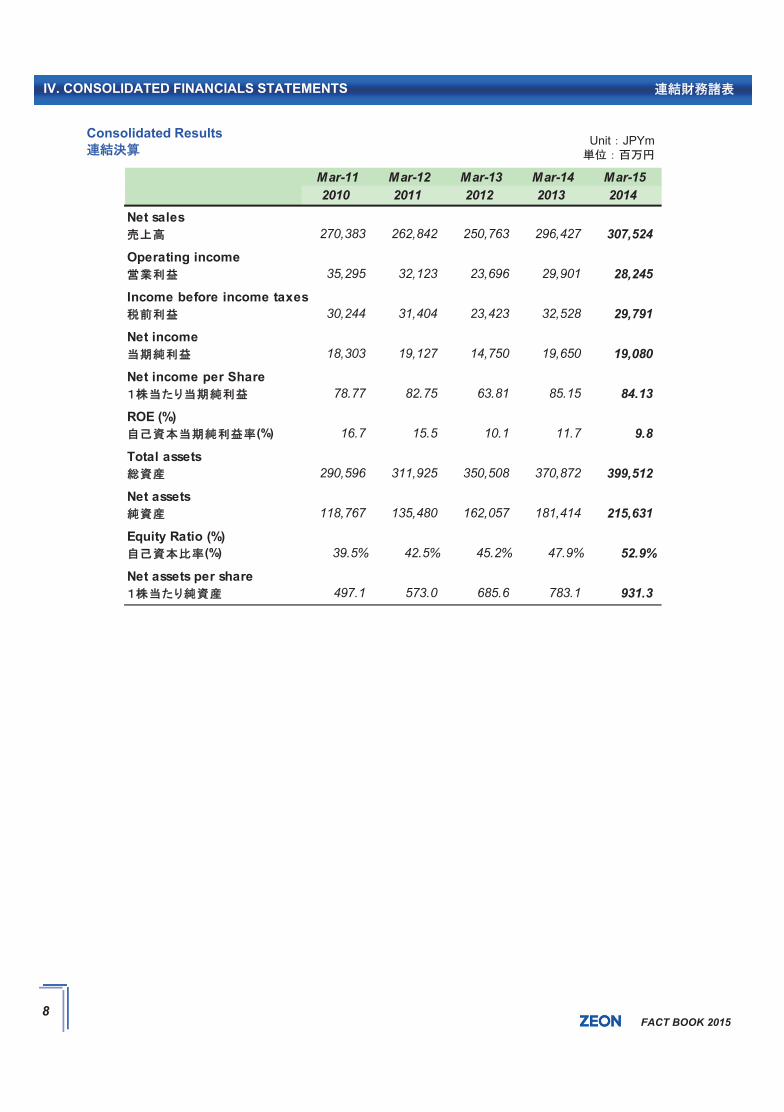
Consolidated Results Unit JPYm
IV. CONSOLIDATED FINANCIALS STATEMENTS
Mar-11 Mar-12 Mar-13 Mar-14 Mar-152010 2011 2012 2013 2014
Net sales270,383 262,842 250,763 296,427 307,524
Operating income35,295 32,123 23,696 29,901 28,245
Income before income taxes30,244 31,404 23,423 32,528 29,791
Net income18,303 19,127 14,750 19,650 19,080
Net income per Share78.77 82.75 63.81 85.15 84.13
ROE (%)(%) 16.7 15.5 10.1 11.7 9.8
Total assets290,596 311,925 350,508 370,872 399,512
Net assets118,767 135,480 162,057 181,414 215,631
Equity Ratio (%)(%) 39.5% 42.5% 45.2% 47.9% 52.9%
Net assets per share 497.1 573.0 685.6 783.1 931.3
FACT BOOK 2015222228
FactBook_2015.indd 8FactBook_2015.indd 8 2015/04/29 20:08:442015/04/29 20:08:44
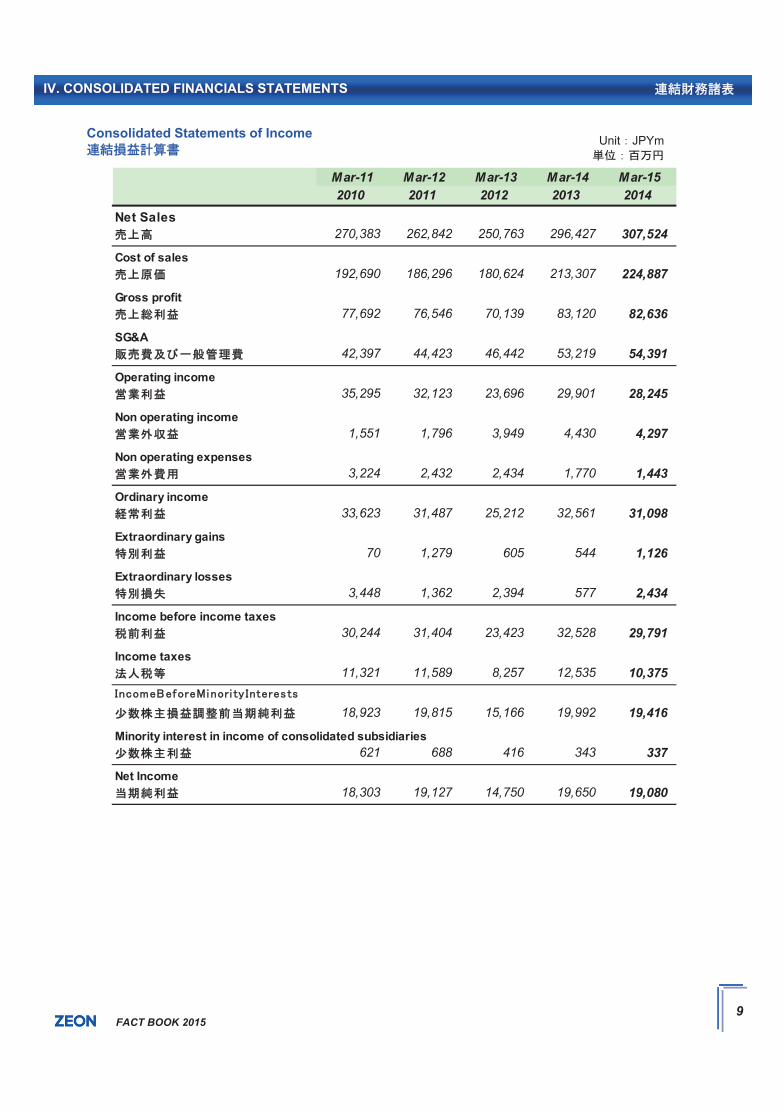
Consolidated Statements of Income Unit JPYm
IV. CONSOLIDATED FINANCIALS STATEMENTS
Mar-11 Mar-12 Mar-13 Mar-14 Mar-152010 2011 2012 2013 2014
Net Sales270,383 262,842 250,763 296,427 307,524
Cost of sales192,690 186,296 180,624 213,307 224,887
Gross profit77,692 76,546 70,139 83,120 82,636
SG&A42,397 44,423 46,442 53,219 54,391
Operating income35,295 32,123 23,696 29,901 28,245
Non operating income1,551 1,796 3,949 4,430 4,297
Non operating expenses3,224 2,432 2,434 1,770 1,443
Ordinary income33,623 31,487 25,212 32,561 31,098
Extraordinary gains70 1,279 605 544 1,126
Extraordinary losses3,448 1,362 2,394 577 2,434
Income before income taxes30,244 31,404 23,423 32,528 29,791
Income taxes11,321 11,589 8,257 12,535 10,375
18,923 19,815 15,166 19,992 19,416
Minority interest in income of consolidated subsidiaries621 688 416 343 337
Net Income18,303 19,127 14,750 19,650 19,080
FACT BOOK 2015222229
FactBook_2015.indd 9FactBook_2015.indd 9 2015/04/29 20:08:452015/04/29 20:08:45
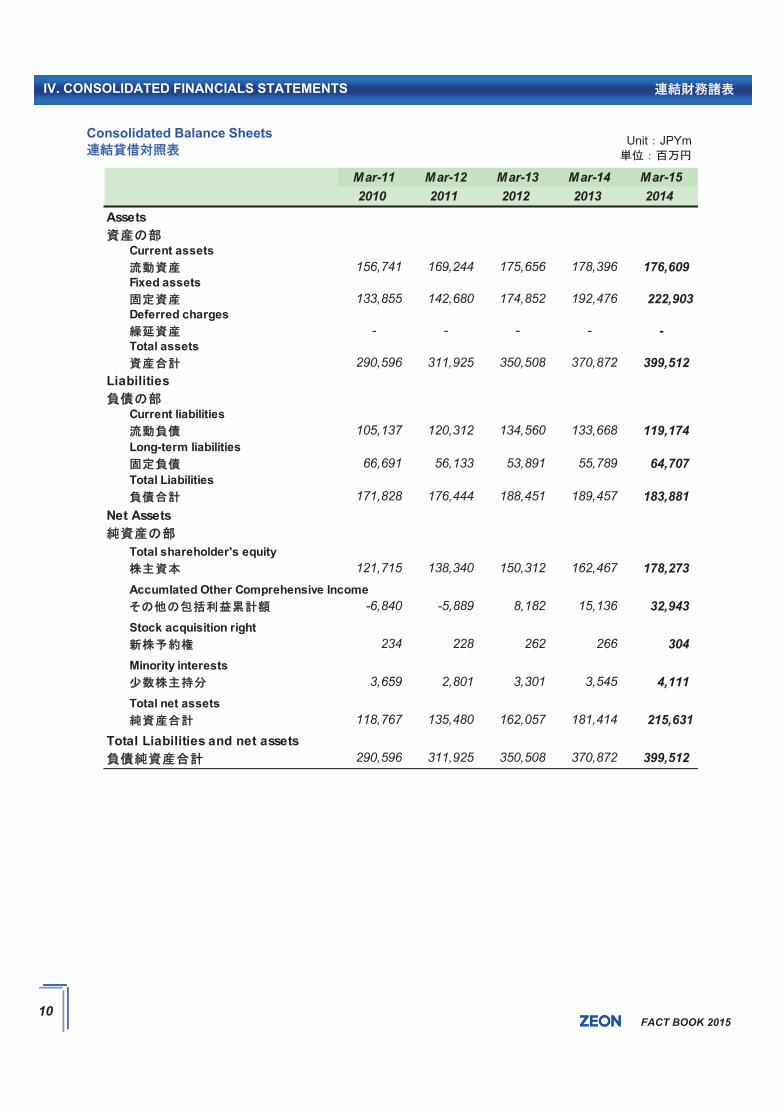
Unit JPYmConsolidated Balance Sheets
IV. CONSOLIDATED FINANCIALS STATEMENTS
Mar-11 Mar-12 Mar-13 Mar-14 Mar-152010 2011 2012 2013 2014
Current assets156,741 169,244 175,656 178,396 176,609
Fixed assets133,855 142,680 174,852 192,476 222,903
Deferred charges- - - - -
Total assets290,596 311,925 350,508 370,872 399,512
Current liabilities105,137 120,312 134,560 133,668 119,174
Long-term liabilities66,691 56,133 53,891 55,789 64,707
Total Liabilities171,828 176,444 188,451 189,457 183,881
Total shareholder's equity121,715 138,340 150,312 162,467 178,273
Accumlated Other Comprehensive Income-6,840 -5,889 8,182 15,136 32,943
Stock acquisition right234 228 262 266 304
Minority interests3,659 2,801 3,301 3,545 4,111
Total net assets118,767 135,480 162,057 181,414 215,631
Total Liabilities and net assets290,596 311,925 350,508 370,872 399,512
Assets
Net Assets
Liabilities
FACT BOOK 20152222210
FactBook_2015.indd 10FactBook_2015.indd 10 2015/04/29 20:08:452015/04/29 20:08:45
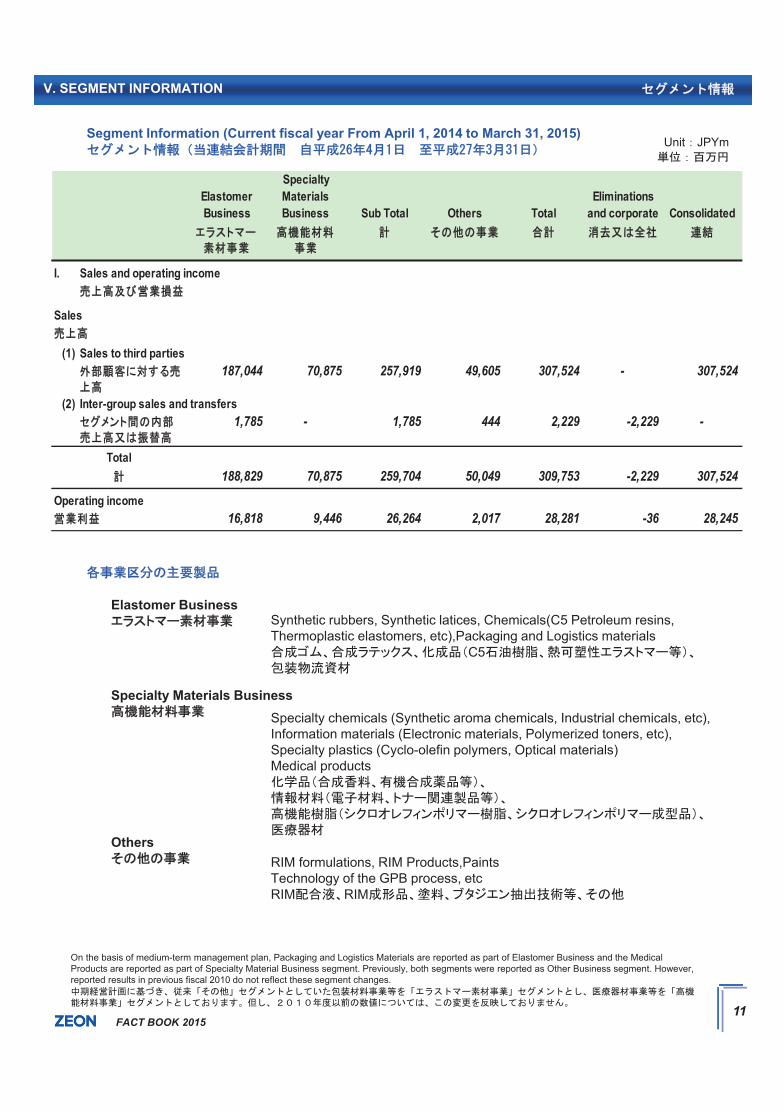
Segment Information (Current fiscal year From April 1, 2014 to March 31, 2015)Unit JPYm
V. SEGMENT INFORMATION
Elastomer BusinessSynthetic rubbers, Synthetic latices, Chemicals(C5 Petroleum resins, Thermoplastic elastomers, etc),Packaging and Logistics materials
C5
Specialty Materials Business
OthersRIM formulations, RIM Products,Paints Technology of the GPB process, etc RIM RIM
Specialty chemicals (Synthetic aroma chemicals, Industrial chemicals, etc), Information materials (Electronic materials, Polymerized toners, etc), Specialty plastics (Cyclo-olefin polymers, Optical materials)Medical products
On the basis of medium-term management plan, Packaging and Logistics Materials are reported as part of Elastomer Business and the Medical Products are reported as part of Specialty Material Business segment. Previously, both segments were reported as Other Business segment. However, reported results in previous fiscal 2010 do not reflect these segment changes.
ElastomerBusiness
SpecialtyMaterialsBusiness Sub Total Others Total
Eliminationsand corporate Consolidated
I. Sales and operating income
Sales
(1) Sales to third parties
(2) Inter-group sales and transfers
188,829 70,875 259,704 50,049 309,753 -2,229 307,524
16,818 9,446 26,264 2,017 28,281 -36 28,245
-2,229
Operating income
444
307,52470,875
1,785 2,229 -
Total
49,605257,919
1,785
307,524
-
187,044 -
FACT BOOK 20152222211
FactBook_2015.indd 11FactBook_2015.indd 11 2015/04/29 20:08:462015/04/29 20:08:46
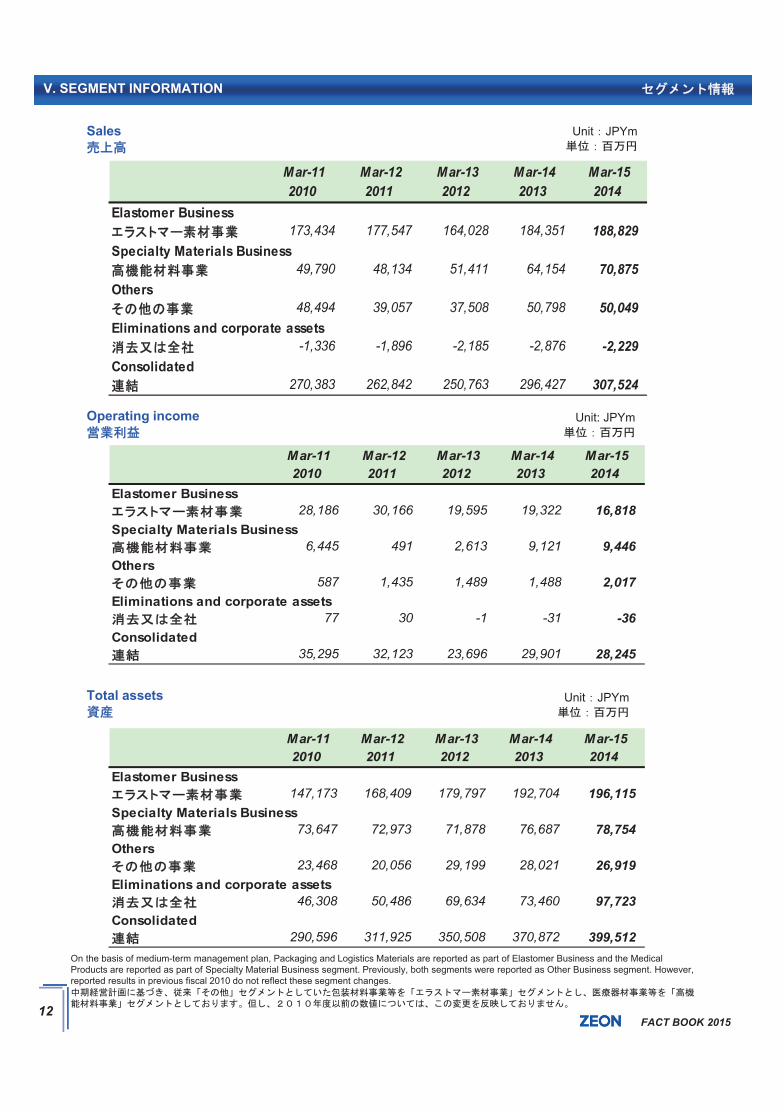
Sales Unit JPYm
Operating income
V. SEGMENT INFORMATION
Total assets
Unit: JPYm
Unit JPYm
On the basis of medium-term management plan, Packaging and Logistics Materials are reported as part of Elastomer Business and the Medical Products are reported as part of Specialty Material Business segment. Previously, both segments were reported as Other Business segment. However, reported results in previous fiscal 2010 do not reflect these segment changes.
Mar-11 Mar-12 Mar-13 Mar-14 Mar-152010 2011 2012 2013 2014
Elastomer Business173,434 177,547 164,028 184,351 188,829
Specialty Materials Business49,790 48,134 51,411 64,154 70,875
Others48,494 39,057 37,508 50,798 50,049
Eliminations and corporate assets-1,336 -1,896 -2,185 -2,876 -2,229
Consolidated270,383 262,842 250,763 296,427 307,524
Mar-11 Mar-12 Mar-13 Mar-14 Mar-152010 2011 2012 2013 2014
Elastomer Business28,186 30,166 19,595 19,322 16,818
Specialty Materials Business6,445 491 2,613 9,121 9,446
Others587 1,435 1,489 1,488 2,017
Eliminations and corporate assets77 30 -1 -31 -36
Consolidated35,295 32,123 23,696 29,901 28,245
Mar-11 Mar-12 Mar-13 Mar-14 Mar-152010 2011 2012 2013 2014
Elastomer Business147,173 168,409 179,797 192,704 196,115
Specialty Materials Business73,647 72,973 71,878 76,687 78,754
Others23,468 20,056 29,199 28,021 26,919
Eliminations and corporate assets46,308 50,486 69,634 73,460 97,723
Consolidated290,596 311,925 350,508 370,872 399,512
FACT BOOK 20152222212
FactBook_2015.indd 12FactBook_2015.indd 12 2015/04/29 20:08:472015/04/29 20:08:47
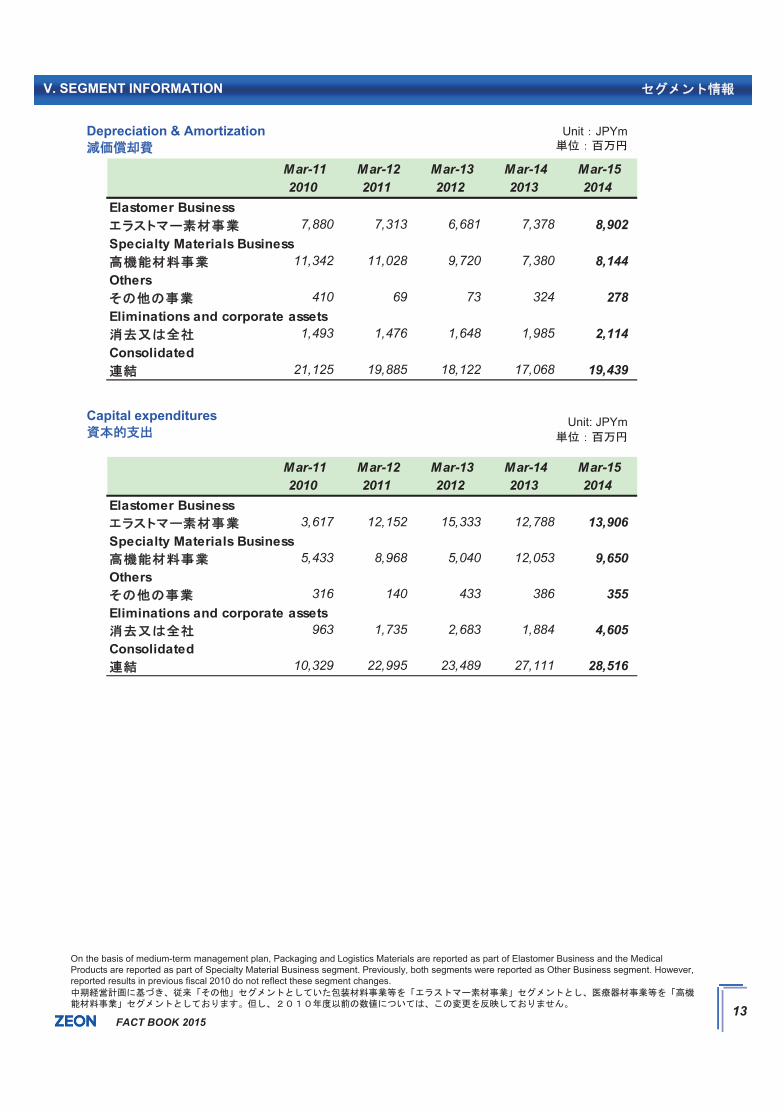
Depreciation & Amortization Unit JPYm
V. SEGMENT INFORMATION
Capital expenditures Unit: JPYm
On the basis of medium-term management plan, Packaging and Logistics Materials are reported as part of Elastomer Business and the Medical Products are reported as part of Specialty Material Business segment. Previously, both segments were reported as Other Business segment. However, reported results in previous fiscal 2010 do not reflect these segment changes.
Mar-11 Mar-12 Mar-13 Mar-14 Mar-152010 2011 2012 2013 2014
Elastomer Business7,880 7,313 6,681 7,378 8,902
Specialty Materials Business11,342 11,028 9,720 7,380 8,144
Others410 69 73 324 278
Eliminations and corporate assets1,493 1,476 1,648 1,985 2,114
Consolidated21,125 19,885 18,122 17,068 19,439
Mar-11 Mar-12 Mar-13 Mar-14 Mar-152010 2011 2012 2013 2014
Elastomer Business3,617 12,152 15,333 12,788 13,906
Specialty Materials Business5,433 8,968 5,040 12,053 9,650
Others316 140 433 386 355
Eliminations and corporate assets963 1,735 2,683 1,884 4,605
Consolidated10,329 22,995 23,489 27,111 28,516
FACT BOOK 20152222213
FactBook_2015.indd 13FactBook_2015.indd 13 2015/04/29 20:08:482015/04/29 20:08:48
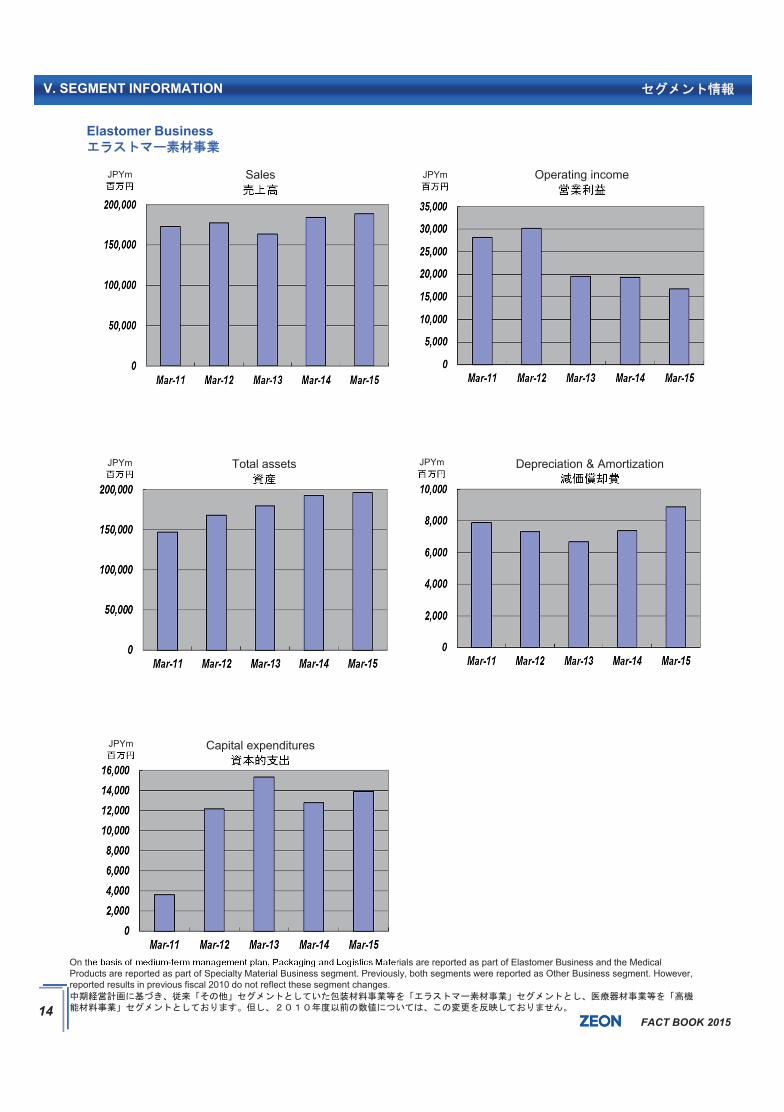
Elastomer Business
Sales Operating incomeJPYm
JPYm
JPYm
JPYmTotal assets Depreciation & Amortization
JPYm Capital expenditures
V. SEGMENT INFORMATION
On the basis of medium-term management plan, Packaging and Logistics Materials are reported as part of Elastomer Business and the Medical Products are reported as part of Specialty Material Business segment. Previously, both segments were reported as Other Business segment. However, reported results in previous fiscal 2010 do not reflect these segment changes.
FACT BOOK 20152222214
FactBook_2015.indd 14FactBook_2015.indd 14 2015/04/29 20:08:492015/04/29 20:08:49
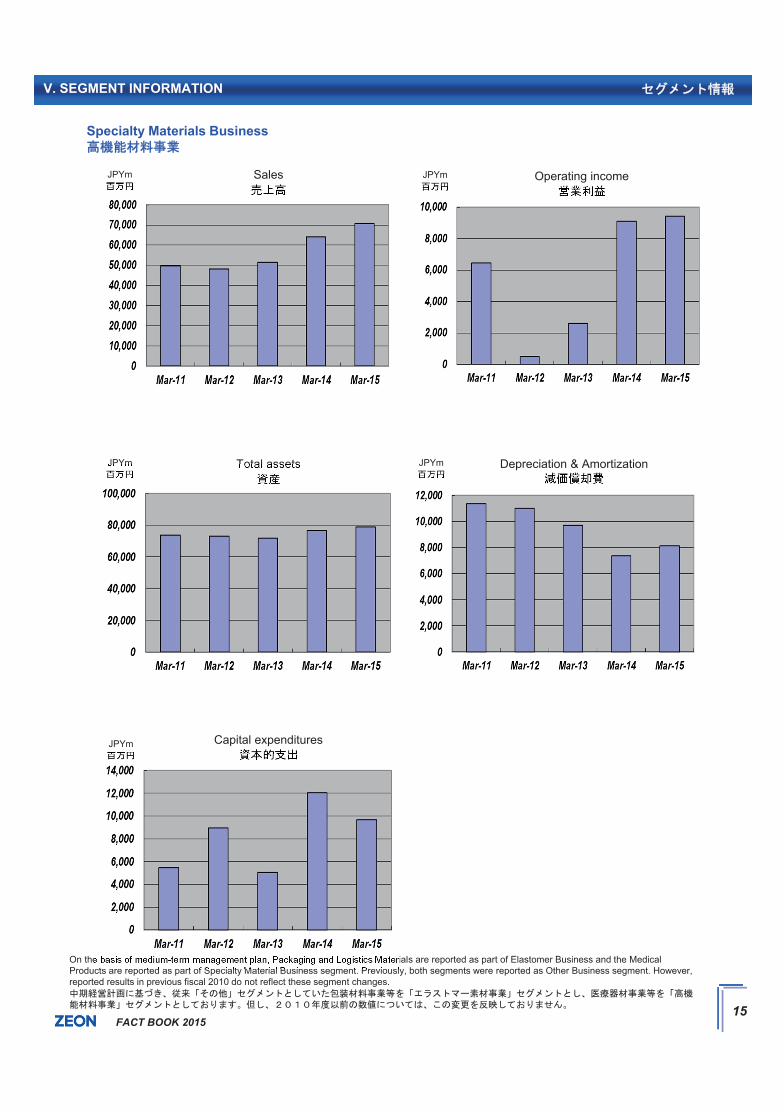
Specialty Materials Business
Sales Operating incomeJPYm
JPYm
JPYm
JPYmTotal assets Depreciation & Amortization
JPYm Capital expenditures
V. SEGMENT INFORMATION
On the basis of medium-term management plan, Packaging and Logistics Materials are reported as part of Elastomer Business and the Medical Products are reported as part of Specialty Material Business segment. Previously, both segments were reported as Other Business segment. However, reported results in previous fiscal 2010 do not reflect these segment changes.
FACT BOOK 20152222215
FactBook_2015.indd 15FactBook_2015.indd 15 2015/04/29 20:08:522015/04/29 20:08:52
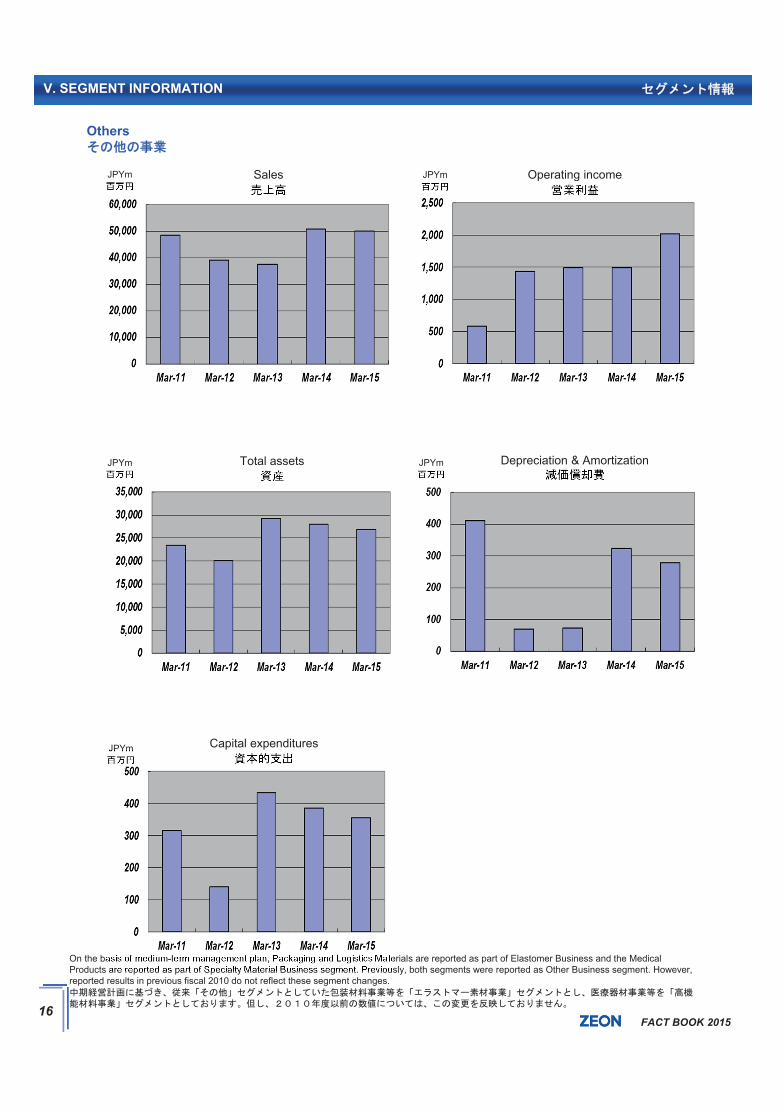
Others
Sales Operating incomeJPYm
JPYm
JPYm
JPYmTotal assets Depreciation & Amortization
JPYm Capital expenditures
V. SEGMENT INFORMATION
On the basis of medium-term management plan, Packaging and Logistics Materials are reported as part of Elastomer Business and the Medical Products are reported as part of Specialty Material Business segment. Previously, both segments were reported as Other Business segment. However, reported results in previous fiscal 2010 do not reflect these segment changes.
FACT BOOK 20152222216
FactBook_2015.indd 16FactBook_2015.indd 16 2015/04/29 20:08:532015/04/29 20:08:53
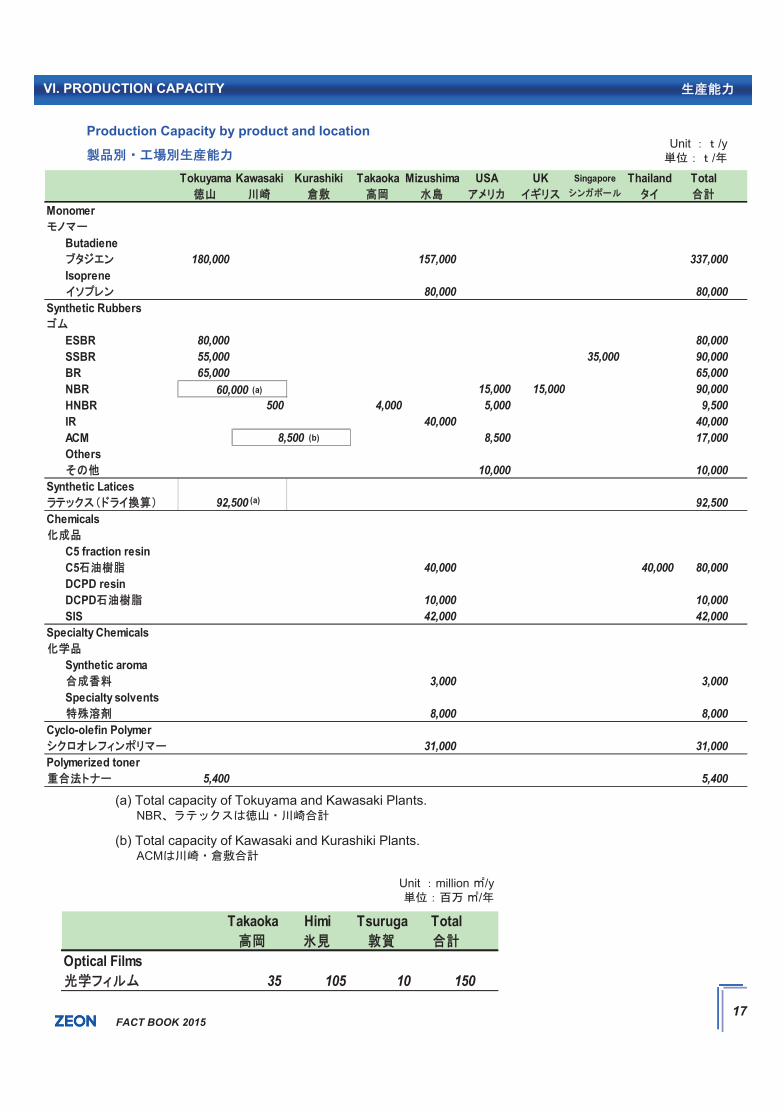
Production Capacity by product and locationUnit /y
/
(a) Total capacity of Tokuyama and Kawasaki Plants.NBR
VI. PRODUCTION CAPACITY
Unit million /y/
(b) Total capacity of Kawasaki and Kurashiki Plants.ACM
Takaoka Himi Tsuruga Total
Optical Films35 105 10 150
Tokuyama Kawasaki Kurashiki Takaoka Mizushima USA UK Singapore Thailand Total
Monomer
Butadiene180,000 157,000 337,000
Isoprene80,000 80,000
Synthetic Rubbers
ESBR 80,000 80,000SSBR 55,000 35,000 90,000BR 65,000 65,000NBR 15,000 15,000 90,000HNBR 500 4,000 5,000 9,500IR 40,000 40,000ACM 8,500 17,000Others
10,000 10,000Synthetic Latices
92,500Chemicals
C5 fraction resinC5 40,000 40,000 80,000DCPD resinDCPD 10,000 10,000SIS 42,000 42,000
Specialty Chemicals
Synthetic aroma3,000 3,000
Specialty solvents8,000 8,000
Cyclo-olefin Polymer31,000 31,000
Polymerized toner5,400 5,400
60,000
92,500
8,500
(a)
(a)
(b)
FACT BOOK 20152222217
FactBook_2015.indd 17FactBook_2015.indd 17 2015/04/29 20:08:552015/04/29 20:08:55

FACT BOOK 20151818181818
FactBook_2015.indd 18FactBook_2015.indd 18 2015/04/29 20:08:562015/04/29 20:08:56
1919191919
References
*Each Fiscal year is from April 1st to March 31st .4 1 3 31 1
FACT BOOK 201522222
FactBook_2015.indd 19FactBook_2015.indd 19 2015/04/29 20:08:562015/04/29 20:08:56
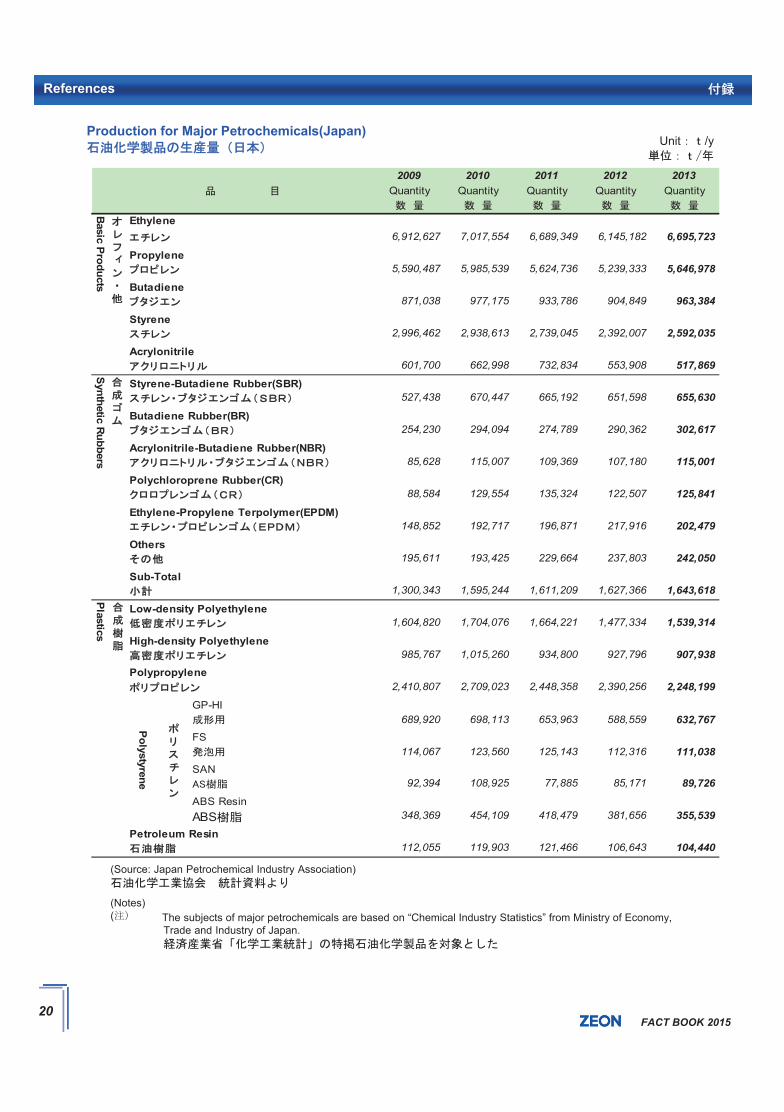
Production for Major Petrochemicals(Japan)Unit /y
(Notes)( The subjects of major petrochemicals are based on “Chemical Industry Statistics” from Ministry of Economy,
Trade and Industry of Japan.
(Source: Japan Petrochemical Industry Association)
References
2009 2010 2011 2012 2013Quantity Quantity Quantity Quantity Quantity
6,912,627 7,017,554 6,689,349 6,145,182 6,695,723
5,590,487 5,985,539 5,624,736 5,239,333 5,646,978
871,038 977,175 933,786 904,849 963,384
2,996,462 2,938,613 2,739,045 2,392,007 2,592,035
601,700 662,998 732,834 553,908 517,869
527,438 670,447 665,192 651,598 655,630
254,230 294,094 274,789 290,362 302,617
85,628 115,007 109,369 107,180 115,001
88,584 129,554 135,324 122,507 125,841
148,852 192,717 196,871 217,916 202,479
195,611 193,425 229,664 237,803 242,050
1,300,343 1,595,244 1,611,209 1,627,366 1,643,618
1,604,820 1,704,076 1,664,221 1,477,334 1,539,314
985,767 1,015,260 934,800 927,796 907,938
2,410,807 2,709,023 2,448,358 2,390,256 2,248,199
GP-HI689,920 698,113 653,963 588,559 632,767
FS114,067 123,560 125,143 112,316 111,038
SAN92,394 108,925 77,885 85,171 89,726
ABS ResinABS 348,369 454,109 418,479 381,656 355,539
112,055 119,903 121,466 106,643 104,440
Polystyrene
Low-density Polyethylene
Polypropylene
Petroleum Resin
Plastics
High-density Polyethylene
Butadiene Rubber(BR)
Basic ProductsSynthetic Rubbers
Ethylene
Propylene
Butadiene
Styrene
Acrylonitrile
Polychloroprene Rubber(CR)
Styrene-Butadiene Rubber(SBR)
Acrylonitrile-Butadiene Rubber(NBR)
Ethylene-Propylene Terpolymer(EPDM)
Others
Sub-Total
FACT BOOK 20152222220
FactBook_2015.indd 20FactBook_2015.indd 20 2015/04/29 20:08:572015/04/29 20:08:57
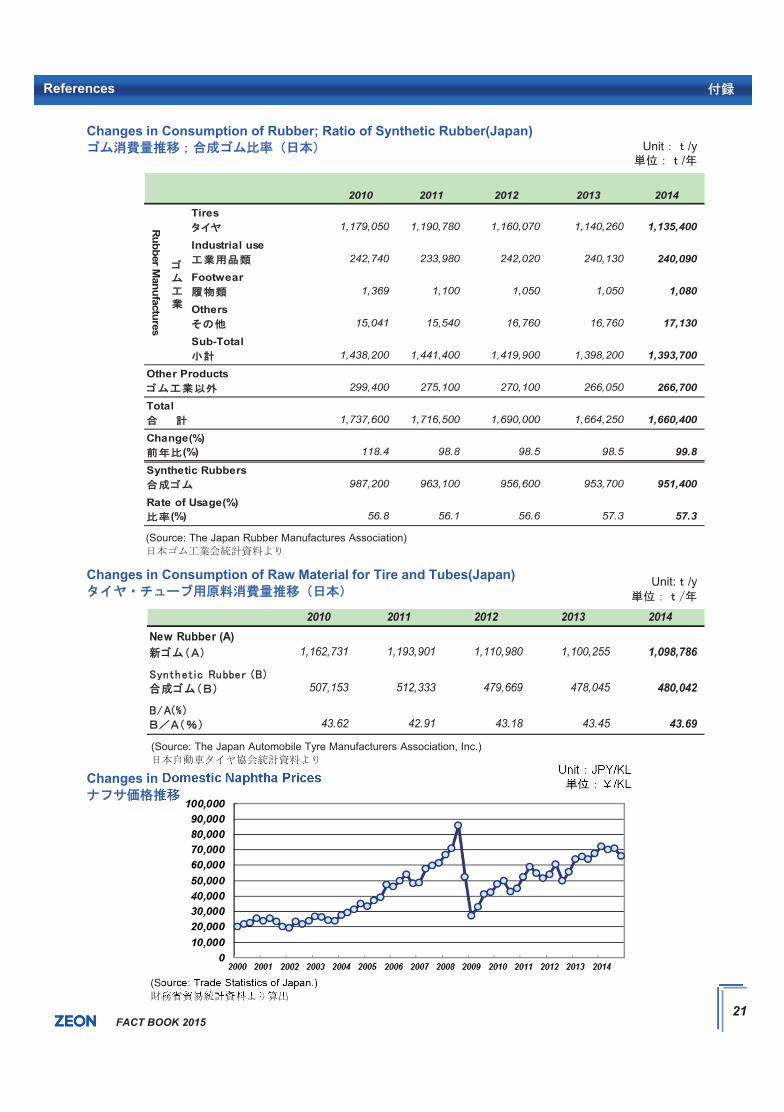
Changes in Consumption of Rubber; Ratio of Synthetic Rubber(Japan)Unit /y
/
(Source: The Japan Rubber Manufactures Association)
Changes in Consumption of Raw Material for Tire and Tubes(Japan) Unit: /y
(Source: The Japan Automobile Tyre Manufacturers Association, Inc.)
Changes in Domestic Naphtha Prices Unit JPY/KL/KL
References
(Source: Trade Statistics of Japan.)
2010 2011 2012 2013 2014Tires
1,179,050 1,190,780 1,160,070 1,140,260 1,135,400
Industrial use242,740 233,980 242,020 240,130 240,090
Footwear1,369 1,100 1,050 1,050 1,080
Others15,041 15,540 16,760 16,760 17,130
Sub-Total1,438,200 1,441,400 1,419,900 1,398,200 1,393,700
299,400 275,100 270,100 266,050 266,700
1,737,600 1,716,500 1,690,000 1,664,250 1,660,400
118.4 98.8 98.5 98.5 99.8
987,200 963,100 956,600 953,700 951,400
56.8 56.1 56.6 57.3 57.3
Rubber Manufactures
Other Products
(%)
Total
Change(%)(%)
Synthetic Rubbers
Rate of Usage(%)
2010 2011 2012 2013 2014New Rubber (A)
1,162,731 1,193,901 1,110,980 1,100,255 1,098,786
507,153 512,333 479,669 478,045 480,042
43.62 42.91 43.18 43.45 43.69
FACT BOOK 20152222221
FactBook_2015.indd 21FactBook_2015.indd 21 2015/04/29 20:08:592015/04/29 20:08:59
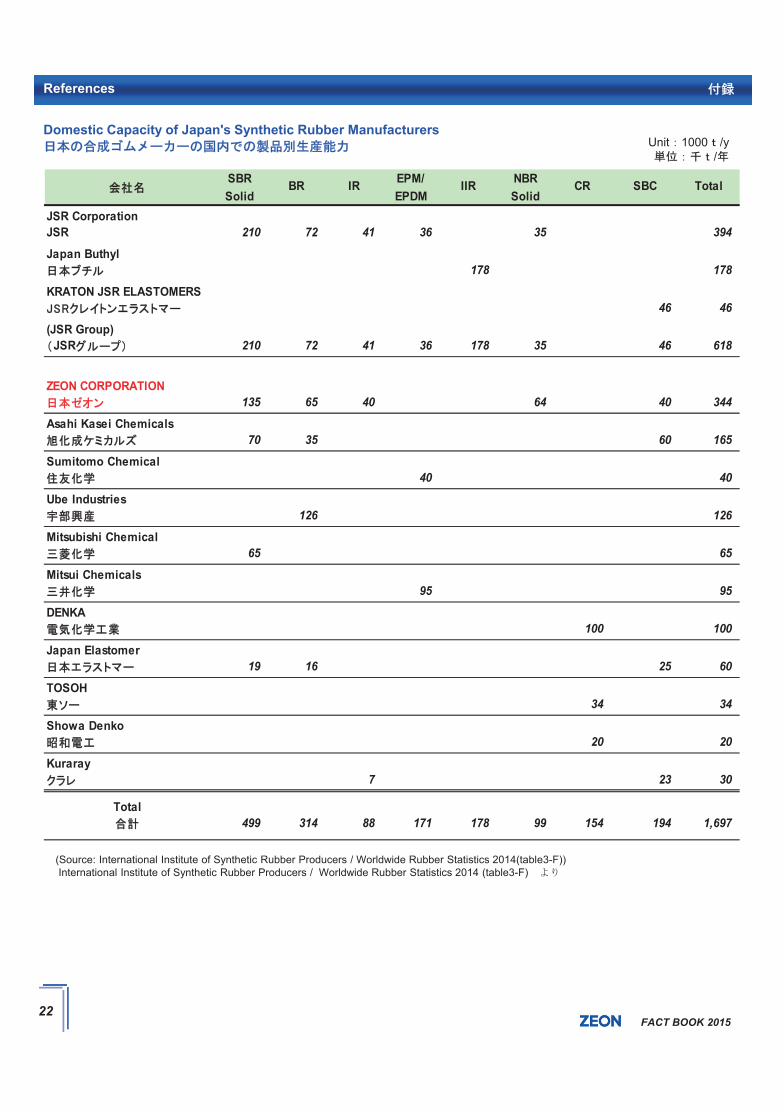
Domestic Capacity of Japan's Synthetic Rubber ManufacturersUnit 1000 /y
/
References
(Source: International Institute of Synthetic Rubber Producers / Worldwide Rubber Statistics 2014(table3-F)) International Institute of Synthetic Rubber Producers / Worldwide Rubber Statistics 2014 (table3-F)
SBR EPM/ NBRSolid EPDM Solid
JSR CorporationJSR 210 72 41 36 35 394
Japan Buthyl178 178
KRATON JSR ELASTOMERS46 46
(JSR Group)JSR 210 72 41 36 178 35 46 618
135 65 40 64 40 344
Asahi Kasei Chemicals70 35 60 165
Sumitomo Chemical40 40
Ube Industries126 126
Mitsubishi Chemical65 65
Mitsui Chemicals95 95
DENKA100 100
Japan Elastomer19 16 25 60
TOSOH34 34
Showa Denko20 20
Kuraray7 23 30
Total499 314 88 171 178 99 154 194 1,697
ZEON CORPORATION
CR TotalBR IR IIR SBC
FACT BOOK 20152222222
FactBook_2015.indd 22FactBook_2015.indd 22 2015/04/29 20:09:002015/04/29 20:09:00
References
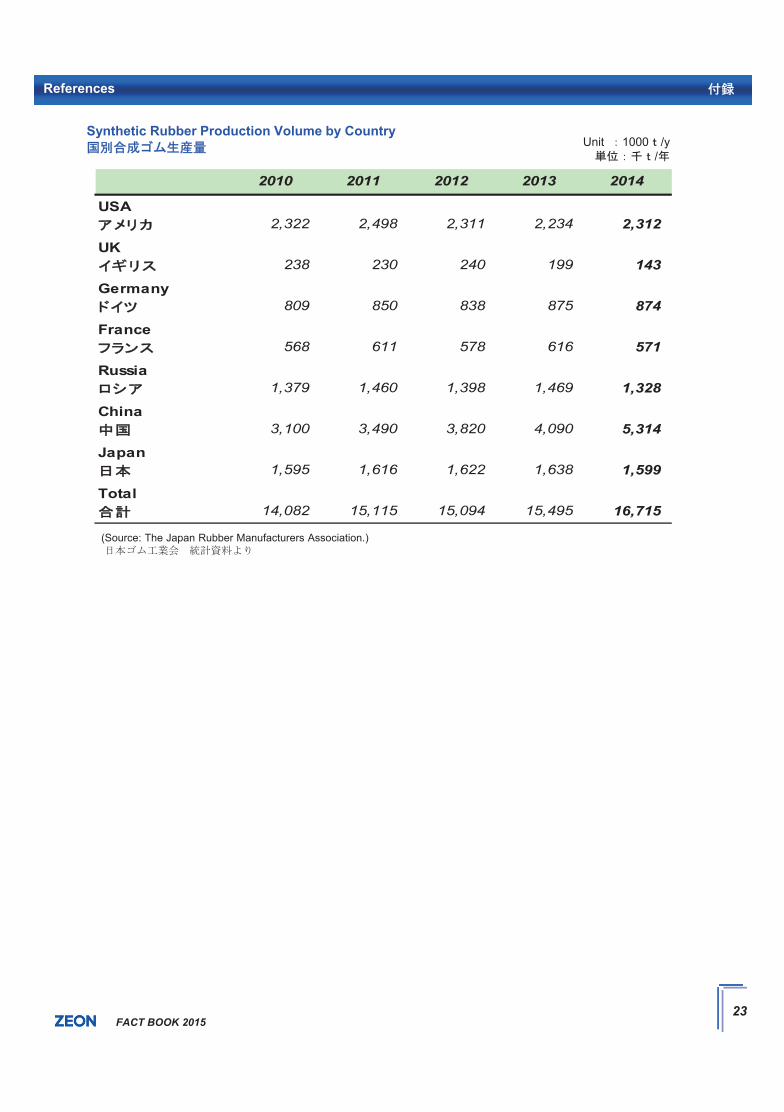
Synthetic Rubber Production Volume by CountryUnit 1000 /y
/
(Source: The Japan Rubber Manufacturers Association.)
2010 2011 2012 2013 2014
USA2,322 2,498 2,311 2,234 2,312
UK238 230 240 199 143
Germany809 850 838 875 874
France568 611 578 616 571
Russia1,379 1,460 1,398 1,469 1,328
China3,100 3,490 3,820 4,090 5,314
Japan1,595 1,616 1,622 1,638 1,599
Total14,082 15,115 15,094 15,495 16,715
FACT BOOK 20152222223
FactBook_2015.indd 23FactBook_2015.indd 23 2015/04/29 20:09:012015/04/29 20:09:01
References
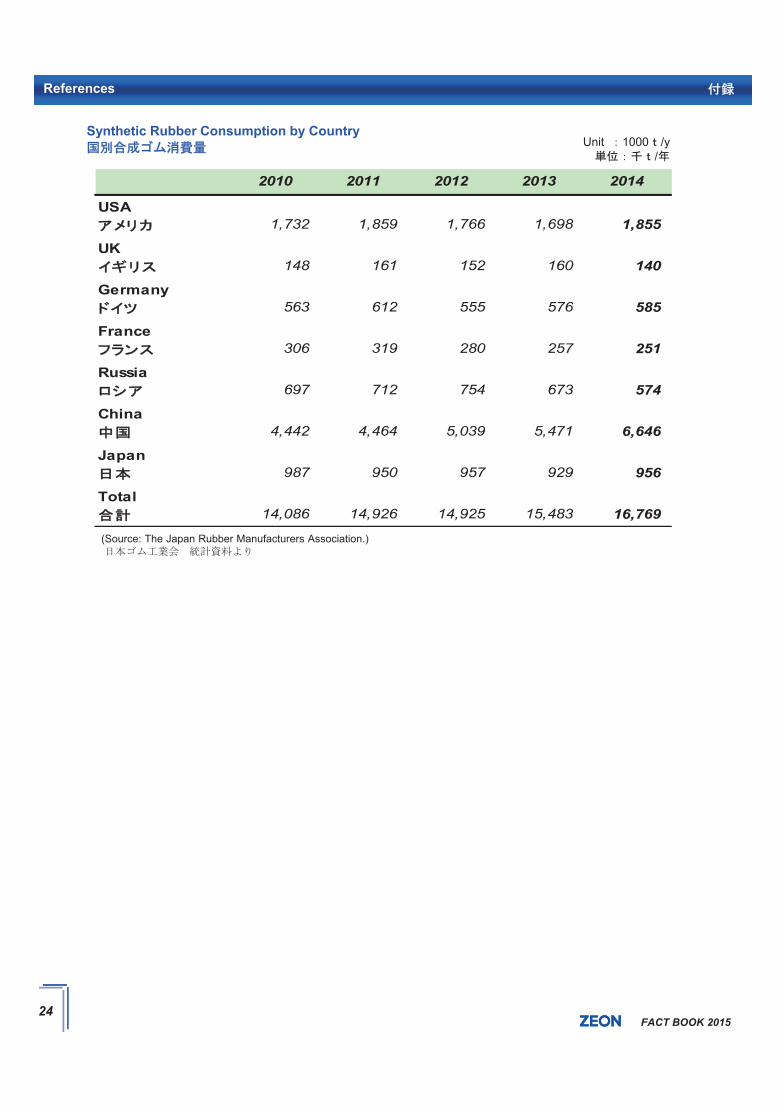
Synthetic Rubber Consumption by Country
(Source: The Japan Rubber Manufacturers Association.)
Unit 1000 /y/
2010 2011 2012 2013 2014
USA1,732 1,859 1,766 1,698 1,855
UK148 161 152 160 140
Germany563 612 555 576 585
France306 319 280 257 251
Russia697 712 754 673 574
China4,442 4,464 5,039 5,471 6,646
Japan987 950 957 929 956
Total14,086 14,926 14,925 15,483 16,769
FACT BOOK 20152222224
FactBook_2015.indd 24FactBook_2015.indd 24 2015/04/29 20:09:012015/04/29 20:09:01
References
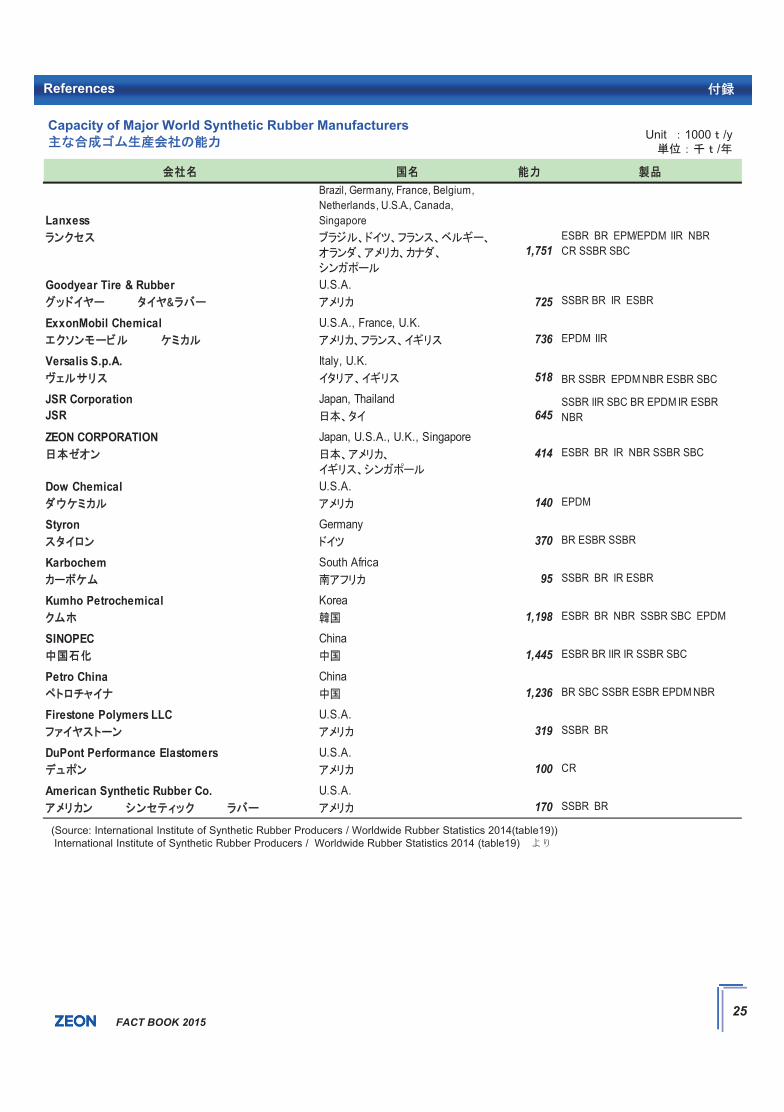
Capacity of Major World Synthetic Rubber Manufacturers
(Source: International Institute of Synthetic Rubber Producers / Worldwide Rubber Statistics 2014(table19)) International Institute of Synthetic Rubber Producers / Worldwide Rubber Statistics 2014 (table19)
Unit 1000 /y/
Lanxess
Brazil, Germany, France, Belgium,Netherlands, U.S.A., Canada,Singapore
1,751ESBR BR EPM/EPDM IIR NBRCR SSBR SBC
Goodyear Tire & Rubber U.S.A.725 SSBR BR IR ESBR
ExxonMobil Chemical U.S.A., France, U.K.736 EPDM IIR
Versalis S.p.A. Italy, U.K.518
JSR Corporation Japan, ThailandJSR 645
ZEON CORPORATION Japan, U.S.A., U.K., Singapore414 ESBR BR IR NBR SSBR SBC
Dow Chemical U.S.A.140 EPDM
Styron Germany370 BR ESBR SSBR
Karbochem South Africa95 SSBR BR IR ESBR
Kumho Petrochemical Korea1,198 ESBR BR NBR SSBR SBC EPDM
SINOPEC China1,445 ESBR BR IIR IR SSBR SBC
Petro China China1,236 BR SBC SSBR ESBR EPDM NBR
Firestone Polymers LLC U.S.A.319 SSBR BR
DuPont Performance Elastomers U.S.A.100 CR
American Synthetic Rubber Co. U.S.A.170 SSBR BR
BR SSBR EPDM NBR ESBR SBC
SSBR IIR SBC BR EPDM IR ESBRNBR
FACT BOOK 20152222225
FactBook_2015.indd 25FactBook_2015.indd 25 2015/04/29 20:09:022015/04/29 20:09:02
References
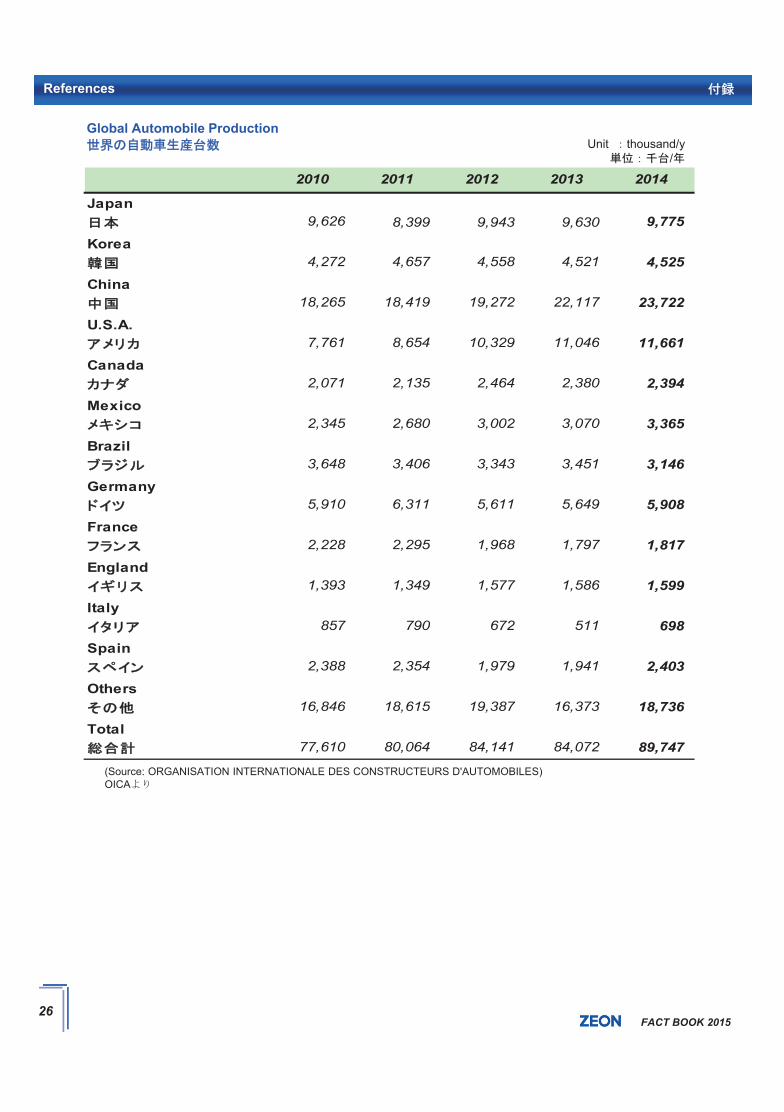
Global Automobile Production Unit thousand/y
/
(Source: ORGANISATION INTERNATIONALE DES CONSTRUCTEURS D'AUTOMOBILES)OICA
2010 2011 2012 2013 2014
Japan9,626 8,399 9,943 9,630 9,775
Korea4,272 4,657 4,558 4,521 4,525
China18,265 18,419 19,272 22,117 23,722
U.S.A.7,761 8,654 10,329 11,046 11,661
Canada2,071 2,135 2,464 2,380 2,394
Mexico2,345 2,680 3,002 3,070 3,365
Brazil3,648 3,406 3,343 3,451 3,146
Germany5,910 6,311 5,611 5,649 5,908
France2,228 2,295 1,968 1,797 1,817
England1,393 1,349 1,577 1,586 1,599
Italy857 790 672 511 698
Spain2,388 2,354 1,979 1,941 2,403
Others16,846 18,615 19,387 16,373 18,736
Total77,610 80,064 84,141 84,072 89,747
FACT BOOK 20152222226
FactBook_2015.indd 26FactBook_2015.indd 26 2015/04/29 20:09:032015/04/29 20:09:03

FACT BOOK 20152727272727
FactBook_2015.indd 27FactBook_2015.indd 27 2015/04/29 20:09:042015/04/29 20:09:04

03-3216-2747 Fax 03-3216-0501
Public Relations Dept.1-6-2, Marunouchi, Chiyoda-ku, Tokyo,100-8246 JAPAN
+81-3-3216-2747 Fax +81-3-3216-0501
FACT BOOK 2015
FactBook_2015.indd 28FactBook_2015.indd 28 2015/04/29 20:09:042015/04/29 20:09:04