Fact Book - bic camera · Fact Book Year ended August 31, 2016 BIC CAMERA INC. The Company has...
15
Fact Book Year ended August 31, 2016 BIC CAMERA INC. The Company has changed its accounting policy and method of presentation from the fiscal year ended August 31, 2015. Such changes have also been applied retrospectively to the results for the fiscal year ended August 31, 2014.
Transcript of Fact Book - bic camera · Fact Book Year ended August 31, 2016 BIC CAMERA INC. The Company has...

Fact Book
Year ended August 31, 2016
BIC CAMERA INC.
The Company has changed its accounting policy and method of presentation from the fiscal year ended
August 31, 2015. Such changes have also been applied retrospectively to the results for the fiscal year
ended August 31, 2014.

(JPY million)2012.8 2013.8 2014.8 2015.8 2016.8
Net sales 518,057 805,378 832,748 795,368 779,081
Operating income 4,069 13,041 20,014 18,800 22,006
Operating income ratio (%) 0.8 1.6 2.4 2.4 2.8
Ordinary income 6,178 15,346 24,056 20,401 23,067
Ordinary income ratio (%) 1.2 1.9 2.9 2.6 3.0
Profit attributable to owners of parent 4,007 2,436 9,850 6,804 11,985
Profit attributable to owners of parentratio (%)
0.8 0.3 1.2 0.9 1.5
Consolidated Sales and Earnings
518
805 832
795 779
0
200
400
600
800
'12.8 '13.8 '14.8 '15.8 '16.8
(JPY billion)
4.0
13.0
20.0 18.8 22.0
0.8
1.6
2.4 2.4 2.8
(1.0)
0.0
1.0
2.0
3.0
0
10
20
30
40
'12.8 '13.8 '14.8 '15.8 '16.8
Operating income ratio(%) (JPY billion)
6.1
15.3
24.0
20.4 23.0
1.2
1.9
2.9 2.6
3.0
-1.0
0.0
1.0
2.0
3.0
0
10
20
30
40
'12.8 '13.8 '14.8 '15.8 '16.8
Ordinary income ratio(%) (JPY billion)
4.0
2.4
9.8
6.8
11.9 0.8
0.3
1.2
0.9
1.5
-2.0
-1.0
0.0
1.0
2.0
0
5
10
15
20
'12.8 '13.8 '14.8 '15.8 '16.8
Profit ratio(%) (JPY billion)
Net sales Operating income / ratio
Ordinary income / ratio Profit attributable to owners of parent / ratio
BIC CAMERA INC. Fact book -Year ended August 31,2016-
- 1 -

(JPY million)2012.8 2013.8 2014.8 2015.8 2016.8
Cost of sales 392,537 605,546 617,867 585,723 568,304
Cost of sales ratio (%) 75.8 75.2 74.2 73.6 72.9
Gross profit 125,520 199,832 214,880 209,645 210,777
Gross profit ratio (%) 24.2 24.8 25.8 26.4 27.1
SG&A expenses 121,450 186,791 194,866 190,845 188,770
SG&A expenses ratio (%) 23.4 23.2 23.4 24.0 24.2
Consolidated Cost of sales and SG&A expenses
392
605 617 585 568
75.8 75.2 74.2 73.6 72.9
0
20
40
60
80
0
200
400
600
800
'12.8 '13.8 '14.8 '15.8 '16.8
Cost of sales ratio(%) (JPY billion)
125
199 214 209 210
24.2 24.8 25.8 26.4 27.1
0
10
20
30
0
100
200
300
'12.8 '13.8 '14.8 '15.8 '16.8
Gross profit ratio(%) (JPY billion)
121
186 194 190 188
23.4 23.2 23.4 24.0 24.2
0
10
20
30
0
100
200
300
'12.8 '13.8 '14.8 '15.8 '16.8
SG&A expenses ratio(%) (JPY billion)
Cost of sales / ratio Gross profit / ratio
SG&A expenses / ratio
BIC CAMERA INC. Fact book -Year ended August 31,2016-
- 2 -
(JPY million)2012.8 2013.8 2014.8 2015.8 2016.8
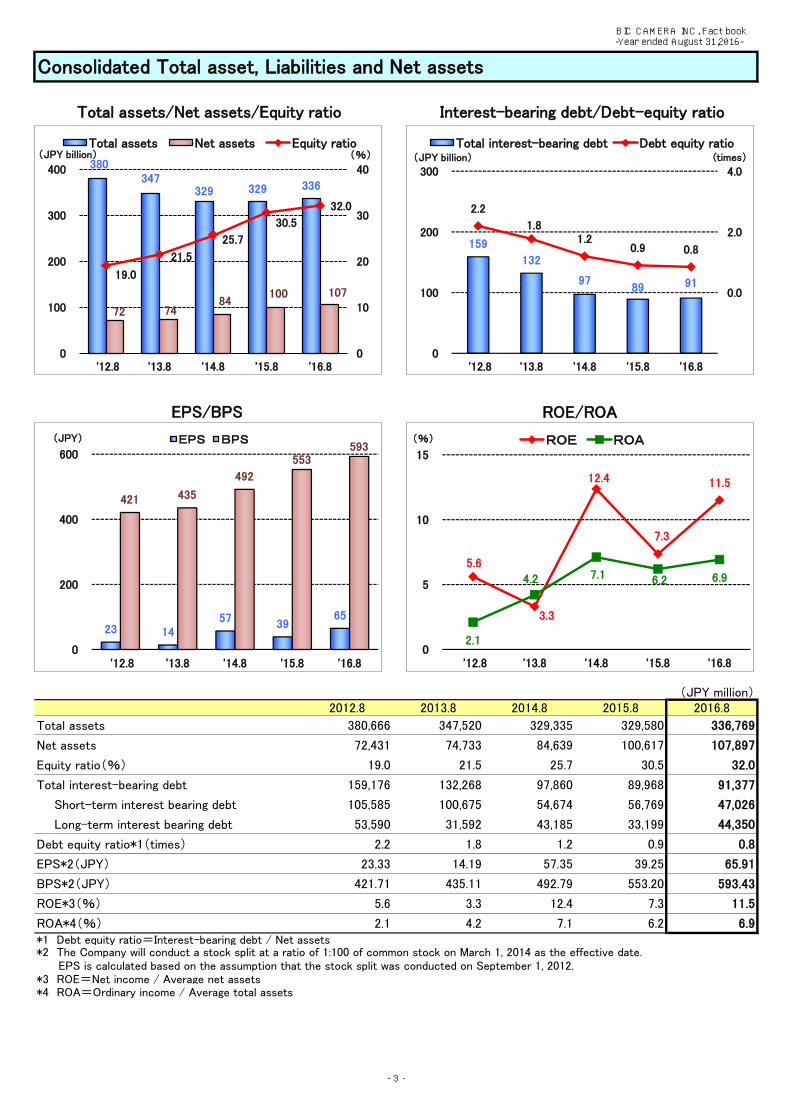
Total assets 380,666 347,520 329,335 329,580 336,769
Net assets 72,431 74,733 84,639 100,617 107,897
Equity ratio(%) 19.0 21.5 25.7 30.5 32.0
Total interest-bearing debt 159,176 132,268 97,860 89,968 91,377
Short-term interest bearing debt 105,585 100,675 54,674 56,769 47,026
Long-term interest bearing debt 53,590 31,592 43,185 33,199 44,350
Debt equity ratio*1(times) 2.2 1.8 1.2 0.9 0.8
EPS*2(JPY) 23.33 14.19 57.35 39.25 65.91
BPS*2(JPY) 421.71 435.11 492.79 553.20 593.43
ROE*3(%) 5.6 3.3 12.4 7.3 11.5
ROA*4(%) 2.1 4.2 7.1 6.2 6.9*1 Debt equity ratio=Interest-bearing debt / Net assets
*3 ROE=Net income / Average net assets*4 ROA=Ordinary income / Average total assets
Consolidated Total asset, Liabilities and Net assets
*2 The Company will conduct a stock split at a ratio of 1:100 of common stock on March 1, 2014 as the effective date. EPS is calculated based on the assumption that the stock split was conducted on September 1, 2012.
380 347
329 329 336
72 74 84
100 107
19.0
21.5
25.7
30.5
32.0
0
10
20
30
40
0
100
200
300
400
'12.8 '13.8 '14.8 '15.8 '16.8
Total assets Net assets Equity ratio(%) (JPY billion)
159
132
97 89 91
2.2
1.8 1.2
0.9 0.8
(2.0)
0.0
2.0
4.0
0
100
200
300
'12.8 '13.8 '14.8 '15.8 '16.8
Total interest-bearing debt Debt equity ratio(JPY billion) (times)
23 14 57 39
65
421 435
492
553 593
0
200
400
600
'12.8 '13.8 '14.8 '15.8 '16.8
EPS BPS (JPY)
5.6
3.3
12.4
7.3
11.5
2.1
4.2 7.1 6.2 6.9
0
5
10
15
'12.8 '13.8 '14.8 '15.8 '16.8
ROE ROA (%)
Total assets/Net assets/Equity ratio Interest-bearing debt/Debt-equity ratio
EPS/BPS ROE/ROA
BIC CAMERA INC. Fact book -Year ended August 31,2016-
- 3 -

(JPY million)2012.8 2013.8 2014.8 2015.8 2016.8
Audio visual products 114,060 153,391 153,948 140,916 126,510Cameras 35,935 48,256 50,828 47,126 37,766TVs 24,109 36,439 37,926 35,085 34,481BD/DVD recorders, Video cameras 19,498 22,439 20,346 17,473 15,266Audios 16,229 23,338 21,524 17,780 16,617AV Softwares 6,466 6,300 6,836 5,640 5,272Others 11,820 16,616 16,486 17,809 17,106
Home appliances 94,007 232,670 244,422 234,304 240,536Refrigerators 13,657 37,383 43,421 34,346 35,213Washing machines 11,018 26,719 31,034 27,119 29,760Kitchen appliances 12,445 28,541 31,584 34,125 34,098Seasonal home electronics 19,934 60,536 58,101 51,776 49,216Personal care electronics 17,424 31,477 30,672 36,903 41,850Others 19,526 48,012 49,608 50,033 50,397
190,949 276,144 281,303 257,671 249,820PCs 53,800 77,036 85,729 65,140 58,213PC peripherals 22,214 29,205 30,158 25,358 23,960PC softwares 13,761 14,435 12,043 9,351 8,184Cellular phones 68,449 102,244 102,101 110,774 109,888Others 32,723 53,222 51,270 47,046 49,573
Other products 111,068 134,483 143,409 151,755 150,089Video Games 29,888 27,537 25,267 23,912 21,447Watches 13,994 16,404 20,183 24,851 23,592Used PCs 17,414 18,540 19,872 17,515 15,671Sporting goods 5,192 5,531 6,102 6,987 7,678Toys 6,384 7,188 8,729 11,168 11,650Glasses and Contact lenses 4,408 4,727 5,003 5,072 5,382Liquors and Soft drinks 3,857 4,262 4,499 5,218 5,416Medicines and Daily goods - - - 8,467 11,798Others 29,927 50,290 53,750 48,560 47,450
Retail goods sales 510,085 796,690 823,083 784,647 766,956Other business 7,972 8,688 9,665 10,721 12,124Total 518,057 805,378 832,748 795,368 779,081
*1 Above amount does not include consumption taxes.*2
Consolidated Sales by Product
Separate "Medicines and Daily goods" from "Others" of "Other products" since 2015.8.
Information communications equipment products
114 153 153 140 126
94
232 244 234 240
190
276 281 257 249
111
134 143
151 150
7
8 9
10 12
0
100
200
300
400
500
600
700
800
900
'12.8 '13.8 '14.8 '15.8 '16.8
Audio visual products Home appliancesInformation Other productsOther business
(JPY billion)
22.0 19.0 18.5 17.7 16.2
18.2 28.9 29.3 29.5 30.9
36.9
34.3 33.8 32.4 32.0
21.4 16.7 17.2 19.1 19.3
1.5 1.1 1.2 1.3 1.6
0%
20%
40%
60%
80%
100%
'12.8 '13.8 '14.8 '15.8 '16.8
Audio visual products Home appliancesInformation Other productsOther business
Sales by product line Composition ratio by product line
BIC CAMERA INC. Fact book -Year ended August 31,2016-
- 4 -

2012.8 2013.8 2014.8 2015.8 2016.8
Assets
Cash and deposits 47,137 33,138 26,276 22,410 25,137
Accounts receivable - trade 29,515 30,237 30,014 29,663 28,171
Merchandise and finished goods 86,963 71,764 73,784 81,677 93,603
Raw materials and supplies 422 382 448 490 475
Program right 66 64 97 91 127
Deferred tax assets 13,545 10,987 8,019 6,584 6,543
Other 23,479 22,700 13,067 12,717 13,532
Allowance for doubtful accounts (1,104) (207) (237) (271) (346)
200,027 169,066 151,470 153,362 167,244
Buildings and structures 48,210 47,423 46,406 50,406 52,249
Accumulated depreciation (17,731) (20,212) (21,503) (25,513) (27,435)
Buildings and structures, net 30,478 27,211 24,902 24,892 24,813
Machinery, equipment and vehicles 587 602 824 1,004 1,223
Accumulated depreciation (350) (404) (466) (582) (733)
Machinery, equipment and vehicles, net 237 198 358 421 490
Land 45,216 44,436 45,407 44,056 46,397
Leased assets 2,929 3,691 5,327 6,222 6,891
Accumulated depreciation (922) (1,529) (2,282) (3,184) (4,141)
Leased assets, net 2,007 2,161 3,045 3,037 2,750
Construction in progress 87 2,529 2,683 2,639 306
Other 7,197 7,322 6,742 7,688 8,243
Accumulated depreciation (5,748) (5,804) (5,350) (6,124) (6,585)
Other, net 1,448 1,517 1,392 1,563 1,657
79,475 78,055 77,789 76,611 76,415
Goodwill 760 491 193 5,072 4,712
Other 16,406 18,525 18,618 18,972 17,050
17,167 19,016 18,811 24,045 21,762
Investment securities 11,599 11,625 12,523 14,385 11,773
Long-term loans receivable 398 1,579 1,217 1,157 274
Deferred tax assets 18,170 15,900 16,390 9,605 10,967
Net defined benefit asset - - 2,059 2,905 2,811
Guarantee deposits 50,515 50,238 47,241 46,026 44,060
Other 3,693 3,800 2,378 2,111 1,905
Allowance for doubtful accounts (392) (1,763) (546) (630) (445)
83,985 81,381 81,263 75,560 71,347
180,627 178,453 177,865 176,217 169,525
11 - - - -
380,666 347,520 329,335 329,580 336,769
Consolidated Balance Sheets
Total intangible assets
Total current assets
(JPY million)
Total property, plant and equipment
Total assets
Total investments and other assets
Total non-current assets
Business commencement expenses
BIC CAMERA INC. Fact book -Year ended August 31,2016-
- 5 -

2012.8 2013.8 2014.8 2015.8 2016.8
Accounts payable - trade 50,317 45,131 42,204 44,038 39,846
Short-term loans payable 86,740 45,680 39,983 23,698 34,062
Current portion of long-term loans payable 15,382 51,402 12,759 30,652 11,609
Current portion of bonds 1,060 1,060 625 50 35
Lease obligations 2,402 2,533 1,307 2,369 1,319
Income taxes payable 575 1,372 8,514 4,711 5,396
Provision for bonuses 2,922 2,312 2,814 2,856 2,820
Provision for point card certificates 13,388 11,504 11,183 11,563 11,570
Provision for loss on store closing 9,353 9,101 1,838 149 311
Asset retirement obligations 654 950 271 81 102
Other 28,535 27,898 28,253 25,393 25,401
211,334 198,946 149,756 145,562 132,475
Bonds payable 1,770 710 15,158 5,427 5,388
Long-term loans payable 46,360 27,407 22,900 24,287 36,101
Lease obligations 5,460 3,474 5,127 3,484 2,860
Deferred tax liabilities 25 21 105 88 103
Provision for goods warranties 779 1,669 2,639 2,700 2,132
Provision for loss on store closing 7,116 2,781 2,945 2,003 1,401
Net defined benefit liability - - 8,755 10,194 12,470
Asset retirement obligations 7,766 7,637 8,263 8,626 8,680
Other 11,928 13,182 6,597 6,358 6,058
Total non-current liabilities 81,207 56,885 72,493 63,171 75,198
Total liabilities 292,541 255,832 222,249 208,733 207,673
Net assets
Capital stock 18,402 18,402 18,402 23,237 23,237
Capital surplus 19,492 19,492 19,492 24,327 24,328
Retained earnings 35,400 36,119 45,560 50,706 60,872
Treasury shares (184) (184) (184) (184) (241)
Total shareholders' equity 73,110 73,829 83,270 98,087 108,196
Valuation difference on available-for-sale securities (678) 903 1,398 2,746 902
Remeasurements of defined benefit plans - - (28) (216) (1,201)
Total accumulated other comprehensive income (678) 903 1,369 2,530 (299)
Non-controlling interests 15,692 16,954 22,446 20,228 21,198
Total net assets 88,124 91,687 107,085 120,846 129,096
Total liabilities and net assets 380,666 347,520 329,335 329,580 336,769
(JPY million)
Liabilities
Total current liabilities
BIC CAMERA INC. Fact book -Year ended August 31,2016-
- 6 -

2012.8 2013.8 2014.8 2015.8 2016.8
Net sales 518,057 805,378 832,748 795,368 779,081
Cost of sales 392,537 605,546 617,867 585,723 568,304
Gross profit 125,520 199,832 214,880 209,645 210,777
Point card certificates 27,654 26,035 27,780 26,380 25,313
Salaries and allowances 19,096 32,089 30,691 29,505 29,286
Provision for bonuses 2,061 2,305 2,807 2,872 2,837
Retirement benefit expenses 1,133 1,331 1,436 1,269 1,561
Rents 20,473 31,495 31,573 31,746 31,923
Provision for merchandise warranties - 1,000 1,042 402 9
Depreciation 2,868 4,931 5,165 5,115 5,510
Amortization of goodwill 268 268 266 378 360
Provision of allowance for doubtful accounts 206 176 130 127 210
Other 47,687 87,157 93,971 93,046 91,756
Selling, general and administrative expenses 121,450 186,791 194,866 190,845 188,770
Operating income 4,069 13,041 20,014 18,800 22,006
Interest income 21 190 182 135 116
Dividend income 570 147 173 186 210
Commission fee 913 1,024 1,037 1,280 1,374
Reversal of provision for loss on store closing - 1,547 4,061 1,189 -
Other 2,157 3,177 1,253 836 728
Total non-operating income 3,661 6,088 6,708 3,627 2,429
Interest expenses 729 1,874 1,317 951 686
Commission fee 204 1,094 857 855 520
Other 618 813 490 219 161
Total non-operating expenses 1,552 3,782 2,665 2,027 1,368
Ordinary income 6,178 15,346 24,056 20,401 23,067
Consolidated Statements of Income
(JPY million)
BIC CAMERA INC. Fact book -Year ended August 31,2016-
- 7 -

2012.8 2013.8 2014.8 2015.8 2016.8
Gain on sales of non-current assets - 461 328 379 200
Gain on sales of investment securities 17 11 0 - 1,411
Gain on sales of shares of subsidiaries and associates - 10 358 0 -
Other 462 57 549 195 23
Total extraordinary income 479 540 1,236 575 1,636
Loss on sales of non-current assets - 0 34 47 13
Loss on retirement of non-current assets 119 178 154 143 100
Loss on valuation of investment securities 685 2,496 - 19 -
Impairment loss 1,198 2,517 3,177 1,520 2,510
Loss on disaster - - - - 171
Other 0 1,390 175 86 192
Total extraordinary losses 2,003 6,582 3,541 1,817 2,987
4,654 9,304 21,752 19,158 21,715
Income taxes - current 1,173 1,857 8,792 6,951 8,064
Income taxes - deferred (653) 3,835 1,373 7,666 177
Total income taxes 519 5,692 10,166 14,618 8,241
Profit 4,135 3,611 11,585 4,539 13,474
Profit (loss) attributable to non-controlling interests 127 1,174 1,735 (2,264) 1,489
Profit attributable to owners of parent 4,007 2,436 9,850 6,804 11,985
Profit before income taxes
(JPY million)
BIC CAMERA INC. Fact book -Year ended August 31,2016-
- 8 -

2012.8 2013.8 2014.8 2015.8 2016.8
Profit before income taxes 4,654 9,304 21,752 19,158 21,715
Depreciation 3,286 5,443 5,608 5,579 6,047
Impairment loss 1,198 2,517 3,177 1,520 2,510
Amortization of goodwill 268 268 266 378 360
Increase (decrease) in allowance for doubtful accounts 174 474 (1,187) 109 (109)
Increase (decrease) in provision for bonuses (110) (609) 502 (5) (36)
Increase (decrease) in provision for point card certificates (2,006) (1,884) (320) 379 6
Increase(decrease) in provision for goods warranties 175 890 969 60 (567)
Increase decrease in net defined benefit liability - - 933 1,019 912
Increase (decrease) in provision for directors' retirement benefits (43) (12) (120) - -
Increase (decrease) in provision for loss on store closing - (3,609) (6,090) (2,442) (343)
Increase (decrease) in other provision - 83 (83) - -
Interest and dividends income (591) (338) (355) (321) (327)
Interest expenses 729 1,874 1,317 951 686
Foreign exchange losses (gains) (0) (0) (0) (0) 0
Loss (gain) on sales of non-current assets - (460) (294) (332) (187)
Loss on retirement of non-current assets 119 178 154 143 100
Loss (gain) on sales of investment securities (17) (11) (0) - (1,411)
Loss (gain) on valuation of investment securities 685 2,496 - 19 -
Loss (gain) on sales of shares of subsidiaries and associates - (10) (358) (0) -
Decrease (increase) in notes and accounts receivable-trade 21 (721) 222 1,208 1,492
Decrease (increase) in inventories (4,929) 15,241 159 (7,593) (11,947)
Increase (decrease) in notes and accounts payable-trade (1,159) (5,186) (2,926) 1,119 (4,192)
Other, net 375 (849) 13,402 (3,639) 414
Subtotal 2,829 25,077 36,728 17,315 15,125
Interest and dividends income received 598 202 238 209 230
Interest expenses paid (746) (1,881) (1,347) (980) (733)
Income taxes paid (6,671) (712) (2,770) (10,416) (6,771)
Net cash provided by (used in) operating activities (3,989) 22,685 32,848 6,128 7,850
Consolidated Statements of Cash Flows
Cash flows from operating activities
(JPY million)
BIC CAMERA INC. Fact book -Year ended August 31,2016-
- 9 -

2012.8 2013.8 2014.8 2015.8 2016.8
Cash flows from investing activities
Purchase of property, plant and equipment (1,289) (6,282) (4,925) (3,846) (4,864)
Proceeds from sales of property, plant and equipment - 946 843 2,029 520
Purchase of intangible assets (985) (2,403) (3,750) (2,464) (1,983)
Purchase of investment securities (3) (8) (22) - (1,133)
Proceeds from sales of investment securities 29 22 0 - 1,778
Proceeds from sales of shares of subsidiaries and associates - 84 1,599 0 -
Payments for guarantee deposits (2,849) (3,162) (627) (1,207) (650)
Proceeds from collection of guarantee deposits 606 3,763 2,624 2,256 1,732
14,767 - - - -
- - - (5,257) -
Other, net 1,393 (145) (340) 487 (15)
Net cash provided by (used in) investing activities 11,668 (7,185) (4,598) (8,001) (4,615)
Cash flows from financing activities
Net increase (decrease) in short-term loans payable 29,366 (41,060) (5,696) (16,598) 10,364
Proceeds from long-term loans payable 10,200 37,022 9,200 35,200 24,000
Repayments of long-term loans payable (16,516) (19,955) (52,351) (15,919) (31,228)
Proceeds from issuance of bonds 246 - 15,075 - -
Redemption of bonds (1,085) (1,060) (1,060) (625) (50)
Proceeds from share issuance to minority shareholders - - 2,845 - -
Cash dividends paid (2,559) (1,706) (1,715) (1,719) (1,814)
Dividends paid to non-controlling interests - (173) (0) (239) (99)
- - - - (52)
Repayments of lease obligations (478) (2,565) (1,408) (1,832) (1,493)
Other, net (2) (0) (0) (31) (70)
Net cash provided by (used in) financing activities 19,170 (29,499) (35,111) (1,765) (446)
Effect of exchange rate change on cash and cash equivalents 0 0 0 0 (0)
Net increase (decrease) in cash and cash equivalents 26,849 (13,998) (6,861) (3,638) 2,788
Cash and cash equivalents at beginning of period 19,964 46,813 32,815 25,953 22,349
- - - 34 0
Cash and cash equivalents at end of period 46,813 32,815 25,953 22,349 25,137
Proceeds from purchase of investments in subsidiaries resulting inchange in scope of consolidation
Purchase of shares of subsidiaries resulting in change in scope ofconsolidation
Increase (decrease) in cash and cash equivalents resulting frommerger of subsidiaries
(JPY million)
Payments from changes in ownership interests in subsidiaries thatdo not result in change in scope of consolidation
BIC CAMERA INC. Fact book -Year ended August 31,2016-
- 10 -

(JPY million)2012.8 2013.8 2014.8 2015.8 2016.8
Net sales 398,638 403,790 448,087 444,879 426,670
Operating income 1,091 2,281 11,402 13,216 13,621
Operating income ratio (%) 0.3 0.6 2.5 3.0 3.2
Ordinary income 3,954 6,359 12,349 14,807 15,406
Ordinary income ratio (%) 1.0 1.6 2.8 3.3 3.6
Profit 203 3,190 6,383 8,112 8,315
Profit ratio (%) 0.1 0.8 1.4 1.8 1.9
Non-Consolidated Sales and Earnings
398 403
448 444 426
0
200
400
600
'12.8 '13.8 '14.8 '15.8 '16.8
(JPY billion)
1.0 2.2
11.4
13.2 13.6
0.3 0.6
2.5 3.0 3.2
(4.0)
(2.0)
0.0
2.0
4.0
0.0
5.0
10.0
15.0
20.0
'12.8 '13.8 '14.8 '15.8 '16.8
Operating income ratio(%) (JPY billion)
3.9 6.3
12.3
14.8 15.4
1.0 1.6
2.8
3.3 3.6
-4.0
-2.0
0.0
2.0
4.0
0.0
5.0
10.0
15.0
20.0
'12.8 '13.8 '14.8 '15.8 '16.8
Ordinary income ratio(%) (JPY billion)
0.2
3.1
6.3
8.1 8.3
0.1
0.8
1.4
1.8 1.9
-2.0
-1.0
0.0
1.0
2.0
0
3
5
8
10
'12.8 '13.8 '14.8 '15.8 '16.8
Profit ratio(%) (JPY billion)
Net sales Operating income / ratio
Ordinary income / ratio Profit / ratio
BIC CAMERA INC. Fact book -Year ended August 31,2016-
- 11 -

(JPY million)2012.8 2013.8 2014.8 2015.8 2016.8
Cost of sales 299,357 302,837 332,515 328,177 310,777
Cost of sales ratio(%) 75.1 75.0 74.2 73.8 72.8
Gross profit 99,280 100,952 115,571 116,702 115,892
Gross profit ratio(%) 24.9 25.0 25.8 26.2 27.2
SG&A expenses Amount 98,189 98,670 104,169 103,485 102,271
(ratio against sales) Ratio(%) 24.6 24.4 23.2 23.3 24.0
Salaries Amount 14,633 13,970 15,545 15,564 15,319
(ratio against sales) Ratio(%) 3.7 3.5 3.5 3.5 3.6
Advertisement & promotion Amount 9,476 9,627 10,406 9,389 7,573
(ratio against sales) Ratio(%) 2.4 2.4 2.3 2.1 1.8
Points expense*1 Amount 24,280 21,687 22,773 20,737 19,123
(ratio against sales) Ratio(%) 6.1 5.4 5.1 4.7 4.5
Rents Amount 16,858 18,484 18,549 18,611 18,827
(ratio against sales) Ratio(%) 4.2 4.6 4.1 4.2 4.4
Non-Consolidated Cost of Sales and SG&A expenses
299 302 332 328 310
75.1 75.0 74.2 73.8 72.8
0
20
40
60
80
0
150
300
450
600
'12.8 '13.8 '14.8 '15.8 '16.8
Cost of sales ratio(%) (JPY billion)
99 100 115 116 115
24.9 25.0 25.8 26.2 27.2
(10)
0
10
20
30
0
50
100
150
200
'12.8 '13.8 '14.8 '15.8 '16.8
Gross profit ratio(%) (JPY billion)
98 98 104 103 102
24.6 24.4 23.2 23.3 24.0
(10)
0
10
20
30
0
50
100
150
200
'12.8 '13.8 '14.8 '15.8 '16.8
SG&A expenses ratio(%) (JPY billion)
3.7 3.5 3.5 3.5 3.6
2.4 2.4 2.3 2.1 1.8
6.1
5.4 5.1
4.7 4.5 4.2 4.6
4.1 4.2 4.4
0
2
4
6
8
'12.8 '13.8 '14.8 '15.8 '16.8
SalariesAdvertisement & promotionPoints expenseRents(%)
Cost of sales / ratio Gross profit / ratio
SG&A expenses / ratio Breakdown of SG&A expenses
BIC CAMERA INC. Fact book -Year ended August 31,2016-
- 12 -

(JPY million)
2012.8 2013.8 2014.8 2015.8 2016.8
Net sales 398,638 403,790 448,087 444,879 426,670
Cost of sales 299,357 302,837 332,515 328,177 310,777
Gross profit 99,280 100,952 115,571 116,702 115,892
SG&A expenses 98,189 98,670 104,169 103,485 102,271
Operating income 1,091 2,281 11,402 13,216 13,621
Non-operating income 6,155 9,331 1,961 2,261 2,316
Non-operating expenses 3,292 5,253 1,013 670 530
Ordinary income 3,954 6,359 12,349 14,807 15,406
Extraordinary income 905 94 834 306 606
Extraordinary loss 5,135 860 1,316 555 2,238
(276) 5,593 11,867 14,559 13,774
Profit 203 3,190 6,383 8,112 8,315
Sales floor space(㎡) 2012.8 2013.8 2014.8 2015.8 2016.8Consolidated 819,234 739,597 671,245 648,997 640,969Non-consolidated 200,494 207,982 202,693 200,656 202,382
Number of stores 2012.8 2013.8 2014.8 2015.8 2016.8Consolidated *1 275 249 220 216 213Non-consolidated 34 34 34 34 35Kojima 202 178 149 144 139Sofmap 37 34 34 35 35Bic Outlet 2 3 3 3 4
Number of employees 2012.8 2013.8 2014.8 2015.8 2016.8Consolidated 9,660 8,868 8,253 8,224 8,123
(The average number of part-time employees)*2 5,752 5,756 5,524 5,706 5,875Non-consolidated 4,384 4,419 4,286 4,300 4,228
(The average number of part-time employees)*2 1,527 1,547 1,374 1,522 1,554It is not include Ranet and Ranet Communications.The number of employees is not include part-time employees.
Non-Consolidated Statements of Income and Others
Sales floor space,Number of stores,Number of employees(end of period)
Profit before income taxes
*2*1
BIC CAMERA INC. Fact book -Year ended August 31,2016-
- 13 -

Corporate outline(As of August 31, 2016)
Company name BIC CAMERA INC.
Headquarter (Takada) 3-23-23, Takada, Toshima-ku, Tokyo, 171-0033
(Ikebukuro) 8th floor, 3-28-13, Nishi-Ikebukuro, Toshima-ku, Tokyo, 171-0021
Established November 21, 1980
Representative director and president Hiroyuki Miyajima
Paid-in capital JPY 23,237 million
Listing Tokyo Stock Exchange First Section
Stock transfer agent Mizuho Trust and Banking
Shareholder Date
Major shareholders(As of August 31, 2016)
Number of sharesheld (shares)
Percentage ofshareholding (%)
Ra・Holdings Co, Ltd. 18,661,500 10.23
Japan Trustee Services Bank, Ltd. (Trust Account) 16,525,600 9.05
Mizuho Trust & Banking Co., Ltd. Securities Management Trust0700026 13,257,000 7.26
Administration Trust (A001) Trustee SMBC Trust Bank Ltd. 8,898,100 4.88
Sumitomo Mitsui Trust Bank, Limited (Trust Account KO No.1) 8,617,600 4.72
The Nomura Trust and Banking Co., Ltd. (Trust Account 2052152) 7,500,000 4.11
Administration Trust (A009) Trustee SMBC Trust Bank Ltd. 6,800,000 3.73
TOKYO BROADCASTING SYSTEM TELEVISION, INC. 6,119,000 3.35
4,646,530 2.55
The Nomura Trust and Banking Co., Ltd. (Trust Account 2052116) 3,758,070 2.06
Composition of shareholders(As of August 31, 2016)
Number of shareholders Number of shares heldPercentage of
shareholding (%)
Financial institutions 81,954,700 44.91
Securities companies 538,835 0.30
Other corporations 31,713,021 17.38
Non-Japanese 10,712,040 5.87
Individual and other 56,901,569 31.18
Treasury stock 658,600 0.36
Total 182,478,765 100.00
Corporate Data
The Master Trust Bank of Japan ,Ltd. (Retail Trust Account 820079254)
BIC CAMERA INC. Fact book -Year ended August 31,2016-
- 14 -