Fact Book 2013-2014
89
Fact Book 2013-2014 An Annual Publication of the Office of Institutional Planning, Research and Assessment Anthony and Louise Viaer-Alumni Hall Office 310 Phone: 512.505.3020 Fax: 512.505.3198
Transcript of Fact Book 2013-2014

Fact Book 2013-2014
An Annual Publication of the Office of Institutional Planning, Research and Assessment
Anthony and Louise Viaer-Alumni Hall
Office 310 Phone: 512.505.3020
Fax: 512.505.3198

Huston-Tillotson University Fact Book 2013-2014
ii
Preface
Huston-Tillotson University (HT) Fact Book is an annual publication of information about the institution
that is frequently requested by board members, faculty, staff, alumni, and others. The Fact Book contains
a wide spectrum of data about the past and present operations of the University. The Office of
Institutional Planning, Research and Assessment (OIPRA) collects, analyzes, disseminates, and presents
information designed to aid in the planning, decision making, and policy formulation at Huston-Tillotson
University. Some of the information presented in text is obtained from administrative reports produced
by various University offices. It is important to note that final enrollment numbers are based on the
official 12th class day report, which is the basis for all state and federal reporting. Please note that this
edition of the Fact Book includes student enrollment data for Fall 2013 and Spring 2014 semesters. The
staff of the Office of Institutional Planning, Research and Assessment would like to express our gratitude
to those offices for their valuable contributions. In our continuing effort to provide timely and accurate
information, OIPRA will continue to refine this publication each year, and we welcome your suggestions
and/or comments.
Office of Institutional Research, Planning and Assessment Staff
Jaya K. Soni Director [email protected] Xia Serena Yan Institutional Research Analyst [email protected] Tami Jackson Admin Assistant [email protected]
Fact Book information is available on the World Wide Web at: http://htu.edu/offices/institutional-research/

Huston-Tillotson University Fact Book 2013-2014
iii
Table of Contents
Section I: University Profile .................................................................................................................... 1-24
HT at a Glance .............................................................................................................................. 1 HT Data Dashboard ...................................................................................................................... 2 Accreditation ................................................................................................................................ 3 Institutional Memberships ............................................................................................................ 4 Mission and Vision Statement ...................................................................................................... 5 University Governance ................................................................................................................. 6 Institutional Goals ........................................................................................................................ 7 Institutional History ...................................................................................................................... 8 University President ..................................................................................................................... 9 Former Presidents .................................................................................................................. 10-12 Executive Administration ........................................................................................................... 13 International Alumni Associations ............................................................................................. 14 Alumni Chapter Presidents ......................................................................................................... 15 Organizational Chart .................................................................................................................. 16 Degree Programs ................................................................................................................... 17-19 Alternative Teaching Certificate Program.................................................................................. 20 Intercollegiate Athletics ........................................................................................................ 21-23 Student Organization Fact Sheet ................................................................................................ 24
Section II: Fall 2013 Student Profile .................................................................................................... 25-37
Demographic Enrollment Statistics: fall 2013 – total student ............................................... 25-26 Total Student Headcount Enrollment by Classification and Gender ...................................... 25 Total Student Headcount and Full-Time Equivalent (FTE) Summary by Level and Status .. 26 Total Student Headcount Enrollment by Level and Status ..................................................... 26 Total Student Headcount Enrollment by Level and Gender ................................................... 26
Demographic Enrollment Statistics: fall 2013 – Undergraduate ........................................... 27-28 Undergraduate Headcount Enrollment by Level and Classification ....................................... 27 Undergraduate Headcount Enrollment by Level and Status ................................................... 27 Undergraduate Headcount Enrollment by Level and Gender ................................................. 27 Undergraduate Headcount Enrollment by Race and Gender .................................................. 27 Undergraduate Headcount Enrollment by Age and Gender ................................................... 28
Geographic Statistics: fall 2013 – Undergraduate ................................................................. 29-32 Undergraduate Headcount Enrollment by Residency ............................................................. 29 Undergraduate Headcount Enrollment by Country of Origin................................................. 29 Undergraduate Headcount Enrollment by State Residency .................................................... 30 Undergraduate Headcount Enrollment by Texas County of Origin .................................. 31-32
Geographic Statistics: fall 2013 – First-Time Freshmen (FF) ............................................... 33-34 FF Headcount Enrollment by Country of Origin .................................................................... 33 FF Headcount Enrollment by State Residency ....................................................................... 33 FF Headcount Enrollment by Texas County of Origin ........................................................... 34
Geographic Statistics: fall 2013 – ATCP ................................................................................... 35 ATCP Headcount Enrollment by Residency .......................................................................... 35 ATCP Headcount Enrollment by Texas County of Origin ..................................................... 35
Academic Statistics: Fall 2013 .............................................................................................. 36-37 Undergraduate Headcount Enrollment by Major and Gender ................................................ 36 First-Time Freshmen Headcount Enrollment by Major and Gender ...................................... 37

Huston-Tillotson University Fact Book 2013-2014
iv
Section III: Spring 2014 Student Profile .............................................................................................. 38-41
Demographic Enrollment Statistics: spring 2014 – total student .......................................... 38-40 Total Student Headcount Enrollment by Classification and Gender ...................................... 38 Total Student Headcount and Full-Time Equivalent (FTE) Summary by Level and Status .. 39 Total Student Headcount Enrollment by Level and Status ..................................................... 39 Total Student Headcount Enrollment by Level and Gender ................................................... 39 Total Student Headcount Enrollment by Race and Gender .................................................... 40
Demographic Enrollment Statistics: spring 2014 – Undergraduate ........................................... 41 Undergraduate Headcount Enrollment by Level and Classification ....................................... 41 Undergraduate Headcount Enrollment by Level and Status ................................................... 41 Undergraduate Headcount Enrollment by Level and Gender ................................................. 41 Undergraduate Headcount Enrollment by Age and Gender ................................................... 41
Geographic Statistics: spring 2014 – Undergraduate ............................................................ 42-45 Undergraduate Headcount Enrollment by Residency ............................................................. 42 Undergraduate Headcount Enrollment by Country of Origin................................................. 42 Undergraduate Headcount Enrollment by State Residency .................................................... 43 Undergraduate Headcount Enrollment by Texas County of Origin .................................. 44-45
Geographic Statistics: spring 2014 – First-Time Freshmen (FF) ............................................... 46 FF Headcount Enrollment by State Residency ....................................................................... 46 FF Headcount Enrollment by Texas County of Origin ........................................................... 46
Geographic Statistics: spring 2014 – ATCP ............................................................................... 47 ATCP Headcount Enrollment by Residency .......................................................................... 47 ATCP Headcount Enrollment by Texas County of Origin ..................................................... 47
Academic Statistics: Spring 2014 .......................................................................................... 48-49 Undergraduate Headcount Enrollment by Major and Gender ................................................ 48 First-Time Freshmen Headcount Enrollment by Major and Gender ...................................... 49
Section IV: Degrees Granted ..................................................................................................................... 50
HT Baccalaureate Completions by Major: July 2013-June 2014 ............................................... 50
Section V: Student Trends .................................................................................................................... 51-67
Demographic Enrollment Trend Data ........................................................................................ 51 Historical Overall Student Headcount Enrollment ................................................................. 51 First-Time Freshmen Student Headcount Enrollment ............................................................ 52 Race/Ethnicity Trends ............................................................................................................ 53 Gender Trends ........................................................................................................................ 53
Geographic Trend Data ......................................................................................................... 54-58 Texas Resident Trends ............................................................................................................ 54 Out-of-State Student Trends .............................................................................................. 55-56 International Student Trends .............................................................................................. 57-58
Retention & Graduation Trend Data ..................................................................................... 59-63 First-Time Freshmen Undergraduate Returning 2nd, 3rd, and 4th Years .................................. 59 Baccalaureate Completions by Year ....................................................................................... 60 Baccalaureate Completions by Major ..................................................................................... 61 Degree Granted to HT Students ......................................................................................... 62-63 Baccalaureate Degree Granted to First-time Freshmen and Transfer Students ...................... 64
Student Financial Aid Trend Data .............................................................................................. 65 Undergraduate Receiving Grant Aid ...................................................................................... 65 FTFT Students Receiving Grant Aid ...................................................................................... 65 FTFT Students Receiving Loans ............................................................................................ 65

Huston-Tillotson University Fact Book 2013-2014
v
Graduation Rate for Full-time, First-time Students .................................................................... 66 4-Year (100%) Graduation Rate ............................................................................................. 66 6-Year (150%) Graduation Rate ............................................................................................. 66 8-Year (200%) Graduation Rate ............................................................................................. 66
Section VI: Fall 2013 Faculty Profile ................................................................................................... 67-68
Full-Time Faculty by Race and Gender ..................................................................................... 67 Faculty by Tenure ...................................................................................................................... 68 Faculty by Rank ......................................................................................................................... 68
Section VII: Facilities and Finances Profile ........................................................................................ 69-79
Buildings & Facilities Description ........................................................................................ 69-73 Health Services ........................................................................................................................... 74 Library Statistics ........................................................................................................................ 75 Financial Aid Disbursed ............................................................................................................. 76 Institutional Revenues ................................................................................................................ 77 Institutional Expenditures and Net Assets .................................................................................. 78 Grants Trend Data ................................................................................................................. 79-80
HT Campus Map ........................................................................................................................ 81
Glossary ................................................................................................................................. 82-83

Huston-Tillotson University Fact Book 2013-2014
- 1 -
Section I: University Profile
HT at a Glance
Location 900 Chicon Street Austin, Texas 78702-2795
HT President and CEO Larry L. Earvin, Ph.D.
Chartered October 24, 1952
Founded 1875
Web Address www.htu.edu
School Type Independent, Interdenominational, Co-ed
Office of Admission 512.505.3028
Degrees Offered Baccalaureate Degree
Mascot Ram
Certificates Offered Post-baccalaureate Certificate
Special Programs Adult Degree Program (ADP), Alternative Teacher Certification Program (ATCP), AusPrEP, Center for Academic Excellence, MAP/WALK Leadership Programs, Military Science, New Student Orientation, STEM Academy, Study Abroad, 3-2 engineering program with Prairie View A&M U, and W.E.B. DuBois Honors Program Student Services Counseling Services, Dining Services, Health Services, Employment services for students, Placement services for graduates
Affiliations The United Methodist Church, The United Church of Christ, and charter member of the United Negro College Fund
Fall 2013 Enrollment
Total students: 973 Total undergraduates: 926 Total Undergraduate Students in ADP: 76 Total Post-Baccalaureate /ATCP: 47 First Generation Students: 45.8% Spring 2014 Enrollment
Total students: 889 Total undergraduates: 839 Total Undergraduate Students in ADP: 96 Total Post-Baccalaureate /ATCP: 50 Student-Faculty Ratio: 13:1 First-time Freshmen (Fall 2013): Average High School GPA: 2.80 Average ACT Composite Score: 15.4 Average SAT Composite Score: 803
Fall 2013-Spring 2014 Academic Year Charges FT-Tuition & Fees (12-17 Hours) RoomSemi Private (Community) Residence Hall Fee Board Tax on Board Minimum Per-Semester (On-Campus) (excluding student health insurance)
Minimum Per-Semester (Off-Campus) (excluding student health insurance)
$6,747 $1,631
$ 27 $1,813
$150 $10,368
$6,747

Huston-Tillotson University Fact Book 2013-2014
- 2 -
HT Data Dashboard
Student Headcount Enrollment Trends Excerpt from pg. 51
First-Time Freshmen Headcount Enrollment Fall 1999 - Fall 2013
First-Time Freshmen Retention
Excerpt from pg. 59
Baccalaureate Completions* By Year Excerpt from pg. 60
Excerpt from pg. 52
506
695 714 653
536
539 611
641
701 696
621 547
596 621 641 666
685 706
742 768 785
882 901 904
918
973
88
89
90
91
92
93
94
95
96
97
98
99
00
01
02
03
04
05
06
07
08
09
10
11
12
13
27%
35%
26% 19%
38% 30%
20%
31% 30% 34%
26% 29%
28%
39% 34%
25%
43%
29%
28%
38% 36% 39%
32% 36%
42%
55% 55%
45%
56%
43%
52% 52% 50% 55%
50% 50%
57% 51%
99 00 01 02 03 04 05 06 07 08 09 10 11 12
4th year return 3rd year return 2nd year return
29%
105
73 64
58 69
80
94 93 94 93
120 130
121 125
2001 2002 2003 2004 2005 2006 2007 2008 2009 2010 2011 2012 2013 2014
107
135
104 121
177 182
168
186 194
179
250
269
182
209 228
Fall
'99
Fall
'00
Fall
'01
Fall
'02
Fall
'03
Fall
'04
Fall
'05
Fall
'06
Fall
'07
Fall
'08
Fall
'09
Fall
'10
Fall
'11
Fall
'12
Fall
'13

Huston-Tillotson University Fact Book 2013-2014
- 3 -
Accreditation
Huston-Tillotson University is accredited by the Commission on Colleges of the Southern Association of
Colleges and Schools to award baccalaureate degrees. Contact the Commission on Colleges at 1866
Southern Lane, Decatur, Georgia 30033-4097 or call 404-679-4500 for questions about the accreditation
of Huston-Tillotson University.
To gain or maintain accreditation with the Commission on Colleges, an institution must
comply with the standards contained in the Principles of Accreditation: Foundations for
Quality Enhancement and with the policies and procedures of the Commission on
Colleges. The Commission on Colleges applies the requirements of its Principles to all
applicant, candidate, and member institutions, regardless of type of institution (public,
private-for-profit, private not-for-profit).
Huston-Tillotson University is listed with and recognized by the Texas Education Agency and The
Commission on Black Colleges of the University Senate of the Board of Higher Education and Ministry
of The United Methodist Church.
The following business programs at Huston-Tillotson University are accredited by the Accreditation
Council for Business Schools and Programs (ACBSP): Business Administration (B.A.)
Huston-Tillotson University Fact Book 2013-2014
- 4 -
Institutional Memberships
HT holds memberships in numerous professional organizations and societies, including the following:
• American College Personnel Association (ACPA)
• American Council on Education (ACE)
• Council for Advancement and Support of Education (CASE)
• Council for Higher Education of the United Church of Christ
• Council of Independent Colleges (CIC)
• Council on Higher Education Accreditation (CHEA)
• Independent Colleges and Universities of Texas (ICUT)
• National Association for Equal Opportunity in Higher Education (NAFEO)
• National Association for Collegiate Registrars and Admissions Officers (NACRAO)
• National Association of Independent Colleges and Universities (NAICU)
• National Association of Intercollegiate Athletics (NAIA)
• National Association of Schools and Colleges of The United Methodist Church
• National Association of Student Personnel Administrators (NASPA)
• Texas Association of Developing Colleges (TADC)
• Texas United Methodist College Association (TUMCA)
• United Negro College Fund (UNCF)

Huston-Tillotson University Fact Book 2013-2014
- 5 -
Mission Statement
As an historically black institution, Huston-Tillotson University’s mission is to provide opportunities to a
diverse population for academic achievement with an emphasis on academic excellence, spiritual and
ethical development, civil engagement, and leadership in a nurturing environment.
Vision Statement
Huston-Tillotson University will be a leader in the education of diverse populations. We will empower
students for success in a global society as critical thinkers, lifelong learners, and ethical citizens.

Huston-Tillotson University Fact Book 2013-2014
- 6 -
University Governance
Huston-Tillotson University is governed by a self-perpetuating Board of Trustees consisting of distinguished local and national alumni, educators, entrepreneurs, church representatives, and community leaders. The Board of Trustees meets two times per year, and is responsible for the mission, vision and governance of the University and the supervision of the President. Below is the Board of Trustees as of Spring 2014. Officers
Mr. Albert Hawkins, Chairperson Austin, TX Dr. C. Mark Melliar-Smith, Vice-Chairperson Austin, TX Ms. Donna D. Carter, Secretary Austin, TX Mr. Trennis Jones, Treasurer Austin, TX
Members
Mrs. Cecelia P. Abbott Austin, TX Mrs. Francis H. Alford Grafton, VT Mr. C. Lee Cooke Austin, TX Ms. Jaki Davis Austin, TX Bishop James E. Dorff San Antonio, TX Dr. Larry L. Earvin (ex-officio) Austin, TX Rev. Terrance D. Grant-Malone Houston, TX Mr. Louis M. Henna, Jr. Austin, TX Ms. Lauren Snowden Ingram Chicago, IL Mr. J. Winston Krause Austin, TX Mr. Paul J. Legris Austin, TX Dr. Thomas O. McDowell Ms. Kathryn S. Page
Austin, TX Dallas, TX
Ms. Ruth C. Robinson Dallas, TX Mr. John Scroggins Houston, TX Dr. Beverly G. Sheftall Atlanta, GA Ms. Liz Stewart Austin, TX Mr. David A. Talbot, Jr. Austin, TX Dr. Orlando L. Taylor Washington, DC Mr. A. Leon Thompson Mr. Cal Varner
Austin, TX Austin, TX

Huston-Tillotson University Fact Book 2013-2014
- 7 -
Institutional Goals
Strategic Goal One: Educate All Students According to Their Needs Strategic Goal Two: Enhance Civic Engagement Strategic Goal Three: Prepare Students for Success Strategic Goal Four: Strengthen Partnerships Strategic Goal Five: Ensure Growth and Stability Core Values
Integrity: We believe in honesty, sincerity, and responsibility.
Diversity: We recognize and value the differences that enrich our educational environment.
Excellence: We are committed to the highest standards of expectation and achievement.
Accountability: We believe in taking responsibility for our actions and our outcomes.
Leadership: We set an example and provide an environment that cultivates tomorrow’s leaders.

Huston-Tillotson University Fact Book 2013-2014
- 8 -
Historical overview of Huston-Tillotson University
Tillotson College dates to 1875 when the Congregationalists (now known as the United Church of Christ) worked with the “freedmen,” the descendants of slavery, to establish a secondary school. The secondary school eventually became Tillotson College and Normal Institute. Throughout the years, the Institute changed to Andrews Normal School, a junior college, a woman’s college, and a senior college. Samuel Huston College dates to 1876 when the Reverend George Warren Richardson, a Methodist minister from Minnesota, leased St. Paul Methodist Episcopal Church in Dallas, Texas, as the school for the colored youth of Dallas. A fire destroyed St. Paul and the school was relocated to a temporary site and then to the Colored Methodists Church of America. The Methodist West Texas Conference relocated the school to Austin, Texas, and Wesley Chapel Methodist Episcopal Church, now Wesley United Methodist Church. Huston-Tillotson College, chartered in 1952 by the State of Texas, represents the merger of Tillotson College and Samuel Huston College. After merging, Huston-Tillotson College became the sole provider of higher education for African-Americans in Central Texas until the landmark case of Brown v. Board of Education (1954), which launched the period of desegregation. Huston-Tillotson College officially became Huston-Tillotson University on February 28, 2005.

Huston-Tillotson University Fact Book 2013-2014
- 9 -
University President
Larry L. Earvin, Ph.D.
President and Chief Executive Officer Huston-Tillotson University
Dr. Earvin’s service to HT as President began July 1, 2000. Dr. Earvin earned his bachelor’s degree in
Business Administration at Clark College (now Clark Atlanta University), a master’s Degree in Urban
Planning from Georgia State University, and a doctorate in American Studies from Emory University.
Before accepting the presidency at Huston-Tillotson, Dr. Earvin was Dean of the College of Arts and
Sciences at Clark Atlanta University. Previously he had been a faculty member and had held a series of
deanships at Clark and Clark Atlanta. A native of Chattanooga, Tennessee, Dr. Earvin and his late wife
Valerie became the parents of a son, William Jarrett, in 1977, and a daughter, Allyson, in 1980.
Dr. Earvin was elected as chair of the Southern Association of Colleges and Schools Commission on
Colleges (SACSCOC) Board of Trustees for 2013. He was also recently named to the Educational
Testing Services’ (ETS) Historically Black College Steering Committee, the Association of Governing
Board’s Task Force on Government, the Council on Higher Education Accreditation’s Task Force, on
advocacy the National Association of Intercollegiate Athletics (NAIA) Board of Directors and the
University Senate of The United Methodist Church.

Huston-Tillotson University Fact Book 2013-2014
- 10 -
Former Presidents-Samuel Huston College
1876-1882
Dr. George O. Richardson
1885-1888 Dr. Thomas M. Dart
1900-1916
Dr. Reuben Shannon Lovinggood
1916-1917 Dr. J.W. Frazier, Interim President
1917-1920
Dr. Mathew Simpson Davage
1920-1923 Dr. Joseph P. Randolph
1923-1926
Bishop Robert N. Brooks
1926-1930 Dr. Thomas Russell Davis
1930-1932
Bishop Willis J. King
1932-1943 Dr. Stanley E. Graunnum
1943-1948
Dr. Karl Everett Downs
1948-1952 Dr. Robert Harrington

Huston-Tillotson University Fact Book 2013-2014
- 11 -
Former Presidents-Tillotson College
1881-1884
Dr. William E. Brooks
1884-1886 Dr. John Kershaw
1886-1888
Dr. Henry L. Hubbell
1888-1894 Dr. William M. Brown
1894-1896
Dr. Winfield S. Goss
1896-1902 Dr. Marshall R. Gaines
1902-1905
Dr. Arthur W. Partch
1905-1918 Dr. Isaac Merrit Agard
1918-1924
Dr. Francis Wayland Fletcher
1924-1930 Dr. J. T. Hodges
1930-1944
Dr. Mary Elizabeth Branch
1944-1952 Dr. William H. Jones
Huston-Tillotson University Fact Book 2013-2014
- 12 -
Former Presidents- Huston-Tillotson College
1952-1955
Dr. Mathew Simpson Davage
1955-1965
Dr. John Jarvis Seabrook
1965-1988
Dr. John Quill Taylor King, Sr.
1988-2000
Dr. Joseph T. McMillan, Jr.
2000-
Dr. Larry L. Earvin

Huston-Tillotson University Fact Book 2013-2014
- 13 -
Executive Administration
President and CEO
Dr. Larry L. Earvin, Ph.D.
Executive Assistant to the President Dr. Terry S. Smith
Interim Provost and Vice President for Academic and Student Affairs
Dr. Archibald Vanderpuye
Vice President for Administration and Finance Ms. Valerie Hill
Vice President for Institutional Advancement
Dr. Roderick L. Smothers
Deans
Interim Dean of School of Business and Technology Dr. Kathryn Davis
Interim Dean of College of Arts and Sciences
Dr. Rosalee Martin
Dean of the University College Dr. Jeff Wilson
Dean of Student Affairs Dr. LaTanya D. Lowery

Huston-Tillotson University Fact Book 2013-2014
- 14 -
International Alumni Association
HT Association Officers President - Dr. Thomas McDowell ‘82 13113 Rochester Lane Austin, Texas 78753 512.990.2809
Financial Secretary - Tracee M. Fletcher ‘96 P. O. Box 841162 Pearland, Texas 77584 713.202.9322
President Elect - Louie Carrington ‘71 3903 Wichita St. Houston TX 77004 713.529.7785
Treasurer - Gaynell Carrington-Brown ‘94 P. O. Box 841162 Pearland, Texas 77584 713.825.1548
Vice President - Angela Fazarro ‘90 326 Regal Drive Allen, TX 75002 936.689.7696
Historian - Andrea Mosie ‘75 4939 Lingonberry Street Houston, TX 77033 713.738.0631
Recording Secretary - Jennifer Jones ‘71 16531 Lonesome Quail Drive Missouri City, TX 77489 713.419.6636
Sergeant-at-Arms - Carolyn Thompson ‘81 7203 Oakwood Glen Blvd #905 Spring, Texas 77379 832.396.6096
Assistant Secretary - Valerie Haywood ‘74 2910 Overland Trail Dickinson, Texas 77539 512.497.6658
Alumni Board of Trustees Representative ‘61 Kathryn S. Page 5116 Woodsboro Lane Dallas, TX 75241 214.376.0835
Corresponding Secretary - China O'Bryant ‘99 P. O. Box 841162 Pearland, Texas 77584 281.706.7636
Immediate Past President - John D. Mays ‘72 12410 Garrod Lee Cove Austin, TX 78724 214.755.0962 (cell)

Huston-Tillotson University Fact Book 2013-2014
- 15 -
Alumni Chapter Presidents
Austin Baltimore-D.C. Metro Bastrop County Alta Moten-Alexander ‘05 9101 Frostwood Trail Austin, TX 78729
Gloria Mitchell ‘61 3209 Adams Mills Road NW Washington, D.C. 20010
Gene Sampson ‘62 P.O. 243 Smithville, TX 78957
Bay Area Dallas Fort Worth Helen Harris ‘53 2667 Alhambra Way Pinole, CA 94564
Michelle Harris ‘75 907 N. Willis Street Wills Point, TX 75169
Beverlia Curley ‘63 7537 Maderia Drive Fort Worth, TX 76112
Golden Triangle Houston Los Angeles Bobbie Granger ‘61 3760 Robinson Street Beaumont, TX 77708
Sheryl Jefferson ‘78 P.O. Box 14494 Houston, TX 77221
James Ellis ‘77 12729 Muroc Street Norwalk, CA 90650
Lubbock San Antonio Seguin Homer Norville ‘50 1615 57th Street Lubbock, TX 78412
Irene Davis-Thompson ‘54 10251 Grand Meadow San Antonio, TX 78239
Clarence Little ‘53 1215 Zunker Street Seguin, TX 78155
Waco Coque Gibson ‘71 809 E. Mitchell Street Waco, TX 76704

Huston-Tillotson University Fact Book 2013-2014
- 16 -
Organizational Chart—2013-2014
Board of Trustees
President and Chief Executive Oficer
Vice President for Administration and
Finance
Director of Accounting and
Financial Reporting
Director of Human Resources
Director of Information Technology
Director of Budget and Contracts
Office Manager Accountant
Provost and VP of Academic and Student Affairs
Associate Provost
Dean of the College of Arts and Services
Dean of the School of Business and Technology
Dean of the University College
Dean of Student Affairs
Director of Library and Media Sciences
Director of Financial Aid
Director of Admission
University Chaplain
Vice President of Institutional
Advancement
Director of Public Relations and
Marketing
Director of Alumni Affairs
Director of Development
Director of Advancement Service
Director of Sponsored Programs and Title III
Senior Development Officer
Executive Assistant to the President
Special Assistant to the President
Director of Institutional Planning,
Research and Assessment
Director of intercollegiate
Athletics

Huston-Tillotson University Fact Book 2013-2014
- 17 -
Degree Programs
Huston-Tillotson University offers Associate of Arts in Liberal Arts (AA), Bachelor of Arts (BA) and
Bachelor of Science (BS) degrees through the College of Arts and Sciences.
COLLEGE OF ARTS AND SCIENCES Associate of Arts in Liberal Arts (AA)
Department of Educator Preparation Major Education (BA) Early Childhood (EC)-6 Generalist Certification Special Education EC-12 Certification 8-12 Technology Applications Certification
Department of Humanities and Fine Arts Majors Communication (BA)*
o Communication Studies o Journalism
English (BA)* o Literary Arts o Writing Arts English 7-12 Teacher Certification
History (BA)* History/Social Studies 7-12 Teacher Certification
Music (BA)* o Voice o Instruments EC-12 Music Teacher Certification
Minors - African and African American Studies - Professional Writing - Religious Studies
Department of Kinesiology Major Kinesiology (BA/BS)* Physical Education EC-12 Teacher Certification o Human Performance o Exercise Science
Represents major o Represents concentration - Represents minor Represents certification * Denotes a minor as well as a major available in the subject area.

Huston-Tillotson University Fact Book 2013-2014
- 18 -
Degree Programs
Huston-Tillotson University offers Bachelor of Arts (BA) and Bachelor of Science (BS) degrees through
the College of Arts and Sciences.
COLLEGE OF ARTS AND SCIENCES
Department of Natural Sciences Majors Biology (BA/BS)*
o Biology o Environmental Science o Human Biology o Pre-Medical Biology/Science 7-12 Teacher Certification
Chemistry (BS)*
Minor - Health Physics (Nuclear Science)
Department of Mathematics Majors Mathematics (BA/BS)*
o Mathematics Mathematics 7-12 Teacher Certification
Pre-Engineering (BS)* Department of Social and Behavioral Sciences Majors Criminal Justice (BA)* Political Science (BA)* Psychology (BA)* Sociology (BA)*
Minor - Pre-Law
Represents major o Represents concentration - Represents minor Represents certification * Denotes a minor as well as a major available in the subject area.

Huston-Tillotson University Fact Book 2013-2014
- 19 -
Degree Programs (cont.)
Huston-Tillotson University offers Bachelor of Arts (BA) and Bachelor of Science (BS) degrees through
the School of Business and Technology.
SCHOOL OF BUSINESS AND TECHNOLOGY
Department of Business Administration Major Business Administration (BA)*
o Accounting o Management o Marketing
Department of Computer Science Majors Computer Science (BS)* Computer Information Systems (BS)
Represents major o Represents concentration - Represents minor Represents certification * Denotes a minor as well as a major available in the subject area.

Huston-Tillotson University Fact Book 2013-2014
- 20 -
Alternative Teacher Certificate Program
Through the College of Arts and Sciences, Huston-Tillotson University’s Teacher Education program
offers coursework and alternative routes to certification through the Alternative Teacher Certification
Program (ATCP). The ATCP Program offers the following certificates:
Elementary Level Certificate • Generalist EC-6
Middle Level Certificate • Generalist 4-8
Single Subject Certificates • Computer Science 8-12
• English Language Arts and Reading 8-12
• History 8-12
• Life Sciences 8-12
• Mathematics 4-8
• Mathematics 8-12
• Mathematics/Science 4-8
• Music EC-12
• Physical Education EC-12
• Physical Sciences 8-12
• Science 4-8
• Science 8-12
• Social Studies 4-8
• Social Studies 8-12
• Special Education EC-12
• Technology Applications 8-12
All Level Supplemental Certificates*
• Bilingual Education Supplemental*
• English as a Second Language Supplemental*
• Special Education Supplemental*
*Must also earn EC-6 Generalist, 4-8 Generalist, or a single subject certification
Huston-Tillotson University Fact Book 2013-2014
- 21 -
Intercollegiate Athletics
The mission of the Huston-Tillotson University Athletic Department is to provide opportunities for
competition in intercollegiate athletics while ensuring an atmosphere that emphasizes both academic and
athletic excellence. The Athletic Department is committed to the principle that participation in athletics is
integral to the total educational process, as well as the personal growth of each student-athlete. We strive
to ensure all of our student-athletes are “Champions of Character” and model the values of Respect,
Responsibility, Integrity, Sportsmanship and Servant Leadership. The mission of the Athletic Program is
and shall always remain compatible with the mission of the University.
Huston-Tillotson University is a member of the National Association of Intercollegiate Athletics (NAIA)
and the Red River Athletic Conference (RRAC) and all athletic teams are governed by the constitution
and bylaws of each group. HT fields 10 varsity teams in the sports of men’s and women’s soccer,
women’s volleyball, men’s cross country, men’s and women’s basketball, men’s and women’s outdoor
track and field, baseball, and softball.
HT Tradition HT athletics has a rich history of tradition and excellence. Early days saw legend Jackie Robinson serving
as Basketball Coach for Sam Houston College in 1945, prior to his signing with the Brooklyn Dodgers
and becoming the 1st African-American in professional sports in America. Baseball Hall of Famer, Willie
Wells, was a HT student. Julian Spence went on to play for the NFL’s Chicago Cardinals. Jim Gathers
won a bronze medal in the 200-meter at the 1952 Olympics. More recently, HT student-athletes have
included Victor Wallace (Pan American Games National Champion), Serge Vengono (a 100-meter
sprinter in the 2000 Olympic Games), Ben Parker (pitcher drafted in 2004 by the Cincinnati Reds), Andre
Pitts (veteran professional basketball player for international basketball leagues) and 9 National
Champions in Track and Field, and numerous Conference titles in men’s soccer, men’s/women’s
basketball and baseball as well as several NAIA National Championship appearances in various sports.
HT’s Intercollegiate Athletic Program The Student-Athlete Advisory Committee (SAAC) of Huston-Tillotson University is dedicated to the
athletic and academic advancement of all student-athletes. The mission of SAAC is to enhance the total
student-athlete experience by promoting opportunity, protecting student-athlete well-being and fostering a
positive student-athlete image to the Campus and community. The SAAC supports and upholds the core
values of the University: academic excellence, integrity, community, respect, compassion, justice, and
active leadership. Each team is represented by two athletes that are recommended by their Head Coach.
The SAAC Executive Board, comprised of President, Vice President, Secretary and Treasurer, are
annually elected at the end of the spring semester by a 2/3 majority of the SAAC representatives.

Huston-Tillotson University Fact Book 2013-2014
- 22 -
Intercollegiate Athletics (cont.)
HT Athletics Staff Fall 2013-Spring 2014
Staff Position Phone Email
Ellen McEwen Director of Intercollegiate Athletics 512.505.3055 [email protected]
Charles H. Dubra Assistant Director of Intercollegiate Athletics
512.505.3050 [email protected]
Rob Ferguson Men's Soccer Coach 512.505.3051 [email protected]
Ronnie C. Kaase Women’s Volleyball & Sports Information Director
512.505.3048 [email protected]
Maurice Callis Women's Basketball Coach 512.505.3052 [email protected]
Thomas Henderson Men’s Basketball Coach 512.505.3053 [email protected]
Alvin L. Moore Men’s Baseball Coach and Business Manager
512.505.3151 [email protected]
Howard H. Ware Cross Country Coach and Outdoor Track and Field Coach
512.505.3049 [email protected]
Roxanne Rodriguez Women’s Softball Coach 512.505.3056 [email protected]
Andy Tunnicliffe Women’s Soccer Coach 512.505.3057 [email protected]
Amii R. Johnson Athletic Trainer 512.505.3199 [email protected]
Joshua Reyes Intramural Director and Assistant Men’s Soccer Coach
512.505.6466 [email protected]
Lee McCormick Strength and Conditioning Coach 512.799.6472 [email protected]
Vacant Cheerleading -- --
Huston-Tillotson University Fact Book 2013-2014
- 23 -
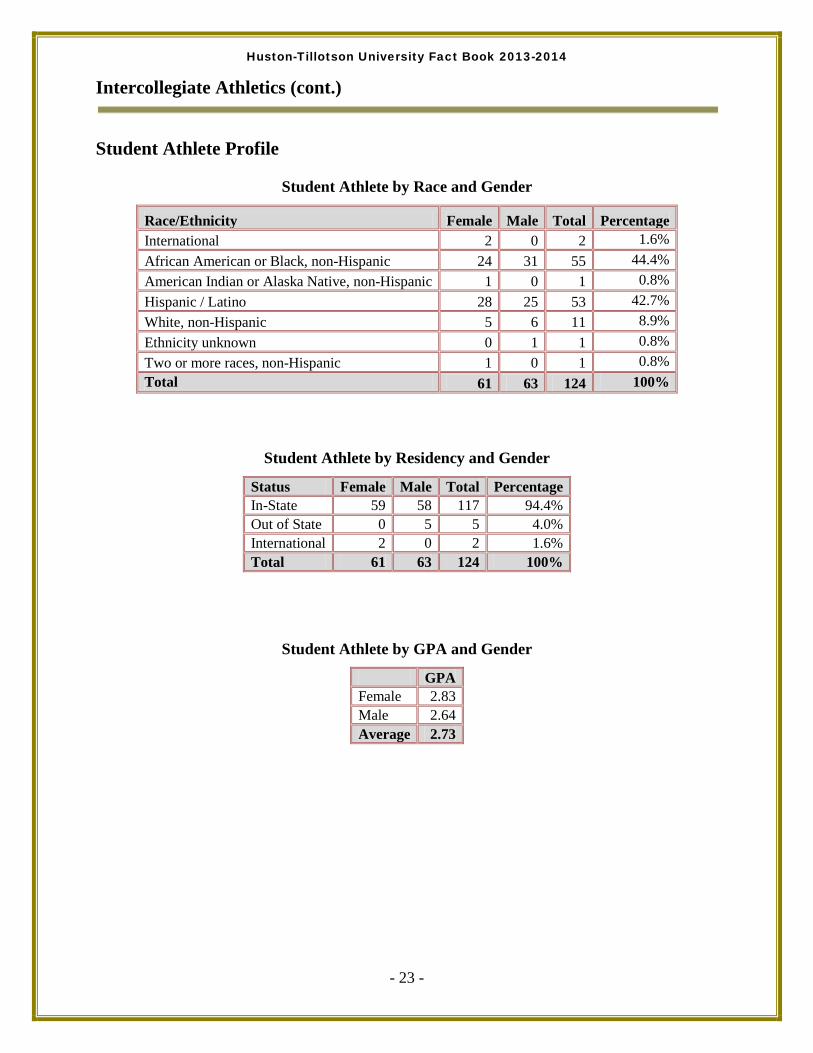
Intercollegiate Athletics (cont.)
Student Athlete Profile
Student Athlete by Race and Gender
Race/Ethnicity Female Male Total Percentage International 2 0 2 1.6% African American or Black, non-Hispanic 24 31 55 44.4% American Indian or Alaska Native, non-Hispanic 1 0 1 0.8% Hispanic / Latino 28 25 53 42.7% White, non-Hispanic 5 6 11 8.9% Ethnicity unknown 0 1 1 0.8% Two or more races, non-Hispanic 1 0 1 0.8% Total 61 63 124 100%
Student Athlete by Residency and Gender
Status Female Male Total Percentage In-State 59 58 117 94.4% Out of State 0 5 5 4.0% International 2 0 2 1.6% Total 61 63 124 100%
Student Athlete by GPA and Gender
GPA Female 2.83 Male 2.64 Average 2.73
Huston-Tillotson University Fact Book 2013-2014
- 24 -
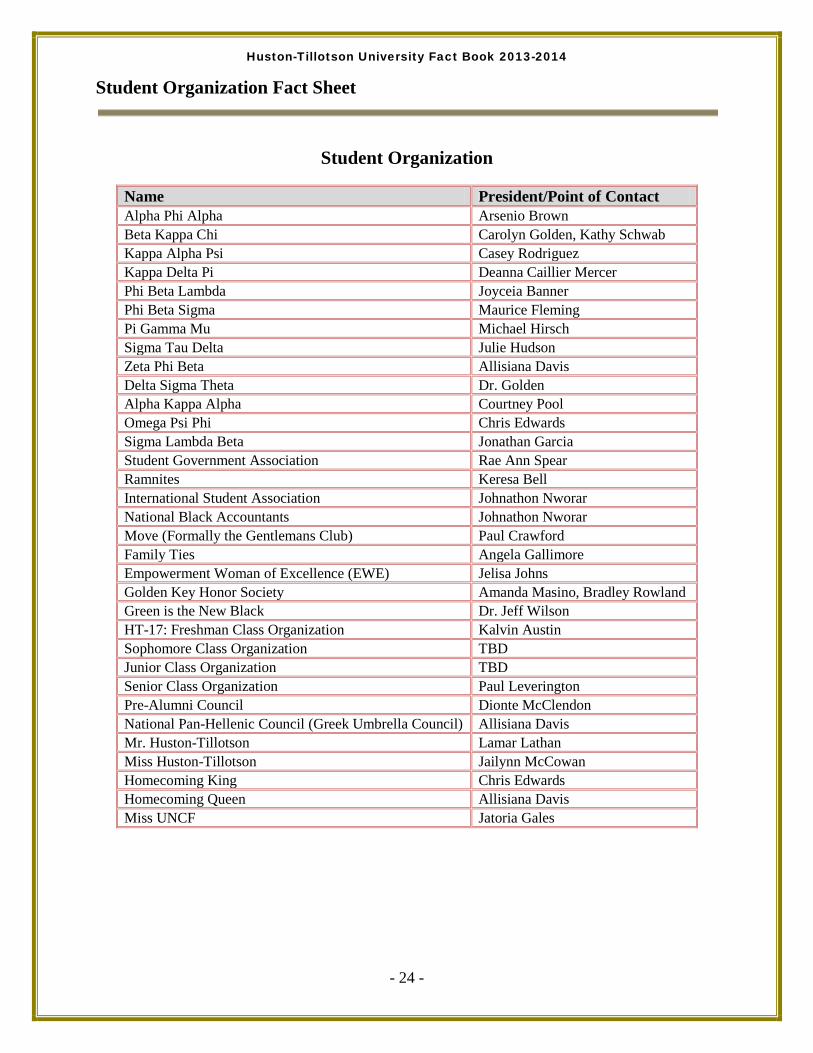
Student Organization Fact Sheet
Student Organization
Name President/Point of Contact Alpha Phi Alpha Arsenio Brown Beta Kappa Chi Carolyn Golden, Kathy Schwab Kappa Alpha Psi Casey Rodriguez Kappa Delta Pi Deanna Caillier Mercer Phi Beta Lambda Joyceia Banner Phi Beta Sigma Maurice Fleming Pi Gamma Mu Michael Hirsch Sigma Tau Delta Julie Hudson Zeta Phi Beta Allisiana Davis Delta Sigma Theta Dr. Golden Alpha Kappa Alpha Courtney Pool Omega Psi Phi Chris Edwards Sigma Lambda Beta Jonathan Garcia Student Government Association Rae Ann Spear Ramnites Keresa Bell International Student Association Johnathon Nworar National Black Accountants Johnathon Nworar Move (Formally the Gentlemans Club) Paul Crawford Family Ties Angela Gallimore Empowerment Woman of Excellence (EWE) Jelisa Johns Golden Key Honor Society Amanda Masino, Bradley Rowland Green is the New Black Dr. Jeff Wilson HT-17: Freshman Class Organization Kalvin Austin Sophomore Class Organization TBD Junior Class Organization TBD Senior Class Organization Paul Leverington Pre-Alumni Council Dionte McClendon National Pan-Hellenic Council (Greek Umbrella Council) Allisiana Davis Mr. Huston-Tillotson Lamar Lathan Miss Huston-Tillotson Jailynn McCowan Homecoming King Chris Edwards Homecoming Queen Allisiana Davis Miss UNCF Jatoria Gales

Huston-Tillotson University Fact Book 2013-2014
- 25 -
Section II: Student Profile
Demographic Enrollment Statistics: Fall 2013 – Total Student
Total Student Headcount Enrollment by Classification and Gender
Classification Female Male Total Percentage of total Student Population
First Time Freshmen 120 108 228 23.4%
Freshmen (continuing, returning, & transfer) 88 95 183 18.8%
Sophomore 95 83 178 18.3%
Junior 109 71 180 18.5%
Senior 82 71 153 15.7%
Undergraduate Non-degree Seeking (NDS) 0 4 4 0.4%
Post Baccalaureate/ATCP 31 16 47 4.8%
Total 525 448 973 100%
108 95
83 71 71
4 16
120
88 95 109
82
0
31
Firs
t Tim
e Fr
eshm
en
Fres
hmen
(con
tinui
ng,
retu
rnin
g, &
tran
sfer
)
Soph
omor
e
Juni
or
Seni
or
Und
ergr
adua
te N
on-
degr
ee S
eeki
ng (N
DS)
Post
Bac
cala
urea
te/A
TCP
Total Student Headcount Enrollment by Classification and Gender
Male Female

Huston-Tillotson University Fact Book 2013-2014
- 26 -
Demographic Enrollment Statistics - Fall 2013: Total Student (cont.)
Total Student Headcount and Full-Time Equivalent (FTE) Summary by Level and Status
Status Undergraduate ATCP Total Percentage Full-Time 840 0 840 86.3% Part-Time 86 47 133 13.7% Total Students 926 47 973 100% FTE* 873.79 17.96
*FTE is calculated based on fall student headcounts as reported by the institution on the IPEDS Enrollment component (Part A).
Total Student Headcount Enrollment by Level and Status
Level FT PT Total Percentage Undergraduate 840 86 926 95.2% ATCP 0 47 47 4.8% Total 840 133 973 100%
*ATCP: Alternative Teacher Certification Program
Total Student Headcount Enrollment by Level and Gender
Level Female Male Total Percentage Undergraduate Full-Time 442 398 840 86.3% Undergraduate Part-Time 52 34 86 8.8% ATCP Full-Time 0 0 0 0% ATCP Part-Time 31 16 47 4.8% Total 525 448 973 100%
*ATCP: Alternative Teacher Certification Program

Huston-Tillotson University Fact Book 2013-2014
- 27 -
Demographic Enrollment Statistics - Fall 2013: Undergraduate
Undergraduate: Headcount Enrollment by Level and Classification
Class Female Male Total Percentage First-Time Freshmen 120 108 228 24.6% Transfer-in Students 70 65 135 14.6% Continuing Students 304 259 563 60.8% Total 494 432 926 100%
Undergraduate: Headcount Enrollment by Level and Status
Level FT PT Total Percentage Traditional Undergraduate 764 86 850 91.8% ADP Undergraduate 76 0 76 8.2% Total 840 86 926 100%
Undergraduate: Headcount Enrollment by Level and Gender
Level Female Male Total Percentage Traditional Undergraduate Full-Time 397 367 764 82.5% Traditional Undergraduate Part-Time 52 34 86 9.3% ADP Full-Time 45 31 76 8.2% ADP Part-Time 0 0 0 0% Total 494 432 926 100%
Undergraduate: Headcount Enrollment by Race and Gender
Race/Ethnicity Female Male Total Percentage International 11 20 31 3.3% African American or Black, non-Hispanic 377 299 676 73.0% American Indian or Alaska Native, non-Hispanic 1 0 1 0.1% Asian, non-Hispanic 2 2 4 0.4% Hispanic / Latino 80 87 167 18.0% Native Hawaiian or other Pacific Islander, non-Hispanic 0 0 0 0.0% White, non-Hispanic 17 20 37 4.0% Ethnicity unknown 3 3 6 0.6% Other 1 0 1 0.1% Two or more races, non-Hispanic 2 1 3 0.3% Total 494 432 926 100.0%

Huston-Tillotson University Fact Book 2013-2014
- 28 -
Demographic Enrollment Statistics - Fall 2013: Undergraduate (cont.)
Undergraduate: Headcount Enrollment by Age and Gender
Age of Students Female Male Total Percentage 18 and under 98 72 170 18.4%
19-20 132 122 254 27.4% 21-22 97 104 201 21.7% 23-25 56 60 114 12.3% 26-30 42 30 72 7.8% 31-35 24 16 40 4.3% 36-40 12 12 24 2.6% 41-45 13 9 22 2.4% 46-50 9 3 12 1.3% 51-55 9 5 14 1.5%
Over 55 2 1 3 0.3% Total 494 432 926 100%

Huston-Tillotson University Fact Book 2013-2014
- 29 -
Geographic Statistics - Fall 2013: Undergraduate
Undergraduate: Headcount Enrollment by Residency
Status Female Male Total Percentage In-State 450 385 835 90.2% Out of State 33 27 60 6.5% International 11 20 31 3.3% Total 494 432 926 100%
Undergraduate: Headcount Enrollment by Country of Origin
Country of Origin Number Percentage 895 United States 96.7%
Bahamas 1 0.1% China 2 0.2% DR Congo 1 0.1% Ethiopia 1 0.1% Hong kong 1 0.1% Lesotho 2 0.2% Liberia 1 0.1% Mexico 3 0.3% Morocco 1 0.1% Nigeria 9 1.0% Niger 1 0.1% Sierra Leone 1 0.1% Trinidad and Tobago 2 0.2% Uganda 1 0.1% Zimbabwe 4 0.4% Totals 926 100%
Huston-Tillotson University Fact Book 2013-2014
- 30 -
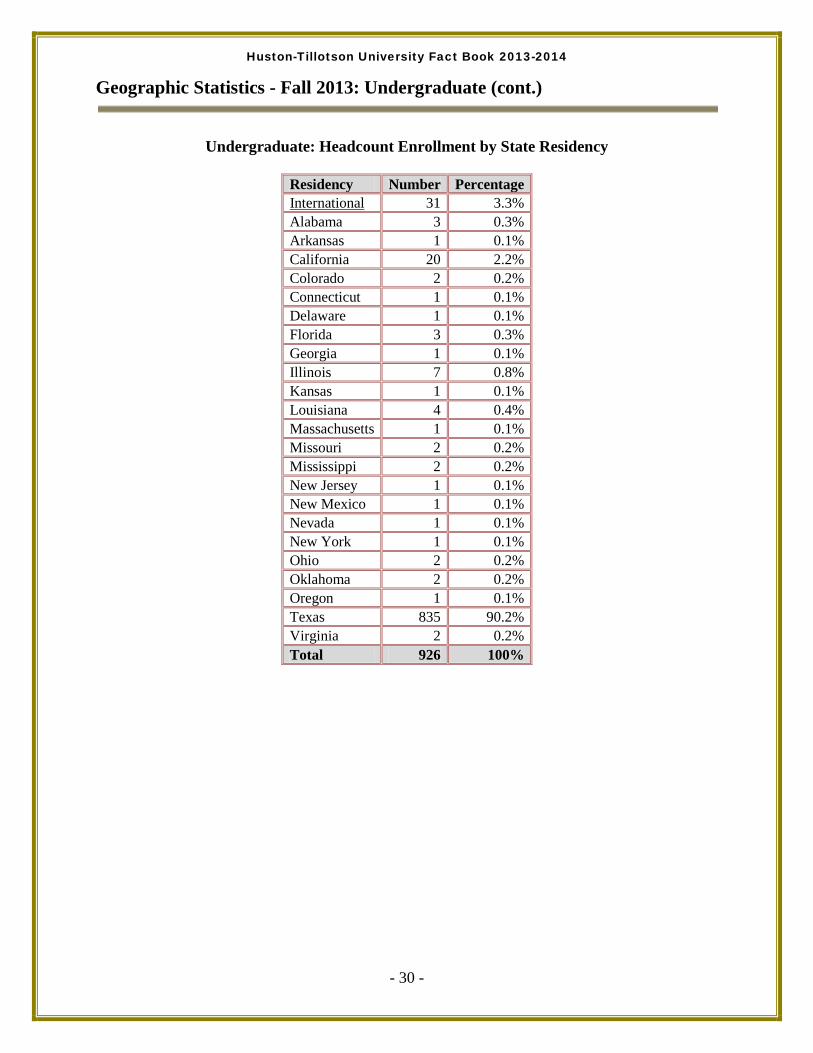
Geographic Statistics - Fall 2013: Undergraduate (cont.)
Undergraduate: Headcount Enrollment by State Residency
Residency Number Percentage
31 International 3.3% Alabama 3 0.3% Arkansas 1 0.1% California 20 2.2% Colorado 2 0.2% Connecticut 1 0.1% Delaware 1 0.1% Florida 3 0.3% Georgia 1 0.1% Illinois 7 0.8% Kansas 1 0.1% Louisiana 4 0.4% Massachusetts 1 0.1% Missouri 2 0.2% Mississippi 2 0.2% New Jersey 1 0.1% New Mexico 1 0.1% Nevada 1 0.1% New York 1 0.1% Ohio 2 0.2% Oklahoma 2 0.2% Oregon 1 0.1% Texas 835 90.2% Virginia 2 0.2% Total 926 100%

Huston-Tillotson University Fact Book 2013-2014
- 31 -
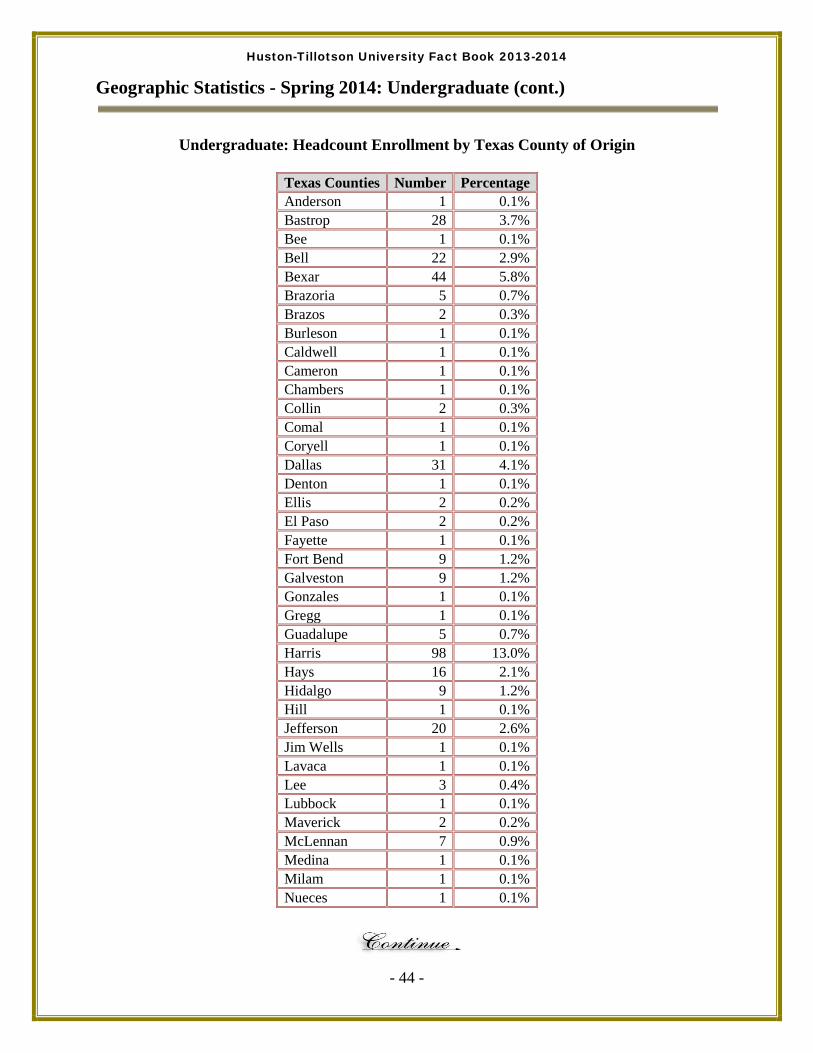
Geographic Statistics - Fall 2013: Undergraduate (cont.)
Undergraduate: Headcount Enrollment by Texas County of Origin
Texas Counties Number Percentage Aransas 1 0.1% Bastrop 26 3.1% Bee 1 0.1% Bell 25 3.0% Bexar 47 5.6% Bowie 1 0.1% Brazoria 5 0.6% Brazos 2 0.2% Burleson 1 0.1% Caldwell 1 0.1% Cameron 1 0.1% Chambers 1 0.1% Collin 1 0.1% Dallas 37 4.4% Denton 2 0.2% Ellis 2 0.2% El Paso 2 0.2% Fayette 2 0.2% Fort Bend 12 1.4% Galveston 10 1.2% Gonzales 1 0.1% Gregg 1 0.1% Grimes 1 0.1% Guadalupe 5 0.6% Harris 108 12.9% Hays 14 1.7% Hidalgo 13 1.6% Hill 1 0.1% Houston 1 0.1% Jefferson 24 2.9% Jim Wells 1 0.1% Kendall 1 0.1% Kleberg 1 0.1% Lee 3 0.4% Lubbock 1 0.1% Maverick 2 0.2%

Huston-Tillotson University Fact Book 2013-2014
- 32 -
Geographic Statistics - Fall 2013: Undergraduate (cont.)
Undergraduate: Headcount Enrollment by Texas County of Origin (cont.)
Texas Counties Number Percentage McLennan 11 1.3% Medina 1 0.1% Milam 1 0.1% Morris 1 0.1% Nueces 1 0.1% Parker 1 0.1% Polk 1 0.1% Starr 2 0.2% Tarrant 33 4.0% Taylor 1 0.1% Throckmorton 1 0.1% Tom Green 1 0.1% Travis 341 40.8% UValde 1 0.1% Victoria 2 0.2% Waller 3 0.4% Wharton 4 0.5% Wichita 1 0.1% Williamson 65 7.8% Wilson 2 0.2% Zapata 2 0.2% Unknown 1 0.1% Total 835 100%

Huston-Tillotson University Fact Book 2013-2014
- 33 -
Geographic Statistics - Fall 2013: First-Time Freshmen (FF)
First-Time Freshmen (FF): Headcount Enrollment by Country of Origin
Country of Origin Number Percentage China 1 0.4% Lesotho 1 0.4% Niger 1 0.4% Nigeria 2 0.9%
222 United States 97.4% Zimbabwe 1 0.4% Totals 228 100%
First-Time Freshmen (FF): Headcount Enrollment by State Residency
State of Residency Number Percentage Arkansas 1 0.4% California 11 4.8% Colorado 2 0.9% Florida 2 0.9% Illinois 3 1.3% Louisiana 1 0.4% Missouri 1 0.4% New Mexico 1 0.4% Ohio 2 0.9% Texas 198 86.8%
6 International 2.6% Total 228 100%

Huston-Tillotson University Fact Book 2013-2014
- 34 -
Geographic Statistics - Fall 2013: First-Time Freshmen (FF) (cont.)
First-Time Freshmen (FF): Headcount Enrollment by Texas County of Origin
Texas Counties Number Percentage Aransas 1 0.5% Bastrop 8 4.0% Bell 6 3.0% Bexar 17 8.6% Bowie 1 0.5% Brazos 1 0.5% Caldwell 1 0.5% Cameron 1 0.5% Chambers 1 0.5% Dallas 8 4.0% Denton 1 0.5% Ellis 1 0.5% Fort Bend 6 3.0% Galveston 2 1.0% Grimes 1 0.5% Guadalupe 1 0.5% Harris 34 17.2% Hays 4 2.0% Hidalgo 1 0.5% Jefferson 10 5.1% Jim Wells 1 0.5% Lee 2 1.0% McLennan 3 1.5% Starr 2 1.0% Tarrant 14 7.1% Throckmorton 1 0.5% Travis 55 27.8% Victoria 1 0.5% Wharton 3 1.5% Williamson 10 5.1% Total 198 100%

Huston-Tillotson University Fact Book 2013-2014
- 35 -
Geographic Statistics - Fall 2013: ATCP*
ATCP: Headcount Enrollment by Residency
Status Female Male Total Percentage
In-State 30 16 46 97.9% Out of State 1 0 1 2.1% International 0 0 0 0% Total 31 16 47 100%
ATCP: Headcount Enrollment by Texas County of Origin
Texas Counties Number Percentage Bastrop 3 6.5% Bexar 1 2.2% Harris 2 4.3% Travis 33 71.7% Williamson 7 15.2% Total 46 100%
*ATCP Alternative Teacher Certification Program
Huston-Tillotson University Fact Book 2013-2014
- 36 -
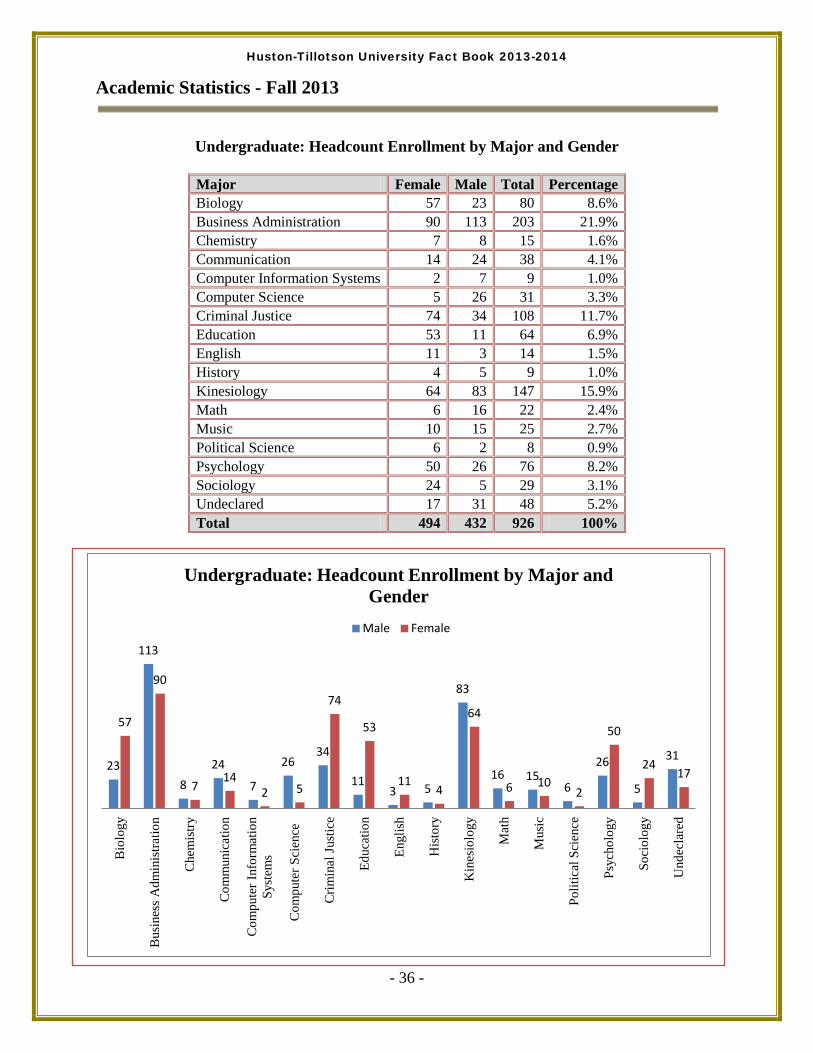
Academic Statistics - Fall 2013
Undergraduate: Headcount Enrollment by Major and Gender
Major Female Male Total Percentage Biology 57 23 80 8.6% Business Administration 90 113 203 21.9% Chemistry 7 8 15 1.6% Communication 14 24 38 4.1% Computer Information Systems 2 7 9 1.0% Computer Science 5 26 31 3.3% Criminal Justice 74 34 108 11.7% Education 53 11 64 6.9% English 11 3 14 1.5% History 4 5 9 1.0% Kinesiology 64 83 147 15.9% Math 6 16 22 2.4% Music 10 15 25 2.7% Political Science 6 2 8 0.9% Psychology 50 26 76 8.2% Sociology 24 5 29 3.1% Undeclared 17 31 48 5.2% Total 494 432 926 100%
23
113
8
24
7
26 34
11 3 5
83
16 15 6
26
5
31
57
90
7 14
2 5
74
53
11 4
64
6 10 2
50
24 17
Bio
logy
Bus
ines
s Adm
inis
tratio
n
Che
mis
try
Com
mun
icat
ion
Com
pute
r Inf
orm
atio
n Sy
stem
s
Com
pute
r Sci
ence
Crim
inal
Jus
tice
Educ
atio
n
Engl
ish
His
tory
Kin
esio
logy
Mat
h
Mus
ic
Polit
ical
Sci
ence
Psyc
holo
gy
Soci
olog
y
Und
ecla
red
Undergraduate: Headcount Enrollment by Major and Gender
Male Female

Huston-Tillotson University Fact Book 2013-2014
- 37 -
Academic Statistics - Fall 2013 (cont.)
First-Time Freshmen (FF): Headcount Enrollment by Major and Gender
Major Female Male Total Percentage Biology 25 12 37 16.2% Business Administration 12 24 36 15.8% Chemistry 1 1 2 0.9% Communication 3 7 10 4.4% Computer Information Systems 0 1 1 0.4% Computer Science 0 5 5 2.2% Criminal Justice 18 9 27 11.8% Education 7 1 8 3.5% English 3 1 4 1.8% History 0 1 1 0.4% Kinesiology 20 20 40 17.5% Math 1 3 4 1.8% Music 5 1 6 2.6% Political Science 1 1 2 0.9% Psychology 11 7 18 7.9% Sociology 2 0 2 0.9% Undeclared 11 14 25 11.0% Total 120 108 228 100%
12
24
1
7
1
5
9
1 1 1
20
3 1 1
7
0
14
25
12
1 3
0 0
18
7
3 0
20
1
5
1
11
2
11
Bio
logy
Bus
ines
s Adm
inis
tratio
n
Che
mis
try
Com
mun
icat
ion
Com
pute
r Inf
orm
atio
n Sy
stem
s
Com
pute
r Sci
ence
Crim
inal
Jus
tice
Educ
atio
n
Engl
ish
His
tory
Kin
esio
logy
Mat
h
Mus
ic
Polit
ical
Sci
ence
Psyc
holo
gy
Soci
olog
y
Und
ecla
red
FF: Headcount Enrollment by Major and Gender Male Female

Huston-Tillotson University Fact Book 2013-2014
- 38 -
Section III: Spring 2014 Student Profile
Demographic Enrollment Statistics: Spring 2014 – Total Student
Total Student: Headcount Enrollment by Classification and Gender
Female Male Total Percentage First-Year, First Time Freshmen (FF) 5 6 11 1.2%
Freshmen (continuing & transfer) 178 149 327 36.8%
Sophomore 96 75 171 19.2%
Junior 80 71 151 17.0%
Senior 102 73 175 19.7%
Non-degree Seeking (NDS) 0 4 4 0.4%
Post Baccalaureate (ATCP)* 33 17 50 5.6%
Total 494 395 889 100%
*ATCP Alternative Teacher Certification Program
6
149
75 71 73
4 17
5
178
96 80
102
0
33
Firs
t-Yea
r, Fi
rst T
ime
Fres
hmen
(FF)
Fres
hmen
(con
tinui
ng &
tra
nsfe
r)
Soph
omor
e
Juni
or
Seni
or
Und
ergr
adua
te N
on-
degr
ee S
eeki
ng (N
DS)
Post
Bac
cala
urea
te/A
TCP
Total Student Headcount Enrollment by Classification and Gender
Male Female

Huston-Tillotson University Fact Book 2013-2014
- 39 -
Demographic Enrollment Statistics: Spring 2014 – Total Student (cont.)
Total Student: Headcount and Full-Time Equivalent (FTE) Summary by Level and Status
Status Undergraduate ATCP Total Percentage Full-Time 765 0 765 86.1% Part-Time 74 50 124 13.9% Total Students 839 50 889 100% FTE* 794.07 19.10 813.17
*FTE is calculated based on fall student headcounts as reported by the institution on the IPEDS Enrollment component (Part A).
Total Student: Headcount Enrollment by Level and Status
Level FT PT Total Percentage Undergraduate 765 74 839 94.4% ATCP* 0 50 50 5.6% Total 765 124 889 100%
*ATCP: Alternative Teacher Certification Program
Total Student: Headcount Enrollment by Level and Gender
Level Female Male Total Percentage Undergraduate Full-Time 419 346 765 86.1% Undergraduate Part-Time 42 32 74 8.3% ATCP Full-Time 0 0 0 0% ATCP Part-Time 33 17 50 5.6% Total 494 395 889 100%

Huston-Tillotson University Fact Book 2013-2014
- 40 -
Demographic Enrollment Statistics: Spring 2014 – Total Student (cont.)
Total Student: Headcount Enrollment by Race and Gender
Race/Ethnicity Female Male Total Percentage International 9 23 32 3.6% African American or Black, non-Hispanic 364 272 636 71.5% American Indian or Alaska Native, non-Hispanic 1 0 1 0.1% Asian, non-Hispanic 2 3 5 0.6% Hispanic / Latino 80 69 149 16.8% Native Hawaiian or other Pacific Islander, non-Hispanic 1 0 1 0.1% White, non-Hispanic 26 24 50 5.6% Ethnicity unknown 4 4 8 0.9% Other 1 0 1 0.1% Two or more races, non-Hispanic 6 0 6 0.7% Total 494 395 889 100.0%

Huston-Tillotson University Fact Book 2013-2014
- 41 -
Demographic Enrollment Statistics - Spring 2014: Undergraduate
Undergraduate: Headcount Enrollment by Level and Classification
Class Female Male Total Percentage First-Time Freshmen 5 6 11 1.3% Transfer-in Students 47 42 89 10.6% Continuing Students 409 330 739 88.1% Total 461 378 839 100%
Undergraduate: Headcount Enrollment by Level and Status
Level FT PT Total Percentage Traditional Undergraduate 669 74 743 88.6% ADP* Undergraduate 96 0 96 11.4% Total 765 74 839 100%
* Adult Degree Program
Undergraduate: Headcount Enrollment by Level and Gender
Level Female Male Total Percentage Traditional Undergraduate Full-Time 363 306 669 79.7% Traditional Undergraduate Part-Time 42 32 74 8.8% ADP Full-Time 56 40 96 11.4% ADP Part-Time 0 0 0 0% Total 461 378 839 100%
Undergraduate: Headcount Enrollment by Age and Gender
Age of Students Female Male Total Percentage 18 and under 63 37 100 11.9%
19-20 129 101 230 27.4% 21-22 83 96 179 21.3% 23-25 71 56 127 15.1% 26-30 42 36 78 9.3% 31-35 22 17 39 4.6% 36-40 9 12 21 2.5% 41-45 15 11 26 3.1% 46-50 12 6 18 2.1% 51-55 12 5 17 2.0%
Over 55 3 1 4 0.5% Total 461 378 839 100%

Huston-Tillotson University Fact Book 2013-2014
- 42 -
Geographic Statistics - Spring 2014: Undergraduate
Undergraduate: Headcount Enrollment by Residency
Status Female Male Total Percentage In-State 423 333 756 90.1% Out of State 29 22 51 6.1% International 9 23 32 3.8% Total 461 378 839 100%
Undergraduate: Headcount Enrollment by Country of Origin
Country of Origin Number Percentage 807 United States 96.2%
Bahamas 1 0.1% China 2 0.2% DR Congo 1 0.1% Hong Kong 1 0.1% Lesotho 1 0.1% Liberia 1 0.1% Mexico 3 0.4% Morocco 1 0.1% Nigeria 9 1.1% Sierra Leone 1 0.1% South Africa 1 0.1% Sri Lanka 4 0.5% Trinidad and Tobago 1 0.1% Uganda 1 0.1% Zimbabwe 4 0.5% Totals 839 100%

Huston-Tillotson University Fact Book 2013-2014
- 43 -
Geographic Statistics - Spring 2014: Undergraduate (cont.)
Undergraduate: Headcount Enrollment by State Residency
Residency Number Percentage
32 International 3.8% Alabama 3 0.4% California 20 2.4% Colorado 1 0.1% Connecticut 1 0.1% Delaware 1 0.1% Florida 2 0.2% Georgia 1 0.1% Illinois 5 0.6% Kansas 1 0.1% Louisiana 3 0.4% Massachusetts 1 0.1% Missouri 1 0.1% Mississippi 2 0.2% New Jersey 1 0.1% New Mexico 1 0.1% Nevada 1 0.1% New York 1 0.1% Ohio 2 0.2% Oregon 1 0.1% Texas 756 90.1% Virginia 2 0.2% Total 839 100%
Huston-Tillotson University Fact Book 2013-2014
- 44 -
Geographic Statistics - Spring 2014: Undergraduate (cont.)
Undergraduate: Headcount Enrollment by Texas County of Origin
Texas Counties Number Percentage Anderson 1 0.1% Bastrop 28 3.7% Bee 1 0.1% Bell 22 2.9% Bexar 44 5.8% Brazoria 5 0.7% Brazos 2 0.3% Burleson 1 0.1% Caldwell 1 0.1% Cameron 1 0.1% Chambers 1 0.1% Collin 2 0.3% Comal 1 0.1% Coryell 1 0.1% Dallas 31 4.1% Denton 1 0.1% Ellis 2 0.2% El Paso 2 0.2% Fayette 1 0.1% Fort Bend 9 1.2% Galveston 9 1.2% Gonzales 1 0.1% Gregg 1 0.1% Guadalupe 5 0.7% Harris 98 13.0% Hays 16 2.1% Hidalgo 9 1.2% Hill 1 0.1% Jefferson 20 2.6% Jim Wells 1 0.1% Lavaca 1 0.1% Lee 3 0.4% Lubbock 1 0.1% Maverick 2 0.2% McLennan 7 0.9% Medina 1 0.1% Milam 1 0.1% Nueces 1 0.1%
Huston-Tillotson University Fact Book 2013-2014
- 45 -
Geographic Statistics - Spring 2014: Undergraduates (cont.)
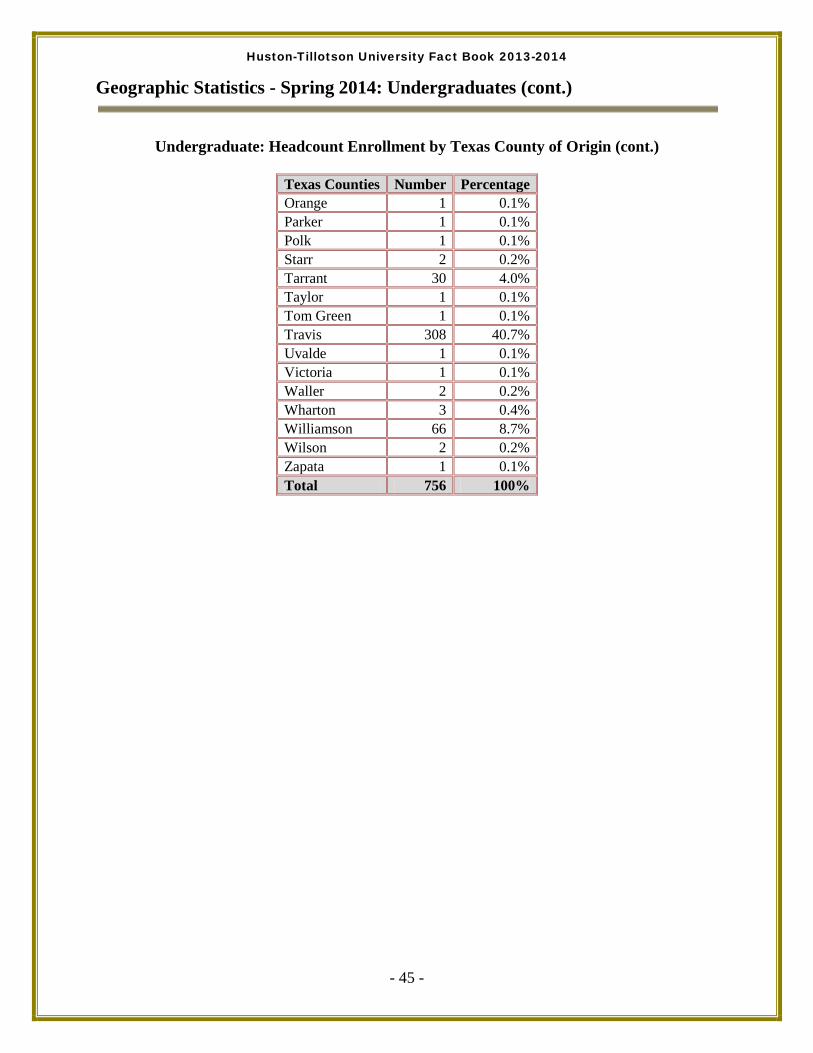
Undergraduate: Headcount Enrollment by Texas County of Origin (cont.)
Texas Counties Number Percentage Orange 1 0.1% Parker 1 0.1% Polk 1 0.1% Starr 2 0.2% Tarrant 30 4.0% Taylor 1 0.1% Tom Green 1 0.1% Travis 308 40.7% Uvalde 1 0.1% Victoria 1 0.1% Waller 2 0.2% Wharton 3 0.4% Williamson 66 8.7% Wilson 2 0.2% Zapata 1 0.1% Total 756 100%

Huston-Tillotson University Fact Book 2013-2014
- 46 -
Geographic Statistics - Spring 2014: First-Time Freshmen (FF)
First-Time Freshmen (FF): Headcount Enrollment by State Residency
State of Residency Number Percentage Texas 11 100% Total 11 100%
First-Time Freshmen (FF): Headcount Enrollment by Texas County of Origin
Texas Counties Number Percentage Bastrop 1 9.1% Bexar 1 9.1% Fort Bend 1 9.1% Harris 2 18.2% Jefferson 1 9.1% Orange 1 9.1% Tarrant 2 18.2% Travis 2 18.2% Total 11 100%

Huston-Tillotson University Fact Book 2013-2014
- 47 -
Geographic Statistics - Spring 2014: ATCP*
ATCP: Headcount Enrollment by Residency Status Female Male Total Percentage
In-State 32 17 49 98.0% Out of State 1 0 1 2.0% Total 33 17 50 100%
ATCP: Headcount Enrollment by Texas County of Origin
Texas Counties Number Percentage Bastrop 3 6.1% Bexar 2 4.1% Harris 1 2.0% Travis 38 77.6% Williamson 5 10.2% Total 49 100%
*ATCP Alternative Teacher Certification Program

Huston-Tillotson University Fact Book 2013-2014
- 48 -
Academic Statistics - Spring 2014
Undergraduate: Headcount Enrollment by Major and Gender
Major Female Male Total Percentage Biology 51 13 64 7.6% Business Administration 98 114 212 25.3% Chemistry 7 5 12 1.4% Communication 11 23 34 4.1% Computer Information Systems 3 8 11 1.3% Computer Science 3 25 28 3.3% Criminal Justice 69 30 99 11.8% Education 54 10 64 7.6% English 11 2 13 1.5% History 4 6 10 1.2% Kinesiology 57 66 123 14.7% Math 6 17 23 2.7% Music 10 13 23 2.7% Political Science 5 1 6 0.7% Psychology 41 24 65 7.7% Sociology 19 6 25 3.0% Undeclared 12 15 27 3.2% Total 461 378 839 100%
13
114
5
23 8
25 30
10 2 6
66
17 13 1
41
6 15
51
98
7 11 3 3
69 54
11 4
57
6 10 5
24 19 12
Bio
logy
Bus
ines
s Adm
inis
tratio
n
Che
mis
try
Com
mun
icat
ion
Com
pute
r Inf
orm
atio
n Sy
stem
s
Com
pute
r Sci
ence
Crim
inal
Jus
tice
Educ
atio
n
Engl
ish
His
tory
Kin
esio
logy
Mat
h
Mus
ic
Polit
ical
Sci
ence
Psyc
holo
gy
Soci
olog
y
Und
ecla
red
Undergraduate: Headcount Enrollment by Major and Gender
Male Female

Huston-Tillotson University Fact Book 2013-2014
- 49 -
Academic Statistics - Spring 2014 (cont.)
First-Time Freshmen (FF): Headcount Enrollment by Major and Gender
Major Female Male Total Percentage Biology 1 0 1 9.1% Business Administration 0 2 2 18.2% Criminal Justice 1 2 3 27.3% Kinesiology 1 1 2 18.2% Psychology 1 0 1 9.1% Undeclared 1 1 2 18.2% Total 5 6 11 100%
0
2 2
1
0
1 1
0
1 1 1 1
Bio
logy
Bus
ines
s Adm
inis
tratio
n
Crim
inal
Jus
tice
Kin
esio
logy
psyc
olog
y
Und
ecla
red
FF: Headcount Enrollment by Major and Gender Male Female

Huston-Tillotson University Fact Book 2013-2014
- 50 -
Section IV: Degree Granted
HT Baccalaureate Completions by Major: July 2013-June 2014*
Major Number Percentage Biology 6 4.8% Business Administration 24 19.2% Chemistry 4 3.2% Chemistry and Mathematics 1 0.8% Communication 8 6.4% Computer Information Systems 1 0.8% Computer Science 4 3.2% Criminal Justice 12 9.6% Education 11 8.8% English 3 2.4% History 1 0.8% Kinesiology 23 18.4% Mathematics 5 4.0% Music 1 0.8% Psychology 9 7.2% Sociology 12 9.6% Total 125 100%
* Unduplicated Count of total number of completers
6
24
4 1
8
1 4
12 11
3 1
23
5
1
9 12
Biol
ogy
Busi
ness
Adm
inis
trat
ion
Chem
istr
y
Chem
istr
y an
d M
athe
mat
ics
Com
mun
icat
ion
Com
pute
r In
form
atio
n Sy
stem
s
Com
pute
r Sc
ienc
e
Crim
inal
Just
ice
Educ
atio
n
Engl
ish
His
tory
Kine
siol
ogy
Mat
hem
atic
s
Mus
ic
Psyc
holo
gy
Soci
olog
y
HT Baccalaureate Completions by Major*

Huston-Tillotson University Fact Book 2013-2014
- 51 -
Section V: Student Trends
Demographic Enrollment Trend Data
Historical Overall Student Headcount Enrollment Fall 1988-Fall 2013
Year Number Percentage Growth over Period 1988 Fall 506 -- 1989 Fall 695 37% 1990 Fall 714 3% 1991 Fall 653 -9% 1992 Fall 536 -18% 1993 Fall 539 1% 1994 Fall 611 16% 1995 Fall 641 5% 1996 Fall 701 9% 1997 Fall 696 -1% 1998 Fall 621 -11% 1999 Fall 547 -12% 2000 Fall 596 9% 2001 Fall 621 4% 2002 Fall 642 3% 2003 Fall 668 4% 2004 Fall 685 3% 2005 Fall 706 3% 2006 Fall 742 5% 2007 Fall 768 4% 2008 Fall 785 2% 2009 Fall 882 12% 2010 Fall 901 2% 2011 Fall 904 >1% 2012 Fall 918 2% 2013 Fall 973 6%
506
695 714 653
536
539 611
641
701 696
621 547
596 621 641 666
685 706
742 768 785 882 901 904
918
973
Student Headcount Enrollment Trends

Huston-Tillotson University Fact Book 2013-2014
- 52 -
Demographic Enrollment Trend Data (cont.)
First-time Freshmen (FF) Student Headcount Enrollment Fall 1999 – Fall 2013
Year Number Percentage Growth over Period
Fall 1999 107 --
Fall 2000 135 26.2%
Fall 2001 104 -23.0%
Fall 2002 121 16.3%
Fall 2003 177 46.3%
Fall 2004 182 2.8%
Fall 2005 168 -7.7%
Fall 2006 186 10.7%
Fall 2007 194 4.3%
Fall 2008 179 -7.7%
Fall 2009 250 39.7%
Fall 2010 269 7.6%
Fall 2011 182 -32.3%
Fall 2012 209 14.8%
Fall 2013 228 9.1%
107
135
104
121
177 182 168
186 194
179
250 269
182 209
228
0
50
100
150
200
250
300
Fall '99
Fall '00
Fall '01
Fall '02
Fall '03
Fall '04
Fall '05
Fall '06
Fall '07
Fall '08
Fall '09
Fall '10
Fall '11
Fall '12
Fall '13
FF Headcount Enrollment Fall 1999 - Fall 2013

Huston-Tillotson University Fact Book 2013-2014
- 53 -
Demographic Enrollment Trend Data (cont.)
Percentage of Students* by Race/Ethnicity Fall 2000-Fall 2013
Race/Ethnicity By Fall Year
Black or African
American
American or Alaska
Native
Asian Hispanic / Latino
Multiracial White International Unknown Other Total
'00 72% NR 3% 10% NR 5% 11% NR 0% 596
'01 74% NR 2% 9% NR 8% 6% NR 1% 621
'02 76% NR 1% 7% NR 10% 5% NR 0% 642
'03 73% NR 1% 10% NR 8% 4% NR 4% 668
'04 74% NR 1% 11% NR 7% 3% NR 4% 685
'05 74% NR 1% 13% NR 7% 2% NR 4% 706
'06 78% NR 1% 10% NR 8% 2% NR 1% 742
'07 75% NR 1% 12% NR 8% 2% NR 2% 768
'08 77% NR <1% 11% NR 8% 3% NR 1% 785
'09 76% NR <1% 13% NR 6% 3% NR 1% 882
'10 72% NR <1% 19% NR 6% 3% NR <1% 901
'11 69% NR <1% 19% NR 6% 4% NR <1% 904
'12 72% <1% <1% 18% <1% 5% 4% <1% <1% 918
'13 73% <1% <1% 18% <1% 5% 3% <1% <1% 973
Percentage of Students* by Gender Fall 2000-Fall 2013
Gender '00 '01 '02 '03 '04 '05 '06 '07 '08 '09 '10 '11 '12 '13
Female 55% 55% 52% 54% 56% 54% 55% 51% 50% 53% 50% 51% 52% 54%
Male 45% 45% 48% 46% 44% 46% 45% 49% 50% 47% 50% 49% 48% 46%
*Includes Undergraduate and ATCP students.
Huston-Tillotson University Fact Book 2013-2014
- 54 -
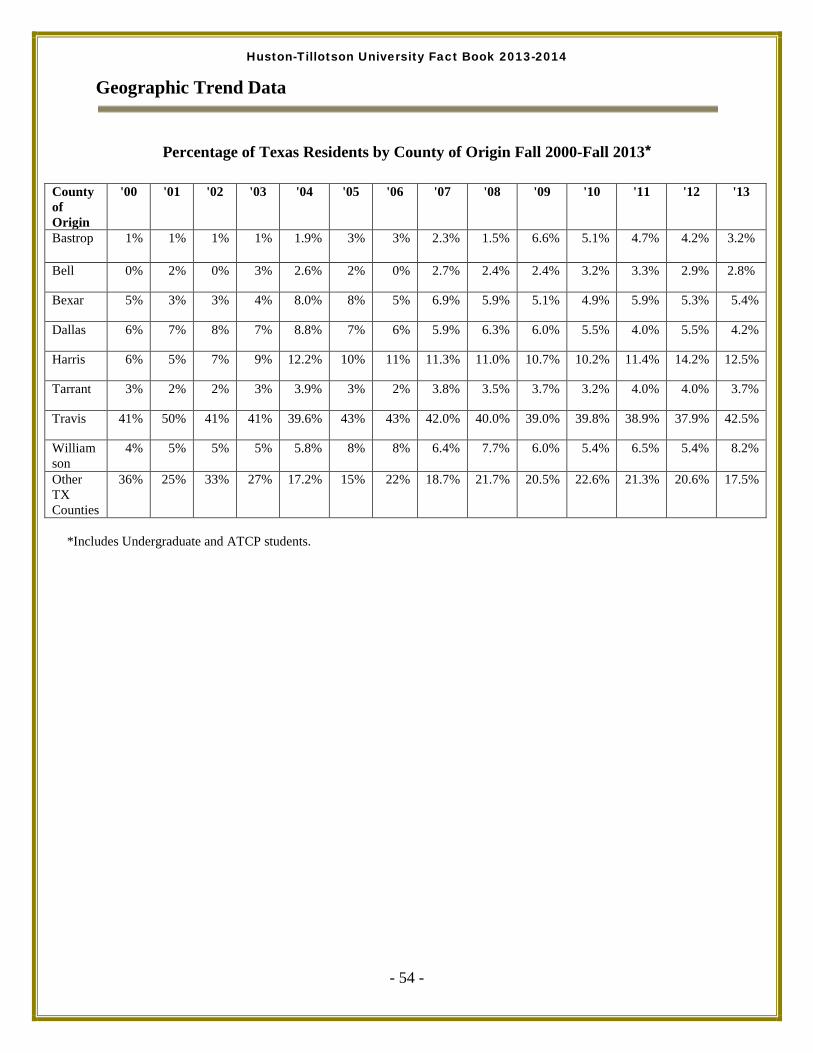
Geographic Trend Data
Percentage of Texas Residents by County of Origin Fall 2000-Fall 2013*
County of Origin
'00 '01 '02 '03 '04 '05 '06 '07 '08 '09 '10 '11 '12 '13
Bastrop 1% 1% 1% 1% 1.9% 3% 3% 2.3% 1.5% 6.6% 5.1% 4.7% 4.2% 3.2%
Bell 0% 2% 0% 3% 2.6% 2% 0% 2.7% 2.4% 2.4% 3.2% 3.3% 2.9% 2.8%
Bexar 5% 3% 3% 4% 8.0% 8% 5% 6.9% 5.9% 5.1% 4.9% 5.9% 5.3% 5.4%
Dallas 6% 7% 8% 7% 8.8% 7% 6% 5.9% 6.3% 6.0% 5.5% 4.0% 5.5% 4.2%
Harris 6% 5% 7% 9% 12.2% 10% 11% 11.3% 11.0% 10.7% 10.2% 11.4% 14.2% 12.5%
Tarrant 3% 2% 2% 3% 3.9% 3% 2% 3.8% 3.5% 3.7% 3.2% 4.0% 4.0% 3.7%
Travis 41% 50% 41% 41% 39.6% 43% 43% 42.0% 40.0% 39.0% 39.8% 38.9% 37.9% 42.5%
Williamson
4% 5% 5% 5% 5.8% 8% 8% 6.4% 7.7% 6.0% 5.4% 6.5% 5.4% 8.2%
Other TX Counties
36% 25% 33% 27% 17.2% 15% 22% 18.7% 21.7% 20.5% 22.6% 21.3% 20.6% 17.5%
*Includes Undergraduate and ATCP students.

Huston-Tillotson University Fact Book 2013-2014
- 55 -
Geographic Trend Data (cont.)
Percentage of Total Out-of-State Students by State of Origin Fall 2000-Fall 2013*
State of Origin '00 '01 '02 '03 '04 '05 '06 '07 '08 '09 '10 '11 '12 '13
Alabama -- -- -- -- -- -- --
2%
2%
4%
2%
6% 5.9% 4.9%
Arizona -- -- -- -- 4% 3% 3% 2% 2% 2% 2% 6% 2.0% --
Arkansas -- -- -- -- 4% 3% -- -- 2% -- -- -- 5.9% 1.6%
California 17% 15% 19% 7% 19% 24% 22.5% 16% 8% 20% 21% 13% 17.6% 32.8%
Colorado 8% 7% 12% 13% -- -- -- 2% -- -- 2% 4% 3.9% 3.3%
Connecticut 4% 4% -- 3% -- -- -- -- -- 2% 2% 2% 2.0% 1.6%
Delaware -- -- -- -- -- -- -- -- -- 2% 2% 2% 2.0% 1.6% District of Columbia 4% -- -- -- -- -- -- -- -- -- -- -- -- --
Florida 4% -- 4% 3% 4% 9% 5% 7% 2% -- -- 6% 3.9% 4.9%
Georgia 4% -- -- 3% -- -- 5% 5% 4% 4% 2% -- -- 1.6%
Idaho -- -- -- -- -- 3% -- -- -- -- -- -- -- --
Illinois 8% 11% 12% 7% 15% 12% 7.5% 7% 2% 2% 2% 9% 7.8% 11.5%
Indiana -- -- 4% 23% 15% 15% 15% 9% 6% -- -- -- -- --
Iowa -- -- -- -- -- -- -- -- -- -- -- -- -- --
Kansas -- -- 4% 3% -- -- 3% 2% 2% -- -- -- 2.0% 1.6%
Kentucky -- -- 4% -- 4% 6% 3% 2% 2% -- -- -- -- --
Louisiana 8% 7% 4% 7% -- -- 7.5% 2% 4% 4% 2% 2% 3.9% 6.6%
Maryland 4% 11% -- 3% 4% 3% 3% 9% 9% 8% 2% 9% 5.9% --
Massachusetts -- -- 12% -- -- -- -- -- -- -- -- -- 2.0% 1.6%
Michigan 8% 11% 4% 3% -- 6% 3% 2% 17% 14% 16% 7% 3.9% --
Minnesota -- -- -- 3% -- -- -- -- 6% 4% 7% 2% -- --
Mississippi -- -- -- -- -- -- -- -- 2% -- -- 4% 3.9% 4.9%
Missouri -- -- -- -- -- 3% 3% 2% 4% 6% 7% 2% 2.0% 3.3%

Huston-Tillotson University Fact Book 2013-2014
- 56 -
Geographic Trend Data (cont.)
Percentage of Total Out-of-State Students by State of Origin 2000-2013* (cont.)
State of Origin '00 '01 '02 '03 '04 '05 '06 '07 '08 '09 '10 '11 '12 '13
Nebraska -- -- -- -- -- -- -- 2% 4% 2% -- -- -- --
Nevada -- 4% -- -- -- -- 3% 5% 4% -- -- 2% 2.0% 1.6%
New Jersey -- -- -- 3% -- 3% -- 2% 2% 2% 2% 4% 3.9% 1.6% New Mexico 4% -- -- -- -- -- -- -- -- 2% 2% 2% -- 1.6%
New York 8% 4% 8% 7% 12% 3% 3% 2% 2% 4% 5% 6% 3.9% 1.6% North Carolina 4% 4% -- -- -- -- -- 2% -- -- -- -- -- --
Ohio 4% 4% 4% -- -- -- -- -- -- 2% -- -- -- 3.3%
Oklahoma -- -- -- -- -- -- -- 5% 4% 2% 2% 2% 3.9% 3.3%
Oregon -- -- -- -- 8% 6% -- -- 2% 2% 2% 2% 2.0% 1.6%
Puerto Rico -- -- -- -- -- -- -- 2% -- 2% 5% -- -- -- Rhode Island -- -- -- -- -- -- -- -- -- -- 5% -- -- -- South Carolina -- -- -- -- -- -- -- -- -- -- -- -- 2.0% --
Tennessee -- -- -- -- 4% 3% 3% 5% 2% 4% 5% 6% -- -- Virgin Islands -- -- -- -- -- -- 7.5% 2% 2% -- -- -- -- --
Virginia -- 19% 4% 3% 8% -- 3% 5% -- -- -- 2% 3.9% 3.3%
Washington -- -- -- -- -- -- -- -- -- -- -- 2% 2.0% --
Wisconsin -- -- 8% 7% -- -- -- -- 4% 2% 2% 2% 2.0% -- *Includes Undergraduate and ATCP students

Huston-Tillotson University Fact Book 2013-2014
- 57 -
Geographic Trend Data (cont.)
Percentage of Overall International Students* Country of Origin Fall 2000 – Fall 2013
Country of Origin '00 '01 '02 '03 '04 '05 '06 '07 '08 '09 '10 '11 '12 '13 Australia -- -- -- -- 5% -- -- -- -- -- -- -- -- -- Bahamas 5% -- -- -- -- 7% 14% 12% 9% 7% 7% 7% 2.9% 3.2% Bahrain 5% -- -- -- -- 7% -- -- -- -- -- -- -- -- Benin -- -- -- -- -- -- -- -- -- -- -- -- 2.9% -- Brazil -- -- -- -- -- -- -- -- 4% 4% 4% 4% -- -- Canada -- -- 3% -- -- -- -- -- -- -- -- -- -- -- Columbia 1% 2% 3% 9% -- -- -- -- -- -- -- -- -- -- Democratic Republic of the Congo -- -- -- -- -- -- -- -- -- -- -- -- 2.9% 3.2% Dominican Republic -- -- -- -- 5% -- 7% 6% -- -- -- -- -- -- Ethiopia -- -- 3% -- -- -- -- -- -- -- -- -- 2.9% 3.2% France 1% 2% 3% -- -- -- -- -- -- -- -- -- -- -- Gambia -- -- -- -- -- -- -- 6% -- -- -- -- -- -- Ghana 1% 2% 3% 3% -- -- -- -- -- -- -- -- 5.9% -- Guinea 1% 2% -- -- -- -- -- -- -- -- -- -- -- -- Hong Kong 1% 2% -- -- -- -- -- -- -- -- -- -- -- 3.2% India 1% 2% 3% 3% -- -- -- -- -- -- -- -- 2.9% -- Indonesia -- -- -- -- -- -- -- -- -- -- -- -- -- -- Iran 1% 4% 3% -- -- -- -- -- -- -- -- -- -- -- Israel -- -- -- -- -- -- -- -- 4% 4% 4% 4% -- -- Jamaica 44% 22% 18% 23% 16% 14% 7% 12% 9% 4% 4% 4% 5.9% -- Japan 1% -- -- -- -- -- -- -- -- -- -- -- -- -- Kenya 1% 2% 3% -- 5% 7% 7% 6% 4% 4% 4% 4% -- -- Lebanon -- -- -- -- -- -- -- -- -- -- -- -- -- -- Lesotho -- -- -- -- -- -- -- -- -- -- -- -- 2.9% 6.5% Liberia -- -- -- -- -- -- -- -- 4% -- -- -- 2.9% 3.2% Libya -- -- -- -- -- -- -- -- 4% -- -- -- -- -- Lithuania -- -- -- 3% -- -- -- -- -- -- -- -- -- -- Macedonia 1% -- -- -- -- 7% -- -- -- -- -- -- -- --

Huston-Tillotson University Fact Book 2013-2014
- 58 -
Geographic Trend Data (cont.)
Percentage of Overall International Students Country of Origin Fall 2000 – Fall 2013 Country of Origin '00 '01 '02 '03 '04 '05 '06 '07 '08 '09 '10 '11 '12 '13 Mexico -- -- 3% -- 5% 7% 7% 6% 0% 4% 4% 4% 8.8% 9.7% Morocco -- -- 5% 6% 5% -- -- -- -- -- -- -- -- 3.2% New Guinea -- -- -- -- -- -- -- -- -- -- -- -- -- -- Niger -- -- -- -- -- -- -- -- -- -- -- -- -- 3.2% Nigeria 3% 4% -- -- -- -- -- -- -- 46% 46% 46% 35.3% 29.0% Pakistan 1% 2% -- -- -- -- -- -- -- -- -- -- -- -- Panama -- 2% 3% -- -- -- -- -- -- -- -- -- -- -- People's Rep. of China 3% 4% 3% -- 5% 14% -- -- 9% 7% 7% 7% -- 6.5% Peru 1% -- -- -- -- -- 7% -- -- -- -- -- -- -- Qatar 1% 7% -- -- 5% 7% -- -- -- -- -- -- -- -- Republic of South Africa 1% 7% 5% -- -- -- -- -- -- -- -- -- -- -- Saudi Arabia 5% 7% 5% 9% 11% 7% 14% -- -- -- -- -- -- -- Senegal -- 3% 3% 5% -- -- -- -- -- 4% 4% 4% -- --
Sierra Leone -- -- -- -- -- -- -- -- -- -- -- -- -- 3.2%
Singapore -- -- -- -- -- -- -- -- -- -- -- -- -- -- South Korea 1% 2% -- -- -- -- -- -- -- -- -- -- -- -- Switzerland -- -- -- -- -- -- -- -- -- -- -- -- -- -- Syria 12% 4% 8% 9% -- -- -- -- -- -- -- -- -- -- Taiwan 1% 2% 0% 9% 5% 7% -- -- -- -- -- -- -- -- Trinidad & Tobago -- -- -- -- -- 14% 30% -- -- 14% 14% 14% 8.8% 6.5% Turkey 1% 9% 10% 11% 5% -- 7% -- -- -- -- -- -- -- Uganda 1% 9% 10% 11% 16% -- -- -- -- -- -- -- 2.9% 3.2% United Arab Emirates -- -- -- -- -- -- -- -- -- -- -- -- -- -- Venezuela -- -- 3% 3% 5% -- -- -- -- -- -- -- -- -- Zimbabwe -- -- -- -- -- -- -- -- -- 7% 7% 7% 11.8% 12.9%
*Undergraduate students
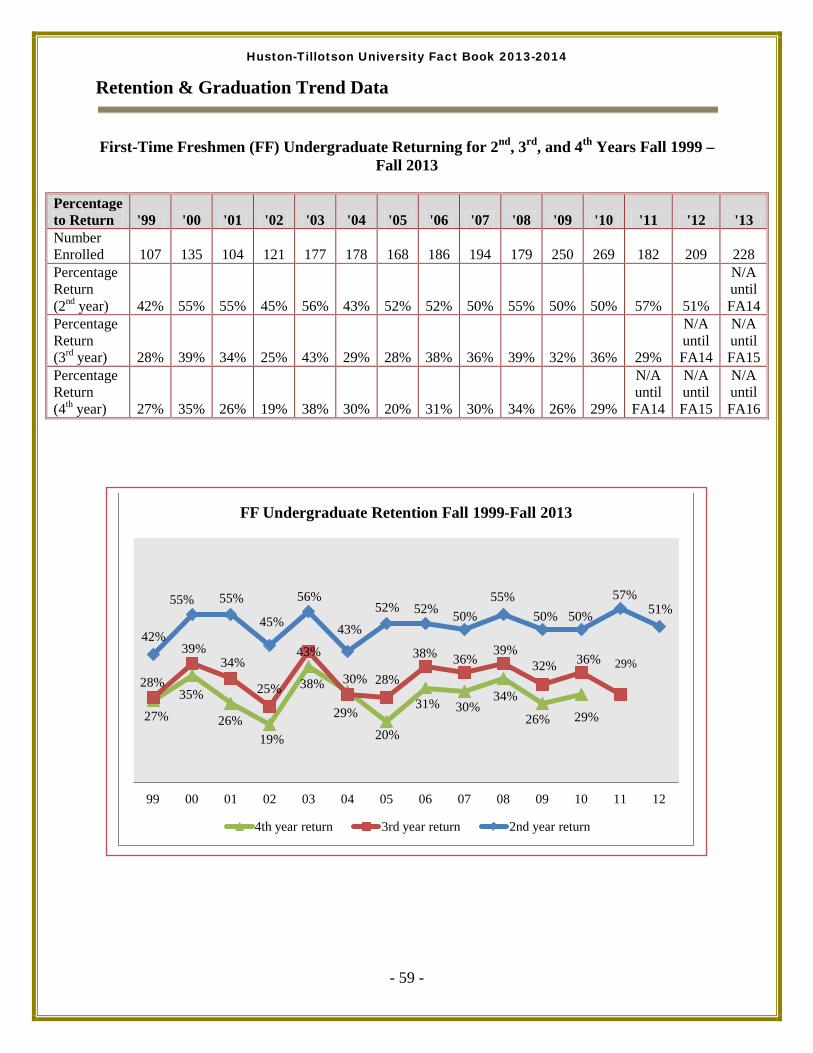
Huston-Tillotson University Fact Book 2013-2014
- 59 -
Retention & Graduation Trend Data
First-Time Freshmen (FF) Undergraduate Returning for 2nd, 3rd, and 4th Years Fall 1999 –
Fall 2013
Percentage to Return '99 '00 '01 '02 '03 '04 '05 '06 '07 '08 '09 '10 '11 '12 '13 Number Enrolled 107 135 104 121 177 178 168 186 194 179 250 269 182 209 228 Percentage Return (2nd year) 42% 55% 55% 45% 56% 43% 52% 52% 50% 55% 50% 50% 57% 51%
N/A until FA14
Percentage Return (3rd year) 28% 39% 34% 25% 43% 29% 28% 38% 36% 39% 32% 36% 29%
N/A until FA14
N/A until FA15
Percentage Return (4th year) 27% 35% 26% 19% 38% 30% 20% 31% 30% 34% 26% 29%
N/A until FA14
N/A until FA15
N/A until FA16
27% 35%
26% 19%
38% 30%
20%
31% 30% 34%
26% 29%
28%
39% 34%
25%
43%
29%
28%
38% 36% 39%
32% 36%
42%
55% 55%
45%
56%
43%
52% 52% 50% 55%
50% 50% 57%
51%
99 00 01 02 03 04 05 06 07 08 09 10 11 12
FF Undergraduate Retention Fall 1999-Fall 2013
4th year return 3rd year return 2nd year return
29%

Huston-Tillotson University Fact Book 2013-2014
- 60 -
Graduation Trend Data
Total Baccalaureate Completions* By Year
Graduate Year Number
2001 105 2002 73 2003 64 2004 58 2005 69 2006 80 2007 94 2008 93 2009 94 2010 93 2011 120 2012 130 2013 121 2014 125 Total 1319
* Unduplicated Count of total number of completers
105
73 64
58
69
80
94 93 94 93
120 130
121 125
BACCALAUREATE COMPLETIONS* BY YEAR
2001 2002 2003 2004 2005 2006 2007 2008 2009 2010 2011 2012 2013 2014

Huston-Tillotson University Fact Book 2013-2014
- 61 -
Graduation Trend Data (cont.)
Trends of HT Baccalaureate Completions by Major 2003 to 2013 (Unduplicated Count)
MAJOR 2003- 2004
2004- 2005
2005- 2006
2006- 2007
2007-2008
2008-2009
2009-2010
2010-2011
2011-2012
2012-2013
2013-2014
Biology 3% 4% 5% 6% 3% 7% 3% 3% 8% 6% 5% Biology and Mathematics -- -- -- 1% -- -- -- -- -- -- -- Biology and Chemistry -- -- -- -- -- -- -- -- -- 1% -- Business Administration 36% 23% 15% 24% 25% 28% 25% 21% 29% 18% 19% Chemistry -- 1% -- -- 2% -- 3% 1% -- 1% 3% Chemistry and Biology -- -- -- 1% -- -- -- -- -- 1% -- Chemistry and Mathematics -- -- -- -- -- -- -- -- -- -- 1% Communication 9% 3% -- -- -- -- -- -- -- 2% 6% Computer Science 14% 16% 9% 5% 2% 5% 1% 5% 2% 2% 3% Computer Information Systems -- -- -- -- -- -- 1% -- 1% 5% 1% Computer Science and Political Science -- 1% -- -- -- -- -- -- -- -- -- Criminal Justice -- -- 6% 13% 15% 13% 12% 14% 8% 9% 10% Education -- -- -- -- -- -- -- 14% 7% 7% 9% English 5% 7% 6.2% 4% 2% 3% 8% 5% 7% 6% 2% History 2% 1% 1% -- 1% 2% 3% 2% 3% 2% 1% Interdisciplinary Studies 3% 9% 16% 14% 15% 12% 14% -- -- -- -- Kinesiology 10% 10% 9% 17% 15% 5% 18% 18% 20% 19% 18% Mathematics 2% 1% 1% -- 2% 2% 1% -- 3% 3% 4% Mathematics and Political Science -- 1% -- -- -- -- -- -- -- -- -- Music 3% 1% 1% 2% 2% 1% -- 4% 5% 2% 1% Political Science 7% 10% 6% 4% 3% 2% 1% 4% 2% 1% -- Psychology 2% 1% 17% 4% 8% 9% 7% 8% 5% 7% 7% Sociology 3% 7% 7% 3% 4% 10% 3% 1% 1% 1% 10% Total Completers 58 69 80 94 93 94 93 120 130 121 125

Huston-Tillotson University Fact Book 2013-2014
- 62 -
Graduation Trend Data (cont.)
Degree Granted to HT Students (Duplicated Count)
College of Arts and Sciences
YR
BIO
CHE
COM
CRJ
ENG
HIS
KIN
MTH
MUS
PSI
PSY
SOC
EDU
TLS
'01 7 1 5 -- 4 -- 10 4 -- 1 3 9 4 48 '02 4 1 3 -- 3 -- 6 2 -- 6 5 3 4 37 '03 2 -- 5 -- 3 1 8 1 3 5 1 2 3 34 '04 7 -- 1 -- 3 -- 7 -- -- 3 5 4 7 37 '05 3 1 2 -- 5 1 7 2 1 7 1 5 6 41 '06 4 -- -- 4 5 1 7 1 1 4 15 6 13 61 '07 *8 1 -- 12 4 -- 16 *1 2 4 4 3 13 *68 '08 3 2 -- 14 2 1 16 2 2 3 7 4 12 68 '09 7 -- -- 12 3 2 5 2 1 2 8 9 11 62 '10 3 3 -- 11 7 3 17 1 -- 1 6 3 13 68 '11 4 1 -- 17 6 2 22 -- 5 5 9 1 17 89 '12 11 -- -- 11 9 4 26 4 *6 3 6 1 9 *90 '13 9 *2 3 11 8 3 23 *5 3 2 4 9 9 *91 '14 6 *5 8 12 3 1 23 *6 1 -- 9 12 11 *97
School of Business and Technology
YR
ACT
BUS
CIS
COS
HOSP ADMIN
MKTG
MGMT INF SYS
PUBL ADMIN
TLS
'01 -- 14 8 26 8 -- 1 57 '02 6 10 8 1 7 -- 4 36 '03 -- 21 9 -- -- -- -- 30 '04 -- 13 8 -- -- -- -- 21 '05 -- 16 12 -- -- -- -- 28 '06 -- 12 7 -- -- -- -- 19 '07 -- 23 5 -- -- -- -- 28 '08 -- 23 2 -- -- -- -- 25 '09 -- 27 5 -- -- -- -- 32 '10 -- 23 1 -- -- 1 -- 25 '11 -- 25 6 -- -- -- -- 31 '12 -- 37 1 2 -- -- -- -- 40 '13 -- 22 6 *4 -- -- -- -- *32 '14 -- 24 1 4 -- -- -- -- 29
* Unduplicated Count of total number of completers

Huston-Tillotson University Fact Book 2013-2014
- 63 -
Graduation Trend Data (cont.)
Degree Granted to ATCP Students
Post Baccalaureate Completions (ATCP) 2007 12 2008 17 2009 39 2010 27 2011 5 2012 11 2013 19 2014 14

Huston-Tillotson University Fact Book 2013-2014
- 64 -
Graduation Trend Data (cont.)
Baccalaureate Degree Granted to First-Time Freshmen and Transfer Students
Year Total Baccalaureate
Completers First-Time Freshmen who were awarded Baccalaureate degrees
Transfer students who were awarded Baccalaureate degrees
2011-12 130 61 (46.9%) 69 (53.1%)
2012-13 121 65 (53.7%) 56 (46.2%)
2013-14 125 62 (49.6%) 63 (50.4%)
61 65
62
69
56
63
2011-12 2012-13 2013-14
Baccalaureate Degree Granted to First-time Freshmen and Transfer Students
First-Time Freshmen who were awarded Baccalaureate degrees
Transfer students who were awarded Baccalaureate degrees

Huston-Tillotson University Fact Book 2013-2014
- 65 -
Student Financial Aid* Trend Data
Undergraduate Receiving Grant Aid
Year Total grant aid received by
all undergraduate students Number of undergraduate students who received a Pell Grant
Percentage of FTFT† students receiving any financial aid
2010-11 $2,806,065 494 79%
2011-12 $6,534,609 642 83%
2012-13 $6,196,127 629 94%
2013-14 $6,630,349 621 97%
FTFT† Students Receiving Grant Aid
Grant Type 2010-2011 2011-2012 2012-2013 2013-2014
Percentage Amount Percentage Amount Percentage Amount Percentage Amount
Federal Government 79% $3,074 76% $4,450 73% $4,624 74% $4,366
Pell 66% $3,548 68% $4,556 73% $4,453 74% $4,115
Other Federal 66% $163 42% $675 40% $310 72% $258
State/Local Government 45% $3,476 43% $3,086 60% $4,223 61% $3,908
Institutional 72% $435 11% $7,518 37% $6,239 46% $5,961
Total 79% $5,437 76% $7,232 87% $9,396 92% $9,072
FTFT† Students Receiving Loans
Loans Type 2010-2011 2011-2012 2012-2013 2013-2014
Percentage Amount Percentage Amount Percentage Amount Percentage Amount
Federal 76% $7,494 77% $8,089 85% $6,442 87% $6,831
Non-Federal 4% $1,459 4% $3,842 1% $5,500 0% n/a
Total 79% $7,257 77% $8,238 85% $6,514 87% $6,831
* All data refers to academic year. † Full-time First-time degree/certificate-seeking undergraduate students.

Huston-Tillotson University Fact Book 2013-2014
- 66 -
Graduation Rates for Full-time, First-time Students* Pursuing Bachelor’s Degrees: Trend Data
Cohort Year
4-Year (100%) Graduation Rate
6-Year (150%) Graduation Rate
8-Year (200%) Graduation Rate
2001 7% (7) 18% (19) 20% (21)
2002 4% (5) 16% (20) 18% (22)
2003 15% (27) 29% (52) 32% (57)
2004 12% (21) 24% (44) 26% (48)
2005 12% (20) 20% (33) 23% (39)
2006 10% (18) 25% (46) 27% (50)
2007 10% (19) 26% (48) N/A until SP 15
2008 13% (23) 32% (57) N/A until SP 16
2009 14% (34) N/A until SP 15 N/A until SP 17
* The result of removing any allowable exclusions from a cohort (or subcohort) because of one of the following documented reasons: 1. The student is deceased or is totally and permanently disabled and thus unable to return to school. 2. The student left school to serve in the armed forces or was called to active duty. (NOT include students already in the military who transfer to another duty station.) 3. The student left school to serve with a foreign aid service of the Federal Government, such as the Peace Corps. 4. The student left school to serve on an official church mission.
20% 18%
32% 26% 23%
27%
18% 16%
29% 24%
20% 25% 26%
32%
7% 4%
15% 12% 12% 10% 10% 13% 14%
2001 2002 2003 2004 2005 2006 2007 2008 2009
Graduation Rates for Full-time, First-time Students* Pursuing Bachelor’s Degrees
8-Year (200%) Graduation Rate 6-Year (150%) Graduation Rate 4-Year (100%) Graduation Rate

Huston-Tillotson University Fact Book 2013-2014
- 67 -
Section VI: Fall 2013 Faculty Profile
Full-Time Faculty by Race & Gender
Female Male Total Percentage
African American or Black 17 7 24 42.9%
Asian 1 0 1 0.2%
Hispanic 1 5 6 10.7%
White 9 12 21 37.5%
Two or More Races 0 1 1 0.2%
International 0 3 3 5.4%
Total 28 28 56 100%
African American or Black, 42.9%
Asian , 0.2%
Hispanic, 10.7%
White, 37.5%
Two or More Races, 0.2%
International, 5.4%
FULL-TIME FACULTY BY RACE

Huston-Tillotson University Fact Book 2013-2014
- 68 -
Faculty Statistics - Fall 2013 (cont.)
Faculty by Tenure*
Female Male Total Percentage
Tenured 6 3 9 16.4%
Tenured Track 3 1 4 7.3%
Not on Tenured Track 18 24 42 76.4%
Total 27* 28 55* 100%
* reported by the institution on the IPEDS Human Resources
Faculty by Rank
Rank Female Male Total Percentage
Professors 6 8 14 25.0%
Associate Professors 5 2 7 12.5%
Assistant Professors 12 12 24 42.9%
Instructors 5 6 11 19.6%
Total 28 28 56 100%
0.0%
10.0%
20.0%
30.0%
40.0%
50.0%
25.0%
12.5%
42.9%
19.6%
Faculty by Rank
Professors Associate Professors
Assistant Professors Instructors
0.0%
20.0%
40.0%
60.0%
80.0%
16.4% 7.3%
76.4%
Tenured
Tenured Track
Huston-Tillotson University Fact Book 2013-2014
- 69 -
Section VII: Facilities & Financial Profile
Buildings & Facilities
Huston-Tillotson University is located on a 19-acre, tree-lined, flourishing campus near downtown
Austin, Texas. The University also owns 6 acres of property adjacent to the campus for future expansion
and development and maintains a biological field station south of the city used by faculty and students for
environmental research.
Campus buildings are named for past presidents and other distinguished persons in testimony to their
outstanding contributions in sustaining the institution and fostering its advancement. The hyphenation of
the building names commemorates the University’s joint heritage in the United Church of Christ and The
United Methodist Church. Each name links a representative of the former Tillotson College (and the
United Church of Christ) with a representative of the former Samuel Huston College (and The United
Methodist Church).
AGARD-LOVINGGOOD CLASSROOM AND ADMINISTRATION BUILDING The “A-L” Building, as it is called on campus, was completed in 1968 and has been refurbished several
times. It is named for Dr. Isaac Merrit Agard, President of Tillotson College from 1905 to 1918, and Dr.
Rueben Shannon Lovinggood, President of Samuel Huston College from 1900 to 1916. The three-story
building serves an administrative hub. The following operational units and personnel are housed in “A-
L”: Psychology Faculty offices, Registrar, Admissions, Financial Aid, School of Business and
Technology, Counseling and Consultation Center, Vice President for Administration and Finance,
Business Office, Adult Degree Program (ADP), Auxiliary Services (post office, duplicating services,
etc.), and Information Technology. “A-L” also includes several classrooms and computer labs. A lecture
hall/auditorium located on the main floor is equipped with distance-learning technology and has a seating
capacity of 216.

Huston-Tillotson University Fact Book 2013-2014
- 70 -
Facilities (cont.)
KING-SEABROOK CHAPEL/JACKSON-MOODY HUMANITIES BUILDING The Chapel-humanities complex was completed in 1974. Named for two presidents of the merged
Huston-Tillotson College – Dr. John Q. Taylor King, Sr. (1965-1988), and Dr. John Jarvis Seabrook
(1955-1965) – the building includes a 392-seat auditorium and a stage adequate for dramatic and other
productions. The humanities portion of the building was named for E. W. Jackson, a former trustee and
generous donor, and the Moody Foundation of Galveston, Texas, which made a substantial contribution
toward the construction of the building. In this portion of the complex are classrooms, practice rooms for
music students, the Center for Academic Excellence, computer laboratories and testing facilities, and
faculty offices for the following departments: Humanities and Fine Arts and Social and Behavioral
Sciences.
DICKEY-LAWLESS SCIENCE BUILDING
Dickey-Lawless was completed in 1954, renovated and modernized in 1993 and 2010. It houses the Dean
of the College of Arts and Sciences; Department of Natural Sciences and Department of Mathematics; an
auditorium, several lecture rooms, laboratories, and offices for the faculty. The building was named in
honor of Dr. James L. Dickey, a Huston-Tillotson graduate, Central Texas physician, and former member
of the Board of Trustees, and Dr. Frederick Lawless, a Chicago physician who also served on the Board
of Trustees.
DOWNS-JONES LIBRARY The split-level library was completed in 1960 and is named for Dr. Karl Everett Downs, President of
Samuel Huston College from 1943-1948, and Dr. William H. Jones, President of Tillotson College from
1944-1952. $2.3 million renovation was completed in March 2013 allowing for various learning
styles. The upper level is designated for collaborative work. On this level, students can be found
studying and discussing projects and assignments together, with a noise level higher than that of many
traditional libraries. The lower level is the individual study level where students can expect little to no
noise. The library is also a participating member of TexShare, a library resource sharing program, which
enables students, faculty, and staff to borrow books and articles from other libraries in the state of
Texas. In addition through the TexShare program, HT students, faculty and staff have access to over 70
electronic databases of articles and eBook. The library currently has 24 PCs available as well as AirRam
wireless internet which allows library users to connect via their laptop, tablet, or mobile
device. Accordingly, the library is equipped with several stations for patrons to plug in these devices. The
library is equipped with an elevator, energy-efficient lighting with sensors, new heating and air
conditioning units, upgraded HVAC fan coils, advanced technological enhancements, and a new roof.

Huston-Tillotson University Fact Book 2013-2014
- 71 -
Facilities (cont.)
Located on the main floor are the general reading room, the computer laboratory, the main stacks, the
processing department, staff offices, the circulation desk, and Ram Café. A curriculum library for the use
of the Teacher Education Program is located on the ground floor and houses a state adopted textbook
collection. The lower level also includes the Media Services Area that acquires, manages, and circulates
all non-print resources, such as audio-visual equipment, VHS tapes, DVDs, and CDs; a multipurpose
room; viewing areas; and a faculty/staff development area with a computer laboratory. Situated on the
main floor near the circulation desk is the State Hermitage Museum Kiosk (a virtual online touch-screen
museum). In addition, the library houses a non-circulating archival collection representing the
institution’s history, administrative documents, papers (of the former Presidents of the institution),
yearbooks, and memorabilia. Finally, the National Endowment for the Humanities Bridging Cultures
initiative awarded HT the Muslim Journeys Bookshelf collection. The collection consists of 25 books and
three films. “Let’s Talk About It” reading and discussion series featuring some of the materials included
in the Bridging Cultures Bookshelf: Muslim Journeys that will be part of the HT curriculum.
ALLEN-FRAZIER RESIDENCE HALL AND BEARD-BURROWES RESIDENCE HALL Located at the north end of campus, Allen-Frazier (female students) and Beard-Burrowes (male students)
Residence Halls were occupied for the first time in 1956. Additions and renovations were made in 1965,
1977, 1988, and 1999. The halls offer a choice of traditional dormitory-style communal living or suites
for four students sharing a common living-study area and bath. Each hall provides telephone service,
cable television, laundry facilities, wireless internet connection, computer room, central heat and air
conditioning, community kitchen, and a lounge area.
The residence halls take their names from former buildings on the previous two campuses. Allen Hall was
the first building on the Tillotson College campus; Frazier Hall was part of Samuel Huston College and
named for Mr. J. W. Frazier, one of the first Samuel Huston professors. Beard Hall was a former Tillotson
College women’s dormitory, named for Reverend A. F. Beard, Corresponding Secretary of the American
Missionary Association from 1902 to 1912; and Burrowes Hall was the first building on the Samuel
Huston campus, named for Mr. Edward T. Burrowes, a generous donor. SGA is now located in Allen-
Frazier Residence Hall.
W.E.B. DuBois Study Room is located in Beard-Burrowes residence hall. The Azie Taylor Morton Study
Room is located in Allen-Frazier residence hall and is dedicated to DuBois scholars also. The office of
the Campus Nurse is located on the first floor of A-F. The Office of Student Activities is located in the
sub-level of A-F.

Huston-Tillotson University Fact Book 2013-2014
- 72 -
Facilities (cont.)
DAVAGE-DURDEN UNION BUILDING
The University Union building, constructed in 1963, houses the dining facilities, a snack bar, President’s
Dining Room, lounge areas, the campus gift shop, and the offices of the Dean of Student Affairs. The
building was named for Dr. Matthew S. Davage, President of Samuel Huston College from 1917-1920
and of Huston-Tillotson College from 1952-1955, and for Mrs. Mattie Ella Holman Durden, a Tillotson
College graduate who served as Secretary of the Board of Trustees.
MARY E. BRANCH GYMNASIUM-AUDITORIUM
Constructed in 1952, this building houses the Intercollegiate Athletic Department and offices for the
coaches and athletic trainer. Training areas are on the lower level. The upper level also includes a large
stage suitable for various programs/ceremonies. The gymnasium on the upper level is also used for
indoor athletic and sports events and for special events. The building is named for Miss Mary E. Branch,
the only woman to serve as president of either Samuel Huston or Tillotson College. Renovation of Mary
E. Branch Gymnasium is completed in January 2014.
CONNER-WASHINGTON HALL
The two-story, wooden frame building located at the center of the campus was constructed in 1938 and
served initially as the offices of the institution’s home economics program. It later served as the residence
of Dr. John Jarvis Seabrook, President of Huston-Tillotson from 1955 to 1965. The building was
renovated in 1995 and named in honor of Dr. B. E. Conner and Dr. M. J. Washington, two distinguished
physicians who served students enrolled at Tillotson College and Samuel Huston College prior to the
merger of the institutions in 1952. The Graduate and Career Development and Campus Safety are housed
in the building.

Huston-Tillotson University Fact Book 2013-2014
- 73 -
Facilities (cont.)
EVANS INDUSTRIAL BUILDING
Evans Industrial Building is one of two historical structures on the campus. Constructed in 1911-1912 by
Tillotson College students, it was completely restored in 1984 and designated as a Texas Historical Site.
The building currently houses offices of Kinesiology instructors, education preparation faculty offices, the
Teaching Resource Center, the Human Performance Laboratory, and a Distance Learning Laboratory.
Originally known as Evans Industrial Hall, the building is named for Major Ira H. Evans, a transplanted
New Englander who served on the Tillotson College Board of Trustees and who provided funds for the
building’s construction. The Department of Educator Preparation, the Department of Kinesiology, and the
Alternative Teacher Certification Program are housed in Evans.
ANTHONY AND LOUISE VIAER- ALUMNI HALL (FORMERLY THE OLD ADMINISTRATION BUILDING)
Tillotson College students fabricated the outside cinder blocks for the Old Administration Building which
was constructed between 1913-1914. It was entered in the National Register of Historic Places in 1993.
The first floor was fully restored in 2005. The second and third floors were fully restored in 2006. The
building was rededicated at Charter Day 2006 (October 27, 2006) and christened the Anthony and Louise
Viaer-Alumni Hall in recognition of the generous contributions from Mr. Anthony Viaer and other
alumni. The building also carries the name of Mr. Viaer’s deceased wife, Louise.
The building houses the office of the Associate Provost, the Dean of the University College, and Human
Resources on the first floor and Institutional Advancement on the second floor. The third floor houses the
Executive Board Room, the President’s Office, and the Office of Institutional Planning, Research and
Assessment Office. The restoration of the first floor was funded by a grant from the Department of
Interior’s National Park Service. The Restoration of the second and third floors and modifications to the
first floor was funded by a grant from the Department of Commerce’s Economic Development
Administration.

Huston-Tillotson University Fact Book 2013-2014
- 74 -
Facilities (Health Services)
Health Services Use Patterns 2002-2014
Type of Service 2002 2003 2004 2005 2006 2007 2008 2009 2010 2011 2012 2013 2014
Students Receiving Care by Nurse 847 1609 1539 1998 1348 651 692 1429 1831 1902 781 746 548
Number of Referrals 28 30 48 74 51 37 24 109 177 62 55 36 55
Number of Staff Treated 71 108 114 148 70 52 129 129 133 142 40 76 15

Huston-Tillotson University Fact Book 2013-2014
- 75 -
Facilities (Library Services)
Library Statistics 2004-2014
Collections
2004-2005
2005-2006
2006-2007
2007-2008
2008-2009
2009-2010
2010-2011
2011-2012
2012-2013
2013-2014
E-Books 106 1,286 1,283 1,283 1283 1283 1283 1283 148,283
Volumes 91,393 92,225 92,642 93,034 94,047 94,916 96,798 85,238 57,792 57,869
Microforms 69,221 69,502 69,502 69,945 69,945 69,945 69,945 69,845 <1,000 <1,000
Serials 292 297 294 285 294 294 254 202 202 202
Audio Visuals 9,144 9,393 9,424 9,666 9,711 9,739 9,893 9,581 2,940 2,940
Human/Fiscal Resources FTE Librarians 4 4 4 4 4 4 4 4 4 4
Total FTE Staff 5.5 5.5 5.75 5.25 5.13 5.00 5.25 4 4 5.4
Total Operating Expenditures 270,216 329,853 321,466 348,448 330,125 344,877 351,877 351,877 355,403 363,793
Circulation Transactions 5,469 5,536 6,467 5,164 3,913 3,804 5,270 3100 2584 3453
Interlibrary Loans 148 110 187 36 91 38 101 50 40 53
Gate Count Typical Week 1,257 1,229 1,229 1,232 1,289 1,232 1,270 714 569 1489
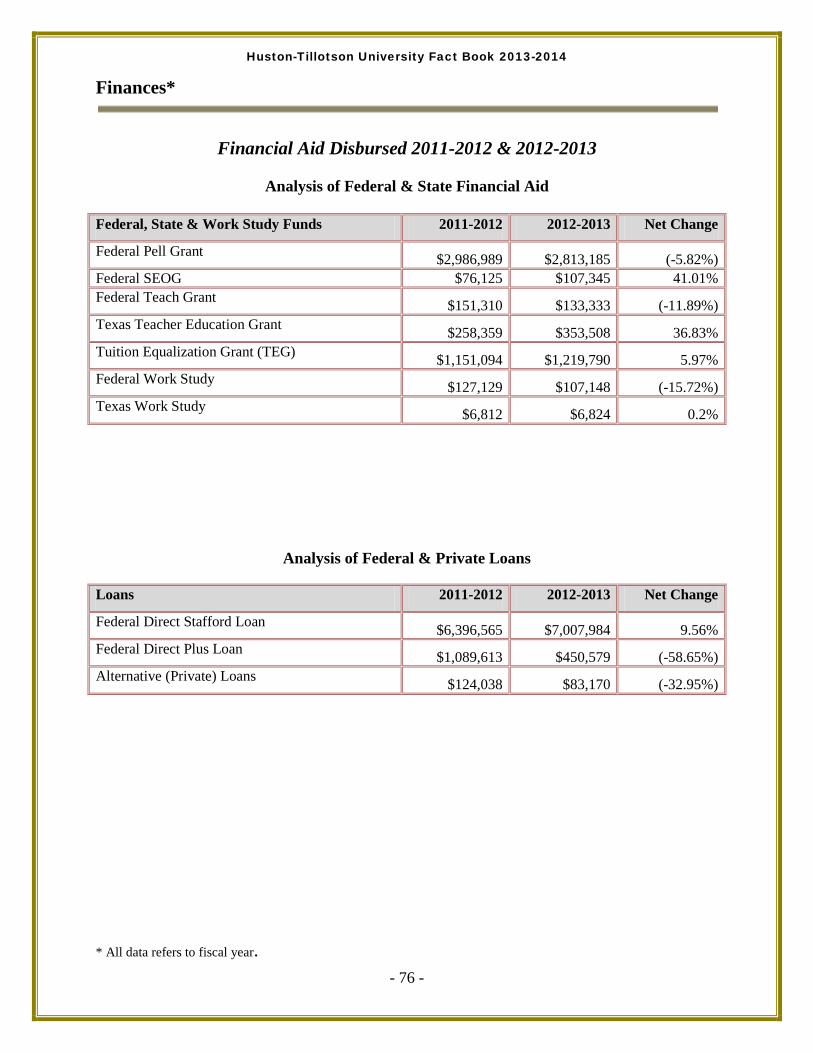
Huston-Tillotson University Fact Book 2013-2014
- 76 -
Finances*
Financial Aid Disbursed 2011-2012 & 2012-2013
Analysis of Federal & State Financial Aid
Federal, State & Work Study Funds 2011-2012 2012-2013 Net Change
Federal Pell Grant $2,986,989 $2,813,185 (-5.82%) Federal SEOG $76,125 $107,345 41.01% Federal Teach Grant $151,310 $133,333 (-11.89%) Texas Teacher Education Grant $258,359 $353,508 36.83% Tuition Equalization Grant (TEG) $1,151,094 $1,219,790 5.97% Federal Work Study $127,129 $107,148 (-15.72%) Texas Work Study $6,812 $6,824 0.2%
Analysis of Federal & Private Loans
Loans 2011-2012 2012-2013 Net Change
Federal Direct Stafford Loan $6,396,565 $7,007,984 9.56% Federal Direct Plus Loan $1,089,613 $450,579 (-58.65%) Alternative (Private) Loans $124,038 $83,170 (-32.95%) * All data refers to fiscal year.

Huston-Tillotson University Fact Book 2013-2014
- 77 -
Finances* (cont.)
Core Revenues July 1, 2012 to June 30, 2013
Revenue Source Core Expenses Percentage Total of
Core Expenses Tuition & Fees $9,178,865 43.9%
Government Grants & Contracts $5,075,574 24.3%
Private Gifts, Grants, & Contracts $2,880,576 13.8%
Investment Return $1,055,589 5.1%
Auxiliary Enterprises $2,346,549 11.2%
Other Core Revenues $359,736 1.7%
Total Core Revenues $20,896,889 100.0%
Total Expenses $18,856,417
* All data refers to fiscal year.
43.9%
24.3%
13.8%
5.1% 11.2% 1.7%
Core Revenues July 1, 2012-June 30, 2013
Tuition & Fees
Government Grants & Contracts Private Gifts, Grants, & Contracts Investment Return
Auxiliary Enterprises
Other Core Revenues

Huston-Tillotson University Fact Book 2013-2014
- 78 -
Finances* (cont.)
Core Expenses July 1, 2012 to June 30, 2013
Expense Function Recent Total of Core Expense Percentage
Instruction $5,321,879 28.2%
Academic Support $1,396,534 7.4%
Institution Support $5,439,425 28.8%
Student Services $3,055,391 16.2%
Auxiliary Enterprises $2,298,224 12.2%
Net Grant Aid to Students $1,344,964 7.1%
Other Core Expenses $0 0.0%
Total Expenditures $18,856,417 100.0%
Total Core Revenues $20,896,889
Institutional Net Assets
Time Frame Amount
Net assets at the beginning of year July 1, 2012 $17,684,245 Net assets at the end of year June 30, 2013 $19,724,717 Change in Net Assets $2,040,472
* All data refers to fiscal year
28.2%
7.4%
28.8%
16.2%
12.2% 7.1% 0.0%
Core Expenses July 1, 2012-June 30, 2013
Instruction
Academic Support
Institution Support
Student Services
Auxiliary Enterprises
Net Grant Aid to Students

Huston-Tillotson University Fact Book 2013-2014
- 79 -
Grants Trend Data
Grants Awarded: 2011-2014
Funding Source Description 2011-2012 2012-2013 2013-2014
3M Foundation AusPrep $5,000 $5,000 $5,000 Austin Independent School District (AISD) Green is the New Black $4,233 American Honda Motor Company Honda Challenge Grant $3,000 $3,000 Applied Materials AusPrep $7,500 AVID: College Access Challenge Grant $11,000 AVID: Summer Institute $10,000
City of Austin Community Health: 21st century Listening Tour $20,000
Department of Defense Mentor Protégé Program
$70,000* Department of Education Title III Part B $2,153,079 $1,985,991 $1,910,687 Department of Education SAFRA $872,713 $962,414 $872,713
Department of Health and Human Services SAMHSA
Minority Serving Institutions Partnerships with Community-Based Organizations (MSI/CBO) $300,000
Ford Foundation HBCU Community Challenge: Scholarships $75,000
General Board of Higher Education Renovations of Locker Room: Gym $300,000 General Board of Higher Education Replacement of Gym Roof $250,000 Home Depot Retool Your School
$10,000*
JAMP $9,914 $10,000 Kercheville Green is the New Black $500 Kodosky Foundation AusPrep $10,000 $10,000 $80,000 Lola Wright Foundation $30,000 $25,000 Lumina Foundation $12,000 $10,000 Mitte Foundation Scholarships $25,000 Morehouse School of Medicine HBCU: CFE Behavioral Mini-Grant $7,500 $7,500 $7,500 National Instruments AusPrep $20,000 $20,000 $20,000 Office of Naval Research Nuclear Science $150,000
Office of Naval Research Increase STEM Undergraduate Students Employment
$250,000*
Penn State Graduate School of Education
HBCUs as Leaders and Teachers in STEM Education $50,000
Sid Richardson Foundation AusPrep $7,253 THECB Teacher Preparation Grant $359,014 $296,000 $296,000 THECB: AVID Work Study Mentorship $70,000 $50,000

Huston-Tillotson University Fact Book 2013-2014
- 80 -
Grants Trend Data (cont.)
Grants Awarded: 2011-2014
Funding Source Description 2011-2012 2012-2013 2013-2014
Time Warner Cable Saturday STEM $4,000 $4,000* U.S. Department of Health Health & Wellness $99,000 United Methodist Church (UMC): 5% College Black Fund Teaching and Learning Institute $34,545 $34,152 $33,631 UNCF Special Programs CDIS $10,000 University of Texas-San Antonio AusPrep $7,256 $6,960 $7,757 University of Texas-European Study $6,000 $10,000 $10,000
USA Funds School and Student Services Capacity Grant - RamOnomics $100,000 $100,000
Total Awards $3,841,360 $3,801,931 $4,493,521 *Denotes grants awarded but not yet received

Huston-Tillotson University Fact Book 2013-2014
- 81 -
Campus Map

Huston-Tillotson University Fact Book 2013-2014
- 81 -
Glossary*
Term Definition
Academic year The period of time generally extending from September to June; usually equated to 2 semesters or trimesters, 3 quarters, or the period covered by a 4-1-4 calendar system.
ATCP Alternative Teacher Certification Program. Calculation of FTE students (using fall student headcounts)
The number of FTE students is calculated based on fall student headcounts as reported by the institution on the IPEDS Enrollment (EF) component (Part A). The full-time equivalent (headcount) of the institution's part-time enrollment is estimated by multiplying the factors noted below times the part-time headcount. These are then added to the full-time enrollment headcounts to obtain an FTE for all students enrolled in the fall. This formula is used to produce an FTE that is used annually in the Digest of Education Statistics. Part-time undergraduate enrollment
- Public 4-year (.403543) - Private (not-for-profit and for-profit) 4-year (.392857) - Public 2-year and <2-year (.335737) - All other institutions (.397058)
Part-time first-professional enrollment - Public 4-year (.600000) - Private (not-for-profit and for-profit) 4-year (.545454)
Part-time graduate enrollment - Public 4-year (.361702) - Private (not-for-profit and for-profit) 4-year (.382059)
Cohort A specific group of students established for tracking purposes. Completer A student who receives a degree, diploma, certificate, or other formal award. In order to
be considered a completer, the degree/award must actually be conferred. Core expenses Total expenses for the essential education activities of the institution. Core expenses for
public institutions reporting under GASB standards include expenses for instruction, research, public service, academic support, student services, institutional support, operation and maintenance of plant, depreciation, scholarships and fellowships, interest and other operating and nonoperating expenses. Core expenses for FASB (primarily private, not-for-profit and for-profit) institutions include expenses on instruction, research, public service, academic support, student services, institutional support, net grant aid to students, and other expenses. For both FASB and GASB institutions, core expenses exclude expenses for auxiliary enterprises (e.g., bookstores, dormitories), hospitals, and independent operations.
Core revenues Total revenues for the essential education activities of the institution. Core revenues for public institutions (using the Governmental Accounting Standards Board (GASB) standards) include tuition and fees; government appropriations (federal, state, and local); government grants and contracts; private gifts, grants, and contracts; investment income; other operating and nonoperating sources; and other revenues and additions. Core revenues for private, not-for-profit and public institutions reporting under the Financial Accounting Standards Board (FASB) standards include tuition and fees; government appropriations (federal, state, and local); government grants and contracts; private gifts, grants, and contracts; investment return; sales and services of educational activities; and other sources. Core revenues for private, for-profit institutions reporting under FASB

Huston-Tillotson University Fact Book 2013-2014
- 82 -
standards include tuition and fees; government appropriations (federal, state, and local); government grants and contracts; private grants and contracts; net investment income; sales and services of educational activities; and other sources. In general, core revenues exclude revenues from auxiliary enterprises (e.g., bookstores, dormitories), hospitals, and independent operations.
Degree/certificate seeking students
Students enrolled in courses for credit and recognized by the institution as seeking a degree, certificate, or other formal award. High school students also enrolled in postsecondary courses for credit are not considered degree/certificate-seeking.
First-time student (undergraduate)
A student who has no prior postsecondary experience (except as noted below) attending any institution for the first time at the undergraduate level. This includes students enrolled in academic or occupational programs. It also includes students enrolled in the fall term who attended college for the first time in the prior summer term, and students who entered with advanced standing (college credits earned before graduation from high school).
Full-time student Undergraduate: A student enrolled for 12 or more semester credits, or 12 or more quarter credits, or 24 or more contact hours a week each term. Graduate: A student enrolled for 9 or more semester credits, or 9 or more quarter credits, or a student involved in thesis or dissertation preparation that is considered full-time by the institution. Doctor's degree - Professional practice -as defined by the institution.
Non-degree-seeking student
A student enrolled in courses for credit who is not recognized by the institution as seeking a degree or formal award.
Pell Grant program (Higher Education Act of 1965, Title IV, Part A, Subpart I, as amended.) Provides grant assistance to eligible undergraduate postsecondary students with demonstrated financial need to help meet education expenses.
Retention rate A measure of the rate at which students persist in their educational program at an institution, expressed as a percentage. For four-year institutions, this is the percentage of first-time bachelors (or equivalent) degree-seeking undergraduates from the previous fall who are again enrolled in the current fall. For all other institutions this is the percentage of first-time degree/certificate-seeking students from the previous fall who either re-enrolled or successfully completed their program by the current fall.
* Definitions of variables used in this report can be found in the IPEDS online glossary available at
http://nces.ed.gov/ipeds/glossary/.

Huston-Tillotson University Fact Book for 2013-2014 is the official fact book of HT, produced by the Office of Institutional Planning, Research & Assessment.
If you have any questions or concerns, please contact Xia Serena Yan [email protected]
Office of Institutional Planning, Research & Assessment Room 310, Anthony & Louise Viaer-Alumni Hall
900 Chicon Street Huston-Tillotson University
Austin, TX 78702 P: 512.505.3020; F: 512.505.3198
http://htu.edu/offices/institutional-research
The mission of the Office of Institutional Planning, Research and Assessment is to systematically collect, analyze, evaluate and disseminate information that is valid and reliable to
support Institutional assessment, planning, policy formulation, accountability, and decision making at Huston-Tillotson University.