Fall 2013 fact book(1)
42
FALL 2013 FACT BOOK
-
Upload
malone-university -
Category
Documents
-
view
214 -
download
0
description
Facts & Figures about Malone University - 2013
Transcript of Fall 2013 fact book(1)

FALL 2013 FACT BOOK

MALONE UNIVERSITY FACT BOOK Table of Contents
Section I Student Data 2Enrollment Summary; Student/Faculty Ratio (Tables) 3Enrollment Summary (Graph) 4Undergraduate Enrollment Analysis 5Graduate Enrollment Analysis 6Students from Stark County High Schools 7Enrollment by State of Origin 8Students by Ethnicity; Countries Represented by International Students 9Religious Affiliation of Traditional Undergraduates 10Freshman Class Statistics 11
Section II Faculty Data 12Fall 2013 Faculty FTE Report 13Distribution of Faculty by School/Department and Highest Degree 14Distribution of Faculty by School/Department and Rank 15Full-time Faculty by Highest Degree (Historical) 16Full-time Faculty by Rank, Gender, and Ethnicity (Historical) 17History of Average FT Faculty Years of Service 18Mean/Median Faculty Salaries by Rank (Historical) 19
Section III Academic Data 20Undergraduate Enrollment by Major: 1-Yr Detail; 10-Yr History 21-22Graduate Enrollment by Program: 10-Yr History 23Total Student Hours by School/Department 24Summer School Student Hours by School/Department 25Undergraduate Summer School Statistics 26Comprehensive Enrollment Summary/Total Individuals Served 26Library Holdings and Circulation 27
Section IV Retention and Graduation Data 28Longitudinal Retention and Graduation Rates 29Major Field Analysis by # of (UG) Graduates: 1-Yr Detail; 10-Yr History 30-31Program Area Analysis by # of Master's Graduates: 10-Yr History 32Post-Graduation Plans of 2012 Graduates 33-36
Section V Financial Data 37Ten-Year History of Tuition, Room, and Board Charges 38Total Budget by Fiscal Year 39Malone Fund Income 40Total Gift Income 41
1

Section I
Student Data
2

HEADCOUNT FTEYEAR UNDERGRAD GRAD TOTAL YEAR UNDERGRAD GRAD TOTAL
1978-79 782 782 1978-79 742.0 742.01979-80 772 772 1979-80 740.0 740.01980-81 776 776 1980-81 729.0 729.01981-82 770 770 1981-82 729.0 729.01982-83 872 872 1982-83 749.0 749.01983-84 876 876 1983-84 716.0 716.01984-85 919 919 1984-85 772.0 772.01985-86 1039 1039 1985-86 879.0 879.01986-87 1048 1048 1986-87 891.0 891.01987-88 1205 1205 1987-88 1028.0 1028.01988-89 1325 1325 1988-89 1116.0 1116.01989-90 1457 1457 1989-90 1230.0 1230.01990-91 1515 46 1561 1990-91 1294.7 29.3 1324.01991-92 1607 94 1701 1991-92 1367.5 50.1 1417.61992-93 1714 91 1805 1992-93 1462.1 43.9 1506.01993-94 1820 109 1929 1993-94 1590.6 53.2 1643.81994-95 1876 128 2004 1994-95 1644.4 60.8 1705.21995-96 1896 120 2016 1995-96 1709.3 67.0 1776.31996-97 1909 192 2101 1996-97 1717.3 117.0 1834.31997-98 2013 226 2239 1997-98 1835.7 133.1 1968.81998-99 1968 262 2230 1998-99 1834.8 160.7 1995.51999-00 1957 244 2201 1999-00 1821.0 155.1 1976.12000-01 1951 217 2168 2000-01 1871.9 132.7 2004.52001-02 1917 239 2156 2001-02 1822.5 148.0 1970.52002-03 1889 257 2146 2002-03 1819.2 167.4 1986.62003-04 1943 270 2213 2003-04 1819.1 174.0 1993.12004-05 1939 314 2253 2004-05 1856.5 200.9 2057.42005-06 1936 357 2293 2005-06 1834.0 237.4 2071.42006-07 1968 336 2304 2006-07 1866.0 225.8 2091.82007-08 2035 350 2385 2007-08 1903.0 229.9 2132.92008-09 2046 409 2455 2008-09 1902.7 279.4 2182.12009-10 2208 430 2638 2009-10 2030.8 284.6 2315.32010-11 2098 429 2527 2010-11 1974.0 304.8 2278.82011-12 1965 475 2440 2011-12 1866.6 334.4 2201.02012-13 1921 475 2396 2012-13 1821.9 321.4 2143.42013-14 1672 441 2113 2013-14 1561.7 318.0 1879.7
ST: FAC FALL '07 FALL '08 FALL '09 FALL '10 FALL '11 FALL '12 FALL '13RATIO 14.1:1 14.0:1 14.8:1 14.5:1 13.4:1 13.3:1 12.7:1
NOTE: The formula used for calculating the above ratio is as follows: All full-time plus 1/3 of part-time students to all full-time plus 1/3 of part-time faculty.FT faculty includes those whose classroom teaching comprises 50% or more of their total load hours.PT faculty does not include FT Malone personnel who teach in addition to their regular positions,supervisors of student teachers/interns/research practicums, or instructors of applied music lessons.
ENROLLMENT SUMMARY - Fall 1978 to Fall 2013
STUDENT:FACULTY RATIO SUMMARY - Fall 2007 to Fall 2013
KRW091113
3

KRW092513
1325
14571561
17021805
19292004 2016
2101
2239 2230 2201 2168 2156 21462213 2253
2293 23042385
2455
26382527
24402396
2113
11321205
12571335
1402
1532 1543 1571 15451624 1583 1600 1578 1529 1505
1604 1591 1623 16131698 1708
18141743
1665 1627
1447
193252 258 273 312 288 333 325 364 389 385 357 373 388 384 339 348 313
355
337
338394
355300 294
22546
94 91 109 128 120192 226 262 244 217 239 257 270 314 357
336
350
409 430 429 475 475 441
0
500
1000
1500
2000
2500
1988 1989 1990 1991 1992 1993 1994 1995 1996 1997 1998 1999 2000 2001 2002 2003 2004 2005 2006 2007 2008 2009 2010 2011 2012 2013
Enrollm
ent
Fall Semester
HISTORY OF FALL ENROLLMENTS BY HEADCOUNT
TOTAL TRADITIONAL UNDERGRADS DEGREE COMPLETION GRADUATE
4

UNDERGRADUATE ENROLLMENT ANALYSISFall Semester
2009-10 2010-11 2011-12 2012-13 2013-14
TOTAL ENROLLMENT 2208 2097 1964 1913 1674
BY ACADEMIC CLASSIFICATIONFreshman 641 546 505 476 414Sophomore 344 367 327 287 271Junior 351 348 369 307 279Senior 366 379 376 460 377Unclassified (inc. PSEs and other non-DS) 70 52 44 48 75Transient (for 2008-09, Transient in 2 0 0 5 2Degreed (for 2008-09, Degreed in 40 52 41 48 29MMP-FT (inc. online) 284 263 222 190 169MMP-PT (inc. Portfolio, Project, other) 72 66 55 58 27BSNDC 38 24 25 34 31
BY STUDENT LOAD* Full-time (12 or more hours) 1573 1544 1503 1479 1283Part-time (less than 12 hours) 241 200 159 152 164
BY SEMESTER HOURSTotal 25319.5 25008.5 24111.0 23630.0 20546.5Part-time 1685.5 1513.5 1134.5 979.5 1123Full-time Equivalent (15/sem) 1688.0 1667.2 1607.4 1575.3 1369.8FTE - MMP (36/3 trimesters) 316.4 287.9 244.2 219.7 162.9FTE - BSNDC 26.4 17.5 15.0 26.9 22.7
BY GENDERMen 894 863 828 796 709Women 1314 1234 1136 1117 965
BY RESIDENCEResident 1105 1052 1057 1001 856
Men 467 453 473 440 388Women 638 599 584 561 468
Commuter 1103 1045 907 912 818Men 427 410 355 356 321Women 676 635 552 556 497
DETAIL FOR FALL 2013*
New Re-Admits ContinuingFull-time Part-time Total FT PT FT PT FT PT
Freshmen 410 4 414 331 2 0 2 79 0Sophomores 266 5 271 28 0 1 0 237 5Juniors 267 12 279 14 5 0 0 253 7Seniors 324 53 377 4 0 0 3 320 50Unclassified** 0 75 75 0 0 0 5 0 70Transients 0 2 2 0 0 0 1 0 1Degreed 17 12 29 0 1 2 0 15 11
Totals 1284 163 1447 377 8 3 11 904 144
* No MMP or RN/BSN students included** Includes PSEs, DEs, Auditors, other Non-degree-seeking students
KRW091813
5

GRADUATE ENROLLMENT ANALYSISFall Semester
HEADCOUNT by hoursFull-time* Part-time
6 -> 8.5 9 > .5 -> 5.5 TotalBusiness 62 20 6 88Counseling 70 29 16 115Education 23 9 57 89Leadership 32 13 25 70Nursing 62 0 3 65Theological Studies 11 1 1 13
TOTAL 260 72 108 440
* Full-time status based on enrollment in 9 hours or more.
CREDIT HOUR DISTRIBUTION
.5 -> 5.5 6 -> 8.5 9 > Total FTE**Business 27 376 181 584 64.9Counseling 48 420 282 750 83.3Education 201 145 99 445 49.4Leadership 98 240 135 473 52.6Nursing 10 496 0 506 56.2Theological Studies 4 66 9 79 8.8
TOTAL 388 1743 706 2837 315.2
** Full-time equivalent based on 9 hours.
BY ENROLLMENT STATUS
New*** Readmit*** Continuing TotalBusiness 25 1 62 88Counseling 20 2 93 115Education 17 1 71 89Leadership 23 1 46 70Nursing 28 2 35 65Theological Studies 1 1 11 13
TOTAL 114 8 318 440
*** New or Re-admitted (in Summer 2013 or Fall 2013) to the program listed
BY GENDER
Male Female TotalBusiness 52 36 88Counseling 26 89 115Education 24 65 89Leadership 25 45 70Nursing 3 62 65Theological Studies 9 4 13
TOTAL 139 301 440
2007-08 2008-09 2009-10 2010-11 2011-12 2012-13
Graduate Student EnrollmentFall 454 567 574 539 638 620
New Students and Re-AdmitsSpring 221 194 191 195 196 167Summer (all sessions) 293 389 413 338 374 236
Total Individuals Served 968 1150 1178 1072 1208 1023
Comprehensive Summary of Graduate Enrollment
KRW091713
6

STUDENTS FROM STARK COUNTY HIGH SCHOOLS
CANTONMcKinley 31 35 44 44 37
Timken 13 12 10 8 4
Central Catholic 16 13 12 13 10
Subtotal 60 60 66 65 51
ALLIANCEAlliance 11 6 3 8 4
MASSILLONWashington 20 23 24 19 18
NORTH CANTONHoover 36 36 33 30 25
Subtotal 67 65 60 57 47
STARK COUNTYCanton South 13 12 8 15 14
East Canton 16 17 15 13 9
Fairless 18 15 13 14 15
Glen Oak 44 37 26 36 40 [+22]*
Heritage Christian 14 17 16 16 9
Jackson 29 31 42 37 32
Lake 34 37 27 25 20
Lake Center Christian 20 26 25 23 21
Louisville 17 22 33 33 29
Marlington 26 22 21 23 15
Massillon Christian 2 2 2 1 2
Minerva 12 18 17 15 12
Northwest 16 15 15 16 16
Perry 47 38 41 38 31
Sandy Valley 10 11 11 5 7
St. Thomas Aquinas 2 5 7 3 3
Tuslaw 16 18 15 10 6
Subtotal 336 343 334 323 281
Home Schooled 88 64 63 68 49
GRAND TOTAL 551 532 523 513 428
Note: PSE students are included. Adult degree-completion students and graduate students are not included.* Dual enrollment students not included in grand total.
2012-132009-10 2010-11 2011-12 2013-14
KRW092313
7

Note: PSE and DE students are included. Degree-completion and graduate students are not included.2006-07 2007-08 2008-09 2009-10 2010-11 2011-12 2012-13 2013-14
Alabama 0 0 0 1 1 1 2 0Alaska 1 1 1 1 2 1 2 1Arizona 1 3 3 2 2 4 2 2California 8 9 10 13 18 21 24 30Colorado 2 1 0 0 0 0 2 0Connecticut 0 0 1 4 4 7 4 2Delaware 2 2 2 1 1 1 1 0Florida 3 4 39 26 6 12 16 13Georgia 2 3 4 4 4 2 3 1Hawaii 0 0 0 3 2 2 3 0Idaho 0 0 1 1 1 1 1 0Illinois 3 1 3 5 5 6 4 9Indiana 6 10 8 6 3 3 5 5Iowa 0 0 0 0 0 0 0 0Kansas 0 1 1 0 0 0 1 1Kentucky 1 1 1 3 1 0 1 1Louisiana 0 0 0 1 0 0 0 0Maine 1 1 2 1 1 0 0 0Maryland 2 5 7 7 7 6 5 10Massachusetts 3 3 2 1 4 5 4 3Michigan 12 9 8 19 11 12 16 19Minnesota 1 2 1 1 1 0 0 2Mississippi 0 0 0 0 0 0 1 1Missouri 0 1 1 2 2 1 1 0Montana 1 1 1 1 1 1 1 0Nebraska 0 0 0 1 0 0 0 0Nevada 1 1 1 0 2 2 2 0New Hampshire 1 1 0 1 1 1 2 0New Jersey 5 6 3 7 6 6 7 2New Mexico 0 0 1 0 0 0 1 1New York 20 19 23 23 21 26 19 14North Carolina 0 2 8 4 5 3 5 3North Dakota 0 0 0 0 0 0 1 0Oklahoma 1 0 1 1 0 0 0 0Oregon 0 0 0 0 0 0 1 2Pennsylvania 113 126 120 121 104 90 72 60Rhode Island 0 0 1 0 0 0 0 0South Carolina 0 0 0 1 2 2 0 1South Dakota 0 0 0 1 0 0 0 0Tennessee 0 1 1 1 2 2 0 2Texas 5 4 2 4 3 2 3 3Utah 0 0 0 0 0 0 0 1Virginia 8 5 6 4 2 3 2 6Washington 0 0 0 0 0 4 2 3West Virginia 8 6 7 4 5 3 4 3Wisconsin 2 2 2 1 0 0 0 1Non-Ohio Subtotals 213 231 272 277 230 230 220 202
Ohio 1373 1426 1416 1499 1486 1408 1385 1220
Internationals 26 23 20 22 28 24 25 23
U.S. Citizens Residing 1 n/a n/a n/a n/a n/a 1 2Outside the 50 States
GRAND TOTAL 1613 1680 1708 1798 1744 1662 1631 1447
KRW091913
STUDENT ENROLLMENT BY STATE
8
STUDENTS BY RACE/ETHNICITY
Number/% of Total N % N % N % N % N % N % N %Am Indian/Alask Nat 7 0.3 8 0.3 10 0.4 5 0.2 2 0.1 9 0.4 7 0.3Asian 15 0.6 16 0.7 18 0.7 22 0.9 12 0.5 12 0.5 16 0.8Black/Non-Hispanic 160 6.8 171 7.0 219 8.4 196 7.8 216 8.9 200 8.5 149 7.1Caucasian 2128 90.4 2182 89.7 2297 87.9 2205 88.3 2097 86.8 2030 85.9 1784 85.5Hispanic 26 1.1 31 1.3 31 1.2 20 0.8 46 1.9 57 2.4 56 2.7Nat Hawaiian/Pac Is 2 0.1 3 0.1 3 0.1Two or more races 24 1.0 39 1.7 39 1.9Unknown* 19 0.8 25 1.0 38 1.5 49 2.0 16 0.7 12 0.5 33 1.6
Total 2355 100.0 2433 100.0 2613 100.0 2497 100.0 2415 100.0 2362 100.0 2087 100.0* In Fall 2010, 12 students from Hong Kong enrolled in an online MMP cohort were included.
INTERNATIONAL STUDENTS
Antigua and BarbudaAustraliaBermudaBoliviaBrazilBulgariaBurundiCameroonCanadaChinaColombiaCongoDenmarkEgyptFinlandGermanyGhanaGreeceIndiaIrelandJamaicaKenyaLiberiaMexicoPolandRomaniaSerbiaSouth AfricaSouth KoreaSpainSt. LuciaTaiwanTrinidadUgandaUkraineUnited KingdomVenezuelaZambia
Total
0 0 0 0 0 0 1
0 0 0 0 0 0 1
04100112
00
27
1
1002
1
1
10001100
011200202
0010300
00
2007 2008 2009 2010 2011 2013
201310
2012
201211
000
27
11
0030
00
01
2
0
20
10
00
000
051
00
Includes traditional undergrads and graduate students
2007 2008 20090
2010 20111
06110
051101
24
1002
11
411
0010
0
2
002
0011
1
1
24
01
0
0 0
0
1
0 0
1
5
10
11
0
22
0
3
0
0
0
030101 0
110
1210
00
02
2
11
0
1
0
1
0 3
110
20
0
021
0
02
00
1
20
20
1
11
11
01
Includes traditional undergrads, degree-completion students, and graduate students
0 02
12
1
10102
0
0
0 1
0 0 0 0
01
02
28
1
000
25
0211
00
1021
0
0
01
00
1
1
0 0
0 1
0 0 2
0 0 0 0 0 110
1
0 0
0 0
KRW092313
9

2006 2007 2008 2009 2010 2011 2012 2013African Methodist Episcopal 0 0 0 1 1 0 0 0American Baptist 1 1 0 1 1 4 3 5Anglican 1 3 1 3 3 2 2 1Apostolic 7 6 7 11 13 11 19 12Assembly of God 48 50 51 46 44 44 43 39Baptist 184 183 175 204 198 194 179 129Bible 13 9 10 6 5 10 7 3Brethren 48 49 64 55 52 44 29 28Catholic 98 119 123 121 107 95 93 91Christian 78 76 75 77 93 113 132 137Christian & Missionary Alliance 45 52 48 52 40 47 35 31Christian Church Disciples of Christ 3 2 4 4 7 8 9 11Christian Reformed Church in America 4 5 7 5 8 5 9 8Church of Christ 31 28 25 41 34 34 32 30Church of God 38 34 30 30 27 28 27 27Church of Jesus Christ-Latter Day Saints 0 0 0 0 0 1 2 2Community 3 3 5 6 7 8 9 6Congregational 2 3 3 2 2 4 2 2Covenant 1 1 0 0 0 0 0 0Eastern Orthodox 4 1 3 4 4 5 2 3Episcopal 8 9 5 5 4 3 2 3Evangelical 26 25 17 28 38 31 41 46Free Methodist 26 32 23 26 20 15 14 14Friends 143 132 139 141 116 88 78 54Gospel 4 2 2 2 2 1 1 1Greek Orthodox 1 1 1 2 2 0 0 0Independent 9 12 11 8 12 12 9 8Interdenominational 0 0 0 0 2 2 5 5Judaism 0 0 0 0 0 0 0 0Lutheran 42 33 38 41 40 27 25 17Lutheran Church in America 1 1 1 2 0 0 0 0Lutheran Church - Missouri Synod 1 0 1 1 2 2 7 8Lutheran, Evangelical 1 0 0 0 0 4 4 5Mennonite 57 57 55 57 55 50 43 37Methodist 7 8 5 5 6 5 16 34Moravian 0 1 1 1 1 0 0 1Nazarene 37 46 40 47 46 37 28 20Pentecostal 34 33 29 25 29 31 26 23Presbyterian 35 33 36 39 32 22 24 14Presbyterian Church of America (PCA) 0 0 0 0 0 1 6 6Protestant 7 4 3 3 3 4 9 13Russian Orthodox 1 2 2 2 1 0 0 0Salvation Army 5 5 8 8 9 4 4 2Serbian Orthodox 0 0 0 1 1 0 0 0Seventh Day Adventist 2 1 0 1 2 3 2 2Southern Baptist Convention 5 9 11 5 8 9 7 5United Church of Christ 20 18 16 12 8 6 3 2United Methodist 115 124 135 129 106 107 77 58United Presbyterian 8 7 10 17 11 15 11 11Wesleyan Church 10 9 4 7 11 11 12 5Wesleyan Methodist 1 2 2 2 2 1 2 2Non-Denominational 294 342 364 364 369 333 309 250Other Churches or Religions 14 12 9 8 5 9 15 12No Church Listed 90 95 109 140 155 172 217 224
Total 1613 1680 1708 1798 1744 1662 1631 1447
Note: PSE and DE students are included. Degree-completion and graduate students are not included.
RELIGIOUS AFFILIATIONS
KRW092413
10
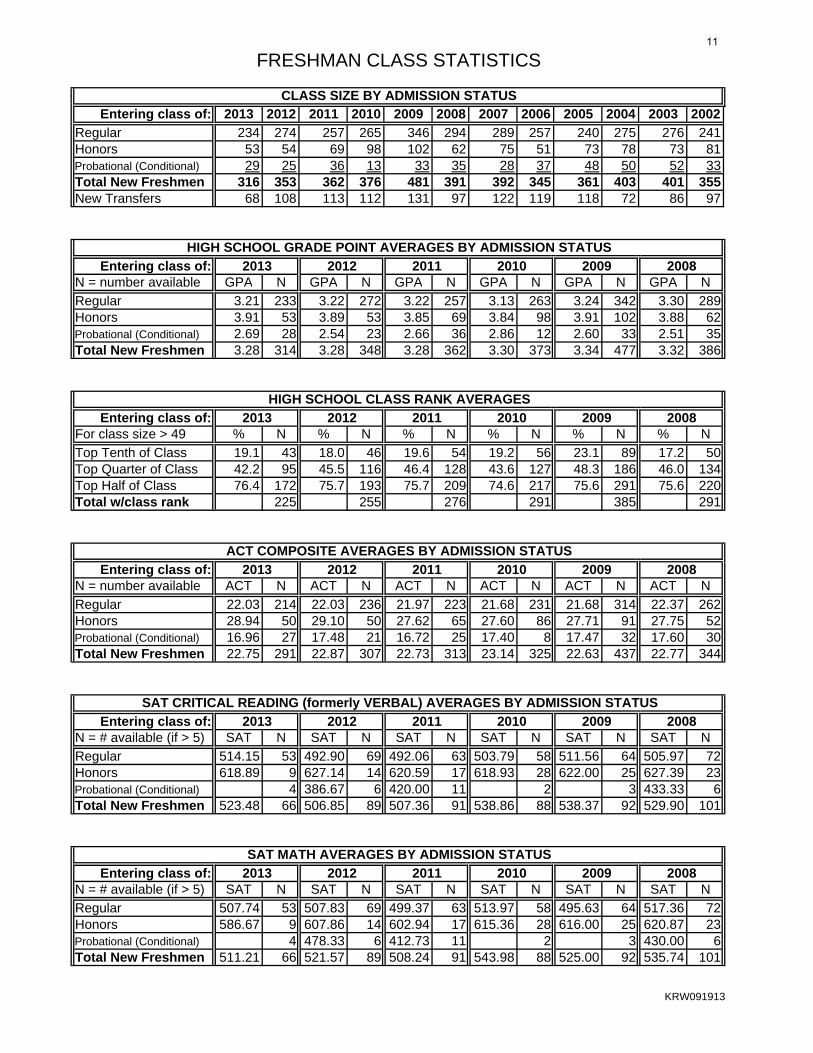
Entering class of: 2013 2012 2011 2010 2009 2008 2007 2006 2005 2004 2003 2002
Regular 234 274 257 265 346 294 289 257 240 275 276 241Honors 53 54 69 98 102 62 75 51 73 78 73 81Probational (Conditional) 29 25 36 13 33 35 28 37 48 50 52 33Total New Freshmen 316 353 362 376 481 391 392 345 361 403 401 355New Transfers 68 108 113 112 131 97 122 119 118 72 86 97
Entering class of:N = number available GPA N GPA N GPA N GPA N GPA N GPA N
Regular 3.21 233 3.22 272 3.22 257 3.13 263 3.24 342 3.30 289Honors 3.91 53 3.89 53 3.85 69 3.84 98 3.91 102 3.88 62Probational (Conditional) 2.69 28 2.54 23 2.66 36 2.86 12 2.60 33 2.51 35Total New Freshmen 3.28 314 3.28 348 3.28 362 3.30 373 3.34 477 3.32 386
Entering class of:For class size > 49 % N % N % N % N % N % N
Top Tenth of Class 19.1 43 18.0 46 19.6 54 19.2 56 23.1 89 17.2 50Top Quarter of Class 42.2 95 45.5 116 46.4 128 43.6 127 48.3 186 46.0 134Top Half of Class 76.4 172 75.7 193 75.7 209 74.6 217 75.6 291 75.6 220Total w/class rank 225 255 276 291 385 291
Entering class of:N = number available ACT N ACT N ACT N ACT N ACT N ACT N
Regular 22.03 214 22.03 236 21.97 223 21.68 231 21.68 314 22.37 262Honors 28.94 50 29.10 50 27.62 65 27.60 86 27.71 91 27.75 52Probational (Conditional) 16.96 27 17.48 21 16.72 25 17.40 8 17.47 32 17.60 30Total New Freshmen 22.75 291 22.87 307 22.73 313 23.14 325 22.63 437 22.77 344
Entering class of:N = # available (if > 5) SAT N SAT N SAT N SAT N SAT N SAT N
Regular 514.15 53 492.90 69 492.06 63 503.79 58 511.56 64 505.97 72Honors 618.89 9 627.14 14 620.59 17 618.93 28 622.00 25 627.39 23Probational (Conditional) 4 386.67 6 420.00 11 2 3 433.33 6Total New Freshmen 523.48 66 506.85 89 507.36 91 538.86 88 538.37 92 529.90 101
Entering class of:N = # available (if > 5) SAT N SAT N SAT N SAT N SAT N SAT N
Regular 507.74 53 507.83 69 499.37 63 513.97 58 495.63 64 517.36 72Honors 586.67 9 607.86 14 602.94 17 615.36 28 616.00 25 620.87 23Probational (Conditional) 4 478.33 6 412.73 11 2 3 430.00 6Total New Freshmen 511.21 66 521.57 89 508.24 91 543.98 88 525.00 92 535.74 101
2008
FRESHMAN CLASS STATISTICS
ACT COMPOSITE AVERAGES BY ADMISSION STATUS
2008
HIGH SCHOOL GRADE POINT AVERAGES BY ADMISSION STATUS
SAT CRITICAL READING (formerly VERBAL) AVERAGES BY ADMISSION STATUS
2011
2009 2008
2010
CLASS SIZE BY ADMISSION STATUS
SAT MATH AVERAGES BY ADMISSION STATUS
2012
2012
2011
2010
20082012
2011 2010
20082012
HIGH SCHOOL CLASS RANK AVERAGES
2011 2010 20092013
2011
2012
20092013
2013
2013 2010 2009
20092013
KRW091913
11

Section II
Faculty Data
12

NOTES: PT-INSIDE refers to FT or PT non-faculty employees (> or = 50%) who teach at least 1 course; FTE = teaching load hours divided by 12 (normal semester load)
COLLEGE/SCHOOL FTE-FT % FTE-PT % FTE-PT % FTE HISTORYDepartment/Program (INSIDE) (OUTSIDE) TOTAL TOTAL FTE
DISTRIBUTED LEARNING 0.67 30.8% 0.50 23.1% 1.00 46.2% 2.17 FALL '96GEN 100/101/150/460; HON 260/370 4.50 73.0% 1.00 16.2% 0.67 10.8% 6.17 120.86COLLEGE OF THEOLOGY, ARTS, AND SCIENCES FALL '97Communication Arts 5.25 86.1% 0.23 3.7% 0.63 10.2% 6.10 126.91History, Philosophy, and Social Sciences 6.42 92.8% 0.00 0.0% 0.50 7.2% 6.92 FALL '98Language and Literature 6.02 64.4% 0.00 0.0% 3.33 35.6% 9.36 133.00Mathematics and Computer Science 3.94 74.7% 0.83 15.8% 0.50 9.5% 5.28 FALL '99Music 6.27 54.3% 0.00 0.0% 5.29 45.7% 11.56 140.81Natural Sciences 8.06 91.6% 0.11 1.3% 0.63 7.1% 8.79 FALL '00Psychology 3.15 75.9% 0.00 0.0% 1.00 24.1% 4.15 144.35Social Work 1.76 96.0% 0.00 0.0% 0.07 4.0% 1.83 FALL '01Theology 4.67 64.7% 0.20 2.8% 2.34 32.5% 7.21 139.57Visual Arts 0.60 17.9% 0.00 0.0% 2.77 82.1% 3.37 FALL '02SCHOOL OF BUSINESS AND LEADERSHIP 139.60Business 5.42 79.7% 0.63 9.3% 0.75 11.0% 6.80 FALL '03SCHOOL OF EDUCATION AND HUMAN DEVELOPMENT 145.01Education 7.78 64.7% 0.46 3.8% 3.78 31.4% 12.02 FALL '04SCHOOL OF NURSING AND HEALTH SCIENCES 146.95Nursing 9.57 66.0% 0.27 1.9% 4.66 32.1% 14.50 FALL '05Health Sciences 2.00 0.0% 0.00 0.0% 0.00 0.0% 2.00 145.28Total Undergraduate 76.08 70.3% 4.23 3.9% 27.91 25.8% 108.22 FALL '06DEGREE COMPLETION 150.07MMP 3.19 48.1% 0.42 6.3% 3.03 45.6% 6.64 FALL '07RN/BSN 1.17 52.2% 0.15 6.7% 0.92 41.0% 2.23 152.90Total Degree Completion 4.36 49.2% 0.57 6.4% 3.94 44.5% 8.87 FALL '08GRADUATE PROGRAMS 151.64Business Administration (MBA) 3.00 80.2% 0.00 0.0% 0.74 19.8% 3.74 FALL '09Counseling/Human Development (MAEd) 3.58 54.7% 0.00 0.0% 2.97 45.3% 6.55 160.58Education (MAEd) 2.27 47.0% 0.00 0.0% 2.56 53.0% 4.83 FALL '10Nursing (MSN) 1.96 69.5% 0.00 0.0% 0.86 30.5% 2.82 159.29Organizational Leadership (MAOL) 2.89 100.0% 0.00 0.0% 0.00 0.0% 2.89 FALL '11Theological Studies (MATS) 0.67 50.0% 0.00 0.0% 0.67 50.0% 1.33 156.35Total Graduate 14.37 64.8% 0.00 0.0% 7.80 35.2% 22.17 FALL '12TOTAL FACULTY FTE 94.81 68.1% 4.80 3.4% 39.65 28.5% 139.26 153.22
krw091613
FALL 2013 FACULTY FULL-TIME EQUIVALENT REPORT 13

COLLEGE/SCHOOL TOTALDepartment/Program # % # % # %
COLLEGE OF THEOLOGY, ARTS, AND SCIENCESCommunication Arts 4 66.7% 1 16.7% 1 16.7% 6History, Philosophy, Social Sciences 8 100.0% 0 0.0% 0 0.0% 8Language and Literature 7 77.8% 0 0.0% 2 22.2% 9Mathematics and Computer Science 4 100.0% 0 0.0% 0 0.0% 4Music 5 71.4% 0 0.0% 2 28.6% 7Natural Sciences 7 77.8% 0 0.0% 2 22.2% 9Psychology 4 100.0% 0 0.0% 0 0.0% 4Social Work 2 66.7% 0 0.0% 1 33.3% 3Theology (inc MATS) 8 100.0% 0 0.0% 0 0.0% 8Visual Arts 1 100.0% 0.0% 0 0.0% 1
SCHOOL OF BUSINESS AND LEADERSHIPBusiness (inc MBA/MAOL) 11 84.6% 0 0.0% 2 15.4% 13Management Studies 2 50.0% 0 0.0% 2 50.0% 4
SCHOOL OF EDUCATION AND HUMAN DEVELOPMENTEducation 9 81.8% 0 0.0% 2 18.2% 11Counseling and Human Development 4 100.0% 0 0.0% 0 0.0% 4
SCHOOL OF NURSING AND HEALTH SCIENCESNursing (inc MSN) 4 28.6% 0 0.0% 10 71.4% 14Health Sciences 2 100.0% 0 0.0% 0 0.0% 2
ALL 82 76.6% 1 0.9% 24 22.4% 107
* Includes faculty on leave or sabbatical and deans; but, not other administrators or librarians with faculty status.** Other terminal degree (i.e., J.D., M.Div., M.F.A.)
DOCTORATE OTHER TERM** <=MASTER'S
DISTRIBUTION OF 2013-14 FULL-TIME FACULTY MEMBERS*BY COLLEGE/SCHOOL/Department AND HIGHEST DEGREE
KRW081913
14

COLLEGE/SCHOOL TOTALDepartment/Program # % # % # % # % # % FAC
COLLEGE OF THEOLOGY, ARTS, AND SCIENCESCommunication Arts 4 67% 0 0% 1 17% 1 17% 0 0% 6History, Philosophy, Social Sciences 6 75% 1 13% 1 13% 0 0% 0 0% 8Language and Literature 4 44% 1 11% 2 22% 2 22% 0 0% 9Mathematics and Computer Science 1 25% 2 50% 1 25% 0 0% 0 0% 4Music 2 29% 1 14% 2 29% 0 0% 2 29% 7Natural Sciences 3 33% 1 11% 4 44% 0 0% 1 11% 9Psychology 4 100% 0 0% 0 0% 0 0% 0 0% 4Social Work 1 33% 2 67% 0 0% 0 0% 0 0% 3Theology (inc MATS) 3 38% 3 38% 2 25% 0 0% 0 0% 8Visual Arts 1 100% 0 0% 0 0% 0 0% 0 0% 1
SCHOOL OF BUSINESS AND LEADERSHIPBusiness (inc MBA/MAOL) 8 62% 3 23% 1 8% 1 8% 0 0% 13Management Studies 0 0% 0 0% 2 50% 2 50% 0 0% 4
SCHOOL OF EDUCATION AND HUMAN DEVELOPMENTEducation 5 45% 3 27% 2 18% 1 9% 0 0% 11Counseling and Human Development 0 0% 2 50% 2 50% 0 0% 0 0% 4
SCHOOL OF NURSING AND HEALTH SCIENCESNursing (inc MSN) 1 7% 5 36% 4 29% 4 29% 0 0% 14Health Sciences 2 100% 0 0% 0 0% 0 0% 0 0% 2
ALL 45 42.1% 24 22.4% 24 22.4% 11 10.3% 3 2.8% 107
* Includes faculty on leave or sabbatical and deans; but, not administrators or librarians with faculty status.
DISTRIBUTION OF 2013-14 FULL-TIME FACULTY MEMBERS*BY COLLEGE/SCHOOL/Department AND RANK
PROFESSOR ASSOCIATE ASSISTANT INSTRUCTOR LECTURER
KRW081913
15

YEAR DOCTORATES OTHER TERMINAL**<=MASTERS % DOCTORATES % DOC + TERM** TOTAL FACULTY1992-93 30 1 37 42.9% 44.3% 701993-94 31 1 37 43.7% 45.1% 711994-95 35 2 38 45.5% 48.1% 771995-96 42 2 38 50.6% 53.0% 831996-97 44 3 37 51.8% 55.3% 851997-98 45 2 40 50.6% 52.8% 891998-99 46 3 42 49.5% 52.7% 931999-00 55 3 41 55.0% 58.0% 1002000-01 56 3 46 52.8% 55.7% 1062001-02 56 5 41 53.8% 58.7% 1042002-03 59 6 38 57.3% 63.1% 1032003-04 58 5 37 58.0% 63.0% 1002004-05 62 7 37 58.5% 65.1% 1062005-06 68 7 31 64.2% 70.8% 1062006-07 69 7 35 62.2% 68.5% 1112007-08 71 4 36 64.0% 67.6% 1112008-09 76 4 33 67.3% 70.8% 1132009-10 77 4 34 67.0% 70.4% 1152010-11 76 4 32 67.9% 71.4% 1122011-12 76 3 32 68.5% 71.2% 1112012-13 81 2 29 72.3% 74.1% 1122013-14 82 1 24 76.6% 77.6% 107
* Includes faculty on leave/sabbatical and deans (college; school), but not administrators or librarians with faculty status.** Other terminal degree (i.e., J.D., M.Div., M.F.A.)
FULL-TIME FACULTY* BY HIGHEST DEGREE EARNED
KRW081913
16

ACADEMIC YEAR 2004-05 2005-06 2006-07 2007-08 2008-09 2009-10 2010-11** 2011-12** 2012-13** 2013-14** # OF FACULTY 106 106 111 111 113 115 112 111 112 107Number of: Professors 23 26 26 30 38 40 43 46 48 45 Associate Professors 39 40 40 37 30 38 32 26 21 24 Assistant Professors 29 25 25 25 31 23 25 25 28 24 Instructors 14 15 20 18 13 13 11 13 12 11 Lecturers 1 0 0 1 1 1 1 1 3 3Percentage of Total: Professors 21.7% 24.5% 23.5% 27.0% 33.6% 34.8% 38.4% 41.4% 42.9% 42.1% Associate Professors 36.8% 37.7% 36.0% 33.3% 26.5% 33.0% 28.6% 23.4% 18.8% 22.4% Assistant Professors 27.4% 23.6% 22.5% 22.5% 27.4% 20.0% 22.3% 22.5% 25.0% 22.4% Instructors 13.2% 14.2% 18.0% 16.2% 11.5% 11.3% 9.8% 11.7% 10.7% 10.3% Lecturers 0.9% 0.0% 0.0% 0.9% 0.9% 0.9% 0.9% 0.9% 2.7% 2.8%
Number of: Women 46 45 49 52 56 57 55 56 58 56 Men 60 61 62 59 57 58 57 55 54 51Percentage of Total: Women 43.4% 42.5% 44.1% 46.8% 49.6% 49.6% 49.1% 50.5% 51.8% 52.3% Men 56.6% 57.5% 55.9% 53.2% 50.4% 50.4% 50.9% 49.5% 48.2% 47.7%Number of: Causasian 100 100 106 105 108 110 107 105 104 100 Minority + Internat'l 6 6 5 6 5 5 5 6 8 7Percentage of Total: Causasian 94.3% 94.3% 95.5% 94.6% 95.6% 95.7% 95.5% 94.6% 92.9% 93.5% Minority + Internat'l 5.7% 5.7% 4.5% 5.4% 4.4% 4.3% 4.5% 5.4% 7.1% 6.5%* Includes faculty on leave or sabbatical, but not administrators with faculty status.** Includes college/school deans.
FULL-TIME FACULTY* BY RANK, GENDER, AND ETHNICITY
KRW081913
17
KRW081913
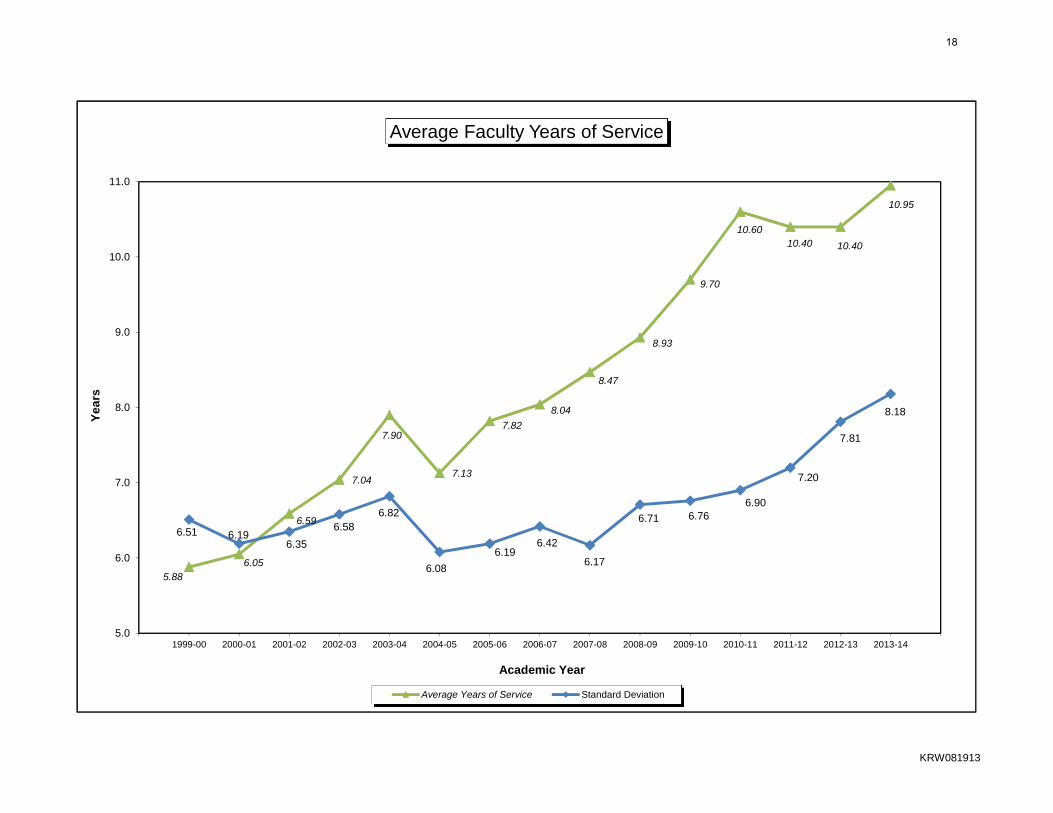
5.88
6.05
6.59
7.04
7.90
7.13
7.82
8.04
8.47
8.93
9.70
10.6010.40 10.40
10.95
6.51 6.196.35
6.586.82
6.08
6.196.42
6.17
6.71 6.766.90
7.20
7.81
8.18
5.0
6.0
7.0
8.0
9.0
10.0
11.0
1999-00 2000-01 2001-02 2002-03 2003-04 2004-05 2005-06 2006-07 2007-08 2008-09 2009-10 2010-11 2011-12 2012-13 2013-14
Ye
ars
Academic Year
Average Faculty Years of Service
Average Years of Service Standard Deviation
18

MEAN ACADEMIC FACULTY SALARIES BY RANK (Base Salaries)
ASSOCIATE ASSISTANTYEAR PROFESSOR PROFESSOR PROFESSOR INSTRUCTOR LECTURER
1999-00 50,222 42,024 36,190 33,393 27,5482000-01 51,493 43,708 38,261 31,570 29,2332001-02 52,479 44,975 39,083 33,884 29,7492002-03 53,785 45,477 40,097 34,807 29,8562003-04 56,145 47,478 42,449 35,876 32,0482004-05 58,233 49,266 42,617 36,425 N < 52005-06 60,390 51,391 44,460 38,391 none2006-07 62,881 53,398 46,949 39,905 none2007-08 64,187 55,619 47,671 40,086 N < 52008-09 66,487 56,874 47,868 42,032 N < 52009-10 66,636 55,760 48,287 41,792 N < 52010-11* 66,878 56,999 48,545 42,970 N < 52011-12 65,585 57,035 46,646 41,936 N < 52012-13 65,310 58,089 47,086 41,948 N < 52013-14 66,073 57,027 48,123 42,595 N < 5
MEDIAN ACADEMIC FACULTY SALARIES BY RANK (Base Salaries)
ASSOCIATE ASSISTANTYEAR PROFESSOR PROFESSOR PROFESSOR INSTRUCTOR LECTURER
1998-99 48,695 40,830 35,265 31,240 26,2851999-00 49,280 41,830 35,830 32,380 27,4602000-01 51,500 43,820 37,540 31,570 28,5702001-02 51,050 45,140 38,430 33,500 29,4402002-03 52,070 44,010 39,460 34,670 29,3052003-04 54,670 46,200 41,440 35,890 31,0202004-05 57,130 48,290 42,180 36,970 N < 52005-06 59,560 50,050 44,555 38,540 none2006-07 62,235 51,945 46,780 40,465 none2007-08 62,835 54,340 48,020 41,780 N < 52008-09 65,400 54,930 47,360 43,770 N < 52009-10 65,400 54,930 47,360 43,770 N < 52010-11* 66,370 56,360 48,300 44,650 N < 52011-12 65,030 56,360 46,290 42,110 N < 52012-13 65,000 57,700 46,960 43,195 N < 52013-14 65,670 56,570 47,660 42,760 N < 5
* reflects October 2010 raise
KRW081613
19

Section III
Academic Data
20

NOTE: +# indicates degreed students pursuing licensure via MT3. * approved and intended/interested in
School Department Major Major Sub-totals Total by Department Total by College/School
College of Theology, Arts, and Sciences 705
Communication Arts 86 86
History, Philosophy, and Social Sciences 46History 22Integrated Social Studies 11Philosophy 5Political Science 8
Language and Literature 57Creative Writing 22English 14Integrated Language Arts 10+2Spanish 4Spanish Education 5
Liberal Arts/Individualized Major 3 3
Mathematics and Computer Science 53Computer Science 35Mathematics 17+1
Music 54Music 7Music Education 22Music Ministry 13Music Production 12
Natural Sciences 207Biology 46Biology - Clinical Lab Sci. 4Chemistry 18Exercise Science 79Integrated Science 4+1Life Science/Chemistry Education 1Zoo and Wildlife Biology 54
Psychology 54 54
Social Work 31 31
Theology 88Bible and Theology 43Educational Ministries 6Sports Outreach Ministries 1Youth Ministry 29Sports/Educational Ministries 1Youth/Educational Ministries 6Youth/Sports Ministries 2
Visual Arts 26Art 20Visual Arts Education 6
School of Business and Leadership 390
BusinessAccounting 33 195Business Administration 111Sport Management 51
Management Studies 195Management 195
School of Education and Human Development 190
Education 190Early Childhood Education 59+8Intervention Specialist 75+4Middle Childhood Education 34Physical Education (BS) 7+3
School of Nursing and Health Sciences 251Traditional Nursing (BSN) 201Degree-Completion Nursing (BSNDC) 31
Community and Public Health Promotion 16School Health Education 3
Undecided/Other 44 44
UNDERGRADUATE ENROLLMENT by MAJOR*Fall 2013
krw092513
21

1st 2nd
Beginning 2009, +# indicates degreed students pursuing licensure via MT3. major major
COLLEGE/SCHOOL /DEPARTMENT/MAJOR 2004 2005 2006 2007 2008 2009 2010 2011 2012 2013 2013College of Theology, Arts, and SciencesDepartment of Communication Arts 93 98 87 95 97 83 82 86 81 86 2Dept of History, Philosophy, & Social Sciences 57 63 55 50 60 56 59 51 63 46
History 13 26 18 13 14 12 12 15 22 22 4Integrated Social Studies 34 23 21 16 23 19+2 16+6 8+6 16+3 11 2Philosophy 2 4 4 2 5 4 5 3 5 5 4Political Science 8 10 12 19 18 19 20 19 17 8 4
Department of Language and Literature 50 54 45 52 67 68 68 56 57 57Creative Writing --- --- --- --- --- --- --- --- 9 22English 19 19 18 23 30 29 26 22 16 14 2Integrated Language Arts 24 27 19 22 24 23+3 21+5 16+1 16+3 10+2Spanish (BA) 3 3 3 1 5 6 7 6 5 4 2Spanish Education (BS) 4 5 5 6 8 7 8+1 10+1 8 5
Dept of Mathematics and Computer Science 51 40 43 52 40 46 40 49 51 53Computer Science 26 22 21 26 19 20 20 24 25 35 2Mathematics 25 18 22 26 21 24+2 19+1 24+1 23+3 17+1 3
Department of Music 57 60 57 60 62 82 79 74 65 54Music (BA) 8 7 5 9 7 7 12 3 8 7 3Music Education (BS) 12 15 13 19 28 33 26 31 22 22Music Ministry (BA) 3 9 7 8 6 12 11 10 14 13Music Production (BA) 34 29 32 24 21 30 30 30 21 12 1
Department of Natural Sciences 70 91 97 123 142 175 175 223 243 207Biology 39 43 31 48 46 59+1 35 43+1 53 46Chemistry 3 9 8 5 11 6 14 17 16 18 2Clinical Laboratory Science 4 3 3 0 0 3 5 2 6 4Exercise Science 17 25 26 30 46 56 73 91 93 79 2Integrated Science 4 4 3 2 1 2 3 4 4+1 4+1Life Science/Chemistry Education 1 1 4 1 3 4 2 4 0 1Life Science Education --- --- --- --- --- --- --- --- 1 0Physical Science Education 2 0 1 1 0 0+1 0 2 1 0Zoo and Wildlife Biology --- 6 21 36 35 43 43 59 68 54
Department of Psychology 47 49 49 61 61 67 60 62 58 54 3Department of Social Work 57 55 67 59 61 55 45 54 47 31 1Department of Theology 120 130 129 120 125 121 112 107 102 88
Bible and Theology 53 45 46 42 48 51 54 53 48 43 5Educational Ministries 5 4 8 8 8 7 4 4 6 6 1Sports Outreach Ministries 6 6 9 6 4 3 1 3 2 1 2Youth Ministry 31 50 44 40 41 33 29 29 29 29 8Sports/Educational Ministries 2 1 0 0 0 2 3 3 2 1Youth/Educational Ministries 11 12 6 7 10 15 12 10 8 6 1Youth/Sports Ministries 12 12 16 17 14 10 9 5 7 2
Department of Visual Arts 38 37 36 35 36 44 36 35 29 26Art (BA) 15 16 18 20 27 32 29 26 26 20 1Visual Arts Education (BS) 23 21 18 15 9 10+2 6+1 5+4 3 6
Liberal Arts or Individualized Major 22 25 31 26 14 11 9 10 7 3
School of Business and LeadershipDepartment of Business 173 174 192 189 215 237 218 205 209 194
Accounting 24 29 29 36 32 43 42 37 36 32 9Business Administration 119 113 123 115 142 142 125 123 119 111 24Sport Management 30 32 40 38 41 52 51 45 54 51 8
Department of Management Studies (MMP) 286 275 310 309 309 358 330 278 247 195
School of Education and Human Development 301 285 252 232 222 247 255 241 239 190Adult Fitness (BA) 8 13 12 14 5 2 --- --- --- ---Early Childhhood Education 166 105 91 75 75 97+4 89+1 87+1 84+9 59+8 53Intervention Specialist Education 36 80 74 76 70 64+12 77+19 70+12 66+11 75+4Middle Childhood Education 58 56 51 48 49 48+1 55+1 53+1 55 34Outdoor Leadership (BA) 4 5 2 2 0 3 --- --- --- ---Physical Education (BS) 29 26 22 17 23 16 13 17 13+1 7+3 1
School of Nursing and Health Sciences 264 313 333 385 367 367 356 312 293 251Traditional Nursing (BSN) 195 231 246 306 295 307 304 266 236 201Degree-Completion Nursing (BSNDC) 50 55 54 51 45 38 24 25 34 31CHE/Community & Public Hlth Promo (BA) 14 23 30 25 24 16 24 16 17 16School Health Education (BS) 5 4 3 3 3 4+2 3+1 4+1 5+1 3 1
Undecided/Other 233 171 116 144 102 131 160 80 61 44
krw091913
MAJOR FIELD ANALYSIS BY FALL ENROLLMENT: 10-YEAR HISTORY22

COLLEGE/SCHOOL /PROGRAM 2004 2005 2006 2007 2008 2009 2010 2011 2012 2013
College of Theology, Arts, and Sciences 36 43 42 37 33 34 37 36 26 13Theological Studies [M.A.T.S.] 33 34 37 36 26 13
Christian Leadership in Sports Ministry 1 1 0 0 0 --Christian Ministries 31 32 36 29 3 1Family and Youth Ministries 0 -- -- -- -- --Leadership in the Christian Church 1 1 1 -- -- --Theological Studies -- -- -- 7 23 12
School of Business and Leadership 52 54 44 71 124 133 134 169 153 158Business Administration [M.B.A.] 52 54 44 71 124 133 98 97 90 88Organizational Leadership [M.A.O.L.] -- -- -- -- -- -- 36 72 63 70
School of Education and Human Development 196 229 206 198 203 213 197 208 238 204Counseling and Human Development [M.A.Ed.] 80 105 105 106 128 142 147 150 131 115
Classroom Guidance 3 6 4 1 -- --Classroom-Based Counseling & Advocacy -- -- -- -- 1 1Clinical Counseling 59 80 91 94 82 83Community Counseling 16 6 -- -- -- --School Counseling 50 50 52 52 42 29 SC Licensure only 2Undetermined 0 0 0 3 6 0
Education [M.A.Ed.] 116 124 101 92 75 71 50 58 107 89Adolescent and Young Adult; Multi-age Lic 3Curriculum and Instruction 21 15 12 6 5 4Curriculum, Instr, and Professional Develop 4 9 1 6 24 22 Administrative Specialist License 3 3Educational Leadership -- -- -- 1 25 20 Principal License 10 12Graduate Licensure: Intervention Specialist 5Instructional Technology 3 -- -- -- -- --Intervention Specialist Education 37 32 25 19 20 11Reading 4 7 5 1 2 4 Endorsement 4Undetermined and/or Workshop only 6 8 7 25 18 1
School of Nursing and Health Sciences 30 38 44 44 49 50 60 62 59 65Nursing [M.S.N.] 30 38 44 44 49 50 60 62 59 65
Clinical Nurse Specialist 4 6 4 4 2 0Family Nurse Practitioner 45 36 44 48 56 65Undetermined 0 8 12 10 1 0
Notes:1) Detail by specific program area/major not available prior to 2008.2) Prior to 2010, the current M.A.T.S. degree was the M.A.C.M. degree (Master of Arts in Christian Ministries).
GRADUATE PROGRAMS ANALYSIS BY FALL ENROLLMENT: 10-YEAR HISTORY
KRW093013
23

FALL SPRING TOTAL YEAR08-09 09-10 10-11 11-12 12-13 08-09 09-10 10-11 11-12 12-13 08-09 09-10 10-11 11-12 12-13 5-yr %
THEOLOGY, ARTS, AND SCIENCESComm Arts 1603 1874 1867 1718 1614 1366 1640 1472 1410 1160 2969 3514 3339 3128 2774 -6.6%Hist, Phil, SS 2411 2447 2464 2275 2060 2172 2520 2269 2155 2165 4583 4967 4733 4430 4225 -7.8%Lang & Lit 2540 2817 2387 2103 2231 2392 2265 2144 1869 1881 4932 5082 4531 3972 4112 -16.6%Math & Cpsc 1082 1219 1220 1134 1270 992 1085 1125 1038 976 2074 2304 2345 2172 2246 8.3%Music 708 782 801.5 733.5 679 830.5 713 792.5 689 709.5 1538.5 1495 1594 1422.5 1388.5 -9.7%Nat Sciences 1900 2246 2403 2835 2487 1832 1997 2329 2295 2263 3732 4243 4732 5130 4750 27.3%Psychology 1343 1395 1174 1314 1059 1052 1169 1227 1014 1062 2395 2564 2401 2328 2121 -11.4%Social Work 342 337 315 389 350 514 378 413 446 395 856 715 728 835 745 -13.0%Theology 2957 2576 2507 2390 2488 2380 2845 2344 2442 2194 5337 5421 4851 4832 4682 -12.3%Visual Arts 631 641 690 541 440 834 760 779 670 565 1465 1401 1469 1211 1005 -31.4%TOTAL 29881.5 31706 30723 29460.5 28048.5 -6.1%
BUSINESS AND LEADERSHIPBusiness 1650 1731 1851 1808 1681 1626 1635 1763 1874 1740 3276 3366 3614 3682 3421 4.4%
EDUCATION AND HUMAN DEVELOPMENTEducation 1735 2152 2976 3056.5 3209.5 1878 2315 3050 2944.5 2914.5 3613 4467 6026 6001 6124 69.5%Health & HP* 1722.5 1577.5 NA NA NA 1364.5 1334 NA NA NA 3087 2911.5 NA NA NA NATOTAL 6700 7378.5 6026 6001 6124 -8.6%
NURSING AND HEALTH SCIENCESNursing 1999 1948 2077 1869 1774 2068 2013 2161 1897 1747 4067 3961 4238 3766 3521 -13.4%Health Sciences 459 489 579 435 513 407 894 1002 986 NATOTAL 5132 4768 4507 NA
GRADUATE**Business 782 808 647 567 518 772 824 580 513 501 1554 1632 1227 1080 1019 -34.4%Counseling 804 855 935 913 844 753 795 904 843 818 1557 1650 1839 1756 1662 6.7%Education 374 382 279 341 556 417 361 371 523 638 791 743 650 864 1194 50.9%Nursing 344 328 406 390 372 378 434 510 532 532 722 762 916 922 904 25.2%Organiz Leadership 304 563 459 406 404 425 710 967 884 NATheological Studies 246 273 279 297 224 187 168 192 174 97 433 441 471 471 321 -25.9%TOTAL 5057 5228 5813 6060 5984 18.3%
CCCU/BCA/ROM/TCCS 81 110 121 140 130 198 110 96 146 116 279 226 217 286 246 -11.8%Pittsburgh Sem. 15 0 0 0 0 0 0 0 0 0 15 0 0 0 0 NABliss Institute 0 0 7 0 12 0 0 0 0 0 0 0 7 0 12 NAGEN 100/101/150 476 562 466 492 429 26 30 28 34 24 502 592 494 526 453 -9.8%GEN 460 222 285 462 423 543 297 213 492 453 528 519 498 954 876 1071 106.4%Distance Learning 416 526 652 590 703 742 884 883 791 1014 1158 1410 1535 1381 1717 48.3%Dual Enrollment 180 57 NA NA NA 185 105 NA NA NA 365 162 NA NA NA NAHonor Sem/Theses 30 26 37 44 38 12 19 23 28 31 42 45 60 72 69 64.3%
Total= 51862 54573 54575 53113 51653 -0.4%* Beginning in 2010-11, HHP hours will be allocated to the departments of Trad. U.G. FTE= 3143 3295 3254 3099 3004 -4.4%Business, Education, and Natural Sciences; and to the School of Nursing and Health Sciences.** Graduate Workshop hours are not included. KRW051013
TOTAL STUDENT HOURS BY SCHOOL/Department: 5-YEAR TREND24

2010-11 2011-12 2012-13SSIII10 SSI11 SSII11 TOTAL SSIII11 SSI12 SSII12 TOTAL SSIII12 SSI13 SSII13 TOTAL 2-yr %
THEOLOGY, ARTS, AND SCIENCESComm Arts 0 21 0 21 0 19 0 19 0 15 0 15 -28.6%Hist, PH, SS 0 66 0 66 24 30 0 54 21 45 9 75 13.6%Lang & Lit 0 0 42 42 0 53 18 71 0 12 27 39 -7.1%Math & Cpsc 0 54 0 54 0 24 15 39 0 0 18 18 -66.7%Music 0 5 0 5 0 3 1 4 0 8 0 8 60.0%Nat Sci 1 276 59 336 0 232 44 276 0 161 36 197 -41.4%Psychology 0 12 0 12 0 6 0 6 3 54 0 57 375.0%Social Work 4 36 0 40 0 38 0 38 0 62 0 62 55.0%Theology 0 49 36 85 1 28 0 29 0 30 3 33 -61.2%Visual Arts 0 9 0 9 0 0 0 0 0 0 0 0 0.0%TOTAL 5 528 137 670 25 433 78 536 24 387 93 504 -24.8%
BUSINESS AND LEADERSHIPBusiness 0 9 0 9 0 3 3 6 0 9 33 42 366.7%
EDUCATION AND HUMAN DEVELOPMENTEducation 0 35 113 148 10.5 117 84 211.5 4 66 60 130 -12.2%Health & HP* 29.5 0 0 29.5 NA NA NA NA NA NA NA NA NATOTAL 29.5 35 113 177.5 10.5 117 84 211.5 4 66 60 130 -26.8%
NURSING AND HEALTH SCIENCESNursing (RN to BSN) 0 210.5 0 210.5 0 300 0 300 0 200 0 200 -5.0%Health Sciences* 0 6 0 6 0 0 0 0 0 8 3 11 83.3%TOTAL 0 216.5 0 216.5 0 300 0 300 0 208 3 211 -2.5%
GRADUATEBusiness 0 542 0 542 0 433 0 433 0 543 0 543 0.2%Counseling 0 570 0 570 0 500 0 500 0 468 0 468 -17.9%Education 0 157 76 233 0 222 317 539 114 994 0 1108 375.5%Ed - Workshops 250 80 507 837 155 0 472 627 251 159 185 595 -28.9%Leadership 0 338 0 338 0 265 0 265 0 80 0 80 -76.3%Nursing 0 500 0 500 0 515 0 515 0 516 0 516 3.2%Theological Studies 0 72 0 72 0 30 6 36 0 4 0 4 -94.4%TOTAL 250 2259 583 3092 155 1965 795 2915 365 2764 185 3314 7.2%
CCCU Programs 0 12 0 12 0 0 0 0 0 6 0 0 -100.0%AuSable 0 0 0 0 0 0 0 0 0 0 0 0 NADistance Lrng (GEN) 381 670 483 1534 458 607 567 1632 418 519 420 1357 -11.5%Gen Ed (GEN 225/460) 0 0 39 39 0 3 66 69 0 60 42 102 161.5%GRAND TOTAL 665.5 3729.5 1355.0 5750.0 648.5 3428.0 1593.0 5669.5 811.0 4019.0 836.0 5660.0 -1.6%
1) Graduate Education Workshop hours are reported separately from regular Graduate Education hours.2) The hours are reported on a fiscal year calendar; hence the inclusion of a Summer III session followed by Summer I and II of the next summer. krw0926133) Full-semester summer hours are counted together with SSI.* Beginning in Fall 2010, Health & HP hours allocated to the Departments of Business, Education, and Natural Sciences; and to the School of Nursing and Health Sciences.
SUMMER SCHOOL STUDENT HOURS BY SCHOOL/Department: 3-YEAR TREND
25

2008 2009 2010 2011 2012 2013ENROLLMENT IN SUMMER SESSIONS
First Five-week Session 292 311 313 241 233 174Second Five-week Session 210 212 178 157 155 118Third Four-week Session 144 106 85 89 84 73Full Fourteen-week Session 41 44 37 43
Total Enrollment 646 629 617 531 509 408
HOURS ENROLLED BY SESSIONFirst Five-week Session 1118.5 1255.0 1285.0 947.0 929.0 668.0Second Five-week Session 832.0 835.0 684.0 614.0 617.0 456.0Third Four-week Session 510.5 410.5 282.5 309.5 285.0 254.0Full Fourteen-week Session 172.0 148.0 124.0 184.0
Total Semester Hours 2461.0 2500.5 2423.5 2018.5 1955.0 1562.0
CLASSIFICATION OF SUMMER SCHOOL STUDENTS1) Fall and Spring enrollees returning for summer school
Freshmen 76 37 50 30 17 12Sophomores 139 94 74 73 54 46Juniors 138 104 123 109 85 98Seniors 220 186 158 150 162 129Special 23 47 18 16 18 11
Total 596 468 423 378 336 296
2) New admissions for summer school
Regular Admission 4 18 15 32 6 8Conditional Admission 0 0 0 0 0 0Academic Probation 0 0 0 0 0 0Special Admission 37 13 7 28 4 1Transient 0 18 9 7 13 6
Total 41 49 31 67 23 15
3) Readmitted students - Not enrolled Fall or Spring
Total 9 10 5 10 7 8
TOTAL STUDENTS ENROLLEDOne Session ONLY 372 341 373 344 312 282Two Sessions or more 179 186 189 187 183 147Three Sessions or more 44 28 37 50 37 47All Four Sessions (I, II, III, Summer Semester) 2 3 1 4 2 1Total Unduplicated Summer Headcount 551 527 562 532 495 429
2007-08 2008-09 2009-10 2010-11 2011-12 2012-13Traditional undergraduate 1849 1853 2040 1883 1841 1701Degree-completion undergraduate 486 522 495 480 469 401Total Undergraduate Students served 2335 2375 2535 2363 2310 2102
Total Graduate Students served 968 1150 1178 1076 1137 1012
TOTAL INDIVIDUALS SERVED 3303 3525 3713 3439 3447 3114
(Fall Semester through Summer III)COMPREHENSIVE SUMMARY OF ENROLLMENTS
UNDERGRADUATE SUMMER SCHOOL STATISTICS(Traditional Programs)
ske/krw093013
26

2003-04 2004-05 2005-06 2006-07 2007-08 2008-09 2009-10 2010-11 2011-12 2012-13
Total Hardcopy Volumes 165,933 169,655 173,231 175,830 178,992 177,505 179,033 177,289 167,816 171,402E-Books 55,327 75,739 81,514Govt. Document Hardcopy Volumes 72,897 72,299 72,889 72,107 72,260 70,024 69,031 39,698 38,906 39,299Total Audiovisual/Microform Items 664,887 686,992 698,109 695,720 712,712 706,763 712,058 697,122 660,020 667,744Total Items 903,717 928,946 944,229 943,657 963,964 954,292 960,122 969,436 942,481 959,959
Total Library Circulation 41,967 39,411 34,227 35,266 34,267 28,966 28,436 28,663 24,652 21,347Interlibrary Loans Borrowed Items 4,172 4,984 5,053 6,560 4,858 4,401 4,626 4,716 4,080 3,450 Loaned Items 6,243 6,353 10,291 5,627 6,560 6,176 5,382 7,141 4,576 5,303
Total Library Expenditures $857,692 $858,638 $875,326 $926,933 $947,556 $844,638 $782,715 $720,379 $700,511 $634,182Library Expenditures 3.900% 3.637% 3.491% 3.456% 3.295% 2.712% 2.470% 2.320% 2.205% 2.040% as % of Total Institutional E & GTotal Institutional E & G Exp. $21,994,216 $23,610,082 $25,074,482 $26,823,460 $28,757,223 $31,140,016 $31,691,300 $31,033,190 $31,773,211 $31,090,473
MALONE UNIVERSITY LIBRARY
HOLDINGS, EXPENDITURES, AND CIRCULATION
RLF/BJM100213
27

Section IV
Retention and Graduation
Data
28

LONGITUDINAL RETENTION AND GRADUATION RATES
RETENTION GRADUATION*FALL NEW FT ENROLLED ENROLLED ENROLLED GRADUATED GRADUATED GRADUATED GRADUATED
OF ENTRY FRESHMEN 2nd Fall 3rd Fall 4th Fall w/in 4 years w/in 5 years w/in 6 years in > 6 years1995 408 274 226 206 134 188 199 202
67.2% 55.4% 50.5% 32.8% 46.1% 48.8% 49.5%
1996 400 268 232 205 141 195 200 20967.0% 58.0% 51.3% 35.3% 48.8% 50.0% 52.3%
1997 464 345 304 284 208 268 275 28574.4% 65.5% 61.2% 44.8% 57.8% 59.3% 61.4%
1998 397 295 243 217 152 208 219 22474.3% 61.2% 54.7% 38.3% 52.4% 55.2% 56.4%
1999 405 286 254 237 159 224 230 23770.6% 62.7% 58.5% 39.3% 55.3% 56.8% 58.5%
2000 388 287 231 218 157 204 206 21374.0% 59.5% 56.2% 40.5% 52.6% 53.1% 54.9%
2001 355 250 220 212 144 192 200 20570.4% 62.0% 59.7% 40.6% 54.1% 56.3% 57.7%
2002 348 262 220 202 148 190 195 20075.3% 63.2% 58.0% 42.5% 54.6% 56.0% 57.5%
2003 389 293 254 236 173 233 237 23975.3% 65.3% 60.7% 44.5% 59.9% 60.9% 61.4%
2004 400 300 253 241 181 225 232 23575.0% 63.3% 60.3% 45.3% 56.3% 58.0% 58.8%
2005 357 263 225 220 165 203 209 21073.7% 63.0% 61.6% 46.2% 56.9% 58.5% 58.8%
2006 341 267 239 219 159 203 213 21778.3% 70.1% 64.2% 46.6% 59.5% 62.5% 63.6%
2007 387 290 259 240 177 224 22774.9% 66.9% 62.0% 45.7% 57.9% 58.7%
2008 389 273 223 207 147 19470.2% 57.3% 53.2% 37.8% 49.9%
2009 477 338 294 280 23070.9% 61.6% 58.7% 48.2%
2010 375 267 224 203 7**71.2% 59.7% 54.1% 1.9%
2011 359 227 19563.2% 54.3%
2012 352 24970.7%
2013 314
*Graduation - includes 2-year and 4-year degrees. Note - A.A. program was discontinued effective 1998-99.**Students who have completed baccalaureate degrees in 3 years or less
KRW091313
29

MAJORS DECEMBER 2012 MAY 2013 AUGUST 2013 TOTALAccounting 2 10 0 12Art 1 7 1 9Bible & Theology 6 14 1 21Biology 0 6 0 6Biology - Clinical Laboratory Science 0 0 0 0Business Administration 8 31 2 41Chemistry 0 3 0 3Communications Arts 6 14 3 23Community Health Education 0 7 3 10Computer Science 2 4 0 6Early Childhood Education 10 19 2 31Educational Ministries 0 1 0 1English 1 4 0 5Exercise Science 1 17 7 25Health Education 0 0 0 0History 2 9 2 13Individualized Major 0 3 0 3Integrated Language Arts 0 4 0 4Integrated Science 0 1 0 1Integrated Social Studies 1 0 0 1Intervention Specialist Education 6 11 1 18Liberal Arts 0 1 0 1Life Science/Chemistry Education 0 0 0 0Management (MMP) - Organizational 25 30 29 84Management (MMP) - Project 4 2 4 10Management (MMP) - Marketing 0 5 3 8Management (MMP) - Environmental 0 1 0 1Management (MMP) - Health Services 2 12 3 17Mathematics 1 7 0 8Middle Childhood Education 8 11 0 19Music 0 1 0 1Music Education 2 2 0 4Music Ministry 0 0 1 1Music Production 0 6 3 9Nursing - Degree-Completion Program BSN 11 9 3 23Nursing - Traditional Basic Program BSN 0 63 0 63Philosophy 0 4 0 4Physical Education 1 1 1 3Political Science 2 2 3 7Psychology 1 14 0 15Social Work 1 10 3 14Spanish 0 0 0 0Spanish Education 0 3 0 3Sport Management 2 8 1 11Sports Outreach Ministries 0 1 0 1Sports/Educational Ministries 0 0 0 0Visual Arts Education 0 1 0 1Youth Ministry 1 4 0 5Youth/Educational Ministries 0 5 1 6Youth/Sports Ministries 0 2 0 2Zoo and Wildlife Biology 3 12 1 16Total Majors Completed in 2012-13 110 382 78 570
NOTE: Double majors are counted in both major fields.
MAJOR FIELD ANALYSIS2012-13 Graduates per MajorUndergraduate Students Only
KRW092513
30

MAJOR FIELD ANALYSIS BY NUMBER OF GRADUATES: 10-YEAR HISTORY
COLLEGE/SCHOOL/DEPT/MAJOR 2004 2005 2006 2007 2008 2009 2010 2011 2012 2013College of Theology, Arts, and Sciences: Communication Arts
Communication Arts 34 22 22 21 20 23 24 23 25 23College of Theology, Arts, and Sciences: History, Philosophy, and Social Sciences
History 4 6 5 6 6 5 4 5 4 13Integrated Social Studies 11 10 7 3 4 1 1 3 2 1Philosophy --- --- --- --- --- --- 2 2 3 4Political Science 4 5 3 2 6 5 6 5 5 7
College of Theology, Arts, and Sciences: Language and LiteratureEnglish 4 6 6 4 8 10 6 13 9 5Integrated Language Arts 9 2 5 6 5 3 5 4 3 4Spanish 3 1 1 2 3 4 0 4 1 0Spanish Education 3 0 2 2 0 0 0 1 2 3
College of Theology, Arts, and Sciences: Mathematics and Computer ScienceComputer Science 5 4 3 5 10 6 5 2 4 6Mathematics 4 5 3 5 7 9 4 3 5 8
College of Theology, Arts, and Sciences: MusicMusic (BA) 1 2 1 2 0 0 0 0 0 1Music Education (BS) 4 5 2 0 2 0 5 4 8 4Music Ministry (BA) --- --- 1 0 1 0 1 1 1 1Music Production (BA) 7 3 2 4 7 1 4 7 5 9
College of Theology, Arts, and Sciences: Natural SciencesBiology 7 6 7 3 5 6 11 7 6 6Chemistry 3 1 1 3 1 1 0 0 1 3Clinical Laboratory Science 0 0 0 1 2 0 1 0 0 0Exercise Science 1 0 3 4 3 6 7 16 11 25Integrated Science 2 1 0 0 1 0 0 0 0 1Life Science/Chemistry Education --- --- --- --- --- --- --- --- 2 0Zoo and Wildlife Biology --- --- 1 1 2 1 6 2 5 16
College of Theology, Arts, and Sciences: PsychologyPsychology 15 10 8 8 14 13 17 13 13 15
College of Theology, Arts, and Sciences: Social WorkSocial Work 5 12 8 17 13 18 17 8 11 14
College of Theology, Arts, and Sciences: TheologyBible and Theology 16 8 15 13 9 14 15 11 6 21Diversified Ministries --- --- --- --- --- --- --- --- --- ---Educational Ministries 1 1 3 1 1 1 2 2 0 1Sports Outreach Ministries 1 0 0 2 0 1 0 1 1 1Sports/Educational Ministries --- 1 1 0 0 0 0 0 0 0Youth Ministry 6 5 8 7 8 13 5 8 7 5Youth/Educational Ministries 4 1 6 2 0 3 2 3 2 6Youth/Sports Ministries 0 0 2 3 7 3 5 3 0 2
College of Theology, Arts, and Sciences: Visual ArtsArt (BA) 2 1 5 6 4 4 7 9 4 9Visual Arts Education (BS) 2 6 3 2 4 1 1 0 1 1
Individualized Major --- --- 2 1 2 0 0 1 1 3Liberal Arts 18 10 13 12 12 6 5 2 3 1School of Business and Leadership: Business
Accounting 8 6 5 9 10 8 10 12 5 12Business Administration 38 31 36 24 36 36 34 36 37 41Sport Management 3 10 10 9 7 6 5 11 7 11
School of Business and Leadership: Management StudiesManagement (MMP) 186 182 175 176 165 144 144 158 126 120
School of Education: EducationAdult Fitness 1 2 3 3 5 3 1 --- --- ---Early Childhood Education (BS) 45 35 32 37 34 27 26 27 33 31Intervention Specialist 14 14 11 22 19 22 19 14 15 18Middle Childhood Education 10 13 8 8 14 9 10 8 5 19Outdoor Leadership (BA) 0 0 2 1 0 0 2 --- --- ---Physical Education (BS) 2 5 5 1 2 5 4 2 2 3
School of Nursing and Health SciencesDegree-Completion 23 28 38 31 29 22 25 16 12 23Traditional (inc. LPN to BSN) 21 25 37 34 61 64 49 56 56 63Community Health Educ (BA) 7 4 7 9 11 13 4 11 7 10Health Education (BS) 1 0 1 2 0 2 4 1 1 0
Number per year includes Dec., Apr/May, and Aug. grads: ex. - 2013 includes Dec. 2012, May 2013, and Aug. 2013.Graduates with double majors are counted in each discipline.
KRW092513
31

GRADUATES BY PROGRAM AREA 2004 2005 2006 2007 2008 2009 2010 2011 2012 2013
BusinessMBA 27 20 25 19 17 40 61 38 47 27MAOL - - - - - - - - 34 20
Counseling and Human DevelopmentClassroom Guidance - - - - - - 2 1 disc.* -Crsrm-Based Coun & Advocacy - - - - - - - 3 1 0Clinical Counseling - - - - - 3 17 11 26 25Community Counseling 8 5 8 18 6 11 3 disc.* - -School Counseling 8 13 15 15 11 19 15 12 12 16
EducationCurriculum and Instruction 6 4 22 26 6 5 3 3 4 4Curr, Instr and Professional Dev 2 2 1 4 1 3 4 0 2 2Educational Ldrshp/Princ Lic - - - - - - - - - 5Instructional Technology 2 3 2 6 2 2 disc.* - - -Intervention Specialist 10 14 7 14 9 14 16 6 6 6Reading 2 3 3 6 6 4 1 2 0 1
NursingClinical Nurse Specialist 5 10 1 0 6 2 2 2 3 disc.*Family Nurse Practitioner 7 5 13 19 14 13 20 19 23 21
Theological StudiesChristian Ldrshp in Sports Min - - - 1 0 1 1 1 0 1Christian Ministries 7 13 10 8 12 5 4 8 2 1Family & Youth Ministries 1 1 0 0 disc.* - - - - -Leadership in the Chr. Church 2 1 0 3 2 3 disc.* - 1 -Pastoral Counseling 2 0 1 disc.* - - - - - -Theological Studies - - - - - - - 2 6 12
Totals 89 94 108 139 92 125 149 108 167 141
Number per year includes December, Apr/May, and August grads: ex. - 2013 includes Dec 2012, May 2013, and Aug 2013.Graduates with double majors are counted in each discipline.
* disc. = Discontinued
PROGRAM AREA ANALYSIS BY # OF MASTER'S GRADUATES: 10-YR HISTORY
KRW092513
32

KRW081613
MALONE UNIVERSITY Class of 2012 (December 2011, April 2012, and August 2012 graduates) Traditional Undergraduate Alumni Status Report – Summary General Information 293 Bachelor’s degrees 75.8% 222 Responding to the survey Information Regarding Traditional Undergraduate Survey Respondents 15.8% 35 Full-time employed in career position 12.2% 27 Full-time employed in temporary job 28.0% 62 Total employed full-time 9.5% 21 Part-time employed in related field of study 15.3% 34 Part-time employed in unrelated field of study 3.6% 8 Enrolled FT in graduate school 1.4% 3 Enrolled PT in graduate school 1.8% 4 Enrolled in certificate/licensure program or other BA/BS 43.2% 96 Planning to pursue graduate school within 2-3 years 37.8% 84 Still seeking full-time employment 9.5% 21 Not seeking employment at this time 40.1% 89 Satisfactorily occupied * * Satisfactorily occupied includes those who are a) employed full-time in a career position (35), b) employed full-time in a temporary job (27), c) employed part-time in related field of study (21), d) enrolled FT in graduate program/and not already counted in a-c above (6). See following page for additional detail. Survey administered when students reported to pick up caps/gowns for Commencement.
33

For December 2011, April 2012, and August 2012 graduatesMajor Addt'l Grad Sch Grad Sch Grad Sch
or # of FT/ FT/ PT/ PT/ Not BA/BS/cert FT PT plansDouble Major (+) Grads Responses In Out In Out Seeking Seeking enrolled enrolled enrolled in 2-3 yrs
Acct + Bus Adm 5 4 1 1 2 2Art 4 1 1Bible & Theology 6 5 1 2 2 1 1 1Biology 6 5 1 1 1 1 1 5Business Admin 31 24 5 7 2 3 6 1 5Chemistry 1 1 1 1Communication Arts 25 19 3 4 2 8 2 7Comm'ty Health Ed 6 6 1 1 2 2 1 2Comm'ty Hlth Ed+Pysc 1 1 1 1Computer Science 4 4 2 1 1 1Early Childhood Ed 20 15 2 1 3 9 10Early Ch+Interv Spec 13 11 3 1 1 6 1 6English 7 5 2 1 2 2English + Philosophy 2 2 1 1 2Exercise Science 11 9 1 5 3 1 1 6History 4 3 1 1 1 1 2Individualized Major 1 1 1 1Integrated Lang Arts 3 2 1 1 2Integrated Soc St 2 2 1 1 2Intervention Spec. 1 0Liberal Arts 4 3 2 1* 2Life Science/Chem Educ 2 0Mathematics 5 5 1 1 1 2 1 3Middle Childhood Ed 4 1 1Middle Ch+Interv Spec 1 1 1 1Music Education 8 3 1 1 1 1 2Music Ministry 1 1 1Music Production 5 3 1 1 1Nursing 56 49 15 3 4 26 1 1 15Philosophy+Psychology 1 1 1 1Physical Education 1 1 1 1Phys Educ+Heatlh Educ 1 1 1Political Science 5 2 1 1 1Psychology 10 8 2 2 2 2 1 6Pyschology +Youth Min 1 1 1Social Work 11 8 1 5 2 2 5Spanish 1 0Spanish Education 2 0Sport Management 6 1 1Sport Mgmt+Bus Admin 1 1 1Visual Arts Education 1 1 1Youth Ministry 5 3 1 1 1 1Youth/Educational Min 2 2 1 1Youth+Sport Outreach Min 1 1 1Zoo & Wildlife Biology 5 5 2 1 2 2TOTAL 293 222 35 27 21 34 84 21 4 8 3 96Percentages 15.8 12.2 9.5 15.3 37.8 9.5 1.8 3.6 1.4 43.2
* involved in raising support for FT missionary service
Traditional Undergraduate Alumni Status Report - Class of 2012
KRW081613
34

KRW081913
MALONE UNIVERSITY Class of 2012 (December 2011, April 2012, and August 2012 graduates) Degree-Completion Alumni Status Report – Summary General Information 3 Environmental Management graduates 1 Environmental + Organizational Management graduate 19 Health Services Management graduates 1 Health Services + Project Management graduate 6 Marketing Management graduates 1 Marketing + Organizational Management graduate 85 Organizational Management graduates 2 Organizational + Project Management graduates 6 Project Management graduates 13 Nursing graduates 137 Total all degree-completion graduates 38.0% 52 Number responding to the survey Information Regarding Survey Respondents 69.2% 36 Full-time employed in field related to major 13.5% 7 Full-time employed in field outside of major 82.7% 43 Total employed full-time 1.9% 1 Part-time employed in field of major 9.6% 5 Part-time employed in field outside of major 9.6% 5 Planning to pursue another undergraduate degree or licensure 15.4% 8 Planning to pursue graduate or professional degree FT within one year 11.5% 6 Planning to pursue graduate or professional degree PT within one year 40.4% 21 Planning to pursue graduate or professional degree within 2-3 years Graduate Programs Alumni Status Report – Summary General Information 34 M.A.O.L. 10 M.A.T.S. (includes 2 Christian Ministries) 47 M.B.A. 38 M.A.Ed. - Counseling 12 M.A.Ed. - Education 26 M.S.N. 167 Total all Master’s graduates 50.3% 84 Number responding to the survey Information Regarding Survey Respondents 54.8% 46 Full-time employed in field related to major 23.8% 20 Full-time employed in field outside of major 78.6% 66 Total employed full-time 8.3% 7 Part-time employed in field of major See following page for additional detail.
35

Degree-Completion Alumni Status Report - Class of 2012
Major Another Grad Sch Grad Sch Grad Schor # Re- FT/ FT/ PT/ PT/ Not BA/BS FT PT w/in
Double Major (+) Grads sponding In Out in Out Seeking Seeking or Cert w/in 1 yr w/in 1 yr 2-3 yrsEnvironmental Management 3 3 2 1 1 1 1 2Environ Mgmt + Organiz Mgmt 1 1 1 1 1Health Services Management 19 6 4 1 2 2 1 1 3Health Serv Mgmt + Project Mgmt 1 0Marketing Management 6 2 2 1Marketing Mgmt + Organiz Mgmt 1 1 1 1Organizational Management 85 32 22 5 1 3 10 13 5 6 1 12Organiz Mgmt + Project Mgmt 2 0Project Management 6 0Nursing 13 7 6 1 5 1 2 3TOTAL 137 52 36 7 1 5 15 22 5 8 6 21Percentages 38.0 69.2 13.5 1.9 9.6 28.8 42.3 9.6 15.4 11.5 40.4
Majoror # Re- FT/ FT/ PT/ PT/ Not
Double Major (+) Grads sponding In Out in Out Seeking SeekingChristian Ministries 2 1 1 1Classroom Based Couns & Advocacy 1 1 1 1Clinical Counseling 26 15 4 2 5 11 4Clinical Nurse Specialist 3 1 1 1Curriculum & Instruction 4 4 4 2 2Curriculum, Instruction, and Prof. Dev. 2 1 1 1Family Nurse Practitioner 23 4 2 1 3 1Intervention Specialist 6 1 1 1MBA 47 23 18 4 9 14Organizational Leadership 34 22 13 9 9 13School Counseling 10 7 2 3 1 6 1School Coun + Clinical Coun 1 1 1 1Theological Studies 8 3 1 1 3TOTAL 167 84 46 20 7 48 36Percentages 50.3 54.8 23.8 8.3 57.1 42.9
Graduate Programs Alumni Status Report - Class of 2012
For December 2011, April 2012, and August 2012 graduates
For December 2011, April 2012, and August 2012 graduates Anticipated educational pursuits
KRW081413
36

Section V
Financial Data
37

TEN-YEAR HISTORY OF TUITION & FEES; ROOM & BOARD CHARGES
2004-05 2005-06 2006-07 2007-08 2008-09 2009-10 2010-11 2011-12 2012-13 2013-14
Per year for 24-36 credits 15630 16530 17520 18600 19740 20730 21954 22832 23860 24934Comprehensive Fee 250 260 270 270 280 350 490 588 676 744
Commuting Student Total 15,880 16,790 17,790 18,870 20,020 21,080 22,444 23,420 24,536 25,678
Room 3250 3250 3300 3400 3480 3620 3848 4222 4412 4412Board (Carte Blanche) 2870 3000 3100 3200 3350 3480 3700 3868 4042 4244Room and Board 6120 6250 6400 6600 6830 7100 7548 8090 8454 8656
Resident Student Total 22,000 23,040 24,190 25,470 26,850 28,180 29,992 31,510 32,990 34,334
TEN-YEAR HISTORY OF % INCREASES IN TUITION & FEES; ROOM & BOARD
2004-05 2005-06 2006-07 2007-08 2008-09 2009-10 2010-11 2011-12 2012-13 2013-14
Per year for 24-36 credits 6.00 5.76 5.99 6.16 6.13 5.02 5.90 4.00 4.50 4.50Comprehensive Fee 0.00 4.00 3.85 0.00 3.70 25.00 40.00 20.00 14.97 10.06
Commuting Student Total 5.90 5.73 5.96 6.07 6.09 5.29 6.47 4.35 4.77 4.65
Room 1.56 0.00 1.54 3.03 2.35 4.02 6.30 9.72 4.50 0.00Board (Carte Blanche) 2.50 4.53 3.33 3.23 4.69 3.88 6.32 4.54 4.50 5.00Room and Board 2.00 2.12 2.40 3.13 3.48 3.95 6.31 7.18 4.50 5.00
Resident Student Total 4.79 4.73 4.99 5.29 5.42 4.95 6.43 5.06 4.70 4.07
15880 1679017790
1887020020
2108022444 23420
24536 24934
6120 6250 6400 6600 6830 7100 7548 8090 8454 8656
2200023040
2419025470
2685028180
2999231510
3299034334
0
5000
10000
15000
20000
25000
30000
35000
40000
04-05 05-06 06-07 07-08 08-09 09-10 10-11 11-12 12-13 13-14
Do
llar
s
Academic Year
Ten-Year History of Tuition & Fees; Room & Board Charges
Tuition & Fees Room & Board Total
KRW092013
38

KRW092513
$24,702,775
$25,360,100
$26,211,880
$27,636,245
$29,538,135
$31,340,715
$33,387,800
$35,567,650
$38,808,300
$39,504,334
$41,610,847
$41,233,953
$39,173,144
$36,625,000
0 10,000,000 20,000,000 30,000,000 40,000,000 50,000,000
2000-01
2001-02
2002-03
2003-04
2004-05
2005-06
2006-07
2007-08
2008-09
2009-10
2010-11
2011-12
2012-13
*2013-14
Dollars
Fis
cal Y
ear
Total Budget for Fiscal Years 2000-01 to *2013-14*subject to approval by Board of Trustees
Budget = Gross Revenue Less Institutional Student Financial Aid
39

ESM090613
$512,428
$613,526
$559,644
$736,485
$661,910
$704,044
$751,691
$808,552
$906,034
$1,001,582
$1,005,434
$909,867
$937,003
$1,009,934
$1,011,686
$1,017,692
$880,688
$957,001
$900,916
$790,199
0 200,000 400,000 600,000 800,000 1,000,000 1,200,000
1993-94
1994-95
1995-96
1996-97
1997-98
1998-99
1999-00
2000-01
2001-02
2002-03
2003-04
2004-05
2005-06
2006-07
2007-08
2008-09
2009-10
2010-11
2011-12
2012-13
Dollars
Fis
ca
l Ye
ar
The Malone Fund Gift Income for Fiscal Years 1993-94 to 2012-13
Unrestricted Giving
40

Note: The 2003-04 amount includes $8,163,229 (81% of total) for the Endowment/Capital Campaign.
$10,038,375
$3,129,634$3,446,275
$5,258,258
$2,736,653
$1,657,897$2,084,607
$1,692,099 $1,956,295$2,000,022
0
1,000,000
2,000,000
3,000,000
4,000,000
5,000,000
6,000,000
7,000,000
8,000,000
9,000,000
10,000,000
11,000,000
2003-04 2004-05 2005-06 2006-07 2007-08 2008-09 2009-10 2010-11 2011-12 2012-13
Do
llar
s
Fiscal Year
Total Gift Income
Foundations11%
Individuals23%
Alumni30%
Other Organizations22%
Corporations6%
EFC-ER6%
Other2%
Gift Income by Source: 2012-13
KRW090613
41