Blends Created by Randy Stark Reno, Nevada 1999. By blends By families.
COORDINATING RESEARCH COUNCIL INC 3650 MANSELL ROADSUITE 140ALPHARETTA GA 30022
CRC Report No AVFL-24
FACE GASOLINES AND BLENDS WITH ETHANOL
DETAILED CHARACTERIZATION OF PHYSICAL AND CHEMICAL
PROPERTIES
July 2014
Disclaimer and Copyright
The Coordinating Research Council Inc (CRC) is a non-profit corporation supported by the petroleum and automotive equipment industries CRC operates through the committees made up of technical experts from industry and government who voluntarily participate The four main areas of research within CRC are air pollution (atmospheric and engineering studies) aviation fuels lubricants and equipment performance heavy-duty vehicle fuels lubricants and equipment performance (eg diesel trucks) and light-duty vehicle fuels lubricants and equipment performance (eg passenger cars) CRCrsquos function is to provide the mechanism for joint research conducted by the two industries that will help in determining the optimum combination of petroleum products and automotive equipment CRCrsquos work is limited to research that is mutually beneficial to the two industries involved and all information is available to the public
CRC makes no warranty expressed or implied on the application of information contained in this report In formulating and approving reports the appropriate committee of the Coordinating Research Council Inc has not investigated or considered patents which may apply to the subject matter Prospective users of the report are responsible for protecting themselves against liability for infringement of patents
CRC Report No AVFL‐24
FACE Gasolines and Blends with Ethanol
Detailed Characterization of Physical and Chemical Properties
William Cannelladagger Michael Fosterˆ Garry Gunterˇ William Leppardsect
daggerChevron
ˆBP
ˇPhillips 66
sectConsultant
i
TABLE OF CONTENTS
Page FIGURES Iii
TABLES v
ACRONYMS vii
ACKNOWLEDGMENTS ix
EXECUTIVE SUMMARY xi
1 INTRODUCTION 1
2 STATISTICAL DESIGN OF FACE GASOLINES MATRIX 3
3 ANALYSES OF FACE GASOLINES 7
31 ASTM Test Results for Physical Properties 7
311 RON MON and Octane Sensitivity 7
312 Distillation Characteristics 9
313 Reid Vapor Pressure (RVP) 10
314 API Gravity and Density 11
315 Net Heat of Combustion (NHC) 12
32 Chemical Properties of FACE Gasolines 13
321 Aromatics by Supercritical Fluid Chromatography (SFC) 13
322 Detailed Hydrocarbon Analyses 14
323 Elemental Analyses 19
4 ANALYSES OF FACE GASOLINES BLENDED WITH ETHANOL 21
41 ASTM Test Results 21
411 Ethanol Content 21
412 RON MON and Octane Sensitivity 22
413 Distillation Characteristics 24
414 Reid Vapor Pressure (RVP) 25
415 API Gravity and Density 25
416 Net Heat of Combustion (NHC) 26
ii
Page
5 SUMMARY AND CONCLUSIONS 27
6 REFERENCES 29
APPENDICES 31
A Properties of FACE Gasolines 31
B Properties of FACE Gasoline Blends with Ethanol 37
iii
FIGURES
Figure Page 11 FACE Gasolines Design Matrix 131 RON Values of FACE Gasolines 732 MON Values of FACE Gasolines 833 Octane Sensitivity Values of FACE Gasolines 934 ASTM D86 Distillation Curves for FACE Gasolines 1035 Reid Vapor Pressures of FACE Gasolines 1036 API Gravities of FACE Gasolines 1137 Densities of FACE Gasolines 1138 ASTM D240 Net Heats of Combustion of FACE Gasolines 1239 FACE Gasoline Compositions by Supercritical Fluid Chromatography (SFC) 13310 Detailed Hydrocarbon Analyses of Low Sensitivity FACE Gasolines 15311 Detailed Hydrocarbon Analyses of High Sensitivity FACE Gasolines 16312 Comparison of Detailed Hydrocarbon Analyses of FACE Gasolines 17313 Comparison of Composition Methods FACE Low Sensitivity Gasolines 18314 Comparison of Composition Methods FACE High Sensitivity Gasolines 18315 Carbon and Hydrogen Elemental Analyses of FACE Gasolines 19316 Sulfur Levels of FACE Gasolines 2041 RON Values of FACE Gasoline Blends with Ethanol 2242 MON Values of FACE Gasoline Blends with Ethanol 2243 Octane Sensitivities of FACE Gasoline Blends with Ethanol 2344 ASTM D86 Distillation Curves for FACE Gasoline Blends with Ethanol 2445 Reid Vapor Pressure of FACE Gasoline Blends with Ethanol 2546 Densities of FACE Gasoline Blends with Ethanol 2547 Net Heat of Combustion of FACE Gasoline Blends with Ethanol 26
iv
v
TABLES Table Page 21 Target and Measured Properties of Hand Blends of Optimized Fuel Blends 422 Target Fuel Parameters of Final Fuel Set 541 Measured Ethanol Content of FACE Gasoline Blends 21A1 Summary Data for FACE Gasolines 31B1 Summary Data for FACE Gasoline Blends with Ethanol 37
vi
vii
ACRONYMS
API American Petroleum Institute
ASTM International Formerly the American Society for Testing and Materials
AVFL Advanced Vehicle Fuel and Lubricants (CRC)
COA certificate of analysis
CPChem Chevron Phillips Chemical Co
CRC Coordinating Research Council
DHA detailed hydrocarbon analysis
FACE Fuels for Advanced Combustion Engines (CRC)
FBP final boiling point
FIA fluorescent indicator adsorption
FID flame ionization detector
GC gas chromatographychromatographic
IBP initial boiling point
MON Motor Octane Number
n‐ normal (as in normal paraffins)
PAH polycyclic aromatic hydrocarbon
PIONA paraffins isoparaffins olefins naphthenes and aromatics
RON Research Octane Number
RVP Reid Vapor Pressure
S gasoline sensitivity (=RON‐MON)
SFC supercritical fluid chromatography
vol volume
wt weight
viii
ix
ACKNOWLEDGMENTS
The work in this report was conducted and coordinated by a fuels characterization subgroup of CRCrsquos Fuels for Advanced Combustion Engines (FACE) Working Group of the Advanced Vehicle Fuel and Lubricants (AVFL) Committee Members of the working team included Bill Cannella Michael Foster Garry Gunter Bill Leppard John Orban and Ken Wright
Following the successful development of the CRC FACE Diesel Fuels Ken Wright and Bill Leppard initiated efforts to design a matrix of reference gasoline fuels which are denoted as the CRC FACE Gasolines Bill Leppard and John Orban used fuels blending models and statistical techniques to generate a matrix of candidate fuel formulations that were ultimately down-selected to 10 formulations Ken Wright Garry Gunter Michael Foster and Bill Cannella arranged for the fuelsrsquo properties and compositions to be characterized in their company laboratories In addition CRC provided funds for the fuels to be analyzed by a contract laboratory
x
xi
EXECUTIVE SUMMARY
This report provides detailed results from a variety of standard ASTM International‐type analyses
and advanced characterization techniques conducted to measure the chemical and physical
properties of a matrix of gasoline test fuels known as the Fuels for Advanced Combustion Engines
(FACE) Gasolines In addition results are reported from analyses conducted on blends of ethanol at
levels of 10 15 and 30 volume (vol) with four of the FACE gasolines
The work was coordinated by a subgroup of the Coordinating Research Councilrsquos (CRCrsquos) Advanced
Vehicle Fuel and Lubricants Committeersquos FACE Working Group It parallels and complements the
work done previously on the FACE Diesel Fuel matrix
The FACE Gasoline matrix consists of 10 fuels designed around 4 properties of primary importance
to the performance of advanced gasoline‐fueled engines Research Octane Number (RON) Octane
Sensitivity (S=RON‐MON) aromatics content and normal‐paraffin (n‐paraffin) content The RON
and S parameters are measures of a fuelrsquos autoignition quality while the aromatics and n‐paraffin
content are measures of a fuelrsquos composition The fuel target levels selected were RONs of 70 85
and 95 ldquolowrdquo and ldquohighrdquo octane sensitivities of le2 and ~ 10 respectively aromatics contents of 5
and 35 vol and n‐paraffin contents of 5 and 25 vol It was recognized that some of these
targets are conflicting (ie high aromatics content with low octane sensitivity) and that required
trade‐offs would result in some of the target parameters not being completely met for some fuels
A full‐factorial set of test gasolines with these target levels would consist of 24 fuels Statistical
techniques (described in this report) were used to reduce this to a tractable number of 10 fuels
while still maintaining a statistically sound matrix which is shown in the Figure below Although the
RON values of 70 and 85 and the octane sensitivity of 2 are lower and n‐paraffin content of 25 vol
are higher than currently found in market gasolines they appear to be potentially relevant for
emerging advanced low temperature combustion engines and so were included in this matrix of
research fuels The CRC FACE Working Group designed this matrix of research fuels A commercial
vendor (Chevron Phillips Chemical Co ndash CPChem) has produced and made the fuels available for
purchase in research quantities to engine and advanced combustion researchers to enable
consistent comparisons of results from different laboratories and test platforms based on the same
set of fuels
I
J
BF
5 aromatics () 35
70
RON
95
5
25
n-paraffins ()
F
AE
G
D
C H
85
X
X
Low Sensitivity RON-MONle2
High Sensitivity RON-MONasymp10
xii
In addition to designing the gasolines a key goal of the current project was to characterize as fully as
possible the chemical and physical properties of the FACE Gasolines and selected blends with
ethanol and to make that information available to the engine and advanced combustion research
and development (RampD) communities to enable selection of standardized test fuels for their
programs and correlation of test results to fuel composition and properties
In support of this project standard ASTM tests were conducted at several different laboratories to
measure the following properties Research Octane Number (RON) Motor Octane Number (MON)
API gravity density RVP distillation profile net heat of combustion elemental carbon hydrogen
and sulfur and fuel composition The fuel composition analytical methods consisted of fluorescent
indicator adsorption (FIA) supercritical fluid chromatography (SFC) and detailed hydrocarbon
analyses (DHA) by one‐dimensional gas chromatography with a flame ionization detector (1D GC‐
FID) Results of those analyses indicate the following
As expected conflicts in the target properties for some of the fuels (such as high aromatics level
coupled with low octane sensitivity) led to some trade‐offs that resulted in some deviation in
the actual properties from the design properties
The RON values come close to meeting the targets for most of the fuels Fuels E H and J have
values that are 24‐38 units higher than the targets
Three of the four ldquohighrdquo sensitivity fuels have measured values of 59‐71 that are lower than
the target value of 10 Two of the ldquolowrdquo sensitivity fuels have measured values (34‐37) that are
a bit higher than the target value of le2 One of the low sensitivity design fuels (ldquoDrdquo) has a value
of 72 that actually effectively makes it a high sensitivity fuel
Detailed hydrocarbon analyses (DHA) indicate that the n‐paraffins contents range from 225‐
316 vol for the four FACE Gasolines that had targets of 25 vol and from 44‐117 vol for
the six FACE Gasolines that had targets of 5 vol
DHAs indicate that the aromatics contents range from 317‐358 vol for the four FACE
Gasolines that had a target of 35 vol and 0‐109 vol for the other fuels that had a target of 5
vol
The high sensitivity fuels contained the high sensitivity components of naphthenes (105‐208
vol) and olefins (68‐127 vol) The exception was Gasoline ldquoDrdquo which had neither of these
components but whose high sensitivity was derived from aromatics components
Five of the FACE Gasolines (ldquoArdquo ldquoBrdquo ldquoCrdquo ldquoFrdquo and ldquoIrdquo) are very rich in isoparaffins with contents ge
676 vol
For the four FACE Gasolines blended with ethanol RON continues to increase as the ethanol
levels increase to 30 vol although the rate of increase lessens as ethanol increases FACE
Gasoline B which has the highest RON of 96 has the highest RON at all ethanol levels with a
value of about 106 at 30 vol ethanol At the same ethanol level FACE Gasolines A and C have
essentially the same RON values FACE Gasoline H starts with a higher RON value than those of
A or C but has a lower value at ethanol blend levels of 15 and 30 vol
xiii
MON increased as ethanol level increased for FACE Gasolines A C and H However although
the MON value was highest for the blends with FACE Gasoline B the MON values of those
blends were essentially constant
For all blends octane sensitivity increased as ethanol content increased with the highest values
of 12‐13 for 30 ethanol blends with FACE Gasolines B and H
The D86 distillation curve trends are similar for the four FACE Gasolines For a given gasoline all
blends start at the same point At around 10 vol distilled the curves for the ethanol blends
diverge from and are lower than the curves for the base gasolines At a certain point the
distillation curves for the blends rise quickly and re‐join the curve for the parent base fuel The
distillation curves for the 30 vol ethanol blends are generally flat as a function of increasing
vol distilled and only start to increase again at about 70‐80 vol distilled when most of the
ethanol has distilled from the liquid
The Reid Vapor Pressures (RVPs) peak at about 10‐15 vol ethanol
We recommend that engine and combustion researchers use these well‐characterized FACE
Gasolines in their test programs to enable comparison of results from different laboratories and test
platforms In addition we recommend that researchers characterize as fully as possible the chemical
and physical properties of other fuels that they test so that more robust correlations can be
developed between fuel properties and engine and combustion performance
xiv
1
1 INTRODUCTION
This report summarizes the efforts to design a matrix of gasoline test fuels known as the Coordinating
Research Councilrsquos (CRC ) Fuels for Advanced Combustion Engines (FACE) Gasolines and to extensively
characterize the physical and chemical properties of those fuels using standard ASTM International‐type
analyses and advanced characterization techniques It also provides information about the properties of
4 of the gasolines blended with 10 15 and 30 vol ethanol
The FACE Gasolines were designed based on statistical methods and target values established by the
CRC Advanced Vehicle Fuel and Lubricant (AVFL) Committeersquos FACE Working Group A key aspect of the
mission of the FACE Working Group is to design sets of test fuels well‐suited for research so that
researchers evaluating advanced combustion systems can compare results from different laboratories
using the same sets of fuels for consistency The current work on the FACE Gasolines follows on the
grouprsquos previous success with the FACE Diesel Fuels (1 2 3)
The FACE Working Group determined that 4 gasoline properties would be of primary importance to the
performance of advanced gasoline‐fueled engines Research Octane Number (RON) Octane Sensitivity
(S=RON‐MON) aromatics content and normal‐paraffin (n‐paraffin) content The RON and S parameters
are measures of the fuel autoignition quality while the aromatics and n‐paraffin content parameters are
measures of the fuel chemistry Since it was expected that some users would want to investigate some
fuels without ethanol the decision was made to exclude ethanol from the base fuel set The fuel target
levels selected were RONs of 70 85 and 95 ldquolowrdquo and ldquohighrdquo octane sensitivities of le2 and ~ 10
respectively aromatics contents of 5 and 35 vol and n‐paraffin contents of 5 and 25 vol A full‐
factorial set of test gasolines with these target levels would consist of 24 fuels Statistical techniques
(described in the next section) were used to reduce this to a tractable number of 10 fuels while still
maintaining a statistically sound matrix The FACE Gasolines design matrix is depicted in Figure 1
Figure 1 FACE Gasolines Design Matrix
2
Although the target RON values of 70 and 85 and the octane sensitivity of 2 are lower and n‐paraffin
content of 25 vol are higher than currently found in market gasolines they appear to be potentially
relevant for emerging advanced low temperature combustion engines and so were included in this
matrix of research fuels
A commercial fuels blender (Chevron Phillips Chemical Co ndash CPChem) agreed to work with the FACE
Working Group and provide blend formulation candidates for each of the target fuels and to
manufacture and make available for sale drum quantities of the final formulations The FACE Working
Group directed that the fuel blends should consist of refinery blending streams to the maximum
possible extent but would allow a maximum of five pure compounds to be added with a maximum
concentration of 10 vol Also the olefin content was limited to a maximum of 10 vol and for safety
reasons the Reid Vapor Pressure was set at a minimum of around 7 psi The suggested variations in the
concentrations of the aromatics and n‐paraffins were plusmn2 vol The suggested variations in the RON and
octane sensitivity were plusmn 2 octane numbers It was recognized that some of the target fuel properties
would lead to conflicts for some fuels (ie high aromatics content but low sensitivity for fuel ldquoDrdquo) and
that some trade‐offs would be required leading to some of the targets not being completely met
As soon as CPChemrsquos manufacturing of the commercial batches was completed a subgroup of the FACE
Working Group set about to characterize as fully as possible the chemical and physical properties of the
FACE Gasolines and to make that information available to the advanced combustion research and
development (RampD) community to enable selection of standardized test fuels for their programs and
correlation of test results to fuel composition and properties In support of that effort standard ASTM
tests were conducted at several different laboratories to measure the following properties Research
Octane Number (RON) Motor Octane Number (MON) API gravity density RVP distillation profile net
heat of combustion elemental carbon hydrogen and sulfur and fuel composition The fuel
composition methods consisted of fluorescent indicator adsorption (FIA) supercritical fluid
chromatography (SFC) and detailed hydrocarbon analyses (DHA) by one‐dimensional gas
chromatography with a flame ionization detector (1D GC‐FID) In general the lab‐to‐lab variation in
these tests was low less than 1 of the mean Because of this good agreement in the following charts
and text generally the average values are used without error bars In addition 5‐gallon sized blends of 4
of the FACE Gasolines (A B C and H) with 10 15 and 30 vol ethanol were prepared and also
characterized
This report is organized into the following sections
bull Section 2 provides details on the statistical techniques used to design the FACE Gasolines matrix
bull Section 3 contains the results of the analyses of the FACE Gasolines
bull Section 4 discusses the results of the analyses of the FACE Gasoline blends with ethanol
bull Section 5 presents a summary and conclusions
bull Section 6 lists the references cited
bull Appendix A provides tables of the properties of the FACE Gasolines
bull Appendix B provides tables of the properties of the FACE Gasolines blended with ethanol
3
2 STATISTICAL DESIGN OF FACE GASOLINES MATRIX
As mentioned in the Introduction the FACE Gasolines matrix was designed around the following four parameters RON octane sensitivity (S) aromatics content and n‐paraffins content The target levels selected were RON 70 85 and 95
Sensitivity le2 (ldquolowrdquo) and asymp10 (ldquohighrdquo) Aromatics 5 and 35 vol n‐paraffins 5 and 25 vol A full‐factorial set of test gasolines with these target levels consists of the twentyfour fuels listed in Table 21 Bill Leppard then used information about the refinery streams and components then available to CPChem the fuels blender and their proprietary non‐linear octane blending model to develop candidate fuel formulations Each blending recipe was optimized by manually adjusting the concentrations of the blending components (blending streams and pure components) In parallel John Orban used the same information about the refinery streams properties to systematically compute all possible candidate fuel formulations using a non‐proprietary linear octane blending model In both modeling efforts the optimum recipes were determined by considering the normalized deviation between the predicted and target properties of RON sensitivity aromatics vol and n‐paraffin vol Although the two modeling efforts were conducted independently there were many interactions during the process resulting in a single set of optimum recipes CPChem then used these optimum recipes to prepare and analyze hand blends for all twentyfour possible fuels These measurements are also listed in Table 1 The FACE Working Group realized that this number of fuels was unrealistic from a manufacturing cost and testing perspective and decided to limit the total number of fuels to ten One thing to note from the table is that four of the eight possible 70 RON fuels (designated by a ldquordquo in the table) were not blended because their model‐predicted properties were too far removed from the target properties The FACE Working Group decided to select two of the four 70 RON fuels for the final matrix of ten fuels These were fuels 1 and 10 Fuel 1 was selected because it contained the lowest amount of aromatics and nearly lowest amount of n‐paraffins Fuel 10 was selected because it contained the highest amounts of aromatics and n‐paraffins The remaining eight fuels were selected from among the sixteen 85 and 95 RON candidates using the D‐ and G‐optimality efficiencies which are two of the most common statistical techniques for evaluating experimental designs The D‐optimality technique generally produces designs that yield small standard errors for the parameter estimates small correlations between the parameter estimates and small standard errors for predicted responses within the design space The G‐optimality technique usually produces similar results The use of these statistical techniques to identify the optimum set of fuels requires defining the correlation model relating a measured engine response to the selected fuel parameters Three linear models were selected which included the following parameters Model 1 ndash Response=f(RON aromatics n‐paraffins and all 1st order interactions of these three parameters) Model 2 ndash Response=f(RON sensitivity aromatics n‐paraffins and all 2‐factor interactions involving RON) and Model 3 ndash Response=f(RON sensitivity aromatics n‐paraffins and all 2‐factor interactions not involving sensitivity) For all three models the D‐ and G‐optimality efficiencies were calculated for all possible sets of eight fuels and the resulting efficiencies were rank ordered The rank orderings of the fuel sets
4
between the D‐ and G‐optimality efficiencies were virtually identical There were however slight differences in the rank orderings among the three correlation models These results were discussed with the FACE Working Group which decided to select the optimum fuel set associated with Model 2 The target properties for this fuel set are listed in Table 22 along with the final fuel designations Once the FACE Working Group decided on the final fuel properties CPChem initiated efforts to make large batches of the fuels one at a time as time and equipment availability permitted At the start of production of each of the fuels small hand blends were first made since the compositions of some of the available refinery blendstocks had changed since the original handblends were made during the modeling efforts For some fuels this required several iterations to come close to meeting the target properties Analyses of the physical and chemical properties of the final commercial blends are presented in the next section
Table 21
Target and Measured Properties of Hand Blends of Optimized Fuel Blends
Fuel
Target Property Measured Property
Arom Vol
n‐Par Vol
RON Sens Arom Vol
n‐Par Vol
RON Sens
1 5 5 70 2 16 99 727 09
4 35 5 70 2
7 5 25 70 2 42 208 660 03
10 35 25 70 2 266 231 764 42
13 5 5 70 10 15 123 789 12
16 35 5 70 10
19 5 25 70 10
22 35 25 70 10
2 5 5 85 2 13 66 861 07
5 35 5 85 2 264 93 935 73
8 5 25 85 2 31 244 835 13
11 35 25 85 2 262 280 846 55
14 5 5 85 10 88 74 886 66
17 35 5 85 10 311 131 863 60
20 5 25 85 10 112 194 856 32
23 35 25 85 10 337 210 863 75
3 5 5 95 2 46 81 953 35
6 35 5 95 2 262 65 987 86
9 5 25 95 2 125 172 915 39
12 35 25 95 2 271 197 940 70
15 5 5 95 10 87 41 948 86
18 35 5 95 10 313 37 971 103
21 5 25 95 10 88 143 924 65
24 35 25 95 10 325 205 915 77
‐ Not blended because model‐predicted properties differed too significantly from target properties
5
Table 22
Target Fuel Parameters for Final Fuel Set
Final FACE Gasoline Designation
Initial Fuel Number
Aromatics Vol
n‐Paraffins
Vol
RON
Sensitivity
A 2 5 5 85 Low (le2)
B 3 5 5 95 Low (le2)
C 8 5 25 85 Low (le2)
D 12 35 25 95 Low (le2)
E 14 5 5 85 High (asymp10)
F 15 5 5 95 High (asymp10)
G 18 35 5 95 High (asymp10)
H 23 35 25 85 High (asymp10)
I 1 5 5 70 Low (le2)
J 10 35 25 70 Low (le2)
6
7
3 ANALYTICAL RESULTS FOR FACE GASOLINES
In this section results of the analyses of the physical and chemical properties of the first commercial
batches of each of the FACE Gasolines are discussed Chevron Phillips 66 BP and a contract laboratory
conducted the analyses Also included are the data provided on the CPChem Certificates of Analyses
(COAs) Note that future production runs that would be required to remake fuels that sell out likely will
result in some changes to the fuel property values reported here for the first production run
31 ASTM TEST RESULTS FOR PHYSICAL PROPERTIES
ASTM methods were used to measure the RON MON API gravity density distillation profiles RVP and
net heats of combustion of all of the FACE Gasolines The results of these analyses are summarized in
the sections below and also listed in detail in Table A1 located in Appendix A
311 RON MON and Octane Sensitivity
The ignition qualities of gasolines are typically characterized by RON and MON values RON values were
measured in CFR engines per ASTM method D2699 (4) Although the measurements were conducted in
several labs the lab‐to‐lab reproducibility was very good so only the average values are reported here
(but individual values are reported in Table A1) Bar charts of the average RON values for each fuel are
presented in Figure 31 (middle bars) Also included are the original design targets (1st bars) and the
values reported on the CPChem Certificates of Analysis (COA) (3rd bars) For most fuels the 3 values are
very close to each other (within plusmn1 unit of each other) The largest differences between measured and
target values are for fuels E H and J where the measured values are about 24‐38 units higher Fuel J is
also noteworthy because the value measured (1 lab only) is 2 units higher than the CPChem COA
Figure 31 RON Values of FACE Gasolines
850
950
850
950
850
950 950
850
700 700
839
958
843
942
874
940
965
869
700
738
835
960
847
932
875
944
968
869
703718
600
650
700
750
800
850
900
950
1000
A B C D E F G H I J
RON
Fuel
RON
Target
AVG
CPChem
8
MON values were measured in CFR engines per ASTM method D2700 (5) Although the measurements
were conducted in several labs the lab‐to‐lab reproducibility was very good so only the average values
are reported here (but individual values are reported in Table A1) Bar charts of the target measured
and CPChem COA MON values for each fuel are presented in Figure 32 The ldquotargetrdquo MON values were
determined by subtracting the target octane sensitivities from the target RON values The largest
difference between the values in this project and those reported on CPChemrsquos COA is 13 for fuel J The
largest differences between the measured and target values are for fuels D E F and H For Gasolines E
F and H the measured values are about 3‐6 units higher than target while for gasoline D the measured
values are about 6 units lower than the target
Figure 32 MON Values of FACE Gasolines
830
930
830
930
750
850 850
750
680 680
835
924
830
870
811
881
858
796
695 701
836
926
836
878
815
888
858
793
696
688
600
650
700
750
800
850
900
950
1000
A B C D E F G H I J
MON
Fuel
MON
Target
AVG
CPChem
9
Octane Sensitivity (S=RON‐MON) values are presented in the bar charts in Figure 33 The average sensitivities measured by the labs in this project are very close to those reported in CPChemrsquos COAs with the exception of Gasoline D The measured values for the three of the four high sensitivity fuels are quite a bit lower than the target value of 10 in the range of 59‐71 The exception is Gasoline G which comes close to meeting the target value Of the six low sensitivity fuels three (Gasolines A C and I) have values that meet the target value of le2 two have values that are slightly higher (Gasolines B and J) and one (Gasoline D) has a value that is significantly higher and in the range of the high sensitivity gasolines This discrepancy with Gasoline D is not surprising since it is very difficult to produce a low sensitivity fuel with a high level of aromatics which typically have high sensitivities Thus relative to the other manufactured FACE Gasolines Gasoline D should be considered a ldquohighrdquo sensitivity fuel
Figure 33 Octane Sensitivity Values of FACE Gasolines
312 Distillation Characteristics
The distillation properties of the fuels were determined by ASTM D86 (6) The D86 values obtained in
this study were very close to those reported on CPChemrsquos COAs The average of those two sources are
plotted in Figure 34 The values are also tabulated in Table A1 The temperature corresponding to a
given recovery fraction X is designated as TX (ie T90 indicates the temperature at which 90 of the
fuel has been vaporized and recovered) The initial boiling points (IBP) of all of the fuels are in a
relatively narrow range of 90‐110˚F In contrast the end boiling points (EBP) range from 253‐410˚F
Gasolines E G and H which are three of the four high sensitivity fuels have the highest EBPs Gasoline
E has a relatively steep increase in temperature of 140˚F from T90‐EBP Gasolines I and A the two fuels
having low sensitivity aromatics and n‐paraffin and low‐mid RON have the lowest EBPs Gasoline I
also has a relatively flat distillation profile from T30‐T90
100 100 100 100
04
34
13
72
63
59
107
71
05
3734
11
54
60
56
110
76
07
30
00
10
20
30
40
50
60
70
80
90
100
110
A B C D E F G H I J
Octan
e Sensitivity
Fuel
Octane Sensitivity
Target
AVG
CPChem
le2le2 le2 le2 le2 le2
‐01
10
Figure 34 ASTM D86 Distillation Curves for the FACE Gasolines
313 Reid Vapor Pressure (RVP)
The RVPs were determined using ASTM method D5191 (7) The values measured in this project were in
excellent agreement with those reported by CPChem COAs (within 01 psi) The averages of both values
are depicted in the bar charts in Figure 35 The values range from 67 to 805 psi
Figure 35 Reid Vapor Pressures of FACE Gasolines
500
1000
1500
2000
2500
3000
3500
4000
4500
0 10 20 30 40 50 60 70 80 90 100
Tempe
rature (˚ F)
Volume Distilled
D86 Distillation ‐ FACE Gasolines
A
B
C
D
E
F
G
H
I
J
805
735 745
680 670
780
725
755 760 750
0
1
2
3
4
5
6
7
8
9
A B C D E F G H I J
Reid Vap
or Pressure (p
si)
FACE Gasoline
Reid Vapor Pressure (RVP) ‐ FACE Gasolines
11
314 API Gravity and Density
The API gravities and densities of the fuels were measured using ASTM method D4052 (8) The
agreement between the values measured in this project and the values reported in the CPChem COAs
The individual values are listed in the Summary Table A1 in Appendix A The average of both values are
plotted in the bar charts in Figures 36 and 37 for API Gravity and density respectively As expected the
FACE Gasolines (D G H and J) having the highest aromatics content have the lowest API Gravities and
highest densities
Figure 36 API Gravities of FACE Gasolines
Figure 37 Densities of FACE Gasolines
7495
7135
7330
5870
6360
6860
54555580
7440
5910
0
5
10
15
20
25
30
35
40
45
50
55
60
65
70
75
80
A B C D E F G H I J
API G
ravity
FACE Gasoline
API Gravity ‐ FACE Gasolines
0685
0697
0691
0743
0725
0707
0760
0755
0697
0742
0645
065
0655
066
0665
067
0675
068
0685
069
0695
07
0705
071
0715
072
0725
073
0735
074
0745
075
0755
076
0765
077
A B C D E F G H I J
Density
(gml)
FACE Gasoline
Density ‐ FACE Gasolines
12
315 Net Heat of Combustion (NHC)
Net Heats of Combustion were measured using ASTM method D240 (9) The values are depicted in the
bar charts in Figure 38 In addition for two of the FACE Gasolines (C and J) the values were also
measured using ASTM method D4809 (10) The D4809 values were very close to those obtained from
method D240 (within 100 BTUlb) TheD240 values range from 18602 to 19251 BTUlb As expected
the FACE Gasolines having the highest aromatics content (D G H and J) have the lowest net heat of
combustion The FACE Gasolines having saturates content gt90 (A B C and I) have the highest net
heat of combustion
Figure 38 ASTM D240 Net Heats of Combustion of FACE Gasolines
19251
19187
19257
18649
18884
19072
1860218625
19225
18731
18200
18400
18600
18800
19000
19200
19400
A B C D E F G H I J
Net Heat o
f Com
bustion (BTU
lb) (A
STM D240)
FACE Gasoline
Net Heat of Combustion ‐ FACE Gasolines
13
32 CHEMICAL PROPERTIES OF FACE GASOLINES
The various types of hydrocarbons in the fuels were characterized by several techniques including
supercritical fluid chromatography (SFC) and detailed hydrocarbon analysis (DHA) by gas
chromatography using a flame ionization detector (GC‐FID) In addition the carbon hydrogen and
sulfur contents were measured Results are reported in the following sections
321 Aromatics by Supercritical Fluid Chromatography (SFC)
The SFC method of ASTM D5186 (11) separates the hydrocarbons into three fractions monoaromatics
polyaromatics and non‐aromatics and characterizes the composition in terms of mass Bar graphs of
the results are presented in Figure 39 Samples of FACE Gasolines B D E G and H were analyzed by
two labs The results from the two labs were very close to each other and so the averages are depicted
in the figure FACE Gasolines A B C and I have nonromatics levels gt90 wt FACE Gasolines D G and
H have the highest amounts of monoaromatics with values ranging from 394‐420 wt FACE
Gasolines E G and H appear to have about 1 wt polyaromatics
Figure 39 Compositions of FACE Gasolines by Supercritical Fluid Chromatography (ASTM D5186)
070 790 600
4175
14001000
39404200
040
3870
015
100
110125
030
9930
9210 9400
5810
85009000
59505675
9960
6100
0
10
20
30
40
50
60
70
80
90
100
A B C D E F G H I J
Composition (Wt )
FACE GASOLINE
SFC Composition ‐ FACE Gasolines
MonoAromatics PolyAromatics NonAromatics
14
322 Hydrocarbons by Detailed Hydrocarbon Analysis (DHA)
Detailed Hydrocarbon Analyses were performed by two labs using gas chromatography with flame
ionization detectors (GC‐FID) This technique enables the determination of concentration on a species‐
by‐species basis provided that retention factors have been determined for each species in the fuel The
results from both labs were very close to each other Bubble charts of the average concentration values
(in volume ) are depicted in Figure 310 for the low sensitivity fuels and Figure 311 for the high
sensitivity fuels on a carbon number basis for the five hydrocarbon classes n‐paraffins iso‐paraffins
naphthenes aromatics and olefins
In general the low sensitivity FACE Gasolines are characterized by large amounts of low sensitivity
components such as n‐paraffins and iso‐paraffins The high sensitivity FACE Gasolines contain more high
sensitivity components such as olefins and naphthenes than the low sensitivity fuels
The total concentration of components within each of the five hydrocarbon classes were added and the
sums are reported in the bar charts in Figure 312 The n‐paraffin levels range from 225‐316 vol for
the four FACE Gasolines (C D H and J) that had targets of 25 vol For the other FACE Gasolines that
had a target level of 5 vol the n‐paraffins levels range from 44‐117 vol The aromatics levels range
from 317‐358 vol for the four FACE Gasolines (D G H and J) that had targets of 35 vol For the
other six FACE Gasolines that had a target level of 5 vol the aromatics levels range from 0‐109 vol
The C7 aromatic is toluene the C8 aromatics consist of a mix of ethylbenzene and the xylene isomers
the C9 aromatics consist of a mix of trimethylbenzenes and methylethylbenzenes and the C10 aromatics
consist of a mix of tetramethylbenzenes dimethylethylbenzenes and methylpropylbenzenes FACE
Gasoline E a high sensitivity fuel has a naphthene content of 208 vol mainly cyclopentane and
cyclohexane Three other high sensitivity fuels (F G and H) have naphthenes concentrations of about
11 vol mainly cyclopentane Those high sensitivity fuels also have the highest olefins content with
concentrations ranging from 68‐127 vol FACE Gasoline I also has 64 vol olefins The C6 olefin is
1‐hexene The C5 olefins consist of a mix of 2‐pentene and methyl butenes In contrast to the high
sensitivity fuels Gasoline D which was designed to be low sensitivity but ended up in the high
sensitivity range has essentially no naphthenes or olefins Its high sensitivity is derived from its high
aromatics content
The C5 isoparaffin in all of the fuels is 2‐methylbutane The C6 isoparaffins consist of a mix of 2‐ and 3‐
methyl pentanes and 23 dimethyl butane The C7 isoparaffins in most of the FACE Gasolines consist of a
mix of 2‐ and 3‐methyl hexanes and 23‐ and 24‐dimethylpentanes The C8 isoparaffins are
predominantly trimethylpentanes with more than 50 of those being isooctane (224
trimethylpentane) The other isomers are mainly 24‐ and 25 dimethylhexanes and 2‐methyl 3‐ethyl
pentane
15
Figure 310 Detailed Hydrocarbon Analyses of Low Sensitivity FACE Gasolines
122 44 219 451 11
48 65
065
3 4 5 6 7 8 9 10 11
Carbon Number
FACE Gasoline A ‐ Detailed Hydrocarbon Analysis (vol)
isoparaffins
n‐paraffins
cycloparaffins
aromatics
olefins
104 13 137 587 16
59
39 37
3 4 5 6 7 8 9 10 11
Carbon Number
FACE Gasoline B ‐ Detailed Hydrocarbon Analysis (vol)
isoparaffins
cycloparaffins
aromatics
olefins
n‐paraffins
64 27 117 468 20 075
30 06
31 118 100
3 4 5 6 7 8 9 10 11
Carbon Number
FACE Gasoline C ‐ Detailed Hydrocarbon Analysis (vol)
isoparaffins
cycloparaffins
aromatics
olefins
n‐paraffins
12 410
99 35 150 46
47 114 70
3 4 5 6 7 8 9 10 11
Carbon Number
FACE Gasoline D ‐ Detailed Hydrocarbon Analysis (vol)
isoparaffins
cycloparaffins
aromatics
olefins
n‐paraffins
41 34 99 321 236 11
07 135
24
11
59
3 4 5 6 7 8 9 10 11
Carbon Number
FACE Gasoline I ‐ Detailed Hydrocarbon Analysis (vol)
isoparaffins
n‐paraffins
cycloparaffins
aromatics
olefins
327
90 124 95
22
14 131 145 29
06
3 4 5 6 7 8 9 10 11
Carbon Number
FACE Gasoline J ‐ Detailed Hydrocarbon Analysis (vol)
isoparaffins
n‐paraffins
cycloparaffins
aromatics
olefins
16
Figure 311 Detailed Hydrocarbon Analyses of High Sensitivity FACE Gasolines
64 68 143 165 18 07
70 105 19 10 04
46 17 18 16 08
21 82 09
29 06 37
3 4 5 6 7 8 9 10 11
Carbon Number
FACE Gasoline E ‐ Detailed Hydrocarbon Analysis (vol)
isoparaffins
cycloparaffins
aromatics
olefins
n‐paraffins
82 64 134 378 14
21 21
100
76
89
3 4 5 6 7 8 9 10 11
Carbon Number
FACE Gasoline F ‐ Detailed Hydrocarbon Analysis (vol)
isoparaffins
n‐paraffins
cycloparaffins
aromatics
olefins
65 66 72 152 16 10
74 09 16 10
15 33 218 54 14
36 25 10
37 07 10
3 4 5 6 7 8 9 10 11
Carbon Number
FACE Gasoline G ‐ Detailed Hydrocarbon Analysis (vol)
isoparaffins
cycloparaffins
aromatics
olefins
n‐paraffins
28 54 71 39 22 09
66 08 17 10
10 95 117 83 43 14
29 21 09
54 05 145 08
3 4 5 6 7 8 9 10 11
Carbon Number
FACE Gasoline H ‐ Detailed Hydrocarbon Analysis (vol)
isoparaffins
cycloparaffins
aromatics
olefins
n‐paraffins
17
Figure 312 Detailed Hydrocarbon Analyses Comparisons of FACE Gasolines
A comparison of the composition results from the DHA and SFC methods is presented in Figure 313 for
the low sensitivity fuels and Figure 314 for the high sensitivity fuels Also included are Fluorescent
Indicator Absorption (FIA ndash ASTM D1319 (12)) composition results reported on the CPChem COAs Since
the FIA method determines total saturates the DHA results for n‐paraffins iso‐paraffins and
naphthenes must be added together to enable the comparison between those two methods Similarly
since the SFC method directly measures aromatics and total non‐aromatics are determined by
difference the olefins amount must be added to the total saturate levels from FIA and DHA to enable
comparisons with the non‐aromatics values from SFC The appropriate comparison categories are
indicated by dashed lines in Figures 313 and 314 Of the three methods SFC generally gives the
highest level of aromatics and FIA the lowest The DHA aromatics values are closer to the FIA levels than
to the SFC levels The DHA olefins are fairly close to the FIA results
117
80
244 241
7944 67
225144
316
860
859
697
421
459
676
384
228
745336
16
01
01208
110
115105
33
23
13
127
94
8168
64
06
58 39
334
10977
336 358
12
317
0
10
20
30
40
50
60
70
80
90
100
A B C D E F G H I J
Composition ( vol)
FACE GASOLINE
DHA Composition ‐ FACE Gasolines
n‐paraffins isoparaffins naphthenes olefins aromatics
18
Figure 313 Comparison of Composition Methods FACE Low Sensitivity Gasolines
Figure 314 Comparison of Composition Methods FACE High Sensitivity Gasolines
117
80
244
144
316
860 859
697
745336
16
01 0433
23
13 64
06
58 3912
317
996951 975
929
712
04
07 04 62
10
42 21 09
278
993
921 940996
610
07
79 6004
390
0
10
20
30
40
50
60
70
80
90
100
DHA FIA SFC DHA FIA SFC DHA FIA SFC DHA FIA SFC DHA FIA SFC
Composition ( )
FACE GASOLINE
Composition ‐ Low Sensitivity FACE Gasolines
n‐paraffins isoparaffins naphthenes olefins aromatics saturates nonaromatics
A B C I J
241
7944 67
225
421
459
676
384
228
01
208
110
115 105
127
94
81 68
334
10977
336 358
701
780
856
587 568
04
99
86
7879
295
12158
335 353
581
850900
595568
419
150100
405432
0
10
20
30
40
50
60
70
80
90
100
DHA FIA SFC DHA FIA SFC DHA FIA SFC DHA FIA SFC DHA FIA SFC
Composition ( )
FACE GASOLINE
Composition ‐ High Sensitivity FACE Gasolines
n‐paraffins isoparaffins naphthenes olefins aromatics saturates nonaromatics
D E F G H
19
323 Elemental Analyses
Carbon and hydrogen contents were measured by two labs using ASTM method D5291 (13) The
average results are presented in the bar graphs in figure 315 The carbon contents range from 8399‐
8748 wt and the hydrogen contents range from1252‐1601 wt As expected the FACE Gasolines
having the highest aromatics content (D G H and J) have the highest carbon and lowest hydrogen
contents
Figure 315 Carbon and Hydrogen Elemental Analyses of FACE Gasolines
8399 8443 8453 8646 8547 8496 8670 87488414 8624
1601 1557 1547 1354 1453 1504 1330 12521586 1376
0
10
20
30
40
50
60
70
80
90
100
A B C D E F G H I J
Compo
sition
(wt)
FACE Gasoline
Carbon‐Hydrogen Elemental Analyses
Hydrogen
Carbon
20
Sulfur content was measured by one lab ASTM method D5453 (14) The results displayed in the bar
charts in Figure 316 are essentially identical to the values reported on the CPChem COAs All FACE
Gasolines had ultra‐low sulfur levels FACE Gasolines E G and H had the highest levels at 21 22 and 15
ppm sulfur The other fuels had levels ranging from 2‐6 ppm
Figure 316 Sulfur Levels of FACE Gasolines
6
4 4
2
21
2
22
15
2 2
0
5
10
15
20
25
A B C D E F G H I J
Sulfur Content (p
pm)
FACE Gasoline
Sulfur Content ‐ FACE Gasolines
21
4 ANALYTICAL RESULTS FOR FACE GASOLINES BLENDED WITH ETHANOL
Although the FACE Gasolines were not formulated with ethanol the expectation is that some potential
users will be interested in testing the fuels with ethanol added To assist selection of fuels for those
studies four FACE Gasolines were selected for blending with levels of 10 15 and 30 vol ethanol The
fuels selected for this purpose were A B C and H The positions of these fuels in the design matrix are
shown below
In this section results of the analyses of the ethanol blends are discussed Chevron Phillips 66 BP and
a contract laboratory conducted the analyses As mentioned previously future production runs that are
required to remake fuels that sell out likely will results in some changes to the fuel property values
reported here
41 ASTM TEST RESULTS
ASTM methods were used to measure the ethanol content RON MON API gravity density distillation
profiles RVP and net heats of combustion of all of the ethanol blends made with the FACE Gasolines
The results of these analyses are summarized below and in Table A2 located in the Appendix
411 Ethanol Content
FACE Gasolines A B C and H were blended with nominally 10 15 and 30 vol ethanol The
concentration of ethanol in each blend were determined using ASTM method D5599 (15) (coupled with
ASTM D4052 density measurement) and by detailed hydrocarbon analysis using gas chromatography
with a flame ionization detector The results for both methods were in excellent agreement for all fuels
as shown below in Table 41
Table 41 Measured Ethanol Content of FACE Gasoline Blends
Ethanol Content (vol)
A B C H
10 15 30 10 15 30 10 15 30 10 15 30
D5599 101 147 299 100 147 302 102 146 295 102 146 303
DHA 100 146 301 100 148 301 103 148 299 102 147 304
22
412 RON MON and Octane Sensitivity
RON values were measured in CFR engines per ASTM method D2699 (4) Although the measurements
were conducted in four labs the lab‐to‐lab reproducibility was very good so only the average values are
reported here (but individual values are reported in Table A2) Average RON values for each fuel are
presented in Figure 41 For all four of these FACE Gasolines the RON values continue to increase even
at the 30 ethanol level although the rates of increase are lower than at lower ethanol levels FACE
Gasoline B has the highest RON at all ethanol levels with a value of about 106 at the 30 ethanol level
FACE Gasolines A and C have essentially the same RON values at all ethanol levels with RON values of
about 102 at the 30 ethanol level FACE Gasoline H without ethanol has a higher RON than A and C
but a lower RON at the 15 and 30 ethanol levels
Figure 41 RON Values of FACE Gasoline Blends with Ethanol
MON values were measured in CFR engines per ASTM method D2700 (5) Although the measurements were conducted in four labs the lab‐to‐lab reproducibility was very good so only the average values are reported here (but individual values are reported in Appendix A2) The MON values for each fuel are
presented in Figure 42 FACE Gasoline B has the highest MON values at all ethanol levels but unlike the other FACE Gasolines the MON value did not increase with ethanol contents above 10 vol The MON values for FACE Gasolines A and C were essentially the same and higher than those for FACE Gasoline H
80081082083084085086087088089090091092093094095096097098099010001010102010301040105010601070108010901100
0 5 10 15 20 25 30 35
RON
Ethanol (vol)
RON Values ‐ FACE Gasoline + Ethanol Blends
FACE A
FACE B
FACE H
FACE C
23
Figure 42 MON Values of FACE Gasoline Blends with Ethanol
Octane Sensitivity (S=RON‐MON) values are presented in Figure 43 As expected due to the relatively high sensitivity of ethanol the sensitivities of all four FACE Gasolines increase as the ethanol content increases FACE Gasoline H has the highest sensitivity at all ethanol levels except at 30 vol ethanol where the sensitivity of the FACE Gasoline B blend becomes slightly higher with values of 124 and 132 respectively The sensitivities for FACE Gasolines A and C are very similar to each other and although lower than the blends for the other FACE Gasolines have the highest rates of increase at the 30 level
Figure 43 Octane Sensitivities FACE Gasoline Blends with Ethanol
750
760
770
780
790
800
810
820
830
840
850
860
870
880
890
900
910
920
930
940
950
0 5 10 15 20 25 30 35
MON
Ethanol (vol)
MON Values ‐ FACE Gasoline + Ethanol Blends
FACE A
FACE B
FACE H
FACE C
00
10
20
30
40
50
60
70
80
90
100
110
120
130
140
0 5 10 15 20 25 30 35
S
Ethanol (vol)
Octane Sensitivity (S) ‐ FACE Gasoline + Ethanol Blends
FACE A
FACE B
FACE H
FACE C
24
413 Distillation Characteristics
The distillation properties of the fuels were determined by ASTM D86 (6) The values are plotted in
Figure 44 and tabulated in Table A2 in the Appendix The behavior and shapes of the curves are very
similar For a given gasoline all of the ethanol blends start at about the same IBP The blends
containing ethanol then follow the same curve which is lower than the base gasoline At a certain point
the ethanol blends then rise quickly to rejoin the distillation curve of the base gasoline The lower the
ethanol content of the blend the earlier (lower distilled volume ) the curve rejoins the base gasoline
curve
Figure 44 ASTM D86 Distillation Profiles for FACE Gasoline Blends with Ethanol
50
100
150
200
250
300
0 10 20 30 40 50 60 70 80 90 100
Temperature (˚ C)
Volume Distilled
D86 Distillation ‐ FACE A Gasoline + Ethanol Blends
0 EtOH
10 EtOH
15 EtOH
30 EtOH
50
100
150
200
250
300
0 10 20 30 40 50 60 70 80 90 100
Temperature (˚ C)
Volume Distilled
D86 Distillation ‐ FACE B Gasoline + Ethanol Blends
0 EtOH
10 EtOH
15 EtOH
30 EtOH
50
100
150
200
250
300
350
0 10 20 30 40 50 60 70 80 90 100
Temperature (˚ C)
Volume Distilled
D86 Distillation ‐ FACE C Gasoline + Ethanol Blends
0 EtOH
10 EtOH
15 EtOH
30 EtOH
50
100
150
200
250
300
350
400
450
0 10 20 30 40 50 60 70 80 90 100
Temperature (˚ C)
Volume Distilled
D86 Distillation ‐ FACE H Gasoline + Ethanol Blends
0 EtOH
10 EtOH
15 EtOH
30 EtOH
25
414 Reid Vapor Pressure (RVP)
The RVPs were determined using ASTM method D5191 (7) The values are plotted in Figure 45 For all
fuels the RVP appears to peak between 10 and 15 vol ethanol and then starts to decrease as the
ethanol content increases further
Figure 45 Reid Vapor Pressures for FACE Gasoline Blends with Ethanol
415 API Gravity and Density
The API gravities and densities of the fuels were measured by two labs using ASTM method D4052 (8) The values from the two labs were in excellent agreement and are listed in Table A2 The average density values are presented in Figure 46 For all of the FACE Gasolines the density increased as the ethanol content increased
Figure 46 Densities of FACE Gasoline Blends with Ethanol
7
75
8
85
9
95
10
0 5 10 15 20 25 30 35
RVP (psi)
Ethanol (vol)
Reid Vapor Pressure (RVP) ‐ FACE Gasoline + Ethanol Blends
FACE A
FACE B
FACE H
FACE C
0685 0697 0691
0759
0696 0705 0699
0761
0700 0710 0704
0763
0716 0724 0719
0768
0
01
02
03
04
05
06
07
08
09
1
A B C H
Density
(gm
l)
Ethanol (vol)
Density ‐ FACE Gasoline Blends with Ethanol
0
10
15
30
26
416 Net Heat of Combustion (NHC)
Net Heats of Combustion were measured by 2 labs using ASTM method D240 (9) For some fuels ASTM
method D4809 (10) was also used The values from both labs and both methods were very close to each
other and the average values are plotted in Figure 47 As expected since the net heat of combustion of
ethanol is lower than that of gasoline for all FACE Gasolines the net heat of combustion decreased as
ethanol content increased The decrease appeared to be linear with ethanol content The decrease
appeared to be steepest for FACE Gasoline B
Figure 47 Net Heat of Combustion of FACE Gasoline Blends with Ethanol
16000
16250
16500
16750
17000
17250
17500
17750
18000
18250
18500
18750
19000
19250
19500
0 5 10 15 20 25 30 35
Net Heat of C
ombustion (B
TUlb)
Ethanol (vol)
Net Heat of Combustion ‐ FACE Gasoline + Ethanol Blends
FACE A
FACE B
FACE H
FACE C
27
5 SUMMARY AND CONCLUSIONS
A subteam of the CRC AVFL FACE Working Group has designed a matrix of reference gasolines
known as the FACE Gasolines A commercial vendor has produced and made the fuels available
for purchase in research quantities It is expected that this will enable consistent comparisons
of engine and combustion results from different laboratories and test platforms based on the
use of the same set of fuels
The matrix is designed around four parameters expected to be of importance for advanced
gasoline engines RON octane sensitivity aromatics content and n‐paraffins content
Statistical methods were used to identify potential candidate formulations and down‐select to a
tractable number of 10 formulations
Detailed analyses were performed on the physical and chemical properties of the final fuel
formulations
Generally the property values measured in the current study agreed very well with the values
reported on the fuel blender (ChevronPhillips Chemical Company ‐ CPChem) Certificates of
Analyses (COAs)
As expected conflicts in the target properties for some of the fuels (such as high aromatics level
coupled with low octane sensitivity) led to some trade‐offs that resulted in some deviation in
the actual properties from the design properties
The RON values come close to meeting the targets for most of the fuels Fuels E H and J have
values that are 24‐38 units higher than the targets
Three of the four ldquohighrdquo sensitivity fuels have measured values of 59‐71 that are lower than
the target value of 10 Two of the ldquolowrdquo sensitivity fuels have measured values (34‐37) that are
a bit higher than the target value of le2 One of the low sensitivity design fuels (ldquoDrdquo) has a value
of 72 that actually effectively makes it a high sensitivity fuel
Detailed hydrocarbon analyses (DHA) indicate that the n‐paraffins contents range from 225‐
316 vol for the four FACE Gasolines that had targets of 25 vol and from 44‐117 vol for
the six FACE Gasolines that had targets of 5 vol
DHAs indicate that the aromatics contents range from 317‐358 vol for the four FACE
Gasolines that had a target of 35 vol and 0‐109 vol for the other fuels that had a target of 5
vol
The high sensitivity fuels contained the high sensitivity components of naphthenes (105‐208
vol) and olefins (68‐127 vol) The exception was Gasoline ldquoDrdquo which had neither of these
components but whose high sensitivity was derived from aromatics components
Five of the FACE Gasolines (ldquoArdquo ldquoBrdquo ldquoCrdquo ldquoFrdquo and ldquoIrdquo) are very rich in isoparaffins with contents ge
676 vol
Aromatics values determined by SFC were generally higher than the values obtained from DHA
The DHA olefins values were close to the FIA values reported on the CPChem COAs
The fuels having the highest aromatics content also have the highest densities and highest net
heats of combustion on an energy content per volume basis
With regards to distillation properties for all fuels the initial boiling points (IBPs) are in a
narrow range of 90‐110˚F although the end boiling points (EBPs) range from 253‐410˚F Three
28
of the high sensitivity fuels have the highest EBPs The two low‐mid RON fuels having low n‐
paraffins and low aromatics have the lowest EBPs
All of the FACE Gasolines have ultra‐low levels of sulfur with the highest value at 22 ppm S and
most fuels having le 6 ppm S
For the four FACE Gasolines blended with ethanol RON continues to increase as the ethanol
levels increase to 30 vol although the rate of increase is lower as the ethanol content
increases FACE Gasoline B which has the highest RON of 96 has the highest RON at all ethanol
levels with a value of about 106 at 30 ethanol At the same ethanol level FACE Gasolines A
and C have essentially the same RON values FACE Gasoline H starts with a higher RON value
than those of A or C but has a lower value at blend levels of 15 and 30 vol
MON increased as the ethanol level increased for FACE Gasolines A C and H The MON values
for these fuels were essentially constant even though the highest MON values were found for
the ethanol blends with FACE Gasoline B
For all blends octane sensitivity increased as ethanol content increased with the highest values
of 12‐13 for 30 vol ethanol blends with FACE Gasolines B and H
The D86 distillation curve trends are similar for the four FACE Gasolines For a given gasoline all
blends start at the same point At around 10 vol distilled the curves for the blends with
ethanol diverge from and are lower than the curves for the base gasolines At a certain point
the distillation curves for the blends rise quickly and re‐join the curve for the parent base fuel
The distillation curves for the 30 vol ethanol blends are generally flat as a function of
increasing vol distilled and only start to increase again at about 70‐80 vol distilled when
most of the ethanol has been distilled from the liquid
The Reid Vapor Pressures (RVPs) peak at about 10‐15 vol
Densities increase slightly as ethanol increases while net heats of combustion decrease
29
6 REFERENCES
1 Alnajjar M Cannella B Dettman H Fairbridge C Franz J Gallant T Gieleciak R Hager D Lay C Lewis S Ratcliff M Sluder S Storey J Yin H Zigler B ldquoChemical and Physical Properties of the Fuels for Advanced Combustion Engines (FACE) Research Diesel Fuelsrdquo CRC Report No FACE‐1 (2010)
2 Gallant T Franz J Alnajjar M Storey J Lewis S Sluder S Cannella W Fairbridge C Hager D Dettman H Luecke J Ratcliff M Zigler ldquoFuels for Advanced Combustion Engines Research Diesel Fuels Analysis of Physical and Chemical Propertiesrdquo SAE Paper 2009‐01‐2769 (2009)
3 CannellaW Fairbridge C Arboleda P Bays T Dettman H Foster M Gieleciak R Gunter G Hager D Lay C Lewis S Luecke J Sluder S Zigler B ldquoDetailed Characterization of the Physical and Chemical Properties of the Reformulated FACE Diesel Fuels FD2B FD4B and FD7Brdquo CRC Report AVFL‐19‐1 (2013)
4 ASTM International Standard Test Method for Research Octane Number of Spark‐Ignition Engine Fuel ASTM D2699 (ASTM International Pennsylvania 2009)
5 ASTM International Standard Test Method for Motor Octane Number of Spark‐Ignition Engine Fuel ASTM D2700 (ASTM International Pennsylvania 2009)
6 ASTM International Standard Test Method for Distillation of Petroleum Products at Atmospheric Pressure ASTM D86‐09e1 (ASTM International Pennsylvania 2009)
7 ASTM International Standard Test Method for Vapor Pressure of Petroleum Products (Mini‐Method) ASTM D5191 (ASTM International Pennsylvania 2009)
8 ASTM International Standard Test Method for Density and Relative Density of Liquids by Digital Density Meter ASTM D4052‐96(2002)e1 (ASTM International Pennsylvania 2002)
9 ASTM International Standard Test Method for Heat of Combustion of Liquid Hydrocarbon Fuels by Bomb Calorimeter ASTM D240‐02(2007) (ASTM International Pennsylvania 2007)
10 ASTM International Standard Test Method for Heat of Combustion of Liquid Hydrocarbon Fuels by Bomb Calorimeter ASTM D4809 (2007) (ASTM International Pennsylvania 2007)
11 ASTM International Standard Test Method for Determination of Aromatic Content and Polynuclear Aromatic Content of Diesel Fuels and Aviation Turbine Fuels by Supercritical Fluid Chromatography ASTM D5186‐03(2009) (ASTM International Pennsylvania 2009)
12 ASTM International Standard Test Method for Hydrocarbon Types in Liquid Petroleum Products by Fluorescent Indicator Adsorption ASTM D1319‐08 (ASTM International Pennsylvania 2008)
13 ASTM International Standard Test Methods for Instrumental Determination of Carbon Hydrogen and Nitrogen in Petroleum Products and Lubricants ASTM D5291‐02(2007) (ASTM International Pennsylvania 2007)
14 ASTM International Standard Test Methods for Determination of Total Sulfur in Light Hydrocarbons Spark‐Ignition Engine Fuel Diesel Engine Fuel and Engine Oil by Ultraviolet Fluorescence ASTM D5453(2007) (ASTM International Pennsylvania 2007)
15 ASTM International Standard Test Methods for Determination of Oxygenates in Gasoline by Gas Chromatography and Oxygen Selective Flame Ionization Detection ASTM D5599 (2007) (ASTM International Pennsylvania 2007)
30
31
Appendix A
Properties of FACE Gasolines
32
Table A1 Summary Data for FACE Gasolines
Specific Tests FACE Gasoline A B C D E F G H I J Research Octane Number (RON) (ASTM D2699) -Lab 1 843 958 850 946 871 940 969 870 700 738 -Lab 2 839 960 840 939 877 960 869 -Lab 3 835 957 840 -Average 839 958 843 942 874 940 965 869 7015 738 -CPChem COA 835 960 847 932 875 944 968 869 703 718 Motor Octane Number (MON) (ASTM D2700) -Lab 1 836 923 830 872 813 881 857 797 695 701 -Lab 2 833 931 830 868 808 860 799 -Lab 3 835 919 829 -Average 835 924 830 870 811 881 858 798 695 701 -CPChem COA 836 926 836 878 815 888 858 793 696 688 Sensitivity (RON-MON) -Lab 1 07 35 20 74 58 59 112 73 05 37 -Lab 2 06 29 10 71 69 100 70 -Lab 3 0 38 11 -Average 04 34 13 72 63 59 107 72 05 37 -CPChem COA -01 34 11 54 60 56 110 76 07 30 API Gravity (API˚) (ASTM D4052) -CPChem COA 750 714 734 587 636 686 545 568 744 595 -Lab 1 749 713 732 587 636 686 546 548 744 587 -Average 7495 7135 733 587 636 686 5455 558 744 591 Density (ASTM D4052) -CPChem COA 0691 0743 0725 0707 0760 0697 0741 -Lab 1 0685 0697 0691 0743 0725 0707 0760 0759 0697 0743 -Average 0685 0697 0691 0743 0725 0707 0760 0759 0697 0742 RVP (psi) (D5191) -CPChem COA 81 74 74 68 67 78 72 75 75 75 -Lab 1 80 73 75 73 76 77 Net Heat of Combustion (BTUlb) (ASTM D4809) 19186 18680 Net Heat of Combustion (BTUlb) (ASTM D240) 19251 19187 19257 18649 18884 19072 18602 18625 19225 18731
33
TableA1 Summary Data for FACE Gasolines
Specific Tests FACE Gasoline A B C D E F G H I J Distillation (˚F) (ASTM D86) -CPChem IBP 93 95 95 88 110 108 93 94 100 101
5 104 128 120 129 131 129 122 123 123 111 10 132 145 136 148 142 142 135 140 156 162 20 160 172 154 176 155 156 158 168 177 206 30 183 194 171 198 166 168 183 192 186 217 40 197 207 187 212 177 180 210 211 191 224 50 203 213 200 221 186 193 240 227 195 231 60 207 216 210 229 197 206 270 242 199 242 70 210 220 218 235 208 217 306 262 203 261 80 213 225 226 280 222 225 328 291 207 291 90 219 235 243 330 267 240 343 327 213 316 95 227 248 270 340 343 261 363 358 220 330 FBP 269 283 328 363 405 294 403 410 259 358
-Lab 1 IBP 90 97 93 97 107 102 99 98 99 95 5 122 133 126 133 134 134 122 127 139 111
10 140 149 139 151 143 144 136 143 160 166 20 165 175 157 179 156 157 158 170 178 209 30 186 196 174 200 168 169 182 194 187 219 40 198 209 188 214 177 182 209 213 192 225 50 204 214 201 224 188 195 238 229 196 232 60 207 218 210 234 197 207 268 243 200 242 70 210 221 218 248 208 218 304 263 204 263 80 213 226 227 288 224 228 328 291 208 292
90 219 236 245 331 258 243 343 329 213 316 95 228 248 274 341 329 261 358 357 220 330 FBP 262 280 330 365 402 291 405 408 247 357
-Average IBP 915 96 94 925 1085 105 96 96 995 98 5 113 1305 123 131 1325 1315 122 125 131 111
10 136 147 1375 1495 1425 143 1355 1415 158 164 20 1625 1735 1555 1775 1555 1565 158 169 1775 203 30 1845 195 1725 199 167 1685 1825 193 1865 218 40 1975 208 1875 213 177 181 2095 212 1915 2245 50 2035 2135 2005 2225 187 194 239 228 1955 2315 60 207 217 210 2315 197 2065 269 2425 1995 242 70 210 2205 218 2415 208 2175 305 2625 2035 262 80 213 2255 2265 284 223 2265 328 291 2075 2915
90 219 2355 244 3305 2625 2415 343 328 213 316 95 2275 248 272 3405 336 261 3605 3575 220 330 FBP 2655 2815 329 364 4035 2925 404 409 253 3575
34
Table A1 Summary Data for FACE Gasolines
Specific Tests FACE Gasoline A B C D E F G H I J Elemental Analysis (ASTM D 5291) -Carbon (wt) -Lab 1 8398 8441 8497 8647 8547 8671 8792 8415 -Lab 4 8400 8444 8419 8645 8547 8496 8669 8703 8414 8624 -Average 8399 8443 8458 8646 8547 8496 8670 8748 8414 8624 -Hydrogen (wt) -Lab 1 1602 1559 1503 1353 1453 1329 1208 1585 -Lab 4 1600 1556 1585 1355 1453 1504 1331 1297 1586 1376 -Average 1601 1557 1547 1354 1453 1504 1330 1252 1586 1376 Sulfur by UV Fluorescence (ppmw) (ASTM D5453) -CPChem COA 4 4 3 2 21 2 20 15 2 2 -Lab 4 6 4 4 2 21 2 22 15 2 2 Hydrocarbons by FIA (vol) (ASTM D1319) -Aromatics (vol) CPChem COA 0 42 21 295 121 58 335 353 09 278 -Olefins (vol) CPChem COA 04 07 04 04 99 86 78 79 62 10 -Saturates (vol) CPChem COA 996 951 975 701 780 856 587 568 929 712 Aromatics by SFC (ASTM D5186) (Lab 1) -MonoAromatics (wt) -Lab 1 07 78 60 414 142 100 393 412 04 387 -Lab 2 80 421 138 395 428 -Average 07 79 60 4175 140 100 394 420 04 387 -PolyAromatics (wt) -Lab 1 0 0 0 03 11 0 10 10 0 03 -Lab 2 0 0 09 12 15 -Average 0 0 0 015 10 0 11 125 0 03 -NonAromatics (wt) -Lab 1 993 922 940 583 847 900 597 578 996 610 -Lab 2 920 579 850 593 557 -Average 993 921 940 581 8475 900 595 5675 996 610
35
Table A1 Summary Data for FACE Gasolines
Specific Tests FACE Gasolines A B C D E F G H I J Detailed Hydrocarbon Analyses by GC-FID -n-paraffins (vol) (Targets) (5) (5) (25) (25) (5) (5) (5) (25) (5) (25) -Lab 1 1144 783 2409 2346 771 434 662 2214 1441 3115 -Lab 2 1187 815 2476 2473 803 446 685 2283 1437 3212 -Average 1165 799 2443 2410 787 440 673 2249 1439 3164 -iso-paraffins (vol) -Lab 1 8562 8591 688 4206 4563 6765 3821 2322 7449 3362 -Lab 2 8635 8586 7066 4221 4621 6747 3864 2240 7459 3366 -Average 8599 8688 6973 4213 4592 6756 3843 2281 7454 3364 -cyclo-paraffins (vol) -Lab 1 192 021 048 010 2216 1078 1163 1035 324 234 -Lab 2 130 007 023 010 1945 1118 1140 1066 336 224 -Average 161 014 036 010 2081 1098 1152 1050 330 229 -aromatics (vol) (Targets) (5) (5) (5) (35) (5) (5) (35) (35) (5) (35) -Lab 1 073 601 409 3425 1121 805 3419 3597 120 3212 -Lab 2 003 568 374 3258 1062 739 3306 3555 110 3125 -Average 38 584 392 3341 1092 772 3363 3576 115 3169 -olefins (vol) -Lab 1 024 001 248 004 1146 978 851 714 643 066 -Lab 2 018 003 006 005 1392 905 771 650 627 054 -Average 021 002 127 04 1269 942 811 682 635 060
36
37
Appendix B
Properties of FACE Gasoline Blends with Ethanol
38
Table B1 Summary Data for FACE Gasoline Blends with Ethanol
Specific Tests FACE Gasoline Blend A B Ethanol Content (Vol ) 0 10 15 30 0 10 15 30 Ethanol Content (Vol ) (ASTM D5599) 0 1012 1469 2990 0 995 1473 3016 Research Octane Number (RON) (ASTM D2699) -Lab 1 843 922 951 1032 958 1015 1039 1067 -Lab 2 839 923 951 1017 960 1008 1023 1050 -Lab 3 835 917 946 1025 957 1012 1031 1069 -Lab 4 916 945 1018 1009 1026 1053 -Average 839 920 948 1023 958 1011 1030 1060 Motor Octane Number (MON) (ASTM D2700) -Lab 1 836 878 890 912 923 936 936 934 -Lab 2 833 874 891 917 931 935 934 931 -Lab 3 835 881 893 911 919 933 934 933 -Lab 4 884 901 916 935 936 933 -Average 835 879 894 914 924 935 935 933 Sensitivity (RON-MON) -Lab 1 07 44 61 120 35 79 103 133 -Lab 2 06 49 60 100 29 73 89 119 -Lab 3 0 36 53 114 38 79 97 136 -Lab 4 32 44 102 74 91 120 -Average 04 41 54 109 34 76 95 127 API Gravity (API˚) (ASTM D4052) -Lab 1 749 7164 7066 661 7131 690 6772 6375 -Lab 4 716 706 660 690 676 638 -Average 749 7162 7063 6605 7131 690 6766 6377 Density (ASTM D4052) -Lab 1 06849 06959 06992 07154 0697 07050 07096 07240 -Lab 4 06966 06999 07161 07055 07106 07244 -Average 06849 06963 06996 07158 0697 07053 07101 07242 RVP (psi) (D5191) Lab 1 83 95 94 91 73 87 86 83 Net Heat of Combustion (BTUlb) (ASTM D4809) 18308 Net Heat of Combustion (BTUlb) (ASTM D240) -Lab 1 19266 18294 18080 16751 19207 18319 17941 16631 -Lab 4 19236 18208 17963 16487 19168 18307 17696 16234 -Average 19251 18251 18021 16619 19187 18313 17818 16432
39
Table B1 Summary Data for FACE Gasoline Blends with Ethanol
Specific Tests FACE Gasoline Blend C H Target Ethanol Content (Vol ) 0 10 15 30 0 10 15 30 Ethanol Content (Vol) (ASTM D5599) 0 1018 1462 2949 0 1016 1459 3034 Research Octane Number (RON) (ASTM D2699) -Lab 1 850 918 951 1012 870 919 941 993 -Lab 2 840 920 950 1014 869 927 941 996 -Lab 3 840 917 946 1019 869 920 937 995 -Lab 4 914 945 1015 916 946 991 -Average 843 917 948 1015 869 921 941 994 Motor Octane Number (MON) (ASTM D2700) -Lab 1 830 876 893 921 797 821 835 861 -Lab 2 830 868 880 924 793 820 831 885 -Lab 3 829 876 887 909 799 817 829 858 -Lab 4 881 890 914 828 839 877 -Average 830 875 888 916 796 822 833 870 Sensitivity (RON-MON) -Lab 1 20 42 58 91 73 98 106 132 -Lab 2 10 52 70 90 76 107 110 111 -Lab 3 11 41 59 110 70 103 108 137 -Lab 4 33 55 101 88 107 114 -(RON)avg ndash (MON)avg 13 42 60 99 73 99 108 124 API Gravity (API˚) (ASTM D4052) -Lab 1 732 7069 6943 6523 5481 5416 5375 5247 -Lab 4 707 693 652 544 538 527 -Average 732 707 694 652 548 543 5377 526 Density (ASTM D4052) -Lab 1 06906 06991 07035 07186 07587 07614 07631 07684 -Lab 4 06997 07043 07192 07610 07636 07678 -Average 06994 07039 07189 07587 07612 07633 07681 RVP (psi) (D5191) Lab 1 75 86 85 83 76 88 87 84 Net Heat of Combustion (BTUlb) (ASTM D4809) 19186 18198 17955 16692 16265 Net Heat of Combustion (BTUlb) (ASTM D240) -Lab 1 19257 18375 18012 16739 18675 17891 17550 16369 -Lab 4 18576 17809 17408 16322 -Average 19257 18375 18012 16739 18625 17850 17479 16345
40
Table B1 Summary Data for FACE Gasoline Blends with Ethanol
Specific Tests FACE Gasoline Blend A B Target Ethanol Content 0 10 15 30 0 10 15 30 Ethanol Content (Vol) -ASTM D5599 0 1012 1469 2990 0 995 1473 3016 -Detailed Hydrocarbon Analysis - GCFID -Lab 1 0 1000 1463 3017 0 1001 1476 3014 Elemental Analysis (ASTM D 5291) -Carbon (wt) -Lab 1 8443 8178 7941 7306 8465 8172 8029 7346 -Lab 4 8433 8085 7823 7361 8471 8110 7921 7380 -Average 8438 8131 7882 7333 8468 8141 7975 7363 -Hydrogen (wt) -Lab 1 1543 1527 1484 1446 1473 1462 1442 1387 -Lab 4 1606 1573 1548 1515 1561 1540 1525 1487 -Average 1575 1550 1516 1481 1517 1501 1483 1437 -Oxygen (wt) (ASTM D5599) Lab 4 0 400 578 1150 0 389 571 1147
Specific Tests FACE Gasoline Blend C H Target Ethanol Content 0 10 15 30 0 10 15 30 Ethanol Content (Vol) -ASTM D5599 0 1018 1462 2949 0 1016 1459 3034 -Detailed Hydrocarbon Analysis - GCFID -Lab 1 0 1027 1483 2988 0 1021 1468 3040 Elemental Analysis (ASTM D 5291) -Carbon (wt) -Lab 1 8447 8200 7998 7336 8768 8402 8401 7624 -Lab 4 8419 8077 7909 7353 8720 8316 8150 7626 -Average 8433 8138 7954 7345 8744 8359 8276 7625 -Hydrogen (wt) -Lab 1 1494 1465 1465 1405 1205 1199 1207 1218 -Lab 4 1585 1668 1523 1509 1300 1305 1292 1316 -Average 1540 1567 1494 1457 1253 1252 1250 1267 -Oxygen (wt) (ASTM D5599) Lab 4 0 401 572 1129 0 368 527 1088
Table B1 Summary Data for FACE Gasoline Blends with Ethanol
41
Specific Tests FACE Gasoline Blend A B Target Ethanol Content 0 10 15 30 0 10 15 30 Distillation (˚F) (ASTM D86) Lab 1 IBP 90 106 99 99 97 105 103 101 5 122 127 122 126 133 128 126 129 10 140 134 131 135 149 135 134 138 20 165 145 144 146 175 147 146 149 30 186 153 152 153 196 155 154 155 40 198 159 156 156 209 165 159 159 50 204 202 159 158 214 211 165 161 60 207 208 204 159 218 217 214 162 70 210 211 210 160 221 219 219 163 80 213 214 213 161 226 225 224 165 90 219 222 219 211 236 234 234 230 95 228 233 229 224 248 247 246 242 FBP 262 261 263 260 280 271 270 266
Specific Tests FACE Gasoline Blend C H Target Ethanol Content 0 10 15 30 0 10 15 30 Distillation (˚F) (ASTM D86) Lab 1 IBP 93 104 102 107 98 96 105 106 5 126 126 123 130 127 123 125 127 10 139 131 131 136 143 132 134 138 20 157 140 140 145 170 145 147 152 30 174 147 147 151 194 153 156 159 40 188 153 153 156 213 167 161 163 50 201 183 157 159 229 217 182 166 60 210 208 176 161 243 236 235 169 70 218 217 215 162 263 255 253 175 80 227 226 223 165 291 283 282 268 90 245 244 241 233 329 322 323 312 95 274 274 269 261 357 351 351 343 FBP 330 331 322 324 408 401 407 396
42

1
1 INTRODUCTION
This report summarizes the efforts to design a matrix of gasoline test fuels known as the Coordinating
Research Councilrsquos (CRC ) Fuels for Advanced Combustion Engines (FACE) Gasolines and to extensively
characterize the physical and chemical properties of those fuels using standard ASTM International‐type
analyses and advanced characterization techniques It also provides information about the properties of
4 of the gasolines blended with 10 15 and 30 vol ethanol
The FACE Gasolines were designed based on statistical methods and target values established by the
CRC Advanced Vehicle Fuel and Lubricant (AVFL) Committeersquos FACE Working Group A key aspect of the
mission of the FACE Working Group is to design sets of test fuels well‐suited for research so that
researchers evaluating advanced combustion systems can compare results from different laboratories
using the same sets of fuels for consistency The current work on the FACE Gasolines follows on the
grouprsquos previous success with the FACE Diesel Fuels (1 2 3)
The FACE Working Group determined that 4 gasoline properties would be of primary importance to the
performance of advanced gasoline‐fueled engines Research Octane Number (RON) Octane Sensitivity
(S=RON‐MON) aromatics content and normal‐paraffin (n‐paraffin) content The RON and S parameters
are measures of the fuel autoignition quality while the aromatics and n‐paraffin content parameters are
measures of the fuel chemistry Since it was expected that some users would want to investigate some
fuels without ethanol the decision was made to exclude ethanol from the base fuel set The fuel target
levels selected were RONs of 70 85 and 95 ldquolowrdquo and ldquohighrdquo octane sensitivities of le2 and ~ 10
respectively aromatics contents of 5 and 35 vol and n‐paraffin contents of 5 and 25 vol A full‐
factorial set of test gasolines with these target levels would consist of 24 fuels Statistical techniques
(described in the next section) were used to reduce this to a tractable number of 10 fuels while still
maintaining a statistically sound matrix The FACE Gasolines design matrix is depicted in Figure 1
Figure 1 FACE Gasolines Design Matrix
2
Although the target RON values of 70 and 85 and the octane sensitivity of 2 are lower and n‐paraffin
content of 25 vol are higher than currently found in market gasolines they appear to be potentially
relevant for emerging advanced low temperature combustion engines and so were included in this
matrix of research fuels
A commercial fuels blender (Chevron Phillips Chemical Co ndash CPChem) agreed to work with the FACE
Working Group and provide blend formulation candidates for each of the target fuels and to
manufacture and make available for sale drum quantities of the final formulations The FACE Working
Group directed that the fuel blends should consist of refinery blending streams to the maximum
possible extent but would allow a maximum of five pure compounds to be added with a maximum
concentration of 10 vol Also the olefin content was limited to a maximum of 10 vol and for safety
reasons the Reid Vapor Pressure was set at a minimum of around 7 psi The suggested variations in the
concentrations of the aromatics and n‐paraffins were plusmn2 vol The suggested variations in the RON and
octane sensitivity were plusmn 2 octane numbers It was recognized that some of the target fuel properties
would lead to conflicts for some fuels (ie high aromatics content but low sensitivity for fuel ldquoDrdquo) and
that some trade‐offs would be required leading to some of the targets not being completely met
As soon as CPChemrsquos manufacturing of the commercial batches was completed a subgroup of the FACE
Working Group set about to characterize as fully as possible the chemical and physical properties of the
FACE Gasolines and to make that information available to the advanced combustion research and
development (RampD) community to enable selection of standardized test fuels for their programs and
correlation of test results to fuel composition and properties In support of that effort standard ASTM
tests were conducted at several different laboratories to measure the following properties Research
Octane Number (RON) Motor Octane Number (MON) API gravity density RVP distillation profile net
heat of combustion elemental carbon hydrogen and sulfur and fuel composition The fuel
composition methods consisted of fluorescent indicator adsorption (FIA) supercritical fluid
chromatography (SFC) and detailed hydrocarbon analyses (DHA) by one‐dimensional gas
chromatography with a flame ionization detector (1D GC‐FID) In general the lab‐to‐lab variation in
these tests was low less than 1 of the mean Because of this good agreement in the following charts
and text generally the average values are used without error bars In addition 5‐gallon sized blends of 4
of the FACE Gasolines (A B C and H) with 10 15 and 30 vol ethanol were prepared and also
characterized
This report is organized into the following sections
bull Section 2 provides details on the statistical techniques used to design the FACE Gasolines matrix
bull Section 3 contains the results of the analyses of the FACE Gasolines
bull Section 4 discusses the results of the analyses of the FACE Gasoline blends with ethanol
bull Section 5 presents a summary and conclusions
bull Section 6 lists the references cited
bull Appendix A provides tables of the properties of the FACE Gasolines
bull Appendix B provides tables of the properties of the FACE Gasolines blended with ethanol
3
2 STATISTICAL DESIGN OF FACE GASOLINES MATRIX
As mentioned in the Introduction the FACE Gasolines matrix was designed around the following four parameters RON octane sensitivity (S) aromatics content and n‐paraffins content The target levels selected were RON 70 85 and 95
Sensitivity le2 (ldquolowrdquo) and asymp10 (ldquohighrdquo) Aromatics 5 and 35 vol n‐paraffins 5 and 25 vol A full‐factorial set of test gasolines with these target levels consists of the twentyfour fuels listed in Table 21 Bill Leppard then used information about the refinery streams and components then available to CPChem the fuels blender and their proprietary non‐linear octane blending model to develop candidate fuel formulations Each blending recipe was optimized by manually adjusting the concentrations of the blending components (blending streams and pure components) In parallel John Orban used the same information about the refinery streams properties to systematically compute all possible candidate fuel formulations using a non‐proprietary linear octane blending model In both modeling efforts the optimum recipes were determined by considering the normalized deviation between the predicted and target properties of RON sensitivity aromatics vol and n‐paraffin vol Although the two modeling efforts were conducted independently there were many interactions during the process resulting in a single set of optimum recipes CPChem then used these optimum recipes to prepare and analyze hand blends for all twentyfour possible fuels These measurements are also listed in Table 1 The FACE Working Group realized that this number of fuels was unrealistic from a manufacturing cost and testing perspective and decided to limit the total number of fuels to ten One thing to note from the table is that four of the eight possible 70 RON fuels (designated by a ldquordquo in the table) were not blended because their model‐predicted properties were too far removed from the target properties The FACE Working Group decided to select two of the four 70 RON fuels for the final matrix of ten fuels These were fuels 1 and 10 Fuel 1 was selected because it contained the lowest amount of aromatics and nearly lowest amount of n‐paraffins Fuel 10 was selected because it contained the highest amounts of aromatics and n‐paraffins The remaining eight fuels were selected from among the sixteen 85 and 95 RON candidates using the D‐ and G‐optimality efficiencies which are two of the most common statistical techniques for evaluating experimental designs The D‐optimality technique generally produces designs that yield small standard errors for the parameter estimates small correlations between the parameter estimates and small standard errors for predicted responses within the design space The G‐optimality technique usually produces similar results The use of these statistical techniques to identify the optimum set of fuels requires defining the correlation model relating a measured engine response to the selected fuel parameters Three linear models were selected which included the following parameters Model 1 ndash Response=f(RON aromatics n‐paraffins and all 1st order interactions of these three parameters) Model 2 ndash Response=f(RON sensitivity aromatics n‐paraffins and all 2‐factor interactions involving RON) and Model 3 ndash Response=f(RON sensitivity aromatics n‐paraffins and all 2‐factor interactions not involving sensitivity) For all three models the D‐ and G‐optimality efficiencies were calculated for all possible sets of eight fuels and the resulting efficiencies were rank ordered The rank orderings of the fuel sets
4
between the D‐ and G‐optimality efficiencies were virtually identical There were however slight differences in the rank orderings among the three correlation models These results were discussed with the FACE Working Group which decided to select the optimum fuel set associated with Model 2 The target properties for this fuel set are listed in Table 22 along with the final fuel designations Once the FACE Working Group decided on the final fuel properties CPChem initiated efforts to make large batches of the fuels one at a time as time and equipment availability permitted At the start of production of each of the fuels small hand blends were first made since the compositions of some of the available refinery blendstocks had changed since the original handblends were made during the modeling efforts For some fuels this required several iterations to come close to meeting the target properties Analyses of the physical and chemical properties of the final commercial blends are presented in the next section
Table 21
Target and Measured Properties of Hand Blends of Optimized Fuel Blends
Fuel
Target Property Measured Property
Arom Vol
n‐Par Vol
RON Sens Arom Vol
n‐Par Vol
RON Sens
1 5 5 70 2 16 99 727 09
4 35 5 70 2
7 5 25 70 2 42 208 660 03
10 35 25 70 2 266 231 764 42
13 5 5 70 10 15 123 789 12
16 35 5 70 10
19 5 25 70 10
22 35 25 70 10
2 5 5 85 2 13 66 861 07
5 35 5 85 2 264 93 935 73
8 5 25 85 2 31 244 835 13
11 35 25 85 2 262 280 846 55
14 5 5 85 10 88 74 886 66
17 35 5 85 10 311 131 863 60
20 5 25 85 10 112 194 856 32
23 35 25 85 10 337 210 863 75
3 5 5 95 2 46 81 953 35
6 35 5 95 2 262 65 987 86
9 5 25 95 2 125 172 915 39
12 35 25 95 2 271 197 940 70
15 5 5 95 10 87 41 948 86
18 35 5 95 10 313 37 971 103
21 5 25 95 10 88 143 924 65
24 35 25 95 10 325 205 915 77
‐ Not blended because model‐predicted properties differed too significantly from target properties
5
Table 22
Target Fuel Parameters for Final Fuel Set
Final FACE Gasoline Designation
Initial Fuel Number
Aromatics Vol
n‐Paraffins
Vol
RON
Sensitivity
A 2 5 5 85 Low (le2)
B 3 5 5 95 Low (le2)
C 8 5 25 85 Low (le2)
D 12 35 25 95 Low (le2)
E 14 5 5 85 High (asymp10)
F 15 5 5 95 High (asymp10)
G 18 35 5 95 High (asymp10)
H 23 35 25 85 High (asymp10)
I 1 5 5 70 Low (le2)
J 10 35 25 70 Low (le2)
6
7
3 ANALYTICAL RESULTS FOR FACE GASOLINES
In this section results of the analyses of the physical and chemical properties of the first commercial
batches of each of the FACE Gasolines are discussed Chevron Phillips 66 BP and a contract laboratory
conducted the analyses Also included are the data provided on the CPChem Certificates of Analyses
(COAs) Note that future production runs that would be required to remake fuels that sell out likely will
result in some changes to the fuel property values reported here for the first production run
31 ASTM TEST RESULTS FOR PHYSICAL PROPERTIES
ASTM methods were used to measure the RON MON API gravity density distillation profiles RVP and
net heats of combustion of all of the FACE Gasolines The results of these analyses are summarized in
the sections below and also listed in detail in Table A1 located in Appendix A
311 RON MON and Octane Sensitivity
The ignition qualities of gasolines are typically characterized by RON and MON values RON values were
measured in CFR engines per ASTM method D2699 (4) Although the measurements were conducted in
several labs the lab‐to‐lab reproducibility was very good so only the average values are reported here
(but individual values are reported in Table A1) Bar charts of the average RON values for each fuel are
presented in Figure 31 (middle bars) Also included are the original design targets (1st bars) and the
values reported on the CPChem Certificates of Analysis (COA) (3rd bars) For most fuels the 3 values are
very close to each other (within plusmn1 unit of each other) The largest differences between measured and
target values are for fuels E H and J where the measured values are about 24‐38 units higher Fuel J is
also noteworthy because the value measured (1 lab only) is 2 units higher than the CPChem COA
Figure 31 RON Values of FACE Gasolines
850
950
850
950
850
950 950
850
700 700
839
958
843
942
874
940
965
869
700
738
835
960
847
932
875
944
968
869
703718
600
650
700
750
800
850
900
950
1000
A B C D E F G H I J
RON
Fuel
RON
Target
AVG
CPChem
8
MON values were measured in CFR engines per ASTM method D2700 (5) Although the measurements
were conducted in several labs the lab‐to‐lab reproducibility was very good so only the average values
are reported here (but individual values are reported in Table A1) Bar charts of the target measured
and CPChem COA MON values for each fuel are presented in Figure 32 The ldquotargetrdquo MON values were
determined by subtracting the target octane sensitivities from the target RON values The largest
difference between the values in this project and those reported on CPChemrsquos COA is 13 for fuel J The
largest differences between the measured and target values are for fuels D E F and H For Gasolines E
F and H the measured values are about 3‐6 units higher than target while for gasoline D the measured
values are about 6 units lower than the target
Figure 32 MON Values of FACE Gasolines
830
930
830
930
750
850 850
750
680 680
835
924
830
870
811
881
858
796
695 701
836
926
836
878
815
888
858
793
696
688
600
650
700
750
800
850
900
950
1000
A B C D E F G H I J
MON
Fuel
MON
Target
AVG
CPChem
9
Octane Sensitivity (S=RON‐MON) values are presented in the bar charts in Figure 33 The average sensitivities measured by the labs in this project are very close to those reported in CPChemrsquos COAs with the exception of Gasoline D The measured values for the three of the four high sensitivity fuels are quite a bit lower than the target value of 10 in the range of 59‐71 The exception is Gasoline G which comes close to meeting the target value Of the six low sensitivity fuels three (Gasolines A C and I) have values that meet the target value of le2 two have values that are slightly higher (Gasolines B and J) and one (Gasoline D) has a value that is significantly higher and in the range of the high sensitivity gasolines This discrepancy with Gasoline D is not surprising since it is very difficult to produce a low sensitivity fuel with a high level of aromatics which typically have high sensitivities Thus relative to the other manufactured FACE Gasolines Gasoline D should be considered a ldquohighrdquo sensitivity fuel
Figure 33 Octane Sensitivity Values of FACE Gasolines
312 Distillation Characteristics
The distillation properties of the fuels were determined by ASTM D86 (6) The D86 values obtained in
this study were very close to those reported on CPChemrsquos COAs The average of those two sources are
plotted in Figure 34 The values are also tabulated in Table A1 The temperature corresponding to a
given recovery fraction X is designated as TX (ie T90 indicates the temperature at which 90 of the
fuel has been vaporized and recovered) The initial boiling points (IBP) of all of the fuels are in a
relatively narrow range of 90‐110˚F In contrast the end boiling points (EBP) range from 253‐410˚F
Gasolines E G and H which are three of the four high sensitivity fuels have the highest EBPs Gasoline
E has a relatively steep increase in temperature of 140˚F from T90‐EBP Gasolines I and A the two fuels
having low sensitivity aromatics and n‐paraffin and low‐mid RON have the lowest EBPs Gasoline I
also has a relatively flat distillation profile from T30‐T90
100 100 100 100
04
34
13
72
63
59
107
71
05
3734
11
54
60
56
110
76
07
30
00
10
20
30
40
50
60
70
80
90
100
110
A B C D E F G H I J
Octan
e Sensitivity
Fuel
Octane Sensitivity
Target
AVG
CPChem
le2le2 le2 le2 le2 le2
‐01
10
Figure 34 ASTM D86 Distillation Curves for the FACE Gasolines
313 Reid Vapor Pressure (RVP)
The RVPs were determined using ASTM method D5191 (7) The values measured in this project were in
excellent agreement with those reported by CPChem COAs (within 01 psi) The averages of both values
are depicted in the bar charts in Figure 35 The values range from 67 to 805 psi
Figure 35 Reid Vapor Pressures of FACE Gasolines
500
1000
1500
2000
2500
3000
3500
4000
4500
0 10 20 30 40 50 60 70 80 90 100
Tempe
rature (˚ F)
Volume Distilled
D86 Distillation ‐ FACE Gasolines
A
B
C
D
E
F
G
H
I
J
805
735 745
680 670
780
725
755 760 750
0
1
2
3
4
5
6
7
8
9
A B C D E F G H I J
Reid Vap
or Pressure (p
si)
FACE Gasoline
Reid Vapor Pressure (RVP) ‐ FACE Gasolines
11
314 API Gravity and Density
The API gravities and densities of the fuels were measured using ASTM method D4052 (8) The
agreement between the values measured in this project and the values reported in the CPChem COAs
The individual values are listed in the Summary Table A1 in Appendix A The average of both values are
plotted in the bar charts in Figures 36 and 37 for API Gravity and density respectively As expected the
FACE Gasolines (D G H and J) having the highest aromatics content have the lowest API Gravities and
highest densities
Figure 36 API Gravities of FACE Gasolines
Figure 37 Densities of FACE Gasolines
7495
7135
7330
5870
6360
6860
54555580
7440
5910
0
5
10
15
20
25
30
35
40
45
50
55
60
65
70
75
80
A B C D E F G H I J
API G
ravity
FACE Gasoline
API Gravity ‐ FACE Gasolines
0685
0697
0691
0743
0725
0707
0760
0755
0697
0742
0645
065
0655
066
0665
067
0675
068
0685
069
0695
07
0705
071
0715
072
0725
073
0735
074
0745
075
0755
076
0765
077
A B C D E F G H I J
Density
(gml)
FACE Gasoline
Density ‐ FACE Gasolines
12
315 Net Heat of Combustion (NHC)
Net Heats of Combustion were measured using ASTM method D240 (9) The values are depicted in the
bar charts in Figure 38 In addition for two of the FACE Gasolines (C and J) the values were also
measured using ASTM method D4809 (10) The D4809 values were very close to those obtained from
method D240 (within 100 BTUlb) TheD240 values range from 18602 to 19251 BTUlb As expected
the FACE Gasolines having the highest aromatics content (D G H and J) have the lowest net heat of
combustion The FACE Gasolines having saturates content gt90 (A B C and I) have the highest net
heat of combustion
Figure 38 ASTM D240 Net Heats of Combustion of FACE Gasolines
19251
19187
19257
18649
18884
19072
1860218625
19225
18731
18200
18400
18600
18800
19000
19200
19400
A B C D E F G H I J
Net Heat o
f Com
bustion (BTU
lb) (A
STM D240)
FACE Gasoline
Net Heat of Combustion ‐ FACE Gasolines
13
32 CHEMICAL PROPERTIES OF FACE GASOLINES
The various types of hydrocarbons in the fuels were characterized by several techniques including
supercritical fluid chromatography (SFC) and detailed hydrocarbon analysis (DHA) by gas
chromatography using a flame ionization detector (GC‐FID) In addition the carbon hydrogen and
sulfur contents were measured Results are reported in the following sections
321 Aromatics by Supercritical Fluid Chromatography (SFC)
The SFC method of ASTM D5186 (11) separates the hydrocarbons into three fractions monoaromatics
polyaromatics and non‐aromatics and characterizes the composition in terms of mass Bar graphs of
the results are presented in Figure 39 Samples of FACE Gasolines B D E G and H were analyzed by
two labs The results from the two labs were very close to each other and so the averages are depicted
in the figure FACE Gasolines A B C and I have nonromatics levels gt90 wt FACE Gasolines D G and
H have the highest amounts of monoaromatics with values ranging from 394‐420 wt FACE
Gasolines E G and H appear to have about 1 wt polyaromatics
Figure 39 Compositions of FACE Gasolines by Supercritical Fluid Chromatography (ASTM D5186)
070 790 600
4175
14001000
39404200
040
3870
015
100
110125
030
9930
9210 9400
5810
85009000
59505675
9960
6100
0
10
20
30
40
50
60
70
80
90
100
A B C D E F G H I J
Composition (Wt )
FACE GASOLINE
SFC Composition ‐ FACE Gasolines
MonoAromatics PolyAromatics NonAromatics
14
322 Hydrocarbons by Detailed Hydrocarbon Analysis (DHA)
Detailed Hydrocarbon Analyses were performed by two labs using gas chromatography with flame
ionization detectors (GC‐FID) This technique enables the determination of concentration on a species‐
by‐species basis provided that retention factors have been determined for each species in the fuel The
results from both labs were very close to each other Bubble charts of the average concentration values
(in volume ) are depicted in Figure 310 for the low sensitivity fuels and Figure 311 for the high
sensitivity fuels on a carbon number basis for the five hydrocarbon classes n‐paraffins iso‐paraffins
naphthenes aromatics and olefins
In general the low sensitivity FACE Gasolines are characterized by large amounts of low sensitivity
components such as n‐paraffins and iso‐paraffins The high sensitivity FACE Gasolines contain more high
sensitivity components such as olefins and naphthenes than the low sensitivity fuels
The total concentration of components within each of the five hydrocarbon classes were added and the
sums are reported in the bar charts in Figure 312 The n‐paraffin levels range from 225‐316 vol for
the four FACE Gasolines (C D H and J) that had targets of 25 vol For the other FACE Gasolines that
had a target level of 5 vol the n‐paraffins levels range from 44‐117 vol The aromatics levels range
from 317‐358 vol for the four FACE Gasolines (D G H and J) that had targets of 35 vol For the
other six FACE Gasolines that had a target level of 5 vol the aromatics levels range from 0‐109 vol
The C7 aromatic is toluene the C8 aromatics consist of a mix of ethylbenzene and the xylene isomers
the C9 aromatics consist of a mix of trimethylbenzenes and methylethylbenzenes and the C10 aromatics
consist of a mix of tetramethylbenzenes dimethylethylbenzenes and methylpropylbenzenes FACE
Gasoline E a high sensitivity fuel has a naphthene content of 208 vol mainly cyclopentane and
cyclohexane Three other high sensitivity fuels (F G and H) have naphthenes concentrations of about
11 vol mainly cyclopentane Those high sensitivity fuels also have the highest olefins content with
concentrations ranging from 68‐127 vol FACE Gasoline I also has 64 vol olefins The C6 olefin is
1‐hexene The C5 olefins consist of a mix of 2‐pentene and methyl butenes In contrast to the high
sensitivity fuels Gasoline D which was designed to be low sensitivity but ended up in the high
sensitivity range has essentially no naphthenes or olefins Its high sensitivity is derived from its high
aromatics content
The C5 isoparaffin in all of the fuels is 2‐methylbutane The C6 isoparaffins consist of a mix of 2‐ and 3‐
methyl pentanes and 23 dimethyl butane The C7 isoparaffins in most of the FACE Gasolines consist of a
mix of 2‐ and 3‐methyl hexanes and 23‐ and 24‐dimethylpentanes The C8 isoparaffins are
predominantly trimethylpentanes with more than 50 of those being isooctane (224
trimethylpentane) The other isomers are mainly 24‐ and 25 dimethylhexanes and 2‐methyl 3‐ethyl
pentane
15
Figure 310 Detailed Hydrocarbon Analyses of Low Sensitivity FACE Gasolines
122 44 219 451 11
48 65
065
3 4 5 6 7 8 9 10 11
Carbon Number
FACE Gasoline A ‐ Detailed Hydrocarbon Analysis (vol)
isoparaffins
n‐paraffins
cycloparaffins
aromatics
olefins
104 13 137 587 16
59
39 37
3 4 5 6 7 8 9 10 11
Carbon Number
FACE Gasoline B ‐ Detailed Hydrocarbon Analysis (vol)
isoparaffins
cycloparaffins
aromatics
olefins
n‐paraffins
64 27 117 468 20 075
30 06
31 118 100
3 4 5 6 7 8 9 10 11
Carbon Number
FACE Gasoline C ‐ Detailed Hydrocarbon Analysis (vol)
isoparaffins
cycloparaffins
aromatics
olefins
n‐paraffins
12 410
99 35 150 46
47 114 70
3 4 5 6 7 8 9 10 11
Carbon Number
FACE Gasoline D ‐ Detailed Hydrocarbon Analysis (vol)
isoparaffins
cycloparaffins
aromatics
olefins
n‐paraffins
41 34 99 321 236 11
07 135
24
11
59
3 4 5 6 7 8 9 10 11
Carbon Number
FACE Gasoline I ‐ Detailed Hydrocarbon Analysis (vol)
isoparaffins
n‐paraffins
cycloparaffins
aromatics
olefins
327
90 124 95
22
14 131 145 29
06
3 4 5 6 7 8 9 10 11
Carbon Number
FACE Gasoline J ‐ Detailed Hydrocarbon Analysis (vol)
isoparaffins
n‐paraffins
cycloparaffins
aromatics
olefins
16
Figure 311 Detailed Hydrocarbon Analyses of High Sensitivity FACE Gasolines
64 68 143 165 18 07
70 105 19 10 04
46 17 18 16 08
21 82 09
29 06 37
3 4 5 6 7 8 9 10 11
Carbon Number
FACE Gasoline E ‐ Detailed Hydrocarbon Analysis (vol)
isoparaffins
cycloparaffins
aromatics
olefins
n‐paraffins
82 64 134 378 14
21 21
100
76
89
3 4 5 6 7 8 9 10 11
Carbon Number
FACE Gasoline F ‐ Detailed Hydrocarbon Analysis (vol)
isoparaffins
n‐paraffins
cycloparaffins
aromatics
olefins
65 66 72 152 16 10
74 09 16 10
15 33 218 54 14
36 25 10
37 07 10
3 4 5 6 7 8 9 10 11
Carbon Number
FACE Gasoline G ‐ Detailed Hydrocarbon Analysis (vol)
isoparaffins
cycloparaffins
aromatics
olefins
n‐paraffins
28 54 71 39 22 09
66 08 17 10
10 95 117 83 43 14
29 21 09
54 05 145 08
3 4 5 6 7 8 9 10 11
Carbon Number
FACE Gasoline H ‐ Detailed Hydrocarbon Analysis (vol)
isoparaffins
cycloparaffins
aromatics
olefins
n‐paraffins
17
Figure 312 Detailed Hydrocarbon Analyses Comparisons of FACE Gasolines
A comparison of the composition results from the DHA and SFC methods is presented in Figure 313 for
the low sensitivity fuels and Figure 314 for the high sensitivity fuels Also included are Fluorescent
Indicator Absorption (FIA ndash ASTM D1319 (12)) composition results reported on the CPChem COAs Since
the FIA method determines total saturates the DHA results for n‐paraffins iso‐paraffins and
naphthenes must be added together to enable the comparison between those two methods Similarly
since the SFC method directly measures aromatics and total non‐aromatics are determined by
difference the olefins amount must be added to the total saturate levels from FIA and DHA to enable
comparisons with the non‐aromatics values from SFC The appropriate comparison categories are
indicated by dashed lines in Figures 313 and 314 Of the three methods SFC generally gives the
highest level of aromatics and FIA the lowest The DHA aromatics values are closer to the FIA levels than
to the SFC levels The DHA olefins are fairly close to the FIA results
117
80
244 241
7944 67
225144
316
860
859
697
421
459
676
384
228
745336
16
01
01208
110
115105
33
23
13
127
94
8168
64
06
58 39
334
10977
336 358
12
317
0
10
20
30
40
50
60
70
80
90
100
A B C D E F G H I J
Composition ( vol)
FACE GASOLINE
DHA Composition ‐ FACE Gasolines
n‐paraffins isoparaffins naphthenes olefins aromatics
18
Figure 313 Comparison of Composition Methods FACE Low Sensitivity Gasolines
Figure 314 Comparison of Composition Methods FACE High Sensitivity Gasolines
117
80
244
144
316
860 859
697
745336
16
01 0433
23
13 64
06
58 3912
317
996951 975
929
712
04
07 04 62
10
42 21 09
278
993
921 940996
610
07
79 6004
390
0
10
20
30
40
50
60
70
80
90
100
DHA FIA SFC DHA FIA SFC DHA FIA SFC DHA FIA SFC DHA FIA SFC
Composition ( )
FACE GASOLINE
Composition ‐ Low Sensitivity FACE Gasolines
n‐paraffins isoparaffins naphthenes olefins aromatics saturates nonaromatics
A B C I J
241
7944 67
225
421
459
676
384
228
01
208
110
115 105
127
94
81 68
334
10977
336 358
701
780
856
587 568
04
99
86
7879
295
12158
335 353
581
850900
595568
419
150100
405432
0
10
20
30
40
50
60
70
80
90
100
DHA FIA SFC DHA FIA SFC DHA FIA SFC DHA FIA SFC DHA FIA SFC
Composition ( )
FACE GASOLINE
Composition ‐ High Sensitivity FACE Gasolines
n‐paraffins isoparaffins naphthenes olefins aromatics saturates nonaromatics
D E F G H
19
323 Elemental Analyses
Carbon and hydrogen contents were measured by two labs using ASTM method D5291 (13) The
average results are presented in the bar graphs in figure 315 The carbon contents range from 8399‐
8748 wt and the hydrogen contents range from1252‐1601 wt As expected the FACE Gasolines
having the highest aromatics content (D G H and J) have the highest carbon and lowest hydrogen
contents
Figure 315 Carbon and Hydrogen Elemental Analyses of FACE Gasolines
8399 8443 8453 8646 8547 8496 8670 87488414 8624
1601 1557 1547 1354 1453 1504 1330 12521586 1376
0
10
20
30
40
50
60
70
80
90
100
A B C D E F G H I J
Compo
sition
(wt)
FACE Gasoline
Carbon‐Hydrogen Elemental Analyses
Hydrogen
Carbon
20
Sulfur content was measured by one lab ASTM method D5453 (14) The results displayed in the bar
charts in Figure 316 are essentially identical to the values reported on the CPChem COAs All FACE
Gasolines had ultra‐low sulfur levels FACE Gasolines E G and H had the highest levels at 21 22 and 15
ppm sulfur The other fuels had levels ranging from 2‐6 ppm
Figure 316 Sulfur Levels of FACE Gasolines
6
4 4
2
21
2
22
15
2 2
0
5
10
15
20
25
A B C D E F G H I J
Sulfur Content (p
pm)
FACE Gasoline
Sulfur Content ‐ FACE Gasolines
21
4 ANALYTICAL RESULTS FOR FACE GASOLINES BLENDED WITH ETHANOL
Although the FACE Gasolines were not formulated with ethanol the expectation is that some potential
users will be interested in testing the fuels with ethanol added To assist selection of fuels for those
studies four FACE Gasolines were selected for blending with levels of 10 15 and 30 vol ethanol The
fuels selected for this purpose were A B C and H The positions of these fuels in the design matrix are
shown below
In this section results of the analyses of the ethanol blends are discussed Chevron Phillips 66 BP and
a contract laboratory conducted the analyses As mentioned previously future production runs that are
required to remake fuels that sell out likely will results in some changes to the fuel property values
reported here
41 ASTM TEST RESULTS
ASTM methods were used to measure the ethanol content RON MON API gravity density distillation
profiles RVP and net heats of combustion of all of the ethanol blends made with the FACE Gasolines
The results of these analyses are summarized below and in Table A2 located in the Appendix
411 Ethanol Content
FACE Gasolines A B C and H were blended with nominally 10 15 and 30 vol ethanol The
concentration of ethanol in each blend were determined using ASTM method D5599 (15) (coupled with
ASTM D4052 density measurement) and by detailed hydrocarbon analysis using gas chromatography
with a flame ionization detector The results for both methods were in excellent agreement for all fuels
as shown below in Table 41
Table 41 Measured Ethanol Content of FACE Gasoline Blends
Ethanol Content (vol)
A B C H
10 15 30 10 15 30 10 15 30 10 15 30
D5599 101 147 299 100 147 302 102 146 295 102 146 303
DHA 100 146 301 100 148 301 103 148 299 102 147 304
22
412 RON MON and Octane Sensitivity
RON values were measured in CFR engines per ASTM method D2699 (4) Although the measurements
were conducted in four labs the lab‐to‐lab reproducibility was very good so only the average values are
reported here (but individual values are reported in Table A2) Average RON values for each fuel are
presented in Figure 41 For all four of these FACE Gasolines the RON values continue to increase even
at the 30 ethanol level although the rates of increase are lower than at lower ethanol levels FACE
Gasoline B has the highest RON at all ethanol levels with a value of about 106 at the 30 ethanol level
FACE Gasolines A and C have essentially the same RON values at all ethanol levels with RON values of
about 102 at the 30 ethanol level FACE Gasoline H without ethanol has a higher RON than A and C
but a lower RON at the 15 and 30 ethanol levels
Figure 41 RON Values of FACE Gasoline Blends with Ethanol
MON values were measured in CFR engines per ASTM method D2700 (5) Although the measurements were conducted in four labs the lab‐to‐lab reproducibility was very good so only the average values are reported here (but individual values are reported in Appendix A2) The MON values for each fuel are
presented in Figure 42 FACE Gasoline B has the highest MON values at all ethanol levels but unlike the other FACE Gasolines the MON value did not increase with ethanol contents above 10 vol The MON values for FACE Gasolines A and C were essentially the same and higher than those for FACE Gasoline H
80081082083084085086087088089090091092093094095096097098099010001010102010301040105010601070108010901100
0 5 10 15 20 25 30 35
RON
Ethanol (vol)
RON Values ‐ FACE Gasoline + Ethanol Blends
FACE A
FACE B
FACE H
FACE C
23
Figure 42 MON Values of FACE Gasoline Blends with Ethanol
Octane Sensitivity (S=RON‐MON) values are presented in Figure 43 As expected due to the relatively high sensitivity of ethanol the sensitivities of all four FACE Gasolines increase as the ethanol content increases FACE Gasoline H has the highest sensitivity at all ethanol levels except at 30 vol ethanol where the sensitivity of the FACE Gasoline B blend becomes slightly higher with values of 124 and 132 respectively The sensitivities for FACE Gasolines A and C are very similar to each other and although lower than the blends for the other FACE Gasolines have the highest rates of increase at the 30 level
Figure 43 Octane Sensitivities FACE Gasoline Blends with Ethanol
750
760
770
780
790
800
810
820
830
840
850
860
870
880
890
900
910
920
930
940
950
0 5 10 15 20 25 30 35
MON
Ethanol (vol)
MON Values ‐ FACE Gasoline + Ethanol Blends
FACE A
FACE B
FACE H
FACE C
00
10
20
30
40
50
60
70
80
90
100
110
120
130
140
0 5 10 15 20 25 30 35
S
Ethanol (vol)
Octane Sensitivity (S) ‐ FACE Gasoline + Ethanol Blends
FACE A
FACE B
FACE H
FACE C
24
413 Distillation Characteristics
The distillation properties of the fuels were determined by ASTM D86 (6) The values are plotted in
Figure 44 and tabulated in Table A2 in the Appendix The behavior and shapes of the curves are very
similar For a given gasoline all of the ethanol blends start at about the same IBP The blends
containing ethanol then follow the same curve which is lower than the base gasoline At a certain point
the ethanol blends then rise quickly to rejoin the distillation curve of the base gasoline The lower the
ethanol content of the blend the earlier (lower distilled volume ) the curve rejoins the base gasoline
curve
Figure 44 ASTM D86 Distillation Profiles for FACE Gasoline Blends with Ethanol
50
100
150
200
250
300
0 10 20 30 40 50 60 70 80 90 100
Temperature (˚ C)
Volume Distilled
D86 Distillation ‐ FACE A Gasoline + Ethanol Blends
0 EtOH
10 EtOH
15 EtOH
30 EtOH
50
100
150
200
250
300
0 10 20 30 40 50 60 70 80 90 100
Temperature (˚ C)
Volume Distilled
D86 Distillation ‐ FACE B Gasoline + Ethanol Blends
0 EtOH
10 EtOH
15 EtOH
30 EtOH
50
100
150
200
250
300
350
0 10 20 30 40 50 60 70 80 90 100
Temperature (˚ C)
Volume Distilled
D86 Distillation ‐ FACE C Gasoline + Ethanol Blends
0 EtOH
10 EtOH
15 EtOH
30 EtOH
50
100
150
200
250
300
350
400
450
0 10 20 30 40 50 60 70 80 90 100
Temperature (˚ C)
Volume Distilled
D86 Distillation ‐ FACE H Gasoline + Ethanol Blends
0 EtOH
10 EtOH
15 EtOH
30 EtOH
25
414 Reid Vapor Pressure (RVP)
The RVPs were determined using ASTM method D5191 (7) The values are plotted in Figure 45 For all
fuels the RVP appears to peak between 10 and 15 vol ethanol and then starts to decrease as the
ethanol content increases further
Figure 45 Reid Vapor Pressures for FACE Gasoline Blends with Ethanol
415 API Gravity and Density
The API gravities and densities of the fuels were measured by two labs using ASTM method D4052 (8) The values from the two labs were in excellent agreement and are listed in Table A2 The average density values are presented in Figure 46 For all of the FACE Gasolines the density increased as the ethanol content increased
Figure 46 Densities of FACE Gasoline Blends with Ethanol
7
75
8
85
9
95
10
0 5 10 15 20 25 30 35
RVP (psi)
Ethanol (vol)
Reid Vapor Pressure (RVP) ‐ FACE Gasoline + Ethanol Blends
FACE A
FACE B
FACE H
FACE C
0685 0697 0691
0759
0696 0705 0699
0761
0700 0710 0704
0763
0716 0724 0719
0768
0
01
02
03
04
05
06
07
08
09
1
A B C H
Density
(gm
l)
Ethanol (vol)
Density ‐ FACE Gasoline Blends with Ethanol
0
10
15
30
26
416 Net Heat of Combustion (NHC)
Net Heats of Combustion were measured by 2 labs using ASTM method D240 (9) For some fuels ASTM
method D4809 (10) was also used The values from both labs and both methods were very close to each
other and the average values are plotted in Figure 47 As expected since the net heat of combustion of
ethanol is lower than that of gasoline for all FACE Gasolines the net heat of combustion decreased as
ethanol content increased The decrease appeared to be linear with ethanol content The decrease
appeared to be steepest for FACE Gasoline B
Figure 47 Net Heat of Combustion of FACE Gasoline Blends with Ethanol
16000
16250
16500
16750
17000
17250
17500
17750
18000
18250
18500
18750
19000
19250
19500
0 5 10 15 20 25 30 35
Net Heat of C
ombustion (B
TUlb)
Ethanol (vol)
Net Heat of Combustion ‐ FACE Gasoline + Ethanol Blends
FACE A
FACE B
FACE H
FACE C
27
5 SUMMARY AND CONCLUSIONS
A subteam of the CRC AVFL FACE Working Group has designed a matrix of reference gasolines
known as the FACE Gasolines A commercial vendor has produced and made the fuels available
for purchase in research quantities It is expected that this will enable consistent comparisons
of engine and combustion results from different laboratories and test platforms based on the
use of the same set of fuels
The matrix is designed around four parameters expected to be of importance for advanced
gasoline engines RON octane sensitivity aromatics content and n‐paraffins content
Statistical methods were used to identify potential candidate formulations and down‐select to a
tractable number of 10 formulations
Detailed analyses were performed on the physical and chemical properties of the final fuel
formulations
Generally the property values measured in the current study agreed very well with the values
reported on the fuel blender (ChevronPhillips Chemical Company ‐ CPChem) Certificates of
Analyses (COAs)
As expected conflicts in the target properties for some of the fuels (such as high aromatics level
coupled with low octane sensitivity) led to some trade‐offs that resulted in some deviation in
the actual properties from the design properties
The RON values come close to meeting the targets for most of the fuels Fuels E H and J have
values that are 24‐38 units higher than the targets
Three of the four ldquohighrdquo sensitivity fuels have measured values of 59‐71 that are lower than
the target value of 10 Two of the ldquolowrdquo sensitivity fuels have measured values (34‐37) that are
a bit higher than the target value of le2 One of the low sensitivity design fuels (ldquoDrdquo) has a value
of 72 that actually effectively makes it a high sensitivity fuel
Detailed hydrocarbon analyses (DHA) indicate that the n‐paraffins contents range from 225‐
316 vol for the four FACE Gasolines that had targets of 25 vol and from 44‐117 vol for
the six FACE Gasolines that had targets of 5 vol
DHAs indicate that the aromatics contents range from 317‐358 vol for the four FACE
Gasolines that had a target of 35 vol and 0‐109 vol for the other fuels that had a target of 5
vol
The high sensitivity fuels contained the high sensitivity components of naphthenes (105‐208
vol) and olefins (68‐127 vol) The exception was Gasoline ldquoDrdquo which had neither of these
components but whose high sensitivity was derived from aromatics components
Five of the FACE Gasolines (ldquoArdquo ldquoBrdquo ldquoCrdquo ldquoFrdquo and ldquoIrdquo) are very rich in isoparaffins with contents ge
676 vol
Aromatics values determined by SFC were generally higher than the values obtained from DHA
The DHA olefins values were close to the FIA values reported on the CPChem COAs
The fuels having the highest aromatics content also have the highest densities and highest net
heats of combustion on an energy content per volume basis
With regards to distillation properties for all fuels the initial boiling points (IBPs) are in a
narrow range of 90‐110˚F although the end boiling points (EBPs) range from 253‐410˚F Three
28
of the high sensitivity fuels have the highest EBPs The two low‐mid RON fuels having low n‐
paraffins and low aromatics have the lowest EBPs
All of the FACE Gasolines have ultra‐low levels of sulfur with the highest value at 22 ppm S and
most fuels having le 6 ppm S
For the four FACE Gasolines blended with ethanol RON continues to increase as the ethanol
levels increase to 30 vol although the rate of increase is lower as the ethanol content
increases FACE Gasoline B which has the highest RON of 96 has the highest RON at all ethanol
levels with a value of about 106 at 30 ethanol At the same ethanol level FACE Gasolines A
and C have essentially the same RON values FACE Gasoline H starts with a higher RON value
than those of A or C but has a lower value at blend levels of 15 and 30 vol
MON increased as the ethanol level increased for FACE Gasolines A C and H The MON values
for these fuels were essentially constant even though the highest MON values were found for
the ethanol blends with FACE Gasoline B
For all blends octane sensitivity increased as ethanol content increased with the highest values
of 12‐13 for 30 vol ethanol blends with FACE Gasolines B and H
The D86 distillation curve trends are similar for the four FACE Gasolines For a given gasoline all
blends start at the same point At around 10 vol distilled the curves for the blends with
ethanol diverge from and are lower than the curves for the base gasolines At a certain point
the distillation curves for the blends rise quickly and re‐join the curve for the parent base fuel
The distillation curves for the 30 vol ethanol blends are generally flat as a function of
increasing vol distilled and only start to increase again at about 70‐80 vol distilled when
most of the ethanol has been distilled from the liquid
The Reid Vapor Pressures (RVPs) peak at about 10‐15 vol
Densities increase slightly as ethanol increases while net heats of combustion decrease
29
6 REFERENCES
1 Alnajjar M Cannella B Dettman H Fairbridge C Franz J Gallant T Gieleciak R Hager D Lay C Lewis S Ratcliff M Sluder S Storey J Yin H Zigler B ldquoChemical and Physical Properties of the Fuels for Advanced Combustion Engines (FACE) Research Diesel Fuelsrdquo CRC Report No FACE‐1 (2010)
2 Gallant T Franz J Alnajjar M Storey J Lewis S Sluder S Cannella W Fairbridge C Hager D Dettman H Luecke J Ratcliff M Zigler ldquoFuels for Advanced Combustion Engines Research Diesel Fuels Analysis of Physical and Chemical Propertiesrdquo SAE Paper 2009‐01‐2769 (2009)
3 CannellaW Fairbridge C Arboleda P Bays T Dettman H Foster M Gieleciak R Gunter G Hager D Lay C Lewis S Luecke J Sluder S Zigler B ldquoDetailed Characterization of the Physical and Chemical Properties of the Reformulated FACE Diesel Fuels FD2B FD4B and FD7Brdquo CRC Report AVFL‐19‐1 (2013)
4 ASTM International Standard Test Method for Research Octane Number of Spark‐Ignition Engine Fuel ASTM D2699 (ASTM International Pennsylvania 2009)
5 ASTM International Standard Test Method for Motor Octane Number of Spark‐Ignition Engine Fuel ASTM D2700 (ASTM International Pennsylvania 2009)
6 ASTM International Standard Test Method for Distillation of Petroleum Products at Atmospheric Pressure ASTM D86‐09e1 (ASTM International Pennsylvania 2009)
7 ASTM International Standard Test Method for Vapor Pressure of Petroleum Products (Mini‐Method) ASTM D5191 (ASTM International Pennsylvania 2009)
8 ASTM International Standard Test Method for Density and Relative Density of Liquids by Digital Density Meter ASTM D4052‐96(2002)e1 (ASTM International Pennsylvania 2002)
9 ASTM International Standard Test Method for Heat of Combustion of Liquid Hydrocarbon Fuels by Bomb Calorimeter ASTM D240‐02(2007) (ASTM International Pennsylvania 2007)
10 ASTM International Standard Test Method for Heat of Combustion of Liquid Hydrocarbon Fuels by Bomb Calorimeter ASTM D4809 (2007) (ASTM International Pennsylvania 2007)
11 ASTM International Standard Test Method for Determination of Aromatic Content and Polynuclear Aromatic Content of Diesel Fuels and Aviation Turbine Fuels by Supercritical Fluid Chromatography ASTM D5186‐03(2009) (ASTM International Pennsylvania 2009)
12 ASTM International Standard Test Method for Hydrocarbon Types in Liquid Petroleum Products by Fluorescent Indicator Adsorption ASTM D1319‐08 (ASTM International Pennsylvania 2008)
13 ASTM International Standard Test Methods for Instrumental Determination of Carbon Hydrogen and Nitrogen in Petroleum Products and Lubricants ASTM D5291‐02(2007) (ASTM International Pennsylvania 2007)
14 ASTM International Standard Test Methods for Determination of Total Sulfur in Light Hydrocarbons Spark‐Ignition Engine Fuel Diesel Engine Fuel and Engine Oil by Ultraviolet Fluorescence ASTM D5453(2007) (ASTM International Pennsylvania 2007)
15 ASTM International Standard Test Methods for Determination of Oxygenates in Gasoline by Gas Chromatography and Oxygen Selective Flame Ionization Detection ASTM D5599 (2007) (ASTM International Pennsylvania 2007)
30
31
Appendix A
Properties of FACE Gasolines
32
Table A1 Summary Data for FACE Gasolines
Specific Tests FACE Gasoline A B C D E F G H I J Research Octane Number (RON) (ASTM D2699) -Lab 1 843 958 850 946 871 940 969 870 700 738 -Lab 2 839 960 840 939 877 960 869 -Lab 3 835 957 840 -Average 839 958 843 942 874 940 965 869 7015 738 -CPChem COA 835 960 847 932 875 944 968 869 703 718 Motor Octane Number (MON) (ASTM D2700) -Lab 1 836 923 830 872 813 881 857 797 695 701 -Lab 2 833 931 830 868 808 860 799 -Lab 3 835 919 829 -Average 835 924 830 870 811 881 858 798 695 701 -CPChem COA 836 926 836 878 815 888 858 793 696 688 Sensitivity (RON-MON) -Lab 1 07 35 20 74 58 59 112 73 05 37 -Lab 2 06 29 10 71 69 100 70 -Lab 3 0 38 11 -Average 04 34 13 72 63 59 107 72 05 37 -CPChem COA -01 34 11 54 60 56 110 76 07 30 API Gravity (API˚) (ASTM D4052) -CPChem COA 750 714 734 587 636 686 545 568 744 595 -Lab 1 749 713 732 587 636 686 546 548 744 587 -Average 7495 7135 733 587 636 686 5455 558 744 591 Density (ASTM D4052) -CPChem COA 0691 0743 0725 0707 0760 0697 0741 -Lab 1 0685 0697 0691 0743 0725 0707 0760 0759 0697 0743 -Average 0685 0697 0691 0743 0725 0707 0760 0759 0697 0742 RVP (psi) (D5191) -CPChem COA 81 74 74 68 67 78 72 75 75 75 -Lab 1 80 73 75 73 76 77 Net Heat of Combustion (BTUlb) (ASTM D4809) 19186 18680 Net Heat of Combustion (BTUlb) (ASTM D240) 19251 19187 19257 18649 18884 19072 18602 18625 19225 18731
33
TableA1 Summary Data for FACE Gasolines
Specific Tests FACE Gasoline A B C D E F G H I J Distillation (˚F) (ASTM D86) -CPChem IBP 93 95 95 88 110 108 93 94 100 101
5 104 128 120 129 131 129 122 123 123 111 10 132 145 136 148 142 142 135 140 156 162 20 160 172 154 176 155 156 158 168 177 206 30 183 194 171 198 166 168 183 192 186 217 40 197 207 187 212 177 180 210 211 191 224 50 203 213 200 221 186 193 240 227 195 231 60 207 216 210 229 197 206 270 242 199 242 70 210 220 218 235 208 217 306 262 203 261 80 213 225 226 280 222 225 328 291 207 291 90 219 235 243 330 267 240 343 327 213 316 95 227 248 270 340 343 261 363 358 220 330 FBP 269 283 328 363 405 294 403 410 259 358
-Lab 1 IBP 90 97 93 97 107 102 99 98 99 95 5 122 133 126 133 134 134 122 127 139 111
10 140 149 139 151 143 144 136 143 160 166 20 165 175 157 179 156 157 158 170 178 209 30 186 196 174 200 168 169 182 194 187 219 40 198 209 188 214 177 182 209 213 192 225 50 204 214 201 224 188 195 238 229 196 232 60 207 218 210 234 197 207 268 243 200 242 70 210 221 218 248 208 218 304 263 204 263 80 213 226 227 288 224 228 328 291 208 292
90 219 236 245 331 258 243 343 329 213 316 95 228 248 274 341 329 261 358 357 220 330 FBP 262 280 330 365 402 291 405 408 247 357
-Average IBP 915 96 94 925 1085 105 96 96 995 98 5 113 1305 123 131 1325 1315 122 125 131 111
10 136 147 1375 1495 1425 143 1355 1415 158 164 20 1625 1735 1555 1775 1555 1565 158 169 1775 203 30 1845 195 1725 199 167 1685 1825 193 1865 218 40 1975 208 1875 213 177 181 2095 212 1915 2245 50 2035 2135 2005 2225 187 194 239 228 1955 2315 60 207 217 210 2315 197 2065 269 2425 1995 242 70 210 2205 218 2415 208 2175 305 2625 2035 262 80 213 2255 2265 284 223 2265 328 291 2075 2915
90 219 2355 244 3305 2625 2415 343 328 213 316 95 2275 248 272 3405 336 261 3605 3575 220 330 FBP 2655 2815 329 364 4035 2925 404 409 253 3575
34
Table A1 Summary Data for FACE Gasolines
Specific Tests FACE Gasoline A B C D E F G H I J Elemental Analysis (ASTM D 5291) -Carbon (wt) -Lab 1 8398 8441 8497 8647 8547 8671 8792 8415 -Lab 4 8400 8444 8419 8645 8547 8496 8669 8703 8414 8624 -Average 8399 8443 8458 8646 8547 8496 8670 8748 8414 8624 -Hydrogen (wt) -Lab 1 1602 1559 1503 1353 1453 1329 1208 1585 -Lab 4 1600 1556 1585 1355 1453 1504 1331 1297 1586 1376 -Average 1601 1557 1547 1354 1453 1504 1330 1252 1586 1376 Sulfur by UV Fluorescence (ppmw) (ASTM D5453) -CPChem COA 4 4 3 2 21 2 20 15 2 2 -Lab 4 6 4 4 2 21 2 22 15 2 2 Hydrocarbons by FIA (vol) (ASTM D1319) -Aromatics (vol) CPChem COA 0 42 21 295 121 58 335 353 09 278 -Olefins (vol) CPChem COA 04 07 04 04 99 86 78 79 62 10 -Saturates (vol) CPChem COA 996 951 975 701 780 856 587 568 929 712 Aromatics by SFC (ASTM D5186) (Lab 1) -MonoAromatics (wt) -Lab 1 07 78 60 414 142 100 393 412 04 387 -Lab 2 80 421 138 395 428 -Average 07 79 60 4175 140 100 394 420 04 387 -PolyAromatics (wt) -Lab 1 0 0 0 03 11 0 10 10 0 03 -Lab 2 0 0 09 12 15 -Average 0 0 0 015 10 0 11 125 0 03 -NonAromatics (wt) -Lab 1 993 922 940 583 847 900 597 578 996 610 -Lab 2 920 579 850 593 557 -Average 993 921 940 581 8475 900 595 5675 996 610
35
Table A1 Summary Data for FACE Gasolines
Specific Tests FACE Gasolines A B C D E F G H I J Detailed Hydrocarbon Analyses by GC-FID -n-paraffins (vol) (Targets) (5) (5) (25) (25) (5) (5) (5) (25) (5) (25) -Lab 1 1144 783 2409 2346 771 434 662 2214 1441 3115 -Lab 2 1187 815 2476 2473 803 446 685 2283 1437 3212 -Average 1165 799 2443 2410 787 440 673 2249 1439 3164 -iso-paraffins (vol) -Lab 1 8562 8591 688 4206 4563 6765 3821 2322 7449 3362 -Lab 2 8635 8586 7066 4221 4621 6747 3864 2240 7459 3366 -Average 8599 8688 6973 4213 4592 6756 3843 2281 7454 3364 -cyclo-paraffins (vol) -Lab 1 192 021 048 010 2216 1078 1163 1035 324 234 -Lab 2 130 007 023 010 1945 1118 1140 1066 336 224 -Average 161 014 036 010 2081 1098 1152 1050 330 229 -aromatics (vol) (Targets) (5) (5) (5) (35) (5) (5) (35) (35) (5) (35) -Lab 1 073 601 409 3425 1121 805 3419 3597 120 3212 -Lab 2 003 568 374 3258 1062 739 3306 3555 110 3125 -Average 38 584 392 3341 1092 772 3363 3576 115 3169 -olefins (vol) -Lab 1 024 001 248 004 1146 978 851 714 643 066 -Lab 2 018 003 006 005 1392 905 771 650 627 054 -Average 021 002 127 04 1269 942 811 682 635 060
36
37
Appendix B
Properties of FACE Gasoline Blends with Ethanol
38
Table B1 Summary Data for FACE Gasoline Blends with Ethanol
Specific Tests FACE Gasoline Blend A B Ethanol Content (Vol ) 0 10 15 30 0 10 15 30 Ethanol Content (Vol ) (ASTM D5599) 0 1012 1469 2990 0 995 1473 3016 Research Octane Number (RON) (ASTM D2699) -Lab 1 843 922 951 1032 958 1015 1039 1067 -Lab 2 839 923 951 1017 960 1008 1023 1050 -Lab 3 835 917 946 1025 957 1012 1031 1069 -Lab 4 916 945 1018 1009 1026 1053 -Average 839 920 948 1023 958 1011 1030 1060 Motor Octane Number (MON) (ASTM D2700) -Lab 1 836 878 890 912 923 936 936 934 -Lab 2 833 874 891 917 931 935 934 931 -Lab 3 835 881 893 911 919 933 934 933 -Lab 4 884 901 916 935 936 933 -Average 835 879 894 914 924 935 935 933 Sensitivity (RON-MON) -Lab 1 07 44 61 120 35 79 103 133 -Lab 2 06 49 60 100 29 73 89 119 -Lab 3 0 36 53 114 38 79 97 136 -Lab 4 32 44 102 74 91 120 -Average 04 41 54 109 34 76 95 127 API Gravity (API˚) (ASTM D4052) -Lab 1 749 7164 7066 661 7131 690 6772 6375 -Lab 4 716 706 660 690 676 638 -Average 749 7162 7063 6605 7131 690 6766 6377 Density (ASTM D4052) -Lab 1 06849 06959 06992 07154 0697 07050 07096 07240 -Lab 4 06966 06999 07161 07055 07106 07244 -Average 06849 06963 06996 07158 0697 07053 07101 07242 RVP (psi) (D5191) Lab 1 83 95 94 91 73 87 86 83 Net Heat of Combustion (BTUlb) (ASTM D4809) 18308 Net Heat of Combustion (BTUlb) (ASTM D240) -Lab 1 19266 18294 18080 16751 19207 18319 17941 16631 -Lab 4 19236 18208 17963 16487 19168 18307 17696 16234 -Average 19251 18251 18021 16619 19187 18313 17818 16432
39
Table B1 Summary Data for FACE Gasoline Blends with Ethanol
Specific Tests FACE Gasoline Blend C H Target Ethanol Content (Vol ) 0 10 15 30 0 10 15 30 Ethanol Content (Vol) (ASTM D5599) 0 1018 1462 2949 0 1016 1459 3034 Research Octane Number (RON) (ASTM D2699) -Lab 1 850 918 951 1012 870 919 941 993 -Lab 2 840 920 950 1014 869 927 941 996 -Lab 3 840 917 946 1019 869 920 937 995 -Lab 4 914 945 1015 916 946 991 -Average 843 917 948 1015 869 921 941 994 Motor Octane Number (MON) (ASTM D2700) -Lab 1 830 876 893 921 797 821 835 861 -Lab 2 830 868 880 924 793 820 831 885 -Lab 3 829 876 887 909 799 817 829 858 -Lab 4 881 890 914 828 839 877 -Average 830 875 888 916 796 822 833 870 Sensitivity (RON-MON) -Lab 1 20 42 58 91 73 98 106 132 -Lab 2 10 52 70 90 76 107 110 111 -Lab 3 11 41 59 110 70 103 108 137 -Lab 4 33 55 101 88 107 114 -(RON)avg ndash (MON)avg 13 42 60 99 73 99 108 124 API Gravity (API˚) (ASTM D4052) -Lab 1 732 7069 6943 6523 5481 5416 5375 5247 -Lab 4 707 693 652 544 538 527 -Average 732 707 694 652 548 543 5377 526 Density (ASTM D4052) -Lab 1 06906 06991 07035 07186 07587 07614 07631 07684 -Lab 4 06997 07043 07192 07610 07636 07678 -Average 06994 07039 07189 07587 07612 07633 07681 RVP (psi) (D5191) Lab 1 75 86 85 83 76 88 87 84 Net Heat of Combustion (BTUlb) (ASTM D4809) 19186 18198 17955 16692 16265 Net Heat of Combustion (BTUlb) (ASTM D240) -Lab 1 19257 18375 18012 16739 18675 17891 17550 16369 -Lab 4 18576 17809 17408 16322 -Average 19257 18375 18012 16739 18625 17850 17479 16345
40
Table B1 Summary Data for FACE Gasoline Blends with Ethanol
Specific Tests FACE Gasoline Blend A B Target Ethanol Content 0 10 15 30 0 10 15 30 Ethanol Content (Vol) -ASTM D5599 0 1012 1469 2990 0 995 1473 3016 -Detailed Hydrocarbon Analysis - GCFID -Lab 1 0 1000 1463 3017 0 1001 1476 3014 Elemental Analysis (ASTM D 5291) -Carbon (wt) -Lab 1 8443 8178 7941 7306 8465 8172 8029 7346 -Lab 4 8433 8085 7823 7361 8471 8110 7921 7380 -Average 8438 8131 7882 7333 8468 8141 7975 7363 -Hydrogen (wt) -Lab 1 1543 1527 1484 1446 1473 1462 1442 1387 -Lab 4 1606 1573 1548 1515 1561 1540 1525 1487 -Average 1575 1550 1516 1481 1517 1501 1483 1437 -Oxygen (wt) (ASTM D5599) Lab 4 0 400 578 1150 0 389 571 1147
Specific Tests FACE Gasoline Blend C H Target Ethanol Content 0 10 15 30 0 10 15 30 Ethanol Content (Vol) -ASTM D5599 0 1018 1462 2949 0 1016 1459 3034 -Detailed Hydrocarbon Analysis - GCFID -Lab 1 0 1027 1483 2988 0 1021 1468 3040 Elemental Analysis (ASTM D 5291) -Carbon (wt) -Lab 1 8447 8200 7998 7336 8768 8402 8401 7624 -Lab 4 8419 8077 7909 7353 8720 8316 8150 7626 -Average 8433 8138 7954 7345 8744 8359 8276 7625 -Hydrogen (wt) -Lab 1 1494 1465 1465 1405 1205 1199 1207 1218 -Lab 4 1585 1668 1523 1509 1300 1305 1292 1316 -Average 1540 1567 1494 1457 1253 1252 1250 1267 -Oxygen (wt) (ASTM D5599) Lab 4 0 401 572 1129 0 368 527 1088
Table B1 Summary Data for FACE Gasoline Blends with Ethanol
41
Specific Tests FACE Gasoline Blend A B Target Ethanol Content 0 10 15 30 0 10 15 30 Distillation (˚F) (ASTM D86) Lab 1 IBP 90 106 99 99 97 105 103 101 5 122 127 122 126 133 128 126 129 10 140 134 131 135 149 135 134 138 20 165 145 144 146 175 147 146 149 30 186 153 152 153 196 155 154 155 40 198 159 156 156 209 165 159 159 50 204 202 159 158 214 211 165 161 60 207 208 204 159 218 217 214 162 70 210 211 210 160 221 219 219 163 80 213 214 213 161 226 225 224 165 90 219 222 219 211 236 234 234 230 95 228 233 229 224 248 247 246 242 FBP 262 261 263 260 280 271 270 266
Specific Tests FACE Gasoline Blend C H Target Ethanol Content 0 10 15 30 0 10 15 30 Distillation (˚F) (ASTM D86) Lab 1 IBP 93 104 102 107 98 96 105 106 5 126 126 123 130 127 123 125 127 10 139 131 131 136 143 132 134 138 20 157 140 140 145 170 145 147 152 30 174 147 147 151 194 153 156 159 40 188 153 153 156 213 167 161 163 50 201 183 157 159 229 217 182 166 60 210 208 176 161 243 236 235 169 70 218 217 215 162 263 255 253 175 80 227 226 223 165 291 283 282 268 90 245 244 241 233 329 322 323 312 95 274 274 269 261 357 351 351 343 FBP 330 331 322 324 408 401 407 396
42

2
Although the target RON values of 70 and 85 and the octane sensitivity of 2 are lower and n‐paraffin
content of 25 vol are higher than currently found in market gasolines they appear to be potentially
relevant for emerging advanced low temperature combustion engines and so were included in this
matrix of research fuels
A commercial fuels blender (Chevron Phillips Chemical Co ndash CPChem) agreed to work with the FACE
Working Group and provide blend formulation candidates for each of the target fuels and to
manufacture and make available for sale drum quantities of the final formulations The FACE Working
Group directed that the fuel blends should consist of refinery blending streams to the maximum
possible extent but would allow a maximum of five pure compounds to be added with a maximum
concentration of 10 vol Also the olefin content was limited to a maximum of 10 vol and for safety
reasons the Reid Vapor Pressure was set at a minimum of around 7 psi The suggested variations in the
concentrations of the aromatics and n‐paraffins were plusmn2 vol The suggested variations in the RON and
octane sensitivity were plusmn 2 octane numbers It was recognized that some of the target fuel properties
would lead to conflicts for some fuels (ie high aromatics content but low sensitivity for fuel ldquoDrdquo) and
that some trade‐offs would be required leading to some of the targets not being completely met
As soon as CPChemrsquos manufacturing of the commercial batches was completed a subgroup of the FACE
Working Group set about to characterize as fully as possible the chemical and physical properties of the
FACE Gasolines and to make that information available to the advanced combustion research and
development (RampD) community to enable selection of standardized test fuels for their programs and
correlation of test results to fuel composition and properties In support of that effort standard ASTM
tests were conducted at several different laboratories to measure the following properties Research
Octane Number (RON) Motor Octane Number (MON) API gravity density RVP distillation profile net
heat of combustion elemental carbon hydrogen and sulfur and fuel composition The fuel
composition methods consisted of fluorescent indicator adsorption (FIA) supercritical fluid
chromatography (SFC) and detailed hydrocarbon analyses (DHA) by one‐dimensional gas
chromatography with a flame ionization detector (1D GC‐FID) In general the lab‐to‐lab variation in
these tests was low less than 1 of the mean Because of this good agreement in the following charts
and text generally the average values are used without error bars In addition 5‐gallon sized blends of 4
of the FACE Gasolines (A B C and H) with 10 15 and 30 vol ethanol were prepared and also
characterized
This report is organized into the following sections
bull Section 2 provides details on the statistical techniques used to design the FACE Gasolines matrix
bull Section 3 contains the results of the analyses of the FACE Gasolines
bull Section 4 discusses the results of the analyses of the FACE Gasoline blends with ethanol
bull Section 5 presents a summary and conclusions
bull Section 6 lists the references cited
bull Appendix A provides tables of the properties of the FACE Gasolines
bull Appendix B provides tables of the properties of the FACE Gasolines blended with ethanol
3
2 STATISTICAL DESIGN OF FACE GASOLINES MATRIX
As mentioned in the Introduction the FACE Gasolines matrix was designed around the following four parameters RON octane sensitivity (S) aromatics content and n‐paraffins content The target levels selected were RON 70 85 and 95
Sensitivity le2 (ldquolowrdquo) and asymp10 (ldquohighrdquo) Aromatics 5 and 35 vol n‐paraffins 5 and 25 vol A full‐factorial set of test gasolines with these target levels consists of the twentyfour fuels listed in Table 21 Bill Leppard then used information about the refinery streams and components then available to CPChem the fuels blender and their proprietary non‐linear octane blending model to develop candidate fuel formulations Each blending recipe was optimized by manually adjusting the concentrations of the blending components (blending streams and pure components) In parallel John Orban used the same information about the refinery streams properties to systematically compute all possible candidate fuel formulations using a non‐proprietary linear octane blending model In both modeling efforts the optimum recipes were determined by considering the normalized deviation between the predicted and target properties of RON sensitivity aromatics vol and n‐paraffin vol Although the two modeling efforts were conducted independently there were many interactions during the process resulting in a single set of optimum recipes CPChem then used these optimum recipes to prepare and analyze hand blends for all twentyfour possible fuels These measurements are also listed in Table 1 The FACE Working Group realized that this number of fuels was unrealistic from a manufacturing cost and testing perspective and decided to limit the total number of fuels to ten One thing to note from the table is that four of the eight possible 70 RON fuels (designated by a ldquordquo in the table) were not blended because their model‐predicted properties were too far removed from the target properties The FACE Working Group decided to select two of the four 70 RON fuels for the final matrix of ten fuels These were fuels 1 and 10 Fuel 1 was selected because it contained the lowest amount of aromatics and nearly lowest amount of n‐paraffins Fuel 10 was selected because it contained the highest amounts of aromatics and n‐paraffins The remaining eight fuels were selected from among the sixteen 85 and 95 RON candidates using the D‐ and G‐optimality efficiencies which are two of the most common statistical techniques for evaluating experimental designs The D‐optimality technique generally produces designs that yield small standard errors for the parameter estimates small correlations between the parameter estimates and small standard errors for predicted responses within the design space The G‐optimality technique usually produces similar results The use of these statistical techniques to identify the optimum set of fuels requires defining the correlation model relating a measured engine response to the selected fuel parameters Three linear models were selected which included the following parameters Model 1 ndash Response=f(RON aromatics n‐paraffins and all 1st order interactions of these three parameters) Model 2 ndash Response=f(RON sensitivity aromatics n‐paraffins and all 2‐factor interactions involving RON) and Model 3 ndash Response=f(RON sensitivity aromatics n‐paraffins and all 2‐factor interactions not involving sensitivity) For all three models the D‐ and G‐optimality efficiencies were calculated for all possible sets of eight fuels and the resulting efficiencies were rank ordered The rank orderings of the fuel sets
4
between the D‐ and G‐optimality efficiencies were virtually identical There were however slight differences in the rank orderings among the three correlation models These results were discussed with the FACE Working Group which decided to select the optimum fuel set associated with Model 2 The target properties for this fuel set are listed in Table 22 along with the final fuel designations Once the FACE Working Group decided on the final fuel properties CPChem initiated efforts to make large batches of the fuels one at a time as time and equipment availability permitted At the start of production of each of the fuels small hand blends were first made since the compositions of some of the available refinery blendstocks had changed since the original handblends were made during the modeling efforts For some fuels this required several iterations to come close to meeting the target properties Analyses of the physical and chemical properties of the final commercial blends are presented in the next section
Table 21
Target and Measured Properties of Hand Blends of Optimized Fuel Blends
Fuel
Target Property Measured Property
Arom Vol
n‐Par Vol
RON Sens Arom Vol
n‐Par Vol
RON Sens
1 5 5 70 2 16 99 727 09
4 35 5 70 2
7 5 25 70 2 42 208 660 03
10 35 25 70 2 266 231 764 42
13 5 5 70 10 15 123 789 12
16 35 5 70 10
19 5 25 70 10
22 35 25 70 10
2 5 5 85 2 13 66 861 07
5 35 5 85 2 264 93 935 73
8 5 25 85 2 31 244 835 13
11 35 25 85 2 262 280 846 55
14 5 5 85 10 88 74 886 66
17 35 5 85 10 311 131 863 60
20 5 25 85 10 112 194 856 32
23 35 25 85 10 337 210 863 75
3 5 5 95 2 46 81 953 35
6 35 5 95 2 262 65 987 86
9 5 25 95 2 125 172 915 39
12 35 25 95 2 271 197 940 70
15 5 5 95 10 87 41 948 86
18 35 5 95 10 313 37 971 103
21 5 25 95 10 88 143 924 65
24 35 25 95 10 325 205 915 77
‐ Not blended because model‐predicted properties differed too significantly from target properties
5
Table 22
Target Fuel Parameters for Final Fuel Set
Final FACE Gasoline Designation
Initial Fuel Number
Aromatics Vol
n‐Paraffins
Vol
RON
Sensitivity
A 2 5 5 85 Low (le2)
B 3 5 5 95 Low (le2)
C 8 5 25 85 Low (le2)
D 12 35 25 95 Low (le2)
E 14 5 5 85 High (asymp10)
F 15 5 5 95 High (asymp10)
G 18 35 5 95 High (asymp10)
H 23 35 25 85 High (asymp10)
I 1 5 5 70 Low (le2)
J 10 35 25 70 Low (le2)
6
7
3 ANALYTICAL RESULTS FOR FACE GASOLINES
In this section results of the analyses of the physical and chemical properties of the first commercial
batches of each of the FACE Gasolines are discussed Chevron Phillips 66 BP and a contract laboratory
conducted the analyses Also included are the data provided on the CPChem Certificates of Analyses
(COAs) Note that future production runs that would be required to remake fuels that sell out likely will
result in some changes to the fuel property values reported here for the first production run
31 ASTM TEST RESULTS FOR PHYSICAL PROPERTIES
ASTM methods were used to measure the RON MON API gravity density distillation profiles RVP and
net heats of combustion of all of the FACE Gasolines The results of these analyses are summarized in
the sections below and also listed in detail in Table A1 located in Appendix A
311 RON MON and Octane Sensitivity
The ignition qualities of gasolines are typically characterized by RON and MON values RON values were
measured in CFR engines per ASTM method D2699 (4) Although the measurements were conducted in
several labs the lab‐to‐lab reproducibility was very good so only the average values are reported here
(but individual values are reported in Table A1) Bar charts of the average RON values for each fuel are
presented in Figure 31 (middle bars) Also included are the original design targets (1st bars) and the
values reported on the CPChem Certificates of Analysis (COA) (3rd bars) For most fuels the 3 values are
very close to each other (within plusmn1 unit of each other) The largest differences between measured and
target values are for fuels E H and J where the measured values are about 24‐38 units higher Fuel J is
also noteworthy because the value measured (1 lab only) is 2 units higher than the CPChem COA
Figure 31 RON Values of FACE Gasolines
850
950
850
950
850
950 950
850
700 700
839
958
843
942
874
940
965
869
700
738
835
960
847
932
875
944
968
869
703718
600
650
700
750
800
850
900
950
1000
A B C D E F G H I J
RON
Fuel
RON
Target
AVG
CPChem
8
MON values were measured in CFR engines per ASTM method D2700 (5) Although the measurements
were conducted in several labs the lab‐to‐lab reproducibility was very good so only the average values
are reported here (but individual values are reported in Table A1) Bar charts of the target measured
and CPChem COA MON values for each fuel are presented in Figure 32 The ldquotargetrdquo MON values were
determined by subtracting the target octane sensitivities from the target RON values The largest
difference between the values in this project and those reported on CPChemrsquos COA is 13 for fuel J The
largest differences between the measured and target values are for fuels D E F and H For Gasolines E
F and H the measured values are about 3‐6 units higher than target while for gasoline D the measured
values are about 6 units lower than the target
Figure 32 MON Values of FACE Gasolines
830
930
830
930
750
850 850
750
680 680
835
924
830
870
811
881
858
796
695 701
836
926
836
878
815
888
858
793
696
688
600
650
700
750
800
850
900
950
1000
A B C D E F G H I J
MON
Fuel
MON
Target
AVG
CPChem
9
Octane Sensitivity (S=RON‐MON) values are presented in the bar charts in Figure 33 The average sensitivities measured by the labs in this project are very close to those reported in CPChemrsquos COAs with the exception of Gasoline D The measured values for the three of the four high sensitivity fuels are quite a bit lower than the target value of 10 in the range of 59‐71 The exception is Gasoline G which comes close to meeting the target value Of the six low sensitivity fuels three (Gasolines A C and I) have values that meet the target value of le2 two have values that are slightly higher (Gasolines B and J) and one (Gasoline D) has a value that is significantly higher and in the range of the high sensitivity gasolines This discrepancy with Gasoline D is not surprising since it is very difficult to produce a low sensitivity fuel with a high level of aromatics which typically have high sensitivities Thus relative to the other manufactured FACE Gasolines Gasoline D should be considered a ldquohighrdquo sensitivity fuel
Figure 33 Octane Sensitivity Values of FACE Gasolines
312 Distillation Characteristics
The distillation properties of the fuels were determined by ASTM D86 (6) The D86 values obtained in
this study were very close to those reported on CPChemrsquos COAs The average of those two sources are
plotted in Figure 34 The values are also tabulated in Table A1 The temperature corresponding to a
given recovery fraction X is designated as TX (ie T90 indicates the temperature at which 90 of the
fuel has been vaporized and recovered) The initial boiling points (IBP) of all of the fuels are in a
relatively narrow range of 90‐110˚F In contrast the end boiling points (EBP) range from 253‐410˚F
Gasolines E G and H which are three of the four high sensitivity fuels have the highest EBPs Gasoline
E has a relatively steep increase in temperature of 140˚F from T90‐EBP Gasolines I and A the two fuels
having low sensitivity aromatics and n‐paraffin and low‐mid RON have the lowest EBPs Gasoline I
also has a relatively flat distillation profile from T30‐T90
100 100 100 100
04
34
13
72
63
59
107
71
05
3734
11
54
60
56
110
76
07
30
00
10
20
30
40
50
60
70
80
90
100
110
A B C D E F G H I J
Octan
e Sensitivity
Fuel
Octane Sensitivity
Target
AVG
CPChem
le2le2 le2 le2 le2 le2
‐01
10
Figure 34 ASTM D86 Distillation Curves for the FACE Gasolines
313 Reid Vapor Pressure (RVP)
The RVPs were determined using ASTM method D5191 (7) The values measured in this project were in
excellent agreement with those reported by CPChem COAs (within 01 psi) The averages of both values
are depicted in the bar charts in Figure 35 The values range from 67 to 805 psi
Figure 35 Reid Vapor Pressures of FACE Gasolines
500
1000
1500
2000
2500
3000
3500
4000
4500
0 10 20 30 40 50 60 70 80 90 100
Tempe
rature (˚ F)
Volume Distilled
D86 Distillation ‐ FACE Gasolines
A
B
C
D
E
F
G
H
I
J
805
735 745
680 670
780
725
755 760 750
0
1
2
3
4
5
6
7
8
9
A B C D E F G H I J
Reid Vap
or Pressure (p
si)
FACE Gasoline
Reid Vapor Pressure (RVP) ‐ FACE Gasolines
11
314 API Gravity and Density
The API gravities and densities of the fuels were measured using ASTM method D4052 (8) The
agreement between the values measured in this project and the values reported in the CPChem COAs
The individual values are listed in the Summary Table A1 in Appendix A The average of both values are
plotted in the bar charts in Figures 36 and 37 for API Gravity and density respectively As expected the
FACE Gasolines (D G H and J) having the highest aromatics content have the lowest API Gravities and
highest densities
Figure 36 API Gravities of FACE Gasolines
Figure 37 Densities of FACE Gasolines
7495
7135
7330
5870
6360
6860
54555580
7440
5910
0
5
10
15
20
25
30
35
40
45
50
55
60
65
70
75
80
A B C D E F G H I J
API G
ravity
FACE Gasoline
API Gravity ‐ FACE Gasolines
0685
0697
0691
0743
0725
0707
0760
0755
0697
0742
0645
065
0655
066
0665
067
0675
068
0685
069
0695
07
0705
071
0715
072
0725
073
0735
074
0745
075
0755
076
0765
077
A B C D E F G H I J
Density
(gml)
FACE Gasoline
Density ‐ FACE Gasolines
12
315 Net Heat of Combustion (NHC)
Net Heats of Combustion were measured using ASTM method D240 (9) The values are depicted in the
bar charts in Figure 38 In addition for two of the FACE Gasolines (C and J) the values were also
measured using ASTM method D4809 (10) The D4809 values were very close to those obtained from
method D240 (within 100 BTUlb) TheD240 values range from 18602 to 19251 BTUlb As expected
the FACE Gasolines having the highest aromatics content (D G H and J) have the lowest net heat of
combustion The FACE Gasolines having saturates content gt90 (A B C and I) have the highest net
heat of combustion
Figure 38 ASTM D240 Net Heats of Combustion of FACE Gasolines
19251
19187
19257
18649
18884
19072
1860218625
19225
18731
18200
18400
18600
18800
19000
19200
19400
A B C D E F G H I J
Net Heat o
f Com
bustion (BTU
lb) (A
STM D240)
FACE Gasoline
Net Heat of Combustion ‐ FACE Gasolines
13
32 CHEMICAL PROPERTIES OF FACE GASOLINES
The various types of hydrocarbons in the fuels were characterized by several techniques including
supercritical fluid chromatography (SFC) and detailed hydrocarbon analysis (DHA) by gas
chromatography using a flame ionization detector (GC‐FID) In addition the carbon hydrogen and
sulfur contents were measured Results are reported in the following sections
321 Aromatics by Supercritical Fluid Chromatography (SFC)
The SFC method of ASTM D5186 (11) separates the hydrocarbons into three fractions monoaromatics
polyaromatics and non‐aromatics and characterizes the composition in terms of mass Bar graphs of
the results are presented in Figure 39 Samples of FACE Gasolines B D E G and H were analyzed by
two labs The results from the two labs were very close to each other and so the averages are depicted
in the figure FACE Gasolines A B C and I have nonromatics levels gt90 wt FACE Gasolines D G and
H have the highest amounts of monoaromatics with values ranging from 394‐420 wt FACE
Gasolines E G and H appear to have about 1 wt polyaromatics
Figure 39 Compositions of FACE Gasolines by Supercritical Fluid Chromatography (ASTM D5186)
070 790 600
4175
14001000
39404200
040
3870
015
100
110125
030
9930
9210 9400
5810
85009000
59505675
9960
6100
0
10
20
30
40
50
60
70
80
90
100
A B C D E F G H I J
Composition (Wt )
FACE GASOLINE
SFC Composition ‐ FACE Gasolines
MonoAromatics PolyAromatics NonAromatics
14
322 Hydrocarbons by Detailed Hydrocarbon Analysis (DHA)
Detailed Hydrocarbon Analyses were performed by two labs using gas chromatography with flame
ionization detectors (GC‐FID) This technique enables the determination of concentration on a species‐
by‐species basis provided that retention factors have been determined for each species in the fuel The
results from both labs were very close to each other Bubble charts of the average concentration values
(in volume ) are depicted in Figure 310 for the low sensitivity fuels and Figure 311 for the high
sensitivity fuels on a carbon number basis for the five hydrocarbon classes n‐paraffins iso‐paraffins
naphthenes aromatics and olefins
In general the low sensitivity FACE Gasolines are characterized by large amounts of low sensitivity
components such as n‐paraffins and iso‐paraffins The high sensitivity FACE Gasolines contain more high
sensitivity components such as olefins and naphthenes than the low sensitivity fuels
The total concentration of components within each of the five hydrocarbon classes were added and the
sums are reported in the bar charts in Figure 312 The n‐paraffin levels range from 225‐316 vol for
the four FACE Gasolines (C D H and J) that had targets of 25 vol For the other FACE Gasolines that
had a target level of 5 vol the n‐paraffins levels range from 44‐117 vol The aromatics levels range
from 317‐358 vol for the four FACE Gasolines (D G H and J) that had targets of 35 vol For the
other six FACE Gasolines that had a target level of 5 vol the aromatics levels range from 0‐109 vol
The C7 aromatic is toluene the C8 aromatics consist of a mix of ethylbenzene and the xylene isomers
the C9 aromatics consist of a mix of trimethylbenzenes and methylethylbenzenes and the C10 aromatics
consist of a mix of tetramethylbenzenes dimethylethylbenzenes and methylpropylbenzenes FACE
Gasoline E a high sensitivity fuel has a naphthene content of 208 vol mainly cyclopentane and
cyclohexane Three other high sensitivity fuels (F G and H) have naphthenes concentrations of about
11 vol mainly cyclopentane Those high sensitivity fuels also have the highest olefins content with
concentrations ranging from 68‐127 vol FACE Gasoline I also has 64 vol olefins The C6 olefin is
1‐hexene The C5 olefins consist of a mix of 2‐pentene and methyl butenes In contrast to the high
sensitivity fuels Gasoline D which was designed to be low sensitivity but ended up in the high
sensitivity range has essentially no naphthenes or olefins Its high sensitivity is derived from its high
aromatics content
The C5 isoparaffin in all of the fuels is 2‐methylbutane The C6 isoparaffins consist of a mix of 2‐ and 3‐
methyl pentanes and 23 dimethyl butane The C7 isoparaffins in most of the FACE Gasolines consist of a
mix of 2‐ and 3‐methyl hexanes and 23‐ and 24‐dimethylpentanes The C8 isoparaffins are
predominantly trimethylpentanes with more than 50 of those being isooctane (224
trimethylpentane) The other isomers are mainly 24‐ and 25 dimethylhexanes and 2‐methyl 3‐ethyl
pentane
15
Figure 310 Detailed Hydrocarbon Analyses of Low Sensitivity FACE Gasolines
122 44 219 451 11
48 65
065
3 4 5 6 7 8 9 10 11
Carbon Number
FACE Gasoline A ‐ Detailed Hydrocarbon Analysis (vol)
isoparaffins
n‐paraffins
cycloparaffins
aromatics
olefins
104 13 137 587 16
59
39 37
3 4 5 6 7 8 9 10 11
Carbon Number
FACE Gasoline B ‐ Detailed Hydrocarbon Analysis (vol)
isoparaffins
cycloparaffins
aromatics
olefins
n‐paraffins
64 27 117 468 20 075
30 06
31 118 100
3 4 5 6 7 8 9 10 11
Carbon Number
FACE Gasoline C ‐ Detailed Hydrocarbon Analysis (vol)
isoparaffins
cycloparaffins
aromatics
olefins
n‐paraffins
12 410
99 35 150 46
47 114 70
3 4 5 6 7 8 9 10 11
Carbon Number
FACE Gasoline D ‐ Detailed Hydrocarbon Analysis (vol)
isoparaffins
cycloparaffins
aromatics
olefins
n‐paraffins
41 34 99 321 236 11
07 135
24
11
59
3 4 5 6 7 8 9 10 11
Carbon Number
FACE Gasoline I ‐ Detailed Hydrocarbon Analysis (vol)
isoparaffins
n‐paraffins
cycloparaffins
aromatics
olefins
327
90 124 95
22
14 131 145 29
06
3 4 5 6 7 8 9 10 11
Carbon Number
FACE Gasoline J ‐ Detailed Hydrocarbon Analysis (vol)
isoparaffins
n‐paraffins
cycloparaffins
aromatics
olefins
16
Figure 311 Detailed Hydrocarbon Analyses of High Sensitivity FACE Gasolines
64 68 143 165 18 07
70 105 19 10 04
46 17 18 16 08
21 82 09
29 06 37
3 4 5 6 7 8 9 10 11
Carbon Number
FACE Gasoline E ‐ Detailed Hydrocarbon Analysis (vol)
isoparaffins
cycloparaffins
aromatics
olefins
n‐paraffins
82 64 134 378 14
21 21
100
76
89
3 4 5 6 7 8 9 10 11
Carbon Number
FACE Gasoline F ‐ Detailed Hydrocarbon Analysis (vol)
isoparaffins
n‐paraffins
cycloparaffins
aromatics
olefins
65 66 72 152 16 10
74 09 16 10
15 33 218 54 14
36 25 10
37 07 10
3 4 5 6 7 8 9 10 11
Carbon Number
FACE Gasoline G ‐ Detailed Hydrocarbon Analysis (vol)
isoparaffins
cycloparaffins
aromatics
olefins
n‐paraffins
28 54 71 39 22 09
66 08 17 10
10 95 117 83 43 14
29 21 09
54 05 145 08
3 4 5 6 7 8 9 10 11
Carbon Number
FACE Gasoline H ‐ Detailed Hydrocarbon Analysis (vol)
isoparaffins
cycloparaffins
aromatics
olefins
n‐paraffins
17
Figure 312 Detailed Hydrocarbon Analyses Comparisons of FACE Gasolines
A comparison of the composition results from the DHA and SFC methods is presented in Figure 313 for
the low sensitivity fuels and Figure 314 for the high sensitivity fuels Also included are Fluorescent
Indicator Absorption (FIA ndash ASTM D1319 (12)) composition results reported on the CPChem COAs Since
the FIA method determines total saturates the DHA results for n‐paraffins iso‐paraffins and
naphthenes must be added together to enable the comparison between those two methods Similarly
since the SFC method directly measures aromatics and total non‐aromatics are determined by
difference the olefins amount must be added to the total saturate levels from FIA and DHA to enable
comparisons with the non‐aromatics values from SFC The appropriate comparison categories are
indicated by dashed lines in Figures 313 and 314 Of the three methods SFC generally gives the
highest level of aromatics and FIA the lowest The DHA aromatics values are closer to the FIA levels than
to the SFC levels The DHA olefins are fairly close to the FIA results
117
80
244 241
7944 67
225144
316
860
859
697
421
459
676
384
228
745336
16
01
01208
110
115105
33
23
13
127
94
8168
64
06
58 39
334
10977
336 358
12
317
0
10
20
30
40
50
60
70
80
90
100
A B C D E F G H I J
Composition ( vol)
FACE GASOLINE
DHA Composition ‐ FACE Gasolines
n‐paraffins isoparaffins naphthenes olefins aromatics
18
Figure 313 Comparison of Composition Methods FACE Low Sensitivity Gasolines
Figure 314 Comparison of Composition Methods FACE High Sensitivity Gasolines
117
80
244
144
316
860 859
697
745336
16
01 0433
23
13 64
06
58 3912
317
996951 975
929
712
04
07 04 62
10
42 21 09
278
993
921 940996
610
07
79 6004
390
0
10
20
30
40
50
60
70
80
90
100
DHA FIA SFC DHA FIA SFC DHA FIA SFC DHA FIA SFC DHA FIA SFC
Composition ( )
FACE GASOLINE
Composition ‐ Low Sensitivity FACE Gasolines
n‐paraffins isoparaffins naphthenes olefins aromatics saturates nonaromatics
A B C I J
241
7944 67
225
421
459
676
384
228
01
208
110
115 105
127
94
81 68
334
10977
336 358
701
780
856
587 568
04
99
86
7879
295
12158
335 353
581
850900
595568
419
150100
405432
0
10
20
30
40
50
60
70
80
90
100
DHA FIA SFC DHA FIA SFC DHA FIA SFC DHA FIA SFC DHA FIA SFC
Composition ( )
FACE GASOLINE
Composition ‐ High Sensitivity FACE Gasolines
n‐paraffins isoparaffins naphthenes olefins aromatics saturates nonaromatics
D E F G H
19
323 Elemental Analyses
Carbon and hydrogen contents were measured by two labs using ASTM method D5291 (13) The
average results are presented in the bar graphs in figure 315 The carbon contents range from 8399‐
8748 wt and the hydrogen contents range from1252‐1601 wt As expected the FACE Gasolines
having the highest aromatics content (D G H and J) have the highest carbon and lowest hydrogen
contents
Figure 315 Carbon and Hydrogen Elemental Analyses of FACE Gasolines
8399 8443 8453 8646 8547 8496 8670 87488414 8624
1601 1557 1547 1354 1453 1504 1330 12521586 1376
0
10
20
30
40
50
60
70
80
90
100
A B C D E F G H I J
Compo
sition
(wt)
FACE Gasoline
Carbon‐Hydrogen Elemental Analyses
Hydrogen
Carbon
20
Sulfur content was measured by one lab ASTM method D5453 (14) The results displayed in the bar
charts in Figure 316 are essentially identical to the values reported on the CPChem COAs All FACE
Gasolines had ultra‐low sulfur levels FACE Gasolines E G and H had the highest levels at 21 22 and 15
ppm sulfur The other fuels had levels ranging from 2‐6 ppm
Figure 316 Sulfur Levels of FACE Gasolines
6
4 4
2
21
2
22
15
2 2
0
5
10
15
20
25
A B C D E F G H I J
Sulfur Content (p
pm)
FACE Gasoline
Sulfur Content ‐ FACE Gasolines
21
4 ANALYTICAL RESULTS FOR FACE GASOLINES BLENDED WITH ETHANOL
Although the FACE Gasolines were not formulated with ethanol the expectation is that some potential
users will be interested in testing the fuels with ethanol added To assist selection of fuels for those
studies four FACE Gasolines were selected for blending with levels of 10 15 and 30 vol ethanol The
fuels selected for this purpose were A B C and H The positions of these fuels in the design matrix are
shown below
In this section results of the analyses of the ethanol blends are discussed Chevron Phillips 66 BP and
a contract laboratory conducted the analyses As mentioned previously future production runs that are
required to remake fuels that sell out likely will results in some changes to the fuel property values
reported here
41 ASTM TEST RESULTS
ASTM methods were used to measure the ethanol content RON MON API gravity density distillation
profiles RVP and net heats of combustion of all of the ethanol blends made with the FACE Gasolines
The results of these analyses are summarized below and in Table A2 located in the Appendix
411 Ethanol Content
FACE Gasolines A B C and H were blended with nominally 10 15 and 30 vol ethanol The
concentration of ethanol in each blend were determined using ASTM method D5599 (15) (coupled with
ASTM D4052 density measurement) and by detailed hydrocarbon analysis using gas chromatography
with a flame ionization detector The results for both methods were in excellent agreement for all fuels
as shown below in Table 41
Table 41 Measured Ethanol Content of FACE Gasoline Blends
Ethanol Content (vol)
A B C H
10 15 30 10 15 30 10 15 30 10 15 30
D5599 101 147 299 100 147 302 102 146 295 102 146 303
DHA 100 146 301 100 148 301 103 148 299 102 147 304
22
412 RON MON and Octane Sensitivity
RON values were measured in CFR engines per ASTM method D2699 (4) Although the measurements
were conducted in four labs the lab‐to‐lab reproducibility was very good so only the average values are
reported here (but individual values are reported in Table A2) Average RON values for each fuel are
presented in Figure 41 For all four of these FACE Gasolines the RON values continue to increase even
at the 30 ethanol level although the rates of increase are lower than at lower ethanol levels FACE
Gasoline B has the highest RON at all ethanol levels with a value of about 106 at the 30 ethanol level
FACE Gasolines A and C have essentially the same RON values at all ethanol levels with RON values of
about 102 at the 30 ethanol level FACE Gasoline H without ethanol has a higher RON than A and C
but a lower RON at the 15 and 30 ethanol levels
Figure 41 RON Values of FACE Gasoline Blends with Ethanol
MON values were measured in CFR engines per ASTM method D2700 (5) Although the measurements were conducted in four labs the lab‐to‐lab reproducibility was very good so only the average values are reported here (but individual values are reported in Appendix A2) The MON values for each fuel are
presented in Figure 42 FACE Gasoline B has the highest MON values at all ethanol levels but unlike the other FACE Gasolines the MON value did not increase with ethanol contents above 10 vol The MON values for FACE Gasolines A and C were essentially the same and higher than those for FACE Gasoline H
80081082083084085086087088089090091092093094095096097098099010001010102010301040105010601070108010901100
0 5 10 15 20 25 30 35
RON
Ethanol (vol)
RON Values ‐ FACE Gasoline + Ethanol Blends
FACE A
FACE B
FACE H
FACE C
23
Figure 42 MON Values of FACE Gasoline Blends with Ethanol
Octane Sensitivity (S=RON‐MON) values are presented in Figure 43 As expected due to the relatively high sensitivity of ethanol the sensitivities of all four FACE Gasolines increase as the ethanol content increases FACE Gasoline H has the highest sensitivity at all ethanol levels except at 30 vol ethanol where the sensitivity of the FACE Gasoline B blend becomes slightly higher with values of 124 and 132 respectively The sensitivities for FACE Gasolines A and C are very similar to each other and although lower than the blends for the other FACE Gasolines have the highest rates of increase at the 30 level
Figure 43 Octane Sensitivities FACE Gasoline Blends with Ethanol
750
760
770
780
790
800
810
820
830
840
850
860
870
880
890
900
910
920
930
940
950
0 5 10 15 20 25 30 35
MON
Ethanol (vol)
MON Values ‐ FACE Gasoline + Ethanol Blends
FACE A
FACE B
FACE H
FACE C
00
10
20
30
40
50
60
70
80
90
100
110
120
130
140
0 5 10 15 20 25 30 35
S
Ethanol (vol)
Octane Sensitivity (S) ‐ FACE Gasoline + Ethanol Blends
FACE A
FACE B
FACE H
FACE C
24
413 Distillation Characteristics
The distillation properties of the fuels were determined by ASTM D86 (6) The values are plotted in
Figure 44 and tabulated in Table A2 in the Appendix The behavior and shapes of the curves are very
similar For a given gasoline all of the ethanol blends start at about the same IBP The blends
containing ethanol then follow the same curve which is lower than the base gasoline At a certain point
the ethanol blends then rise quickly to rejoin the distillation curve of the base gasoline The lower the
ethanol content of the blend the earlier (lower distilled volume ) the curve rejoins the base gasoline
curve
Figure 44 ASTM D86 Distillation Profiles for FACE Gasoline Blends with Ethanol
50
100
150
200
250
300
0 10 20 30 40 50 60 70 80 90 100
Temperature (˚ C)
Volume Distilled
D86 Distillation ‐ FACE A Gasoline + Ethanol Blends
0 EtOH
10 EtOH
15 EtOH
30 EtOH
50
100
150
200
250
300
0 10 20 30 40 50 60 70 80 90 100
Temperature (˚ C)
Volume Distilled
D86 Distillation ‐ FACE B Gasoline + Ethanol Blends
0 EtOH
10 EtOH
15 EtOH
30 EtOH
50
100
150
200
250
300
350
0 10 20 30 40 50 60 70 80 90 100
Temperature (˚ C)
Volume Distilled
D86 Distillation ‐ FACE C Gasoline + Ethanol Blends
0 EtOH
10 EtOH
15 EtOH
30 EtOH
50
100
150
200
250
300
350
400
450
0 10 20 30 40 50 60 70 80 90 100
Temperature (˚ C)
Volume Distilled
D86 Distillation ‐ FACE H Gasoline + Ethanol Blends
0 EtOH
10 EtOH
15 EtOH
30 EtOH
25
414 Reid Vapor Pressure (RVP)
The RVPs were determined using ASTM method D5191 (7) The values are plotted in Figure 45 For all
fuels the RVP appears to peak between 10 and 15 vol ethanol and then starts to decrease as the
ethanol content increases further
Figure 45 Reid Vapor Pressures for FACE Gasoline Blends with Ethanol
415 API Gravity and Density
The API gravities and densities of the fuels were measured by two labs using ASTM method D4052 (8) The values from the two labs were in excellent agreement and are listed in Table A2 The average density values are presented in Figure 46 For all of the FACE Gasolines the density increased as the ethanol content increased
Figure 46 Densities of FACE Gasoline Blends with Ethanol
7
75
8
85
9
95
10
0 5 10 15 20 25 30 35
RVP (psi)
Ethanol (vol)
Reid Vapor Pressure (RVP) ‐ FACE Gasoline + Ethanol Blends
FACE A
FACE B
FACE H
FACE C
0685 0697 0691
0759
0696 0705 0699
0761
0700 0710 0704
0763
0716 0724 0719
0768
0
01
02
03
04
05
06
07
08
09
1
A B C H
Density
(gm
l)
Ethanol (vol)
Density ‐ FACE Gasoline Blends with Ethanol
0
10
15
30
26
416 Net Heat of Combustion (NHC)
Net Heats of Combustion were measured by 2 labs using ASTM method D240 (9) For some fuels ASTM
method D4809 (10) was also used The values from both labs and both methods were very close to each
other and the average values are plotted in Figure 47 As expected since the net heat of combustion of
ethanol is lower than that of gasoline for all FACE Gasolines the net heat of combustion decreased as
ethanol content increased The decrease appeared to be linear with ethanol content The decrease
appeared to be steepest for FACE Gasoline B
Figure 47 Net Heat of Combustion of FACE Gasoline Blends with Ethanol
16000
16250
16500
16750
17000
17250
17500
17750
18000
18250
18500
18750
19000
19250
19500
0 5 10 15 20 25 30 35
Net Heat of C
ombustion (B
TUlb)
Ethanol (vol)
Net Heat of Combustion ‐ FACE Gasoline + Ethanol Blends
FACE A
FACE B
FACE H
FACE C
27
5 SUMMARY AND CONCLUSIONS
A subteam of the CRC AVFL FACE Working Group has designed a matrix of reference gasolines
known as the FACE Gasolines A commercial vendor has produced and made the fuels available
for purchase in research quantities It is expected that this will enable consistent comparisons
of engine and combustion results from different laboratories and test platforms based on the
use of the same set of fuels
The matrix is designed around four parameters expected to be of importance for advanced
gasoline engines RON octane sensitivity aromatics content and n‐paraffins content
Statistical methods were used to identify potential candidate formulations and down‐select to a
tractable number of 10 formulations
Detailed analyses were performed on the physical and chemical properties of the final fuel
formulations
Generally the property values measured in the current study agreed very well with the values
reported on the fuel blender (ChevronPhillips Chemical Company ‐ CPChem) Certificates of
Analyses (COAs)
As expected conflicts in the target properties for some of the fuels (such as high aromatics level
coupled with low octane sensitivity) led to some trade‐offs that resulted in some deviation in
the actual properties from the design properties
The RON values come close to meeting the targets for most of the fuels Fuels E H and J have
values that are 24‐38 units higher than the targets
Three of the four ldquohighrdquo sensitivity fuels have measured values of 59‐71 that are lower than
the target value of 10 Two of the ldquolowrdquo sensitivity fuels have measured values (34‐37) that are
a bit higher than the target value of le2 One of the low sensitivity design fuels (ldquoDrdquo) has a value
of 72 that actually effectively makes it a high sensitivity fuel
Detailed hydrocarbon analyses (DHA) indicate that the n‐paraffins contents range from 225‐
316 vol for the four FACE Gasolines that had targets of 25 vol and from 44‐117 vol for
the six FACE Gasolines that had targets of 5 vol
DHAs indicate that the aromatics contents range from 317‐358 vol for the four FACE
Gasolines that had a target of 35 vol and 0‐109 vol for the other fuels that had a target of 5
vol
The high sensitivity fuels contained the high sensitivity components of naphthenes (105‐208
vol) and olefins (68‐127 vol) The exception was Gasoline ldquoDrdquo which had neither of these
components but whose high sensitivity was derived from aromatics components
Five of the FACE Gasolines (ldquoArdquo ldquoBrdquo ldquoCrdquo ldquoFrdquo and ldquoIrdquo) are very rich in isoparaffins with contents ge
676 vol
Aromatics values determined by SFC were generally higher than the values obtained from DHA
The DHA olefins values were close to the FIA values reported on the CPChem COAs
The fuels having the highest aromatics content also have the highest densities and highest net
heats of combustion on an energy content per volume basis
With regards to distillation properties for all fuels the initial boiling points (IBPs) are in a
narrow range of 90‐110˚F although the end boiling points (EBPs) range from 253‐410˚F Three
28
of the high sensitivity fuels have the highest EBPs The two low‐mid RON fuels having low n‐
paraffins and low aromatics have the lowest EBPs
All of the FACE Gasolines have ultra‐low levels of sulfur with the highest value at 22 ppm S and
most fuels having le 6 ppm S
For the four FACE Gasolines blended with ethanol RON continues to increase as the ethanol
levels increase to 30 vol although the rate of increase is lower as the ethanol content
increases FACE Gasoline B which has the highest RON of 96 has the highest RON at all ethanol
levels with a value of about 106 at 30 ethanol At the same ethanol level FACE Gasolines A
and C have essentially the same RON values FACE Gasoline H starts with a higher RON value
than those of A or C but has a lower value at blend levels of 15 and 30 vol
MON increased as the ethanol level increased for FACE Gasolines A C and H The MON values
for these fuels were essentially constant even though the highest MON values were found for
the ethanol blends with FACE Gasoline B
For all blends octane sensitivity increased as ethanol content increased with the highest values
of 12‐13 for 30 vol ethanol blends with FACE Gasolines B and H
The D86 distillation curve trends are similar for the four FACE Gasolines For a given gasoline all
blends start at the same point At around 10 vol distilled the curves for the blends with
ethanol diverge from and are lower than the curves for the base gasolines At a certain point
the distillation curves for the blends rise quickly and re‐join the curve for the parent base fuel
The distillation curves for the 30 vol ethanol blends are generally flat as a function of
increasing vol distilled and only start to increase again at about 70‐80 vol distilled when
most of the ethanol has been distilled from the liquid
The Reid Vapor Pressures (RVPs) peak at about 10‐15 vol
Densities increase slightly as ethanol increases while net heats of combustion decrease
29
6 REFERENCES
1 Alnajjar M Cannella B Dettman H Fairbridge C Franz J Gallant T Gieleciak R Hager D Lay C Lewis S Ratcliff M Sluder S Storey J Yin H Zigler B ldquoChemical and Physical Properties of the Fuels for Advanced Combustion Engines (FACE) Research Diesel Fuelsrdquo CRC Report No FACE‐1 (2010)
2 Gallant T Franz J Alnajjar M Storey J Lewis S Sluder S Cannella W Fairbridge C Hager D Dettman H Luecke J Ratcliff M Zigler ldquoFuels for Advanced Combustion Engines Research Diesel Fuels Analysis of Physical and Chemical Propertiesrdquo SAE Paper 2009‐01‐2769 (2009)
3 CannellaW Fairbridge C Arboleda P Bays T Dettman H Foster M Gieleciak R Gunter G Hager D Lay C Lewis S Luecke J Sluder S Zigler B ldquoDetailed Characterization of the Physical and Chemical Properties of the Reformulated FACE Diesel Fuels FD2B FD4B and FD7Brdquo CRC Report AVFL‐19‐1 (2013)
4 ASTM International Standard Test Method for Research Octane Number of Spark‐Ignition Engine Fuel ASTM D2699 (ASTM International Pennsylvania 2009)
5 ASTM International Standard Test Method for Motor Octane Number of Spark‐Ignition Engine Fuel ASTM D2700 (ASTM International Pennsylvania 2009)
6 ASTM International Standard Test Method for Distillation of Petroleum Products at Atmospheric Pressure ASTM D86‐09e1 (ASTM International Pennsylvania 2009)
7 ASTM International Standard Test Method for Vapor Pressure of Petroleum Products (Mini‐Method) ASTM D5191 (ASTM International Pennsylvania 2009)
8 ASTM International Standard Test Method for Density and Relative Density of Liquids by Digital Density Meter ASTM D4052‐96(2002)e1 (ASTM International Pennsylvania 2002)
9 ASTM International Standard Test Method for Heat of Combustion of Liquid Hydrocarbon Fuels by Bomb Calorimeter ASTM D240‐02(2007) (ASTM International Pennsylvania 2007)
10 ASTM International Standard Test Method for Heat of Combustion of Liquid Hydrocarbon Fuels by Bomb Calorimeter ASTM D4809 (2007) (ASTM International Pennsylvania 2007)
11 ASTM International Standard Test Method for Determination of Aromatic Content and Polynuclear Aromatic Content of Diesel Fuels and Aviation Turbine Fuels by Supercritical Fluid Chromatography ASTM D5186‐03(2009) (ASTM International Pennsylvania 2009)
12 ASTM International Standard Test Method for Hydrocarbon Types in Liquid Petroleum Products by Fluorescent Indicator Adsorption ASTM D1319‐08 (ASTM International Pennsylvania 2008)
13 ASTM International Standard Test Methods for Instrumental Determination of Carbon Hydrogen and Nitrogen in Petroleum Products and Lubricants ASTM D5291‐02(2007) (ASTM International Pennsylvania 2007)
14 ASTM International Standard Test Methods for Determination of Total Sulfur in Light Hydrocarbons Spark‐Ignition Engine Fuel Diesel Engine Fuel and Engine Oil by Ultraviolet Fluorescence ASTM D5453(2007) (ASTM International Pennsylvania 2007)
15 ASTM International Standard Test Methods for Determination of Oxygenates in Gasoline by Gas Chromatography and Oxygen Selective Flame Ionization Detection ASTM D5599 (2007) (ASTM International Pennsylvania 2007)
30
31
Appendix A
Properties of FACE Gasolines
32
Table A1 Summary Data for FACE Gasolines
Specific Tests FACE Gasoline A B C D E F G H I J Research Octane Number (RON) (ASTM D2699) -Lab 1 843 958 850 946 871 940 969 870 700 738 -Lab 2 839 960 840 939 877 960 869 -Lab 3 835 957 840 -Average 839 958 843 942 874 940 965 869 7015 738 -CPChem COA 835 960 847 932 875 944 968 869 703 718 Motor Octane Number (MON) (ASTM D2700) -Lab 1 836 923 830 872 813 881 857 797 695 701 -Lab 2 833 931 830 868 808 860 799 -Lab 3 835 919 829 -Average 835 924 830 870 811 881 858 798 695 701 -CPChem COA 836 926 836 878 815 888 858 793 696 688 Sensitivity (RON-MON) -Lab 1 07 35 20 74 58 59 112 73 05 37 -Lab 2 06 29 10 71 69 100 70 -Lab 3 0 38 11 -Average 04 34 13 72 63 59 107 72 05 37 -CPChem COA -01 34 11 54 60 56 110 76 07 30 API Gravity (API˚) (ASTM D4052) -CPChem COA 750 714 734 587 636 686 545 568 744 595 -Lab 1 749 713 732 587 636 686 546 548 744 587 -Average 7495 7135 733 587 636 686 5455 558 744 591 Density (ASTM D4052) -CPChem COA 0691 0743 0725 0707 0760 0697 0741 -Lab 1 0685 0697 0691 0743 0725 0707 0760 0759 0697 0743 -Average 0685 0697 0691 0743 0725 0707 0760 0759 0697 0742 RVP (psi) (D5191) -CPChem COA 81 74 74 68 67 78 72 75 75 75 -Lab 1 80 73 75 73 76 77 Net Heat of Combustion (BTUlb) (ASTM D4809) 19186 18680 Net Heat of Combustion (BTUlb) (ASTM D240) 19251 19187 19257 18649 18884 19072 18602 18625 19225 18731
33
TableA1 Summary Data for FACE Gasolines
Specific Tests FACE Gasoline A B C D E F G H I J Distillation (˚F) (ASTM D86) -CPChem IBP 93 95 95 88 110 108 93 94 100 101
5 104 128 120 129 131 129 122 123 123 111 10 132 145 136 148 142 142 135 140 156 162 20 160 172 154 176 155 156 158 168 177 206 30 183 194 171 198 166 168 183 192 186 217 40 197 207 187 212 177 180 210 211 191 224 50 203 213 200 221 186 193 240 227 195 231 60 207 216 210 229 197 206 270 242 199 242 70 210 220 218 235 208 217 306 262 203 261 80 213 225 226 280 222 225 328 291 207 291 90 219 235 243 330 267 240 343 327 213 316 95 227 248 270 340 343 261 363 358 220 330 FBP 269 283 328 363 405 294 403 410 259 358
-Lab 1 IBP 90 97 93 97 107 102 99 98 99 95 5 122 133 126 133 134 134 122 127 139 111
10 140 149 139 151 143 144 136 143 160 166 20 165 175 157 179 156 157 158 170 178 209 30 186 196 174 200 168 169 182 194 187 219 40 198 209 188 214 177 182 209 213 192 225 50 204 214 201 224 188 195 238 229 196 232 60 207 218 210 234 197 207 268 243 200 242 70 210 221 218 248 208 218 304 263 204 263 80 213 226 227 288 224 228 328 291 208 292
90 219 236 245 331 258 243 343 329 213 316 95 228 248 274 341 329 261 358 357 220 330 FBP 262 280 330 365 402 291 405 408 247 357
-Average IBP 915 96 94 925 1085 105 96 96 995 98 5 113 1305 123 131 1325 1315 122 125 131 111
10 136 147 1375 1495 1425 143 1355 1415 158 164 20 1625 1735 1555 1775 1555 1565 158 169 1775 203 30 1845 195 1725 199 167 1685 1825 193 1865 218 40 1975 208 1875 213 177 181 2095 212 1915 2245 50 2035 2135 2005 2225 187 194 239 228 1955 2315 60 207 217 210 2315 197 2065 269 2425 1995 242 70 210 2205 218 2415 208 2175 305 2625 2035 262 80 213 2255 2265 284 223 2265 328 291 2075 2915
90 219 2355 244 3305 2625 2415 343 328 213 316 95 2275 248 272 3405 336 261 3605 3575 220 330 FBP 2655 2815 329 364 4035 2925 404 409 253 3575
34
Table A1 Summary Data for FACE Gasolines
Specific Tests FACE Gasoline A B C D E F G H I J Elemental Analysis (ASTM D 5291) -Carbon (wt) -Lab 1 8398 8441 8497 8647 8547 8671 8792 8415 -Lab 4 8400 8444 8419 8645 8547 8496 8669 8703 8414 8624 -Average 8399 8443 8458 8646 8547 8496 8670 8748 8414 8624 -Hydrogen (wt) -Lab 1 1602 1559 1503 1353 1453 1329 1208 1585 -Lab 4 1600 1556 1585 1355 1453 1504 1331 1297 1586 1376 -Average 1601 1557 1547 1354 1453 1504 1330 1252 1586 1376 Sulfur by UV Fluorescence (ppmw) (ASTM D5453) -CPChem COA 4 4 3 2 21 2 20 15 2 2 -Lab 4 6 4 4 2 21 2 22 15 2 2 Hydrocarbons by FIA (vol) (ASTM D1319) -Aromatics (vol) CPChem COA 0 42 21 295 121 58 335 353 09 278 -Olefins (vol) CPChem COA 04 07 04 04 99 86 78 79 62 10 -Saturates (vol) CPChem COA 996 951 975 701 780 856 587 568 929 712 Aromatics by SFC (ASTM D5186) (Lab 1) -MonoAromatics (wt) -Lab 1 07 78 60 414 142 100 393 412 04 387 -Lab 2 80 421 138 395 428 -Average 07 79 60 4175 140 100 394 420 04 387 -PolyAromatics (wt) -Lab 1 0 0 0 03 11 0 10 10 0 03 -Lab 2 0 0 09 12 15 -Average 0 0 0 015 10 0 11 125 0 03 -NonAromatics (wt) -Lab 1 993 922 940 583 847 900 597 578 996 610 -Lab 2 920 579 850 593 557 -Average 993 921 940 581 8475 900 595 5675 996 610
35
Table A1 Summary Data for FACE Gasolines
Specific Tests FACE Gasolines A B C D E F G H I J Detailed Hydrocarbon Analyses by GC-FID -n-paraffins (vol) (Targets) (5) (5) (25) (25) (5) (5) (5) (25) (5) (25) -Lab 1 1144 783 2409 2346 771 434 662 2214 1441 3115 -Lab 2 1187 815 2476 2473 803 446 685 2283 1437 3212 -Average 1165 799 2443 2410 787 440 673 2249 1439 3164 -iso-paraffins (vol) -Lab 1 8562 8591 688 4206 4563 6765 3821 2322 7449 3362 -Lab 2 8635 8586 7066 4221 4621 6747 3864 2240 7459 3366 -Average 8599 8688 6973 4213 4592 6756 3843 2281 7454 3364 -cyclo-paraffins (vol) -Lab 1 192 021 048 010 2216 1078 1163 1035 324 234 -Lab 2 130 007 023 010 1945 1118 1140 1066 336 224 -Average 161 014 036 010 2081 1098 1152 1050 330 229 -aromatics (vol) (Targets) (5) (5) (5) (35) (5) (5) (35) (35) (5) (35) -Lab 1 073 601 409 3425 1121 805 3419 3597 120 3212 -Lab 2 003 568 374 3258 1062 739 3306 3555 110 3125 -Average 38 584 392 3341 1092 772 3363 3576 115 3169 -olefins (vol) -Lab 1 024 001 248 004 1146 978 851 714 643 066 -Lab 2 018 003 006 005 1392 905 771 650 627 054 -Average 021 002 127 04 1269 942 811 682 635 060
36
37
Appendix B
Properties of FACE Gasoline Blends with Ethanol
38
Table B1 Summary Data for FACE Gasoline Blends with Ethanol
Specific Tests FACE Gasoline Blend A B Ethanol Content (Vol ) 0 10 15 30 0 10 15 30 Ethanol Content (Vol ) (ASTM D5599) 0 1012 1469 2990 0 995 1473 3016 Research Octane Number (RON) (ASTM D2699) -Lab 1 843 922 951 1032 958 1015 1039 1067 -Lab 2 839 923 951 1017 960 1008 1023 1050 -Lab 3 835 917 946 1025 957 1012 1031 1069 -Lab 4 916 945 1018 1009 1026 1053 -Average 839 920 948 1023 958 1011 1030 1060 Motor Octane Number (MON) (ASTM D2700) -Lab 1 836 878 890 912 923 936 936 934 -Lab 2 833 874 891 917 931 935 934 931 -Lab 3 835 881 893 911 919 933 934 933 -Lab 4 884 901 916 935 936 933 -Average 835 879 894 914 924 935 935 933 Sensitivity (RON-MON) -Lab 1 07 44 61 120 35 79 103 133 -Lab 2 06 49 60 100 29 73 89 119 -Lab 3 0 36 53 114 38 79 97 136 -Lab 4 32 44 102 74 91 120 -Average 04 41 54 109 34 76 95 127 API Gravity (API˚) (ASTM D4052) -Lab 1 749 7164 7066 661 7131 690 6772 6375 -Lab 4 716 706 660 690 676 638 -Average 749 7162 7063 6605 7131 690 6766 6377 Density (ASTM D4052) -Lab 1 06849 06959 06992 07154 0697 07050 07096 07240 -Lab 4 06966 06999 07161 07055 07106 07244 -Average 06849 06963 06996 07158 0697 07053 07101 07242 RVP (psi) (D5191) Lab 1 83 95 94 91 73 87 86 83 Net Heat of Combustion (BTUlb) (ASTM D4809) 18308 Net Heat of Combustion (BTUlb) (ASTM D240) -Lab 1 19266 18294 18080 16751 19207 18319 17941 16631 -Lab 4 19236 18208 17963 16487 19168 18307 17696 16234 -Average 19251 18251 18021 16619 19187 18313 17818 16432
39
Table B1 Summary Data for FACE Gasoline Blends with Ethanol
Specific Tests FACE Gasoline Blend C H Target Ethanol Content (Vol ) 0 10 15 30 0 10 15 30 Ethanol Content (Vol) (ASTM D5599) 0 1018 1462 2949 0 1016 1459 3034 Research Octane Number (RON) (ASTM D2699) -Lab 1 850 918 951 1012 870 919 941 993 -Lab 2 840 920 950 1014 869 927 941 996 -Lab 3 840 917 946 1019 869 920 937 995 -Lab 4 914 945 1015 916 946 991 -Average 843 917 948 1015 869 921 941 994 Motor Octane Number (MON) (ASTM D2700) -Lab 1 830 876 893 921 797 821 835 861 -Lab 2 830 868 880 924 793 820 831 885 -Lab 3 829 876 887 909 799 817 829 858 -Lab 4 881 890 914 828 839 877 -Average 830 875 888 916 796 822 833 870 Sensitivity (RON-MON) -Lab 1 20 42 58 91 73 98 106 132 -Lab 2 10 52 70 90 76 107 110 111 -Lab 3 11 41 59 110 70 103 108 137 -Lab 4 33 55 101 88 107 114 -(RON)avg ndash (MON)avg 13 42 60 99 73 99 108 124 API Gravity (API˚) (ASTM D4052) -Lab 1 732 7069 6943 6523 5481 5416 5375 5247 -Lab 4 707 693 652 544 538 527 -Average 732 707 694 652 548 543 5377 526 Density (ASTM D4052) -Lab 1 06906 06991 07035 07186 07587 07614 07631 07684 -Lab 4 06997 07043 07192 07610 07636 07678 -Average 06994 07039 07189 07587 07612 07633 07681 RVP (psi) (D5191) Lab 1 75 86 85 83 76 88 87 84 Net Heat of Combustion (BTUlb) (ASTM D4809) 19186 18198 17955 16692 16265 Net Heat of Combustion (BTUlb) (ASTM D240) -Lab 1 19257 18375 18012 16739 18675 17891 17550 16369 -Lab 4 18576 17809 17408 16322 -Average 19257 18375 18012 16739 18625 17850 17479 16345
40
Table B1 Summary Data for FACE Gasoline Blends with Ethanol
Specific Tests FACE Gasoline Blend A B Target Ethanol Content 0 10 15 30 0 10 15 30 Ethanol Content (Vol) -ASTM D5599 0 1012 1469 2990 0 995 1473 3016 -Detailed Hydrocarbon Analysis - GCFID -Lab 1 0 1000 1463 3017 0 1001 1476 3014 Elemental Analysis (ASTM D 5291) -Carbon (wt) -Lab 1 8443 8178 7941 7306 8465 8172 8029 7346 -Lab 4 8433 8085 7823 7361 8471 8110 7921 7380 -Average 8438 8131 7882 7333 8468 8141 7975 7363 -Hydrogen (wt) -Lab 1 1543 1527 1484 1446 1473 1462 1442 1387 -Lab 4 1606 1573 1548 1515 1561 1540 1525 1487 -Average 1575 1550 1516 1481 1517 1501 1483 1437 -Oxygen (wt) (ASTM D5599) Lab 4 0 400 578 1150 0 389 571 1147
Specific Tests FACE Gasoline Blend C H Target Ethanol Content 0 10 15 30 0 10 15 30 Ethanol Content (Vol) -ASTM D5599 0 1018 1462 2949 0 1016 1459 3034 -Detailed Hydrocarbon Analysis - GCFID -Lab 1 0 1027 1483 2988 0 1021 1468 3040 Elemental Analysis (ASTM D 5291) -Carbon (wt) -Lab 1 8447 8200 7998 7336 8768 8402 8401 7624 -Lab 4 8419 8077 7909 7353 8720 8316 8150 7626 -Average 8433 8138 7954 7345 8744 8359 8276 7625 -Hydrogen (wt) -Lab 1 1494 1465 1465 1405 1205 1199 1207 1218 -Lab 4 1585 1668 1523 1509 1300 1305 1292 1316 -Average 1540 1567 1494 1457 1253 1252 1250 1267 -Oxygen (wt) (ASTM D5599) Lab 4 0 401 572 1129 0 368 527 1088
Table B1 Summary Data for FACE Gasoline Blends with Ethanol
41
Specific Tests FACE Gasoline Blend A B Target Ethanol Content 0 10 15 30 0 10 15 30 Distillation (˚F) (ASTM D86) Lab 1 IBP 90 106 99 99 97 105 103 101 5 122 127 122 126 133 128 126 129 10 140 134 131 135 149 135 134 138 20 165 145 144 146 175 147 146 149 30 186 153 152 153 196 155 154 155 40 198 159 156 156 209 165 159 159 50 204 202 159 158 214 211 165 161 60 207 208 204 159 218 217 214 162 70 210 211 210 160 221 219 219 163 80 213 214 213 161 226 225 224 165 90 219 222 219 211 236 234 234 230 95 228 233 229 224 248 247 246 242 FBP 262 261 263 260 280 271 270 266
Specific Tests FACE Gasoline Blend C H Target Ethanol Content 0 10 15 30 0 10 15 30 Distillation (˚F) (ASTM D86) Lab 1 IBP 93 104 102 107 98 96 105 106 5 126 126 123 130 127 123 125 127 10 139 131 131 136 143 132 134 138 20 157 140 140 145 170 145 147 152 30 174 147 147 151 194 153 156 159 40 188 153 153 156 213 167 161 163 50 201 183 157 159 229 217 182 166 60 210 208 176 161 243 236 235 169 70 218 217 215 162 263 255 253 175 80 227 226 223 165 291 283 282 268 90 245 244 241 233 329 322 323 312 95 274 274 269 261 357 351 351 343 FBP 330 331 322 324 408 401 407 396
42

3
2 STATISTICAL DESIGN OF FACE GASOLINES MATRIX
As mentioned in the Introduction the FACE Gasolines matrix was designed around the following four parameters RON octane sensitivity (S) aromatics content and n‐paraffins content The target levels selected were RON 70 85 and 95
Sensitivity le2 (ldquolowrdquo) and asymp10 (ldquohighrdquo) Aromatics 5 and 35 vol n‐paraffins 5 and 25 vol A full‐factorial set of test gasolines with these target levels consists of the twentyfour fuels listed in Table 21 Bill Leppard then used information about the refinery streams and components then available to CPChem the fuels blender and their proprietary non‐linear octane blending model to develop candidate fuel formulations Each blending recipe was optimized by manually adjusting the concentrations of the blending components (blending streams and pure components) In parallel John Orban used the same information about the refinery streams properties to systematically compute all possible candidate fuel formulations using a non‐proprietary linear octane blending model In both modeling efforts the optimum recipes were determined by considering the normalized deviation between the predicted and target properties of RON sensitivity aromatics vol and n‐paraffin vol Although the two modeling efforts were conducted independently there were many interactions during the process resulting in a single set of optimum recipes CPChem then used these optimum recipes to prepare and analyze hand blends for all twentyfour possible fuels These measurements are also listed in Table 1 The FACE Working Group realized that this number of fuels was unrealistic from a manufacturing cost and testing perspective and decided to limit the total number of fuels to ten One thing to note from the table is that four of the eight possible 70 RON fuels (designated by a ldquordquo in the table) were not blended because their model‐predicted properties were too far removed from the target properties The FACE Working Group decided to select two of the four 70 RON fuels for the final matrix of ten fuels These were fuels 1 and 10 Fuel 1 was selected because it contained the lowest amount of aromatics and nearly lowest amount of n‐paraffins Fuel 10 was selected because it contained the highest amounts of aromatics and n‐paraffins The remaining eight fuels were selected from among the sixteen 85 and 95 RON candidates using the D‐ and G‐optimality efficiencies which are two of the most common statistical techniques for evaluating experimental designs The D‐optimality technique generally produces designs that yield small standard errors for the parameter estimates small correlations between the parameter estimates and small standard errors for predicted responses within the design space The G‐optimality technique usually produces similar results The use of these statistical techniques to identify the optimum set of fuels requires defining the correlation model relating a measured engine response to the selected fuel parameters Three linear models were selected which included the following parameters Model 1 ndash Response=f(RON aromatics n‐paraffins and all 1st order interactions of these three parameters) Model 2 ndash Response=f(RON sensitivity aromatics n‐paraffins and all 2‐factor interactions involving RON) and Model 3 ndash Response=f(RON sensitivity aromatics n‐paraffins and all 2‐factor interactions not involving sensitivity) For all three models the D‐ and G‐optimality efficiencies were calculated for all possible sets of eight fuels and the resulting efficiencies were rank ordered The rank orderings of the fuel sets
4
between the D‐ and G‐optimality efficiencies were virtually identical There were however slight differences in the rank orderings among the three correlation models These results were discussed with the FACE Working Group which decided to select the optimum fuel set associated with Model 2 The target properties for this fuel set are listed in Table 22 along with the final fuel designations Once the FACE Working Group decided on the final fuel properties CPChem initiated efforts to make large batches of the fuels one at a time as time and equipment availability permitted At the start of production of each of the fuels small hand blends were first made since the compositions of some of the available refinery blendstocks had changed since the original handblends were made during the modeling efforts For some fuels this required several iterations to come close to meeting the target properties Analyses of the physical and chemical properties of the final commercial blends are presented in the next section
Table 21
Target and Measured Properties of Hand Blends of Optimized Fuel Blends
Fuel
Target Property Measured Property
Arom Vol
n‐Par Vol
RON Sens Arom Vol
n‐Par Vol
RON Sens
1 5 5 70 2 16 99 727 09
4 35 5 70 2
7 5 25 70 2 42 208 660 03
10 35 25 70 2 266 231 764 42
13 5 5 70 10 15 123 789 12
16 35 5 70 10
19 5 25 70 10
22 35 25 70 10
2 5 5 85 2 13 66 861 07
5 35 5 85 2 264 93 935 73
8 5 25 85 2 31 244 835 13
11 35 25 85 2 262 280 846 55
14 5 5 85 10 88 74 886 66
17 35 5 85 10 311 131 863 60
20 5 25 85 10 112 194 856 32
23 35 25 85 10 337 210 863 75
3 5 5 95 2 46 81 953 35
6 35 5 95 2 262 65 987 86
9 5 25 95 2 125 172 915 39
12 35 25 95 2 271 197 940 70
15 5 5 95 10 87 41 948 86
18 35 5 95 10 313 37 971 103
21 5 25 95 10 88 143 924 65
24 35 25 95 10 325 205 915 77
‐ Not blended because model‐predicted properties differed too significantly from target properties
5
Table 22
Target Fuel Parameters for Final Fuel Set
Final FACE Gasoline Designation
Initial Fuel Number
Aromatics Vol
n‐Paraffins
Vol
RON
Sensitivity
A 2 5 5 85 Low (le2)
B 3 5 5 95 Low (le2)
C 8 5 25 85 Low (le2)
D 12 35 25 95 Low (le2)
E 14 5 5 85 High (asymp10)
F 15 5 5 95 High (asymp10)
G 18 35 5 95 High (asymp10)
H 23 35 25 85 High (asymp10)
I 1 5 5 70 Low (le2)
J 10 35 25 70 Low (le2)
6
7
3 ANALYTICAL RESULTS FOR FACE GASOLINES
In this section results of the analyses of the physical and chemical properties of the first commercial
batches of each of the FACE Gasolines are discussed Chevron Phillips 66 BP and a contract laboratory
conducted the analyses Also included are the data provided on the CPChem Certificates of Analyses
(COAs) Note that future production runs that would be required to remake fuels that sell out likely will
result in some changes to the fuel property values reported here for the first production run
31 ASTM TEST RESULTS FOR PHYSICAL PROPERTIES
ASTM methods were used to measure the RON MON API gravity density distillation profiles RVP and
net heats of combustion of all of the FACE Gasolines The results of these analyses are summarized in
the sections below and also listed in detail in Table A1 located in Appendix A
311 RON MON and Octane Sensitivity
The ignition qualities of gasolines are typically characterized by RON and MON values RON values were
measured in CFR engines per ASTM method D2699 (4) Although the measurements were conducted in
several labs the lab‐to‐lab reproducibility was very good so only the average values are reported here
(but individual values are reported in Table A1) Bar charts of the average RON values for each fuel are
presented in Figure 31 (middle bars) Also included are the original design targets (1st bars) and the
values reported on the CPChem Certificates of Analysis (COA) (3rd bars) For most fuels the 3 values are
very close to each other (within plusmn1 unit of each other) The largest differences between measured and
target values are for fuels E H and J where the measured values are about 24‐38 units higher Fuel J is
also noteworthy because the value measured (1 lab only) is 2 units higher than the CPChem COA
Figure 31 RON Values of FACE Gasolines
850
950
850
950
850
950 950
850
700 700
839
958
843
942
874
940
965
869
700
738
835
960
847
932
875
944
968
869
703718
600
650
700
750
800
850
900
950
1000
A B C D E F G H I J
RON
Fuel
RON
Target
AVG
CPChem
8
MON values were measured in CFR engines per ASTM method D2700 (5) Although the measurements
were conducted in several labs the lab‐to‐lab reproducibility was very good so only the average values
are reported here (but individual values are reported in Table A1) Bar charts of the target measured
and CPChem COA MON values for each fuel are presented in Figure 32 The ldquotargetrdquo MON values were
determined by subtracting the target octane sensitivities from the target RON values The largest
difference between the values in this project and those reported on CPChemrsquos COA is 13 for fuel J The
largest differences between the measured and target values are for fuels D E F and H For Gasolines E
F and H the measured values are about 3‐6 units higher than target while for gasoline D the measured
values are about 6 units lower than the target
Figure 32 MON Values of FACE Gasolines
830
930
830
930
750
850 850
750
680 680
835
924
830
870
811
881
858
796
695 701
836
926
836
878
815
888
858
793
696
688
600
650
700
750
800
850
900
950
1000
A B C D E F G H I J
MON
Fuel
MON
Target
AVG
CPChem
9
Octane Sensitivity (S=RON‐MON) values are presented in the bar charts in Figure 33 The average sensitivities measured by the labs in this project are very close to those reported in CPChemrsquos COAs with the exception of Gasoline D The measured values for the three of the four high sensitivity fuels are quite a bit lower than the target value of 10 in the range of 59‐71 The exception is Gasoline G which comes close to meeting the target value Of the six low sensitivity fuels three (Gasolines A C and I) have values that meet the target value of le2 two have values that are slightly higher (Gasolines B and J) and one (Gasoline D) has a value that is significantly higher and in the range of the high sensitivity gasolines This discrepancy with Gasoline D is not surprising since it is very difficult to produce a low sensitivity fuel with a high level of aromatics which typically have high sensitivities Thus relative to the other manufactured FACE Gasolines Gasoline D should be considered a ldquohighrdquo sensitivity fuel
Figure 33 Octane Sensitivity Values of FACE Gasolines
312 Distillation Characteristics
The distillation properties of the fuels were determined by ASTM D86 (6) The D86 values obtained in
this study were very close to those reported on CPChemrsquos COAs The average of those two sources are
plotted in Figure 34 The values are also tabulated in Table A1 The temperature corresponding to a
given recovery fraction X is designated as TX (ie T90 indicates the temperature at which 90 of the
fuel has been vaporized and recovered) The initial boiling points (IBP) of all of the fuels are in a
relatively narrow range of 90‐110˚F In contrast the end boiling points (EBP) range from 253‐410˚F
Gasolines E G and H which are three of the four high sensitivity fuels have the highest EBPs Gasoline
E has a relatively steep increase in temperature of 140˚F from T90‐EBP Gasolines I and A the two fuels
having low sensitivity aromatics and n‐paraffin and low‐mid RON have the lowest EBPs Gasoline I
also has a relatively flat distillation profile from T30‐T90
100 100 100 100
04
34
13
72
63
59
107
71
05
3734
11
54
60
56
110
76
07
30
00
10
20
30
40
50
60
70
80
90
100
110
A B C D E F G H I J
Octan
e Sensitivity
Fuel
Octane Sensitivity
Target
AVG
CPChem
le2le2 le2 le2 le2 le2
‐01
10
Figure 34 ASTM D86 Distillation Curves for the FACE Gasolines
313 Reid Vapor Pressure (RVP)
The RVPs were determined using ASTM method D5191 (7) The values measured in this project were in
excellent agreement with those reported by CPChem COAs (within 01 psi) The averages of both values
are depicted in the bar charts in Figure 35 The values range from 67 to 805 psi
Figure 35 Reid Vapor Pressures of FACE Gasolines
500
1000
1500
2000
2500
3000
3500
4000
4500
0 10 20 30 40 50 60 70 80 90 100
Tempe
rature (˚ F)
Volume Distilled
D86 Distillation ‐ FACE Gasolines
A
B
C
D
E
F
G
H
I
J
805
735 745
680 670
780
725
755 760 750
0
1
2
3
4
5
6
7
8
9
A B C D E F G H I J
Reid Vap
or Pressure (p
si)
FACE Gasoline
Reid Vapor Pressure (RVP) ‐ FACE Gasolines
11
314 API Gravity and Density
The API gravities and densities of the fuels were measured using ASTM method D4052 (8) The
agreement between the values measured in this project and the values reported in the CPChem COAs
The individual values are listed in the Summary Table A1 in Appendix A The average of both values are
plotted in the bar charts in Figures 36 and 37 for API Gravity and density respectively As expected the
FACE Gasolines (D G H and J) having the highest aromatics content have the lowest API Gravities and
highest densities
Figure 36 API Gravities of FACE Gasolines
Figure 37 Densities of FACE Gasolines
7495
7135
7330
5870
6360
6860
54555580
7440
5910
0
5
10
15
20
25
30
35
40
45
50
55
60
65
70
75
80
A B C D E F G H I J
API G
ravity
FACE Gasoline
API Gravity ‐ FACE Gasolines
0685
0697
0691
0743
0725
0707
0760
0755
0697
0742
0645
065
0655
066
0665
067
0675
068
0685
069
0695
07
0705
071
0715
072
0725
073
0735
074
0745
075
0755
076
0765
077
A B C D E F G H I J
Density
(gml)
FACE Gasoline
Density ‐ FACE Gasolines
12
315 Net Heat of Combustion (NHC)
Net Heats of Combustion were measured using ASTM method D240 (9) The values are depicted in the
bar charts in Figure 38 In addition for two of the FACE Gasolines (C and J) the values were also
measured using ASTM method D4809 (10) The D4809 values were very close to those obtained from
method D240 (within 100 BTUlb) TheD240 values range from 18602 to 19251 BTUlb As expected
the FACE Gasolines having the highest aromatics content (D G H and J) have the lowest net heat of
combustion The FACE Gasolines having saturates content gt90 (A B C and I) have the highest net
heat of combustion
Figure 38 ASTM D240 Net Heats of Combustion of FACE Gasolines
19251
19187
19257
18649
18884
19072
1860218625
19225
18731
18200
18400
18600
18800
19000
19200
19400
A B C D E F G H I J
Net Heat o
f Com
bustion (BTU
lb) (A
STM D240)
FACE Gasoline
Net Heat of Combustion ‐ FACE Gasolines
13
32 CHEMICAL PROPERTIES OF FACE GASOLINES
The various types of hydrocarbons in the fuels were characterized by several techniques including
supercritical fluid chromatography (SFC) and detailed hydrocarbon analysis (DHA) by gas
chromatography using a flame ionization detector (GC‐FID) In addition the carbon hydrogen and
sulfur contents were measured Results are reported in the following sections
321 Aromatics by Supercritical Fluid Chromatography (SFC)
The SFC method of ASTM D5186 (11) separates the hydrocarbons into three fractions monoaromatics
polyaromatics and non‐aromatics and characterizes the composition in terms of mass Bar graphs of
the results are presented in Figure 39 Samples of FACE Gasolines B D E G and H were analyzed by
two labs The results from the two labs were very close to each other and so the averages are depicted
in the figure FACE Gasolines A B C and I have nonromatics levels gt90 wt FACE Gasolines D G and
H have the highest amounts of monoaromatics with values ranging from 394‐420 wt FACE
Gasolines E G and H appear to have about 1 wt polyaromatics
Figure 39 Compositions of FACE Gasolines by Supercritical Fluid Chromatography (ASTM D5186)
070 790 600
4175
14001000
39404200
040
3870
015
100
110125
030
9930
9210 9400
5810
85009000
59505675
9960
6100
0
10
20
30
40
50
60
70
80
90
100
A B C D E F G H I J
Composition (Wt )
FACE GASOLINE
SFC Composition ‐ FACE Gasolines
MonoAromatics PolyAromatics NonAromatics
14
322 Hydrocarbons by Detailed Hydrocarbon Analysis (DHA)
Detailed Hydrocarbon Analyses were performed by two labs using gas chromatography with flame
ionization detectors (GC‐FID) This technique enables the determination of concentration on a species‐
by‐species basis provided that retention factors have been determined for each species in the fuel The
results from both labs were very close to each other Bubble charts of the average concentration values
(in volume ) are depicted in Figure 310 for the low sensitivity fuels and Figure 311 for the high
sensitivity fuels on a carbon number basis for the five hydrocarbon classes n‐paraffins iso‐paraffins
naphthenes aromatics and olefins
In general the low sensitivity FACE Gasolines are characterized by large amounts of low sensitivity
components such as n‐paraffins and iso‐paraffins The high sensitivity FACE Gasolines contain more high
sensitivity components such as olefins and naphthenes than the low sensitivity fuels
The total concentration of components within each of the five hydrocarbon classes were added and the
sums are reported in the bar charts in Figure 312 The n‐paraffin levels range from 225‐316 vol for
the four FACE Gasolines (C D H and J) that had targets of 25 vol For the other FACE Gasolines that
had a target level of 5 vol the n‐paraffins levels range from 44‐117 vol The aromatics levels range
from 317‐358 vol for the four FACE Gasolines (D G H and J) that had targets of 35 vol For the
other six FACE Gasolines that had a target level of 5 vol the aromatics levels range from 0‐109 vol
The C7 aromatic is toluene the C8 aromatics consist of a mix of ethylbenzene and the xylene isomers
the C9 aromatics consist of a mix of trimethylbenzenes and methylethylbenzenes and the C10 aromatics
consist of a mix of tetramethylbenzenes dimethylethylbenzenes and methylpropylbenzenes FACE
Gasoline E a high sensitivity fuel has a naphthene content of 208 vol mainly cyclopentane and
cyclohexane Three other high sensitivity fuels (F G and H) have naphthenes concentrations of about
11 vol mainly cyclopentane Those high sensitivity fuels also have the highest olefins content with
concentrations ranging from 68‐127 vol FACE Gasoline I also has 64 vol olefins The C6 olefin is
1‐hexene The C5 olefins consist of a mix of 2‐pentene and methyl butenes In contrast to the high
sensitivity fuels Gasoline D which was designed to be low sensitivity but ended up in the high
sensitivity range has essentially no naphthenes or olefins Its high sensitivity is derived from its high
aromatics content
The C5 isoparaffin in all of the fuels is 2‐methylbutane The C6 isoparaffins consist of a mix of 2‐ and 3‐
methyl pentanes and 23 dimethyl butane The C7 isoparaffins in most of the FACE Gasolines consist of a
mix of 2‐ and 3‐methyl hexanes and 23‐ and 24‐dimethylpentanes The C8 isoparaffins are
predominantly trimethylpentanes with more than 50 of those being isooctane (224
trimethylpentane) The other isomers are mainly 24‐ and 25 dimethylhexanes and 2‐methyl 3‐ethyl
pentane
15
Figure 310 Detailed Hydrocarbon Analyses of Low Sensitivity FACE Gasolines
122 44 219 451 11
48 65
065
3 4 5 6 7 8 9 10 11
Carbon Number
FACE Gasoline A ‐ Detailed Hydrocarbon Analysis (vol)
isoparaffins
n‐paraffins
cycloparaffins
aromatics
olefins
104 13 137 587 16
59
39 37
3 4 5 6 7 8 9 10 11
Carbon Number
FACE Gasoline B ‐ Detailed Hydrocarbon Analysis (vol)
isoparaffins
cycloparaffins
aromatics
olefins
n‐paraffins
64 27 117 468 20 075
30 06
31 118 100
3 4 5 6 7 8 9 10 11
Carbon Number
FACE Gasoline C ‐ Detailed Hydrocarbon Analysis (vol)
isoparaffins
cycloparaffins
aromatics
olefins
n‐paraffins
12 410
99 35 150 46
47 114 70
3 4 5 6 7 8 9 10 11
Carbon Number
FACE Gasoline D ‐ Detailed Hydrocarbon Analysis (vol)
isoparaffins
cycloparaffins
aromatics
olefins
n‐paraffins
41 34 99 321 236 11
07 135
24
11
59
3 4 5 6 7 8 9 10 11
Carbon Number
FACE Gasoline I ‐ Detailed Hydrocarbon Analysis (vol)
isoparaffins
n‐paraffins
cycloparaffins
aromatics
olefins
327
90 124 95
22
14 131 145 29
06
3 4 5 6 7 8 9 10 11
Carbon Number
FACE Gasoline J ‐ Detailed Hydrocarbon Analysis (vol)
isoparaffins
n‐paraffins
cycloparaffins
aromatics
olefins
16
Figure 311 Detailed Hydrocarbon Analyses of High Sensitivity FACE Gasolines
64 68 143 165 18 07
70 105 19 10 04
46 17 18 16 08
21 82 09
29 06 37
3 4 5 6 7 8 9 10 11
Carbon Number
FACE Gasoline E ‐ Detailed Hydrocarbon Analysis (vol)
isoparaffins
cycloparaffins
aromatics
olefins
n‐paraffins
82 64 134 378 14
21 21
100
76
89
3 4 5 6 7 8 9 10 11
Carbon Number
FACE Gasoline F ‐ Detailed Hydrocarbon Analysis (vol)
isoparaffins
n‐paraffins
cycloparaffins
aromatics
olefins
65 66 72 152 16 10
74 09 16 10
15 33 218 54 14
36 25 10
37 07 10
3 4 5 6 7 8 9 10 11
Carbon Number
FACE Gasoline G ‐ Detailed Hydrocarbon Analysis (vol)
isoparaffins
cycloparaffins
aromatics
olefins
n‐paraffins
28 54 71 39 22 09
66 08 17 10
10 95 117 83 43 14
29 21 09
54 05 145 08
3 4 5 6 7 8 9 10 11
Carbon Number
FACE Gasoline H ‐ Detailed Hydrocarbon Analysis (vol)
isoparaffins
cycloparaffins
aromatics
olefins
n‐paraffins
17
Figure 312 Detailed Hydrocarbon Analyses Comparisons of FACE Gasolines
A comparison of the composition results from the DHA and SFC methods is presented in Figure 313 for
the low sensitivity fuels and Figure 314 for the high sensitivity fuels Also included are Fluorescent
Indicator Absorption (FIA ndash ASTM D1319 (12)) composition results reported on the CPChem COAs Since
the FIA method determines total saturates the DHA results for n‐paraffins iso‐paraffins and
naphthenes must be added together to enable the comparison between those two methods Similarly
since the SFC method directly measures aromatics and total non‐aromatics are determined by
difference the olefins amount must be added to the total saturate levels from FIA and DHA to enable
comparisons with the non‐aromatics values from SFC The appropriate comparison categories are
indicated by dashed lines in Figures 313 and 314 Of the three methods SFC generally gives the
highest level of aromatics and FIA the lowest The DHA aromatics values are closer to the FIA levels than
to the SFC levels The DHA olefins are fairly close to the FIA results
117
80
244 241
7944 67
225144
316
860
859
697
421
459
676
384
228
745336
16
01
01208
110
115105
33
23
13
127
94
8168
64
06
58 39
334
10977
336 358
12
317
0
10
20
30
40
50
60
70
80
90
100
A B C D E F G H I J
Composition ( vol)
FACE GASOLINE
DHA Composition ‐ FACE Gasolines
n‐paraffins isoparaffins naphthenes olefins aromatics
18
Figure 313 Comparison of Composition Methods FACE Low Sensitivity Gasolines
Figure 314 Comparison of Composition Methods FACE High Sensitivity Gasolines
117
80
244
144
316
860 859
697
745336
16
01 0433
23
13 64
06
58 3912
317
996951 975
929
712
04
07 04 62
10
42 21 09
278
993
921 940996
610
07
79 6004
390
0
10
20
30
40
50
60
70
80
90
100
DHA FIA SFC DHA FIA SFC DHA FIA SFC DHA FIA SFC DHA FIA SFC
Composition ( )
FACE GASOLINE
Composition ‐ Low Sensitivity FACE Gasolines
n‐paraffins isoparaffins naphthenes olefins aromatics saturates nonaromatics
A B C I J
241
7944 67
225
421
459
676
384
228
01
208
110
115 105
127
94
81 68
334
10977
336 358
701
780
856
587 568
04
99
86
7879
295
12158
335 353
581
850900
595568
419
150100
405432
0
10
20
30
40
50
60
70
80
90
100
DHA FIA SFC DHA FIA SFC DHA FIA SFC DHA FIA SFC DHA FIA SFC
Composition ( )
FACE GASOLINE
Composition ‐ High Sensitivity FACE Gasolines
n‐paraffins isoparaffins naphthenes olefins aromatics saturates nonaromatics
D E F G H
19
323 Elemental Analyses
Carbon and hydrogen contents were measured by two labs using ASTM method D5291 (13) The
average results are presented in the bar graphs in figure 315 The carbon contents range from 8399‐
8748 wt and the hydrogen contents range from1252‐1601 wt As expected the FACE Gasolines
having the highest aromatics content (D G H and J) have the highest carbon and lowest hydrogen
contents
Figure 315 Carbon and Hydrogen Elemental Analyses of FACE Gasolines
8399 8443 8453 8646 8547 8496 8670 87488414 8624
1601 1557 1547 1354 1453 1504 1330 12521586 1376
0
10
20
30
40
50
60
70
80
90
100
A B C D E F G H I J
Compo
sition
(wt)
FACE Gasoline
Carbon‐Hydrogen Elemental Analyses
Hydrogen
Carbon
20
Sulfur content was measured by one lab ASTM method D5453 (14) The results displayed in the bar
charts in Figure 316 are essentially identical to the values reported on the CPChem COAs All FACE
Gasolines had ultra‐low sulfur levels FACE Gasolines E G and H had the highest levels at 21 22 and 15
ppm sulfur The other fuels had levels ranging from 2‐6 ppm
Figure 316 Sulfur Levels of FACE Gasolines
6
4 4
2
21
2
22
15
2 2
0
5
10
15
20
25
A B C D E F G H I J
Sulfur Content (p
pm)
FACE Gasoline
Sulfur Content ‐ FACE Gasolines
21
4 ANALYTICAL RESULTS FOR FACE GASOLINES BLENDED WITH ETHANOL
Although the FACE Gasolines were not formulated with ethanol the expectation is that some potential
users will be interested in testing the fuels with ethanol added To assist selection of fuels for those
studies four FACE Gasolines were selected for blending with levels of 10 15 and 30 vol ethanol The
fuels selected for this purpose were A B C and H The positions of these fuels in the design matrix are
shown below
In this section results of the analyses of the ethanol blends are discussed Chevron Phillips 66 BP and
a contract laboratory conducted the analyses As mentioned previously future production runs that are
required to remake fuels that sell out likely will results in some changes to the fuel property values
reported here
41 ASTM TEST RESULTS
ASTM methods were used to measure the ethanol content RON MON API gravity density distillation
profiles RVP and net heats of combustion of all of the ethanol blends made with the FACE Gasolines
The results of these analyses are summarized below and in Table A2 located in the Appendix
411 Ethanol Content
FACE Gasolines A B C and H were blended with nominally 10 15 and 30 vol ethanol The
concentration of ethanol in each blend were determined using ASTM method D5599 (15) (coupled with
ASTM D4052 density measurement) and by detailed hydrocarbon analysis using gas chromatography
with a flame ionization detector The results for both methods were in excellent agreement for all fuels
as shown below in Table 41
Table 41 Measured Ethanol Content of FACE Gasoline Blends
Ethanol Content (vol)
A B C H
10 15 30 10 15 30 10 15 30 10 15 30
D5599 101 147 299 100 147 302 102 146 295 102 146 303
DHA 100 146 301 100 148 301 103 148 299 102 147 304
22
412 RON MON and Octane Sensitivity
RON values were measured in CFR engines per ASTM method D2699 (4) Although the measurements
were conducted in four labs the lab‐to‐lab reproducibility was very good so only the average values are
reported here (but individual values are reported in Table A2) Average RON values for each fuel are
presented in Figure 41 For all four of these FACE Gasolines the RON values continue to increase even
at the 30 ethanol level although the rates of increase are lower than at lower ethanol levels FACE
Gasoline B has the highest RON at all ethanol levels with a value of about 106 at the 30 ethanol level
FACE Gasolines A and C have essentially the same RON values at all ethanol levels with RON values of
about 102 at the 30 ethanol level FACE Gasoline H without ethanol has a higher RON than A and C
but a lower RON at the 15 and 30 ethanol levels
Figure 41 RON Values of FACE Gasoline Blends with Ethanol
MON values were measured in CFR engines per ASTM method D2700 (5) Although the measurements were conducted in four labs the lab‐to‐lab reproducibility was very good so only the average values are reported here (but individual values are reported in Appendix A2) The MON values for each fuel are
presented in Figure 42 FACE Gasoline B has the highest MON values at all ethanol levels but unlike the other FACE Gasolines the MON value did not increase with ethanol contents above 10 vol The MON values for FACE Gasolines A and C were essentially the same and higher than those for FACE Gasoline H
80081082083084085086087088089090091092093094095096097098099010001010102010301040105010601070108010901100
0 5 10 15 20 25 30 35
RON
Ethanol (vol)
RON Values ‐ FACE Gasoline + Ethanol Blends
FACE A
FACE B
FACE H
FACE C
23
Figure 42 MON Values of FACE Gasoline Blends with Ethanol
Octane Sensitivity (S=RON‐MON) values are presented in Figure 43 As expected due to the relatively high sensitivity of ethanol the sensitivities of all four FACE Gasolines increase as the ethanol content increases FACE Gasoline H has the highest sensitivity at all ethanol levels except at 30 vol ethanol where the sensitivity of the FACE Gasoline B blend becomes slightly higher with values of 124 and 132 respectively The sensitivities for FACE Gasolines A and C are very similar to each other and although lower than the blends for the other FACE Gasolines have the highest rates of increase at the 30 level
Figure 43 Octane Sensitivities FACE Gasoline Blends with Ethanol
750
760
770
780
790
800
810
820
830
840
850
860
870
880
890
900
910
920
930
940
950
0 5 10 15 20 25 30 35
MON
Ethanol (vol)
MON Values ‐ FACE Gasoline + Ethanol Blends
FACE A
FACE B
FACE H
FACE C
00
10
20
30
40
50
60
70
80
90
100
110
120
130
140
0 5 10 15 20 25 30 35
S
Ethanol (vol)
Octane Sensitivity (S) ‐ FACE Gasoline + Ethanol Blends
FACE A
FACE B
FACE H
FACE C
24
413 Distillation Characteristics
The distillation properties of the fuels were determined by ASTM D86 (6) The values are plotted in
Figure 44 and tabulated in Table A2 in the Appendix The behavior and shapes of the curves are very
similar For a given gasoline all of the ethanol blends start at about the same IBP The blends
containing ethanol then follow the same curve which is lower than the base gasoline At a certain point
the ethanol blends then rise quickly to rejoin the distillation curve of the base gasoline The lower the
ethanol content of the blend the earlier (lower distilled volume ) the curve rejoins the base gasoline
curve
Figure 44 ASTM D86 Distillation Profiles for FACE Gasoline Blends with Ethanol
50
100
150
200
250
300
0 10 20 30 40 50 60 70 80 90 100
Temperature (˚ C)
Volume Distilled
D86 Distillation ‐ FACE A Gasoline + Ethanol Blends
0 EtOH
10 EtOH
15 EtOH
30 EtOH
50
100
150
200
250
300
0 10 20 30 40 50 60 70 80 90 100
Temperature (˚ C)
Volume Distilled
D86 Distillation ‐ FACE B Gasoline + Ethanol Blends
0 EtOH
10 EtOH
15 EtOH
30 EtOH
50
100
150
200
250
300
350
0 10 20 30 40 50 60 70 80 90 100
Temperature (˚ C)
Volume Distilled
D86 Distillation ‐ FACE C Gasoline + Ethanol Blends
0 EtOH
10 EtOH
15 EtOH
30 EtOH
50
100
150
200
250
300
350
400
450
0 10 20 30 40 50 60 70 80 90 100
Temperature (˚ C)
Volume Distilled
D86 Distillation ‐ FACE H Gasoline + Ethanol Blends
0 EtOH
10 EtOH
15 EtOH
30 EtOH
25
414 Reid Vapor Pressure (RVP)
The RVPs were determined using ASTM method D5191 (7) The values are plotted in Figure 45 For all
fuels the RVP appears to peak between 10 and 15 vol ethanol and then starts to decrease as the
ethanol content increases further
Figure 45 Reid Vapor Pressures for FACE Gasoline Blends with Ethanol
415 API Gravity and Density
The API gravities and densities of the fuels were measured by two labs using ASTM method D4052 (8) The values from the two labs were in excellent agreement and are listed in Table A2 The average density values are presented in Figure 46 For all of the FACE Gasolines the density increased as the ethanol content increased
Figure 46 Densities of FACE Gasoline Blends with Ethanol
7
75
8
85
9
95
10
0 5 10 15 20 25 30 35
RVP (psi)
Ethanol (vol)
Reid Vapor Pressure (RVP) ‐ FACE Gasoline + Ethanol Blends
FACE A
FACE B
FACE H
FACE C
0685 0697 0691
0759
0696 0705 0699
0761
0700 0710 0704
0763
0716 0724 0719
0768
0
01
02
03
04
05
06
07
08
09
1
A B C H
Density
(gm
l)
Ethanol (vol)
Density ‐ FACE Gasoline Blends with Ethanol
0
10
15
30
26
416 Net Heat of Combustion (NHC)
Net Heats of Combustion were measured by 2 labs using ASTM method D240 (9) For some fuels ASTM
method D4809 (10) was also used The values from both labs and both methods were very close to each
other and the average values are plotted in Figure 47 As expected since the net heat of combustion of
ethanol is lower than that of gasoline for all FACE Gasolines the net heat of combustion decreased as
ethanol content increased The decrease appeared to be linear with ethanol content The decrease
appeared to be steepest for FACE Gasoline B
Figure 47 Net Heat of Combustion of FACE Gasoline Blends with Ethanol
16000
16250
16500
16750
17000
17250
17500
17750
18000
18250
18500
18750
19000
19250
19500
0 5 10 15 20 25 30 35
Net Heat of C
ombustion (B
TUlb)
Ethanol (vol)
Net Heat of Combustion ‐ FACE Gasoline + Ethanol Blends
FACE A
FACE B
FACE H
FACE C
27
5 SUMMARY AND CONCLUSIONS
A subteam of the CRC AVFL FACE Working Group has designed a matrix of reference gasolines
known as the FACE Gasolines A commercial vendor has produced and made the fuels available
for purchase in research quantities It is expected that this will enable consistent comparisons
of engine and combustion results from different laboratories and test platforms based on the
use of the same set of fuels
The matrix is designed around four parameters expected to be of importance for advanced
gasoline engines RON octane sensitivity aromatics content and n‐paraffins content
Statistical methods were used to identify potential candidate formulations and down‐select to a
tractable number of 10 formulations
Detailed analyses were performed on the physical and chemical properties of the final fuel
formulations
Generally the property values measured in the current study agreed very well with the values
reported on the fuel blender (ChevronPhillips Chemical Company ‐ CPChem) Certificates of
Analyses (COAs)
As expected conflicts in the target properties for some of the fuels (such as high aromatics level
coupled with low octane sensitivity) led to some trade‐offs that resulted in some deviation in
the actual properties from the design properties
The RON values come close to meeting the targets for most of the fuels Fuels E H and J have
values that are 24‐38 units higher than the targets
Three of the four ldquohighrdquo sensitivity fuels have measured values of 59‐71 that are lower than
the target value of 10 Two of the ldquolowrdquo sensitivity fuels have measured values (34‐37) that are
a bit higher than the target value of le2 One of the low sensitivity design fuels (ldquoDrdquo) has a value
of 72 that actually effectively makes it a high sensitivity fuel
Detailed hydrocarbon analyses (DHA) indicate that the n‐paraffins contents range from 225‐
316 vol for the four FACE Gasolines that had targets of 25 vol and from 44‐117 vol for
the six FACE Gasolines that had targets of 5 vol
DHAs indicate that the aromatics contents range from 317‐358 vol for the four FACE
Gasolines that had a target of 35 vol and 0‐109 vol for the other fuels that had a target of 5
vol
The high sensitivity fuels contained the high sensitivity components of naphthenes (105‐208
vol) and olefins (68‐127 vol) The exception was Gasoline ldquoDrdquo which had neither of these
components but whose high sensitivity was derived from aromatics components
Five of the FACE Gasolines (ldquoArdquo ldquoBrdquo ldquoCrdquo ldquoFrdquo and ldquoIrdquo) are very rich in isoparaffins with contents ge
676 vol
Aromatics values determined by SFC were generally higher than the values obtained from DHA
The DHA olefins values were close to the FIA values reported on the CPChem COAs
The fuels having the highest aromatics content also have the highest densities and highest net
heats of combustion on an energy content per volume basis
With regards to distillation properties for all fuels the initial boiling points (IBPs) are in a
narrow range of 90‐110˚F although the end boiling points (EBPs) range from 253‐410˚F Three
28
of the high sensitivity fuels have the highest EBPs The two low‐mid RON fuels having low n‐
paraffins and low aromatics have the lowest EBPs
All of the FACE Gasolines have ultra‐low levels of sulfur with the highest value at 22 ppm S and
most fuels having le 6 ppm S
For the four FACE Gasolines blended with ethanol RON continues to increase as the ethanol
levels increase to 30 vol although the rate of increase is lower as the ethanol content
increases FACE Gasoline B which has the highest RON of 96 has the highest RON at all ethanol
levels with a value of about 106 at 30 ethanol At the same ethanol level FACE Gasolines A
and C have essentially the same RON values FACE Gasoline H starts with a higher RON value
than those of A or C but has a lower value at blend levels of 15 and 30 vol
MON increased as the ethanol level increased for FACE Gasolines A C and H The MON values
for these fuels were essentially constant even though the highest MON values were found for
the ethanol blends with FACE Gasoline B
For all blends octane sensitivity increased as ethanol content increased with the highest values
of 12‐13 for 30 vol ethanol blends with FACE Gasolines B and H
The D86 distillation curve trends are similar for the four FACE Gasolines For a given gasoline all
blends start at the same point At around 10 vol distilled the curves for the blends with
ethanol diverge from and are lower than the curves for the base gasolines At a certain point
the distillation curves for the blends rise quickly and re‐join the curve for the parent base fuel
The distillation curves for the 30 vol ethanol blends are generally flat as a function of
increasing vol distilled and only start to increase again at about 70‐80 vol distilled when
most of the ethanol has been distilled from the liquid
The Reid Vapor Pressures (RVPs) peak at about 10‐15 vol
Densities increase slightly as ethanol increases while net heats of combustion decrease
29
6 REFERENCES
1 Alnajjar M Cannella B Dettman H Fairbridge C Franz J Gallant T Gieleciak R Hager D Lay C Lewis S Ratcliff M Sluder S Storey J Yin H Zigler B ldquoChemical and Physical Properties of the Fuels for Advanced Combustion Engines (FACE) Research Diesel Fuelsrdquo CRC Report No FACE‐1 (2010)
2 Gallant T Franz J Alnajjar M Storey J Lewis S Sluder S Cannella W Fairbridge C Hager D Dettman H Luecke J Ratcliff M Zigler ldquoFuels for Advanced Combustion Engines Research Diesel Fuels Analysis of Physical and Chemical Propertiesrdquo SAE Paper 2009‐01‐2769 (2009)
3 CannellaW Fairbridge C Arboleda P Bays T Dettman H Foster M Gieleciak R Gunter G Hager D Lay C Lewis S Luecke J Sluder S Zigler B ldquoDetailed Characterization of the Physical and Chemical Properties of the Reformulated FACE Diesel Fuels FD2B FD4B and FD7Brdquo CRC Report AVFL‐19‐1 (2013)
4 ASTM International Standard Test Method for Research Octane Number of Spark‐Ignition Engine Fuel ASTM D2699 (ASTM International Pennsylvania 2009)
5 ASTM International Standard Test Method for Motor Octane Number of Spark‐Ignition Engine Fuel ASTM D2700 (ASTM International Pennsylvania 2009)
6 ASTM International Standard Test Method for Distillation of Petroleum Products at Atmospheric Pressure ASTM D86‐09e1 (ASTM International Pennsylvania 2009)
7 ASTM International Standard Test Method for Vapor Pressure of Petroleum Products (Mini‐Method) ASTM D5191 (ASTM International Pennsylvania 2009)
8 ASTM International Standard Test Method for Density and Relative Density of Liquids by Digital Density Meter ASTM D4052‐96(2002)e1 (ASTM International Pennsylvania 2002)
9 ASTM International Standard Test Method for Heat of Combustion of Liquid Hydrocarbon Fuels by Bomb Calorimeter ASTM D240‐02(2007) (ASTM International Pennsylvania 2007)
10 ASTM International Standard Test Method for Heat of Combustion of Liquid Hydrocarbon Fuels by Bomb Calorimeter ASTM D4809 (2007) (ASTM International Pennsylvania 2007)
11 ASTM International Standard Test Method for Determination of Aromatic Content and Polynuclear Aromatic Content of Diesel Fuels and Aviation Turbine Fuels by Supercritical Fluid Chromatography ASTM D5186‐03(2009) (ASTM International Pennsylvania 2009)
12 ASTM International Standard Test Method for Hydrocarbon Types in Liquid Petroleum Products by Fluorescent Indicator Adsorption ASTM D1319‐08 (ASTM International Pennsylvania 2008)
13 ASTM International Standard Test Methods for Instrumental Determination of Carbon Hydrogen and Nitrogen in Petroleum Products and Lubricants ASTM D5291‐02(2007) (ASTM International Pennsylvania 2007)
14 ASTM International Standard Test Methods for Determination of Total Sulfur in Light Hydrocarbons Spark‐Ignition Engine Fuel Diesel Engine Fuel and Engine Oil by Ultraviolet Fluorescence ASTM D5453(2007) (ASTM International Pennsylvania 2007)
15 ASTM International Standard Test Methods for Determination of Oxygenates in Gasoline by Gas Chromatography and Oxygen Selective Flame Ionization Detection ASTM D5599 (2007) (ASTM International Pennsylvania 2007)
30
31
Appendix A
Properties of FACE Gasolines
32
Table A1 Summary Data for FACE Gasolines
Specific Tests FACE Gasoline A B C D E F G H I J Research Octane Number (RON) (ASTM D2699) -Lab 1 843 958 850 946 871 940 969 870 700 738 -Lab 2 839 960 840 939 877 960 869 -Lab 3 835 957 840 -Average 839 958 843 942 874 940 965 869 7015 738 -CPChem COA 835 960 847 932 875 944 968 869 703 718 Motor Octane Number (MON) (ASTM D2700) -Lab 1 836 923 830 872 813 881 857 797 695 701 -Lab 2 833 931 830 868 808 860 799 -Lab 3 835 919 829 -Average 835 924 830 870 811 881 858 798 695 701 -CPChem COA 836 926 836 878 815 888 858 793 696 688 Sensitivity (RON-MON) -Lab 1 07 35 20 74 58 59 112 73 05 37 -Lab 2 06 29 10 71 69 100 70 -Lab 3 0 38 11 -Average 04 34 13 72 63 59 107 72 05 37 -CPChem COA -01 34 11 54 60 56 110 76 07 30 API Gravity (API˚) (ASTM D4052) -CPChem COA 750 714 734 587 636 686 545 568 744 595 -Lab 1 749 713 732 587 636 686 546 548 744 587 -Average 7495 7135 733 587 636 686 5455 558 744 591 Density (ASTM D4052) -CPChem COA 0691 0743 0725 0707 0760 0697 0741 -Lab 1 0685 0697 0691 0743 0725 0707 0760 0759 0697 0743 -Average 0685 0697 0691 0743 0725 0707 0760 0759 0697 0742 RVP (psi) (D5191) -CPChem COA 81 74 74 68 67 78 72 75 75 75 -Lab 1 80 73 75 73 76 77 Net Heat of Combustion (BTUlb) (ASTM D4809) 19186 18680 Net Heat of Combustion (BTUlb) (ASTM D240) 19251 19187 19257 18649 18884 19072 18602 18625 19225 18731
33
TableA1 Summary Data for FACE Gasolines
Specific Tests FACE Gasoline A B C D E F G H I J Distillation (˚F) (ASTM D86) -CPChem IBP 93 95 95 88 110 108 93 94 100 101
5 104 128 120 129 131 129 122 123 123 111 10 132 145 136 148 142 142 135 140 156 162 20 160 172 154 176 155 156 158 168 177 206 30 183 194 171 198 166 168 183 192 186 217 40 197 207 187 212 177 180 210 211 191 224 50 203 213 200 221 186 193 240 227 195 231 60 207 216 210 229 197 206 270 242 199 242 70 210 220 218 235 208 217 306 262 203 261 80 213 225 226 280 222 225 328 291 207 291 90 219 235 243 330 267 240 343 327 213 316 95 227 248 270 340 343 261 363 358 220 330 FBP 269 283 328 363 405 294 403 410 259 358
-Lab 1 IBP 90 97 93 97 107 102 99 98 99 95 5 122 133 126 133 134 134 122 127 139 111
10 140 149 139 151 143 144 136 143 160 166 20 165 175 157 179 156 157 158 170 178 209 30 186 196 174 200 168 169 182 194 187 219 40 198 209 188 214 177 182 209 213 192 225 50 204 214 201 224 188 195 238 229 196 232 60 207 218 210 234 197 207 268 243 200 242 70 210 221 218 248 208 218 304 263 204 263 80 213 226 227 288 224 228 328 291 208 292
90 219 236 245 331 258 243 343 329 213 316 95 228 248 274 341 329 261 358 357 220 330 FBP 262 280 330 365 402 291 405 408 247 357
-Average IBP 915 96 94 925 1085 105 96 96 995 98 5 113 1305 123 131 1325 1315 122 125 131 111
10 136 147 1375 1495 1425 143 1355 1415 158 164 20 1625 1735 1555 1775 1555 1565 158 169 1775 203 30 1845 195 1725 199 167 1685 1825 193 1865 218 40 1975 208 1875 213 177 181 2095 212 1915 2245 50 2035 2135 2005 2225 187 194 239 228 1955 2315 60 207 217 210 2315 197 2065 269 2425 1995 242 70 210 2205 218 2415 208 2175 305 2625 2035 262 80 213 2255 2265 284 223 2265 328 291 2075 2915
90 219 2355 244 3305 2625 2415 343 328 213 316 95 2275 248 272 3405 336 261 3605 3575 220 330 FBP 2655 2815 329 364 4035 2925 404 409 253 3575
34
Table A1 Summary Data for FACE Gasolines
Specific Tests FACE Gasoline A B C D E F G H I J Elemental Analysis (ASTM D 5291) -Carbon (wt) -Lab 1 8398 8441 8497 8647 8547 8671 8792 8415 -Lab 4 8400 8444 8419 8645 8547 8496 8669 8703 8414 8624 -Average 8399 8443 8458 8646 8547 8496 8670 8748 8414 8624 -Hydrogen (wt) -Lab 1 1602 1559 1503 1353 1453 1329 1208 1585 -Lab 4 1600 1556 1585 1355 1453 1504 1331 1297 1586 1376 -Average 1601 1557 1547 1354 1453 1504 1330 1252 1586 1376 Sulfur by UV Fluorescence (ppmw) (ASTM D5453) -CPChem COA 4 4 3 2 21 2 20 15 2 2 -Lab 4 6 4 4 2 21 2 22 15 2 2 Hydrocarbons by FIA (vol) (ASTM D1319) -Aromatics (vol) CPChem COA 0 42 21 295 121 58 335 353 09 278 -Olefins (vol) CPChem COA 04 07 04 04 99 86 78 79 62 10 -Saturates (vol) CPChem COA 996 951 975 701 780 856 587 568 929 712 Aromatics by SFC (ASTM D5186) (Lab 1) -MonoAromatics (wt) -Lab 1 07 78 60 414 142 100 393 412 04 387 -Lab 2 80 421 138 395 428 -Average 07 79 60 4175 140 100 394 420 04 387 -PolyAromatics (wt) -Lab 1 0 0 0 03 11 0 10 10 0 03 -Lab 2 0 0 09 12 15 -Average 0 0 0 015 10 0 11 125 0 03 -NonAromatics (wt) -Lab 1 993 922 940 583 847 900 597 578 996 610 -Lab 2 920 579 850 593 557 -Average 993 921 940 581 8475 900 595 5675 996 610
35
Table A1 Summary Data for FACE Gasolines
Specific Tests FACE Gasolines A B C D E F G H I J Detailed Hydrocarbon Analyses by GC-FID -n-paraffins (vol) (Targets) (5) (5) (25) (25) (5) (5) (5) (25) (5) (25) -Lab 1 1144 783 2409 2346 771 434 662 2214 1441 3115 -Lab 2 1187 815 2476 2473 803 446 685 2283 1437 3212 -Average 1165 799 2443 2410 787 440 673 2249 1439 3164 -iso-paraffins (vol) -Lab 1 8562 8591 688 4206 4563 6765 3821 2322 7449 3362 -Lab 2 8635 8586 7066 4221 4621 6747 3864 2240 7459 3366 -Average 8599 8688 6973 4213 4592 6756 3843 2281 7454 3364 -cyclo-paraffins (vol) -Lab 1 192 021 048 010 2216 1078 1163 1035 324 234 -Lab 2 130 007 023 010 1945 1118 1140 1066 336 224 -Average 161 014 036 010 2081 1098 1152 1050 330 229 -aromatics (vol) (Targets) (5) (5) (5) (35) (5) (5) (35) (35) (5) (35) -Lab 1 073 601 409 3425 1121 805 3419 3597 120 3212 -Lab 2 003 568 374 3258 1062 739 3306 3555 110 3125 -Average 38 584 392 3341 1092 772 3363 3576 115 3169 -olefins (vol) -Lab 1 024 001 248 004 1146 978 851 714 643 066 -Lab 2 018 003 006 005 1392 905 771 650 627 054 -Average 021 002 127 04 1269 942 811 682 635 060
36
37
Appendix B
Properties of FACE Gasoline Blends with Ethanol
38
Table B1 Summary Data for FACE Gasoline Blends with Ethanol
Specific Tests FACE Gasoline Blend A B Ethanol Content (Vol ) 0 10 15 30 0 10 15 30 Ethanol Content (Vol ) (ASTM D5599) 0 1012 1469 2990 0 995 1473 3016 Research Octane Number (RON) (ASTM D2699) -Lab 1 843 922 951 1032 958 1015 1039 1067 -Lab 2 839 923 951 1017 960 1008 1023 1050 -Lab 3 835 917 946 1025 957 1012 1031 1069 -Lab 4 916 945 1018 1009 1026 1053 -Average 839 920 948 1023 958 1011 1030 1060 Motor Octane Number (MON) (ASTM D2700) -Lab 1 836 878 890 912 923 936 936 934 -Lab 2 833 874 891 917 931 935 934 931 -Lab 3 835 881 893 911 919 933 934 933 -Lab 4 884 901 916 935 936 933 -Average 835 879 894 914 924 935 935 933 Sensitivity (RON-MON) -Lab 1 07 44 61 120 35 79 103 133 -Lab 2 06 49 60 100 29 73 89 119 -Lab 3 0 36 53 114 38 79 97 136 -Lab 4 32 44 102 74 91 120 -Average 04 41 54 109 34 76 95 127 API Gravity (API˚) (ASTM D4052) -Lab 1 749 7164 7066 661 7131 690 6772 6375 -Lab 4 716 706 660 690 676 638 -Average 749 7162 7063 6605 7131 690 6766 6377 Density (ASTM D4052) -Lab 1 06849 06959 06992 07154 0697 07050 07096 07240 -Lab 4 06966 06999 07161 07055 07106 07244 -Average 06849 06963 06996 07158 0697 07053 07101 07242 RVP (psi) (D5191) Lab 1 83 95 94 91 73 87 86 83 Net Heat of Combustion (BTUlb) (ASTM D4809) 18308 Net Heat of Combustion (BTUlb) (ASTM D240) -Lab 1 19266 18294 18080 16751 19207 18319 17941 16631 -Lab 4 19236 18208 17963 16487 19168 18307 17696 16234 -Average 19251 18251 18021 16619 19187 18313 17818 16432
39
Table B1 Summary Data for FACE Gasoline Blends with Ethanol
Specific Tests FACE Gasoline Blend C H Target Ethanol Content (Vol ) 0 10 15 30 0 10 15 30 Ethanol Content (Vol) (ASTM D5599) 0 1018 1462 2949 0 1016 1459 3034 Research Octane Number (RON) (ASTM D2699) -Lab 1 850 918 951 1012 870 919 941 993 -Lab 2 840 920 950 1014 869 927 941 996 -Lab 3 840 917 946 1019 869 920 937 995 -Lab 4 914 945 1015 916 946 991 -Average 843 917 948 1015 869 921 941 994 Motor Octane Number (MON) (ASTM D2700) -Lab 1 830 876 893 921 797 821 835 861 -Lab 2 830 868 880 924 793 820 831 885 -Lab 3 829 876 887 909 799 817 829 858 -Lab 4 881 890 914 828 839 877 -Average 830 875 888 916 796 822 833 870 Sensitivity (RON-MON) -Lab 1 20 42 58 91 73 98 106 132 -Lab 2 10 52 70 90 76 107 110 111 -Lab 3 11 41 59 110 70 103 108 137 -Lab 4 33 55 101 88 107 114 -(RON)avg ndash (MON)avg 13 42 60 99 73 99 108 124 API Gravity (API˚) (ASTM D4052) -Lab 1 732 7069 6943 6523 5481 5416 5375 5247 -Lab 4 707 693 652 544 538 527 -Average 732 707 694 652 548 543 5377 526 Density (ASTM D4052) -Lab 1 06906 06991 07035 07186 07587 07614 07631 07684 -Lab 4 06997 07043 07192 07610 07636 07678 -Average 06994 07039 07189 07587 07612 07633 07681 RVP (psi) (D5191) Lab 1 75 86 85 83 76 88 87 84 Net Heat of Combustion (BTUlb) (ASTM D4809) 19186 18198 17955 16692 16265 Net Heat of Combustion (BTUlb) (ASTM D240) -Lab 1 19257 18375 18012 16739 18675 17891 17550 16369 -Lab 4 18576 17809 17408 16322 -Average 19257 18375 18012 16739 18625 17850 17479 16345
40
Table B1 Summary Data for FACE Gasoline Blends with Ethanol
Specific Tests FACE Gasoline Blend A B Target Ethanol Content 0 10 15 30 0 10 15 30 Ethanol Content (Vol) -ASTM D5599 0 1012 1469 2990 0 995 1473 3016 -Detailed Hydrocarbon Analysis - GCFID -Lab 1 0 1000 1463 3017 0 1001 1476 3014 Elemental Analysis (ASTM D 5291) -Carbon (wt) -Lab 1 8443 8178 7941 7306 8465 8172 8029 7346 -Lab 4 8433 8085 7823 7361 8471 8110 7921 7380 -Average 8438 8131 7882 7333 8468 8141 7975 7363 -Hydrogen (wt) -Lab 1 1543 1527 1484 1446 1473 1462 1442 1387 -Lab 4 1606 1573 1548 1515 1561 1540 1525 1487 -Average 1575 1550 1516 1481 1517 1501 1483 1437 -Oxygen (wt) (ASTM D5599) Lab 4 0 400 578 1150 0 389 571 1147
Specific Tests FACE Gasoline Blend C H Target Ethanol Content 0 10 15 30 0 10 15 30 Ethanol Content (Vol) -ASTM D5599 0 1018 1462 2949 0 1016 1459 3034 -Detailed Hydrocarbon Analysis - GCFID -Lab 1 0 1027 1483 2988 0 1021 1468 3040 Elemental Analysis (ASTM D 5291) -Carbon (wt) -Lab 1 8447 8200 7998 7336 8768 8402 8401 7624 -Lab 4 8419 8077 7909 7353 8720 8316 8150 7626 -Average 8433 8138 7954 7345 8744 8359 8276 7625 -Hydrogen (wt) -Lab 1 1494 1465 1465 1405 1205 1199 1207 1218 -Lab 4 1585 1668 1523 1509 1300 1305 1292 1316 -Average 1540 1567 1494 1457 1253 1252 1250 1267 -Oxygen (wt) (ASTM D5599) Lab 4 0 401 572 1129 0 368 527 1088
Table B1 Summary Data for FACE Gasoline Blends with Ethanol
41
Specific Tests FACE Gasoline Blend A B Target Ethanol Content 0 10 15 30 0 10 15 30 Distillation (˚F) (ASTM D86) Lab 1 IBP 90 106 99 99 97 105 103 101 5 122 127 122 126 133 128 126 129 10 140 134 131 135 149 135 134 138 20 165 145 144 146 175 147 146 149 30 186 153 152 153 196 155 154 155 40 198 159 156 156 209 165 159 159 50 204 202 159 158 214 211 165 161 60 207 208 204 159 218 217 214 162 70 210 211 210 160 221 219 219 163 80 213 214 213 161 226 225 224 165 90 219 222 219 211 236 234 234 230 95 228 233 229 224 248 247 246 242 FBP 262 261 263 260 280 271 270 266
Specific Tests FACE Gasoline Blend C H Target Ethanol Content 0 10 15 30 0 10 15 30 Distillation (˚F) (ASTM D86) Lab 1 IBP 93 104 102 107 98 96 105 106 5 126 126 123 130 127 123 125 127 10 139 131 131 136 143 132 134 138 20 157 140 140 145 170 145 147 152 30 174 147 147 151 194 153 156 159 40 188 153 153 156 213 167 161 163 50 201 183 157 159 229 217 182 166 60 210 208 176 161 243 236 235 169 70 218 217 215 162 263 255 253 175 80 227 226 223 165 291 283 282 268 90 245 244 241 233 329 322 323 312 95 274 274 269 261 357 351 351 343 FBP 330 331 322 324 408 401 407 396
42
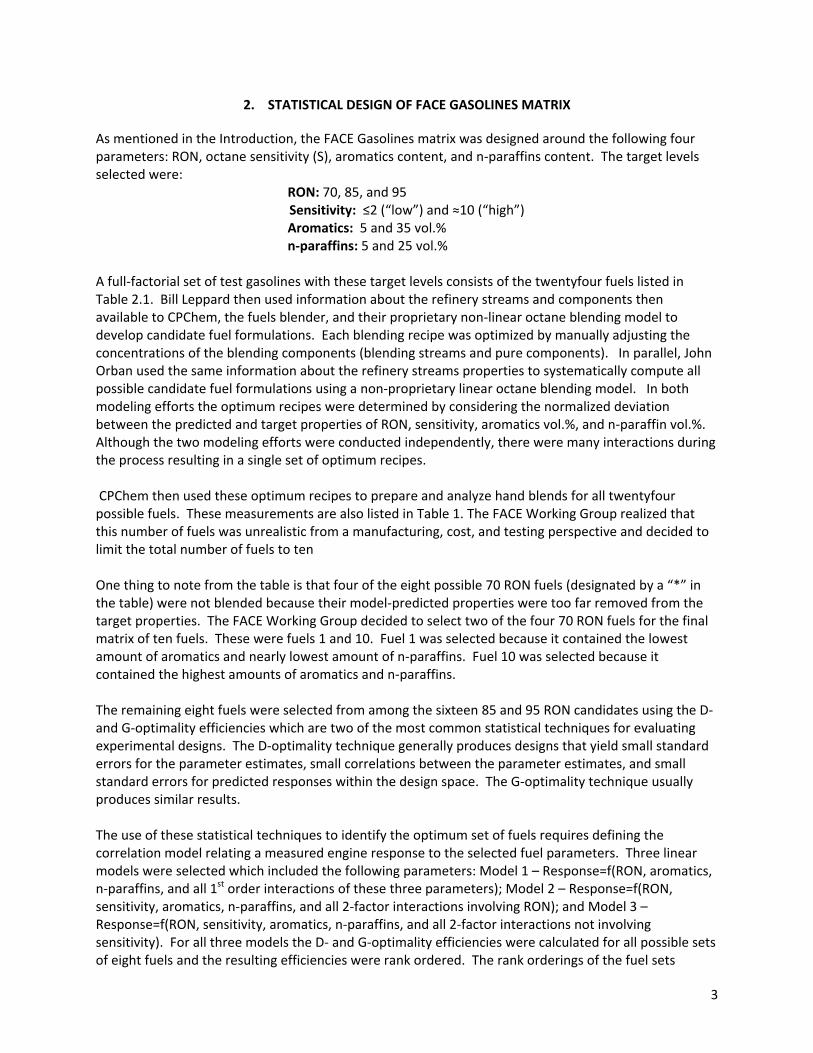
4
between the D‐ and G‐optimality efficiencies were virtually identical There were however slight differences in the rank orderings among the three correlation models These results were discussed with the FACE Working Group which decided to select the optimum fuel set associated with Model 2 The target properties for this fuel set are listed in Table 22 along with the final fuel designations Once the FACE Working Group decided on the final fuel properties CPChem initiated efforts to make large batches of the fuels one at a time as time and equipment availability permitted At the start of production of each of the fuels small hand blends were first made since the compositions of some of the available refinery blendstocks had changed since the original handblends were made during the modeling efforts For some fuels this required several iterations to come close to meeting the target properties Analyses of the physical and chemical properties of the final commercial blends are presented in the next section
Table 21
Target and Measured Properties of Hand Blends of Optimized Fuel Blends
Fuel
Target Property Measured Property
Arom Vol
n‐Par Vol
RON Sens Arom Vol
n‐Par Vol
RON Sens
1 5 5 70 2 16 99 727 09
4 35 5 70 2
7 5 25 70 2 42 208 660 03
10 35 25 70 2 266 231 764 42
13 5 5 70 10 15 123 789 12
16 35 5 70 10
19 5 25 70 10
22 35 25 70 10
2 5 5 85 2 13 66 861 07
5 35 5 85 2 264 93 935 73
8 5 25 85 2 31 244 835 13
11 35 25 85 2 262 280 846 55
14 5 5 85 10 88 74 886 66
17 35 5 85 10 311 131 863 60
20 5 25 85 10 112 194 856 32
23 35 25 85 10 337 210 863 75
3 5 5 95 2 46 81 953 35
6 35 5 95 2 262 65 987 86
9 5 25 95 2 125 172 915 39
12 35 25 95 2 271 197 940 70
15 5 5 95 10 87 41 948 86
18 35 5 95 10 313 37 971 103
21 5 25 95 10 88 143 924 65
24 35 25 95 10 325 205 915 77
‐ Not blended because model‐predicted properties differed too significantly from target properties
5
Table 22
Target Fuel Parameters for Final Fuel Set
Final FACE Gasoline Designation
Initial Fuel Number
Aromatics Vol
n‐Paraffins
Vol
RON
Sensitivity
A 2 5 5 85 Low (le2)
B 3 5 5 95 Low (le2)
C 8 5 25 85 Low (le2)
D 12 35 25 95 Low (le2)
E 14 5 5 85 High (asymp10)
F 15 5 5 95 High (asymp10)
G 18 35 5 95 High (asymp10)
H 23 35 25 85 High (asymp10)
I 1 5 5 70 Low (le2)
J 10 35 25 70 Low (le2)
6
7
3 ANALYTICAL RESULTS FOR FACE GASOLINES
In this section results of the analyses of the physical and chemical properties of the first commercial
batches of each of the FACE Gasolines are discussed Chevron Phillips 66 BP and a contract laboratory
conducted the analyses Also included are the data provided on the CPChem Certificates of Analyses
(COAs) Note that future production runs that would be required to remake fuels that sell out likely will
result in some changes to the fuel property values reported here for the first production run
31 ASTM TEST RESULTS FOR PHYSICAL PROPERTIES
ASTM methods were used to measure the RON MON API gravity density distillation profiles RVP and
net heats of combustion of all of the FACE Gasolines The results of these analyses are summarized in
the sections below and also listed in detail in Table A1 located in Appendix A
311 RON MON and Octane Sensitivity
The ignition qualities of gasolines are typically characterized by RON and MON values RON values were
measured in CFR engines per ASTM method D2699 (4) Although the measurements were conducted in
several labs the lab‐to‐lab reproducibility was very good so only the average values are reported here
(but individual values are reported in Table A1) Bar charts of the average RON values for each fuel are
presented in Figure 31 (middle bars) Also included are the original design targets (1st bars) and the
values reported on the CPChem Certificates of Analysis (COA) (3rd bars) For most fuels the 3 values are
very close to each other (within plusmn1 unit of each other) The largest differences between measured and
target values are for fuels E H and J where the measured values are about 24‐38 units higher Fuel J is
also noteworthy because the value measured (1 lab only) is 2 units higher than the CPChem COA
Figure 31 RON Values of FACE Gasolines
850
950
850
950
850
950 950
850
700 700
839
958
843
942
874
940
965
869
700
738
835
960
847
932
875
944
968
869
703718
600
650
700
750
800
850
900
950
1000
A B C D E F G H I J
RON
Fuel
RON
Target
AVG
CPChem
8
MON values were measured in CFR engines per ASTM method D2700 (5) Although the measurements
were conducted in several labs the lab‐to‐lab reproducibility was very good so only the average values
are reported here (but individual values are reported in Table A1) Bar charts of the target measured
and CPChem COA MON values for each fuel are presented in Figure 32 The ldquotargetrdquo MON values were
determined by subtracting the target octane sensitivities from the target RON values The largest
difference between the values in this project and those reported on CPChemrsquos COA is 13 for fuel J The
largest differences between the measured and target values are for fuels D E F and H For Gasolines E
F and H the measured values are about 3‐6 units higher than target while for gasoline D the measured
values are about 6 units lower than the target
Figure 32 MON Values of FACE Gasolines
830
930
830
930
750
850 850
750
680 680
835
924
830
870
811
881
858
796
695 701
836
926
836
878
815
888
858
793
696
688
600
650
700
750
800
850
900
950
1000
A B C D E F G H I J
MON
Fuel
MON
Target
AVG
CPChem
9
Octane Sensitivity (S=RON‐MON) values are presented in the bar charts in Figure 33 The average sensitivities measured by the labs in this project are very close to those reported in CPChemrsquos COAs with the exception of Gasoline D The measured values for the three of the four high sensitivity fuels are quite a bit lower than the target value of 10 in the range of 59‐71 The exception is Gasoline G which comes close to meeting the target value Of the six low sensitivity fuels three (Gasolines A C and I) have values that meet the target value of le2 two have values that are slightly higher (Gasolines B and J) and one (Gasoline D) has a value that is significantly higher and in the range of the high sensitivity gasolines This discrepancy with Gasoline D is not surprising since it is very difficult to produce a low sensitivity fuel with a high level of aromatics which typically have high sensitivities Thus relative to the other manufactured FACE Gasolines Gasoline D should be considered a ldquohighrdquo sensitivity fuel
Figure 33 Octane Sensitivity Values of FACE Gasolines
312 Distillation Characteristics
The distillation properties of the fuels were determined by ASTM D86 (6) The D86 values obtained in
this study were very close to those reported on CPChemrsquos COAs The average of those two sources are
plotted in Figure 34 The values are also tabulated in Table A1 The temperature corresponding to a
given recovery fraction X is designated as TX (ie T90 indicates the temperature at which 90 of the
fuel has been vaporized and recovered) The initial boiling points (IBP) of all of the fuels are in a
relatively narrow range of 90‐110˚F In contrast the end boiling points (EBP) range from 253‐410˚F
Gasolines E G and H which are three of the four high sensitivity fuels have the highest EBPs Gasoline
E has a relatively steep increase in temperature of 140˚F from T90‐EBP Gasolines I and A the two fuels
having low sensitivity aromatics and n‐paraffin and low‐mid RON have the lowest EBPs Gasoline I
also has a relatively flat distillation profile from T30‐T90
100 100 100 100
04
34
13
72
63
59
107
71
05
3734
11
54
60
56
110
76
07
30
00
10
20
30
40
50
60
70
80
90
100
110
A B C D E F G H I J
Octan
e Sensitivity
Fuel
Octane Sensitivity
Target
AVG
CPChem
le2le2 le2 le2 le2 le2
‐01
10
Figure 34 ASTM D86 Distillation Curves for the FACE Gasolines
313 Reid Vapor Pressure (RVP)
The RVPs were determined using ASTM method D5191 (7) The values measured in this project were in
excellent agreement with those reported by CPChem COAs (within 01 psi) The averages of both values
are depicted in the bar charts in Figure 35 The values range from 67 to 805 psi
Figure 35 Reid Vapor Pressures of FACE Gasolines
500
1000
1500
2000
2500
3000
3500
4000
4500
0 10 20 30 40 50 60 70 80 90 100
Tempe
rature (˚ F)
Volume Distilled
D86 Distillation ‐ FACE Gasolines
A
B
C
D
E
F
G
H
I
J
805
735 745
680 670
780
725
755 760 750
0
1
2
3
4
5
6
7
8
9
A B C D E F G H I J
Reid Vap
or Pressure (p
si)
FACE Gasoline
Reid Vapor Pressure (RVP) ‐ FACE Gasolines
11
314 API Gravity and Density
The API gravities and densities of the fuels were measured using ASTM method D4052 (8) The
agreement between the values measured in this project and the values reported in the CPChem COAs
The individual values are listed in the Summary Table A1 in Appendix A The average of both values are
plotted in the bar charts in Figures 36 and 37 for API Gravity and density respectively As expected the
FACE Gasolines (D G H and J) having the highest aromatics content have the lowest API Gravities and
highest densities
Figure 36 API Gravities of FACE Gasolines
Figure 37 Densities of FACE Gasolines
7495
7135
7330
5870
6360
6860
54555580
7440
5910
0
5
10
15
20
25
30
35
40
45
50
55
60
65
70
75
80
A B C D E F G H I J
API G
ravity
FACE Gasoline
API Gravity ‐ FACE Gasolines
0685
0697
0691
0743
0725
0707
0760
0755
0697
0742
0645
065
0655
066
0665
067
0675
068
0685
069
0695
07
0705
071
0715
072
0725
073
0735
074
0745
075
0755
076
0765
077
A B C D E F G H I J
Density
(gml)
FACE Gasoline
Density ‐ FACE Gasolines
12
315 Net Heat of Combustion (NHC)
Net Heats of Combustion were measured using ASTM method D240 (9) The values are depicted in the
bar charts in Figure 38 In addition for two of the FACE Gasolines (C and J) the values were also
measured using ASTM method D4809 (10) The D4809 values were very close to those obtained from
method D240 (within 100 BTUlb) TheD240 values range from 18602 to 19251 BTUlb As expected
the FACE Gasolines having the highest aromatics content (D G H and J) have the lowest net heat of
combustion The FACE Gasolines having saturates content gt90 (A B C and I) have the highest net
heat of combustion
Figure 38 ASTM D240 Net Heats of Combustion of FACE Gasolines
19251
19187
19257
18649
18884
19072
1860218625
19225
18731
18200
18400
18600
18800
19000
19200
19400
A B C D E F G H I J
Net Heat o
f Com
bustion (BTU
lb) (A
STM D240)
FACE Gasoline
Net Heat of Combustion ‐ FACE Gasolines
13
32 CHEMICAL PROPERTIES OF FACE GASOLINES
The various types of hydrocarbons in the fuels were characterized by several techniques including
supercritical fluid chromatography (SFC) and detailed hydrocarbon analysis (DHA) by gas
chromatography using a flame ionization detector (GC‐FID) In addition the carbon hydrogen and
sulfur contents were measured Results are reported in the following sections
321 Aromatics by Supercritical Fluid Chromatography (SFC)
The SFC method of ASTM D5186 (11) separates the hydrocarbons into three fractions monoaromatics
polyaromatics and non‐aromatics and characterizes the composition in terms of mass Bar graphs of
the results are presented in Figure 39 Samples of FACE Gasolines B D E G and H were analyzed by
two labs The results from the two labs were very close to each other and so the averages are depicted
in the figure FACE Gasolines A B C and I have nonromatics levels gt90 wt FACE Gasolines D G and
H have the highest amounts of monoaromatics with values ranging from 394‐420 wt FACE
Gasolines E G and H appear to have about 1 wt polyaromatics
Figure 39 Compositions of FACE Gasolines by Supercritical Fluid Chromatography (ASTM D5186)
070 790 600
4175
14001000
39404200
040
3870
015
100
110125
030
9930
9210 9400
5810
85009000
59505675
9960
6100
0
10
20
30
40
50
60
70
80
90
100
A B C D E F G H I J
Composition (Wt )
FACE GASOLINE
SFC Composition ‐ FACE Gasolines
MonoAromatics PolyAromatics NonAromatics
14
322 Hydrocarbons by Detailed Hydrocarbon Analysis (DHA)
Detailed Hydrocarbon Analyses were performed by two labs using gas chromatography with flame
ionization detectors (GC‐FID) This technique enables the determination of concentration on a species‐
by‐species basis provided that retention factors have been determined for each species in the fuel The
results from both labs were very close to each other Bubble charts of the average concentration values
(in volume ) are depicted in Figure 310 for the low sensitivity fuels and Figure 311 for the high
sensitivity fuels on a carbon number basis for the five hydrocarbon classes n‐paraffins iso‐paraffins
naphthenes aromatics and olefins
In general the low sensitivity FACE Gasolines are characterized by large amounts of low sensitivity
components such as n‐paraffins and iso‐paraffins The high sensitivity FACE Gasolines contain more high
sensitivity components such as olefins and naphthenes than the low sensitivity fuels
The total concentration of components within each of the five hydrocarbon classes were added and the
sums are reported in the bar charts in Figure 312 The n‐paraffin levels range from 225‐316 vol for
the four FACE Gasolines (C D H and J) that had targets of 25 vol For the other FACE Gasolines that
had a target level of 5 vol the n‐paraffins levels range from 44‐117 vol The aromatics levels range
from 317‐358 vol for the four FACE Gasolines (D G H and J) that had targets of 35 vol For the
other six FACE Gasolines that had a target level of 5 vol the aromatics levels range from 0‐109 vol
The C7 aromatic is toluene the C8 aromatics consist of a mix of ethylbenzene and the xylene isomers
the C9 aromatics consist of a mix of trimethylbenzenes and methylethylbenzenes and the C10 aromatics
consist of a mix of tetramethylbenzenes dimethylethylbenzenes and methylpropylbenzenes FACE
Gasoline E a high sensitivity fuel has a naphthene content of 208 vol mainly cyclopentane and
cyclohexane Three other high sensitivity fuels (F G and H) have naphthenes concentrations of about
11 vol mainly cyclopentane Those high sensitivity fuels also have the highest olefins content with
concentrations ranging from 68‐127 vol FACE Gasoline I also has 64 vol olefins The C6 olefin is
1‐hexene The C5 olefins consist of a mix of 2‐pentene and methyl butenes In contrast to the high
sensitivity fuels Gasoline D which was designed to be low sensitivity but ended up in the high
sensitivity range has essentially no naphthenes or olefins Its high sensitivity is derived from its high
aromatics content
The C5 isoparaffin in all of the fuels is 2‐methylbutane The C6 isoparaffins consist of a mix of 2‐ and 3‐
methyl pentanes and 23 dimethyl butane The C7 isoparaffins in most of the FACE Gasolines consist of a
mix of 2‐ and 3‐methyl hexanes and 23‐ and 24‐dimethylpentanes The C8 isoparaffins are
predominantly trimethylpentanes with more than 50 of those being isooctane (224
trimethylpentane) The other isomers are mainly 24‐ and 25 dimethylhexanes and 2‐methyl 3‐ethyl
pentane
15
Figure 310 Detailed Hydrocarbon Analyses of Low Sensitivity FACE Gasolines
122 44 219 451 11
48 65
065
3 4 5 6 7 8 9 10 11
Carbon Number
FACE Gasoline A ‐ Detailed Hydrocarbon Analysis (vol)
isoparaffins
n‐paraffins
cycloparaffins
aromatics
olefins
104 13 137 587 16
59
39 37
3 4 5 6 7 8 9 10 11
Carbon Number
FACE Gasoline B ‐ Detailed Hydrocarbon Analysis (vol)
isoparaffins
cycloparaffins
aromatics
olefins
n‐paraffins
64 27 117 468 20 075
30 06
31 118 100
3 4 5 6 7 8 9 10 11
Carbon Number
FACE Gasoline C ‐ Detailed Hydrocarbon Analysis (vol)
isoparaffins
cycloparaffins
aromatics
olefins
n‐paraffins
12 410
99 35 150 46
47 114 70
3 4 5 6 7 8 9 10 11
Carbon Number
FACE Gasoline D ‐ Detailed Hydrocarbon Analysis (vol)
isoparaffins
cycloparaffins
aromatics
olefins
n‐paraffins
41 34 99 321 236 11
07 135
24
11
59
3 4 5 6 7 8 9 10 11
Carbon Number
FACE Gasoline I ‐ Detailed Hydrocarbon Analysis (vol)
isoparaffins
n‐paraffins
cycloparaffins
aromatics
olefins
327
90 124 95
22
14 131 145 29
06
3 4 5 6 7 8 9 10 11
Carbon Number
FACE Gasoline J ‐ Detailed Hydrocarbon Analysis (vol)
isoparaffins
n‐paraffins
cycloparaffins
aromatics
olefins
16
Figure 311 Detailed Hydrocarbon Analyses of High Sensitivity FACE Gasolines
64 68 143 165 18 07
70 105 19 10 04
46 17 18 16 08
21 82 09
29 06 37
3 4 5 6 7 8 9 10 11
Carbon Number
FACE Gasoline E ‐ Detailed Hydrocarbon Analysis (vol)
isoparaffins
cycloparaffins
aromatics
olefins
n‐paraffins
82 64 134 378 14
21 21
100
76
89
3 4 5 6 7 8 9 10 11
Carbon Number
FACE Gasoline F ‐ Detailed Hydrocarbon Analysis (vol)
isoparaffins
n‐paraffins
cycloparaffins
aromatics
olefins
65 66 72 152 16 10
74 09 16 10
15 33 218 54 14
36 25 10
37 07 10
3 4 5 6 7 8 9 10 11
Carbon Number
FACE Gasoline G ‐ Detailed Hydrocarbon Analysis (vol)
isoparaffins
cycloparaffins
aromatics
olefins
n‐paraffins
28 54 71 39 22 09
66 08 17 10
10 95 117 83 43 14
29 21 09
54 05 145 08
3 4 5 6 7 8 9 10 11
Carbon Number
FACE Gasoline H ‐ Detailed Hydrocarbon Analysis (vol)
isoparaffins
cycloparaffins
aromatics
olefins
n‐paraffins
17
Figure 312 Detailed Hydrocarbon Analyses Comparisons of FACE Gasolines
A comparison of the composition results from the DHA and SFC methods is presented in Figure 313 for
the low sensitivity fuels and Figure 314 for the high sensitivity fuels Also included are Fluorescent
Indicator Absorption (FIA ndash ASTM D1319 (12)) composition results reported on the CPChem COAs Since
the FIA method determines total saturates the DHA results for n‐paraffins iso‐paraffins and
naphthenes must be added together to enable the comparison between those two methods Similarly
since the SFC method directly measures aromatics and total non‐aromatics are determined by
difference the olefins amount must be added to the total saturate levels from FIA and DHA to enable
comparisons with the non‐aromatics values from SFC The appropriate comparison categories are
indicated by dashed lines in Figures 313 and 314 Of the three methods SFC generally gives the
highest level of aromatics and FIA the lowest The DHA aromatics values are closer to the FIA levels than
to the SFC levels The DHA olefins are fairly close to the FIA results
117
80
244 241
7944 67
225144
316
860
859
697
421
459
676
384
228
745336
16
01
01208
110
115105
33
23
13
127
94
8168
64
06
58 39
334
10977
336 358
12
317
0
10
20
30
40
50
60
70
80
90
100
A B C D E F G H I J
Composition ( vol)
FACE GASOLINE
DHA Composition ‐ FACE Gasolines
n‐paraffins isoparaffins naphthenes olefins aromatics
18
Figure 313 Comparison of Composition Methods FACE Low Sensitivity Gasolines
Figure 314 Comparison of Composition Methods FACE High Sensitivity Gasolines
117
80
244
144
316
860 859
697
745336
16
01 0433
23
13 64
06
58 3912
317
996951 975
929
712
04
07 04 62
10
42 21 09
278
993
921 940996
610
07
79 6004
390
0
10
20
30
40
50
60
70
80
90
100
DHA FIA SFC DHA FIA SFC DHA FIA SFC DHA FIA SFC DHA FIA SFC
Composition ( )
FACE GASOLINE
Composition ‐ Low Sensitivity FACE Gasolines
n‐paraffins isoparaffins naphthenes olefins aromatics saturates nonaromatics
A B C I J
241
7944 67
225
421
459
676
384
228
01
208
110
115 105
127
94
81 68
334
10977
336 358
701
780
856
587 568
04
99
86
7879
295
12158
335 353
581
850900
595568
419
150100
405432
0
10
20
30
40
50
60
70
80
90
100
DHA FIA SFC DHA FIA SFC DHA FIA SFC DHA FIA SFC DHA FIA SFC
Composition ( )
FACE GASOLINE
Composition ‐ High Sensitivity FACE Gasolines
n‐paraffins isoparaffins naphthenes olefins aromatics saturates nonaromatics
D E F G H
19
323 Elemental Analyses
Carbon and hydrogen contents were measured by two labs using ASTM method D5291 (13) The
average results are presented in the bar graphs in figure 315 The carbon contents range from 8399‐
8748 wt and the hydrogen contents range from1252‐1601 wt As expected the FACE Gasolines
having the highest aromatics content (D G H and J) have the highest carbon and lowest hydrogen
contents
Figure 315 Carbon and Hydrogen Elemental Analyses of FACE Gasolines
8399 8443 8453 8646 8547 8496 8670 87488414 8624
1601 1557 1547 1354 1453 1504 1330 12521586 1376
0
10
20
30
40
50
60
70
80
90
100
A B C D E F G H I J
Compo
sition
(wt)
FACE Gasoline
Carbon‐Hydrogen Elemental Analyses
Hydrogen
Carbon
20
Sulfur content was measured by one lab ASTM method D5453 (14) The results displayed in the bar
charts in Figure 316 are essentially identical to the values reported on the CPChem COAs All FACE
Gasolines had ultra‐low sulfur levels FACE Gasolines E G and H had the highest levels at 21 22 and 15
ppm sulfur The other fuels had levels ranging from 2‐6 ppm
Figure 316 Sulfur Levels of FACE Gasolines
6
4 4
2
21
2
22
15
2 2
0
5
10
15
20
25
A B C D E F G H I J
Sulfur Content (p
pm)
FACE Gasoline
Sulfur Content ‐ FACE Gasolines
21
4 ANALYTICAL RESULTS FOR FACE GASOLINES BLENDED WITH ETHANOL
Although the FACE Gasolines were not formulated with ethanol the expectation is that some potential
users will be interested in testing the fuels with ethanol added To assist selection of fuels for those
studies four FACE Gasolines were selected for blending with levels of 10 15 and 30 vol ethanol The
fuels selected for this purpose were A B C and H The positions of these fuels in the design matrix are
shown below
In this section results of the analyses of the ethanol blends are discussed Chevron Phillips 66 BP and
a contract laboratory conducted the analyses As mentioned previously future production runs that are
required to remake fuels that sell out likely will results in some changes to the fuel property values
reported here
41 ASTM TEST RESULTS
ASTM methods were used to measure the ethanol content RON MON API gravity density distillation
profiles RVP and net heats of combustion of all of the ethanol blends made with the FACE Gasolines
The results of these analyses are summarized below and in Table A2 located in the Appendix
411 Ethanol Content
FACE Gasolines A B C and H were blended with nominally 10 15 and 30 vol ethanol The
concentration of ethanol in each blend were determined using ASTM method D5599 (15) (coupled with
ASTM D4052 density measurement) and by detailed hydrocarbon analysis using gas chromatography
with a flame ionization detector The results for both methods were in excellent agreement for all fuels
as shown below in Table 41
Table 41 Measured Ethanol Content of FACE Gasoline Blends
Ethanol Content (vol)
A B C H
10 15 30 10 15 30 10 15 30 10 15 30
D5599 101 147 299 100 147 302 102 146 295 102 146 303
DHA 100 146 301 100 148 301 103 148 299 102 147 304
22
412 RON MON and Octane Sensitivity
RON values were measured in CFR engines per ASTM method D2699 (4) Although the measurements
were conducted in four labs the lab‐to‐lab reproducibility was very good so only the average values are
reported here (but individual values are reported in Table A2) Average RON values for each fuel are
presented in Figure 41 For all four of these FACE Gasolines the RON values continue to increase even
at the 30 ethanol level although the rates of increase are lower than at lower ethanol levels FACE
Gasoline B has the highest RON at all ethanol levels with a value of about 106 at the 30 ethanol level
FACE Gasolines A and C have essentially the same RON values at all ethanol levels with RON values of
about 102 at the 30 ethanol level FACE Gasoline H without ethanol has a higher RON than A and C
but a lower RON at the 15 and 30 ethanol levels
Figure 41 RON Values of FACE Gasoline Blends with Ethanol
MON values were measured in CFR engines per ASTM method D2700 (5) Although the measurements were conducted in four labs the lab‐to‐lab reproducibility was very good so only the average values are reported here (but individual values are reported in Appendix A2) The MON values for each fuel are
presented in Figure 42 FACE Gasoline B has the highest MON values at all ethanol levels but unlike the other FACE Gasolines the MON value did not increase with ethanol contents above 10 vol The MON values for FACE Gasolines A and C were essentially the same and higher than those for FACE Gasoline H
80081082083084085086087088089090091092093094095096097098099010001010102010301040105010601070108010901100
0 5 10 15 20 25 30 35
RON
Ethanol (vol)
RON Values ‐ FACE Gasoline + Ethanol Blends
FACE A
FACE B
FACE H
FACE C
23
Figure 42 MON Values of FACE Gasoline Blends with Ethanol
Octane Sensitivity (S=RON‐MON) values are presented in Figure 43 As expected due to the relatively high sensitivity of ethanol the sensitivities of all four FACE Gasolines increase as the ethanol content increases FACE Gasoline H has the highest sensitivity at all ethanol levels except at 30 vol ethanol where the sensitivity of the FACE Gasoline B blend becomes slightly higher with values of 124 and 132 respectively The sensitivities for FACE Gasolines A and C are very similar to each other and although lower than the blends for the other FACE Gasolines have the highest rates of increase at the 30 level
Figure 43 Octane Sensitivities FACE Gasoline Blends with Ethanol
750
760
770
780
790
800
810
820
830
840
850
860
870
880
890
900
910
920
930
940
950
0 5 10 15 20 25 30 35
MON
Ethanol (vol)
MON Values ‐ FACE Gasoline + Ethanol Blends
FACE A
FACE B
FACE H
FACE C
00
10
20
30
40
50
60
70
80
90
100
110
120
130
140
0 5 10 15 20 25 30 35
S
Ethanol (vol)
Octane Sensitivity (S) ‐ FACE Gasoline + Ethanol Blends
FACE A
FACE B
FACE H
FACE C
24
413 Distillation Characteristics
The distillation properties of the fuels were determined by ASTM D86 (6) The values are plotted in
Figure 44 and tabulated in Table A2 in the Appendix The behavior and shapes of the curves are very
similar For a given gasoline all of the ethanol blends start at about the same IBP The blends
containing ethanol then follow the same curve which is lower than the base gasoline At a certain point
the ethanol blends then rise quickly to rejoin the distillation curve of the base gasoline The lower the
ethanol content of the blend the earlier (lower distilled volume ) the curve rejoins the base gasoline
curve
Figure 44 ASTM D86 Distillation Profiles for FACE Gasoline Blends with Ethanol
50
100
150
200
250
300
0 10 20 30 40 50 60 70 80 90 100
Temperature (˚ C)
Volume Distilled
D86 Distillation ‐ FACE A Gasoline + Ethanol Blends
0 EtOH
10 EtOH
15 EtOH
30 EtOH
50
100
150
200
250
300
0 10 20 30 40 50 60 70 80 90 100
Temperature (˚ C)
Volume Distilled
D86 Distillation ‐ FACE B Gasoline + Ethanol Blends
0 EtOH
10 EtOH
15 EtOH
30 EtOH
50
100
150
200
250
300
350
0 10 20 30 40 50 60 70 80 90 100
Temperature (˚ C)
Volume Distilled
D86 Distillation ‐ FACE C Gasoline + Ethanol Blends
0 EtOH
10 EtOH
15 EtOH
30 EtOH
50
100
150
200
250
300
350
400
450
0 10 20 30 40 50 60 70 80 90 100
Temperature (˚ C)
Volume Distilled
D86 Distillation ‐ FACE H Gasoline + Ethanol Blends
0 EtOH
10 EtOH
15 EtOH
30 EtOH
25
414 Reid Vapor Pressure (RVP)
The RVPs were determined using ASTM method D5191 (7) The values are plotted in Figure 45 For all
fuels the RVP appears to peak between 10 and 15 vol ethanol and then starts to decrease as the
ethanol content increases further
Figure 45 Reid Vapor Pressures for FACE Gasoline Blends with Ethanol
415 API Gravity and Density
The API gravities and densities of the fuels were measured by two labs using ASTM method D4052 (8) The values from the two labs were in excellent agreement and are listed in Table A2 The average density values are presented in Figure 46 For all of the FACE Gasolines the density increased as the ethanol content increased
Figure 46 Densities of FACE Gasoline Blends with Ethanol
7
75
8
85
9
95
10
0 5 10 15 20 25 30 35
RVP (psi)
Ethanol (vol)
Reid Vapor Pressure (RVP) ‐ FACE Gasoline + Ethanol Blends
FACE A
FACE B
FACE H
FACE C
0685 0697 0691
0759
0696 0705 0699
0761
0700 0710 0704
0763
0716 0724 0719
0768
0
01
02
03
04
05
06
07
08
09
1
A B C H
Density
(gm
l)
Ethanol (vol)
Density ‐ FACE Gasoline Blends with Ethanol
0
10
15
30
26
416 Net Heat of Combustion (NHC)
Net Heats of Combustion were measured by 2 labs using ASTM method D240 (9) For some fuels ASTM
method D4809 (10) was also used The values from both labs and both methods were very close to each
other and the average values are plotted in Figure 47 As expected since the net heat of combustion of
ethanol is lower than that of gasoline for all FACE Gasolines the net heat of combustion decreased as
ethanol content increased The decrease appeared to be linear with ethanol content The decrease
appeared to be steepest for FACE Gasoline B
Figure 47 Net Heat of Combustion of FACE Gasoline Blends with Ethanol
16000
16250
16500
16750
17000
17250
17500
17750
18000
18250
18500
18750
19000
19250
19500
0 5 10 15 20 25 30 35
Net Heat of C
ombustion (B
TUlb)
Ethanol (vol)
Net Heat of Combustion ‐ FACE Gasoline + Ethanol Blends
FACE A
FACE B
FACE H
FACE C
27
5 SUMMARY AND CONCLUSIONS
A subteam of the CRC AVFL FACE Working Group has designed a matrix of reference gasolines
known as the FACE Gasolines A commercial vendor has produced and made the fuels available
for purchase in research quantities It is expected that this will enable consistent comparisons
of engine and combustion results from different laboratories and test platforms based on the
use of the same set of fuels
The matrix is designed around four parameters expected to be of importance for advanced
gasoline engines RON octane sensitivity aromatics content and n‐paraffins content
Statistical methods were used to identify potential candidate formulations and down‐select to a
tractable number of 10 formulations
Detailed analyses were performed on the physical and chemical properties of the final fuel
formulations
Generally the property values measured in the current study agreed very well with the values
reported on the fuel blender (ChevronPhillips Chemical Company ‐ CPChem) Certificates of
Analyses (COAs)
As expected conflicts in the target properties for some of the fuels (such as high aromatics level
coupled with low octane sensitivity) led to some trade‐offs that resulted in some deviation in
the actual properties from the design properties
The RON values come close to meeting the targets for most of the fuels Fuels E H and J have
values that are 24‐38 units higher than the targets
Three of the four ldquohighrdquo sensitivity fuels have measured values of 59‐71 that are lower than
the target value of 10 Two of the ldquolowrdquo sensitivity fuels have measured values (34‐37) that are
a bit higher than the target value of le2 One of the low sensitivity design fuels (ldquoDrdquo) has a value
of 72 that actually effectively makes it a high sensitivity fuel
Detailed hydrocarbon analyses (DHA) indicate that the n‐paraffins contents range from 225‐
316 vol for the four FACE Gasolines that had targets of 25 vol and from 44‐117 vol for
the six FACE Gasolines that had targets of 5 vol
DHAs indicate that the aromatics contents range from 317‐358 vol for the four FACE
Gasolines that had a target of 35 vol and 0‐109 vol for the other fuels that had a target of 5
vol
The high sensitivity fuels contained the high sensitivity components of naphthenes (105‐208
vol) and olefins (68‐127 vol) The exception was Gasoline ldquoDrdquo which had neither of these
components but whose high sensitivity was derived from aromatics components
Five of the FACE Gasolines (ldquoArdquo ldquoBrdquo ldquoCrdquo ldquoFrdquo and ldquoIrdquo) are very rich in isoparaffins with contents ge
676 vol
Aromatics values determined by SFC were generally higher than the values obtained from DHA
The DHA olefins values were close to the FIA values reported on the CPChem COAs
The fuels having the highest aromatics content also have the highest densities and highest net
heats of combustion on an energy content per volume basis
With regards to distillation properties for all fuels the initial boiling points (IBPs) are in a
narrow range of 90‐110˚F although the end boiling points (EBPs) range from 253‐410˚F Three
28
of the high sensitivity fuels have the highest EBPs The two low‐mid RON fuels having low n‐
paraffins and low aromatics have the lowest EBPs
All of the FACE Gasolines have ultra‐low levels of sulfur with the highest value at 22 ppm S and
most fuels having le 6 ppm S
For the four FACE Gasolines blended with ethanol RON continues to increase as the ethanol
levels increase to 30 vol although the rate of increase is lower as the ethanol content
increases FACE Gasoline B which has the highest RON of 96 has the highest RON at all ethanol
levels with a value of about 106 at 30 ethanol At the same ethanol level FACE Gasolines A
and C have essentially the same RON values FACE Gasoline H starts with a higher RON value
than those of A or C but has a lower value at blend levels of 15 and 30 vol
MON increased as the ethanol level increased for FACE Gasolines A C and H The MON values
for these fuels were essentially constant even though the highest MON values were found for
the ethanol blends with FACE Gasoline B
For all blends octane sensitivity increased as ethanol content increased with the highest values
of 12‐13 for 30 vol ethanol blends with FACE Gasolines B and H
The D86 distillation curve trends are similar for the four FACE Gasolines For a given gasoline all
blends start at the same point At around 10 vol distilled the curves for the blends with
ethanol diverge from and are lower than the curves for the base gasolines At a certain point
the distillation curves for the blends rise quickly and re‐join the curve for the parent base fuel
The distillation curves for the 30 vol ethanol blends are generally flat as a function of
increasing vol distilled and only start to increase again at about 70‐80 vol distilled when
most of the ethanol has been distilled from the liquid
The Reid Vapor Pressures (RVPs) peak at about 10‐15 vol
Densities increase slightly as ethanol increases while net heats of combustion decrease
29
6 REFERENCES
1 Alnajjar M Cannella B Dettman H Fairbridge C Franz J Gallant T Gieleciak R Hager D Lay C Lewis S Ratcliff M Sluder S Storey J Yin H Zigler B ldquoChemical and Physical Properties of the Fuels for Advanced Combustion Engines (FACE) Research Diesel Fuelsrdquo CRC Report No FACE‐1 (2010)
2 Gallant T Franz J Alnajjar M Storey J Lewis S Sluder S Cannella W Fairbridge C Hager D Dettman H Luecke J Ratcliff M Zigler ldquoFuels for Advanced Combustion Engines Research Diesel Fuels Analysis of Physical and Chemical Propertiesrdquo SAE Paper 2009‐01‐2769 (2009)
3 CannellaW Fairbridge C Arboleda P Bays T Dettman H Foster M Gieleciak R Gunter G Hager D Lay C Lewis S Luecke J Sluder S Zigler B ldquoDetailed Characterization of the Physical and Chemical Properties of the Reformulated FACE Diesel Fuels FD2B FD4B and FD7Brdquo CRC Report AVFL‐19‐1 (2013)
4 ASTM International Standard Test Method for Research Octane Number of Spark‐Ignition Engine Fuel ASTM D2699 (ASTM International Pennsylvania 2009)
5 ASTM International Standard Test Method for Motor Octane Number of Spark‐Ignition Engine Fuel ASTM D2700 (ASTM International Pennsylvania 2009)
6 ASTM International Standard Test Method for Distillation of Petroleum Products at Atmospheric Pressure ASTM D86‐09e1 (ASTM International Pennsylvania 2009)
7 ASTM International Standard Test Method for Vapor Pressure of Petroleum Products (Mini‐Method) ASTM D5191 (ASTM International Pennsylvania 2009)
8 ASTM International Standard Test Method for Density and Relative Density of Liquids by Digital Density Meter ASTM D4052‐96(2002)e1 (ASTM International Pennsylvania 2002)
9 ASTM International Standard Test Method for Heat of Combustion of Liquid Hydrocarbon Fuels by Bomb Calorimeter ASTM D240‐02(2007) (ASTM International Pennsylvania 2007)
10 ASTM International Standard Test Method for Heat of Combustion of Liquid Hydrocarbon Fuels by Bomb Calorimeter ASTM D4809 (2007) (ASTM International Pennsylvania 2007)
11 ASTM International Standard Test Method for Determination of Aromatic Content and Polynuclear Aromatic Content of Diesel Fuels and Aviation Turbine Fuels by Supercritical Fluid Chromatography ASTM D5186‐03(2009) (ASTM International Pennsylvania 2009)
12 ASTM International Standard Test Method for Hydrocarbon Types in Liquid Petroleum Products by Fluorescent Indicator Adsorption ASTM D1319‐08 (ASTM International Pennsylvania 2008)
13 ASTM International Standard Test Methods for Instrumental Determination of Carbon Hydrogen and Nitrogen in Petroleum Products and Lubricants ASTM D5291‐02(2007) (ASTM International Pennsylvania 2007)
14 ASTM International Standard Test Methods for Determination of Total Sulfur in Light Hydrocarbons Spark‐Ignition Engine Fuel Diesel Engine Fuel and Engine Oil by Ultraviolet Fluorescence ASTM D5453(2007) (ASTM International Pennsylvania 2007)
15 ASTM International Standard Test Methods for Determination of Oxygenates in Gasoline by Gas Chromatography and Oxygen Selective Flame Ionization Detection ASTM D5599 (2007) (ASTM International Pennsylvania 2007)
30
31
Appendix A
Properties of FACE Gasolines
32
Table A1 Summary Data for FACE Gasolines
Specific Tests FACE Gasoline A B C D E F G H I J Research Octane Number (RON) (ASTM D2699) -Lab 1 843 958 850 946 871 940 969 870 700 738 -Lab 2 839 960 840 939 877 960 869 -Lab 3 835 957 840 -Average 839 958 843 942 874 940 965 869 7015 738 -CPChem COA 835 960 847 932 875 944 968 869 703 718 Motor Octane Number (MON) (ASTM D2700) -Lab 1 836 923 830 872 813 881 857 797 695 701 -Lab 2 833 931 830 868 808 860 799 -Lab 3 835 919 829 -Average 835 924 830 870 811 881 858 798 695 701 -CPChem COA 836 926 836 878 815 888 858 793 696 688 Sensitivity (RON-MON) -Lab 1 07 35 20 74 58 59 112 73 05 37 -Lab 2 06 29 10 71 69 100 70 -Lab 3 0 38 11 -Average 04 34 13 72 63 59 107 72 05 37 -CPChem COA -01 34 11 54 60 56 110 76 07 30 API Gravity (API˚) (ASTM D4052) -CPChem COA 750 714 734 587 636 686 545 568 744 595 -Lab 1 749 713 732 587 636 686 546 548 744 587 -Average 7495 7135 733 587 636 686 5455 558 744 591 Density (ASTM D4052) -CPChem COA 0691 0743 0725 0707 0760 0697 0741 -Lab 1 0685 0697 0691 0743 0725 0707 0760 0759 0697 0743 -Average 0685 0697 0691 0743 0725 0707 0760 0759 0697 0742 RVP (psi) (D5191) -CPChem COA 81 74 74 68 67 78 72 75 75 75 -Lab 1 80 73 75 73 76 77 Net Heat of Combustion (BTUlb) (ASTM D4809) 19186 18680 Net Heat of Combustion (BTUlb) (ASTM D240) 19251 19187 19257 18649 18884 19072 18602 18625 19225 18731
33
TableA1 Summary Data for FACE Gasolines
Specific Tests FACE Gasoline A B C D E F G H I J Distillation (˚F) (ASTM D86) -CPChem IBP 93 95 95 88 110 108 93 94 100 101
5 104 128 120 129 131 129 122 123 123 111 10 132 145 136 148 142 142 135 140 156 162 20 160 172 154 176 155 156 158 168 177 206 30 183 194 171 198 166 168 183 192 186 217 40 197 207 187 212 177 180 210 211 191 224 50 203 213 200 221 186 193 240 227 195 231 60 207 216 210 229 197 206 270 242 199 242 70 210 220 218 235 208 217 306 262 203 261 80 213 225 226 280 222 225 328 291 207 291 90 219 235 243 330 267 240 343 327 213 316 95 227 248 270 340 343 261 363 358 220 330 FBP 269 283 328 363 405 294 403 410 259 358
-Lab 1 IBP 90 97 93 97 107 102 99 98 99 95 5 122 133 126 133 134 134 122 127 139 111
10 140 149 139 151 143 144 136 143 160 166 20 165 175 157 179 156 157 158 170 178 209 30 186 196 174 200 168 169 182 194 187 219 40 198 209 188 214 177 182 209 213 192 225 50 204 214 201 224 188 195 238 229 196 232 60 207 218 210 234 197 207 268 243 200 242 70 210 221 218 248 208 218 304 263 204 263 80 213 226 227 288 224 228 328 291 208 292
90 219 236 245 331 258 243 343 329 213 316 95 228 248 274 341 329 261 358 357 220 330 FBP 262 280 330 365 402 291 405 408 247 357
-Average IBP 915 96 94 925 1085 105 96 96 995 98 5 113 1305 123 131 1325 1315 122 125 131 111
10 136 147 1375 1495 1425 143 1355 1415 158 164 20 1625 1735 1555 1775 1555 1565 158 169 1775 203 30 1845 195 1725 199 167 1685 1825 193 1865 218 40 1975 208 1875 213 177 181 2095 212 1915 2245 50 2035 2135 2005 2225 187 194 239 228 1955 2315 60 207 217 210 2315 197 2065 269 2425 1995 242 70 210 2205 218 2415 208 2175 305 2625 2035 262 80 213 2255 2265 284 223 2265 328 291 2075 2915
90 219 2355 244 3305 2625 2415 343 328 213 316 95 2275 248 272 3405 336 261 3605 3575 220 330 FBP 2655 2815 329 364 4035 2925 404 409 253 3575
34
Table A1 Summary Data for FACE Gasolines
Specific Tests FACE Gasoline A B C D E F G H I J Elemental Analysis (ASTM D 5291) -Carbon (wt) -Lab 1 8398 8441 8497 8647 8547 8671 8792 8415 -Lab 4 8400 8444 8419 8645 8547 8496 8669 8703 8414 8624 -Average 8399 8443 8458 8646 8547 8496 8670 8748 8414 8624 -Hydrogen (wt) -Lab 1 1602 1559 1503 1353 1453 1329 1208 1585 -Lab 4 1600 1556 1585 1355 1453 1504 1331 1297 1586 1376 -Average 1601 1557 1547 1354 1453 1504 1330 1252 1586 1376 Sulfur by UV Fluorescence (ppmw) (ASTM D5453) -CPChem COA 4 4 3 2 21 2 20 15 2 2 -Lab 4 6 4 4 2 21 2 22 15 2 2 Hydrocarbons by FIA (vol) (ASTM D1319) -Aromatics (vol) CPChem COA 0 42 21 295 121 58 335 353 09 278 -Olefins (vol) CPChem COA 04 07 04 04 99 86 78 79 62 10 -Saturates (vol) CPChem COA 996 951 975 701 780 856 587 568 929 712 Aromatics by SFC (ASTM D5186) (Lab 1) -MonoAromatics (wt) -Lab 1 07 78 60 414 142 100 393 412 04 387 -Lab 2 80 421 138 395 428 -Average 07 79 60 4175 140 100 394 420 04 387 -PolyAromatics (wt) -Lab 1 0 0 0 03 11 0 10 10 0 03 -Lab 2 0 0 09 12 15 -Average 0 0 0 015 10 0 11 125 0 03 -NonAromatics (wt) -Lab 1 993 922 940 583 847 900 597 578 996 610 -Lab 2 920 579 850 593 557 -Average 993 921 940 581 8475 900 595 5675 996 610
35
Table A1 Summary Data for FACE Gasolines
Specific Tests FACE Gasolines A B C D E F G H I J Detailed Hydrocarbon Analyses by GC-FID -n-paraffins (vol) (Targets) (5) (5) (25) (25) (5) (5) (5) (25) (5) (25) -Lab 1 1144 783 2409 2346 771 434 662 2214 1441 3115 -Lab 2 1187 815 2476 2473 803 446 685 2283 1437 3212 -Average 1165 799 2443 2410 787 440 673 2249 1439 3164 -iso-paraffins (vol) -Lab 1 8562 8591 688 4206 4563 6765 3821 2322 7449 3362 -Lab 2 8635 8586 7066 4221 4621 6747 3864 2240 7459 3366 -Average 8599 8688 6973 4213 4592 6756 3843 2281 7454 3364 -cyclo-paraffins (vol) -Lab 1 192 021 048 010 2216 1078 1163 1035 324 234 -Lab 2 130 007 023 010 1945 1118 1140 1066 336 224 -Average 161 014 036 010 2081 1098 1152 1050 330 229 -aromatics (vol) (Targets) (5) (5) (5) (35) (5) (5) (35) (35) (5) (35) -Lab 1 073 601 409 3425 1121 805 3419 3597 120 3212 -Lab 2 003 568 374 3258 1062 739 3306 3555 110 3125 -Average 38 584 392 3341 1092 772 3363 3576 115 3169 -olefins (vol) -Lab 1 024 001 248 004 1146 978 851 714 643 066 -Lab 2 018 003 006 005 1392 905 771 650 627 054 -Average 021 002 127 04 1269 942 811 682 635 060
36
37
Appendix B
Properties of FACE Gasoline Blends with Ethanol
38
Table B1 Summary Data for FACE Gasoline Blends with Ethanol
Specific Tests FACE Gasoline Blend A B Ethanol Content (Vol ) 0 10 15 30 0 10 15 30 Ethanol Content (Vol ) (ASTM D5599) 0 1012 1469 2990 0 995 1473 3016 Research Octane Number (RON) (ASTM D2699) -Lab 1 843 922 951 1032 958 1015 1039 1067 -Lab 2 839 923 951 1017 960 1008 1023 1050 -Lab 3 835 917 946 1025 957 1012 1031 1069 -Lab 4 916 945 1018 1009 1026 1053 -Average 839 920 948 1023 958 1011 1030 1060 Motor Octane Number (MON) (ASTM D2700) -Lab 1 836 878 890 912 923 936 936 934 -Lab 2 833 874 891 917 931 935 934 931 -Lab 3 835 881 893 911 919 933 934 933 -Lab 4 884 901 916 935 936 933 -Average 835 879 894 914 924 935 935 933 Sensitivity (RON-MON) -Lab 1 07 44 61 120 35 79 103 133 -Lab 2 06 49 60 100 29 73 89 119 -Lab 3 0 36 53 114 38 79 97 136 -Lab 4 32 44 102 74 91 120 -Average 04 41 54 109 34 76 95 127 API Gravity (API˚) (ASTM D4052) -Lab 1 749 7164 7066 661 7131 690 6772 6375 -Lab 4 716 706 660 690 676 638 -Average 749 7162 7063 6605 7131 690 6766 6377 Density (ASTM D4052) -Lab 1 06849 06959 06992 07154 0697 07050 07096 07240 -Lab 4 06966 06999 07161 07055 07106 07244 -Average 06849 06963 06996 07158 0697 07053 07101 07242 RVP (psi) (D5191) Lab 1 83 95 94 91 73 87 86 83 Net Heat of Combustion (BTUlb) (ASTM D4809) 18308 Net Heat of Combustion (BTUlb) (ASTM D240) -Lab 1 19266 18294 18080 16751 19207 18319 17941 16631 -Lab 4 19236 18208 17963 16487 19168 18307 17696 16234 -Average 19251 18251 18021 16619 19187 18313 17818 16432
39
Table B1 Summary Data for FACE Gasoline Blends with Ethanol
Specific Tests FACE Gasoline Blend C H Target Ethanol Content (Vol ) 0 10 15 30 0 10 15 30 Ethanol Content (Vol) (ASTM D5599) 0 1018 1462 2949 0 1016 1459 3034 Research Octane Number (RON) (ASTM D2699) -Lab 1 850 918 951 1012 870 919 941 993 -Lab 2 840 920 950 1014 869 927 941 996 -Lab 3 840 917 946 1019 869 920 937 995 -Lab 4 914 945 1015 916 946 991 -Average 843 917 948 1015 869 921 941 994 Motor Octane Number (MON) (ASTM D2700) -Lab 1 830 876 893 921 797 821 835 861 -Lab 2 830 868 880 924 793 820 831 885 -Lab 3 829 876 887 909 799 817 829 858 -Lab 4 881 890 914 828 839 877 -Average 830 875 888 916 796 822 833 870 Sensitivity (RON-MON) -Lab 1 20 42 58 91 73 98 106 132 -Lab 2 10 52 70 90 76 107 110 111 -Lab 3 11 41 59 110 70 103 108 137 -Lab 4 33 55 101 88 107 114 -(RON)avg ndash (MON)avg 13 42 60 99 73 99 108 124 API Gravity (API˚) (ASTM D4052) -Lab 1 732 7069 6943 6523 5481 5416 5375 5247 -Lab 4 707 693 652 544 538 527 -Average 732 707 694 652 548 543 5377 526 Density (ASTM D4052) -Lab 1 06906 06991 07035 07186 07587 07614 07631 07684 -Lab 4 06997 07043 07192 07610 07636 07678 -Average 06994 07039 07189 07587 07612 07633 07681 RVP (psi) (D5191) Lab 1 75 86 85 83 76 88 87 84 Net Heat of Combustion (BTUlb) (ASTM D4809) 19186 18198 17955 16692 16265 Net Heat of Combustion (BTUlb) (ASTM D240) -Lab 1 19257 18375 18012 16739 18675 17891 17550 16369 -Lab 4 18576 17809 17408 16322 -Average 19257 18375 18012 16739 18625 17850 17479 16345
40
Table B1 Summary Data for FACE Gasoline Blends with Ethanol
Specific Tests FACE Gasoline Blend A B Target Ethanol Content 0 10 15 30 0 10 15 30 Ethanol Content (Vol) -ASTM D5599 0 1012 1469 2990 0 995 1473 3016 -Detailed Hydrocarbon Analysis - GCFID -Lab 1 0 1000 1463 3017 0 1001 1476 3014 Elemental Analysis (ASTM D 5291) -Carbon (wt) -Lab 1 8443 8178 7941 7306 8465 8172 8029 7346 -Lab 4 8433 8085 7823 7361 8471 8110 7921 7380 -Average 8438 8131 7882 7333 8468 8141 7975 7363 -Hydrogen (wt) -Lab 1 1543 1527 1484 1446 1473 1462 1442 1387 -Lab 4 1606 1573 1548 1515 1561 1540 1525 1487 -Average 1575 1550 1516 1481 1517 1501 1483 1437 -Oxygen (wt) (ASTM D5599) Lab 4 0 400 578 1150 0 389 571 1147
Specific Tests FACE Gasoline Blend C H Target Ethanol Content 0 10 15 30 0 10 15 30 Ethanol Content (Vol) -ASTM D5599 0 1018 1462 2949 0 1016 1459 3034 -Detailed Hydrocarbon Analysis - GCFID -Lab 1 0 1027 1483 2988 0 1021 1468 3040 Elemental Analysis (ASTM D 5291) -Carbon (wt) -Lab 1 8447 8200 7998 7336 8768 8402 8401 7624 -Lab 4 8419 8077 7909 7353 8720 8316 8150 7626 -Average 8433 8138 7954 7345 8744 8359 8276 7625 -Hydrogen (wt) -Lab 1 1494 1465 1465 1405 1205 1199 1207 1218 -Lab 4 1585 1668 1523 1509 1300 1305 1292 1316 -Average 1540 1567 1494 1457 1253 1252 1250 1267 -Oxygen (wt) (ASTM D5599) Lab 4 0 401 572 1129 0 368 527 1088
Table B1 Summary Data for FACE Gasoline Blends with Ethanol
41
Specific Tests FACE Gasoline Blend A B Target Ethanol Content 0 10 15 30 0 10 15 30 Distillation (˚F) (ASTM D86) Lab 1 IBP 90 106 99 99 97 105 103 101 5 122 127 122 126 133 128 126 129 10 140 134 131 135 149 135 134 138 20 165 145 144 146 175 147 146 149 30 186 153 152 153 196 155 154 155 40 198 159 156 156 209 165 159 159 50 204 202 159 158 214 211 165 161 60 207 208 204 159 218 217 214 162 70 210 211 210 160 221 219 219 163 80 213 214 213 161 226 225 224 165 90 219 222 219 211 236 234 234 230 95 228 233 229 224 248 247 246 242 FBP 262 261 263 260 280 271 270 266
Specific Tests FACE Gasoline Blend C H Target Ethanol Content 0 10 15 30 0 10 15 30 Distillation (˚F) (ASTM D86) Lab 1 IBP 93 104 102 107 98 96 105 106 5 126 126 123 130 127 123 125 127 10 139 131 131 136 143 132 134 138 20 157 140 140 145 170 145 147 152 30 174 147 147 151 194 153 156 159 40 188 153 153 156 213 167 161 163 50 201 183 157 159 229 217 182 166 60 210 208 176 161 243 236 235 169 70 218 217 215 162 263 255 253 175 80 227 226 223 165 291 283 282 268 90 245 244 241 233 329 322 323 312 95 274 274 269 261 357 351 351 343 FBP 330 331 322 324 408 401 407 396
42

5
Table 22
Target Fuel Parameters for Final Fuel Set
Final FACE Gasoline Designation
Initial Fuel Number
Aromatics Vol
n‐Paraffins
Vol
RON
Sensitivity
A 2 5 5 85 Low (le2)
B 3 5 5 95 Low (le2)
C 8 5 25 85 Low (le2)
D 12 35 25 95 Low (le2)
E 14 5 5 85 High (asymp10)
F 15 5 5 95 High (asymp10)
G 18 35 5 95 High (asymp10)
H 23 35 25 85 High (asymp10)
I 1 5 5 70 Low (le2)
J 10 35 25 70 Low (le2)
6
7
3 ANALYTICAL RESULTS FOR FACE GASOLINES
In this section results of the analyses of the physical and chemical properties of the first commercial
batches of each of the FACE Gasolines are discussed Chevron Phillips 66 BP and a contract laboratory
conducted the analyses Also included are the data provided on the CPChem Certificates of Analyses
(COAs) Note that future production runs that would be required to remake fuels that sell out likely will
result in some changes to the fuel property values reported here for the first production run
31 ASTM TEST RESULTS FOR PHYSICAL PROPERTIES
ASTM methods were used to measure the RON MON API gravity density distillation profiles RVP and
net heats of combustion of all of the FACE Gasolines The results of these analyses are summarized in
the sections below and also listed in detail in Table A1 located in Appendix A
311 RON MON and Octane Sensitivity
The ignition qualities of gasolines are typically characterized by RON and MON values RON values were
measured in CFR engines per ASTM method D2699 (4) Although the measurements were conducted in
several labs the lab‐to‐lab reproducibility was very good so only the average values are reported here
(but individual values are reported in Table A1) Bar charts of the average RON values for each fuel are
presented in Figure 31 (middle bars) Also included are the original design targets (1st bars) and the
values reported on the CPChem Certificates of Analysis (COA) (3rd bars) For most fuels the 3 values are
very close to each other (within plusmn1 unit of each other) The largest differences between measured and
target values are for fuels E H and J where the measured values are about 24‐38 units higher Fuel J is
also noteworthy because the value measured (1 lab only) is 2 units higher than the CPChem COA
Figure 31 RON Values of FACE Gasolines
850
950
850
950
850
950 950
850
700 700
839
958
843
942
874
940
965
869
700
738
835
960
847
932
875
944
968
869
703718
600
650
700
750
800
850
900
950
1000
A B C D E F G H I J
RON
Fuel
RON
Target
AVG
CPChem
8
MON values were measured in CFR engines per ASTM method D2700 (5) Although the measurements
were conducted in several labs the lab‐to‐lab reproducibility was very good so only the average values
are reported here (but individual values are reported in Table A1) Bar charts of the target measured
and CPChem COA MON values for each fuel are presented in Figure 32 The ldquotargetrdquo MON values were
determined by subtracting the target octane sensitivities from the target RON values The largest
difference between the values in this project and those reported on CPChemrsquos COA is 13 for fuel J The
largest differences between the measured and target values are for fuels D E F and H For Gasolines E
F and H the measured values are about 3‐6 units higher than target while for gasoline D the measured
values are about 6 units lower than the target
Figure 32 MON Values of FACE Gasolines
830
930
830
930
750
850 850
750
680 680
835
924
830
870
811
881
858
796
695 701
836
926
836
878
815
888
858
793
696
688
600
650
700
750
800
850
900
950
1000
A B C D E F G H I J
MON
Fuel
MON
Target
AVG
CPChem
9
Octane Sensitivity (S=RON‐MON) values are presented in the bar charts in Figure 33 The average sensitivities measured by the labs in this project are very close to those reported in CPChemrsquos COAs with the exception of Gasoline D The measured values for the three of the four high sensitivity fuels are quite a bit lower than the target value of 10 in the range of 59‐71 The exception is Gasoline G which comes close to meeting the target value Of the six low sensitivity fuels three (Gasolines A C and I) have values that meet the target value of le2 two have values that are slightly higher (Gasolines B and J) and one (Gasoline D) has a value that is significantly higher and in the range of the high sensitivity gasolines This discrepancy with Gasoline D is not surprising since it is very difficult to produce a low sensitivity fuel with a high level of aromatics which typically have high sensitivities Thus relative to the other manufactured FACE Gasolines Gasoline D should be considered a ldquohighrdquo sensitivity fuel
Figure 33 Octane Sensitivity Values of FACE Gasolines
312 Distillation Characteristics
The distillation properties of the fuels were determined by ASTM D86 (6) The D86 values obtained in
this study were very close to those reported on CPChemrsquos COAs The average of those two sources are
plotted in Figure 34 The values are also tabulated in Table A1 The temperature corresponding to a
given recovery fraction X is designated as TX (ie T90 indicates the temperature at which 90 of the
fuel has been vaporized and recovered) The initial boiling points (IBP) of all of the fuels are in a
relatively narrow range of 90‐110˚F In contrast the end boiling points (EBP) range from 253‐410˚F
Gasolines E G and H which are three of the four high sensitivity fuels have the highest EBPs Gasoline
E has a relatively steep increase in temperature of 140˚F from T90‐EBP Gasolines I and A the two fuels
having low sensitivity aromatics and n‐paraffin and low‐mid RON have the lowest EBPs Gasoline I
also has a relatively flat distillation profile from T30‐T90
100 100 100 100
04
34
13
72
63
59
107
71
05
3734
11
54
60
56
110
76
07
30
00
10
20
30
40
50
60
70
80
90
100
110
A B C D E F G H I J
Octan
e Sensitivity
Fuel
Octane Sensitivity
Target
AVG
CPChem
le2le2 le2 le2 le2 le2
‐01
10
Figure 34 ASTM D86 Distillation Curves for the FACE Gasolines
313 Reid Vapor Pressure (RVP)
The RVPs were determined using ASTM method D5191 (7) The values measured in this project were in
excellent agreement with those reported by CPChem COAs (within 01 psi) The averages of both values
are depicted in the bar charts in Figure 35 The values range from 67 to 805 psi
Figure 35 Reid Vapor Pressures of FACE Gasolines
500
1000
1500
2000
2500
3000
3500
4000
4500
0 10 20 30 40 50 60 70 80 90 100
Tempe
rature (˚ F)
Volume Distilled
D86 Distillation ‐ FACE Gasolines
A
B
C
D
E
F
G
H
I
J
805
735 745
680 670
780
725
755 760 750
0
1
2
3
4
5
6
7
8
9
A B C D E F G H I J
Reid Vap
or Pressure (p
si)
FACE Gasoline
Reid Vapor Pressure (RVP) ‐ FACE Gasolines
11
314 API Gravity and Density
The API gravities and densities of the fuels were measured using ASTM method D4052 (8) The
agreement between the values measured in this project and the values reported in the CPChem COAs
The individual values are listed in the Summary Table A1 in Appendix A The average of both values are
plotted in the bar charts in Figures 36 and 37 for API Gravity and density respectively As expected the
FACE Gasolines (D G H and J) having the highest aromatics content have the lowest API Gravities and
highest densities
Figure 36 API Gravities of FACE Gasolines
Figure 37 Densities of FACE Gasolines
7495
7135
7330
5870
6360
6860
54555580
7440
5910
0
5
10
15
20
25
30
35
40
45
50
55
60
65
70
75
80
A B C D E F G H I J
API G
ravity
FACE Gasoline
API Gravity ‐ FACE Gasolines
0685
0697
0691
0743
0725
0707
0760
0755
0697
0742
0645
065
0655
066
0665
067
0675
068
0685
069
0695
07
0705
071
0715
072
0725
073
0735
074
0745
075
0755
076
0765
077
A B C D E F G H I J
Density
(gml)
FACE Gasoline
Density ‐ FACE Gasolines
12
315 Net Heat of Combustion (NHC)
Net Heats of Combustion were measured using ASTM method D240 (9) The values are depicted in the
bar charts in Figure 38 In addition for two of the FACE Gasolines (C and J) the values were also
measured using ASTM method D4809 (10) The D4809 values were very close to those obtained from
method D240 (within 100 BTUlb) TheD240 values range from 18602 to 19251 BTUlb As expected
the FACE Gasolines having the highest aromatics content (D G H and J) have the lowest net heat of
combustion The FACE Gasolines having saturates content gt90 (A B C and I) have the highest net
heat of combustion
Figure 38 ASTM D240 Net Heats of Combustion of FACE Gasolines
19251
19187
19257
18649
18884
19072
1860218625
19225
18731
18200
18400
18600
18800
19000
19200
19400
A B C D E F G H I J
Net Heat o
f Com
bustion (BTU
lb) (A
STM D240)
FACE Gasoline
Net Heat of Combustion ‐ FACE Gasolines
13
32 CHEMICAL PROPERTIES OF FACE GASOLINES
The various types of hydrocarbons in the fuels were characterized by several techniques including
supercritical fluid chromatography (SFC) and detailed hydrocarbon analysis (DHA) by gas
chromatography using a flame ionization detector (GC‐FID) In addition the carbon hydrogen and
sulfur contents were measured Results are reported in the following sections
321 Aromatics by Supercritical Fluid Chromatography (SFC)
The SFC method of ASTM D5186 (11) separates the hydrocarbons into three fractions monoaromatics
polyaromatics and non‐aromatics and characterizes the composition in terms of mass Bar graphs of
the results are presented in Figure 39 Samples of FACE Gasolines B D E G and H were analyzed by
two labs The results from the two labs were very close to each other and so the averages are depicted
in the figure FACE Gasolines A B C and I have nonromatics levels gt90 wt FACE Gasolines D G and
H have the highest amounts of monoaromatics with values ranging from 394‐420 wt FACE
Gasolines E G and H appear to have about 1 wt polyaromatics
Figure 39 Compositions of FACE Gasolines by Supercritical Fluid Chromatography (ASTM D5186)
070 790 600
4175
14001000
39404200
040
3870
015
100
110125
030
9930
9210 9400
5810
85009000
59505675
9960
6100
0
10
20
30
40
50
60
70
80
90
100
A B C D E F G H I J
Composition (Wt )
FACE GASOLINE
SFC Composition ‐ FACE Gasolines
MonoAromatics PolyAromatics NonAromatics
14
322 Hydrocarbons by Detailed Hydrocarbon Analysis (DHA)
Detailed Hydrocarbon Analyses were performed by two labs using gas chromatography with flame
ionization detectors (GC‐FID) This technique enables the determination of concentration on a species‐
by‐species basis provided that retention factors have been determined for each species in the fuel The
results from both labs were very close to each other Bubble charts of the average concentration values
(in volume ) are depicted in Figure 310 for the low sensitivity fuels and Figure 311 for the high
sensitivity fuels on a carbon number basis for the five hydrocarbon classes n‐paraffins iso‐paraffins
naphthenes aromatics and olefins
In general the low sensitivity FACE Gasolines are characterized by large amounts of low sensitivity
components such as n‐paraffins and iso‐paraffins The high sensitivity FACE Gasolines contain more high
sensitivity components such as olefins and naphthenes than the low sensitivity fuels
The total concentration of components within each of the five hydrocarbon classes were added and the
sums are reported in the bar charts in Figure 312 The n‐paraffin levels range from 225‐316 vol for
the four FACE Gasolines (C D H and J) that had targets of 25 vol For the other FACE Gasolines that
had a target level of 5 vol the n‐paraffins levels range from 44‐117 vol The aromatics levels range
from 317‐358 vol for the four FACE Gasolines (D G H and J) that had targets of 35 vol For the
other six FACE Gasolines that had a target level of 5 vol the aromatics levels range from 0‐109 vol
The C7 aromatic is toluene the C8 aromatics consist of a mix of ethylbenzene and the xylene isomers
the C9 aromatics consist of a mix of trimethylbenzenes and methylethylbenzenes and the C10 aromatics
consist of a mix of tetramethylbenzenes dimethylethylbenzenes and methylpropylbenzenes FACE
Gasoline E a high sensitivity fuel has a naphthene content of 208 vol mainly cyclopentane and
cyclohexane Three other high sensitivity fuels (F G and H) have naphthenes concentrations of about
11 vol mainly cyclopentane Those high sensitivity fuels also have the highest olefins content with
concentrations ranging from 68‐127 vol FACE Gasoline I also has 64 vol olefins The C6 olefin is
1‐hexene The C5 olefins consist of a mix of 2‐pentene and methyl butenes In contrast to the high
sensitivity fuels Gasoline D which was designed to be low sensitivity but ended up in the high
sensitivity range has essentially no naphthenes or olefins Its high sensitivity is derived from its high
aromatics content
The C5 isoparaffin in all of the fuels is 2‐methylbutane The C6 isoparaffins consist of a mix of 2‐ and 3‐
methyl pentanes and 23 dimethyl butane The C7 isoparaffins in most of the FACE Gasolines consist of a
mix of 2‐ and 3‐methyl hexanes and 23‐ and 24‐dimethylpentanes The C8 isoparaffins are
predominantly trimethylpentanes with more than 50 of those being isooctane (224
trimethylpentane) The other isomers are mainly 24‐ and 25 dimethylhexanes and 2‐methyl 3‐ethyl
pentane
15
Figure 310 Detailed Hydrocarbon Analyses of Low Sensitivity FACE Gasolines
122 44 219 451 11
48 65
065
3 4 5 6 7 8 9 10 11
Carbon Number
FACE Gasoline A ‐ Detailed Hydrocarbon Analysis (vol)
isoparaffins
n‐paraffins
cycloparaffins
aromatics
olefins
104 13 137 587 16
59
39 37
3 4 5 6 7 8 9 10 11
Carbon Number
FACE Gasoline B ‐ Detailed Hydrocarbon Analysis (vol)
isoparaffins
cycloparaffins
aromatics
olefins
n‐paraffins
64 27 117 468 20 075
30 06
31 118 100
3 4 5 6 7 8 9 10 11
Carbon Number
FACE Gasoline C ‐ Detailed Hydrocarbon Analysis (vol)
isoparaffins
cycloparaffins
aromatics
olefins
n‐paraffins
12 410
99 35 150 46
47 114 70
3 4 5 6 7 8 9 10 11
Carbon Number
FACE Gasoline D ‐ Detailed Hydrocarbon Analysis (vol)
isoparaffins
cycloparaffins
aromatics
olefins
n‐paraffins
41 34 99 321 236 11
07 135
24
11
59
3 4 5 6 7 8 9 10 11
Carbon Number
FACE Gasoline I ‐ Detailed Hydrocarbon Analysis (vol)
isoparaffins
n‐paraffins
cycloparaffins
aromatics
olefins
327
90 124 95
22
14 131 145 29
06
3 4 5 6 7 8 9 10 11
Carbon Number
FACE Gasoline J ‐ Detailed Hydrocarbon Analysis (vol)
isoparaffins
n‐paraffins
cycloparaffins
aromatics
olefins
16
Figure 311 Detailed Hydrocarbon Analyses of High Sensitivity FACE Gasolines
64 68 143 165 18 07
70 105 19 10 04
46 17 18 16 08
21 82 09
29 06 37
3 4 5 6 7 8 9 10 11
Carbon Number
FACE Gasoline E ‐ Detailed Hydrocarbon Analysis (vol)
isoparaffins
cycloparaffins
aromatics
olefins
n‐paraffins
82 64 134 378 14
21 21
100
76
89
3 4 5 6 7 8 9 10 11
Carbon Number
FACE Gasoline F ‐ Detailed Hydrocarbon Analysis (vol)
isoparaffins
n‐paraffins
cycloparaffins
aromatics
olefins
65 66 72 152 16 10
74 09 16 10
15 33 218 54 14
36 25 10
37 07 10
3 4 5 6 7 8 9 10 11
Carbon Number
FACE Gasoline G ‐ Detailed Hydrocarbon Analysis (vol)
isoparaffins
cycloparaffins
aromatics
olefins
n‐paraffins
28 54 71 39 22 09
66 08 17 10
10 95 117 83 43 14
29 21 09
54 05 145 08
3 4 5 6 7 8 9 10 11
Carbon Number
FACE Gasoline H ‐ Detailed Hydrocarbon Analysis (vol)
isoparaffins
cycloparaffins
aromatics
olefins
n‐paraffins
17
Figure 312 Detailed Hydrocarbon Analyses Comparisons of FACE Gasolines
A comparison of the composition results from the DHA and SFC methods is presented in Figure 313 for
the low sensitivity fuels and Figure 314 for the high sensitivity fuels Also included are Fluorescent
Indicator Absorption (FIA ndash ASTM D1319 (12)) composition results reported on the CPChem COAs Since
the FIA method determines total saturates the DHA results for n‐paraffins iso‐paraffins and
naphthenes must be added together to enable the comparison between those two methods Similarly
since the SFC method directly measures aromatics and total non‐aromatics are determined by
difference the olefins amount must be added to the total saturate levels from FIA and DHA to enable
comparisons with the non‐aromatics values from SFC The appropriate comparison categories are
indicated by dashed lines in Figures 313 and 314 Of the three methods SFC generally gives the
highest level of aromatics and FIA the lowest The DHA aromatics values are closer to the FIA levels than
to the SFC levels The DHA olefins are fairly close to the FIA results
117
80
244 241
7944 67
225144
316
860
859
697
421
459
676
384
228
745336
16
01
01208
110
115105
33
23
13
127
94
8168
64
06
58 39
334
10977
336 358
12
317
0
10
20
30
40
50
60
70
80
90
100
A B C D E F G H I J
Composition ( vol)
FACE GASOLINE
DHA Composition ‐ FACE Gasolines
n‐paraffins isoparaffins naphthenes olefins aromatics
18
Figure 313 Comparison of Composition Methods FACE Low Sensitivity Gasolines
Figure 314 Comparison of Composition Methods FACE High Sensitivity Gasolines
117
80
244
144
316
860 859
697
745336
16
01 0433
23
13 64
06
58 3912
317
996951 975
929
712
04
07 04 62
10
42 21 09
278
993
921 940996
610
07
79 6004
390
0
10
20
30
40
50
60
70
80
90
100
DHA FIA SFC DHA FIA SFC DHA FIA SFC DHA FIA SFC DHA FIA SFC
Composition ( )
FACE GASOLINE
Composition ‐ Low Sensitivity FACE Gasolines
n‐paraffins isoparaffins naphthenes olefins aromatics saturates nonaromatics
A B C I J
241
7944 67
225
421
459
676
384
228
01
208
110
115 105
127
94
81 68
334
10977
336 358
701
780
856
587 568
04
99
86
7879
295
12158
335 353
581
850900
595568
419
150100
405432
0
10
20
30
40
50
60
70
80
90
100
DHA FIA SFC DHA FIA SFC DHA FIA SFC DHA FIA SFC DHA FIA SFC
Composition ( )
FACE GASOLINE
Composition ‐ High Sensitivity FACE Gasolines
n‐paraffins isoparaffins naphthenes olefins aromatics saturates nonaromatics
D E F G H
19
323 Elemental Analyses
Carbon and hydrogen contents were measured by two labs using ASTM method D5291 (13) The
average results are presented in the bar graphs in figure 315 The carbon contents range from 8399‐
8748 wt and the hydrogen contents range from1252‐1601 wt As expected the FACE Gasolines
having the highest aromatics content (D G H and J) have the highest carbon and lowest hydrogen
contents
Figure 315 Carbon and Hydrogen Elemental Analyses of FACE Gasolines
8399 8443 8453 8646 8547 8496 8670 87488414 8624
1601 1557 1547 1354 1453 1504 1330 12521586 1376
0
10
20
30
40
50
60
70
80
90
100
A B C D E F G H I J
Compo
sition
(wt)
FACE Gasoline
Carbon‐Hydrogen Elemental Analyses
Hydrogen
Carbon
20
Sulfur content was measured by one lab ASTM method D5453 (14) The results displayed in the bar
charts in Figure 316 are essentially identical to the values reported on the CPChem COAs All FACE
Gasolines had ultra‐low sulfur levels FACE Gasolines E G and H had the highest levels at 21 22 and 15
ppm sulfur The other fuels had levels ranging from 2‐6 ppm
Figure 316 Sulfur Levels of FACE Gasolines
6
4 4
2
21
2
22
15
2 2
0
5
10
15
20
25
A B C D E F G H I J
Sulfur Content (p
pm)
FACE Gasoline
Sulfur Content ‐ FACE Gasolines
21
4 ANALYTICAL RESULTS FOR FACE GASOLINES BLENDED WITH ETHANOL
Although the FACE Gasolines were not formulated with ethanol the expectation is that some potential
users will be interested in testing the fuels with ethanol added To assist selection of fuels for those
studies four FACE Gasolines were selected for blending with levels of 10 15 and 30 vol ethanol The
fuels selected for this purpose were A B C and H The positions of these fuels in the design matrix are
shown below
In this section results of the analyses of the ethanol blends are discussed Chevron Phillips 66 BP and
a contract laboratory conducted the analyses As mentioned previously future production runs that are
required to remake fuels that sell out likely will results in some changes to the fuel property values
reported here
41 ASTM TEST RESULTS
ASTM methods were used to measure the ethanol content RON MON API gravity density distillation
profiles RVP and net heats of combustion of all of the ethanol blends made with the FACE Gasolines
The results of these analyses are summarized below and in Table A2 located in the Appendix
411 Ethanol Content
FACE Gasolines A B C and H were blended with nominally 10 15 and 30 vol ethanol The
concentration of ethanol in each blend were determined using ASTM method D5599 (15) (coupled with
ASTM D4052 density measurement) and by detailed hydrocarbon analysis using gas chromatography
with a flame ionization detector The results for both methods were in excellent agreement for all fuels
as shown below in Table 41
Table 41 Measured Ethanol Content of FACE Gasoline Blends
Ethanol Content (vol)
A B C H
10 15 30 10 15 30 10 15 30 10 15 30
D5599 101 147 299 100 147 302 102 146 295 102 146 303
DHA 100 146 301 100 148 301 103 148 299 102 147 304
22
412 RON MON and Octane Sensitivity
RON values were measured in CFR engines per ASTM method D2699 (4) Although the measurements
were conducted in four labs the lab‐to‐lab reproducibility was very good so only the average values are
reported here (but individual values are reported in Table A2) Average RON values for each fuel are
presented in Figure 41 For all four of these FACE Gasolines the RON values continue to increase even
at the 30 ethanol level although the rates of increase are lower than at lower ethanol levels FACE
Gasoline B has the highest RON at all ethanol levels with a value of about 106 at the 30 ethanol level
FACE Gasolines A and C have essentially the same RON values at all ethanol levels with RON values of
about 102 at the 30 ethanol level FACE Gasoline H without ethanol has a higher RON than A and C
but a lower RON at the 15 and 30 ethanol levels
Figure 41 RON Values of FACE Gasoline Blends with Ethanol
MON values were measured in CFR engines per ASTM method D2700 (5) Although the measurements were conducted in four labs the lab‐to‐lab reproducibility was very good so only the average values are reported here (but individual values are reported in Appendix A2) The MON values for each fuel are
presented in Figure 42 FACE Gasoline B has the highest MON values at all ethanol levels but unlike the other FACE Gasolines the MON value did not increase with ethanol contents above 10 vol The MON values for FACE Gasolines A and C were essentially the same and higher than those for FACE Gasoline H
80081082083084085086087088089090091092093094095096097098099010001010102010301040105010601070108010901100
0 5 10 15 20 25 30 35
RON
Ethanol (vol)
RON Values ‐ FACE Gasoline + Ethanol Blends
FACE A
FACE B
FACE H
FACE C
23
Figure 42 MON Values of FACE Gasoline Blends with Ethanol
Octane Sensitivity (S=RON‐MON) values are presented in Figure 43 As expected due to the relatively high sensitivity of ethanol the sensitivities of all four FACE Gasolines increase as the ethanol content increases FACE Gasoline H has the highest sensitivity at all ethanol levels except at 30 vol ethanol where the sensitivity of the FACE Gasoline B blend becomes slightly higher with values of 124 and 132 respectively The sensitivities for FACE Gasolines A and C are very similar to each other and although lower than the blends for the other FACE Gasolines have the highest rates of increase at the 30 level
Figure 43 Octane Sensitivities FACE Gasoline Blends with Ethanol
750
760
770
780
790
800
810
820
830
840
850
860
870
880
890
900
910
920
930
940
950
0 5 10 15 20 25 30 35
MON
Ethanol (vol)
MON Values ‐ FACE Gasoline + Ethanol Blends
FACE A
FACE B
FACE H
FACE C
00
10
20
30
40
50
60
70
80
90
100
110
120
130
140
0 5 10 15 20 25 30 35
S
Ethanol (vol)
Octane Sensitivity (S) ‐ FACE Gasoline + Ethanol Blends
FACE A
FACE B
FACE H
FACE C
24
413 Distillation Characteristics
The distillation properties of the fuels were determined by ASTM D86 (6) The values are plotted in
Figure 44 and tabulated in Table A2 in the Appendix The behavior and shapes of the curves are very
similar For a given gasoline all of the ethanol blends start at about the same IBP The blends
containing ethanol then follow the same curve which is lower than the base gasoline At a certain point
the ethanol blends then rise quickly to rejoin the distillation curve of the base gasoline The lower the
ethanol content of the blend the earlier (lower distilled volume ) the curve rejoins the base gasoline
curve
Figure 44 ASTM D86 Distillation Profiles for FACE Gasoline Blends with Ethanol
50
100
150
200
250
300
0 10 20 30 40 50 60 70 80 90 100
Temperature (˚ C)
Volume Distilled
D86 Distillation ‐ FACE A Gasoline + Ethanol Blends
0 EtOH
10 EtOH
15 EtOH
30 EtOH
50
100
150
200
250
300
0 10 20 30 40 50 60 70 80 90 100
Temperature (˚ C)
Volume Distilled
D86 Distillation ‐ FACE B Gasoline + Ethanol Blends
0 EtOH
10 EtOH
15 EtOH
30 EtOH
50
100
150
200
250
300
350
0 10 20 30 40 50 60 70 80 90 100
Temperature (˚ C)
Volume Distilled
D86 Distillation ‐ FACE C Gasoline + Ethanol Blends
0 EtOH
10 EtOH
15 EtOH
30 EtOH
50
100
150
200
250
300
350
400
450
0 10 20 30 40 50 60 70 80 90 100
Temperature (˚ C)
Volume Distilled
D86 Distillation ‐ FACE H Gasoline + Ethanol Blends
0 EtOH
10 EtOH
15 EtOH
30 EtOH
25
414 Reid Vapor Pressure (RVP)
The RVPs were determined using ASTM method D5191 (7) The values are plotted in Figure 45 For all
fuels the RVP appears to peak between 10 and 15 vol ethanol and then starts to decrease as the
ethanol content increases further
Figure 45 Reid Vapor Pressures for FACE Gasoline Blends with Ethanol
415 API Gravity and Density
The API gravities and densities of the fuels were measured by two labs using ASTM method D4052 (8) The values from the two labs were in excellent agreement and are listed in Table A2 The average density values are presented in Figure 46 For all of the FACE Gasolines the density increased as the ethanol content increased
Figure 46 Densities of FACE Gasoline Blends with Ethanol
7
75
8
85
9
95
10
0 5 10 15 20 25 30 35
RVP (psi)
Ethanol (vol)
Reid Vapor Pressure (RVP) ‐ FACE Gasoline + Ethanol Blends
FACE A
FACE B
FACE H
FACE C
0685 0697 0691
0759
0696 0705 0699
0761
0700 0710 0704
0763
0716 0724 0719
0768
0
01
02
03
04
05
06
07
08
09
1
A B C H
Density
(gm
l)
Ethanol (vol)
Density ‐ FACE Gasoline Blends with Ethanol
0
10
15
30
26
416 Net Heat of Combustion (NHC)
Net Heats of Combustion were measured by 2 labs using ASTM method D240 (9) For some fuels ASTM
method D4809 (10) was also used The values from both labs and both methods were very close to each
other and the average values are plotted in Figure 47 As expected since the net heat of combustion of
ethanol is lower than that of gasoline for all FACE Gasolines the net heat of combustion decreased as
ethanol content increased The decrease appeared to be linear with ethanol content The decrease
appeared to be steepest for FACE Gasoline B
Figure 47 Net Heat of Combustion of FACE Gasoline Blends with Ethanol
16000
16250
16500
16750
17000
17250
17500
17750
18000
18250
18500
18750
19000
19250
19500
0 5 10 15 20 25 30 35
Net Heat of C
ombustion (B
TUlb)
Ethanol (vol)
Net Heat of Combustion ‐ FACE Gasoline + Ethanol Blends
FACE A
FACE B
FACE H
FACE C
27
5 SUMMARY AND CONCLUSIONS
A subteam of the CRC AVFL FACE Working Group has designed a matrix of reference gasolines
known as the FACE Gasolines A commercial vendor has produced and made the fuels available
for purchase in research quantities It is expected that this will enable consistent comparisons
of engine and combustion results from different laboratories and test platforms based on the
use of the same set of fuels
The matrix is designed around four parameters expected to be of importance for advanced
gasoline engines RON octane sensitivity aromatics content and n‐paraffins content
Statistical methods were used to identify potential candidate formulations and down‐select to a
tractable number of 10 formulations
Detailed analyses were performed on the physical and chemical properties of the final fuel
formulations
Generally the property values measured in the current study agreed very well with the values
reported on the fuel blender (ChevronPhillips Chemical Company ‐ CPChem) Certificates of
Analyses (COAs)
As expected conflicts in the target properties for some of the fuels (such as high aromatics level
coupled with low octane sensitivity) led to some trade‐offs that resulted in some deviation in
the actual properties from the design properties
The RON values come close to meeting the targets for most of the fuels Fuels E H and J have
values that are 24‐38 units higher than the targets
Three of the four ldquohighrdquo sensitivity fuels have measured values of 59‐71 that are lower than
the target value of 10 Two of the ldquolowrdquo sensitivity fuels have measured values (34‐37) that are
a bit higher than the target value of le2 One of the low sensitivity design fuels (ldquoDrdquo) has a value
of 72 that actually effectively makes it a high sensitivity fuel
Detailed hydrocarbon analyses (DHA) indicate that the n‐paraffins contents range from 225‐
316 vol for the four FACE Gasolines that had targets of 25 vol and from 44‐117 vol for
the six FACE Gasolines that had targets of 5 vol
DHAs indicate that the aromatics contents range from 317‐358 vol for the four FACE
Gasolines that had a target of 35 vol and 0‐109 vol for the other fuels that had a target of 5
vol
The high sensitivity fuels contained the high sensitivity components of naphthenes (105‐208
vol) and olefins (68‐127 vol) The exception was Gasoline ldquoDrdquo which had neither of these
components but whose high sensitivity was derived from aromatics components
Five of the FACE Gasolines (ldquoArdquo ldquoBrdquo ldquoCrdquo ldquoFrdquo and ldquoIrdquo) are very rich in isoparaffins with contents ge
676 vol
Aromatics values determined by SFC were generally higher than the values obtained from DHA
The DHA olefins values were close to the FIA values reported on the CPChem COAs
The fuels having the highest aromatics content also have the highest densities and highest net
heats of combustion on an energy content per volume basis
With regards to distillation properties for all fuels the initial boiling points (IBPs) are in a
narrow range of 90‐110˚F although the end boiling points (EBPs) range from 253‐410˚F Three
28
of the high sensitivity fuels have the highest EBPs The two low‐mid RON fuels having low n‐
paraffins and low aromatics have the lowest EBPs
All of the FACE Gasolines have ultra‐low levels of sulfur with the highest value at 22 ppm S and
most fuels having le 6 ppm S
For the four FACE Gasolines blended with ethanol RON continues to increase as the ethanol
levels increase to 30 vol although the rate of increase is lower as the ethanol content
increases FACE Gasoline B which has the highest RON of 96 has the highest RON at all ethanol
levels with a value of about 106 at 30 ethanol At the same ethanol level FACE Gasolines A
and C have essentially the same RON values FACE Gasoline H starts with a higher RON value
than those of A or C but has a lower value at blend levels of 15 and 30 vol
MON increased as the ethanol level increased for FACE Gasolines A C and H The MON values
for these fuels were essentially constant even though the highest MON values were found for
the ethanol blends with FACE Gasoline B
For all blends octane sensitivity increased as ethanol content increased with the highest values
of 12‐13 for 30 vol ethanol blends with FACE Gasolines B and H
The D86 distillation curve trends are similar for the four FACE Gasolines For a given gasoline all
blends start at the same point At around 10 vol distilled the curves for the blends with
ethanol diverge from and are lower than the curves for the base gasolines At a certain point
the distillation curves for the blends rise quickly and re‐join the curve for the parent base fuel
The distillation curves for the 30 vol ethanol blends are generally flat as a function of
increasing vol distilled and only start to increase again at about 70‐80 vol distilled when
most of the ethanol has been distilled from the liquid
The Reid Vapor Pressures (RVPs) peak at about 10‐15 vol
Densities increase slightly as ethanol increases while net heats of combustion decrease
29
6 REFERENCES
1 Alnajjar M Cannella B Dettman H Fairbridge C Franz J Gallant T Gieleciak R Hager D Lay C Lewis S Ratcliff M Sluder S Storey J Yin H Zigler B ldquoChemical and Physical Properties of the Fuels for Advanced Combustion Engines (FACE) Research Diesel Fuelsrdquo CRC Report No FACE‐1 (2010)
2 Gallant T Franz J Alnajjar M Storey J Lewis S Sluder S Cannella W Fairbridge C Hager D Dettman H Luecke J Ratcliff M Zigler ldquoFuels for Advanced Combustion Engines Research Diesel Fuels Analysis of Physical and Chemical Propertiesrdquo SAE Paper 2009‐01‐2769 (2009)
3 CannellaW Fairbridge C Arboleda P Bays T Dettman H Foster M Gieleciak R Gunter G Hager D Lay C Lewis S Luecke J Sluder S Zigler B ldquoDetailed Characterization of the Physical and Chemical Properties of the Reformulated FACE Diesel Fuels FD2B FD4B and FD7Brdquo CRC Report AVFL‐19‐1 (2013)
4 ASTM International Standard Test Method for Research Octane Number of Spark‐Ignition Engine Fuel ASTM D2699 (ASTM International Pennsylvania 2009)
5 ASTM International Standard Test Method for Motor Octane Number of Spark‐Ignition Engine Fuel ASTM D2700 (ASTM International Pennsylvania 2009)
6 ASTM International Standard Test Method for Distillation of Petroleum Products at Atmospheric Pressure ASTM D86‐09e1 (ASTM International Pennsylvania 2009)
7 ASTM International Standard Test Method for Vapor Pressure of Petroleum Products (Mini‐Method) ASTM D5191 (ASTM International Pennsylvania 2009)
8 ASTM International Standard Test Method for Density and Relative Density of Liquids by Digital Density Meter ASTM D4052‐96(2002)e1 (ASTM International Pennsylvania 2002)
9 ASTM International Standard Test Method for Heat of Combustion of Liquid Hydrocarbon Fuels by Bomb Calorimeter ASTM D240‐02(2007) (ASTM International Pennsylvania 2007)
10 ASTM International Standard Test Method for Heat of Combustion of Liquid Hydrocarbon Fuels by Bomb Calorimeter ASTM D4809 (2007) (ASTM International Pennsylvania 2007)
11 ASTM International Standard Test Method for Determination of Aromatic Content and Polynuclear Aromatic Content of Diesel Fuels and Aviation Turbine Fuels by Supercritical Fluid Chromatography ASTM D5186‐03(2009) (ASTM International Pennsylvania 2009)
12 ASTM International Standard Test Method for Hydrocarbon Types in Liquid Petroleum Products by Fluorescent Indicator Adsorption ASTM D1319‐08 (ASTM International Pennsylvania 2008)
13 ASTM International Standard Test Methods for Instrumental Determination of Carbon Hydrogen and Nitrogen in Petroleum Products and Lubricants ASTM D5291‐02(2007) (ASTM International Pennsylvania 2007)
14 ASTM International Standard Test Methods for Determination of Total Sulfur in Light Hydrocarbons Spark‐Ignition Engine Fuel Diesel Engine Fuel and Engine Oil by Ultraviolet Fluorescence ASTM D5453(2007) (ASTM International Pennsylvania 2007)
15 ASTM International Standard Test Methods for Determination of Oxygenates in Gasoline by Gas Chromatography and Oxygen Selective Flame Ionization Detection ASTM D5599 (2007) (ASTM International Pennsylvania 2007)
30
31
Appendix A
Properties of FACE Gasolines
32
Table A1 Summary Data for FACE Gasolines
Specific Tests FACE Gasoline A B C D E F G H I J Research Octane Number (RON) (ASTM D2699) -Lab 1 843 958 850 946 871 940 969 870 700 738 -Lab 2 839 960 840 939 877 960 869 -Lab 3 835 957 840 -Average 839 958 843 942 874 940 965 869 7015 738 -CPChem COA 835 960 847 932 875 944 968 869 703 718 Motor Octane Number (MON) (ASTM D2700) -Lab 1 836 923 830 872 813 881 857 797 695 701 -Lab 2 833 931 830 868 808 860 799 -Lab 3 835 919 829 -Average 835 924 830 870 811 881 858 798 695 701 -CPChem COA 836 926 836 878 815 888 858 793 696 688 Sensitivity (RON-MON) -Lab 1 07 35 20 74 58 59 112 73 05 37 -Lab 2 06 29 10 71 69 100 70 -Lab 3 0 38 11 -Average 04 34 13 72 63 59 107 72 05 37 -CPChem COA -01 34 11 54 60 56 110 76 07 30 API Gravity (API˚) (ASTM D4052) -CPChem COA 750 714 734 587 636 686 545 568 744 595 -Lab 1 749 713 732 587 636 686 546 548 744 587 -Average 7495 7135 733 587 636 686 5455 558 744 591 Density (ASTM D4052) -CPChem COA 0691 0743 0725 0707 0760 0697 0741 -Lab 1 0685 0697 0691 0743 0725 0707 0760 0759 0697 0743 -Average 0685 0697 0691 0743 0725 0707 0760 0759 0697 0742 RVP (psi) (D5191) -CPChem COA 81 74 74 68 67 78 72 75 75 75 -Lab 1 80 73 75 73 76 77 Net Heat of Combustion (BTUlb) (ASTM D4809) 19186 18680 Net Heat of Combustion (BTUlb) (ASTM D240) 19251 19187 19257 18649 18884 19072 18602 18625 19225 18731
33
TableA1 Summary Data for FACE Gasolines
Specific Tests FACE Gasoline A B C D E F G H I J Distillation (˚F) (ASTM D86) -CPChem IBP 93 95 95 88 110 108 93 94 100 101
5 104 128 120 129 131 129 122 123 123 111 10 132 145 136 148 142 142 135 140 156 162 20 160 172 154 176 155 156 158 168 177 206 30 183 194 171 198 166 168 183 192 186 217 40 197 207 187 212 177 180 210 211 191 224 50 203 213 200 221 186 193 240 227 195 231 60 207 216 210 229 197 206 270 242 199 242 70 210 220 218 235 208 217 306 262 203 261 80 213 225 226 280 222 225 328 291 207 291 90 219 235 243 330 267 240 343 327 213 316 95 227 248 270 340 343 261 363 358 220 330 FBP 269 283 328 363 405 294 403 410 259 358
-Lab 1 IBP 90 97 93 97 107 102 99 98 99 95 5 122 133 126 133 134 134 122 127 139 111
10 140 149 139 151 143 144 136 143 160 166 20 165 175 157 179 156 157 158 170 178 209 30 186 196 174 200 168 169 182 194 187 219 40 198 209 188 214 177 182 209 213 192 225 50 204 214 201 224 188 195 238 229 196 232 60 207 218 210 234 197 207 268 243 200 242 70 210 221 218 248 208 218 304 263 204 263 80 213 226 227 288 224 228 328 291 208 292
90 219 236 245 331 258 243 343 329 213 316 95 228 248 274 341 329 261 358 357 220 330 FBP 262 280 330 365 402 291 405 408 247 357
-Average IBP 915 96 94 925 1085 105 96 96 995 98 5 113 1305 123 131 1325 1315 122 125 131 111
10 136 147 1375 1495 1425 143 1355 1415 158 164 20 1625 1735 1555 1775 1555 1565 158 169 1775 203 30 1845 195 1725 199 167 1685 1825 193 1865 218 40 1975 208 1875 213 177 181 2095 212 1915 2245 50 2035 2135 2005 2225 187 194 239 228 1955 2315 60 207 217 210 2315 197 2065 269 2425 1995 242 70 210 2205 218 2415 208 2175 305 2625 2035 262 80 213 2255 2265 284 223 2265 328 291 2075 2915
90 219 2355 244 3305 2625 2415 343 328 213 316 95 2275 248 272 3405 336 261 3605 3575 220 330 FBP 2655 2815 329 364 4035 2925 404 409 253 3575
34
Table A1 Summary Data for FACE Gasolines
Specific Tests FACE Gasoline A B C D E F G H I J Elemental Analysis (ASTM D 5291) -Carbon (wt) -Lab 1 8398 8441 8497 8647 8547 8671 8792 8415 -Lab 4 8400 8444 8419 8645 8547 8496 8669 8703 8414 8624 -Average 8399 8443 8458 8646 8547 8496 8670 8748 8414 8624 -Hydrogen (wt) -Lab 1 1602 1559 1503 1353 1453 1329 1208 1585 -Lab 4 1600 1556 1585 1355 1453 1504 1331 1297 1586 1376 -Average 1601 1557 1547 1354 1453 1504 1330 1252 1586 1376 Sulfur by UV Fluorescence (ppmw) (ASTM D5453) -CPChem COA 4 4 3 2 21 2 20 15 2 2 -Lab 4 6 4 4 2 21 2 22 15 2 2 Hydrocarbons by FIA (vol) (ASTM D1319) -Aromatics (vol) CPChem COA 0 42 21 295 121 58 335 353 09 278 -Olefins (vol) CPChem COA 04 07 04 04 99 86 78 79 62 10 -Saturates (vol) CPChem COA 996 951 975 701 780 856 587 568 929 712 Aromatics by SFC (ASTM D5186) (Lab 1) -MonoAromatics (wt) -Lab 1 07 78 60 414 142 100 393 412 04 387 -Lab 2 80 421 138 395 428 -Average 07 79 60 4175 140 100 394 420 04 387 -PolyAromatics (wt) -Lab 1 0 0 0 03 11 0 10 10 0 03 -Lab 2 0 0 09 12 15 -Average 0 0 0 015 10 0 11 125 0 03 -NonAromatics (wt) -Lab 1 993 922 940 583 847 900 597 578 996 610 -Lab 2 920 579 850 593 557 -Average 993 921 940 581 8475 900 595 5675 996 610
35
Table A1 Summary Data for FACE Gasolines
Specific Tests FACE Gasolines A B C D E F G H I J Detailed Hydrocarbon Analyses by GC-FID -n-paraffins (vol) (Targets) (5) (5) (25) (25) (5) (5) (5) (25) (5) (25) -Lab 1 1144 783 2409 2346 771 434 662 2214 1441 3115 -Lab 2 1187 815 2476 2473 803 446 685 2283 1437 3212 -Average 1165 799 2443 2410 787 440 673 2249 1439 3164 -iso-paraffins (vol) -Lab 1 8562 8591 688 4206 4563 6765 3821 2322 7449 3362 -Lab 2 8635 8586 7066 4221 4621 6747 3864 2240 7459 3366 -Average 8599 8688 6973 4213 4592 6756 3843 2281 7454 3364 -cyclo-paraffins (vol) -Lab 1 192 021 048 010 2216 1078 1163 1035 324 234 -Lab 2 130 007 023 010 1945 1118 1140 1066 336 224 -Average 161 014 036 010 2081 1098 1152 1050 330 229 -aromatics (vol) (Targets) (5) (5) (5) (35) (5) (5) (35) (35) (5) (35) -Lab 1 073 601 409 3425 1121 805 3419 3597 120 3212 -Lab 2 003 568 374 3258 1062 739 3306 3555 110 3125 -Average 38 584 392 3341 1092 772 3363 3576 115 3169 -olefins (vol) -Lab 1 024 001 248 004 1146 978 851 714 643 066 -Lab 2 018 003 006 005 1392 905 771 650 627 054 -Average 021 002 127 04 1269 942 811 682 635 060
36
37
Appendix B
Properties of FACE Gasoline Blends with Ethanol
38
Table B1 Summary Data for FACE Gasoline Blends with Ethanol
Specific Tests FACE Gasoline Blend A B Ethanol Content (Vol ) 0 10 15 30 0 10 15 30 Ethanol Content (Vol ) (ASTM D5599) 0 1012 1469 2990 0 995 1473 3016 Research Octane Number (RON) (ASTM D2699) -Lab 1 843 922 951 1032 958 1015 1039 1067 -Lab 2 839 923 951 1017 960 1008 1023 1050 -Lab 3 835 917 946 1025 957 1012 1031 1069 -Lab 4 916 945 1018 1009 1026 1053 -Average 839 920 948 1023 958 1011 1030 1060 Motor Octane Number (MON) (ASTM D2700) -Lab 1 836 878 890 912 923 936 936 934 -Lab 2 833 874 891 917 931 935 934 931 -Lab 3 835 881 893 911 919 933 934 933 -Lab 4 884 901 916 935 936 933 -Average 835 879 894 914 924 935 935 933 Sensitivity (RON-MON) -Lab 1 07 44 61 120 35 79 103 133 -Lab 2 06 49 60 100 29 73 89 119 -Lab 3 0 36 53 114 38 79 97 136 -Lab 4 32 44 102 74 91 120 -Average 04 41 54 109 34 76 95 127 API Gravity (API˚) (ASTM D4052) -Lab 1 749 7164 7066 661 7131 690 6772 6375 -Lab 4 716 706 660 690 676 638 -Average 749 7162 7063 6605 7131 690 6766 6377 Density (ASTM D4052) -Lab 1 06849 06959 06992 07154 0697 07050 07096 07240 -Lab 4 06966 06999 07161 07055 07106 07244 -Average 06849 06963 06996 07158 0697 07053 07101 07242 RVP (psi) (D5191) Lab 1 83 95 94 91 73 87 86 83 Net Heat of Combustion (BTUlb) (ASTM D4809) 18308 Net Heat of Combustion (BTUlb) (ASTM D240) -Lab 1 19266 18294 18080 16751 19207 18319 17941 16631 -Lab 4 19236 18208 17963 16487 19168 18307 17696 16234 -Average 19251 18251 18021 16619 19187 18313 17818 16432
39
Table B1 Summary Data for FACE Gasoline Blends with Ethanol
Specific Tests FACE Gasoline Blend C H Target Ethanol Content (Vol ) 0 10 15 30 0 10 15 30 Ethanol Content (Vol) (ASTM D5599) 0 1018 1462 2949 0 1016 1459 3034 Research Octane Number (RON) (ASTM D2699) -Lab 1 850 918 951 1012 870 919 941 993 -Lab 2 840 920 950 1014 869 927 941 996 -Lab 3 840 917 946 1019 869 920 937 995 -Lab 4 914 945 1015 916 946 991 -Average 843 917 948 1015 869 921 941 994 Motor Octane Number (MON) (ASTM D2700) -Lab 1 830 876 893 921 797 821 835 861 -Lab 2 830 868 880 924 793 820 831 885 -Lab 3 829 876 887 909 799 817 829 858 -Lab 4 881 890 914 828 839 877 -Average 830 875 888 916 796 822 833 870 Sensitivity (RON-MON) -Lab 1 20 42 58 91 73 98 106 132 -Lab 2 10 52 70 90 76 107 110 111 -Lab 3 11 41 59 110 70 103 108 137 -Lab 4 33 55 101 88 107 114 -(RON)avg ndash (MON)avg 13 42 60 99 73 99 108 124 API Gravity (API˚) (ASTM D4052) -Lab 1 732 7069 6943 6523 5481 5416 5375 5247 -Lab 4 707 693 652 544 538 527 -Average 732 707 694 652 548 543 5377 526 Density (ASTM D4052) -Lab 1 06906 06991 07035 07186 07587 07614 07631 07684 -Lab 4 06997 07043 07192 07610 07636 07678 -Average 06994 07039 07189 07587 07612 07633 07681 RVP (psi) (D5191) Lab 1 75 86 85 83 76 88 87 84 Net Heat of Combustion (BTUlb) (ASTM D4809) 19186 18198 17955 16692 16265 Net Heat of Combustion (BTUlb) (ASTM D240) -Lab 1 19257 18375 18012 16739 18675 17891 17550 16369 -Lab 4 18576 17809 17408 16322 -Average 19257 18375 18012 16739 18625 17850 17479 16345
40
Table B1 Summary Data for FACE Gasoline Blends with Ethanol
Specific Tests FACE Gasoline Blend A B Target Ethanol Content 0 10 15 30 0 10 15 30 Ethanol Content (Vol) -ASTM D5599 0 1012 1469 2990 0 995 1473 3016 -Detailed Hydrocarbon Analysis - GCFID -Lab 1 0 1000 1463 3017 0 1001 1476 3014 Elemental Analysis (ASTM D 5291) -Carbon (wt) -Lab 1 8443 8178 7941 7306 8465 8172 8029 7346 -Lab 4 8433 8085 7823 7361 8471 8110 7921 7380 -Average 8438 8131 7882 7333 8468 8141 7975 7363 -Hydrogen (wt) -Lab 1 1543 1527 1484 1446 1473 1462 1442 1387 -Lab 4 1606 1573 1548 1515 1561 1540 1525 1487 -Average 1575 1550 1516 1481 1517 1501 1483 1437 -Oxygen (wt) (ASTM D5599) Lab 4 0 400 578 1150 0 389 571 1147
Specific Tests FACE Gasoline Blend C H Target Ethanol Content 0 10 15 30 0 10 15 30 Ethanol Content (Vol) -ASTM D5599 0 1018 1462 2949 0 1016 1459 3034 -Detailed Hydrocarbon Analysis - GCFID -Lab 1 0 1027 1483 2988 0 1021 1468 3040 Elemental Analysis (ASTM D 5291) -Carbon (wt) -Lab 1 8447 8200 7998 7336 8768 8402 8401 7624 -Lab 4 8419 8077 7909 7353 8720 8316 8150 7626 -Average 8433 8138 7954 7345 8744 8359 8276 7625 -Hydrogen (wt) -Lab 1 1494 1465 1465 1405 1205 1199 1207 1218 -Lab 4 1585 1668 1523 1509 1300 1305 1292 1316 -Average 1540 1567 1494 1457 1253 1252 1250 1267 -Oxygen (wt) (ASTM D5599) Lab 4 0 401 572 1129 0 368 527 1088
Table B1 Summary Data for FACE Gasoline Blends with Ethanol
41
Specific Tests FACE Gasoline Blend A B Target Ethanol Content 0 10 15 30 0 10 15 30 Distillation (˚F) (ASTM D86) Lab 1 IBP 90 106 99 99 97 105 103 101 5 122 127 122 126 133 128 126 129 10 140 134 131 135 149 135 134 138 20 165 145 144 146 175 147 146 149 30 186 153 152 153 196 155 154 155 40 198 159 156 156 209 165 159 159 50 204 202 159 158 214 211 165 161 60 207 208 204 159 218 217 214 162 70 210 211 210 160 221 219 219 163 80 213 214 213 161 226 225 224 165 90 219 222 219 211 236 234 234 230 95 228 233 229 224 248 247 246 242 FBP 262 261 263 260 280 271 270 266
Specific Tests FACE Gasoline Blend C H Target Ethanol Content 0 10 15 30 0 10 15 30 Distillation (˚F) (ASTM D86) Lab 1 IBP 93 104 102 107 98 96 105 106 5 126 126 123 130 127 123 125 127 10 139 131 131 136 143 132 134 138 20 157 140 140 145 170 145 147 152 30 174 147 147 151 194 153 156 159 40 188 153 153 156 213 167 161 163 50 201 183 157 159 229 217 182 166 60 210 208 176 161 243 236 235 169 70 218 217 215 162 263 255 253 175 80 227 226 223 165 291 283 282 268 90 245 244 241 233 329 322 323 312 95 274 274 269 261 357 351 351 343 FBP 330 331 322 324 408 401 407 396
42

6
7
3 ANALYTICAL RESULTS FOR FACE GASOLINES
In this section results of the analyses of the physical and chemical properties of the first commercial
batches of each of the FACE Gasolines are discussed Chevron Phillips 66 BP and a contract laboratory
conducted the analyses Also included are the data provided on the CPChem Certificates of Analyses
(COAs) Note that future production runs that would be required to remake fuels that sell out likely will
result in some changes to the fuel property values reported here for the first production run
31 ASTM TEST RESULTS FOR PHYSICAL PROPERTIES
ASTM methods were used to measure the RON MON API gravity density distillation profiles RVP and
net heats of combustion of all of the FACE Gasolines The results of these analyses are summarized in
the sections below and also listed in detail in Table A1 located in Appendix A
311 RON MON and Octane Sensitivity
The ignition qualities of gasolines are typically characterized by RON and MON values RON values were
measured in CFR engines per ASTM method D2699 (4) Although the measurements were conducted in
several labs the lab‐to‐lab reproducibility was very good so only the average values are reported here
(but individual values are reported in Table A1) Bar charts of the average RON values for each fuel are
presented in Figure 31 (middle bars) Also included are the original design targets (1st bars) and the
values reported on the CPChem Certificates of Analysis (COA) (3rd bars) For most fuels the 3 values are
very close to each other (within plusmn1 unit of each other) The largest differences between measured and
target values are for fuels E H and J where the measured values are about 24‐38 units higher Fuel J is
also noteworthy because the value measured (1 lab only) is 2 units higher than the CPChem COA
Figure 31 RON Values of FACE Gasolines
850
950
850
950
850
950 950
850
700 700
839
958
843
942
874
940
965
869
700
738
835
960
847
932
875
944
968
869
703718
600
650
700
750
800
850
900
950
1000
A B C D E F G H I J
RON
Fuel
RON
Target
AVG
CPChem
8
MON values were measured in CFR engines per ASTM method D2700 (5) Although the measurements
were conducted in several labs the lab‐to‐lab reproducibility was very good so only the average values
are reported here (but individual values are reported in Table A1) Bar charts of the target measured
and CPChem COA MON values for each fuel are presented in Figure 32 The ldquotargetrdquo MON values were
determined by subtracting the target octane sensitivities from the target RON values The largest
difference between the values in this project and those reported on CPChemrsquos COA is 13 for fuel J The
largest differences between the measured and target values are for fuels D E F and H For Gasolines E
F and H the measured values are about 3‐6 units higher than target while for gasoline D the measured
values are about 6 units lower than the target
Figure 32 MON Values of FACE Gasolines
830
930
830
930
750
850 850
750
680 680
835
924
830
870
811
881
858
796
695 701
836
926
836
878
815
888
858
793
696
688
600
650
700
750
800
850
900
950
1000
A B C D E F G H I J
MON
Fuel
MON
Target
AVG
CPChem
9
Octane Sensitivity (S=RON‐MON) values are presented in the bar charts in Figure 33 The average sensitivities measured by the labs in this project are very close to those reported in CPChemrsquos COAs with the exception of Gasoline D The measured values for the three of the four high sensitivity fuels are quite a bit lower than the target value of 10 in the range of 59‐71 The exception is Gasoline G which comes close to meeting the target value Of the six low sensitivity fuels three (Gasolines A C and I) have values that meet the target value of le2 two have values that are slightly higher (Gasolines B and J) and one (Gasoline D) has a value that is significantly higher and in the range of the high sensitivity gasolines This discrepancy with Gasoline D is not surprising since it is very difficult to produce a low sensitivity fuel with a high level of aromatics which typically have high sensitivities Thus relative to the other manufactured FACE Gasolines Gasoline D should be considered a ldquohighrdquo sensitivity fuel
Figure 33 Octane Sensitivity Values of FACE Gasolines
312 Distillation Characteristics
The distillation properties of the fuels were determined by ASTM D86 (6) The D86 values obtained in
this study were very close to those reported on CPChemrsquos COAs The average of those two sources are
plotted in Figure 34 The values are also tabulated in Table A1 The temperature corresponding to a
given recovery fraction X is designated as TX (ie T90 indicates the temperature at which 90 of the
fuel has been vaporized and recovered) The initial boiling points (IBP) of all of the fuels are in a
relatively narrow range of 90‐110˚F In contrast the end boiling points (EBP) range from 253‐410˚F
Gasolines E G and H which are three of the four high sensitivity fuels have the highest EBPs Gasoline
E has a relatively steep increase in temperature of 140˚F from T90‐EBP Gasolines I and A the two fuels
having low sensitivity aromatics and n‐paraffin and low‐mid RON have the lowest EBPs Gasoline I
also has a relatively flat distillation profile from T30‐T90
100 100 100 100
04
34
13
72
63
59
107
71
05
3734
11
54
60
56
110
76
07
30
00
10
20
30
40
50
60
70
80
90
100
110
A B C D E F G H I J
Octan
e Sensitivity
Fuel
Octane Sensitivity
Target
AVG
CPChem
le2le2 le2 le2 le2 le2
‐01
10
Figure 34 ASTM D86 Distillation Curves for the FACE Gasolines
313 Reid Vapor Pressure (RVP)
The RVPs were determined using ASTM method D5191 (7) The values measured in this project were in
excellent agreement with those reported by CPChem COAs (within 01 psi) The averages of both values
are depicted in the bar charts in Figure 35 The values range from 67 to 805 psi
Figure 35 Reid Vapor Pressures of FACE Gasolines
500
1000
1500
2000
2500
3000
3500
4000
4500
0 10 20 30 40 50 60 70 80 90 100
Tempe
rature (˚ F)
Volume Distilled
D86 Distillation ‐ FACE Gasolines
A
B
C
D
E
F
G
H
I
J
805
735 745
680 670
780
725
755 760 750
0
1
2
3
4
5
6
7
8
9
A B C D E F G H I J
Reid Vap
or Pressure (p
si)
FACE Gasoline
Reid Vapor Pressure (RVP) ‐ FACE Gasolines
11
314 API Gravity and Density
The API gravities and densities of the fuels were measured using ASTM method D4052 (8) The
agreement between the values measured in this project and the values reported in the CPChem COAs
The individual values are listed in the Summary Table A1 in Appendix A The average of both values are
plotted in the bar charts in Figures 36 and 37 for API Gravity and density respectively As expected the
FACE Gasolines (D G H and J) having the highest aromatics content have the lowest API Gravities and
highest densities
Figure 36 API Gravities of FACE Gasolines
Figure 37 Densities of FACE Gasolines
7495
7135
7330
5870
6360
6860
54555580
7440
5910
0
5
10
15
20
25
30
35
40
45
50
55
60
65
70
75
80
A B C D E F G H I J
API G
ravity
FACE Gasoline
API Gravity ‐ FACE Gasolines
0685
0697
0691
0743
0725
0707
0760
0755
0697
0742
0645
065
0655
066
0665
067
0675
068
0685
069
0695
07
0705
071
0715
072
0725
073
0735
074
0745
075
0755
076
0765
077
A B C D E F G H I J
Density
(gml)
FACE Gasoline
Density ‐ FACE Gasolines
12
315 Net Heat of Combustion (NHC)
Net Heats of Combustion were measured using ASTM method D240 (9) The values are depicted in the
bar charts in Figure 38 In addition for two of the FACE Gasolines (C and J) the values were also
measured using ASTM method D4809 (10) The D4809 values were very close to those obtained from
method D240 (within 100 BTUlb) TheD240 values range from 18602 to 19251 BTUlb As expected
the FACE Gasolines having the highest aromatics content (D G H and J) have the lowest net heat of
combustion The FACE Gasolines having saturates content gt90 (A B C and I) have the highest net
heat of combustion
Figure 38 ASTM D240 Net Heats of Combustion of FACE Gasolines
19251
19187
19257
18649
18884
19072
1860218625
19225
18731
18200
18400
18600
18800
19000
19200
19400
A B C D E F G H I J
Net Heat o
f Com
bustion (BTU
lb) (A
STM D240)
FACE Gasoline
Net Heat of Combustion ‐ FACE Gasolines
13
32 CHEMICAL PROPERTIES OF FACE GASOLINES
The various types of hydrocarbons in the fuels were characterized by several techniques including
supercritical fluid chromatography (SFC) and detailed hydrocarbon analysis (DHA) by gas
chromatography using a flame ionization detector (GC‐FID) In addition the carbon hydrogen and
sulfur contents were measured Results are reported in the following sections
321 Aromatics by Supercritical Fluid Chromatography (SFC)
The SFC method of ASTM D5186 (11) separates the hydrocarbons into three fractions monoaromatics
polyaromatics and non‐aromatics and characterizes the composition in terms of mass Bar graphs of
the results are presented in Figure 39 Samples of FACE Gasolines B D E G and H were analyzed by
two labs The results from the two labs were very close to each other and so the averages are depicted
in the figure FACE Gasolines A B C and I have nonromatics levels gt90 wt FACE Gasolines D G and
H have the highest amounts of monoaromatics with values ranging from 394‐420 wt FACE
Gasolines E G and H appear to have about 1 wt polyaromatics
Figure 39 Compositions of FACE Gasolines by Supercritical Fluid Chromatography (ASTM D5186)
070 790 600
4175
14001000
39404200
040
3870
015
100
110125
030
9930
9210 9400
5810
85009000
59505675
9960
6100
0
10
20
30
40
50
60
70
80
90
100
A B C D E F G H I J
Composition (Wt )
FACE GASOLINE
SFC Composition ‐ FACE Gasolines
MonoAromatics PolyAromatics NonAromatics
14
322 Hydrocarbons by Detailed Hydrocarbon Analysis (DHA)
Detailed Hydrocarbon Analyses were performed by two labs using gas chromatography with flame
ionization detectors (GC‐FID) This technique enables the determination of concentration on a species‐
by‐species basis provided that retention factors have been determined for each species in the fuel The
results from both labs were very close to each other Bubble charts of the average concentration values
(in volume ) are depicted in Figure 310 for the low sensitivity fuels and Figure 311 for the high
sensitivity fuels on a carbon number basis for the five hydrocarbon classes n‐paraffins iso‐paraffins
naphthenes aromatics and olefins
In general the low sensitivity FACE Gasolines are characterized by large amounts of low sensitivity
components such as n‐paraffins and iso‐paraffins The high sensitivity FACE Gasolines contain more high
sensitivity components such as olefins and naphthenes than the low sensitivity fuels
The total concentration of components within each of the five hydrocarbon classes were added and the
sums are reported in the bar charts in Figure 312 The n‐paraffin levels range from 225‐316 vol for
the four FACE Gasolines (C D H and J) that had targets of 25 vol For the other FACE Gasolines that
had a target level of 5 vol the n‐paraffins levels range from 44‐117 vol The aromatics levels range
from 317‐358 vol for the four FACE Gasolines (D G H and J) that had targets of 35 vol For the
other six FACE Gasolines that had a target level of 5 vol the aromatics levels range from 0‐109 vol
The C7 aromatic is toluene the C8 aromatics consist of a mix of ethylbenzene and the xylene isomers
the C9 aromatics consist of a mix of trimethylbenzenes and methylethylbenzenes and the C10 aromatics
consist of a mix of tetramethylbenzenes dimethylethylbenzenes and methylpropylbenzenes FACE
Gasoline E a high sensitivity fuel has a naphthene content of 208 vol mainly cyclopentane and
cyclohexane Three other high sensitivity fuels (F G and H) have naphthenes concentrations of about
11 vol mainly cyclopentane Those high sensitivity fuels also have the highest olefins content with
concentrations ranging from 68‐127 vol FACE Gasoline I also has 64 vol olefins The C6 olefin is
1‐hexene The C5 olefins consist of a mix of 2‐pentene and methyl butenes In contrast to the high
sensitivity fuels Gasoline D which was designed to be low sensitivity but ended up in the high
sensitivity range has essentially no naphthenes or olefins Its high sensitivity is derived from its high
aromatics content
The C5 isoparaffin in all of the fuels is 2‐methylbutane The C6 isoparaffins consist of a mix of 2‐ and 3‐
methyl pentanes and 23 dimethyl butane The C7 isoparaffins in most of the FACE Gasolines consist of a
mix of 2‐ and 3‐methyl hexanes and 23‐ and 24‐dimethylpentanes The C8 isoparaffins are
predominantly trimethylpentanes with more than 50 of those being isooctane (224
trimethylpentane) The other isomers are mainly 24‐ and 25 dimethylhexanes and 2‐methyl 3‐ethyl
pentane
15
Figure 310 Detailed Hydrocarbon Analyses of Low Sensitivity FACE Gasolines
122 44 219 451 11
48 65
065
3 4 5 6 7 8 9 10 11
Carbon Number
FACE Gasoline A ‐ Detailed Hydrocarbon Analysis (vol)
isoparaffins
n‐paraffins
cycloparaffins
aromatics
olefins
104 13 137 587 16
59
39 37
3 4 5 6 7 8 9 10 11
Carbon Number
FACE Gasoline B ‐ Detailed Hydrocarbon Analysis (vol)
isoparaffins
cycloparaffins
aromatics
olefins
n‐paraffins
64 27 117 468 20 075
30 06
31 118 100
3 4 5 6 7 8 9 10 11
Carbon Number
FACE Gasoline C ‐ Detailed Hydrocarbon Analysis (vol)
isoparaffins
cycloparaffins
aromatics
olefins
n‐paraffins
12 410
99 35 150 46
47 114 70
3 4 5 6 7 8 9 10 11
Carbon Number
FACE Gasoline D ‐ Detailed Hydrocarbon Analysis (vol)
isoparaffins
cycloparaffins
aromatics
olefins
n‐paraffins
41 34 99 321 236 11
07 135
24
11
59
3 4 5 6 7 8 9 10 11
Carbon Number
FACE Gasoline I ‐ Detailed Hydrocarbon Analysis (vol)
isoparaffins
n‐paraffins
cycloparaffins
aromatics
olefins
327
90 124 95
22
14 131 145 29
06
3 4 5 6 7 8 9 10 11
Carbon Number
FACE Gasoline J ‐ Detailed Hydrocarbon Analysis (vol)
isoparaffins
n‐paraffins
cycloparaffins
aromatics
olefins
16
Figure 311 Detailed Hydrocarbon Analyses of High Sensitivity FACE Gasolines
64 68 143 165 18 07
70 105 19 10 04
46 17 18 16 08
21 82 09
29 06 37
3 4 5 6 7 8 9 10 11
Carbon Number
FACE Gasoline E ‐ Detailed Hydrocarbon Analysis (vol)
isoparaffins
cycloparaffins
aromatics
olefins
n‐paraffins
82 64 134 378 14
21 21
100
76
89
3 4 5 6 7 8 9 10 11
Carbon Number
FACE Gasoline F ‐ Detailed Hydrocarbon Analysis (vol)
isoparaffins
n‐paraffins
cycloparaffins
aromatics
olefins
65 66 72 152 16 10
74 09 16 10
15 33 218 54 14
36 25 10
37 07 10
3 4 5 6 7 8 9 10 11
Carbon Number
FACE Gasoline G ‐ Detailed Hydrocarbon Analysis (vol)
isoparaffins
cycloparaffins
aromatics
olefins
n‐paraffins
28 54 71 39 22 09
66 08 17 10
10 95 117 83 43 14
29 21 09
54 05 145 08
3 4 5 6 7 8 9 10 11
Carbon Number
FACE Gasoline H ‐ Detailed Hydrocarbon Analysis (vol)
isoparaffins
cycloparaffins
aromatics
olefins
n‐paraffins
17
Figure 312 Detailed Hydrocarbon Analyses Comparisons of FACE Gasolines
A comparison of the composition results from the DHA and SFC methods is presented in Figure 313 for
the low sensitivity fuels and Figure 314 for the high sensitivity fuels Also included are Fluorescent
Indicator Absorption (FIA ndash ASTM D1319 (12)) composition results reported on the CPChem COAs Since
the FIA method determines total saturates the DHA results for n‐paraffins iso‐paraffins and
naphthenes must be added together to enable the comparison between those two methods Similarly
since the SFC method directly measures aromatics and total non‐aromatics are determined by
difference the olefins amount must be added to the total saturate levels from FIA and DHA to enable
comparisons with the non‐aromatics values from SFC The appropriate comparison categories are
indicated by dashed lines in Figures 313 and 314 Of the three methods SFC generally gives the
highest level of aromatics and FIA the lowest The DHA aromatics values are closer to the FIA levels than
to the SFC levels The DHA olefins are fairly close to the FIA results
117
80
244 241
7944 67
225144
316
860
859
697
421
459
676
384
228
745336
16
01
01208
110
115105
33
23
13
127
94
8168
64
06
58 39
334
10977
336 358
12
317
0
10
20
30
40
50
60
70
80
90
100
A B C D E F G H I J
Composition ( vol)
FACE GASOLINE
DHA Composition ‐ FACE Gasolines
n‐paraffins isoparaffins naphthenes olefins aromatics
18
Figure 313 Comparison of Composition Methods FACE Low Sensitivity Gasolines
Figure 314 Comparison of Composition Methods FACE High Sensitivity Gasolines
117
80
244
144
316
860 859
697
745336
16
01 0433
23
13 64
06
58 3912
317
996951 975
929
712
04
07 04 62
10
42 21 09
278
993
921 940996
610
07
79 6004
390
0
10
20
30
40
50
60
70
80
90
100
DHA FIA SFC DHA FIA SFC DHA FIA SFC DHA FIA SFC DHA FIA SFC
Composition ( )
FACE GASOLINE
Composition ‐ Low Sensitivity FACE Gasolines
n‐paraffins isoparaffins naphthenes olefins aromatics saturates nonaromatics
A B C I J
241
7944 67
225
421
459
676
384
228
01
208
110
115 105
127
94
81 68
334
10977
336 358
701
780
856
587 568
04
99
86
7879
295
12158
335 353
581
850900
595568
419
150100
405432
0
10
20
30
40
50
60
70
80
90
100
DHA FIA SFC DHA FIA SFC DHA FIA SFC DHA FIA SFC DHA FIA SFC
Composition ( )
FACE GASOLINE
Composition ‐ High Sensitivity FACE Gasolines
n‐paraffins isoparaffins naphthenes olefins aromatics saturates nonaromatics
D E F G H
19
323 Elemental Analyses
Carbon and hydrogen contents were measured by two labs using ASTM method D5291 (13) The
average results are presented in the bar graphs in figure 315 The carbon contents range from 8399‐
8748 wt and the hydrogen contents range from1252‐1601 wt As expected the FACE Gasolines
having the highest aromatics content (D G H and J) have the highest carbon and lowest hydrogen
contents
Figure 315 Carbon and Hydrogen Elemental Analyses of FACE Gasolines
8399 8443 8453 8646 8547 8496 8670 87488414 8624
1601 1557 1547 1354 1453 1504 1330 12521586 1376
0
10
20
30
40
50
60
70
80
90
100
A B C D E F G H I J
Compo
sition
(wt)
FACE Gasoline
Carbon‐Hydrogen Elemental Analyses
Hydrogen
Carbon
20
Sulfur content was measured by one lab ASTM method D5453 (14) The results displayed in the bar
charts in Figure 316 are essentially identical to the values reported on the CPChem COAs All FACE
Gasolines had ultra‐low sulfur levels FACE Gasolines E G and H had the highest levels at 21 22 and 15
ppm sulfur The other fuels had levels ranging from 2‐6 ppm
Figure 316 Sulfur Levels of FACE Gasolines
6
4 4
2
21
2
22
15
2 2
0
5
10
15
20
25
A B C D E F G H I J
Sulfur Content (p
pm)
FACE Gasoline
Sulfur Content ‐ FACE Gasolines
21
4 ANALYTICAL RESULTS FOR FACE GASOLINES BLENDED WITH ETHANOL
Although the FACE Gasolines were not formulated with ethanol the expectation is that some potential
users will be interested in testing the fuels with ethanol added To assist selection of fuels for those
studies four FACE Gasolines were selected for blending with levels of 10 15 and 30 vol ethanol The
fuels selected for this purpose were A B C and H The positions of these fuels in the design matrix are
shown below
In this section results of the analyses of the ethanol blends are discussed Chevron Phillips 66 BP and
a contract laboratory conducted the analyses As mentioned previously future production runs that are
required to remake fuels that sell out likely will results in some changes to the fuel property values
reported here
41 ASTM TEST RESULTS
ASTM methods were used to measure the ethanol content RON MON API gravity density distillation
profiles RVP and net heats of combustion of all of the ethanol blends made with the FACE Gasolines
The results of these analyses are summarized below and in Table A2 located in the Appendix
411 Ethanol Content
FACE Gasolines A B C and H were blended with nominally 10 15 and 30 vol ethanol The
concentration of ethanol in each blend were determined using ASTM method D5599 (15) (coupled with
ASTM D4052 density measurement) and by detailed hydrocarbon analysis using gas chromatography
with a flame ionization detector The results for both methods were in excellent agreement for all fuels
as shown below in Table 41
Table 41 Measured Ethanol Content of FACE Gasoline Blends
Ethanol Content (vol)
A B C H
10 15 30 10 15 30 10 15 30 10 15 30
D5599 101 147 299 100 147 302 102 146 295 102 146 303
DHA 100 146 301 100 148 301 103 148 299 102 147 304
22
412 RON MON and Octane Sensitivity
RON values were measured in CFR engines per ASTM method D2699 (4) Although the measurements
were conducted in four labs the lab‐to‐lab reproducibility was very good so only the average values are
reported here (but individual values are reported in Table A2) Average RON values for each fuel are
presented in Figure 41 For all four of these FACE Gasolines the RON values continue to increase even
at the 30 ethanol level although the rates of increase are lower than at lower ethanol levels FACE
Gasoline B has the highest RON at all ethanol levels with a value of about 106 at the 30 ethanol level
FACE Gasolines A and C have essentially the same RON values at all ethanol levels with RON values of
about 102 at the 30 ethanol level FACE Gasoline H without ethanol has a higher RON than A and C
but a lower RON at the 15 and 30 ethanol levels
Figure 41 RON Values of FACE Gasoline Blends with Ethanol
MON values were measured in CFR engines per ASTM method D2700 (5) Although the measurements were conducted in four labs the lab‐to‐lab reproducibility was very good so only the average values are reported here (but individual values are reported in Appendix A2) The MON values for each fuel are
presented in Figure 42 FACE Gasoline B has the highest MON values at all ethanol levels but unlike the other FACE Gasolines the MON value did not increase with ethanol contents above 10 vol The MON values for FACE Gasolines A and C were essentially the same and higher than those for FACE Gasoline H
80081082083084085086087088089090091092093094095096097098099010001010102010301040105010601070108010901100
0 5 10 15 20 25 30 35
RON
Ethanol (vol)
RON Values ‐ FACE Gasoline + Ethanol Blends
FACE A
FACE B
FACE H
FACE C
23
Figure 42 MON Values of FACE Gasoline Blends with Ethanol
Octane Sensitivity (S=RON‐MON) values are presented in Figure 43 As expected due to the relatively high sensitivity of ethanol the sensitivities of all four FACE Gasolines increase as the ethanol content increases FACE Gasoline H has the highest sensitivity at all ethanol levels except at 30 vol ethanol where the sensitivity of the FACE Gasoline B blend becomes slightly higher with values of 124 and 132 respectively The sensitivities for FACE Gasolines A and C are very similar to each other and although lower than the blends for the other FACE Gasolines have the highest rates of increase at the 30 level
Figure 43 Octane Sensitivities FACE Gasoline Blends with Ethanol
750
760
770
780
790
800
810
820
830
840
850
860
870
880
890
900
910
920
930
940
950
0 5 10 15 20 25 30 35
MON
Ethanol (vol)
MON Values ‐ FACE Gasoline + Ethanol Blends
FACE A
FACE B
FACE H
FACE C
00
10
20
30
40
50
60
70
80
90
100
110
120
130
140
0 5 10 15 20 25 30 35
S
Ethanol (vol)
Octane Sensitivity (S) ‐ FACE Gasoline + Ethanol Blends
FACE A
FACE B
FACE H
FACE C
24
413 Distillation Characteristics
The distillation properties of the fuels were determined by ASTM D86 (6) The values are plotted in
Figure 44 and tabulated in Table A2 in the Appendix The behavior and shapes of the curves are very
similar For a given gasoline all of the ethanol blends start at about the same IBP The blends
containing ethanol then follow the same curve which is lower than the base gasoline At a certain point
the ethanol blends then rise quickly to rejoin the distillation curve of the base gasoline The lower the
ethanol content of the blend the earlier (lower distilled volume ) the curve rejoins the base gasoline
curve
Figure 44 ASTM D86 Distillation Profiles for FACE Gasoline Blends with Ethanol
50
100
150
200
250
300
0 10 20 30 40 50 60 70 80 90 100
Temperature (˚ C)
Volume Distilled
D86 Distillation ‐ FACE A Gasoline + Ethanol Blends
0 EtOH
10 EtOH
15 EtOH
30 EtOH
50
100
150
200
250
300
0 10 20 30 40 50 60 70 80 90 100
Temperature (˚ C)
Volume Distilled
D86 Distillation ‐ FACE B Gasoline + Ethanol Blends
0 EtOH
10 EtOH
15 EtOH
30 EtOH
50
100
150
200
250
300
350
0 10 20 30 40 50 60 70 80 90 100
Temperature (˚ C)
Volume Distilled
D86 Distillation ‐ FACE C Gasoline + Ethanol Blends
0 EtOH
10 EtOH
15 EtOH
30 EtOH
50
100
150
200
250
300
350
400
450
0 10 20 30 40 50 60 70 80 90 100
Temperature (˚ C)
Volume Distilled
D86 Distillation ‐ FACE H Gasoline + Ethanol Blends
0 EtOH
10 EtOH
15 EtOH
30 EtOH
25
414 Reid Vapor Pressure (RVP)
The RVPs were determined using ASTM method D5191 (7) The values are plotted in Figure 45 For all
fuels the RVP appears to peak between 10 and 15 vol ethanol and then starts to decrease as the
ethanol content increases further
Figure 45 Reid Vapor Pressures for FACE Gasoline Blends with Ethanol
415 API Gravity and Density
The API gravities and densities of the fuels were measured by two labs using ASTM method D4052 (8) The values from the two labs were in excellent agreement and are listed in Table A2 The average density values are presented in Figure 46 For all of the FACE Gasolines the density increased as the ethanol content increased
Figure 46 Densities of FACE Gasoline Blends with Ethanol
7
75
8
85
9
95
10
0 5 10 15 20 25 30 35
RVP (psi)
Ethanol (vol)
Reid Vapor Pressure (RVP) ‐ FACE Gasoline + Ethanol Blends
FACE A
FACE B
FACE H
FACE C
0685 0697 0691
0759
0696 0705 0699
0761
0700 0710 0704
0763
0716 0724 0719
0768
0
01
02
03
04
05
06
07
08
09
1
A B C H
Density
(gm
l)
Ethanol (vol)
Density ‐ FACE Gasoline Blends with Ethanol
0
10
15
30
26
416 Net Heat of Combustion (NHC)
Net Heats of Combustion were measured by 2 labs using ASTM method D240 (9) For some fuels ASTM
method D4809 (10) was also used The values from both labs and both methods were very close to each
other and the average values are plotted in Figure 47 As expected since the net heat of combustion of
ethanol is lower than that of gasoline for all FACE Gasolines the net heat of combustion decreased as
ethanol content increased The decrease appeared to be linear with ethanol content The decrease
appeared to be steepest for FACE Gasoline B
Figure 47 Net Heat of Combustion of FACE Gasoline Blends with Ethanol
16000
16250
16500
16750
17000
17250
17500
17750
18000
18250
18500
18750
19000
19250
19500
0 5 10 15 20 25 30 35
Net Heat of C
ombustion (B
TUlb)
Ethanol (vol)
Net Heat of Combustion ‐ FACE Gasoline + Ethanol Blends
FACE A
FACE B
FACE H
FACE C
27
5 SUMMARY AND CONCLUSIONS
A subteam of the CRC AVFL FACE Working Group has designed a matrix of reference gasolines
known as the FACE Gasolines A commercial vendor has produced and made the fuels available
for purchase in research quantities It is expected that this will enable consistent comparisons
of engine and combustion results from different laboratories and test platforms based on the
use of the same set of fuels
The matrix is designed around four parameters expected to be of importance for advanced
gasoline engines RON octane sensitivity aromatics content and n‐paraffins content
Statistical methods were used to identify potential candidate formulations and down‐select to a
tractable number of 10 formulations
Detailed analyses were performed on the physical and chemical properties of the final fuel
formulations
Generally the property values measured in the current study agreed very well with the values
reported on the fuel blender (ChevronPhillips Chemical Company ‐ CPChem) Certificates of
Analyses (COAs)
As expected conflicts in the target properties for some of the fuels (such as high aromatics level
coupled with low octane sensitivity) led to some trade‐offs that resulted in some deviation in
the actual properties from the design properties
The RON values come close to meeting the targets for most of the fuels Fuels E H and J have
values that are 24‐38 units higher than the targets
Three of the four ldquohighrdquo sensitivity fuels have measured values of 59‐71 that are lower than
the target value of 10 Two of the ldquolowrdquo sensitivity fuels have measured values (34‐37) that are
a bit higher than the target value of le2 One of the low sensitivity design fuels (ldquoDrdquo) has a value
of 72 that actually effectively makes it a high sensitivity fuel
Detailed hydrocarbon analyses (DHA) indicate that the n‐paraffins contents range from 225‐
316 vol for the four FACE Gasolines that had targets of 25 vol and from 44‐117 vol for
the six FACE Gasolines that had targets of 5 vol
DHAs indicate that the aromatics contents range from 317‐358 vol for the four FACE
Gasolines that had a target of 35 vol and 0‐109 vol for the other fuels that had a target of 5
vol
The high sensitivity fuels contained the high sensitivity components of naphthenes (105‐208
vol) and olefins (68‐127 vol) The exception was Gasoline ldquoDrdquo which had neither of these
components but whose high sensitivity was derived from aromatics components
Five of the FACE Gasolines (ldquoArdquo ldquoBrdquo ldquoCrdquo ldquoFrdquo and ldquoIrdquo) are very rich in isoparaffins with contents ge
676 vol
Aromatics values determined by SFC were generally higher than the values obtained from DHA
The DHA olefins values were close to the FIA values reported on the CPChem COAs
The fuels having the highest aromatics content also have the highest densities and highest net
heats of combustion on an energy content per volume basis
With regards to distillation properties for all fuels the initial boiling points (IBPs) are in a
narrow range of 90‐110˚F although the end boiling points (EBPs) range from 253‐410˚F Three
28
of the high sensitivity fuels have the highest EBPs The two low‐mid RON fuels having low n‐
paraffins and low aromatics have the lowest EBPs
All of the FACE Gasolines have ultra‐low levels of sulfur with the highest value at 22 ppm S and
most fuels having le 6 ppm S
For the four FACE Gasolines blended with ethanol RON continues to increase as the ethanol
levels increase to 30 vol although the rate of increase is lower as the ethanol content
increases FACE Gasoline B which has the highest RON of 96 has the highest RON at all ethanol
levels with a value of about 106 at 30 ethanol At the same ethanol level FACE Gasolines A
and C have essentially the same RON values FACE Gasoline H starts with a higher RON value
than those of A or C but has a lower value at blend levels of 15 and 30 vol
MON increased as the ethanol level increased for FACE Gasolines A C and H The MON values
for these fuels were essentially constant even though the highest MON values were found for
the ethanol blends with FACE Gasoline B
For all blends octane sensitivity increased as ethanol content increased with the highest values
of 12‐13 for 30 vol ethanol blends with FACE Gasolines B and H
The D86 distillation curve trends are similar for the four FACE Gasolines For a given gasoline all
blends start at the same point At around 10 vol distilled the curves for the blends with
ethanol diverge from and are lower than the curves for the base gasolines At a certain point
the distillation curves for the blends rise quickly and re‐join the curve for the parent base fuel
The distillation curves for the 30 vol ethanol blends are generally flat as a function of
increasing vol distilled and only start to increase again at about 70‐80 vol distilled when
most of the ethanol has been distilled from the liquid
The Reid Vapor Pressures (RVPs) peak at about 10‐15 vol
Densities increase slightly as ethanol increases while net heats of combustion decrease
29
6 REFERENCES
1 Alnajjar M Cannella B Dettman H Fairbridge C Franz J Gallant T Gieleciak R Hager D Lay C Lewis S Ratcliff M Sluder S Storey J Yin H Zigler B ldquoChemical and Physical Properties of the Fuels for Advanced Combustion Engines (FACE) Research Diesel Fuelsrdquo CRC Report No FACE‐1 (2010)
2 Gallant T Franz J Alnajjar M Storey J Lewis S Sluder S Cannella W Fairbridge C Hager D Dettman H Luecke J Ratcliff M Zigler ldquoFuels for Advanced Combustion Engines Research Diesel Fuels Analysis of Physical and Chemical Propertiesrdquo SAE Paper 2009‐01‐2769 (2009)
3 CannellaW Fairbridge C Arboleda P Bays T Dettman H Foster M Gieleciak R Gunter G Hager D Lay C Lewis S Luecke J Sluder S Zigler B ldquoDetailed Characterization of the Physical and Chemical Properties of the Reformulated FACE Diesel Fuels FD2B FD4B and FD7Brdquo CRC Report AVFL‐19‐1 (2013)
4 ASTM International Standard Test Method for Research Octane Number of Spark‐Ignition Engine Fuel ASTM D2699 (ASTM International Pennsylvania 2009)
5 ASTM International Standard Test Method for Motor Octane Number of Spark‐Ignition Engine Fuel ASTM D2700 (ASTM International Pennsylvania 2009)
6 ASTM International Standard Test Method for Distillation of Petroleum Products at Atmospheric Pressure ASTM D86‐09e1 (ASTM International Pennsylvania 2009)
7 ASTM International Standard Test Method for Vapor Pressure of Petroleum Products (Mini‐Method) ASTM D5191 (ASTM International Pennsylvania 2009)
8 ASTM International Standard Test Method for Density and Relative Density of Liquids by Digital Density Meter ASTM D4052‐96(2002)e1 (ASTM International Pennsylvania 2002)
9 ASTM International Standard Test Method for Heat of Combustion of Liquid Hydrocarbon Fuels by Bomb Calorimeter ASTM D240‐02(2007) (ASTM International Pennsylvania 2007)
10 ASTM International Standard Test Method for Heat of Combustion of Liquid Hydrocarbon Fuels by Bomb Calorimeter ASTM D4809 (2007) (ASTM International Pennsylvania 2007)
11 ASTM International Standard Test Method for Determination of Aromatic Content and Polynuclear Aromatic Content of Diesel Fuels and Aviation Turbine Fuels by Supercritical Fluid Chromatography ASTM D5186‐03(2009) (ASTM International Pennsylvania 2009)
12 ASTM International Standard Test Method for Hydrocarbon Types in Liquid Petroleum Products by Fluorescent Indicator Adsorption ASTM D1319‐08 (ASTM International Pennsylvania 2008)
13 ASTM International Standard Test Methods for Instrumental Determination of Carbon Hydrogen and Nitrogen in Petroleum Products and Lubricants ASTM D5291‐02(2007) (ASTM International Pennsylvania 2007)
14 ASTM International Standard Test Methods for Determination of Total Sulfur in Light Hydrocarbons Spark‐Ignition Engine Fuel Diesel Engine Fuel and Engine Oil by Ultraviolet Fluorescence ASTM D5453(2007) (ASTM International Pennsylvania 2007)
15 ASTM International Standard Test Methods for Determination of Oxygenates in Gasoline by Gas Chromatography and Oxygen Selective Flame Ionization Detection ASTM D5599 (2007) (ASTM International Pennsylvania 2007)
30
31
Appendix A
Properties of FACE Gasolines
32
Table A1 Summary Data for FACE Gasolines
Specific Tests FACE Gasoline A B C D E F G H I J Research Octane Number (RON) (ASTM D2699) -Lab 1 843 958 850 946 871 940 969 870 700 738 -Lab 2 839 960 840 939 877 960 869 -Lab 3 835 957 840 -Average 839 958 843 942 874 940 965 869 7015 738 -CPChem COA 835 960 847 932 875 944 968 869 703 718 Motor Octane Number (MON) (ASTM D2700) -Lab 1 836 923 830 872 813 881 857 797 695 701 -Lab 2 833 931 830 868 808 860 799 -Lab 3 835 919 829 -Average 835 924 830 870 811 881 858 798 695 701 -CPChem COA 836 926 836 878 815 888 858 793 696 688 Sensitivity (RON-MON) -Lab 1 07 35 20 74 58 59 112 73 05 37 -Lab 2 06 29 10 71 69 100 70 -Lab 3 0 38 11 -Average 04 34 13 72 63 59 107 72 05 37 -CPChem COA -01 34 11 54 60 56 110 76 07 30 API Gravity (API˚) (ASTM D4052) -CPChem COA 750 714 734 587 636 686 545 568 744 595 -Lab 1 749 713 732 587 636 686 546 548 744 587 -Average 7495 7135 733 587 636 686 5455 558 744 591 Density (ASTM D4052) -CPChem COA 0691 0743 0725 0707 0760 0697 0741 -Lab 1 0685 0697 0691 0743 0725 0707 0760 0759 0697 0743 -Average 0685 0697 0691 0743 0725 0707 0760 0759 0697 0742 RVP (psi) (D5191) -CPChem COA 81 74 74 68 67 78 72 75 75 75 -Lab 1 80 73 75 73 76 77 Net Heat of Combustion (BTUlb) (ASTM D4809) 19186 18680 Net Heat of Combustion (BTUlb) (ASTM D240) 19251 19187 19257 18649 18884 19072 18602 18625 19225 18731
33
TableA1 Summary Data for FACE Gasolines
Specific Tests FACE Gasoline A B C D E F G H I J Distillation (˚F) (ASTM D86) -CPChem IBP 93 95 95 88 110 108 93 94 100 101
5 104 128 120 129 131 129 122 123 123 111 10 132 145 136 148 142 142 135 140 156 162 20 160 172 154 176 155 156 158 168 177 206 30 183 194 171 198 166 168 183 192 186 217 40 197 207 187 212 177 180 210 211 191 224 50 203 213 200 221 186 193 240 227 195 231 60 207 216 210 229 197 206 270 242 199 242 70 210 220 218 235 208 217 306 262 203 261 80 213 225 226 280 222 225 328 291 207 291 90 219 235 243 330 267 240 343 327 213 316 95 227 248 270 340 343 261 363 358 220 330 FBP 269 283 328 363 405 294 403 410 259 358
-Lab 1 IBP 90 97 93 97 107 102 99 98 99 95 5 122 133 126 133 134 134 122 127 139 111
10 140 149 139 151 143 144 136 143 160 166 20 165 175 157 179 156 157 158 170 178 209 30 186 196 174 200 168 169 182 194 187 219 40 198 209 188 214 177 182 209 213 192 225 50 204 214 201 224 188 195 238 229 196 232 60 207 218 210 234 197 207 268 243 200 242 70 210 221 218 248 208 218 304 263 204 263 80 213 226 227 288 224 228 328 291 208 292
90 219 236 245 331 258 243 343 329 213 316 95 228 248 274 341 329 261 358 357 220 330 FBP 262 280 330 365 402 291 405 408 247 357
-Average IBP 915 96 94 925 1085 105 96 96 995 98 5 113 1305 123 131 1325 1315 122 125 131 111
10 136 147 1375 1495 1425 143 1355 1415 158 164 20 1625 1735 1555 1775 1555 1565 158 169 1775 203 30 1845 195 1725 199 167 1685 1825 193 1865 218 40 1975 208 1875 213 177 181 2095 212 1915 2245 50 2035 2135 2005 2225 187 194 239 228 1955 2315 60 207 217 210 2315 197 2065 269 2425 1995 242 70 210 2205 218 2415 208 2175 305 2625 2035 262 80 213 2255 2265 284 223 2265 328 291 2075 2915
90 219 2355 244 3305 2625 2415 343 328 213 316 95 2275 248 272 3405 336 261 3605 3575 220 330 FBP 2655 2815 329 364 4035 2925 404 409 253 3575
34
Table A1 Summary Data for FACE Gasolines
Specific Tests FACE Gasoline A B C D E F G H I J Elemental Analysis (ASTM D 5291) -Carbon (wt) -Lab 1 8398 8441 8497 8647 8547 8671 8792 8415 -Lab 4 8400 8444 8419 8645 8547 8496 8669 8703 8414 8624 -Average 8399 8443 8458 8646 8547 8496 8670 8748 8414 8624 -Hydrogen (wt) -Lab 1 1602 1559 1503 1353 1453 1329 1208 1585 -Lab 4 1600 1556 1585 1355 1453 1504 1331 1297 1586 1376 -Average 1601 1557 1547 1354 1453 1504 1330 1252 1586 1376 Sulfur by UV Fluorescence (ppmw) (ASTM D5453) -CPChem COA 4 4 3 2 21 2 20 15 2 2 -Lab 4 6 4 4 2 21 2 22 15 2 2 Hydrocarbons by FIA (vol) (ASTM D1319) -Aromatics (vol) CPChem COA 0 42 21 295 121 58 335 353 09 278 -Olefins (vol) CPChem COA 04 07 04 04 99 86 78 79 62 10 -Saturates (vol) CPChem COA 996 951 975 701 780 856 587 568 929 712 Aromatics by SFC (ASTM D5186) (Lab 1) -MonoAromatics (wt) -Lab 1 07 78 60 414 142 100 393 412 04 387 -Lab 2 80 421 138 395 428 -Average 07 79 60 4175 140 100 394 420 04 387 -PolyAromatics (wt) -Lab 1 0 0 0 03 11 0 10 10 0 03 -Lab 2 0 0 09 12 15 -Average 0 0 0 015 10 0 11 125 0 03 -NonAromatics (wt) -Lab 1 993 922 940 583 847 900 597 578 996 610 -Lab 2 920 579 850 593 557 -Average 993 921 940 581 8475 900 595 5675 996 610
35
Table A1 Summary Data for FACE Gasolines
Specific Tests FACE Gasolines A B C D E F G H I J Detailed Hydrocarbon Analyses by GC-FID -n-paraffins (vol) (Targets) (5) (5) (25) (25) (5) (5) (5) (25) (5) (25) -Lab 1 1144 783 2409 2346 771 434 662 2214 1441 3115 -Lab 2 1187 815 2476 2473 803 446 685 2283 1437 3212 -Average 1165 799 2443 2410 787 440 673 2249 1439 3164 -iso-paraffins (vol) -Lab 1 8562 8591 688 4206 4563 6765 3821 2322 7449 3362 -Lab 2 8635 8586 7066 4221 4621 6747 3864 2240 7459 3366 -Average 8599 8688 6973 4213 4592 6756 3843 2281 7454 3364 -cyclo-paraffins (vol) -Lab 1 192 021 048 010 2216 1078 1163 1035 324 234 -Lab 2 130 007 023 010 1945 1118 1140 1066 336 224 -Average 161 014 036 010 2081 1098 1152 1050 330 229 -aromatics (vol) (Targets) (5) (5) (5) (35) (5) (5) (35) (35) (5) (35) -Lab 1 073 601 409 3425 1121 805 3419 3597 120 3212 -Lab 2 003 568 374 3258 1062 739 3306 3555 110 3125 -Average 38 584 392 3341 1092 772 3363 3576 115 3169 -olefins (vol) -Lab 1 024 001 248 004 1146 978 851 714 643 066 -Lab 2 018 003 006 005 1392 905 771 650 627 054 -Average 021 002 127 04 1269 942 811 682 635 060
36
37
Appendix B
Properties of FACE Gasoline Blends with Ethanol
38
Table B1 Summary Data for FACE Gasoline Blends with Ethanol
Specific Tests FACE Gasoline Blend A B Ethanol Content (Vol ) 0 10 15 30 0 10 15 30 Ethanol Content (Vol ) (ASTM D5599) 0 1012 1469 2990 0 995 1473 3016 Research Octane Number (RON) (ASTM D2699) -Lab 1 843 922 951 1032 958 1015 1039 1067 -Lab 2 839 923 951 1017 960 1008 1023 1050 -Lab 3 835 917 946 1025 957 1012 1031 1069 -Lab 4 916 945 1018 1009 1026 1053 -Average 839 920 948 1023 958 1011 1030 1060 Motor Octane Number (MON) (ASTM D2700) -Lab 1 836 878 890 912 923 936 936 934 -Lab 2 833 874 891 917 931 935 934 931 -Lab 3 835 881 893 911 919 933 934 933 -Lab 4 884 901 916 935 936 933 -Average 835 879 894 914 924 935 935 933 Sensitivity (RON-MON) -Lab 1 07 44 61 120 35 79 103 133 -Lab 2 06 49 60 100 29 73 89 119 -Lab 3 0 36 53 114 38 79 97 136 -Lab 4 32 44 102 74 91 120 -Average 04 41 54 109 34 76 95 127 API Gravity (API˚) (ASTM D4052) -Lab 1 749 7164 7066 661 7131 690 6772 6375 -Lab 4 716 706 660 690 676 638 -Average 749 7162 7063 6605 7131 690 6766 6377 Density (ASTM D4052) -Lab 1 06849 06959 06992 07154 0697 07050 07096 07240 -Lab 4 06966 06999 07161 07055 07106 07244 -Average 06849 06963 06996 07158 0697 07053 07101 07242 RVP (psi) (D5191) Lab 1 83 95 94 91 73 87 86 83 Net Heat of Combustion (BTUlb) (ASTM D4809) 18308 Net Heat of Combustion (BTUlb) (ASTM D240) -Lab 1 19266 18294 18080 16751 19207 18319 17941 16631 -Lab 4 19236 18208 17963 16487 19168 18307 17696 16234 -Average 19251 18251 18021 16619 19187 18313 17818 16432
39
Table B1 Summary Data for FACE Gasoline Blends with Ethanol
Specific Tests FACE Gasoline Blend C H Target Ethanol Content (Vol ) 0 10 15 30 0 10 15 30 Ethanol Content (Vol) (ASTM D5599) 0 1018 1462 2949 0 1016 1459 3034 Research Octane Number (RON) (ASTM D2699) -Lab 1 850 918 951 1012 870 919 941 993 -Lab 2 840 920 950 1014 869 927 941 996 -Lab 3 840 917 946 1019 869 920 937 995 -Lab 4 914 945 1015 916 946 991 -Average 843 917 948 1015 869 921 941 994 Motor Octane Number (MON) (ASTM D2700) -Lab 1 830 876 893 921 797 821 835 861 -Lab 2 830 868 880 924 793 820 831 885 -Lab 3 829 876 887 909 799 817 829 858 -Lab 4 881 890 914 828 839 877 -Average 830 875 888 916 796 822 833 870 Sensitivity (RON-MON) -Lab 1 20 42 58 91 73 98 106 132 -Lab 2 10 52 70 90 76 107 110 111 -Lab 3 11 41 59 110 70 103 108 137 -Lab 4 33 55 101 88 107 114 -(RON)avg ndash (MON)avg 13 42 60 99 73 99 108 124 API Gravity (API˚) (ASTM D4052) -Lab 1 732 7069 6943 6523 5481 5416 5375 5247 -Lab 4 707 693 652 544 538 527 -Average 732 707 694 652 548 543 5377 526 Density (ASTM D4052) -Lab 1 06906 06991 07035 07186 07587 07614 07631 07684 -Lab 4 06997 07043 07192 07610 07636 07678 -Average 06994 07039 07189 07587 07612 07633 07681 RVP (psi) (D5191) Lab 1 75 86 85 83 76 88 87 84 Net Heat of Combustion (BTUlb) (ASTM D4809) 19186 18198 17955 16692 16265 Net Heat of Combustion (BTUlb) (ASTM D240) -Lab 1 19257 18375 18012 16739 18675 17891 17550 16369 -Lab 4 18576 17809 17408 16322 -Average 19257 18375 18012 16739 18625 17850 17479 16345
40
Table B1 Summary Data for FACE Gasoline Blends with Ethanol
Specific Tests FACE Gasoline Blend A B Target Ethanol Content 0 10 15 30 0 10 15 30 Ethanol Content (Vol) -ASTM D5599 0 1012 1469 2990 0 995 1473 3016 -Detailed Hydrocarbon Analysis - GCFID -Lab 1 0 1000 1463 3017 0 1001 1476 3014 Elemental Analysis (ASTM D 5291) -Carbon (wt) -Lab 1 8443 8178 7941 7306 8465 8172 8029 7346 -Lab 4 8433 8085 7823 7361 8471 8110 7921 7380 -Average 8438 8131 7882 7333 8468 8141 7975 7363 -Hydrogen (wt) -Lab 1 1543 1527 1484 1446 1473 1462 1442 1387 -Lab 4 1606 1573 1548 1515 1561 1540 1525 1487 -Average 1575 1550 1516 1481 1517 1501 1483 1437 -Oxygen (wt) (ASTM D5599) Lab 4 0 400 578 1150 0 389 571 1147
Specific Tests FACE Gasoline Blend C H Target Ethanol Content 0 10 15 30 0 10 15 30 Ethanol Content (Vol) -ASTM D5599 0 1018 1462 2949 0 1016 1459 3034 -Detailed Hydrocarbon Analysis - GCFID -Lab 1 0 1027 1483 2988 0 1021 1468 3040 Elemental Analysis (ASTM D 5291) -Carbon (wt) -Lab 1 8447 8200 7998 7336 8768 8402 8401 7624 -Lab 4 8419 8077 7909 7353 8720 8316 8150 7626 -Average 8433 8138 7954 7345 8744 8359 8276 7625 -Hydrogen (wt) -Lab 1 1494 1465 1465 1405 1205 1199 1207 1218 -Lab 4 1585 1668 1523 1509 1300 1305 1292 1316 -Average 1540 1567 1494 1457 1253 1252 1250 1267 -Oxygen (wt) (ASTM D5599) Lab 4 0 401 572 1129 0 368 527 1088
Table B1 Summary Data for FACE Gasoline Blends with Ethanol
41
Specific Tests FACE Gasoline Blend A B Target Ethanol Content 0 10 15 30 0 10 15 30 Distillation (˚F) (ASTM D86) Lab 1 IBP 90 106 99 99 97 105 103 101 5 122 127 122 126 133 128 126 129 10 140 134 131 135 149 135 134 138 20 165 145 144 146 175 147 146 149 30 186 153 152 153 196 155 154 155 40 198 159 156 156 209 165 159 159 50 204 202 159 158 214 211 165 161 60 207 208 204 159 218 217 214 162 70 210 211 210 160 221 219 219 163 80 213 214 213 161 226 225 224 165 90 219 222 219 211 236 234 234 230 95 228 233 229 224 248 247 246 242 FBP 262 261 263 260 280 271 270 266
Specific Tests FACE Gasoline Blend C H Target Ethanol Content 0 10 15 30 0 10 15 30 Distillation (˚F) (ASTM D86) Lab 1 IBP 93 104 102 107 98 96 105 106 5 126 126 123 130 127 123 125 127 10 139 131 131 136 143 132 134 138 20 157 140 140 145 170 145 147 152 30 174 147 147 151 194 153 156 159 40 188 153 153 156 213 167 161 163 50 201 183 157 159 229 217 182 166 60 210 208 176 161 243 236 235 169 70 218 217 215 162 263 255 253 175 80 227 226 223 165 291 283 282 268 90 245 244 241 233 329 322 323 312 95 274 274 269 261 357 351 351 343 FBP 330 331 322 324 408 401 407 396
42

7
3 ANALYTICAL RESULTS FOR FACE GASOLINES
In this section results of the analyses of the physical and chemical properties of the first commercial
batches of each of the FACE Gasolines are discussed Chevron Phillips 66 BP and a contract laboratory
conducted the analyses Also included are the data provided on the CPChem Certificates of Analyses
(COAs) Note that future production runs that would be required to remake fuels that sell out likely will
result in some changes to the fuel property values reported here for the first production run
31 ASTM TEST RESULTS FOR PHYSICAL PROPERTIES
ASTM methods were used to measure the RON MON API gravity density distillation profiles RVP and
net heats of combustion of all of the FACE Gasolines The results of these analyses are summarized in
the sections below and also listed in detail in Table A1 located in Appendix A
311 RON MON and Octane Sensitivity
The ignition qualities of gasolines are typically characterized by RON and MON values RON values were
measured in CFR engines per ASTM method D2699 (4) Although the measurements were conducted in
several labs the lab‐to‐lab reproducibility was very good so only the average values are reported here
(but individual values are reported in Table A1) Bar charts of the average RON values for each fuel are
presented in Figure 31 (middle bars) Also included are the original design targets (1st bars) and the
values reported on the CPChem Certificates of Analysis (COA) (3rd bars) For most fuels the 3 values are
very close to each other (within plusmn1 unit of each other) The largest differences between measured and
target values are for fuels E H and J where the measured values are about 24‐38 units higher Fuel J is
also noteworthy because the value measured (1 lab only) is 2 units higher than the CPChem COA
Figure 31 RON Values of FACE Gasolines
850
950
850
950
850
950 950
850
700 700
839
958
843
942
874
940
965
869
700
738
835
960
847
932
875
944
968
869
703718
600
650
700
750
800
850
900
950
1000
A B C D E F G H I J
RON
Fuel
RON
Target
AVG
CPChem
8
MON values were measured in CFR engines per ASTM method D2700 (5) Although the measurements
were conducted in several labs the lab‐to‐lab reproducibility was very good so only the average values
are reported here (but individual values are reported in Table A1) Bar charts of the target measured
and CPChem COA MON values for each fuel are presented in Figure 32 The ldquotargetrdquo MON values were
determined by subtracting the target octane sensitivities from the target RON values The largest
difference between the values in this project and those reported on CPChemrsquos COA is 13 for fuel J The
largest differences between the measured and target values are for fuels D E F and H For Gasolines E
F and H the measured values are about 3‐6 units higher than target while for gasoline D the measured
values are about 6 units lower than the target
Figure 32 MON Values of FACE Gasolines
830
930
830
930
750
850 850
750
680 680
835
924
830
870
811
881
858
796
695 701
836
926
836
878
815
888
858
793
696
688
600
650
700
750
800
850
900
950
1000
A B C D E F G H I J
MON
Fuel
MON
Target
AVG
CPChem
9
Octane Sensitivity (S=RON‐MON) values are presented in the bar charts in Figure 33 The average sensitivities measured by the labs in this project are very close to those reported in CPChemrsquos COAs with the exception of Gasoline D The measured values for the three of the four high sensitivity fuels are quite a bit lower than the target value of 10 in the range of 59‐71 The exception is Gasoline G which comes close to meeting the target value Of the six low sensitivity fuels three (Gasolines A C and I) have values that meet the target value of le2 two have values that are slightly higher (Gasolines B and J) and one (Gasoline D) has a value that is significantly higher and in the range of the high sensitivity gasolines This discrepancy with Gasoline D is not surprising since it is very difficult to produce a low sensitivity fuel with a high level of aromatics which typically have high sensitivities Thus relative to the other manufactured FACE Gasolines Gasoline D should be considered a ldquohighrdquo sensitivity fuel
Figure 33 Octane Sensitivity Values of FACE Gasolines
312 Distillation Characteristics
The distillation properties of the fuels were determined by ASTM D86 (6) The D86 values obtained in
this study were very close to those reported on CPChemrsquos COAs The average of those two sources are
plotted in Figure 34 The values are also tabulated in Table A1 The temperature corresponding to a
given recovery fraction X is designated as TX (ie T90 indicates the temperature at which 90 of the
fuel has been vaporized and recovered) The initial boiling points (IBP) of all of the fuels are in a
relatively narrow range of 90‐110˚F In contrast the end boiling points (EBP) range from 253‐410˚F
Gasolines E G and H which are three of the four high sensitivity fuels have the highest EBPs Gasoline
E has a relatively steep increase in temperature of 140˚F from T90‐EBP Gasolines I and A the two fuels
having low sensitivity aromatics and n‐paraffin and low‐mid RON have the lowest EBPs Gasoline I
also has a relatively flat distillation profile from T30‐T90
100 100 100 100
04
34
13
72
63
59
107
71
05
3734
11
54
60
56
110
76
07
30
00
10
20
30
40
50
60
70
80
90
100
110
A B C D E F G H I J
Octan
e Sensitivity
Fuel
Octane Sensitivity
Target
AVG
CPChem
le2le2 le2 le2 le2 le2
‐01
10
Figure 34 ASTM D86 Distillation Curves for the FACE Gasolines
313 Reid Vapor Pressure (RVP)
The RVPs were determined using ASTM method D5191 (7) The values measured in this project were in
excellent agreement with those reported by CPChem COAs (within 01 psi) The averages of both values
are depicted in the bar charts in Figure 35 The values range from 67 to 805 psi
Figure 35 Reid Vapor Pressures of FACE Gasolines
500
1000
1500
2000
2500
3000
3500
4000
4500
0 10 20 30 40 50 60 70 80 90 100
Tempe
rature (˚ F)
Volume Distilled
D86 Distillation ‐ FACE Gasolines
A
B
C
D
E
F
G
H
I
J
805
735 745
680 670
780
725
755 760 750
0
1
2
3
4
5
6
7
8
9
A B C D E F G H I J
Reid Vap
or Pressure (p
si)
FACE Gasoline
Reid Vapor Pressure (RVP) ‐ FACE Gasolines
11
314 API Gravity and Density
The API gravities and densities of the fuels were measured using ASTM method D4052 (8) The
agreement between the values measured in this project and the values reported in the CPChem COAs
The individual values are listed in the Summary Table A1 in Appendix A The average of both values are
plotted in the bar charts in Figures 36 and 37 for API Gravity and density respectively As expected the
FACE Gasolines (D G H and J) having the highest aromatics content have the lowest API Gravities and
highest densities
Figure 36 API Gravities of FACE Gasolines
Figure 37 Densities of FACE Gasolines
7495
7135
7330
5870
6360
6860
54555580
7440
5910
0
5
10
15
20
25
30
35
40
45
50
55
60
65
70
75
80
A B C D E F G H I J
API G
ravity
FACE Gasoline
API Gravity ‐ FACE Gasolines
0685
0697
0691
0743
0725
0707
0760
0755
0697
0742
0645
065
0655
066
0665
067
0675
068
0685
069
0695
07
0705
071
0715
072
0725
073
0735
074
0745
075
0755
076
0765
077
A B C D E F G H I J
Density
(gml)
FACE Gasoline
Density ‐ FACE Gasolines
12
315 Net Heat of Combustion (NHC)
Net Heats of Combustion were measured using ASTM method D240 (9) The values are depicted in the
bar charts in Figure 38 In addition for two of the FACE Gasolines (C and J) the values were also
measured using ASTM method D4809 (10) The D4809 values were very close to those obtained from
method D240 (within 100 BTUlb) TheD240 values range from 18602 to 19251 BTUlb As expected
the FACE Gasolines having the highest aromatics content (D G H and J) have the lowest net heat of
combustion The FACE Gasolines having saturates content gt90 (A B C and I) have the highest net
heat of combustion
Figure 38 ASTM D240 Net Heats of Combustion of FACE Gasolines
19251
19187
19257
18649
18884
19072
1860218625
19225
18731
18200
18400
18600
18800
19000
19200
19400
A B C D E F G H I J
Net Heat o
f Com
bustion (BTU
lb) (A
STM D240)
FACE Gasoline
Net Heat of Combustion ‐ FACE Gasolines
13
32 CHEMICAL PROPERTIES OF FACE GASOLINES
The various types of hydrocarbons in the fuels were characterized by several techniques including
supercritical fluid chromatography (SFC) and detailed hydrocarbon analysis (DHA) by gas
chromatography using a flame ionization detector (GC‐FID) In addition the carbon hydrogen and
sulfur contents were measured Results are reported in the following sections
321 Aromatics by Supercritical Fluid Chromatography (SFC)
The SFC method of ASTM D5186 (11) separates the hydrocarbons into three fractions monoaromatics
polyaromatics and non‐aromatics and characterizes the composition in terms of mass Bar graphs of
the results are presented in Figure 39 Samples of FACE Gasolines B D E G and H were analyzed by
two labs The results from the two labs were very close to each other and so the averages are depicted
in the figure FACE Gasolines A B C and I have nonromatics levels gt90 wt FACE Gasolines D G and
H have the highest amounts of monoaromatics with values ranging from 394‐420 wt FACE
Gasolines E G and H appear to have about 1 wt polyaromatics
Figure 39 Compositions of FACE Gasolines by Supercritical Fluid Chromatography (ASTM D5186)
070 790 600
4175
14001000
39404200
040
3870
015
100
110125
030
9930
9210 9400
5810
85009000
59505675
9960
6100
0
10
20
30
40
50
60
70
80
90
100
A B C D E F G H I J
Composition (Wt )
FACE GASOLINE
SFC Composition ‐ FACE Gasolines
MonoAromatics PolyAromatics NonAromatics
14
322 Hydrocarbons by Detailed Hydrocarbon Analysis (DHA)
Detailed Hydrocarbon Analyses were performed by two labs using gas chromatography with flame
ionization detectors (GC‐FID) This technique enables the determination of concentration on a species‐
by‐species basis provided that retention factors have been determined for each species in the fuel The
results from both labs were very close to each other Bubble charts of the average concentration values
(in volume ) are depicted in Figure 310 for the low sensitivity fuels and Figure 311 for the high
sensitivity fuels on a carbon number basis for the five hydrocarbon classes n‐paraffins iso‐paraffins
naphthenes aromatics and olefins
In general the low sensitivity FACE Gasolines are characterized by large amounts of low sensitivity
components such as n‐paraffins and iso‐paraffins The high sensitivity FACE Gasolines contain more high
sensitivity components such as olefins and naphthenes than the low sensitivity fuels
The total concentration of components within each of the five hydrocarbon classes were added and the
sums are reported in the bar charts in Figure 312 The n‐paraffin levels range from 225‐316 vol for
the four FACE Gasolines (C D H and J) that had targets of 25 vol For the other FACE Gasolines that
had a target level of 5 vol the n‐paraffins levels range from 44‐117 vol The aromatics levels range
from 317‐358 vol for the four FACE Gasolines (D G H and J) that had targets of 35 vol For the
other six FACE Gasolines that had a target level of 5 vol the aromatics levels range from 0‐109 vol
The C7 aromatic is toluene the C8 aromatics consist of a mix of ethylbenzene and the xylene isomers
the C9 aromatics consist of a mix of trimethylbenzenes and methylethylbenzenes and the C10 aromatics
consist of a mix of tetramethylbenzenes dimethylethylbenzenes and methylpropylbenzenes FACE
Gasoline E a high sensitivity fuel has a naphthene content of 208 vol mainly cyclopentane and
cyclohexane Three other high sensitivity fuels (F G and H) have naphthenes concentrations of about
11 vol mainly cyclopentane Those high sensitivity fuels also have the highest olefins content with
concentrations ranging from 68‐127 vol FACE Gasoline I also has 64 vol olefins The C6 olefin is
1‐hexene The C5 olefins consist of a mix of 2‐pentene and methyl butenes In contrast to the high
sensitivity fuels Gasoline D which was designed to be low sensitivity but ended up in the high
sensitivity range has essentially no naphthenes or olefins Its high sensitivity is derived from its high
aromatics content
The C5 isoparaffin in all of the fuels is 2‐methylbutane The C6 isoparaffins consist of a mix of 2‐ and 3‐
methyl pentanes and 23 dimethyl butane The C7 isoparaffins in most of the FACE Gasolines consist of a
mix of 2‐ and 3‐methyl hexanes and 23‐ and 24‐dimethylpentanes The C8 isoparaffins are
predominantly trimethylpentanes with more than 50 of those being isooctane (224
trimethylpentane) The other isomers are mainly 24‐ and 25 dimethylhexanes and 2‐methyl 3‐ethyl
pentane
15
Figure 310 Detailed Hydrocarbon Analyses of Low Sensitivity FACE Gasolines
122 44 219 451 11
48 65
065
3 4 5 6 7 8 9 10 11
Carbon Number
FACE Gasoline A ‐ Detailed Hydrocarbon Analysis (vol)
isoparaffins
n‐paraffins
cycloparaffins
aromatics
olefins
104 13 137 587 16
59
39 37
3 4 5 6 7 8 9 10 11
Carbon Number
FACE Gasoline B ‐ Detailed Hydrocarbon Analysis (vol)
isoparaffins
cycloparaffins
aromatics
olefins
n‐paraffins
64 27 117 468 20 075
30 06
31 118 100
3 4 5 6 7 8 9 10 11
Carbon Number
FACE Gasoline C ‐ Detailed Hydrocarbon Analysis (vol)
isoparaffins
cycloparaffins
aromatics
olefins
n‐paraffins
12 410
99 35 150 46
47 114 70
3 4 5 6 7 8 9 10 11
Carbon Number
FACE Gasoline D ‐ Detailed Hydrocarbon Analysis (vol)
isoparaffins
cycloparaffins
aromatics
olefins
n‐paraffins
41 34 99 321 236 11
07 135
24
11
59
3 4 5 6 7 8 9 10 11
Carbon Number
FACE Gasoline I ‐ Detailed Hydrocarbon Analysis (vol)
isoparaffins
n‐paraffins
cycloparaffins
aromatics
olefins
327
90 124 95
22
14 131 145 29
06
3 4 5 6 7 8 9 10 11
Carbon Number
FACE Gasoline J ‐ Detailed Hydrocarbon Analysis (vol)
isoparaffins
n‐paraffins
cycloparaffins
aromatics
olefins
16
Figure 311 Detailed Hydrocarbon Analyses of High Sensitivity FACE Gasolines
64 68 143 165 18 07
70 105 19 10 04
46 17 18 16 08
21 82 09
29 06 37
3 4 5 6 7 8 9 10 11
Carbon Number
FACE Gasoline E ‐ Detailed Hydrocarbon Analysis (vol)
isoparaffins
cycloparaffins
aromatics
olefins
n‐paraffins
82 64 134 378 14
21 21
100
76
89
3 4 5 6 7 8 9 10 11
Carbon Number
FACE Gasoline F ‐ Detailed Hydrocarbon Analysis (vol)
isoparaffins
n‐paraffins
cycloparaffins
aromatics
olefins
65 66 72 152 16 10
74 09 16 10
15 33 218 54 14
36 25 10
37 07 10
3 4 5 6 7 8 9 10 11
Carbon Number
FACE Gasoline G ‐ Detailed Hydrocarbon Analysis (vol)
isoparaffins
cycloparaffins
aromatics
olefins
n‐paraffins
28 54 71 39 22 09
66 08 17 10
10 95 117 83 43 14
29 21 09
54 05 145 08
3 4 5 6 7 8 9 10 11
Carbon Number
FACE Gasoline H ‐ Detailed Hydrocarbon Analysis (vol)
isoparaffins
cycloparaffins
aromatics
olefins
n‐paraffins
17
Figure 312 Detailed Hydrocarbon Analyses Comparisons of FACE Gasolines
A comparison of the composition results from the DHA and SFC methods is presented in Figure 313 for
the low sensitivity fuels and Figure 314 for the high sensitivity fuels Also included are Fluorescent
Indicator Absorption (FIA ndash ASTM D1319 (12)) composition results reported on the CPChem COAs Since
the FIA method determines total saturates the DHA results for n‐paraffins iso‐paraffins and
naphthenes must be added together to enable the comparison between those two methods Similarly
since the SFC method directly measures aromatics and total non‐aromatics are determined by
difference the olefins amount must be added to the total saturate levels from FIA and DHA to enable
comparisons with the non‐aromatics values from SFC The appropriate comparison categories are
indicated by dashed lines in Figures 313 and 314 Of the three methods SFC generally gives the
highest level of aromatics and FIA the lowest The DHA aromatics values are closer to the FIA levels than
to the SFC levels The DHA olefins are fairly close to the FIA results
117
80
244 241
7944 67
225144
316
860
859
697
421
459
676
384
228
745336
16
01
01208
110
115105
33
23
13
127
94
8168
64
06
58 39
334
10977
336 358
12
317
0
10
20
30
40
50
60
70
80
90
100
A B C D E F G H I J
Composition ( vol)
FACE GASOLINE
DHA Composition ‐ FACE Gasolines
n‐paraffins isoparaffins naphthenes olefins aromatics
18
Figure 313 Comparison of Composition Methods FACE Low Sensitivity Gasolines
Figure 314 Comparison of Composition Methods FACE High Sensitivity Gasolines
117
80
244
144
316
860 859
697
745336
16
01 0433
23
13 64
06
58 3912
317
996951 975
929
712
04
07 04 62
10
42 21 09
278
993
921 940996
610
07
79 6004
390
0
10
20
30
40
50
60
70
80
90
100
DHA FIA SFC DHA FIA SFC DHA FIA SFC DHA FIA SFC DHA FIA SFC
Composition ( )
FACE GASOLINE
Composition ‐ Low Sensitivity FACE Gasolines
n‐paraffins isoparaffins naphthenes olefins aromatics saturates nonaromatics
A B C I J
241
7944 67
225
421
459
676
384
228
01
208
110
115 105
127
94
81 68
334
10977
336 358
701
780
856
587 568
04
99
86
7879
295
12158
335 353
581
850900
595568
419
150100
405432
0
10
20
30
40
50
60
70
80
90
100
DHA FIA SFC DHA FIA SFC DHA FIA SFC DHA FIA SFC DHA FIA SFC
Composition ( )
FACE GASOLINE
Composition ‐ High Sensitivity FACE Gasolines
n‐paraffins isoparaffins naphthenes olefins aromatics saturates nonaromatics
D E F G H
19
323 Elemental Analyses
Carbon and hydrogen contents were measured by two labs using ASTM method D5291 (13) The
average results are presented in the bar graphs in figure 315 The carbon contents range from 8399‐
8748 wt and the hydrogen contents range from1252‐1601 wt As expected the FACE Gasolines
having the highest aromatics content (D G H and J) have the highest carbon and lowest hydrogen
contents
Figure 315 Carbon and Hydrogen Elemental Analyses of FACE Gasolines
8399 8443 8453 8646 8547 8496 8670 87488414 8624
1601 1557 1547 1354 1453 1504 1330 12521586 1376
0
10
20
30
40
50
60
70
80
90
100
A B C D E F G H I J
Compo
sition
(wt)
FACE Gasoline
Carbon‐Hydrogen Elemental Analyses
Hydrogen
Carbon
20
Sulfur content was measured by one lab ASTM method D5453 (14) The results displayed in the bar
charts in Figure 316 are essentially identical to the values reported on the CPChem COAs All FACE
Gasolines had ultra‐low sulfur levels FACE Gasolines E G and H had the highest levels at 21 22 and 15
ppm sulfur The other fuels had levels ranging from 2‐6 ppm
Figure 316 Sulfur Levels of FACE Gasolines
6
4 4
2
21
2
22
15
2 2
0
5
10
15
20
25
A B C D E F G H I J
Sulfur Content (p
pm)
FACE Gasoline
Sulfur Content ‐ FACE Gasolines
21
4 ANALYTICAL RESULTS FOR FACE GASOLINES BLENDED WITH ETHANOL
Although the FACE Gasolines were not formulated with ethanol the expectation is that some potential
users will be interested in testing the fuels with ethanol added To assist selection of fuels for those
studies four FACE Gasolines were selected for blending with levels of 10 15 and 30 vol ethanol The
fuels selected for this purpose were A B C and H The positions of these fuels in the design matrix are
shown below
In this section results of the analyses of the ethanol blends are discussed Chevron Phillips 66 BP and
a contract laboratory conducted the analyses As mentioned previously future production runs that are
required to remake fuels that sell out likely will results in some changes to the fuel property values
reported here
41 ASTM TEST RESULTS
ASTM methods were used to measure the ethanol content RON MON API gravity density distillation
profiles RVP and net heats of combustion of all of the ethanol blends made with the FACE Gasolines
The results of these analyses are summarized below and in Table A2 located in the Appendix
411 Ethanol Content
FACE Gasolines A B C and H were blended with nominally 10 15 and 30 vol ethanol The
concentration of ethanol in each blend were determined using ASTM method D5599 (15) (coupled with
ASTM D4052 density measurement) and by detailed hydrocarbon analysis using gas chromatography
with a flame ionization detector The results for both methods were in excellent agreement for all fuels
as shown below in Table 41
Table 41 Measured Ethanol Content of FACE Gasoline Blends
Ethanol Content (vol)
A B C H
10 15 30 10 15 30 10 15 30 10 15 30
D5599 101 147 299 100 147 302 102 146 295 102 146 303
DHA 100 146 301 100 148 301 103 148 299 102 147 304
22
412 RON MON and Octane Sensitivity
RON values were measured in CFR engines per ASTM method D2699 (4) Although the measurements
were conducted in four labs the lab‐to‐lab reproducibility was very good so only the average values are
reported here (but individual values are reported in Table A2) Average RON values for each fuel are
presented in Figure 41 For all four of these FACE Gasolines the RON values continue to increase even
at the 30 ethanol level although the rates of increase are lower than at lower ethanol levels FACE
Gasoline B has the highest RON at all ethanol levels with a value of about 106 at the 30 ethanol level
FACE Gasolines A and C have essentially the same RON values at all ethanol levels with RON values of
about 102 at the 30 ethanol level FACE Gasoline H without ethanol has a higher RON than A and C
but a lower RON at the 15 and 30 ethanol levels
Figure 41 RON Values of FACE Gasoline Blends with Ethanol
MON values were measured in CFR engines per ASTM method D2700 (5) Although the measurements were conducted in four labs the lab‐to‐lab reproducibility was very good so only the average values are reported here (but individual values are reported in Appendix A2) The MON values for each fuel are
presented in Figure 42 FACE Gasoline B has the highest MON values at all ethanol levels but unlike the other FACE Gasolines the MON value did not increase with ethanol contents above 10 vol The MON values for FACE Gasolines A and C were essentially the same and higher than those for FACE Gasoline H
80081082083084085086087088089090091092093094095096097098099010001010102010301040105010601070108010901100
0 5 10 15 20 25 30 35
RON
Ethanol (vol)
RON Values ‐ FACE Gasoline + Ethanol Blends
FACE A
FACE B
FACE H
FACE C
23
Figure 42 MON Values of FACE Gasoline Blends with Ethanol
Octane Sensitivity (S=RON‐MON) values are presented in Figure 43 As expected due to the relatively high sensitivity of ethanol the sensitivities of all four FACE Gasolines increase as the ethanol content increases FACE Gasoline H has the highest sensitivity at all ethanol levels except at 30 vol ethanol where the sensitivity of the FACE Gasoline B blend becomes slightly higher with values of 124 and 132 respectively The sensitivities for FACE Gasolines A and C are very similar to each other and although lower than the blends for the other FACE Gasolines have the highest rates of increase at the 30 level
Figure 43 Octane Sensitivities FACE Gasoline Blends with Ethanol
750
760
770
780
790
800
810
820
830
840
850
860
870
880
890
900
910
920
930
940
950
0 5 10 15 20 25 30 35
MON
Ethanol (vol)
MON Values ‐ FACE Gasoline + Ethanol Blends
FACE A
FACE B
FACE H
FACE C
00
10
20
30
40
50
60
70
80
90
100
110
120
130
140
0 5 10 15 20 25 30 35
S
Ethanol (vol)
Octane Sensitivity (S) ‐ FACE Gasoline + Ethanol Blends
FACE A
FACE B
FACE H
FACE C
24
413 Distillation Characteristics
The distillation properties of the fuels were determined by ASTM D86 (6) The values are plotted in
Figure 44 and tabulated in Table A2 in the Appendix The behavior and shapes of the curves are very
similar For a given gasoline all of the ethanol blends start at about the same IBP The blends
containing ethanol then follow the same curve which is lower than the base gasoline At a certain point
the ethanol blends then rise quickly to rejoin the distillation curve of the base gasoline The lower the
ethanol content of the blend the earlier (lower distilled volume ) the curve rejoins the base gasoline
curve
Figure 44 ASTM D86 Distillation Profiles for FACE Gasoline Blends with Ethanol
50
100
150
200
250
300
0 10 20 30 40 50 60 70 80 90 100
Temperature (˚ C)
Volume Distilled
D86 Distillation ‐ FACE A Gasoline + Ethanol Blends
0 EtOH
10 EtOH
15 EtOH
30 EtOH
50
100
150
200
250
300
0 10 20 30 40 50 60 70 80 90 100
Temperature (˚ C)
Volume Distilled
D86 Distillation ‐ FACE B Gasoline + Ethanol Blends
0 EtOH
10 EtOH
15 EtOH
30 EtOH
50
100
150
200
250
300
350
0 10 20 30 40 50 60 70 80 90 100
Temperature (˚ C)
Volume Distilled
D86 Distillation ‐ FACE C Gasoline + Ethanol Blends
0 EtOH
10 EtOH
15 EtOH
30 EtOH
50
100
150
200
250
300
350
400
450
0 10 20 30 40 50 60 70 80 90 100
Temperature (˚ C)
Volume Distilled
D86 Distillation ‐ FACE H Gasoline + Ethanol Blends
0 EtOH
10 EtOH
15 EtOH
30 EtOH
25
414 Reid Vapor Pressure (RVP)
The RVPs were determined using ASTM method D5191 (7) The values are plotted in Figure 45 For all
fuels the RVP appears to peak between 10 and 15 vol ethanol and then starts to decrease as the
ethanol content increases further
Figure 45 Reid Vapor Pressures for FACE Gasoline Blends with Ethanol
415 API Gravity and Density
The API gravities and densities of the fuels were measured by two labs using ASTM method D4052 (8) The values from the two labs were in excellent agreement and are listed in Table A2 The average density values are presented in Figure 46 For all of the FACE Gasolines the density increased as the ethanol content increased
Figure 46 Densities of FACE Gasoline Blends with Ethanol
7
75
8
85
9
95
10
0 5 10 15 20 25 30 35
RVP (psi)
Ethanol (vol)
Reid Vapor Pressure (RVP) ‐ FACE Gasoline + Ethanol Blends
FACE A
FACE B
FACE H
FACE C
0685 0697 0691
0759
0696 0705 0699
0761
0700 0710 0704
0763
0716 0724 0719
0768
0
01
02
03
04
05
06
07
08
09
1
A B C H
Density
(gm
l)
Ethanol (vol)
Density ‐ FACE Gasoline Blends with Ethanol
0
10
15
30
26
416 Net Heat of Combustion (NHC)
Net Heats of Combustion were measured by 2 labs using ASTM method D240 (9) For some fuels ASTM
method D4809 (10) was also used The values from both labs and both methods were very close to each
other and the average values are plotted in Figure 47 As expected since the net heat of combustion of
ethanol is lower than that of gasoline for all FACE Gasolines the net heat of combustion decreased as
ethanol content increased The decrease appeared to be linear with ethanol content The decrease
appeared to be steepest for FACE Gasoline B
Figure 47 Net Heat of Combustion of FACE Gasoline Blends with Ethanol
16000
16250
16500
16750
17000
17250
17500
17750
18000
18250
18500
18750
19000
19250
19500
0 5 10 15 20 25 30 35
Net Heat of C
ombustion (B
TUlb)
Ethanol (vol)
Net Heat of Combustion ‐ FACE Gasoline + Ethanol Blends
FACE A
FACE B
FACE H
FACE C
27
5 SUMMARY AND CONCLUSIONS
A subteam of the CRC AVFL FACE Working Group has designed a matrix of reference gasolines
known as the FACE Gasolines A commercial vendor has produced and made the fuels available
for purchase in research quantities It is expected that this will enable consistent comparisons
of engine and combustion results from different laboratories and test platforms based on the
use of the same set of fuels
The matrix is designed around four parameters expected to be of importance for advanced
gasoline engines RON octane sensitivity aromatics content and n‐paraffins content
Statistical methods were used to identify potential candidate formulations and down‐select to a
tractable number of 10 formulations
Detailed analyses were performed on the physical and chemical properties of the final fuel
formulations
Generally the property values measured in the current study agreed very well with the values
reported on the fuel blender (ChevronPhillips Chemical Company ‐ CPChem) Certificates of
Analyses (COAs)
As expected conflicts in the target properties for some of the fuels (such as high aromatics level
coupled with low octane sensitivity) led to some trade‐offs that resulted in some deviation in
the actual properties from the design properties
The RON values come close to meeting the targets for most of the fuels Fuels E H and J have
values that are 24‐38 units higher than the targets
Three of the four ldquohighrdquo sensitivity fuels have measured values of 59‐71 that are lower than
the target value of 10 Two of the ldquolowrdquo sensitivity fuels have measured values (34‐37) that are
a bit higher than the target value of le2 One of the low sensitivity design fuels (ldquoDrdquo) has a value
of 72 that actually effectively makes it a high sensitivity fuel
Detailed hydrocarbon analyses (DHA) indicate that the n‐paraffins contents range from 225‐
316 vol for the four FACE Gasolines that had targets of 25 vol and from 44‐117 vol for
the six FACE Gasolines that had targets of 5 vol
DHAs indicate that the aromatics contents range from 317‐358 vol for the four FACE
Gasolines that had a target of 35 vol and 0‐109 vol for the other fuels that had a target of 5
vol
The high sensitivity fuels contained the high sensitivity components of naphthenes (105‐208
vol) and olefins (68‐127 vol) The exception was Gasoline ldquoDrdquo which had neither of these
components but whose high sensitivity was derived from aromatics components
Five of the FACE Gasolines (ldquoArdquo ldquoBrdquo ldquoCrdquo ldquoFrdquo and ldquoIrdquo) are very rich in isoparaffins with contents ge
676 vol
Aromatics values determined by SFC were generally higher than the values obtained from DHA
The DHA olefins values were close to the FIA values reported on the CPChem COAs
The fuels having the highest aromatics content also have the highest densities and highest net
heats of combustion on an energy content per volume basis
With regards to distillation properties for all fuels the initial boiling points (IBPs) are in a
narrow range of 90‐110˚F although the end boiling points (EBPs) range from 253‐410˚F Three
28
of the high sensitivity fuels have the highest EBPs The two low‐mid RON fuels having low n‐
paraffins and low aromatics have the lowest EBPs
All of the FACE Gasolines have ultra‐low levels of sulfur with the highest value at 22 ppm S and
most fuels having le 6 ppm S
For the four FACE Gasolines blended with ethanol RON continues to increase as the ethanol
levels increase to 30 vol although the rate of increase is lower as the ethanol content
increases FACE Gasoline B which has the highest RON of 96 has the highest RON at all ethanol
levels with a value of about 106 at 30 ethanol At the same ethanol level FACE Gasolines A
and C have essentially the same RON values FACE Gasoline H starts with a higher RON value
than those of A or C but has a lower value at blend levels of 15 and 30 vol
MON increased as the ethanol level increased for FACE Gasolines A C and H The MON values
for these fuels were essentially constant even though the highest MON values were found for
the ethanol blends with FACE Gasoline B
For all blends octane sensitivity increased as ethanol content increased with the highest values
of 12‐13 for 30 vol ethanol blends with FACE Gasolines B and H
The D86 distillation curve trends are similar for the four FACE Gasolines For a given gasoline all
blends start at the same point At around 10 vol distilled the curves for the blends with
ethanol diverge from and are lower than the curves for the base gasolines At a certain point
the distillation curves for the blends rise quickly and re‐join the curve for the parent base fuel
The distillation curves for the 30 vol ethanol blends are generally flat as a function of
increasing vol distilled and only start to increase again at about 70‐80 vol distilled when
most of the ethanol has been distilled from the liquid
The Reid Vapor Pressures (RVPs) peak at about 10‐15 vol
Densities increase slightly as ethanol increases while net heats of combustion decrease
29
6 REFERENCES
1 Alnajjar M Cannella B Dettman H Fairbridge C Franz J Gallant T Gieleciak R Hager D Lay C Lewis S Ratcliff M Sluder S Storey J Yin H Zigler B ldquoChemical and Physical Properties of the Fuels for Advanced Combustion Engines (FACE) Research Diesel Fuelsrdquo CRC Report No FACE‐1 (2010)
2 Gallant T Franz J Alnajjar M Storey J Lewis S Sluder S Cannella W Fairbridge C Hager D Dettman H Luecke J Ratcliff M Zigler ldquoFuels for Advanced Combustion Engines Research Diesel Fuels Analysis of Physical and Chemical Propertiesrdquo SAE Paper 2009‐01‐2769 (2009)
3 CannellaW Fairbridge C Arboleda P Bays T Dettman H Foster M Gieleciak R Gunter G Hager D Lay C Lewis S Luecke J Sluder S Zigler B ldquoDetailed Characterization of the Physical and Chemical Properties of the Reformulated FACE Diesel Fuels FD2B FD4B and FD7Brdquo CRC Report AVFL‐19‐1 (2013)
4 ASTM International Standard Test Method for Research Octane Number of Spark‐Ignition Engine Fuel ASTM D2699 (ASTM International Pennsylvania 2009)
5 ASTM International Standard Test Method for Motor Octane Number of Spark‐Ignition Engine Fuel ASTM D2700 (ASTM International Pennsylvania 2009)
6 ASTM International Standard Test Method for Distillation of Petroleum Products at Atmospheric Pressure ASTM D86‐09e1 (ASTM International Pennsylvania 2009)
7 ASTM International Standard Test Method for Vapor Pressure of Petroleum Products (Mini‐Method) ASTM D5191 (ASTM International Pennsylvania 2009)
8 ASTM International Standard Test Method for Density and Relative Density of Liquids by Digital Density Meter ASTM D4052‐96(2002)e1 (ASTM International Pennsylvania 2002)
9 ASTM International Standard Test Method for Heat of Combustion of Liquid Hydrocarbon Fuels by Bomb Calorimeter ASTM D240‐02(2007) (ASTM International Pennsylvania 2007)
10 ASTM International Standard Test Method for Heat of Combustion of Liquid Hydrocarbon Fuels by Bomb Calorimeter ASTM D4809 (2007) (ASTM International Pennsylvania 2007)
11 ASTM International Standard Test Method for Determination of Aromatic Content and Polynuclear Aromatic Content of Diesel Fuels and Aviation Turbine Fuels by Supercritical Fluid Chromatography ASTM D5186‐03(2009) (ASTM International Pennsylvania 2009)
12 ASTM International Standard Test Method for Hydrocarbon Types in Liquid Petroleum Products by Fluorescent Indicator Adsorption ASTM D1319‐08 (ASTM International Pennsylvania 2008)
13 ASTM International Standard Test Methods for Instrumental Determination of Carbon Hydrogen and Nitrogen in Petroleum Products and Lubricants ASTM D5291‐02(2007) (ASTM International Pennsylvania 2007)
14 ASTM International Standard Test Methods for Determination of Total Sulfur in Light Hydrocarbons Spark‐Ignition Engine Fuel Diesel Engine Fuel and Engine Oil by Ultraviolet Fluorescence ASTM D5453(2007) (ASTM International Pennsylvania 2007)
15 ASTM International Standard Test Methods for Determination of Oxygenates in Gasoline by Gas Chromatography and Oxygen Selective Flame Ionization Detection ASTM D5599 (2007) (ASTM International Pennsylvania 2007)
30
31
Appendix A
Properties of FACE Gasolines
32
Table A1 Summary Data for FACE Gasolines
Specific Tests FACE Gasoline A B C D E F G H I J Research Octane Number (RON) (ASTM D2699) -Lab 1 843 958 850 946 871 940 969 870 700 738 -Lab 2 839 960 840 939 877 960 869 -Lab 3 835 957 840 -Average 839 958 843 942 874 940 965 869 7015 738 -CPChem COA 835 960 847 932 875 944 968 869 703 718 Motor Octane Number (MON) (ASTM D2700) -Lab 1 836 923 830 872 813 881 857 797 695 701 -Lab 2 833 931 830 868 808 860 799 -Lab 3 835 919 829 -Average 835 924 830 870 811 881 858 798 695 701 -CPChem COA 836 926 836 878 815 888 858 793 696 688 Sensitivity (RON-MON) -Lab 1 07 35 20 74 58 59 112 73 05 37 -Lab 2 06 29 10 71 69 100 70 -Lab 3 0 38 11 -Average 04 34 13 72 63 59 107 72 05 37 -CPChem COA -01 34 11 54 60 56 110 76 07 30 API Gravity (API˚) (ASTM D4052) -CPChem COA 750 714 734 587 636 686 545 568 744 595 -Lab 1 749 713 732 587 636 686 546 548 744 587 -Average 7495 7135 733 587 636 686 5455 558 744 591 Density (ASTM D4052) -CPChem COA 0691 0743 0725 0707 0760 0697 0741 -Lab 1 0685 0697 0691 0743 0725 0707 0760 0759 0697 0743 -Average 0685 0697 0691 0743 0725 0707 0760 0759 0697 0742 RVP (psi) (D5191) -CPChem COA 81 74 74 68 67 78 72 75 75 75 -Lab 1 80 73 75 73 76 77 Net Heat of Combustion (BTUlb) (ASTM D4809) 19186 18680 Net Heat of Combustion (BTUlb) (ASTM D240) 19251 19187 19257 18649 18884 19072 18602 18625 19225 18731
33
TableA1 Summary Data for FACE Gasolines
Specific Tests FACE Gasoline A B C D E F G H I J Distillation (˚F) (ASTM D86) -CPChem IBP 93 95 95 88 110 108 93 94 100 101
5 104 128 120 129 131 129 122 123 123 111 10 132 145 136 148 142 142 135 140 156 162 20 160 172 154 176 155 156 158 168 177 206 30 183 194 171 198 166 168 183 192 186 217 40 197 207 187 212 177 180 210 211 191 224 50 203 213 200 221 186 193 240 227 195 231 60 207 216 210 229 197 206 270 242 199 242 70 210 220 218 235 208 217 306 262 203 261 80 213 225 226 280 222 225 328 291 207 291 90 219 235 243 330 267 240 343 327 213 316 95 227 248 270 340 343 261 363 358 220 330 FBP 269 283 328 363 405 294 403 410 259 358
-Lab 1 IBP 90 97 93 97 107 102 99 98 99 95 5 122 133 126 133 134 134 122 127 139 111
10 140 149 139 151 143 144 136 143 160 166 20 165 175 157 179 156 157 158 170 178 209 30 186 196 174 200 168 169 182 194 187 219 40 198 209 188 214 177 182 209 213 192 225 50 204 214 201 224 188 195 238 229 196 232 60 207 218 210 234 197 207 268 243 200 242 70 210 221 218 248 208 218 304 263 204 263 80 213 226 227 288 224 228 328 291 208 292
90 219 236 245 331 258 243 343 329 213 316 95 228 248 274 341 329 261 358 357 220 330 FBP 262 280 330 365 402 291 405 408 247 357
-Average IBP 915 96 94 925 1085 105 96 96 995 98 5 113 1305 123 131 1325 1315 122 125 131 111
10 136 147 1375 1495 1425 143 1355 1415 158 164 20 1625 1735 1555 1775 1555 1565 158 169 1775 203 30 1845 195 1725 199 167 1685 1825 193 1865 218 40 1975 208 1875 213 177 181 2095 212 1915 2245 50 2035 2135 2005 2225 187 194 239 228 1955 2315 60 207 217 210 2315 197 2065 269 2425 1995 242 70 210 2205 218 2415 208 2175 305 2625 2035 262 80 213 2255 2265 284 223 2265 328 291 2075 2915
90 219 2355 244 3305 2625 2415 343 328 213 316 95 2275 248 272 3405 336 261 3605 3575 220 330 FBP 2655 2815 329 364 4035 2925 404 409 253 3575
34
Table A1 Summary Data for FACE Gasolines
Specific Tests FACE Gasoline A B C D E F G H I J Elemental Analysis (ASTM D 5291) -Carbon (wt) -Lab 1 8398 8441 8497 8647 8547 8671 8792 8415 -Lab 4 8400 8444 8419 8645 8547 8496 8669 8703 8414 8624 -Average 8399 8443 8458 8646 8547 8496 8670 8748 8414 8624 -Hydrogen (wt) -Lab 1 1602 1559 1503 1353 1453 1329 1208 1585 -Lab 4 1600 1556 1585 1355 1453 1504 1331 1297 1586 1376 -Average 1601 1557 1547 1354 1453 1504 1330 1252 1586 1376 Sulfur by UV Fluorescence (ppmw) (ASTM D5453) -CPChem COA 4 4 3 2 21 2 20 15 2 2 -Lab 4 6 4 4 2 21 2 22 15 2 2 Hydrocarbons by FIA (vol) (ASTM D1319) -Aromatics (vol) CPChem COA 0 42 21 295 121 58 335 353 09 278 -Olefins (vol) CPChem COA 04 07 04 04 99 86 78 79 62 10 -Saturates (vol) CPChem COA 996 951 975 701 780 856 587 568 929 712 Aromatics by SFC (ASTM D5186) (Lab 1) -MonoAromatics (wt) -Lab 1 07 78 60 414 142 100 393 412 04 387 -Lab 2 80 421 138 395 428 -Average 07 79 60 4175 140 100 394 420 04 387 -PolyAromatics (wt) -Lab 1 0 0 0 03 11 0 10 10 0 03 -Lab 2 0 0 09 12 15 -Average 0 0 0 015 10 0 11 125 0 03 -NonAromatics (wt) -Lab 1 993 922 940 583 847 900 597 578 996 610 -Lab 2 920 579 850 593 557 -Average 993 921 940 581 8475 900 595 5675 996 610
35
Table A1 Summary Data for FACE Gasolines
Specific Tests FACE Gasolines A B C D E F G H I J Detailed Hydrocarbon Analyses by GC-FID -n-paraffins (vol) (Targets) (5) (5) (25) (25) (5) (5) (5) (25) (5) (25) -Lab 1 1144 783 2409 2346 771 434 662 2214 1441 3115 -Lab 2 1187 815 2476 2473 803 446 685 2283 1437 3212 -Average 1165 799 2443 2410 787 440 673 2249 1439 3164 -iso-paraffins (vol) -Lab 1 8562 8591 688 4206 4563 6765 3821 2322 7449 3362 -Lab 2 8635 8586 7066 4221 4621 6747 3864 2240 7459 3366 -Average 8599 8688 6973 4213 4592 6756 3843 2281 7454 3364 -cyclo-paraffins (vol) -Lab 1 192 021 048 010 2216 1078 1163 1035 324 234 -Lab 2 130 007 023 010 1945 1118 1140 1066 336 224 -Average 161 014 036 010 2081 1098 1152 1050 330 229 -aromatics (vol) (Targets) (5) (5) (5) (35) (5) (5) (35) (35) (5) (35) -Lab 1 073 601 409 3425 1121 805 3419 3597 120 3212 -Lab 2 003 568 374 3258 1062 739 3306 3555 110 3125 -Average 38 584 392 3341 1092 772 3363 3576 115 3169 -olefins (vol) -Lab 1 024 001 248 004 1146 978 851 714 643 066 -Lab 2 018 003 006 005 1392 905 771 650 627 054 -Average 021 002 127 04 1269 942 811 682 635 060
36
37
Appendix B
Properties of FACE Gasoline Blends with Ethanol
38
Table B1 Summary Data for FACE Gasoline Blends with Ethanol
Specific Tests FACE Gasoline Blend A B Ethanol Content (Vol ) 0 10 15 30 0 10 15 30 Ethanol Content (Vol ) (ASTM D5599) 0 1012 1469 2990 0 995 1473 3016 Research Octane Number (RON) (ASTM D2699) -Lab 1 843 922 951 1032 958 1015 1039 1067 -Lab 2 839 923 951 1017 960 1008 1023 1050 -Lab 3 835 917 946 1025 957 1012 1031 1069 -Lab 4 916 945 1018 1009 1026 1053 -Average 839 920 948 1023 958 1011 1030 1060 Motor Octane Number (MON) (ASTM D2700) -Lab 1 836 878 890 912 923 936 936 934 -Lab 2 833 874 891 917 931 935 934 931 -Lab 3 835 881 893 911 919 933 934 933 -Lab 4 884 901 916 935 936 933 -Average 835 879 894 914 924 935 935 933 Sensitivity (RON-MON) -Lab 1 07 44 61 120 35 79 103 133 -Lab 2 06 49 60 100 29 73 89 119 -Lab 3 0 36 53 114 38 79 97 136 -Lab 4 32 44 102 74 91 120 -Average 04 41 54 109 34 76 95 127 API Gravity (API˚) (ASTM D4052) -Lab 1 749 7164 7066 661 7131 690 6772 6375 -Lab 4 716 706 660 690 676 638 -Average 749 7162 7063 6605 7131 690 6766 6377 Density (ASTM D4052) -Lab 1 06849 06959 06992 07154 0697 07050 07096 07240 -Lab 4 06966 06999 07161 07055 07106 07244 -Average 06849 06963 06996 07158 0697 07053 07101 07242 RVP (psi) (D5191) Lab 1 83 95 94 91 73 87 86 83 Net Heat of Combustion (BTUlb) (ASTM D4809) 18308 Net Heat of Combustion (BTUlb) (ASTM D240) -Lab 1 19266 18294 18080 16751 19207 18319 17941 16631 -Lab 4 19236 18208 17963 16487 19168 18307 17696 16234 -Average 19251 18251 18021 16619 19187 18313 17818 16432
39
Table B1 Summary Data for FACE Gasoline Blends with Ethanol
Specific Tests FACE Gasoline Blend C H Target Ethanol Content (Vol ) 0 10 15 30 0 10 15 30 Ethanol Content (Vol) (ASTM D5599) 0 1018 1462 2949 0 1016 1459 3034 Research Octane Number (RON) (ASTM D2699) -Lab 1 850 918 951 1012 870 919 941 993 -Lab 2 840 920 950 1014 869 927 941 996 -Lab 3 840 917 946 1019 869 920 937 995 -Lab 4 914 945 1015 916 946 991 -Average 843 917 948 1015 869 921 941 994 Motor Octane Number (MON) (ASTM D2700) -Lab 1 830 876 893 921 797 821 835 861 -Lab 2 830 868 880 924 793 820 831 885 -Lab 3 829 876 887 909 799 817 829 858 -Lab 4 881 890 914 828 839 877 -Average 830 875 888 916 796 822 833 870 Sensitivity (RON-MON) -Lab 1 20 42 58 91 73 98 106 132 -Lab 2 10 52 70 90 76 107 110 111 -Lab 3 11 41 59 110 70 103 108 137 -Lab 4 33 55 101 88 107 114 -(RON)avg ndash (MON)avg 13 42 60 99 73 99 108 124 API Gravity (API˚) (ASTM D4052) -Lab 1 732 7069 6943 6523 5481 5416 5375 5247 -Lab 4 707 693 652 544 538 527 -Average 732 707 694 652 548 543 5377 526 Density (ASTM D4052) -Lab 1 06906 06991 07035 07186 07587 07614 07631 07684 -Lab 4 06997 07043 07192 07610 07636 07678 -Average 06994 07039 07189 07587 07612 07633 07681 RVP (psi) (D5191) Lab 1 75 86 85 83 76 88 87 84 Net Heat of Combustion (BTUlb) (ASTM D4809) 19186 18198 17955 16692 16265 Net Heat of Combustion (BTUlb) (ASTM D240) -Lab 1 19257 18375 18012 16739 18675 17891 17550 16369 -Lab 4 18576 17809 17408 16322 -Average 19257 18375 18012 16739 18625 17850 17479 16345
40
Table B1 Summary Data for FACE Gasoline Blends with Ethanol
Specific Tests FACE Gasoline Blend A B Target Ethanol Content 0 10 15 30 0 10 15 30 Ethanol Content (Vol) -ASTM D5599 0 1012 1469 2990 0 995 1473 3016 -Detailed Hydrocarbon Analysis - GCFID -Lab 1 0 1000 1463 3017 0 1001 1476 3014 Elemental Analysis (ASTM D 5291) -Carbon (wt) -Lab 1 8443 8178 7941 7306 8465 8172 8029 7346 -Lab 4 8433 8085 7823 7361 8471 8110 7921 7380 -Average 8438 8131 7882 7333 8468 8141 7975 7363 -Hydrogen (wt) -Lab 1 1543 1527 1484 1446 1473 1462 1442 1387 -Lab 4 1606 1573 1548 1515 1561 1540 1525 1487 -Average 1575 1550 1516 1481 1517 1501 1483 1437 -Oxygen (wt) (ASTM D5599) Lab 4 0 400 578 1150 0 389 571 1147
Specific Tests FACE Gasoline Blend C H Target Ethanol Content 0 10 15 30 0 10 15 30 Ethanol Content (Vol) -ASTM D5599 0 1018 1462 2949 0 1016 1459 3034 -Detailed Hydrocarbon Analysis - GCFID -Lab 1 0 1027 1483 2988 0 1021 1468 3040 Elemental Analysis (ASTM D 5291) -Carbon (wt) -Lab 1 8447 8200 7998 7336 8768 8402 8401 7624 -Lab 4 8419 8077 7909 7353 8720 8316 8150 7626 -Average 8433 8138 7954 7345 8744 8359 8276 7625 -Hydrogen (wt) -Lab 1 1494 1465 1465 1405 1205 1199 1207 1218 -Lab 4 1585 1668 1523 1509 1300 1305 1292 1316 -Average 1540 1567 1494 1457 1253 1252 1250 1267 -Oxygen (wt) (ASTM D5599) Lab 4 0 401 572 1129 0 368 527 1088
Table B1 Summary Data for FACE Gasoline Blends with Ethanol
41
Specific Tests FACE Gasoline Blend A B Target Ethanol Content 0 10 15 30 0 10 15 30 Distillation (˚F) (ASTM D86) Lab 1 IBP 90 106 99 99 97 105 103 101 5 122 127 122 126 133 128 126 129 10 140 134 131 135 149 135 134 138 20 165 145 144 146 175 147 146 149 30 186 153 152 153 196 155 154 155 40 198 159 156 156 209 165 159 159 50 204 202 159 158 214 211 165 161 60 207 208 204 159 218 217 214 162 70 210 211 210 160 221 219 219 163 80 213 214 213 161 226 225 224 165 90 219 222 219 211 236 234 234 230 95 228 233 229 224 248 247 246 242 FBP 262 261 263 260 280 271 270 266
Specific Tests FACE Gasoline Blend C H Target Ethanol Content 0 10 15 30 0 10 15 30 Distillation (˚F) (ASTM D86) Lab 1 IBP 93 104 102 107 98 96 105 106 5 126 126 123 130 127 123 125 127 10 139 131 131 136 143 132 134 138 20 157 140 140 145 170 145 147 152 30 174 147 147 151 194 153 156 159 40 188 153 153 156 213 167 161 163 50 201 183 157 159 229 217 182 166 60 210 208 176 161 243 236 235 169 70 218 217 215 162 263 255 253 175 80 227 226 223 165 291 283 282 268 90 245 244 241 233 329 322 323 312 95 274 274 269 261 357 351 351 343 FBP 330 331 322 324 408 401 407 396
42

8
MON values were measured in CFR engines per ASTM method D2700 (5) Although the measurements
were conducted in several labs the lab‐to‐lab reproducibility was very good so only the average values
are reported here (but individual values are reported in Table A1) Bar charts of the target measured
and CPChem COA MON values for each fuel are presented in Figure 32 The ldquotargetrdquo MON values were
determined by subtracting the target octane sensitivities from the target RON values The largest
difference between the values in this project and those reported on CPChemrsquos COA is 13 for fuel J The
largest differences between the measured and target values are for fuels D E F and H For Gasolines E
F and H the measured values are about 3‐6 units higher than target while for gasoline D the measured
values are about 6 units lower than the target
Figure 32 MON Values of FACE Gasolines
830
930
830
930
750
850 850
750
680 680
835
924
830
870
811
881
858
796
695 701
836
926
836
878
815
888
858
793
696
688
600
650
700
750
800
850
900
950
1000
A B C D E F G H I J
MON
Fuel
MON
Target
AVG
CPChem
9
Octane Sensitivity (S=RON‐MON) values are presented in the bar charts in Figure 33 The average sensitivities measured by the labs in this project are very close to those reported in CPChemrsquos COAs with the exception of Gasoline D The measured values for the three of the four high sensitivity fuels are quite a bit lower than the target value of 10 in the range of 59‐71 The exception is Gasoline G which comes close to meeting the target value Of the six low sensitivity fuels three (Gasolines A C and I) have values that meet the target value of le2 two have values that are slightly higher (Gasolines B and J) and one (Gasoline D) has a value that is significantly higher and in the range of the high sensitivity gasolines This discrepancy with Gasoline D is not surprising since it is very difficult to produce a low sensitivity fuel with a high level of aromatics which typically have high sensitivities Thus relative to the other manufactured FACE Gasolines Gasoline D should be considered a ldquohighrdquo sensitivity fuel
Figure 33 Octane Sensitivity Values of FACE Gasolines
312 Distillation Characteristics
The distillation properties of the fuels were determined by ASTM D86 (6) The D86 values obtained in
this study were very close to those reported on CPChemrsquos COAs The average of those two sources are
plotted in Figure 34 The values are also tabulated in Table A1 The temperature corresponding to a
given recovery fraction X is designated as TX (ie T90 indicates the temperature at which 90 of the
fuel has been vaporized and recovered) The initial boiling points (IBP) of all of the fuels are in a
relatively narrow range of 90‐110˚F In contrast the end boiling points (EBP) range from 253‐410˚F
Gasolines E G and H which are three of the four high sensitivity fuels have the highest EBPs Gasoline
E has a relatively steep increase in temperature of 140˚F from T90‐EBP Gasolines I and A the two fuels
having low sensitivity aromatics and n‐paraffin and low‐mid RON have the lowest EBPs Gasoline I
also has a relatively flat distillation profile from T30‐T90
100 100 100 100
04
34
13
72
63
59
107
71
05
3734
11
54
60
56
110
76
07
30
00
10
20
30
40
50
60
70
80
90
100
110
A B C D E F G H I J
Octan
e Sensitivity
Fuel
Octane Sensitivity
Target
AVG
CPChem
le2le2 le2 le2 le2 le2
‐01
10
Figure 34 ASTM D86 Distillation Curves for the FACE Gasolines
313 Reid Vapor Pressure (RVP)
The RVPs were determined using ASTM method D5191 (7) The values measured in this project were in
excellent agreement with those reported by CPChem COAs (within 01 psi) The averages of both values
are depicted in the bar charts in Figure 35 The values range from 67 to 805 psi
Figure 35 Reid Vapor Pressures of FACE Gasolines
500
1000
1500
2000
2500
3000
3500
4000
4500
0 10 20 30 40 50 60 70 80 90 100
Tempe
rature (˚ F)
Volume Distilled
D86 Distillation ‐ FACE Gasolines
A
B
C
D
E
F
G
H
I
J
805
735 745
680 670
780
725
755 760 750
0
1
2
3
4
5
6
7
8
9
A B C D E F G H I J
Reid Vap
or Pressure (p
si)
FACE Gasoline
Reid Vapor Pressure (RVP) ‐ FACE Gasolines
11
314 API Gravity and Density
The API gravities and densities of the fuels were measured using ASTM method D4052 (8) The
agreement between the values measured in this project and the values reported in the CPChem COAs
The individual values are listed in the Summary Table A1 in Appendix A The average of both values are
plotted in the bar charts in Figures 36 and 37 for API Gravity and density respectively As expected the
FACE Gasolines (D G H and J) having the highest aromatics content have the lowest API Gravities and
highest densities
Figure 36 API Gravities of FACE Gasolines
Figure 37 Densities of FACE Gasolines
7495
7135
7330
5870
6360
6860
54555580
7440
5910
0
5
10
15
20
25
30
35
40
45
50
55
60
65
70
75
80
A B C D E F G H I J
API G
ravity
FACE Gasoline
API Gravity ‐ FACE Gasolines
0685
0697
0691
0743
0725
0707
0760
0755
0697
0742
0645
065
0655
066
0665
067
0675
068
0685
069
0695
07
0705
071
0715
072
0725
073
0735
074
0745
075
0755
076
0765
077
A B C D E F G H I J
Density
(gml)
FACE Gasoline
Density ‐ FACE Gasolines
12
315 Net Heat of Combustion (NHC)
Net Heats of Combustion were measured using ASTM method D240 (9) The values are depicted in the
bar charts in Figure 38 In addition for two of the FACE Gasolines (C and J) the values were also
measured using ASTM method D4809 (10) The D4809 values were very close to those obtained from
method D240 (within 100 BTUlb) TheD240 values range from 18602 to 19251 BTUlb As expected
the FACE Gasolines having the highest aromatics content (D G H and J) have the lowest net heat of
combustion The FACE Gasolines having saturates content gt90 (A B C and I) have the highest net
heat of combustion
Figure 38 ASTM D240 Net Heats of Combustion of FACE Gasolines
19251
19187
19257
18649
18884
19072
1860218625
19225
18731
18200
18400
18600
18800
19000
19200
19400
A B C D E F G H I J
Net Heat o
f Com
bustion (BTU
lb) (A
STM D240)
FACE Gasoline
Net Heat of Combustion ‐ FACE Gasolines
13
32 CHEMICAL PROPERTIES OF FACE GASOLINES
The various types of hydrocarbons in the fuels were characterized by several techniques including
supercritical fluid chromatography (SFC) and detailed hydrocarbon analysis (DHA) by gas
chromatography using a flame ionization detector (GC‐FID) In addition the carbon hydrogen and
sulfur contents were measured Results are reported in the following sections
321 Aromatics by Supercritical Fluid Chromatography (SFC)
The SFC method of ASTM D5186 (11) separates the hydrocarbons into three fractions monoaromatics
polyaromatics and non‐aromatics and characterizes the composition in terms of mass Bar graphs of
the results are presented in Figure 39 Samples of FACE Gasolines B D E G and H were analyzed by
two labs The results from the two labs were very close to each other and so the averages are depicted
in the figure FACE Gasolines A B C and I have nonromatics levels gt90 wt FACE Gasolines D G and
H have the highest amounts of monoaromatics with values ranging from 394‐420 wt FACE
Gasolines E G and H appear to have about 1 wt polyaromatics
Figure 39 Compositions of FACE Gasolines by Supercritical Fluid Chromatography (ASTM D5186)
070 790 600
4175
14001000
39404200
040
3870
015
100
110125
030
9930
9210 9400
5810
85009000
59505675
9960
6100
0
10
20
30
40
50
60
70
80
90
100
A B C D E F G H I J
Composition (Wt )
FACE GASOLINE
SFC Composition ‐ FACE Gasolines
MonoAromatics PolyAromatics NonAromatics
14
322 Hydrocarbons by Detailed Hydrocarbon Analysis (DHA)
Detailed Hydrocarbon Analyses were performed by two labs using gas chromatography with flame
ionization detectors (GC‐FID) This technique enables the determination of concentration on a species‐
by‐species basis provided that retention factors have been determined for each species in the fuel The
results from both labs were very close to each other Bubble charts of the average concentration values
(in volume ) are depicted in Figure 310 for the low sensitivity fuels and Figure 311 for the high
sensitivity fuels on a carbon number basis for the five hydrocarbon classes n‐paraffins iso‐paraffins
naphthenes aromatics and olefins
In general the low sensitivity FACE Gasolines are characterized by large amounts of low sensitivity
components such as n‐paraffins and iso‐paraffins The high sensitivity FACE Gasolines contain more high
sensitivity components such as olefins and naphthenes than the low sensitivity fuels
The total concentration of components within each of the five hydrocarbon classes were added and the
sums are reported in the bar charts in Figure 312 The n‐paraffin levels range from 225‐316 vol for
the four FACE Gasolines (C D H and J) that had targets of 25 vol For the other FACE Gasolines that
had a target level of 5 vol the n‐paraffins levels range from 44‐117 vol The aromatics levels range
from 317‐358 vol for the four FACE Gasolines (D G H and J) that had targets of 35 vol For the
other six FACE Gasolines that had a target level of 5 vol the aromatics levels range from 0‐109 vol
The C7 aromatic is toluene the C8 aromatics consist of a mix of ethylbenzene and the xylene isomers
the C9 aromatics consist of a mix of trimethylbenzenes and methylethylbenzenes and the C10 aromatics
consist of a mix of tetramethylbenzenes dimethylethylbenzenes and methylpropylbenzenes FACE
Gasoline E a high sensitivity fuel has a naphthene content of 208 vol mainly cyclopentane and
cyclohexane Three other high sensitivity fuels (F G and H) have naphthenes concentrations of about
11 vol mainly cyclopentane Those high sensitivity fuels also have the highest olefins content with
concentrations ranging from 68‐127 vol FACE Gasoline I also has 64 vol olefins The C6 olefin is
1‐hexene The C5 olefins consist of a mix of 2‐pentene and methyl butenes In contrast to the high
sensitivity fuels Gasoline D which was designed to be low sensitivity but ended up in the high
sensitivity range has essentially no naphthenes or olefins Its high sensitivity is derived from its high
aromatics content
The C5 isoparaffin in all of the fuels is 2‐methylbutane The C6 isoparaffins consist of a mix of 2‐ and 3‐
methyl pentanes and 23 dimethyl butane The C7 isoparaffins in most of the FACE Gasolines consist of a
mix of 2‐ and 3‐methyl hexanes and 23‐ and 24‐dimethylpentanes The C8 isoparaffins are
predominantly trimethylpentanes with more than 50 of those being isooctane (224
trimethylpentane) The other isomers are mainly 24‐ and 25 dimethylhexanes and 2‐methyl 3‐ethyl
pentane
15
Figure 310 Detailed Hydrocarbon Analyses of Low Sensitivity FACE Gasolines
122 44 219 451 11
48 65
065
3 4 5 6 7 8 9 10 11
Carbon Number
FACE Gasoline A ‐ Detailed Hydrocarbon Analysis (vol)
isoparaffins
n‐paraffins
cycloparaffins
aromatics
olefins
104 13 137 587 16
59
39 37
3 4 5 6 7 8 9 10 11
Carbon Number
FACE Gasoline B ‐ Detailed Hydrocarbon Analysis (vol)
isoparaffins
cycloparaffins
aromatics
olefins
n‐paraffins
64 27 117 468 20 075
30 06
31 118 100
3 4 5 6 7 8 9 10 11
Carbon Number
FACE Gasoline C ‐ Detailed Hydrocarbon Analysis (vol)
isoparaffins
cycloparaffins
aromatics
olefins
n‐paraffins
12 410
99 35 150 46
47 114 70
3 4 5 6 7 8 9 10 11
Carbon Number
FACE Gasoline D ‐ Detailed Hydrocarbon Analysis (vol)
isoparaffins
cycloparaffins
aromatics
olefins
n‐paraffins
41 34 99 321 236 11
07 135
24
11
59
3 4 5 6 7 8 9 10 11
Carbon Number
FACE Gasoline I ‐ Detailed Hydrocarbon Analysis (vol)
isoparaffins
n‐paraffins
cycloparaffins
aromatics
olefins
327
90 124 95
22
14 131 145 29
06
3 4 5 6 7 8 9 10 11
Carbon Number
FACE Gasoline J ‐ Detailed Hydrocarbon Analysis (vol)
isoparaffins
n‐paraffins
cycloparaffins
aromatics
olefins
16
Figure 311 Detailed Hydrocarbon Analyses of High Sensitivity FACE Gasolines
64 68 143 165 18 07
70 105 19 10 04
46 17 18 16 08
21 82 09
29 06 37
3 4 5 6 7 8 9 10 11
Carbon Number
FACE Gasoline E ‐ Detailed Hydrocarbon Analysis (vol)
isoparaffins
cycloparaffins
aromatics
olefins
n‐paraffins
82 64 134 378 14
21 21
100
76
89
3 4 5 6 7 8 9 10 11
Carbon Number
FACE Gasoline F ‐ Detailed Hydrocarbon Analysis (vol)
isoparaffins
n‐paraffins
cycloparaffins
aromatics
olefins
65 66 72 152 16 10
74 09 16 10
15 33 218 54 14
36 25 10
37 07 10
3 4 5 6 7 8 9 10 11
Carbon Number
FACE Gasoline G ‐ Detailed Hydrocarbon Analysis (vol)
isoparaffins
cycloparaffins
aromatics
olefins
n‐paraffins
28 54 71 39 22 09
66 08 17 10
10 95 117 83 43 14
29 21 09
54 05 145 08
3 4 5 6 7 8 9 10 11
Carbon Number
FACE Gasoline H ‐ Detailed Hydrocarbon Analysis (vol)
isoparaffins
cycloparaffins
aromatics
olefins
n‐paraffins
17
Figure 312 Detailed Hydrocarbon Analyses Comparisons of FACE Gasolines
A comparison of the composition results from the DHA and SFC methods is presented in Figure 313 for
the low sensitivity fuels and Figure 314 for the high sensitivity fuels Also included are Fluorescent
Indicator Absorption (FIA ndash ASTM D1319 (12)) composition results reported on the CPChem COAs Since
the FIA method determines total saturates the DHA results for n‐paraffins iso‐paraffins and
naphthenes must be added together to enable the comparison between those two methods Similarly
since the SFC method directly measures aromatics and total non‐aromatics are determined by
difference the olefins amount must be added to the total saturate levels from FIA and DHA to enable
comparisons with the non‐aromatics values from SFC The appropriate comparison categories are
indicated by dashed lines in Figures 313 and 314 Of the three methods SFC generally gives the
highest level of aromatics and FIA the lowest The DHA aromatics values are closer to the FIA levels than
to the SFC levels The DHA olefins are fairly close to the FIA results
117
80
244 241
7944 67
225144
316
860
859
697
421
459
676
384
228
745336
16
01
01208
110
115105
33
23
13
127
94
8168
64
06
58 39
334
10977
336 358
12
317
0
10
20
30
40
50
60
70
80
90
100
A B C D E F G H I J
Composition ( vol)
FACE GASOLINE
DHA Composition ‐ FACE Gasolines
n‐paraffins isoparaffins naphthenes olefins aromatics
18
Figure 313 Comparison of Composition Methods FACE Low Sensitivity Gasolines
Figure 314 Comparison of Composition Methods FACE High Sensitivity Gasolines
117
80
244
144
316
860 859
697
745336
16
01 0433
23
13 64
06
58 3912
317
996951 975
929
712
04
07 04 62
10
42 21 09
278
993
921 940996
610
07
79 6004
390
0
10
20
30
40
50
60
70
80
90
100
DHA FIA SFC DHA FIA SFC DHA FIA SFC DHA FIA SFC DHA FIA SFC
Composition ( )
FACE GASOLINE
Composition ‐ Low Sensitivity FACE Gasolines
n‐paraffins isoparaffins naphthenes olefins aromatics saturates nonaromatics
A B C I J
241
7944 67
225
421
459
676
384
228
01
208
110
115 105
127
94
81 68
334
10977
336 358
701
780
856
587 568
04
99
86
7879
295
12158
335 353
581
850900
595568
419
150100
405432
0
10
20
30
40
50
60
70
80
90
100
DHA FIA SFC DHA FIA SFC DHA FIA SFC DHA FIA SFC DHA FIA SFC
Composition ( )
FACE GASOLINE
Composition ‐ High Sensitivity FACE Gasolines
n‐paraffins isoparaffins naphthenes olefins aromatics saturates nonaromatics
D E F G H
19
323 Elemental Analyses
Carbon and hydrogen contents were measured by two labs using ASTM method D5291 (13) The
average results are presented in the bar graphs in figure 315 The carbon contents range from 8399‐
8748 wt and the hydrogen contents range from1252‐1601 wt As expected the FACE Gasolines
having the highest aromatics content (D G H and J) have the highest carbon and lowest hydrogen
contents
Figure 315 Carbon and Hydrogen Elemental Analyses of FACE Gasolines
8399 8443 8453 8646 8547 8496 8670 87488414 8624
1601 1557 1547 1354 1453 1504 1330 12521586 1376
0
10
20
30
40
50
60
70
80
90
100
A B C D E F G H I J
Compo
sition
(wt)
FACE Gasoline
Carbon‐Hydrogen Elemental Analyses
Hydrogen
Carbon
20
Sulfur content was measured by one lab ASTM method D5453 (14) The results displayed in the bar
charts in Figure 316 are essentially identical to the values reported on the CPChem COAs All FACE
Gasolines had ultra‐low sulfur levels FACE Gasolines E G and H had the highest levels at 21 22 and 15
ppm sulfur The other fuels had levels ranging from 2‐6 ppm
Figure 316 Sulfur Levels of FACE Gasolines
6
4 4
2
21
2
22
15
2 2
0
5
10
15
20
25
A B C D E F G H I J
Sulfur Content (p
pm)
FACE Gasoline
Sulfur Content ‐ FACE Gasolines
21
4 ANALYTICAL RESULTS FOR FACE GASOLINES BLENDED WITH ETHANOL
Although the FACE Gasolines were not formulated with ethanol the expectation is that some potential
users will be interested in testing the fuels with ethanol added To assist selection of fuels for those
studies four FACE Gasolines were selected for blending with levels of 10 15 and 30 vol ethanol The
fuels selected for this purpose were A B C and H The positions of these fuels in the design matrix are
shown below
In this section results of the analyses of the ethanol blends are discussed Chevron Phillips 66 BP and
a contract laboratory conducted the analyses As mentioned previously future production runs that are
required to remake fuels that sell out likely will results in some changes to the fuel property values
reported here
41 ASTM TEST RESULTS
ASTM methods were used to measure the ethanol content RON MON API gravity density distillation
profiles RVP and net heats of combustion of all of the ethanol blends made with the FACE Gasolines
The results of these analyses are summarized below and in Table A2 located in the Appendix
411 Ethanol Content
FACE Gasolines A B C and H were blended with nominally 10 15 and 30 vol ethanol The
concentration of ethanol in each blend were determined using ASTM method D5599 (15) (coupled with
ASTM D4052 density measurement) and by detailed hydrocarbon analysis using gas chromatography
with a flame ionization detector The results for both methods were in excellent agreement for all fuels
as shown below in Table 41
Table 41 Measured Ethanol Content of FACE Gasoline Blends
Ethanol Content (vol)
A B C H
10 15 30 10 15 30 10 15 30 10 15 30
D5599 101 147 299 100 147 302 102 146 295 102 146 303
DHA 100 146 301 100 148 301 103 148 299 102 147 304
22
412 RON MON and Octane Sensitivity
RON values were measured in CFR engines per ASTM method D2699 (4) Although the measurements
were conducted in four labs the lab‐to‐lab reproducibility was very good so only the average values are
reported here (but individual values are reported in Table A2) Average RON values for each fuel are
presented in Figure 41 For all four of these FACE Gasolines the RON values continue to increase even
at the 30 ethanol level although the rates of increase are lower than at lower ethanol levels FACE
Gasoline B has the highest RON at all ethanol levels with a value of about 106 at the 30 ethanol level
FACE Gasolines A and C have essentially the same RON values at all ethanol levels with RON values of
about 102 at the 30 ethanol level FACE Gasoline H without ethanol has a higher RON than A and C
but a lower RON at the 15 and 30 ethanol levels
Figure 41 RON Values of FACE Gasoline Blends with Ethanol
MON values were measured in CFR engines per ASTM method D2700 (5) Although the measurements were conducted in four labs the lab‐to‐lab reproducibility was very good so only the average values are reported here (but individual values are reported in Appendix A2) The MON values for each fuel are
presented in Figure 42 FACE Gasoline B has the highest MON values at all ethanol levels but unlike the other FACE Gasolines the MON value did not increase with ethanol contents above 10 vol The MON values for FACE Gasolines A and C were essentially the same and higher than those for FACE Gasoline H
80081082083084085086087088089090091092093094095096097098099010001010102010301040105010601070108010901100
0 5 10 15 20 25 30 35
RON
Ethanol (vol)
RON Values ‐ FACE Gasoline + Ethanol Blends
FACE A
FACE B
FACE H
FACE C
23
Figure 42 MON Values of FACE Gasoline Blends with Ethanol
Octane Sensitivity (S=RON‐MON) values are presented in Figure 43 As expected due to the relatively high sensitivity of ethanol the sensitivities of all four FACE Gasolines increase as the ethanol content increases FACE Gasoline H has the highest sensitivity at all ethanol levels except at 30 vol ethanol where the sensitivity of the FACE Gasoline B blend becomes slightly higher with values of 124 and 132 respectively The sensitivities for FACE Gasolines A and C are very similar to each other and although lower than the blends for the other FACE Gasolines have the highest rates of increase at the 30 level
Figure 43 Octane Sensitivities FACE Gasoline Blends with Ethanol
750
760
770
780
790
800
810
820
830
840
850
860
870
880
890
900
910
920
930
940
950
0 5 10 15 20 25 30 35
MON
Ethanol (vol)
MON Values ‐ FACE Gasoline + Ethanol Blends
FACE A
FACE B
FACE H
FACE C
00
10
20
30
40
50
60
70
80
90
100
110
120
130
140
0 5 10 15 20 25 30 35
S
Ethanol (vol)
Octane Sensitivity (S) ‐ FACE Gasoline + Ethanol Blends
FACE A
FACE B
FACE H
FACE C
24
413 Distillation Characteristics
The distillation properties of the fuels were determined by ASTM D86 (6) The values are plotted in
Figure 44 and tabulated in Table A2 in the Appendix The behavior and shapes of the curves are very
similar For a given gasoline all of the ethanol blends start at about the same IBP The blends
containing ethanol then follow the same curve which is lower than the base gasoline At a certain point
the ethanol blends then rise quickly to rejoin the distillation curve of the base gasoline The lower the
ethanol content of the blend the earlier (lower distilled volume ) the curve rejoins the base gasoline
curve
Figure 44 ASTM D86 Distillation Profiles for FACE Gasoline Blends with Ethanol
50
100
150
200
250
300
0 10 20 30 40 50 60 70 80 90 100
Temperature (˚ C)
Volume Distilled
D86 Distillation ‐ FACE A Gasoline + Ethanol Blends
0 EtOH
10 EtOH
15 EtOH
30 EtOH
50
100
150
200
250
300
0 10 20 30 40 50 60 70 80 90 100
Temperature (˚ C)
Volume Distilled
D86 Distillation ‐ FACE B Gasoline + Ethanol Blends
0 EtOH
10 EtOH
15 EtOH
30 EtOH
50
100
150
200
250
300
350
0 10 20 30 40 50 60 70 80 90 100
Temperature (˚ C)
Volume Distilled
D86 Distillation ‐ FACE C Gasoline + Ethanol Blends
0 EtOH
10 EtOH
15 EtOH
30 EtOH
50
100
150
200
250
300
350
400
450
0 10 20 30 40 50 60 70 80 90 100
Temperature (˚ C)
Volume Distilled
D86 Distillation ‐ FACE H Gasoline + Ethanol Blends
0 EtOH
10 EtOH
15 EtOH
30 EtOH
25
414 Reid Vapor Pressure (RVP)
The RVPs were determined using ASTM method D5191 (7) The values are plotted in Figure 45 For all
fuels the RVP appears to peak between 10 and 15 vol ethanol and then starts to decrease as the
ethanol content increases further
Figure 45 Reid Vapor Pressures for FACE Gasoline Blends with Ethanol
415 API Gravity and Density
The API gravities and densities of the fuels were measured by two labs using ASTM method D4052 (8) The values from the two labs were in excellent agreement and are listed in Table A2 The average density values are presented in Figure 46 For all of the FACE Gasolines the density increased as the ethanol content increased
Figure 46 Densities of FACE Gasoline Blends with Ethanol
7
75
8
85
9
95
10
0 5 10 15 20 25 30 35
RVP (psi)
Ethanol (vol)
Reid Vapor Pressure (RVP) ‐ FACE Gasoline + Ethanol Blends
FACE A
FACE B
FACE H
FACE C
0685 0697 0691
0759
0696 0705 0699
0761
0700 0710 0704
0763
0716 0724 0719
0768
0
01
02
03
04
05
06
07
08
09
1
A B C H
Density
(gm
l)
Ethanol (vol)
Density ‐ FACE Gasoline Blends with Ethanol
0
10
15
30
26
416 Net Heat of Combustion (NHC)
Net Heats of Combustion were measured by 2 labs using ASTM method D240 (9) For some fuels ASTM
method D4809 (10) was also used The values from both labs and both methods were very close to each
other and the average values are plotted in Figure 47 As expected since the net heat of combustion of
ethanol is lower than that of gasoline for all FACE Gasolines the net heat of combustion decreased as
ethanol content increased The decrease appeared to be linear with ethanol content The decrease
appeared to be steepest for FACE Gasoline B
Figure 47 Net Heat of Combustion of FACE Gasoline Blends with Ethanol
16000
16250
16500
16750
17000
17250
17500
17750
18000
18250
18500
18750
19000
19250
19500
0 5 10 15 20 25 30 35
Net Heat of C
ombustion (B
TUlb)
Ethanol (vol)
Net Heat of Combustion ‐ FACE Gasoline + Ethanol Blends
FACE A
FACE B
FACE H
FACE C
27
5 SUMMARY AND CONCLUSIONS
A subteam of the CRC AVFL FACE Working Group has designed a matrix of reference gasolines
known as the FACE Gasolines A commercial vendor has produced and made the fuels available
for purchase in research quantities It is expected that this will enable consistent comparisons
of engine and combustion results from different laboratories and test platforms based on the
use of the same set of fuels
The matrix is designed around four parameters expected to be of importance for advanced
gasoline engines RON octane sensitivity aromatics content and n‐paraffins content
Statistical methods were used to identify potential candidate formulations and down‐select to a
tractable number of 10 formulations
Detailed analyses were performed on the physical and chemical properties of the final fuel
formulations
Generally the property values measured in the current study agreed very well with the values
reported on the fuel blender (ChevronPhillips Chemical Company ‐ CPChem) Certificates of
Analyses (COAs)
As expected conflicts in the target properties for some of the fuels (such as high aromatics level
coupled with low octane sensitivity) led to some trade‐offs that resulted in some deviation in
the actual properties from the design properties
The RON values come close to meeting the targets for most of the fuels Fuels E H and J have
values that are 24‐38 units higher than the targets
Three of the four ldquohighrdquo sensitivity fuels have measured values of 59‐71 that are lower than
the target value of 10 Two of the ldquolowrdquo sensitivity fuels have measured values (34‐37) that are
a bit higher than the target value of le2 One of the low sensitivity design fuels (ldquoDrdquo) has a value
of 72 that actually effectively makes it a high sensitivity fuel
Detailed hydrocarbon analyses (DHA) indicate that the n‐paraffins contents range from 225‐
316 vol for the four FACE Gasolines that had targets of 25 vol and from 44‐117 vol for
the six FACE Gasolines that had targets of 5 vol
DHAs indicate that the aromatics contents range from 317‐358 vol for the four FACE
Gasolines that had a target of 35 vol and 0‐109 vol for the other fuels that had a target of 5
vol
The high sensitivity fuels contained the high sensitivity components of naphthenes (105‐208
vol) and olefins (68‐127 vol) The exception was Gasoline ldquoDrdquo which had neither of these
components but whose high sensitivity was derived from aromatics components
Five of the FACE Gasolines (ldquoArdquo ldquoBrdquo ldquoCrdquo ldquoFrdquo and ldquoIrdquo) are very rich in isoparaffins with contents ge
676 vol
Aromatics values determined by SFC were generally higher than the values obtained from DHA
The DHA olefins values were close to the FIA values reported on the CPChem COAs
The fuels having the highest aromatics content also have the highest densities and highest net
heats of combustion on an energy content per volume basis
With regards to distillation properties for all fuels the initial boiling points (IBPs) are in a
narrow range of 90‐110˚F although the end boiling points (EBPs) range from 253‐410˚F Three
28
of the high sensitivity fuels have the highest EBPs The two low‐mid RON fuels having low n‐
paraffins and low aromatics have the lowest EBPs
All of the FACE Gasolines have ultra‐low levels of sulfur with the highest value at 22 ppm S and
most fuels having le 6 ppm S
For the four FACE Gasolines blended with ethanol RON continues to increase as the ethanol
levels increase to 30 vol although the rate of increase is lower as the ethanol content
increases FACE Gasoline B which has the highest RON of 96 has the highest RON at all ethanol
levels with a value of about 106 at 30 ethanol At the same ethanol level FACE Gasolines A
and C have essentially the same RON values FACE Gasoline H starts with a higher RON value
than those of A or C but has a lower value at blend levels of 15 and 30 vol
MON increased as the ethanol level increased for FACE Gasolines A C and H The MON values
for these fuels were essentially constant even though the highest MON values were found for
the ethanol blends with FACE Gasoline B
For all blends octane sensitivity increased as ethanol content increased with the highest values
of 12‐13 for 30 vol ethanol blends with FACE Gasolines B and H
The D86 distillation curve trends are similar for the four FACE Gasolines For a given gasoline all
blends start at the same point At around 10 vol distilled the curves for the blends with
ethanol diverge from and are lower than the curves for the base gasolines At a certain point
the distillation curves for the blends rise quickly and re‐join the curve for the parent base fuel
The distillation curves for the 30 vol ethanol blends are generally flat as a function of
increasing vol distilled and only start to increase again at about 70‐80 vol distilled when
most of the ethanol has been distilled from the liquid
The Reid Vapor Pressures (RVPs) peak at about 10‐15 vol
Densities increase slightly as ethanol increases while net heats of combustion decrease
29
6 REFERENCES
1 Alnajjar M Cannella B Dettman H Fairbridge C Franz J Gallant T Gieleciak R Hager D Lay C Lewis S Ratcliff M Sluder S Storey J Yin H Zigler B ldquoChemical and Physical Properties of the Fuels for Advanced Combustion Engines (FACE) Research Diesel Fuelsrdquo CRC Report No FACE‐1 (2010)
2 Gallant T Franz J Alnajjar M Storey J Lewis S Sluder S Cannella W Fairbridge C Hager D Dettman H Luecke J Ratcliff M Zigler ldquoFuels for Advanced Combustion Engines Research Diesel Fuels Analysis of Physical and Chemical Propertiesrdquo SAE Paper 2009‐01‐2769 (2009)
3 CannellaW Fairbridge C Arboleda P Bays T Dettman H Foster M Gieleciak R Gunter G Hager D Lay C Lewis S Luecke J Sluder S Zigler B ldquoDetailed Characterization of the Physical and Chemical Properties of the Reformulated FACE Diesel Fuels FD2B FD4B and FD7Brdquo CRC Report AVFL‐19‐1 (2013)
4 ASTM International Standard Test Method for Research Octane Number of Spark‐Ignition Engine Fuel ASTM D2699 (ASTM International Pennsylvania 2009)
5 ASTM International Standard Test Method for Motor Octane Number of Spark‐Ignition Engine Fuel ASTM D2700 (ASTM International Pennsylvania 2009)
6 ASTM International Standard Test Method for Distillation of Petroleum Products at Atmospheric Pressure ASTM D86‐09e1 (ASTM International Pennsylvania 2009)
7 ASTM International Standard Test Method for Vapor Pressure of Petroleum Products (Mini‐Method) ASTM D5191 (ASTM International Pennsylvania 2009)
8 ASTM International Standard Test Method for Density and Relative Density of Liquids by Digital Density Meter ASTM D4052‐96(2002)e1 (ASTM International Pennsylvania 2002)
9 ASTM International Standard Test Method for Heat of Combustion of Liquid Hydrocarbon Fuels by Bomb Calorimeter ASTM D240‐02(2007) (ASTM International Pennsylvania 2007)
10 ASTM International Standard Test Method for Heat of Combustion of Liquid Hydrocarbon Fuels by Bomb Calorimeter ASTM D4809 (2007) (ASTM International Pennsylvania 2007)
11 ASTM International Standard Test Method for Determination of Aromatic Content and Polynuclear Aromatic Content of Diesel Fuels and Aviation Turbine Fuels by Supercritical Fluid Chromatography ASTM D5186‐03(2009) (ASTM International Pennsylvania 2009)
12 ASTM International Standard Test Method for Hydrocarbon Types in Liquid Petroleum Products by Fluorescent Indicator Adsorption ASTM D1319‐08 (ASTM International Pennsylvania 2008)
13 ASTM International Standard Test Methods for Instrumental Determination of Carbon Hydrogen and Nitrogen in Petroleum Products and Lubricants ASTM D5291‐02(2007) (ASTM International Pennsylvania 2007)
14 ASTM International Standard Test Methods for Determination of Total Sulfur in Light Hydrocarbons Spark‐Ignition Engine Fuel Diesel Engine Fuel and Engine Oil by Ultraviolet Fluorescence ASTM D5453(2007) (ASTM International Pennsylvania 2007)
15 ASTM International Standard Test Methods for Determination of Oxygenates in Gasoline by Gas Chromatography and Oxygen Selective Flame Ionization Detection ASTM D5599 (2007) (ASTM International Pennsylvania 2007)
30
31
Appendix A
Properties of FACE Gasolines
32
Table A1 Summary Data for FACE Gasolines
Specific Tests FACE Gasoline A B C D E F G H I J Research Octane Number (RON) (ASTM D2699) -Lab 1 843 958 850 946 871 940 969 870 700 738 -Lab 2 839 960 840 939 877 960 869 -Lab 3 835 957 840 -Average 839 958 843 942 874 940 965 869 7015 738 -CPChem COA 835 960 847 932 875 944 968 869 703 718 Motor Octane Number (MON) (ASTM D2700) -Lab 1 836 923 830 872 813 881 857 797 695 701 -Lab 2 833 931 830 868 808 860 799 -Lab 3 835 919 829 -Average 835 924 830 870 811 881 858 798 695 701 -CPChem COA 836 926 836 878 815 888 858 793 696 688 Sensitivity (RON-MON) -Lab 1 07 35 20 74 58 59 112 73 05 37 -Lab 2 06 29 10 71 69 100 70 -Lab 3 0 38 11 -Average 04 34 13 72 63 59 107 72 05 37 -CPChem COA -01 34 11 54 60 56 110 76 07 30 API Gravity (API˚) (ASTM D4052) -CPChem COA 750 714 734 587 636 686 545 568 744 595 -Lab 1 749 713 732 587 636 686 546 548 744 587 -Average 7495 7135 733 587 636 686 5455 558 744 591 Density (ASTM D4052) -CPChem COA 0691 0743 0725 0707 0760 0697 0741 -Lab 1 0685 0697 0691 0743 0725 0707 0760 0759 0697 0743 -Average 0685 0697 0691 0743 0725 0707 0760 0759 0697 0742 RVP (psi) (D5191) -CPChem COA 81 74 74 68 67 78 72 75 75 75 -Lab 1 80 73 75 73 76 77 Net Heat of Combustion (BTUlb) (ASTM D4809) 19186 18680 Net Heat of Combustion (BTUlb) (ASTM D240) 19251 19187 19257 18649 18884 19072 18602 18625 19225 18731
33
TableA1 Summary Data for FACE Gasolines
Specific Tests FACE Gasoline A B C D E F G H I J Distillation (˚F) (ASTM D86) -CPChem IBP 93 95 95 88 110 108 93 94 100 101
5 104 128 120 129 131 129 122 123 123 111 10 132 145 136 148 142 142 135 140 156 162 20 160 172 154 176 155 156 158 168 177 206 30 183 194 171 198 166 168 183 192 186 217 40 197 207 187 212 177 180 210 211 191 224 50 203 213 200 221 186 193 240 227 195 231 60 207 216 210 229 197 206 270 242 199 242 70 210 220 218 235 208 217 306 262 203 261 80 213 225 226 280 222 225 328 291 207 291 90 219 235 243 330 267 240 343 327 213 316 95 227 248 270 340 343 261 363 358 220 330 FBP 269 283 328 363 405 294 403 410 259 358
-Lab 1 IBP 90 97 93 97 107 102 99 98 99 95 5 122 133 126 133 134 134 122 127 139 111
10 140 149 139 151 143 144 136 143 160 166 20 165 175 157 179 156 157 158 170 178 209 30 186 196 174 200 168 169 182 194 187 219 40 198 209 188 214 177 182 209 213 192 225 50 204 214 201 224 188 195 238 229 196 232 60 207 218 210 234 197 207 268 243 200 242 70 210 221 218 248 208 218 304 263 204 263 80 213 226 227 288 224 228 328 291 208 292
90 219 236 245 331 258 243 343 329 213 316 95 228 248 274 341 329 261 358 357 220 330 FBP 262 280 330 365 402 291 405 408 247 357
-Average IBP 915 96 94 925 1085 105 96 96 995 98 5 113 1305 123 131 1325 1315 122 125 131 111
10 136 147 1375 1495 1425 143 1355 1415 158 164 20 1625 1735 1555 1775 1555 1565 158 169 1775 203 30 1845 195 1725 199 167 1685 1825 193 1865 218 40 1975 208 1875 213 177 181 2095 212 1915 2245 50 2035 2135 2005 2225 187 194 239 228 1955 2315 60 207 217 210 2315 197 2065 269 2425 1995 242 70 210 2205 218 2415 208 2175 305 2625 2035 262 80 213 2255 2265 284 223 2265 328 291 2075 2915
90 219 2355 244 3305 2625 2415 343 328 213 316 95 2275 248 272 3405 336 261 3605 3575 220 330 FBP 2655 2815 329 364 4035 2925 404 409 253 3575
34
Table A1 Summary Data for FACE Gasolines
Specific Tests FACE Gasoline A B C D E F G H I J Elemental Analysis (ASTM D 5291) -Carbon (wt) -Lab 1 8398 8441 8497 8647 8547 8671 8792 8415 -Lab 4 8400 8444 8419 8645 8547 8496 8669 8703 8414 8624 -Average 8399 8443 8458 8646 8547 8496 8670 8748 8414 8624 -Hydrogen (wt) -Lab 1 1602 1559 1503 1353 1453 1329 1208 1585 -Lab 4 1600 1556 1585 1355 1453 1504 1331 1297 1586 1376 -Average 1601 1557 1547 1354 1453 1504 1330 1252 1586 1376 Sulfur by UV Fluorescence (ppmw) (ASTM D5453) -CPChem COA 4 4 3 2 21 2 20 15 2 2 -Lab 4 6 4 4 2 21 2 22 15 2 2 Hydrocarbons by FIA (vol) (ASTM D1319) -Aromatics (vol) CPChem COA 0 42 21 295 121 58 335 353 09 278 -Olefins (vol) CPChem COA 04 07 04 04 99 86 78 79 62 10 -Saturates (vol) CPChem COA 996 951 975 701 780 856 587 568 929 712 Aromatics by SFC (ASTM D5186) (Lab 1) -MonoAromatics (wt) -Lab 1 07 78 60 414 142 100 393 412 04 387 -Lab 2 80 421 138 395 428 -Average 07 79 60 4175 140 100 394 420 04 387 -PolyAromatics (wt) -Lab 1 0 0 0 03 11 0 10 10 0 03 -Lab 2 0 0 09 12 15 -Average 0 0 0 015 10 0 11 125 0 03 -NonAromatics (wt) -Lab 1 993 922 940 583 847 900 597 578 996 610 -Lab 2 920 579 850 593 557 -Average 993 921 940 581 8475 900 595 5675 996 610
35
Table A1 Summary Data for FACE Gasolines
Specific Tests FACE Gasolines A B C D E F G H I J Detailed Hydrocarbon Analyses by GC-FID -n-paraffins (vol) (Targets) (5) (5) (25) (25) (5) (5) (5) (25) (5) (25) -Lab 1 1144 783 2409 2346 771 434 662 2214 1441 3115 -Lab 2 1187 815 2476 2473 803 446 685 2283 1437 3212 -Average 1165 799 2443 2410 787 440 673 2249 1439 3164 -iso-paraffins (vol) -Lab 1 8562 8591 688 4206 4563 6765 3821 2322 7449 3362 -Lab 2 8635 8586 7066 4221 4621 6747 3864 2240 7459 3366 -Average 8599 8688 6973 4213 4592 6756 3843 2281 7454 3364 -cyclo-paraffins (vol) -Lab 1 192 021 048 010 2216 1078 1163 1035 324 234 -Lab 2 130 007 023 010 1945 1118 1140 1066 336 224 -Average 161 014 036 010 2081 1098 1152 1050 330 229 -aromatics (vol) (Targets) (5) (5) (5) (35) (5) (5) (35) (35) (5) (35) -Lab 1 073 601 409 3425 1121 805 3419 3597 120 3212 -Lab 2 003 568 374 3258 1062 739 3306 3555 110 3125 -Average 38 584 392 3341 1092 772 3363 3576 115 3169 -olefins (vol) -Lab 1 024 001 248 004 1146 978 851 714 643 066 -Lab 2 018 003 006 005 1392 905 771 650 627 054 -Average 021 002 127 04 1269 942 811 682 635 060
36
37
Appendix B
Properties of FACE Gasoline Blends with Ethanol
38
Table B1 Summary Data for FACE Gasoline Blends with Ethanol
Specific Tests FACE Gasoline Blend A B Ethanol Content (Vol ) 0 10 15 30 0 10 15 30 Ethanol Content (Vol ) (ASTM D5599) 0 1012 1469 2990 0 995 1473 3016 Research Octane Number (RON) (ASTM D2699) -Lab 1 843 922 951 1032 958 1015 1039 1067 -Lab 2 839 923 951 1017 960 1008 1023 1050 -Lab 3 835 917 946 1025 957 1012 1031 1069 -Lab 4 916 945 1018 1009 1026 1053 -Average 839 920 948 1023 958 1011 1030 1060 Motor Octane Number (MON) (ASTM D2700) -Lab 1 836 878 890 912 923 936 936 934 -Lab 2 833 874 891 917 931 935 934 931 -Lab 3 835 881 893 911 919 933 934 933 -Lab 4 884 901 916 935 936 933 -Average 835 879 894 914 924 935 935 933 Sensitivity (RON-MON) -Lab 1 07 44 61 120 35 79 103 133 -Lab 2 06 49 60 100 29 73 89 119 -Lab 3 0 36 53 114 38 79 97 136 -Lab 4 32 44 102 74 91 120 -Average 04 41 54 109 34 76 95 127 API Gravity (API˚) (ASTM D4052) -Lab 1 749 7164 7066 661 7131 690 6772 6375 -Lab 4 716 706 660 690 676 638 -Average 749 7162 7063 6605 7131 690 6766 6377 Density (ASTM D4052) -Lab 1 06849 06959 06992 07154 0697 07050 07096 07240 -Lab 4 06966 06999 07161 07055 07106 07244 -Average 06849 06963 06996 07158 0697 07053 07101 07242 RVP (psi) (D5191) Lab 1 83 95 94 91 73 87 86 83 Net Heat of Combustion (BTUlb) (ASTM D4809) 18308 Net Heat of Combustion (BTUlb) (ASTM D240) -Lab 1 19266 18294 18080 16751 19207 18319 17941 16631 -Lab 4 19236 18208 17963 16487 19168 18307 17696 16234 -Average 19251 18251 18021 16619 19187 18313 17818 16432
39
Table B1 Summary Data for FACE Gasoline Blends with Ethanol
Specific Tests FACE Gasoline Blend C H Target Ethanol Content (Vol ) 0 10 15 30 0 10 15 30 Ethanol Content (Vol) (ASTM D5599) 0 1018 1462 2949 0 1016 1459 3034 Research Octane Number (RON) (ASTM D2699) -Lab 1 850 918 951 1012 870 919 941 993 -Lab 2 840 920 950 1014 869 927 941 996 -Lab 3 840 917 946 1019 869 920 937 995 -Lab 4 914 945 1015 916 946 991 -Average 843 917 948 1015 869 921 941 994 Motor Octane Number (MON) (ASTM D2700) -Lab 1 830 876 893 921 797 821 835 861 -Lab 2 830 868 880 924 793 820 831 885 -Lab 3 829 876 887 909 799 817 829 858 -Lab 4 881 890 914 828 839 877 -Average 830 875 888 916 796 822 833 870 Sensitivity (RON-MON) -Lab 1 20 42 58 91 73 98 106 132 -Lab 2 10 52 70 90 76 107 110 111 -Lab 3 11 41 59 110 70 103 108 137 -Lab 4 33 55 101 88 107 114 -(RON)avg ndash (MON)avg 13 42 60 99 73 99 108 124 API Gravity (API˚) (ASTM D4052) -Lab 1 732 7069 6943 6523 5481 5416 5375 5247 -Lab 4 707 693 652 544 538 527 -Average 732 707 694 652 548 543 5377 526 Density (ASTM D4052) -Lab 1 06906 06991 07035 07186 07587 07614 07631 07684 -Lab 4 06997 07043 07192 07610 07636 07678 -Average 06994 07039 07189 07587 07612 07633 07681 RVP (psi) (D5191) Lab 1 75 86 85 83 76 88 87 84 Net Heat of Combustion (BTUlb) (ASTM D4809) 19186 18198 17955 16692 16265 Net Heat of Combustion (BTUlb) (ASTM D240) -Lab 1 19257 18375 18012 16739 18675 17891 17550 16369 -Lab 4 18576 17809 17408 16322 -Average 19257 18375 18012 16739 18625 17850 17479 16345
40
Table B1 Summary Data for FACE Gasoline Blends with Ethanol
Specific Tests FACE Gasoline Blend A B Target Ethanol Content 0 10 15 30 0 10 15 30 Ethanol Content (Vol) -ASTM D5599 0 1012 1469 2990 0 995 1473 3016 -Detailed Hydrocarbon Analysis - GCFID -Lab 1 0 1000 1463 3017 0 1001 1476 3014 Elemental Analysis (ASTM D 5291) -Carbon (wt) -Lab 1 8443 8178 7941 7306 8465 8172 8029 7346 -Lab 4 8433 8085 7823 7361 8471 8110 7921 7380 -Average 8438 8131 7882 7333 8468 8141 7975 7363 -Hydrogen (wt) -Lab 1 1543 1527 1484 1446 1473 1462 1442 1387 -Lab 4 1606 1573 1548 1515 1561 1540 1525 1487 -Average 1575 1550 1516 1481 1517 1501 1483 1437 -Oxygen (wt) (ASTM D5599) Lab 4 0 400 578 1150 0 389 571 1147
Specific Tests FACE Gasoline Blend C H Target Ethanol Content 0 10 15 30 0 10 15 30 Ethanol Content (Vol) -ASTM D5599 0 1018 1462 2949 0 1016 1459 3034 -Detailed Hydrocarbon Analysis - GCFID -Lab 1 0 1027 1483 2988 0 1021 1468 3040 Elemental Analysis (ASTM D 5291) -Carbon (wt) -Lab 1 8447 8200 7998 7336 8768 8402 8401 7624 -Lab 4 8419 8077 7909 7353 8720 8316 8150 7626 -Average 8433 8138 7954 7345 8744 8359 8276 7625 -Hydrogen (wt) -Lab 1 1494 1465 1465 1405 1205 1199 1207 1218 -Lab 4 1585 1668 1523 1509 1300 1305 1292 1316 -Average 1540 1567 1494 1457 1253 1252 1250 1267 -Oxygen (wt) (ASTM D5599) Lab 4 0 401 572 1129 0 368 527 1088
Table B1 Summary Data for FACE Gasoline Blends with Ethanol
41
Specific Tests FACE Gasoline Blend A B Target Ethanol Content 0 10 15 30 0 10 15 30 Distillation (˚F) (ASTM D86) Lab 1 IBP 90 106 99 99 97 105 103 101 5 122 127 122 126 133 128 126 129 10 140 134 131 135 149 135 134 138 20 165 145 144 146 175 147 146 149 30 186 153 152 153 196 155 154 155 40 198 159 156 156 209 165 159 159 50 204 202 159 158 214 211 165 161 60 207 208 204 159 218 217 214 162 70 210 211 210 160 221 219 219 163 80 213 214 213 161 226 225 224 165 90 219 222 219 211 236 234 234 230 95 228 233 229 224 248 247 246 242 FBP 262 261 263 260 280 271 270 266
Specific Tests FACE Gasoline Blend C H Target Ethanol Content 0 10 15 30 0 10 15 30 Distillation (˚F) (ASTM D86) Lab 1 IBP 93 104 102 107 98 96 105 106 5 126 126 123 130 127 123 125 127 10 139 131 131 136 143 132 134 138 20 157 140 140 145 170 145 147 152 30 174 147 147 151 194 153 156 159 40 188 153 153 156 213 167 161 163 50 201 183 157 159 229 217 182 166 60 210 208 176 161 243 236 235 169 70 218 217 215 162 263 255 253 175 80 227 226 223 165 291 283 282 268 90 245 244 241 233 329 322 323 312 95 274 274 269 261 357 351 351 343 FBP 330 331 322 324 408 401 407 396
42

9
Octane Sensitivity (S=RON‐MON) values are presented in the bar charts in Figure 33 The average sensitivities measured by the labs in this project are very close to those reported in CPChemrsquos COAs with the exception of Gasoline D The measured values for the three of the four high sensitivity fuels are quite a bit lower than the target value of 10 in the range of 59‐71 The exception is Gasoline G which comes close to meeting the target value Of the six low sensitivity fuels three (Gasolines A C and I) have values that meet the target value of le2 two have values that are slightly higher (Gasolines B and J) and one (Gasoline D) has a value that is significantly higher and in the range of the high sensitivity gasolines This discrepancy with Gasoline D is not surprising since it is very difficult to produce a low sensitivity fuel with a high level of aromatics which typically have high sensitivities Thus relative to the other manufactured FACE Gasolines Gasoline D should be considered a ldquohighrdquo sensitivity fuel
Figure 33 Octane Sensitivity Values of FACE Gasolines
312 Distillation Characteristics
The distillation properties of the fuels were determined by ASTM D86 (6) The D86 values obtained in
this study were very close to those reported on CPChemrsquos COAs The average of those two sources are
plotted in Figure 34 The values are also tabulated in Table A1 The temperature corresponding to a
given recovery fraction X is designated as TX (ie T90 indicates the temperature at which 90 of the
fuel has been vaporized and recovered) The initial boiling points (IBP) of all of the fuels are in a
relatively narrow range of 90‐110˚F In contrast the end boiling points (EBP) range from 253‐410˚F
Gasolines E G and H which are three of the four high sensitivity fuels have the highest EBPs Gasoline
E has a relatively steep increase in temperature of 140˚F from T90‐EBP Gasolines I and A the two fuels
having low sensitivity aromatics and n‐paraffin and low‐mid RON have the lowest EBPs Gasoline I
also has a relatively flat distillation profile from T30‐T90
100 100 100 100
04
34
13
72
63
59
107
71
05
3734
11
54
60
56
110
76
07
30
00
10
20
30
40
50
60
70
80
90
100
110
A B C D E F G H I J
Octan
e Sensitivity
Fuel
Octane Sensitivity
Target
AVG
CPChem
le2le2 le2 le2 le2 le2
‐01
10
Figure 34 ASTM D86 Distillation Curves for the FACE Gasolines
313 Reid Vapor Pressure (RVP)
The RVPs were determined using ASTM method D5191 (7) The values measured in this project were in
excellent agreement with those reported by CPChem COAs (within 01 psi) The averages of both values
are depicted in the bar charts in Figure 35 The values range from 67 to 805 psi
Figure 35 Reid Vapor Pressures of FACE Gasolines
500
1000
1500
2000
2500
3000
3500
4000
4500
0 10 20 30 40 50 60 70 80 90 100
Tempe
rature (˚ F)
Volume Distilled
D86 Distillation ‐ FACE Gasolines
A
B
C
D
E
F
G
H
I
J
805
735 745
680 670
780
725
755 760 750
0
1
2
3
4
5
6
7
8
9
A B C D E F G H I J
Reid Vap
or Pressure (p
si)
FACE Gasoline
Reid Vapor Pressure (RVP) ‐ FACE Gasolines
11
314 API Gravity and Density
The API gravities and densities of the fuels were measured using ASTM method D4052 (8) The
agreement between the values measured in this project and the values reported in the CPChem COAs
The individual values are listed in the Summary Table A1 in Appendix A The average of both values are
plotted in the bar charts in Figures 36 and 37 for API Gravity and density respectively As expected the
FACE Gasolines (D G H and J) having the highest aromatics content have the lowest API Gravities and
highest densities
Figure 36 API Gravities of FACE Gasolines
Figure 37 Densities of FACE Gasolines
7495
7135
7330
5870
6360
6860
54555580
7440
5910
0
5
10
15
20
25
30
35
40
45
50
55
60
65
70
75
80
A B C D E F G H I J
API G
ravity
FACE Gasoline
API Gravity ‐ FACE Gasolines
0685
0697
0691
0743
0725
0707
0760
0755
0697
0742
0645
065
0655
066
0665
067
0675
068
0685
069
0695
07
0705
071
0715
072
0725
073
0735
074
0745
075
0755
076
0765
077
A B C D E F G H I J
Density
(gml)
FACE Gasoline
Density ‐ FACE Gasolines
12
315 Net Heat of Combustion (NHC)
Net Heats of Combustion were measured using ASTM method D240 (9) The values are depicted in the
bar charts in Figure 38 In addition for two of the FACE Gasolines (C and J) the values were also
measured using ASTM method D4809 (10) The D4809 values were very close to those obtained from
method D240 (within 100 BTUlb) TheD240 values range from 18602 to 19251 BTUlb As expected
the FACE Gasolines having the highest aromatics content (D G H and J) have the lowest net heat of
combustion The FACE Gasolines having saturates content gt90 (A B C and I) have the highest net
heat of combustion
Figure 38 ASTM D240 Net Heats of Combustion of FACE Gasolines
19251
19187
19257
18649
18884
19072
1860218625
19225
18731
18200
18400
18600
18800
19000
19200
19400
A B C D E F G H I J
Net Heat o
f Com
bustion (BTU
lb) (A
STM D240)
FACE Gasoline
Net Heat of Combustion ‐ FACE Gasolines
13
32 CHEMICAL PROPERTIES OF FACE GASOLINES
The various types of hydrocarbons in the fuels were characterized by several techniques including
supercritical fluid chromatography (SFC) and detailed hydrocarbon analysis (DHA) by gas
chromatography using a flame ionization detector (GC‐FID) In addition the carbon hydrogen and
sulfur contents were measured Results are reported in the following sections
321 Aromatics by Supercritical Fluid Chromatography (SFC)
The SFC method of ASTM D5186 (11) separates the hydrocarbons into three fractions monoaromatics
polyaromatics and non‐aromatics and characterizes the composition in terms of mass Bar graphs of
the results are presented in Figure 39 Samples of FACE Gasolines B D E G and H were analyzed by
two labs The results from the two labs were very close to each other and so the averages are depicted
in the figure FACE Gasolines A B C and I have nonromatics levels gt90 wt FACE Gasolines D G and
H have the highest amounts of monoaromatics with values ranging from 394‐420 wt FACE
Gasolines E G and H appear to have about 1 wt polyaromatics
Figure 39 Compositions of FACE Gasolines by Supercritical Fluid Chromatography (ASTM D5186)
070 790 600
4175
14001000
39404200
040
3870
015
100
110125
030
9930
9210 9400
5810
85009000
59505675
9960
6100
0
10
20
30
40
50
60
70
80
90
100
A B C D E F G H I J
Composition (Wt )
FACE GASOLINE
SFC Composition ‐ FACE Gasolines
MonoAromatics PolyAromatics NonAromatics
14
322 Hydrocarbons by Detailed Hydrocarbon Analysis (DHA)
Detailed Hydrocarbon Analyses were performed by two labs using gas chromatography with flame
ionization detectors (GC‐FID) This technique enables the determination of concentration on a species‐
by‐species basis provided that retention factors have been determined for each species in the fuel The
results from both labs were very close to each other Bubble charts of the average concentration values
(in volume ) are depicted in Figure 310 for the low sensitivity fuels and Figure 311 for the high
sensitivity fuels on a carbon number basis for the five hydrocarbon classes n‐paraffins iso‐paraffins
naphthenes aromatics and olefins
In general the low sensitivity FACE Gasolines are characterized by large amounts of low sensitivity
components such as n‐paraffins and iso‐paraffins The high sensitivity FACE Gasolines contain more high
sensitivity components such as olefins and naphthenes than the low sensitivity fuels
The total concentration of components within each of the five hydrocarbon classes were added and the
sums are reported in the bar charts in Figure 312 The n‐paraffin levels range from 225‐316 vol for
the four FACE Gasolines (C D H and J) that had targets of 25 vol For the other FACE Gasolines that
had a target level of 5 vol the n‐paraffins levels range from 44‐117 vol The aromatics levels range
from 317‐358 vol for the four FACE Gasolines (D G H and J) that had targets of 35 vol For the
other six FACE Gasolines that had a target level of 5 vol the aromatics levels range from 0‐109 vol
The C7 aromatic is toluene the C8 aromatics consist of a mix of ethylbenzene and the xylene isomers
the C9 aromatics consist of a mix of trimethylbenzenes and methylethylbenzenes and the C10 aromatics
consist of a mix of tetramethylbenzenes dimethylethylbenzenes and methylpropylbenzenes FACE
Gasoline E a high sensitivity fuel has a naphthene content of 208 vol mainly cyclopentane and
cyclohexane Three other high sensitivity fuels (F G and H) have naphthenes concentrations of about
11 vol mainly cyclopentane Those high sensitivity fuels also have the highest olefins content with
concentrations ranging from 68‐127 vol FACE Gasoline I also has 64 vol olefins The C6 olefin is
1‐hexene The C5 olefins consist of a mix of 2‐pentene and methyl butenes In contrast to the high
sensitivity fuels Gasoline D which was designed to be low sensitivity but ended up in the high
sensitivity range has essentially no naphthenes or olefins Its high sensitivity is derived from its high
aromatics content
The C5 isoparaffin in all of the fuels is 2‐methylbutane The C6 isoparaffins consist of a mix of 2‐ and 3‐
methyl pentanes and 23 dimethyl butane The C7 isoparaffins in most of the FACE Gasolines consist of a
mix of 2‐ and 3‐methyl hexanes and 23‐ and 24‐dimethylpentanes The C8 isoparaffins are
predominantly trimethylpentanes with more than 50 of those being isooctane (224
trimethylpentane) The other isomers are mainly 24‐ and 25 dimethylhexanes and 2‐methyl 3‐ethyl
pentane
15
Figure 310 Detailed Hydrocarbon Analyses of Low Sensitivity FACE Gasolines
122 44 219 451 11
48 65
065
3 4 5 6 7 8 9 10 11
Carbon Number
FACE Gasoline A ‐ Detailed Hydrocarbon Analysis (vol)
isoparaffins
n‐paraffins
cycloparaffins
aromatics
olefins
104 13 137 587 16
59
39 37
3 4 5 6 7 8 9 10 11
Carbon Number
FACE Gasoline B ‐ Detailed Hydrocarbon Analysis (vol)
isoparaffins
cycloparaffins
aromatics
olefins
n‐paraffins
64 27 117 468 20 075
30 06
31 118 100
3 4 5 6 7 8 9 10 11
Carbon Number
FACE Gasoline C ‐ Detailed Hydrocarbon Analysis (vol)
isoparaffins
cycloparaffins
aromatics
olefins
n‐paraffins
12 410
99 35 150 46
47 114 70
3 4 5 6 7 8 9 10 11
Carbon Number
FACE Gasoline D ‐ Detailed Hydrocarbon Analysis (vol)
isoparaffins
cycloparaffins
aromatics
olefins
n‐paraffins
41 34 99 321 236 11
07 135
24
11
59
3 4 5 6 7 8 9 10 11
Carbon Number
FACE Gasoline I ‐ Detailed Hydrocarbon Analysis (vol)
isoparaffins
n‐paraffins
cycloparaffins
aromatics
olefins
327
90 124 95
22
14 131 145 29
06
3 4 5 6 7 8 9 10 11
Carbon Number
FACE Gasoline J ‐ Detailed Hydrocarbon Analysis (vol)
isoparaffins
n‐paraffins
cycloparaffins
aromatics
olefins
16
Figure 311 Detailed Hydrocarbon Analyses of High Sensitivity FACE Gasolines
64 68 143 165 18 07
70 105 19 10 04
46 17 18 16 08
21 82 09
29 06 37
3 4 5 6 7 8 9 10 11
Carbon Number
FACE Gasoline E ‐ Detailed Hydrocarbon Analysis (vol)
isoparaffins
cycloparaffins
aromatics
olefins
n‐paraffins
82 64 134 378 14
21 21
100
76
89
3 4 5 6 7 8 9 10 11
Carbon Number
FACE Gasoline F ‐ Detailed Hydrocarbon Analysis (vol)
isoparaffins
n‐paraffins
cycloparaffins
aromatics
olefins
65 66 72 152 16 10
74 09 16 10
15 33 218 54 14
36 25 10
37 07 10
3 4 5 6 7 8 9 10 11
Carbon Number
FACE Gasoline G ‐ Detailed Hydrocarbon Analysis (vol)
isoparaffins
cycloparaffins
aromatics
olefins
n‐paraffins
28 54 71 39 22 09
66 08 17 10
10 95 117 83 43 14
29 21 09
54 05 145 08
3 4 5 6 7 8 9 10 11
Carbon Number
FACE Gasoline H ‐ Detailed Hydrocarbon Analysis (vol)
isoparaffins
cycloparaffins
aromatics
olefins
n‐paraffins
17
Figure 312 Detailed Hydrocarbon Analyses Comparisons of FACE Gasolines
A comparison of the composition results from the DHA and SFC methods is presented in Figure 313 for
the low sensitivity fuels and Figure 314 for the high sensitivity fuels Also included are Fluorescent
Indicator Absorption (FIA ndash ASTM D1319 (12)) composition results reported on the CPChem COAs Since
the FIA method determines total saturates the DHA results for n‐paraffins iso‐paraffins and
naphthenes must be added together to enable the comparison between those two methods Similarly
since the SFC method directly measures aromatics and total non‐aromatics are determined by
difference the olefins amount must be added to the total saturate levels from FIA and DHA to enable
comparisons with the non‐aromatics values from SFC The appropriate comparison categories are
indicated by dashed lines in Figures 313 and 314 Of the three methods SFC generally gives the
highest level of aromatics and FIA the lowest The DHA aromatics values are closer to the FIA levels than
to the SFC levels The DHA olefins are fairly close to the FIA results
117
80
244 241
7944 67
225144
316
860
859
697
421
459
676
384
228
745336
16
01
01208
110
115105
33
23
13
127
94
8168
64
06
58 39
334
10977
336 358
12
317
0
10
20
30
40
50
60
70
80
90
100
A B C D E F G H I J
Composition ( vol)
FACE GASOLINE
DHA Composition ‐ FACE Gasolines
n‐paraffins isoparaffins naphthenes olefins aromatics
18
Figure 313 Comparison of Composition Methods FACE Low Sensitivity Gasolines
Figure 314 Comparison of Composition Methods FACE High Sensitivity Gasolines
117
80
244
144
316
860 859
697
745336
16
01 0433
23
13 64
06
58 3912
317
996951 975
929
712
04
07 04 62
10
42 21 09
278
993
921 940996
610
07
79 6004
390
0
10
20
30
40
50
60
70
80
90
100
DHA FIA SFC DHA FIA SFC DHA FIA SFC DHA FIA SFC DHA FIA SFC
Composition ( )
FACE GASOLINE
Composition ‐ Low Sensitivity FACE Gasolines
n‐paraffins isoparaffins naphthenes olefins aromatics saturates nonaromatics
A B C I J
241
7944 67
225
421
459
676
384
228
01
208
110
115 105
127
94
81 68
334
10977
336 358
701
780
856
587 568
04
99
86
7879
295
12158
335 353
581
850900
595568
419
150100
405432
0
10
20
30
40
50
60
70
80
90
100
DHA FIA SFC DHA FIA SFC DHA FIA SFC DHA FIA SFC DHA FIA SFC
Composition ( )
FACE GASOLINE
Composition ‐ High Sensitivity FACE Gasolines
n‐paraffins isoparaffins naphthenes olefins aromatics saturates nonaromatics
D E F G H
19
323 Elemental Analyses
Carbon and hydrogen contents were measured by two labs using ASTM method D5291 (13) The
average results are presented in the bar graphs in figure 315 The carbon contents range from 8399‐
8748 wt and the hydrogen contents range from1252‐1601 wt As expected the FACE Gasolines
having the highest aromatics content (D G H and J) have the highest carbon and lowest hydrogen
contents
Figure 315 Carbon and Hydrogen Elemental Analyses of FACE Gasolines
8399 8443 8453 8646 8547 8496 8670 87488414 8624
1601 1557 1547 1354 1453 1504 1330 12521586 1376
0
10
20
30
40
50
60
70
80
90
100
A B C D E F G H I J
Compo
sition
(wt)
FACE Gasoline
Carbon‐Hydrogen Elemental Analyses
Hydrogen
Carbon
20
Sulfur content was measured by one lab ASTM method D5453 (14) The results displayed in the bar
charts in Figure 316 are essentially identical to the values reported on the CPChem COAs All FACE
Gasolines had ultra‐low sulfur levels FACE Gasolines E G and H had the highest levels at 21 22 and 15
ppm sulfur The other fuels had levels ranging from 2‐6 ppm
Figure 316 Sulfur Levels of FACE Gasolines
6
4 4
2
21
2
22
15
2 2
0
5
10
15
20
25
A B C D E F G H I J
Sulfur Content (p
pm)
FACE Gasoline
Sulfur Content ‐ FACE Gasolines
21
4 ANALYTICAL RESULTS FOR FACE GASOLINES BLENDED WITH ETHANOL
Although the FACE Gasolines were not formulated with ethanol the expectation is that some potential
users will be interested in testing the fuels with ethanol added To assist selection of fuels for those
studies four FACE Gasolines were selected for blending with levels of 10 15 and 30 vol ethanol The
fuels selected for this purpose were A B C and H The positions of these fuels in the design matrix are
shown below
In this section results of the analyses of the ethanol blends are discussed Chevron Phillips 66 BP and
a contract laboratory conducted the analyses As mentioned previously future production runs that are
required to remake fuels that sell out likely will results in some changes to the fuel property values
reported here
41 ASTM TEST RESULTS
ASTM methods were used to measure the ethanol content RON MON API gravity density distillation
profiles RVP and net heats of combustion of all of the ethanol blends made with the FACE Gasolines
The results of these analyses are summarized below and in Table A2 located in the Appendix
411 Ethanol Content
FACE Gasolines A B C and H were blended with nominally 10 15 and 30 vol ethanol The
concentration of ethanol in each blend were determined using ASTM method D5599 (15) (coupled with
ASTM D4052 density measurement) and by detailed hydrocarbon analysis using gas chromatography
with a flame ionization detector The results for both methods were in excellent agreement for all fuels
as shown below in Table 41
Table 41 Measured Ethanol Content of FACE Gasoline Blends
Ethanol Content (vol)
A B C H
10 15 30 10 15 30 10 15 30 10 15 30
D5599 101 147 299 100 147 302 102 146 295 102 146 303
DHA 100 146 301 100 148 301 103 148 299 102 147 304
22
412 RON MON and Octane Sensitivity
RON values were measured in CFR engines per ASTM method D2699 (4) Although the measurements
were conducted in four labs the lab‐to‐lab reproducibility was very good so only the average values are
reported here (but individual values are reported in Table A2) Average RON values for each fuel are
presented in Figure 41 For all four of these FACE Gasolines the RON values continue to increase even
at the 30 ethanol level although the rates of increase are lower than at lower ethanol levels FACE
Gasoline B has the highest RON at all ethanol levels with a value of about 106 at the 30 ethanol level
FACE Gasolines A and C have essentially the same RON values at all ethanol levels with RON values of
about 102 at the 30 ethanol level FACE Gasoline H without ethanol has a higher RON than A and C
but a lower RON at the 15 and 30 ethanol levels
Figure 41 RON Values of FACE Gasoline Blends with Ethanol
MON values were measured in CFR engines per ASTM method D2700 (5) Although the measurements were conducted in four labs the lab‐to‐lab reproducibility was very good so only the average values are reported here (but individual values are reported in Appendix A2) The MON values for each fuel are
presented in Figure 42 FACE Gasoline B has the highest MON values at all ethanol levels but unlike the other FACE Gasolines the MON value did not increase with ethanol contents above 10 vol The MON values for FACE Gasolines A and C were essentially the same and higher than those for FACE Gasoline H
80081082083084085086087088089090091092093094095096097098099010001010102010301040105010601070108010901100
0 5 10 15 20 25 30 35
RON
Ethanol (vol)
RON Values ‐ FACE Gasoline + Ethanol Blends
FACE A
FACE B
FACE H
FACE C
23
Figure 42 MON Values of FACE Gasoline Blends with Ethanol
Octane Sensitivity (S=RON‐MON) values are presented in Figure 43 As expected due to the relatively high sensitivity of ethanol the sensitivities of all four FACE Gasolines increase as the ethanol content increases FACE Gasoline H has the highest sensitivity at all ethanol levels except at 30 vol ethanol where the sensitivity of the FACE Gasoline B blend becomes slightly higher with values of 124 and 132 respectively The sensitivities for FACE Gasolines A and C are very similar to each other and although lower than the blends for the other FACE Gasolines have the highest rates of increase at the 30 level
Figure 43 Octane Sensitivities FACE Gasoline Blends with Ethanol
750
760
770
780
790
800
810
820
830
840
850
860
870
880
890
900
910
920
930
940
950
0 5 10 15 20 25 30 35
MON
Ethanol (vol)
MON Values ‐ FACE Gasoline + Ethanol Blends
FACE A
FACE B
FACE H
FACE C
00
10
20
30
40
50
60
70
80
90
100
110
120
130
140
0 5 10 15 20 25 30 35
S
Ethanol (vol)
Octane Sensitivity (S) ‐ FACE Gasoline + Ethanol Blends
FACE A
FACE B
FACE H
FACE C
24
413 Distillation Characteristics
The distillation properties of the fuels were determined by ASTM D86 (6) The values are plotted in
Figure 44 and tabulated in Table A2 in the Appendix The behavior and shapes of the curves are very
similar For a given gasoline all of the ethanol blends start at about the same IBP The blends
containing ethanol then follow the same curve which is lower than the base gasoline At a certain point
the ethanol blends then rise quickly to rejoin the distillation curve of the base gasoline The lower the
ethanol content of the blend the earlier (lower distilled volume ) the curve rejoins the base gasoline
curve
Figure 44 ASTM D86 Distillation Profiles for FACE Gasoline Blends with Ethanol
50
100
150
200
250
300
0 10 20 30 40 50 60 70 80 90 100
Temperature (˚ C)
Volume Distilled
D86 Distillation ‐ FACE A Gasoline + Ethanol Blends
0 EtOH
10 EtOH
15 EtOH
30 EtOH
50
100
150
200
250
300
0 10 20 30 40 50 60 70 80 90 100
Temperature (˚ C)
Volume Distilled
D86 Distillation ‐ FACE B Gasoline + Ethanol Blends
0 EtOH
10 EtOH
15 EtOH
30 EtOH
50
100
150
200
250
300
350
0 10 20 30 40 50 60 70 80 90 100
Temperature (˚ C)
Volume Distilled
D86 Distillation ‐ FACE C Gasoline + Ethanol Blends
0 EtOH
10 EtOH
15 EtOH
30 EtOH
50
100
150
200
250
300
350
400
450
0 10 20 30 40 50 60 70 80 90 100
Temperature (˚ C)
Volume Distilled
D86 Distillation ‐ FACE H Gasoline + Ethanol Blends
0 EtOH
10 EtOH
15 EtOH
30 EtOH
25
414 Reid Vapor Pressure (RVP)
The RVPs were determined using ASTM method D5191 (7) The values are plotted in Figure 45 For all
fuels the RVP appears to peak between 10 and 15 vol ethanol and then starts to decrease as the
ethanol content increases further
Figure 45 Reid Vapor Pressures for FACE Gasoline Blends with Ethanol
415 API Gravity and Density
The API gravities and densities of the fuels were measured by two labs using ASTM method D4052 (8) The values from the two labs were in excellent agreement and are listed in Table A2 The average density values are presented in Figure 46 For all of the FACE Gasolines the density increased as the ethanol content increased
Figure 46 Densities of FACE Gasoline Blends with Ethanol
7
75
8
85
9
95
10
0 5 10 15 20 25 30 35
RVP (psi)
Ethanol (vol)
Reid Vapor Pressure (RVP) ‐ FACE Gasoline + Ethanol Blends
FACE A
FACE B
FACE H
FACE C
0685 0697 0691
0759
0696 0705 0699
0761
0700 0710 0704
0763
0716 0724 0719
0768
0
01
02
03
04
05
06
07
08
09
1
A B C H
Density
(gm
l)
Ethanol (vol)
Density ‐ FACE Gasoline Blends with Ethanol
0
10
15
30
26
416 Net Heat of Combustion (NHC)
Net Heats of Combustion were measured by 2 labs using ASTM method D240 (9) For some fuels ASTM
method D4809 (10) was also used The values from both labs and both methods were very close to each
other and the average values are plotted in Figure 47 As expected since the net heat of combustion of
ethanol is lower than that of gasoline for all FACE Gasolines the net heat of combustion decreased as
ethanol content increased The decrease appeared to be linear with ethanol content The decrease
appeared to be steepest for FACE Gasoline B
Figure 47 Net Heat of Combustion of FACE Gasoline Blends with Ethanol
16000
16250
16500
16750
17000
17250
17500
17750
18000
18250
18500
18750
19000
19250
19500
0 5 10 15 20 25 30 35
Net Heat of C
ombustion (B
TUlb)
Ethanol (vol)
Net Heat of Combustion ‐ FACE Gasoline + Ethanol Blends
FACE A
FACE B
FACE H
FACE C
27
5 SUMMARY AND CONCLUSIONS
A subteam of the CRC AVFL FACE Working Group has designed a matrix of reference gasolines
known as the FACE Gasolines A commercial vendor has produced and made the fuels available
for purchase in research quantities It is expected that this will enable consistent comparisons
of engine and combustion results from different laboratories and test platforms based on the
use of the same set of fuels
The matrix is designed around four parameters expected to be of importance for advanced
gasoline engines RON octane sensitivity aromatics content and n‐paraffins content
Statistical methods were used to identify potential candidate formulations and down‐select to a
tractable number of 10 formulations
Detailed analyses were performed on the physical and chemical properties of the final fuel
formulations
Generally the property values measured in the current study agreed very well with the values
reported on the fuel blender (ChevronPhillips Chemical Company ‐ CPChem) Certificates of
Analyses (COAs)
As expected conflicts in the target properties for some of the fuels (such as high aromatics level
coupled with low octane sensitivity) led to some trade‐offs that resulted in some deviation in
the actual properties from the design properties
The RON values come close to meeting the targets for most of the fuels Fuels E H and J have
values that are 24‐38 units higher than the targets
Three of the four ldquohighrdquo sensitivity fuels have measured values of 59‐71 that are lower than
the target value of 10 Two of the ldquolowrdquo sensitivity fuels have measured values (34‐37) that are
a bit higher than the target value of le2 One of the low sensitivity design fuels (ldquoDrdquo) has a value
of 72 that actually effectively makes it a high sensitivity fuel
Detailed hydrocarbon analyses (DHA) indicate that the n‐paraffins contents range from 225‐
316 vol for the four FACE Gasolines that had targets of 25 vol and from 44‐117 vol for
the six FACE Gasolines that had targets of 5 vol
DHAs indicate that the aromatics contents range from 317‐358 vol for the four FACE
Gasolines that had a target of 35 vol and 0‐109 vol for the other fuels that had a target of 5
vol
The high sensitivity fuels contained the high sensitivity components of naphthenes (105‐208
vol) and olefins (68‐127 vol) The exception was Gasoline ldquoDrdquo which had neither of these
components but whose high sensitivity was derived from aromatics components
Five of the FACE Gasolines (ldquoArdquo ldquoBrdquo ldquoCrdquo ldquoFrdquo and ldquoIrdquo) are very rich in isoparaffins with contents ge
676 vol
Aromatics values determined by SFC were generally higher than the values obtained from DHA
The DHA olefins values were close to the FIA values reported on the CPChem COAs
The fuels having the highest aromatics content also have the highest densities and highest net
heats of combustion on an energy content per volume basis
With regards to distillation properties for all fuels the initial boiling points (IBPs) are in a
narrow range of 90‐110˚F although the end boiling points (EBPs) range from 253‐410˚F Three
28
of the high sensitivity fuels have the highest EBPs The two low‐mid RON fuels having low n‐
paraffins and low aromatics have the lowest EBPs
All of the FACE Gasolines have ultra‐low levels of sulfur with the highest value at 22 ppm S and
most fuels having le 6 ppm S
For the four FACE Gasolines blended with ethanol RON continues to increase as the ethanol
levels increase to 30 vol although the rate of increase is lower as the ethanol content
increases FACE Gasoline B which has the highest RON of 96 has the highest RON at all ethanol
levels with a value of about 106 at 30 ethanol At the same ethanol level FACE Gasolines A
and C have essentially the same RON values FACE Gasoline H starts with a higher RON value
than those of A or C but has a lower value at blend levels of 15 and 30 vol
MON increased as the ethanol level increased for FACE Gasolines A C and H The MON values
for these fuels were essentially constant even though the highest MON values were found for
the ethanol blends with FACE Gasoline B
For all blends octane sensitivity increased as ethanol content increased with the highest values
of 12‐13 for 30 vol ethanol blends with FACE Gasolines B and H
The D86 distillation curve trends are similar for the four FACE Gasolines For a given gasoline all
blends start at the same point At around 10 vol distilled the curves for the blends with
ethanol diverge from and are lower than the curves for the base gasolines At a certain point
the distillation curves for the blends rise quickly and re‐join the curve for the parent base fuel
The distillation curves for the 30 vol ethanol blends are generally flat as a function of
increasing vol distilled and only start to increase again at about 70‐80 vol distilled when
most of the ethanol has been distilled from the liquid
The Reid Vapor Pressures (RVPs) peak at about 10‐15 vol
Densities increase slightly as ethanol increases while net heats of combustion decrease
29
6 REFERENCES
1 Alnajjar M Cannella B Dettman H Fairbridge C Franz J Gallant T Gieleciak R Hager D Lay C Lewis S Ratcliff M Sluder S Storey J Yin H Zigler B ldquoChemical and Physical Properties of the Fuels for Advanced Combustion Engines (FACE) Research Diesel Fuelsrdquo CRC Report No FACE‐1 (2010)
2 Gallant T Franz J Alnajjar M Storey J Lewis S Sluder S Cannella W Fairbridge C Hager D Dettman H Luecke J Ratcliff M Zigler ldquoFuels for Advanced Combustion Engines Research Diesel Fuels Analysis of Physical and Chemical Propertiesrdquo SAE Paper 2009‐01‐2769 (2009)
3 CannellaW Fairbridge C Arboleda P Bays T Dettman H Foster M Gieleciak R Gunter G Hager D Lay C Lewis S Luecke J Sluder S Zigler B ldquoDetailed Characterization of the Physical and Chemical Properties of the Reformulated FACE Diesel Fuels FD2B FD4B and FD7Brdquo CRC Report AVFL‐19‐1 (2013)
4 ASTM International Standard Test Method for Research Octane Number of Spark‐Ignition Engine Fuel ASTM D2699 (ASTM International Pennsylvania 2009)
5 ASTM International Standard Test Method for Motor Octane Number of Spark‐Ignition Engine Fuel ASTM D2700 (ASTM International Pennsylvania 2009)
6 ASTM International Standard Test Method for Distillation of Petroleum Products at Atmospheric Pressure ASTM D86‐09e1 (ASTM International Pennsylvania 2009)
7 ASTM International Standard Test Method for Vapor Pressure of Petroleum Products (Mini‐Method) ASTM D5191 (ASTM International Pennsylvania 2009)
8 ASTM International Standard Test Method for Density and Relative Density of Liquids by Digital Density Meter ASTM D4052‐96(2002)e1 (ASTM International Pennsylvania 2002)
9 ASTM International Standard Test Method for Heat of Combustion of Liquid Hydrocarbon Fuels by Bomb Calorimeter ASTM D240‐02(2007) (ASTM International Pennsylvania 2007)
10 ASTM International Standard Test Method for Heat of Combustion of Liquid Hydrocarbon Fuels by Bomb Calorimeter ASTM D4809 (2007) (ASTM International Pennsylvania 2007)
11 ASTM International Standard Test Method for Determination of Aromatic Content and Polynuclear Aromatic Content of Diesel Fuels and Aviation Turbine Fuels by Supercritical Fluid Chromatography ASTM D5186‐03(2009) (ASTM International Pennsylvania 2009)
12 ASTM International Standard Test Method for Hydrocarbon Types in Liquid Petroleum Products by Fluorescent Indicator Adsorption ASTM D1319‐08 (ASTM International Pennsylvania 2008)
13 ASTM International Standard Test Methods for Instrumental Determination of Carbon Hydrogen and Nitrogen in Petroleum Products and Lubricants ASTM D5291‐02(2007) (ASTM International Pennsylvania 2007)
14 ASTM International Standard Test Methods for Determination of Total Sulfur in Light Hydrocarbons Spark‐Ignition Engine Fuel Diesel Engine Fuel and Engine Oil by Ultraviolet Fluorescence ASTM D5453(2007) (ASTM International Pennsylvania 2007)
15 ASTM International Standard Test Methods for Determination of Oxygenates in Gasoline by Gas Chromatography and Oxygen Selective Flame Ionization Detection ASTM D5599 (2007) (ASTM International Pennsylvania 2007)
30
31
Appendix A
Properties of FACE Gasolines
32
Table A1 Summary Data for FACE Gasolines
Specific Tests FACE Gasoline A B C D E F G H I J Research Octane Number (RON) (ASTM D2699) -Lab 1 843 958 850 946 871 940 969 870 700 738 -Lab 2 839 960 840 939 877 960 869 -Lab 3 835 957 840 -Average 839 958 843 942 874 940 965 869 7015 738 -CPChem COA 835 960 847 932 875 944 968 869 703 718 Motor Octane Number (MON) (ASTM D2700) -Lab 1 836 923 830 872 813 881 857 797 695 701 -Lab 2 833 931 830 868 808 860 799 -Lab 3 835 919 829 -Average 835 924 830 870 811 881 858 798 695 701 -CPChem COA 836 926 836 878 815 888 858 793 696 688 Sensitivity (RON-MON) -Lab 1 07 35 20 74 58 59 112 73 05 37 -Lab 2 06 29 10 71 69 100 70 -Lab 3 0 38 11 -Average 04 34 13 72 63 59 107 72 05 37 -CPChem COA -01 34 11 54 60 56 110 76 07 30 API Gravity (API˚) (ASTM D4052) -CPChem COA 750 714 734 587 636 686 545 568 744 595 -Lab 1 749 713 732 587 636 686 546 548 744 587 -Average 7495 7135 733 587 636 686 5455 558 744 591 Density (ASTM D4052) -CPChem COA 0691 0743 0725 0707 0760 0697 0741 -Lab 1 0685 0697 0691 0743 0725 0707 0760 0759 0697 0743 -Average 0685 0697 0691 0743 0725 0707 0760 0759 0697 0742 RVP (psi) (D5191) -CPChem COA 81 74 74 68 67 78 72 75 75 75 -Lab 1 80 73 75 73 76 77 Net Heat of Combustion (BTUlb) (ASTM D4809) 19186 18680 Net Heat of Combustion (BTUlb) (ASTM D240) 19251 19187 19257 18649 18884 19072 18602 18625 19225 18731
33
TableA1 Summary Data for FACE Gasolines
Specific Tests FACE Gasoline A B C D E F G H I J Distillation (˚F) (ASTM D86) -CPChem IBP 93 95 95 88 110 108 93 94 100 101
5 104 128 120 129 131 129 122 123 123 111 10 132 145 136 148 142 142 135 140 156 162 20 160 172 154 176 155 156 158 168 177 206 30 183 194 171 198 166 168 183 192 186 217 40 197 207 187 212 177 180 210 211 191 224 50 203 213 200 221 186 193 240 227 195 231 60 207 216 210 229 197 206 270 242 199 242 70 210 220 218 235 208 217 306 262 203 261 80 213 225 226 280 222 225 328 291 207 291 90 219 235 243 330 267 240 343 327 213 316 95 227 248 270 340 343 261 363 358 220 330 FBP 269 283 328 363 405 294 403 410 259 358
-Lab 1 IBP 90 97 93 97 107 102 99 98 99 95 5 122 133 126 133 134 134 122 127 139 111
10 140 149 139 151 143 144 136 143 160 166 20 165 175 157 179 156 157 158 170 178 209 30 186 196 174 200 168 169 182 194 187 219 40 198 209 188 214 177 182 209 213 192 225 50 204 214 201 224 188 195 238 229 196 232 60 207 218 210 234 197 207 268 243 200 242 70 210 221 218 248 208 218 304 263 204 263 80 213 226 227 288 224 228 328 291 208 292
90 219 236 245 331 258 243 343 329 213 316 95 228 248 274 341 329 261 358 357 220 330 FBP 262 280 330 365 402 291 405 408 247 357
-Average IBP 915 96 94 925 1085 105 96 96 995 98 5 113 1305 123 131 1325 1315 122 125 131 111
10 136 147 1375 1495 1425 143 1355 1415 158 164 20 1625 1735 1555 1775 1555 1565 158 169 1775 203 30 1845 195 1725 199 167 1685 1825 193 1865 218 40 1975 208 1875 213 177 181 2095 212 1915 2245 50 2035 2135 2005 2225 187 194 239 228 1955 2315 60 207 217 210 2315 197 2065 269 2425 1995 242 70 210 2205 218 2415 208 2175 305 2625 2035 262 80 213 2255 2265 284 223 2265 328 291 2075 2915
90 219 2355 244 3305 2625 2415 343 328 213 316 95 2275 248 272 3405 336 261 3605 3575 220 330 FBP 2655 2815 329 364 4035 2925 404 409 253 3575
34
Table A1 Summary Data for FACE Gasolines
Specific Tests FACE Gasoline A B C D E F G H I J Elemental Analysis (ASTM D 5291) -Carbon (wt) -Lab 1 8398 8441 8497 8647 8547 8671 8792 8415 -Lab 4 8400 8444 8419 8645 8547 8496 8669 8703 8414 8624 -Average 8399 8443 8458 8646 8547 8496 8670 8748 8414 8624 -Hydrogen (wt) -Lab 1 1602 1559 1503 1353 1453 1329 1208 1585 -Lab 4 1600 1556 1585 1355 1453 1504 1331 1297 1586 1376 -Average 1601 1557 1547 1354 1453 1504 1330 1252 1586 1376 Sulfur by UV Fluorescence (ppmw) (ASTM D5453) -CPChem COA 4 4 3 2 21 2 20 15 2 2 -Lab 4 6 4 4 2 21 2 22 15 2 2 Hydrocarbons by FIA (vol) (ASTM D1319) -Aromatics (vol) CPChem COA 0 42 21 295 121 58 335 353 09 278 -Olefins (vol) CPChem COA 04 07 04 04 99 86 78 79 62 10 -Saturates (vol) CPChem COA 996 951 975 701 780 856 587 568 929 712 Aromatics by SFC (ASTM D5186) (Lab 1) -MonoAromatics (wt) -Lab 1 07 78 60 414 142 100 393 412 04 387 -Lab 2 80 421 138 395 428 -Average 07 79 60 4175 140 100 394 420 04 387 -PolyAromatics (wt) -Lab 1 0 0 0 03 11 0 10 10 0 03 -Lab 2 0 0 09 12 15 -Average 0 0 0 015 10 0 11 125 0 03 -NonAromatics (wt) -Lab 1 993 922 940 583 847 900 597 578 996 610 -Lab 2 920 579 850 593 557 -Average 993 921 940 581 8475 900 595 5675 996 610
35
Table A1 Summary Data for FACE Gasolines
Specific Tests FACE Gasolines A B C D E F G H I J Detailed Hydrocarbon Analyses by GC-FID -n-paraffins (vol) (Targets) (5) (5) (25) (25) (5) (5) (5) (25) (5) (25) -Lab 1 1144 783 2409 2346 771 434 662 2214 1441 3115 -Lab 2 1187 815 2476 2473 803 446 685 2283 1437 3212 -Average 1165 799 2443 2410 787 440 673 2249 1439 3164 -iso-paraffins (vol) -Lab 1 8562 8591 688 4206 4563 6765 3821 2322 7449 3362 -Lab 2 8635 8586 7066 4221 4621 6747 3864 2240 7459 3366 -Average 8599 8688 6973 4213 4592 6756 3843 2281 7454 3364 -cyclo-paraffins (vol) -Lab 1 192 021 048 010 2216 1078 1163 1035 324 234 -Lab 2 130 007 023 010 1945 1118 1140 1066 336 224 -Average 161 014 036 010 2081 1098 1152 1050 330 229 -aromatics (vol) (Targets) (5) (5) (5) (35) (5) (5) (35) (35) (5) (35) -Lab 1 073 601 409 3425 1121 805 3419 3597 120 3212 -Lab 2 003 568 374 3258 1062 739 3306 3555 110 3125 -Average 38 584 392 3341 1092 772 3363 3576 115 3169 -olefins (vol) -Lab 1 024 001 248 004 1146 978 851 714 643 066 -Lab 2 018 003 006 005 1392 905 771 650 627 054 -Average 021 002 127 04 1269 942 811 682 635 060
36
37
Appendix B
Properties of FACE Gasoline Blends with Ethanol
38
Table B1 Summary Data for FACE Gasoline Blends with Ethanol
Specific Tests FACE Gasoline Blend A B Ethanol Content (Vol ) 0 10 15 30 0 10 15 30 Ethanol Content (Vol ) (ASTM D5599) 0 1012 1469 2990 0 995 1473 3016 Research Octane Number (RON) (ASTM D2699) -Lab 1 843 922 951 1032 958 1015 1039 1067 -Lab 2 839 923 951 1017 960 1008 1023 1050 -Lab 3 835 917 946 1025 957 1012 1031 1069 -Lab 4 916 945 1018 1009 1026 1053 -Average 839 920 948 1023 958 1011 1030 1060 Motor Octane Number (MON) (ASTM D2700) -Lab 1 836 878 890 912 923 936 936 934 -Lab 2 833 874 891 917 931 935 934 931 -Lab 3 835 881 893 911 919 933 934 933 -Lab 4 884 901 916 935 936 933 -Average 835 879 894 914 924 935 935 933 Sensitivity (RON-MON) -Lab 1 07 44 61 120 35 79 103 133 -Lab 2 06 49 60 100 29 73 89 119 -Lab 3 0 36 53 114 38 79 97 136 -Lab 4 32 44 102 74 91 120 -Average 04 41 54 109 34 76 95 127 API Gravity (API˚) (ASTM D4052) -Lab 1 749 7164 7066 661 7131 690 6772 6375 -Lab 4 716 706 660 690 676 638 -Average 749 7162 7063 6605 7131 690 6766 6377 Density (ASTM D4052) -Lab 1 06849 06959 06992 07154 0697 07050 07096 07240 -Lab 4 06966 06999 07161 07055 07106 07244 -Average 06849 06963 06996 07158 0697 07053 07101 07242 RVP (psi) (D5191) Lab 1 83 95 94 91 73 87 86 83 Net Heat of Combustion (BTUlb) (ASTM D4809) 18308 Net Heat of Combustion (BTUlb) (ASTM D240) -Lab 1 19266 18294 18080 16751 19207 18319 17941 16631 -Lab 4 19236 18208 17963 16487 19168 18307 17696 16234 -Average 19251 18251 18021 16619 19187 18313 17818 16432
39
Table B1 Summary Data for FACE Gasoline Blends with Ethanol
Specific Tests FACE Gasoline Blend C H Target Ethanol Content (Vol ) 0 10 15 30 0 10 15 30 Ethanol Content (Vol) (ASTM D5599) 0 1018 1462 2949 0 1016 1459 3034 Research Octane Number (RON) (ASTM D2699) -Lab 1 850 918 951 1012 870 919 941 993 -Lab 2 840 920 950 1014 869 927 941 996 -Lab 3 840 917 946 1019 869 920 937 995 -Lab 4 914 945 1015 916 946 991 -Average 843 917 948 1015 869 921 941 994 Motor Octane Number (MON) (ASTM D2700) -Lab 1 830 876 893 921 797 821 835 861 -Lab 2 830 868 880 924 793 820 831 885 -Lab 3 829 876 887 909 799 817 829 858 -Lab 4 881 890 914 828 839 877 -Average 830 875 888 916 796 822 833 870 Sensitivity (RON-MON) -Lab 1 20 42 58 91 73 98 106 132 -Lab 2 10 52 70 90 76 107 110 111 -Lab 3 11 41 59 110 70 103 108 137 -Lab 4 33 55 101 88 107 114 -(RON)avg ndash (MON)avg 13 42 60 99 73 99 108 124 API Gravity (API˚) (ASTM D4052) -Lab 1 732 7069 6943 6523 5481 5416 5375 5247 -Lab 4 707 693 652 544 538 527 -Average 732 707 694 652 548 543 5377 526 Density (ASTM D4052) -Lab 1 06906 06991 07035 07186 07587 07614 07631 07684 -Lab 4 06997 07043 07192 07610 07636 07678 -Average 06994 07039 07189 07587 07612 07633 07681 RVP (psi) (D5191) Lab 1 75 86 85 83 76 88 87 84 Net Heat of Combustion (BTUlb) (ASTM D4809) 19186 18198 17955 16692 16265 Net Heat of Combustion (BTUlb) (ASTM D240) -Lab 1 19257 18375 18012 16739 18675 17891 17550 16369 -Lab 4 18576 17809 17408 16322 -Average 19257 18375 18012 16739 18625 17850 17479 16345
40
Table B1 Summary Data for FACE Gasoline Blends with Ethanol
Specific Tests FACE Gasoline Blend A B Target Ethanol Content 0 10 15 30 0 10 15 30 Ethanol Content (Vol) -ASTM D5599 0 1012 1469 2990 0 995 1473 3016 -Detailed Hydrocarbon Analysis - GCFID -Lab 1 0 1000 1463 3017 0 1001 1476 3014 Elemental Analysis (ASTM D 5291) -Carbon (wt) -Lab 1 8443 8178 7941 7306 8465 8172 8029 7346 -Lab 4 8433 8085 7823 7361 8471 8110 7921 7380 -Average 8438 8131 7882 7333 8468 8141 7975 7363 -Hydrogen (wt) -Lab 1 1543 1527 1484 1446 1473 1462 1442 1387 -Lab 4 1606 1573 1548 1515 1561 1540 1525 1487 -Average 1575 1550 1516 1481 1517 1501 1483 1437 -Oxygen (wt) (ASTM D5599) Lab 4 0 400 578 1150 0 389 571 1147
Specific Tests FACE Gasoline Blend C H Target Ethanol Content 0 10 15 30 0 10 15 30 Ethanol Content (Vol) -ASTM D5599 0 1018 1462 2949 0 1016 1459 3034 -Detailed Hydrocarbon Analysis - GCFID -Lab 1 0 1027 1483 2988 0 1021 1468 3040 Elemental Analysis (ASTM D 5291) -Carbon (wt) -Lab 1 8447 8200 7998 7336 8768 8402 8401 7624 -Lab 4 8419 8077 7909 7353 8720 8316 8150 7626 -Average 8433 8138 7954 7345 8744 8359 8276 7625 -Hydrogen (wt) -Lab 1 1494 1465 1465 1405 1205 1199 1207 1218 -Lab 4 1585 1668 1523 1509 1300 1305 1292 1316 -Average 1540 1567 1494 1457 1253 1252 1250 1267 -Oxygen (wt) (ASTM D5599) Lab 4 0 401 572 1129 0 368 527 1088
Table B1 Summary Data for FACE Gasoline Blends with Ethanol
41
Specific Tests FACE Gasoline Blend A B Target Ethanol Content 0 10 15 30 0 10 15 30 Distillation (˚F) (ASTM D86) Lab 1 IBP 90 106 99 99 97 105 103 101 5 122 127 122 126 133 128 126 129 10 140 134 131 135 149 135 134 138 20 165 145 144 146 175 147 146 149 30 186 153 152 153 196 155 154 155 40 198 159 156 156 209 165 159 159 50 204 202 159 158 214 211 165 161 60 207 208 204 159 218 217 214 162 70 210 211 210 160 221 219 219 163 80 213 214 213 161 226 225 224 165 90 219 222 219 211 236 234 234 230 95 228 233 229 224 248 247 246 242 FBP 262 261 263 260 280 271 270 266
Specific Tests FACE Gasoline Blend C H Target Ethanol Content 0 10 15 30 0 10 15 30 Distillation (˚F) (ASTM D86) Lab 1 IBP 93 104 102 107 98 96 105 106 5 126 126 123 130 127 123 125 127 10 139 131 131 136 143 132 134 138 20 157 140 140 145 170 145 147 152 30 174 147 147 151 194 153 156 159 40 188 153 153 156 213 167 161 163 50 201 183 157 159 229 217 182 166 60 210 208 176 161 243 236 235 169 70 218 217 215 162 263 255 253 175 80 227 226 223 165 291 283 282 268 90 245 244 241 233 329 322 323 312 95 274 274 269 261 357 351 351 343 FBP 330 331 322 324 408 401 407 396
42

10
Figure 34 ASTM D86 Distillation Curves for the FACE Gasolines
313 Reid Vapor Pressure (RVP)
The RVPs were determined using ASTM method D5191 (7) The values measured in this project were in
excellent agreement with those reported by CPChem COAs (within 01 psi) The averages of both values
are depicted in the bar charts in Figure 35 The values range from 67 to 805 psi
Figure 35 Reid Vapor Pressures of FACE Gasolines
500
1000
1500
2000
2500
3000
3500
4000
4500
0 10 20 30 40 50 60 70 80 90 100
Tempe
rature (˚ F)
Volume Distilled
D86 Distillation ‐ FACE Gasolines
A
B
C
D
E
F
G
H
I
J
805
735 745
680 670
780
725
755 760 750
0
1
2
3
4
5
6
7
8
9
A B C D E F G H I J
Reid Vap
or Pressure (p
si)
FACE Gasoline
Reid Vapor Pressure (RVP) ‐ FACE Gasolines
11
314 API Gravity and Density
The API gravities and densities of the fuels were measured using ASTM method D4052 (8) The
agreement between the values measured in this project and the values reported in the CPChem COAs
The individual values are listed in the Summary Table A1 in Appendix A The average of both values are
plotted in the bar charts in Figures 36 and 37 for API Gravity and density respectively As expected the
FACE Gasolines (D G H and J) having the highest aromatics content have the lowest API Gravities and
highest densities
Figure 36 API Gravities of FACE Gasolines
Figure 37 Densities of FACE Gasolines
7495
7135
7330
5870
6360
6860
54555580
7440
5910
0
5
10
15
20
25
30
35
40
45
50
55
60
65
70
75
80
A B C D E F G H I J
API G
ravity
FACE Gasoline
API Gravity ‐ FACE Gasolines
0685
0697
0691
0743
0725
0707
0760
0755
0697
0742
0645
065
0655
066
0665
067
0675
068
0685
069
0695
07
0705
071
0715
072
0725
073
0735
074
0745
075
0755
076
0765
077
A B C D E F G H I J
Density
(gml)
FACE Gasoline
Density ‐ FACE Gasolines
12
315 Net Heat of Combustion (NHC)
Net Heats of Combustion were measured using ASTM method D240 (9) The values are depicted in the
bar charts in Figure 38 In addition for two of the FACE Gasolines (C and J) the values were also
measured using ASTM method D4809 (10) The D4809 values were very close to those obtained from
method D240 (within 100 BTUlb) TheD240 values range from 18602 to 19251 BTUlb As expected
the FACE Gasolines having the highest aromatics content (D G H and J) have the lowest net heat of
combustion The FACE Gasolines having saturates content gt90 (A B C and I) have the highest net
heat of combustion
Figure 38 ASTM D240 Net Heats of Combustion of FACE Gasolines
19251
19187
19257
18649
18884
19072
1860218625
19225
18731
18200
18400
18600
18800
19000
19200
19400
A B C D E F G H I J
Net Heat o
f Com
bustion (BTU
lb) (A
STM D240)
FACE Gasoline
Net Heat of Combustion ‐ FACE Gasolines
13
32 CHEMICAL PROPERTIES OF FACE GASOLINES
The various types of hydrocarbons in the fuels were characterized by several techniques including
supercritical fluid chromatography (SFC) and detailed hydrocarbon analysis (DHA) by gas
chromatography using a flame ionization detector (GC‐FID) In addition the carbon hydrogen and
sulfur contents were measured Results are reported in the following sections
321 Aromatics by Supercritical Fluid Chromatography (SFC)
The SFC method of ASTM D5186 (11) separates the hydrocarbons into three fractions monoaromatics
polyaromatics and non‐aromatics and characterizes the composition in terms of mass Bar graphs of
the results are presented in Figure 39 Samples of FACE Gasolines B D E G and H were analyzed by
two labs The results from the two labs were very close to each other and so the averages are depicted
in the figure FACE Gasolines A B C and I have nonromatics levels gt90 wt FACE Gasolines D G and
H have the highest amounts of monoaromatics with values ranging from 394‐420 wt FACE
Gasolines E G and H appear to have about 1 wt polyaromatics
Figure 39 Compositions of FACE Gasolines by Supercritical Fluid Chromatography (ASTM D5186)
070 790 600
4175
14001000
39404200
040
3870
015
100
110125
030
9930
9210 9400
5810
85009000
59505675
9960
6100
0
10
20
30
40
50
60
70
80
90
100
A B C D E F G H I J
Composition (Wt )
FACE GASOLINE
SFC Composition ‐ FACE Gasolines
MonoAromatics PolyAromatics NonAromatics
14
322 Hydrocarbons by Detailed Hydrocarbon Analysis (DHA)
Detailed Hydrocarbon Analyses were performed by two labs using gas chromatography with flame
ionization detectors (GC‐FID) This technique enables the determination of concentration on a species‐
by‐species basis provided that retention factors have been determined for each species in the fuel The
results from both labs were very close to each other Bubble charts of the average concentration values
(in volume ) are depicted in Figure 310 for the low sensitivity fuels and Figure 311 for the high
sensitivity fuels on a carbon number basis for the five hydrocarbon classes n‐paraffins iso‐paraffins
naphthenes aromatics and olefins
In general the low sensitivity FACE Gasolines are characterized by large amounts of low sensitivity
components such as n‐paraffins and iso‐paraffins The high sensitivity FACE Gasolines contain more high
sensitivity components such as olefins and naphthenes than the low sensitivity fuels
The total concentration of components within each of the five hydrocarbon classes were added and the
sums are reported in the bar charts in Figure 312 The n‐paraffin levels range from 225‐316 vol for
the four FACE Gasolines (C D H and J) that had targets of 25 vol For the other FACE Gasolines that
had a target level of 5 vol the n‐paraffins levels range from 44‐117 vol The aromatics levels range
from 317‐358 vol for the four FACE Gasolines (D G H and J) that had targets of 35 vol For the
other six FACE Gasolines that had a target level of 5 vol the aromatics levels range from 0‐109 vol
The C7 aromatic is toluene the C8 aromatics consist of a mix of ethylbenzene and the xylene isomers
the C9 aromatics consist of a mix of trimethylbenzenes and methylethylbenzenes and the C10 aromatics
consist of a mix of tetramethylbenzenes dimethylethylbenzenes and methylpropylbenzenes FACE
Gasoline E a high sensitivity fuel has a naphthene content of 208 vol mainly cyclopentane and
cyclohexane Three other high sensitivity fuels (F G and H) have naphthenes concentrations of about
11 vol mainly cyclopentane Those high sensitivity fuels also have the highest olefins content with
concentrations ranging from 68‐127 vol FACE Gasoline I also has 64 vol olefins The C6 olefin is
1‐hexene The C5 olefins consist of a mix of 2‐pentene and methyl butenes In contrast to the high
sensitivity fuels Gasoline D which was designed to be low sensitivity but ended up in the high
sensitivity range has essentially no naphthenes or olefins Its high sensitivity is derived from its high
aromatics content
The C5 isoparaffin in all of the fuels is 2‐methylbutane The C6 isoparaffins consist of a mix of 2‐ and 3‐
methyl pentanes and 23 dimethyl butane The C7 isoparaffins in most of the FACE Gasolines consist of a
mix of 2‐ and 3‐methyl hexanes and 23‐ and 24‐dimethylpentanes The C8 isoparaffins are
predominantly trimethylpentanes with more than 50 of those being isooctane (224
trimethylpentane) The other isomers are mainly 24‐ and 25 dimethylhexanes and 2‐methyl 3‐ethyl
pentane
15
Figure 310 Detailed Hydrocarbon Analyses of Low Sensitivity FACE Gasolines
122 44 219 451 11
48 65
065
3 4 5 6 7 8 9 10 11
Carbon Number
FACE Gasoline A ‐ Detailed Hydrocarbon Analysis (vol)
isoparaffins
n‐paraffins
cycloparaffins
aromatics
olefins
104 13 137 587 16
59
39 37
3 4 5 6 7 8 9 10 11
Carbon Number
FACE Gasoline B ‐ Detailed Hydrocarbon Analysis (vol)
isoparaffins
cycloparaffins
aromatics
olefins
n‐paraffins
64 27 117 468 20 075
30 06
31 118 100
3 4 5 6 7 8 9 10 11
Carbon Number
FACE Gasoline C ‐ Detailed Hydrocarbon Analysis (vol)
isoparaffins
cycloparaffins
aromatics
olefins
n‐paraffins
12 410
99 35 150 46
47 114 70
3 4 5 6 7 8 9 10 11
Carbon Number
FACE Gasoline D ‐ Detailed Hydrocarbon Analysis (vol)
isoparaffins
cycloparaffins
aromatics
olefins
n‐paraffins
41 34 99 321 236 11
07 135
24
11
59
3 4 5 6 7 8 9 10 11
Carbon Number
FACE Gasoline I ‐ Detailed Hydrocarbon Analysis (vol)
isoparaffins
n‐paraffins
cycloparaffins
aromatics
olefins
327
90 124 95
22
14 131 145 29
06
3 4 5 6 7 8 9 10 11
Carbon Number
FACE Gasoline J ‐ Detailed Hydrocarbon Analysis (vol)
isoparaffins
n‐paraffins
cycloparaffins
aromatics
olefins
16
Figure 311 Detailed Hydrocarbon Analyses of High Sensitivity FACE Gasolines
64 68 143 165 18 07
70 105 19 10 04
46 17 18 16 08
21 82 09
29 06 37
3 4 5 6 7 8 9 10 11
Carbon Number
FACE Gasoline E ‐ Detailed Hydrocarbon Analysis (vol)
isoparaffins
cycloparaffins
aromatics
olefins
n‐paraffins
82 64 134 378 14
21 21
100
76
89
3 4 5 6 7 8 9 10 11
Carbon Number
FACE Gasoline F ‐ Detailed Hydrocarbon Analysis (vol)
isoparaffins
n‐paraffins
cycloparaffins
aromatics
olefins
65 66 72 152 16 10
74 09 16 10
15 33 218 54 14
36 25 10
37 07 10
3 4 5 6 7 8 9 10 11
Carbon Number
FACE Gasoline G ‐ Detailed Hydrocarbon Analysis (vol)
isoparaffins
cycloparaffins
aromatics
olefins
n‐paraffins
28 54 71 39 22 09
66 08 17 10
10 95 117 83 43 14
29 21 09
54 05 145 08
3 4 5 6 7 8 9 10 11
Carbon Number
FACE Gasoline H ‐ Detailed Hydrocarbon Analysis (vol)
isoparaffins
cycloparaffins
aromatics
olefins
n‐paraffins
17
Figure 312 Detailed Hydrocarbon Analyses Comparisons of FACE Gasolines
A comparison of the composition results from the DHA and SFC methods is presented in Figure 313 for
the low sensitivity fuels and Figure 314 for the high sensitivity fuels Also included are Fluorescent
Indicator Absorption (FIA ndash ASTM D1319 (12)) composition results reported on the CPChem COAs Since
the FIA method determines total saturates the DHA results for n‐paraffins iso‐paraffins and
naphthenes must be added together to enable the comparison between those two methods Similarly
since the SFC method directly measures aromatics and total non‐aromatics are determined by
difference the olefins amount must be added to the total saturate levels from FIA and DHA to enable
comparisons with the non‐aromatics values from SFC The appropriate comparison categories are
indicated by dashed lines in Figures 313 and 314 Of the three methods SFC generally gives the
highest level of aromatics and FIA the lowest The DHA aromatics values are closer to the FIA levels than
to the SFC levels The DHA olefins are fairly close to the FIA results
117
80
244 241
7944 67
225144
316
860
859
697
421
459
676
384
228
745336
16
01
01208
110
115105
33
23
13
127
94
8168
64
06
58 39
334
10977
336 358
12
317
0
10
20
30
40
50
60
70
80
90
100
A B C D E F G H I J
Composition ( vol)
FACE GASOLINE
DHA Composition ‐ FACE Gasolines
n‐paraffins isoparaffins naphthenes olefins aromatics
18
Figure 313 Comparison of Composition Methods FACE Low Sensitivity Gasolines
Figure 314 Comparison of Composition Methods FACE High Sensitivity Gasolines
117
80
244
144
316
860 859
697
745336
16
01 0433
23
13 64
06
58 3912
317
996951 975
929
712
04
07 04 62
10
42 21 09
278
993
921 940996
610
07
79 6004
390
0
10
20
30
40
50
60
70
80
90
100
DHA FIA SFC DHA FIA SFC DHA FIA SFC DHA FIA SFC DHA FIA SFC
Composition ( )
FACE GASOLINE
Composition ‐ Low Sensitivity FACE Gasolines
n‐paraffins isoparaffins naphthenes olefins aromatics saturates nonaromatics
A B C I J
241
7944 67
225
421
459
676
384
228
01
208
110
115 105
127
94
81 68
334
10977
336 358
701
780
856
587 568
04
99
86
7879
295
12158
335 353
581
850900
595568
419
150100
405432
0
10
20
30
40
50
60
70
80
90
100
DHA FIA SFC DHA FIA SFC DHA FIA SFC DHA FIA SFC DHA FIA SFC
Composition ( )
FACE GASOLINE
Composition ‐ High Sensitivity FACE Gasolines
n‐paraffins isoparaffins naphthenes olefins aromatics saturates nonaromatics
D E F G H
19
323 Elemental Analyses
Carbon and hydrogen contents were measured by two labs using ASTM method D5291 (13) The
average results are presented in the bar graphs in figure 315 The carbon contents range from 8399‐
8748 wt and the hydrogen contents range from1252‐1601 wt As expected the FACE Gasolines
having the highest aromatics content (D G H and J) have the highest carbon and lowest hydrogen
contents
Figure 315 Carbon and Hydrogen Elemental Analyses of FACE Gasolines
8399 8443 8453 8646 8547 8496 8670 87488414 8624
1601 1557 1547 1354 1453 1504 1330 12521586 1376
0
10
20
30
40
50
60
70
80
90
100
A B C D E F G H I J
Compo
sition
(wt)
FACE Gasoline
Carbon‐Hydrogen Elemental Analyses
Hydrogen
Carbon
20
Sulfur content was measured by one lab ASTM method D5453 (14) The results displayed in the bar
charts in Figure 316 are essentially identical to the values reported on the CPChem COAs All FACE
Gasolines had ultra‐low sulfur levels FACE Gasolines E G and H had the highest levels at 21 22 and 15
ppm sulfur The other fuels had levels ranging from 2‐6 ppm
Figure 316 Sulfur Levels of FACE Gasolines
6
4 4
2
21
2
22
15
2 2
0
5
10
15
20
25
A B C D E F G H I J
Sulfur Content (p
pm)
FACE Gasoline
Sulfur Content ‐ FACE Gasolines
21
4 ANALYTICAL RESULTS FOR FACE GASOLINES BLENDED WITH ETHANOL
Although the FACE Gasolines were not formulated with ethanol the expectation is that some potential
users will be interested in testing the fuels with ethanol added To assist selection of fuels for those
studies four FACE Gasolines were selected for blending with levels of 10 15 and 30 vol ethanol The
fuels selected for this purpose were A B C and H The positions of these fuels in the design matrix are
shown below
In this section results of the analyses of the ethanol blends are discussed Chevron Phillips 66 BP and
a contract laboratory conducted the analyses As mentioned previously future production runs that are
required to remake fuels that sell out likely will results in some changes to the fuel property values
reported here
41 ASTM TEST RESULTS
ASTM methods were used to measure the ethanol content RON MON API gravity density distillation
profiles RVP and net heats of combustion of all of the ethanol blends made with the FACE Gasolines
The results of these analyses are summarized below and in Table A2 located in the Appendix
411 Ethanol Content
FACE Gasolines A B C and H were blended with nominally 10 15 and 30 vol ethanol The
concentration of ethanol in each blend were determined using ASTM method D5599 (15) (coupled with
ASTM D4052 density measurement) and by detailed hydrocarbon analysis using gas chromatography
with a flame ionization detector The results for both methods were in excellent agreement for all fuels
as shown below in Table 41
Table 41 Measured Ethanol Content of FACE Gasoline Blends
Ethanol Content (vol)
A B C H
10 15 30 10 15 30 10 15 30 10 15 30
D5599 101 147 299 100 147 302 102 146 295 102 146 303
DHA 100 146 301 100 148 301 103 148 299 102 147 304
22
412 RON MON and Octane Sensitivity
RON values were measured in CFR engines per ASTM method D2699 (4) Although the measurements
were conducted in four labs the lab‐to‐lab reproducibility was very good so only the average values are
reported here (but individual values are reported in Table A2) Average RON values for each fuel are
presented in Figure 41 For all four of these FACE Gasolines the RON values continue to increase even
at the 30 ethanol level although the rates of increase are lower than at lower ethanol levels FACE
Gasoline B has the highest RON at all ethanol levels with a value of about 106 at the 30 ethanol level
FACE Gasolines A and C have essentially the same RON values at all ethanol levels with RON values of
about 102 at the 30 ethanol level FACE Gasoline H without ethanol has a higher RON than A and C
but a lower RON at the 15 and 30 ethanol levels
Figure 41 RON Values of FACE Gasoline Blends with Ethanol
MON values were measured in CFR engines per ASTM method D2700 (5) Although the measurements were conducted in four labs the lab‐to‐lab reproducibility was very good so only the average values are reported here (but individual values are reported in Appendix A2) The MON values for each fuel are
presented in Figure 42 FACE Gasoline B has the highest MON values at all ethanol levels but unlike the other FACE Gasolines the MON value did not increase with ethanol contents above 10 vol The MON values for FACE Gasolines A and C were essentially the same and higher than those for FACE Gasoline H
80081082083084085086087088089090091092093094095096097098099010001010102010301040105010601070108010901100
0 5 10 15 20 25 30 35
RON
Ethanol (vol)
RON Values ‐ FACE Gasoline + Ethanol Blends
FACE A
FACE B
FACE H
FACE C
23
Figure 42 MON Values of FACE Gasoline Blends with Ethanol
Octane Sensitivity (S=RON‐MON) values are presented in Figure 43 As expected due to the relatively high sensitivity of ethanol the sensitivities of all four FACE Gasolines increase as the ethanol content increases FACE Gasoline H has the highest sensitivity at all ethanol levels except at 30 vol ethanol where the sensitivity of the FACE Gasoline B blend becomes slightly higher with values of 124 and 132 respectively The sensitivities for FACE Gasolines A and C are very similar to each other and although lower than the blends for the other FACE Gasolines have the highest rates of increase at the 30 level
Figure 43 Octane Sensitivities FACE Gasoline Blends with Ethanol
750
760
770
780
790
800
810
820
830
840
850
860
870
880
890
900
910
920
930
940
950
0 5 10 15 20 25 30 35
MON
Ethanol (vol)
MON Values ‐ FACE Gasoline + Ethanol Blends
FACE A
FACE B
FACE H
FACE C
00
10
20
30
40
50
60
70
80
90
100
110
120
130
140
0 5 10 15 20 25 30 35
S
Ethanol (vol)
Octane Sensitivity (S) ‐ FACE Gasoline + Ethanol Blends
FACE A
FACE B
FACE H
FACE C
24
413 Distillation Characteristics
The distillation properties of the fuels were determined by ASTM D86 (6) The values are plotted in
Figure 44 and tabulated in Table A2 in the Appendix The behavior and shapes of the curves are very
similar For a given gasoline all of the ethanol blends start at about the same IBP The blends
containing ethanol then follow the same curve which is lower than the base gasoline At a certain point
the ethanol blends then rise quickly to rejoin the distillation curve of the base gasoline The lower the
ethanol content of the blend the earlier (lower distilled volume ) the curve rejoins the base gasoline
curve
Figure 44 ASTM D86 Distillation Profiles for FACE Gasoline Blends with Ethanol
50
100
150
200
250
300
0 10 20 30 40 50 60 70 80 90 100
Temperature (˚ C)
Volume Distilled
D86 Distillation ‐ FACE A Gasoline + Ethanol Blends
0 EtOH
10 EtOH
15 EtOH
30 EtOH
50
100
150
200
250
300
0 10 20 30 40 50 60 70 80 90 100
Temperature (˚ C)
Volume Distilled
D86 Distillation ‐ FACE B Gasoline + Ethanol Blends
0 EtOH
10 EtOH
15 EtOH
30 EtOH
50
100
150
200
250
300
350
0 10 20 30 40 50 60 70 80 90 100
Temperature (˚ C)
Volume Distilled
D86 Distillation ‐ FACE C Gasoline + Ethanol Blends
0 EtOH
10 EtOH
15 EtOH
30 EtOH
50
100
150
200
250
300
350
400
450
0 10 20 30 40 50 60 70 80 90 100
Temperature (˚ C)
Volume Distilled
D86 Distillation ‐ FACE H Gasoline + Ethanol Blends
0 EtOH
10 EtOH
15 EtOH
30 EtOH
25
414 Reid Vapor Pressure (RVP)
The RVPs were determined using ASTM method D5191 (7) The values are plotted in Figure 45 For all
fuels the RVP appears to peak between 10 and 15 vol ethanol and then starts to decrease as the
ethanol content increases further
Figure 45 Reid Vapor Pressures for FACE Gasoline Blends with Ethanol
415 API Gravity and Density
The API gravities and densities of the fuels were measured by two labs using ASTM method D4052 (8) The values from the two labs were in excellent agreement and are listed in Table A2 The average density values are presented in Figure 46 For all of the FACE Gasolines the density increased as the ethanol content increased
Figure 46 Densities of FACE Gasoline Blends with Ethanol
7
75
8
85
9
95
10
0 5 10 15 20 25 30 35
RVP (psi)
Ethanol (vol)
Reid Vapor Pressure (RVP) ‐ FACE Gasoline + Ethanol Blends
FACE A
FACE B
FACE H
FACE C
0685 0697 0691
0759
0696 0705 0699
0761
0700 0710 0704
0763
0716 0724 0719
0768
0
01
02
03
04
05
06
07
08
09
1
A B C H
Density
(gm
l)
Ethanol (vol)
Density ‐ FACE Gasoline Blends with Ethanol
0
10
15
30
26
416 Net Heat of Combustion (NHC)
Net Heats of Combustion were measured by 2 labs using ASTM method D240 (9) For some fuels ASTM
method D4809 (10) was also used The values from both labs and both methods were very close to each
other and the average values are plotted in Figure 47 As expected since the net heat of combustion of
ethanol is lower than that of gasoline for all FACE Gasolines the net heat of combustion decreased as
ethanol content increased The decrease appeared to be linear with ethanol content The decrease
appeared to be steepest for FACE Gasoline B
Figure 47 Net Heat of Combustion of FACE Gasoline Blends with Ethanol
16000
16250
16500
16750
17000
17250
17500
17750
18000
18250
18500
18750
19000
19250
19500
0 5 10 15 20 25 30 35
Net Heat of C
ombustion (B
TUlb)
Ethanol (vol)
Net Heat of Combustion ‐ FACE Gasoline + Ethanol Blends
FACE A
FACE B
FACE H
FACE C
27
5 SUMMARY AND CONCLUSIONS
A subteam of the CRC AVFL FACE Working Group has designed a matrix of reference gasolines
known as the FACE Gasolines A commercial vendor has produced and made the fuels available
for purchase in research quantities It is expected that this will enable consistent comparisons
of engine and combustion results from different laboratories and test platforms based on the
use of the same set of fuels
The matrix is designed around four parameters expected to be of importance for advanced
gasoline engines RON octane sensitivity aromatics content and n‐paraffins content
Statistical methods were used to identify potential candidate formulations and down‐select to a
tractable number of 10 formulations
Detailed analyses were performed on the physical and chemical properties of the final fuel
formulations
Generally the property values measured in the current study agreed very well with the values
reported on the fuel blender (ChevronPhillips Chemical Company ‐ CPChem) Certificates of
Analyses (COAs)
As expected conflicts in the target properties for some of the fuels (such as high aromatics level
coupled with low octane sensitivity) led to some trade‐offs that resulted in some deviation in
the actual properties from the design properties
The RON values come close to meeting the targets for most of the fuels Fuels E H and J have
values that are 24‐38 units higher than the targets
Three of the four ldquohighrdquo sensitivity fuels have measured values of 59‐71 that are lower than
the target value of 10 Two of the ldquolowrdquo sensitivity fuels have measured values (34‐37) that are
a bit higher than the target value of le2 One of the low sensitivity design fuels (ldquoDrdquo) has a value
of 72 that actually effectively makes it a high sensitivity fuel
Detailed hydrocarbon analyses (DHA) indicate that the n‐paraffins contents range from 225‐
316 vol for the four FACE Gasolines that had targets of 25 vol and from 44‐117 vol for
the six FACE Gasolines that had targets of 5 vol
DHAs indicate that the aromatics contents range from 317‐358 vol for the four FACE
Gasolines that had a target of 35 vol and 0‐109 vol for the other fuels that had a target of 5
vol
The high sensitivity fuels contained the high sensitivity components of naphthenes (105‐208
vol) and olefins (68‐127 vol) The exception was Gasoline ldquoDrdquo which had neither of these
components but whose high sensitivity was derived from aromatics components
Five of the FACE Gasolines (ldquoArdquo ldquoBrdquo ldquoCrdquo ldquoFrdquo and ldquoIrdquo) are very rich in isoparaffins with contents ge
676 vol
Aromatics values determined by SFC were generally higher than the values obtained from DHA
The DHA olefins values were close to the FIA values reported on the CPChem COAs
The fuels having the highest aromatics content also have the highest densities and highest net
heats of combustion on an energy content per volume basis
With regards to distillation properties for all fuels the initial boiling points (IBPs) are in a
narrow range of 90‐110˚F although the end boiling points (EBPs) range from 253‐410˚F Three
28
of the high sensitivity fuels have the highest EBPs The two low‐mid RON fuels having low n‐
paraffins and low aromatics have the lowest EBPs
All of the FACE Gasolines have ultra‐low levels of sulfur with the highest value at 22 ppm S and
most fuels having le 6 ppm S
For the four FACE Gasolines blended with ethanol RON continues to increase as the ethanol
levels increase to 30 vol although the rate of increase is lower as the ethanol content
increases FACE Gasoline B which has the highest RON of 96 has the highest RON at all ethanol
levels with a value of about 106 at 30 ethanol At the same ethanol level FACE Gasolines A
and C have essentially the same RON values FACE Gasoline H starts with a higher RON value
than those of A or C but has a lower value at blend levels of 15 and 30 vol
MON increased as the ethanol level increased for FACE Gasolines A C and H The MON values
for these fuels were essentially constant even though the highest MON values were found for
the ethanol blends with FACE Gasoline B
For all blends octane sensitivity increased as ethanol content increased with the highest values
of 12‐13 for 30 vol ethanol blends with FACE Gasolines B and H
The D86 distillation curve trends are similar for the four FACE Gasolines For a given gasoline all
blends start at the same point At around 10 vol distilled the curves for the blends with
ethanol diverge from and are lower than the curves for the base gasolines At a certain point
the distillation curves for the blends rise quickly and re‐join the curve for the parent base fuel
The distillation curves for the 30 vol ethanol blends are generally flat as a function of
increasing vol distilled and only start to increase again at about 70‐80 vol distilled when
most of the ethanol has been distilled from the liquid
The Reid Vapor Pressures (RVPs) peak at about 10‐15 vol
Densities increase slightly as ethanol increases while net heats of combustion decrease
29
6 REFERENCES
1 Alnajjar M Cannella B Dettman H Fairbridge C Franz J Gallant T Gieleciak R Hager D Lay C Lewis S Ratcliff M Sluder S Storey J Yin H Zigler B ldquoChemical and Physical Properties of the Fuels for Advanced Combustion Engines (FACE) Research Diesel Fuelsrdquo CRC Report No FACE‐1 (2010)
2 Gallant T Franz J Alnajjar M Storey J Lewis S Sluder S Cannella W Fairbridge C Hager D Dettman H Luecke J Ratcliff M Zigler ldquoFuels for Advanced Combustion Engines Research Diesel Fuels Analysis of Physical and Chemical Propertiesrdquo SAE Paper 2009‐01‐2769 (2009)
3 CannellaW Fairbridge C Arboleda P Bays T Dettman H Foster M Gieleciak R Gunter G Hager D Lay C Lewis S Luecke J Sluder S Zigler B ldquoDetailed Characterization of the Physical and Chemical Properties of the Reformulated FACE Diesel Fuels FD2B FD4B and FD7Brdquo CRC Report AVFL‐19‐1 (2013)
4 ASTM International Standard Test Method for Research Octane Number of Spark‐Ignition Engine Fuel ASTM D2699 (ASTM International Pennsylvania 2009)
5 ASTM International Standard Test Method for Motor Octane Number of Spark‐Ignition Engine Fuel ASTM D2700 (ASTM International Pennsylvania 2009)
6 ASTM International Standard Test Method for Distillation of Petroleum Products at Atmospheric Pressure ASTM D86‐09e1 (ASTM International Pennsylvania 2009)
7 ASTM International Standard Test Method for Vapor Pressure of Petroleum Products (Mini‐Method) ASTM D5191 (ASTM International Pennsylvania 2009)
8 ASTM International Standard Test Method for Density and Relative Density of Liquids by Digital Density Meter ASTM D4052‐96(2002)e1 (ASTM International Pennsylvania 2002)
9 ASTM International Standard Test Method for Heat of Combustion of Liquid Hydrocarbon Fuels by Bomb Calorimeter ASTM D240‐02(2007) (ASTM International Pennsylvania 2007)
10 ASTM International Standard Test Method for Heat of Combustion of Liquid Hydrocarbon Fuels by Bomb Calorimeter ASTM D4809 (2007) (ASTM International Pennsylvania 2007)
11 ASTM International Standard Test Method for Determination of Aromatic Content and Polynuclear Aromatic Content of Diesel Fuels and Aviation Turbine Fuels by Supercritical Fluid Chromatography ASTM D5186‐03(2009) (ASTM International Pennsylvania 2009)
12 ASTM International Standard Test Method for Hydrocarbon Types in Liquid Petroleum Products by Fluorescent Indicator Adsorption ASTM D1319‐08 (ASTM International Pennsylvania 2008)
13 ASTM International Standard Test Methods for Instrumental Determination of Carbon Hydrogen and Nitrogen in Petroleum Products and Lubricants ASTM D5291‐02(2007) (ASTM International Pennsylvania 2007)
14 ASTM International Standard Test Methods for Determination of Total Sulfur in Light Hydrocarbons Spark‐Ignition Engine Fuel Diesel Engine Fuel and Engine Oil by Ultraviolet Fluorescence ASTM D5453(2007) (ASTM International Pennsylvania 2007)
15 ASTM International Standard Test Methods for Determination of Oxygenates in Gasoline by Gas Chromatography and Oxygen Selective Flame Ionization Detection ASTM D5599 (2007) (ASTM International Pennsylvania 2007)
30
31
Appendix A
Properties of FACE Gasolines
32
Table A1 Summary Data for FACE Gasolines
Specific Tests FACE Gasoline A B C D E F G H I J Research Octane Number (RON) (ASTM D2699) -Lab 1 843 958 850 946 871 940 969 870 700 738 -Lab 2 839 960 840 939 877 960 869 -Lab 3 835 957 840 -Average 839 958 843 942 874 940 965 869 7015 738 -CPChem COA 835 960 847 932 875 944 968 869 703 718 Motor Octane Number (MON) (ASTM D2700) -Lab 1 836 923 830 872 813 881 857 797 695 701 -Lab 2 833 931 830 868 808 860 799 -Lab 3 835 919 829 -Average 835 924 830 870 811 881 858 798 695 701 -CPChem COA 836 926 836 878 815 888 858 793 696 688 Sensitivity (RON-MON) -Lab 1 07 35 20 74 58 59 112 73 05 37 -Lab 2 06 29 10 71 69 100 70 -Lab 3 0 38 11 -Average 04 34 13 72 63 59 107 72 05 37 -CPChem COA -01 34 11 54 60 56 110 76 07 30 API Gravity (API˚) (ASTM D4052) -CPChem COA 750 714 734 587 636 686 545 568 744 595 -Lab 1 749 713 732 587 636 686 546 548 744 587 -Average 7495 7135 733 587 636 686 5455 558 744 591 Density (ASTM D4052) -CPChem COA 0691 0743 0725 0707 0760 0697 0741 -Lab 1 0685 0697 0691 0743 0725 0707 0760 0759 0697 0743 -Average 0685 0697 0691 0743 0725 0707 0760 0759 0697 0742 RVP (psi) (D5191) -CPChem COA 81 74 74 68 67 78 72 75 75 75 -Lab 1 80 73 75 73 76 77 Net Heat of Combustion (BTUlb) (ASTM D4809) 19186 18680 Net Heat of Combustion (BTUlb) (ASTM D240) 19251 19187 19257 18649 18884 19072 18602 18625 19225 18731
33
TableA1 Summary Data for FACE Gasolines
Specific Tests FACE Gasoline A B C D E F G H I J Distillation (˚F) (ASTM D86) -CPChem IBP 93 95 95 88 110 108 93 94 100 101
5 104 128 120 129 131 129 122 123 123 111 10 132 145 136 148 142 142 135 140 156 162 20 160 172 154 176 155 156 158 168 177 206 30 183 194 171 198 166 168 183 192 186 217 40 197 207 187 212 177 180 210 211 191 224 50 203 213 200 221 186 193 240 227 195 231 60 207 216 210 229 197 206 270 242 199 242 70 210 220 218 235 208 217 306 262 203 261 80 213 225 226 280 222 225 328 291 207 291 90 219 235 243 330 267 240 343 327 213 316 95 227 248 270 340 343 261 363 358 220 330 FBP 269 283 328 363 405 294 403 410 259 358
-Lab 1 IBP 90 97 93 97 107 102 99 98 99 95 5 122 133 126 133 134 134 122 127 139 111
10 140 149 139 151 143 144 136 143 160 166 20 165 175 157 179 156 157 158 170 178 209 30 186 196 174 200 168 169 182 194 187 219 40 198 209 188 214 177 182 209 213 192 225 50 204 214 201 224 188 195 238 229 196 232 60 207 218 210 234 197 207 268 243 200 242 70 210 221 218 248 208 218 304 263 204 263 80 213 226 227 288 224 228 328 291 208 292
90 219 236 245 331 258 243 343 329 213 316 95 228 248 274 341 329 261 358 357 220 330 FBP 262 280 330 365 402 291 405 408 247 357
-Average IBP 915 96 94 925 1085 105 96 96 995 98 5 113 1305 123 131 1325 1315 122 125 131 111
10 136 147 1375 1495 1425 143 1355 1415 158 164 20 1625 1735 1555 1775 1555 1565 158 169 1775 203 30 1845 195 1725 199 167 1685 1825 193 1865 218 40 1975 208 1875 213 177 181 2095 212 1915 2245 50 2035 2135 2005 2225 187 194 239 228 1955 2315 60 207 217 210 2315 197 2065 269 2425 1995 242 70 210 2205 218 2415 208 2175 305 2625 2035 262 80 213 2255 2265 284 223 2265 328 291 2075 2915
90 219 2355 244 3305 2625 2415 343 328 213 316 95 2275 248 272 3405 336 261 3605 3575 220 330 FBP 2655 2815 329 364 4035 2925 404 409 253 3575
34
Table A1 Summary Data for FACE Gasolines
Specific Tests FACE Gasoline A B C D E F G H I J Elemental Analysis (ASTM D 5291) -Carbon (wt) -Lab 1 8398 8441 8497 8647 8547 8671 8792 8415 -Lab 4 8400 8444 8419 8645 8547 8496 8669 8703 8414 8624 -Average 8399 8443 8458 8646 8547 8496 8670 8748 8414 8624 -Hydrogen (wt) -Lab 1 1602 1559 1503 1353 1453 1329 1208 1585 -Lab 4 1600 1556 1585 1355 1453 1504 1331 1297 1586 1376 -Average 1601 1557 1547 1354 1453 1504 1330 1252 1586 1376 Sulfur by UV Fluorescence (ppmw) (ASTM D5453) -CPChem COA 4 4 3 2 21 2 20 15 2 2 -Lab 4 6 4 4 2 21 2 22 15 2 2 Hydrocarbons by FIA (vol) (ASTM D1319) -Aromatics (vol) CPChem COA 0 42 21 295 121 58 335 353 09 278 -Olefins (vol) CPChem COA 04 07 04 04 99 86 78 79 62 10 -Saturates (vol) CPChem COA 996 951 975 701 780 856 587 568 929 712 Aromatics by SFC (ASTM D5186) (Lab 1) -MonoAromatics (wt) -Lab 1 07 78 60 414 142 100 393 412 04 387 -Lab 2 80 421 138 395 428 -Average 07 79 60 4175 140 100 394 420 04 387 -PolyAromatics (wt) -Lab 1 0 0 0 03 11 0 10 10 0 03 -Lab 2 0 0 09 12 15 -Average 0 0 0 015 10 0 11 125 0 03 -NonAromatics (wt) -Lab 1 993 922 940 583 847 900 597 578 996 610 -Lab 2 920 579 850 593 557 -Average 993 921 940 581 8475 900 595 5675 996 610
35
Table A1 Summary Data for FACE Gasolines
Specific Tests FACE Gasolines A B C D E F G H I J Detailed Hydrocarbon Analyses by GC-FID -n-paraffins (vol) (Targets) (5) (5) (25) (25) (5) (5) (5) (25) (5) (25) -Lab 1 1144 783 2409 2346 771 434 662 2214 1441 3115 -Lab 2 1187 815 2476 2473 803 446 685 2283 1437 3212 -Average 1165 799 2443 2410 787 440 673 2249 1439 3164 -iso-paraffins (vol) -Lab 1 8562 8591 688 4206 4563 6765 3821 2322 7449 3362 -Lab 2 8635 8586 7066 4221 4621 6747 3864 2240 7459 3366 -Average 8599 8688 6973 4213 4592 6756 3843 2281 7454 3364 -cyclo-paraffins (vol) -Lab 1 192 021 048 010 2216 1078 1163 1035 324 234 -Lab 2 130 007 023 010 1945 1118 1140 1066 336 224 -Average 161 014 036 010 2081 1098 1152 1050 330 229 -aromatics (vol) (Targets) (5) (5) (5) (35) (5) (5) (35) (35) (5) (35) -Lab 1 073 601 409 3425 1121 805 3419 3597 120 3212 -Lab 2 003 568 374 3258 1062 739 3306 3555 110 3125 -Average 38 584 392 3341 1092 772 3363 3576 115 3169 -olefins (vol) -Lab 1 024 001 248 004 1146 978 851 714 643 066 -Lab 2 018 003 006 005 1392 905 771 650 627 054 -Average 021 002 127 04 1269 942 811 682 635 060
36
37
Appendix B
Properties of FACE Gasoline Blends with Ethanol
38
Table B1 Summary Data for FACE Gasoline Blends with Ethanol
Specific Tests FACE Gasoline Blend A B Ethanol Content (Vol ) 0 10 15 30 0 10 15 30 Ethanol Content (Vol ) (ASTM D5599) 0 1012 1469 2990 0 995 1473 3016 Research Octane Number (RON) (ASTM D2699) -Lab 1 843 922 951 1032 958 1015 1039 1067 -Lab 2 839 923 951 1017 960 1008 1023 1050 -Lab 3 835 917 946 1025 957 1012 1031 1069 -Lab 4 916 945 1018 1009 1026 1053 -Average 839 920 948 1023 958 1011 1030 1060 Motor Octane Number (MON) (ASTM D2700) -Lab 1 836 878 890 912 923 936 936 934 -Lab 2 833 874 891 917 931 935 934 931 -Lab 3 835 881 893 911 919 933 934 933 -Lab 4 884 901 916 935 936 933 -Average 835 879 894 914 924 935 935 933 Sensitivity (RON-MON) -Lab 1 07 44 61 120 35 79 103 133 -Lab 2 06 49 60 100 29 73 89 119 -Lab 3 0 36 53 114 38 79 97 136 -Lab 4 32 44 102 74 91 120 -Average 04 41 54 109 34 76 95 127 API Gravity (API˚) (ASTM D4052) -Lab 1 749 7164 7066 661 7131 690 6772 6375 -Lab 4 716 706 660 690 676 638 -Average 749 7162 7063 6605 7131 690 6766 6377 Density (ASTM D4052) -Lab 1 06849 06959 06992 07154 0697 07050 07096 07240 -Lab 4 06966 06999 07161 07055 07106 07244 -Average 06849 06963 06996 07158 0697 07053 07101 07242 RVP (psi) (D5191) Lab 1 83 95 94 91 73 87 86 83 Net Heat of Combustion (BTUlb) (ASTM D4809) 18308 Net Heat of Combustion (BTUlb) (ASTM D240) -Lab 1 19266 18294 18080 16751 19207 18319 17941 16631 -Lab 4 19236 18208 17963 16487 19168 18307 17696 16234 -Average 19251 18251 18021 16619 19187 18313 17818 16432
39
Table B1 Summary Data for FACE Gasoline Blends with Ethanol
Specific Tests FACE Gasoline Blend C H Target Ethanol Content (Vol ) 0 10 15 30 0 10 15 30 Ethanol Content (Vol) (ASTM D5599) 0 1018 1462 2949 0 1016 1459 3034 Research Octane Number (RON) (ASTM D2699) -Lab 1 850 918 951 1012 870 919 941 993 -Lab 2 840 920 950 1014 869 927 941 996 -Lab 3 840 917 946 1019 869 920 937 995 -Lab 4 914 945 1015 916 946 991 -Average 843 917 948 1015 869 921 941 994 Motor Octane Number (MON) (ASTM D2700) -Lab 1 830 876 893 921 797 821 835 861 -Lab 2 830 868 880 924 793 820 831 885 -Lab 3 829 876 887 909 799 817 829 858 -Lab 4 881 890 914 828 839 877 -Average 830 875 888 916 796 822 833 870 Sensitivity (RON-MON) -Lab 1 20 42 58 91 73 98 106 132 -Lab 2 10 52 70 90 76 107 110 111 -Lab 3 11 41 59 110 70 103 108 137 -Lab 4 33 55 101 88 107 114 -(RON)avg ndash (MON)avg 13 42 60 99 73 99 108 124 API Gravity (API˚) (ASTM D4052) -Lab 1 732 7069 6943 6523 5481 5416 5375 5247 -Lab 4 707 693 652 544 538 527 -Average 732 707 694 652 548 543 5377 526 Density (ASTM D4052) -Lab 1 06906 06991 07035 07186 07587 07614 07631 07684 -Lab 4 06997 07043 07192 07610 07636 07678 -Average 06994 07039 07189 07587 07612 07633 07681 RVP (psi) (D5191) Lab 1 75 86 85 83 76 88 87 84 Net Heat of Combustion (BTUlb) (ASTM D4809) 19186 18198 17955 16692 16265 Net Heat of Combustion (BTUlb) (ASTM D240) -Lab 1 19257 18375 18012 16739 18675 17891 17550 16369 -Lab 4 18576 17809 17408 16322 -Average 19257 18375 18012 16739 18625 17850 17479 16345
40
Table B1 Summary Data for FACE Gasoline Blends with Ethanol
Specific Tests FACE Gasoline Blend A B Target Ethanol Content 0 10 15 30 0 10 15 30 Ethanol Content (Vol) -ASTM D5599 0 1012 1469 2990 0 995 1473 3016 -Detailed Hydrocarbon Analysis - GCFID -Lab 1 0 1000 1463 3017 0 1001 1476 3014 Elemental Analysis (ASTM D 5291) -Carbon (wt) -Lab 1 8443 8178 7941 7306 8465 8172 8029 7346 -Lab 4 8433 8085 7823 7361 8471 8110 7921 7380 -Average 8438 8131 7882 7333 8468 8141 7975 7363 -Hydrogen (wt) -Lab 1 1543 1527 1484 1446 1473 1462 1442 1387 -Lab 4 1606 1573 1548 1515 1561 1540 1525 1487 -Average 1575 1550 1516 1481 1517 1501 1483 1437 -Oxygen (wt) (ASTM D5599) Lab 4 0 400 578 1150 0 389 571 1147
Specific Tests FACE Gasoline Blend C H Target Ethanol Content 0 10 15 30 0 10 15 30 Ethanol Content (Vol) -ASTM D5599 0 1018 1462 2949 0 1016 1459 3034 -Detailed Hydrocarbon Analysis - GCFID -Lab 1 0 1027 1483 2988 0 1021 1468 3040 Elemental Analysis (ASTM D 5291) -Carbon (wt) -Lab 1 8447 8200 7998 7336 8768 8402 8401 7624 -Lab 4 8419 8077 7909 7353 8720 8316 8150 7626 -Average 8433 8138 7954 7345 8744 8359 8276 7625 -Hydrogen (wt) -Lab 1 1494 1465 1465 1405 1205 1199 1207 1218 -Lab 4 1585 1668 1523 1509 1300 1305 1292 1316 -Average 1540 1567 1494 1457 1253 1252 1250 1267 -Oxygen (wt) (ASTM D5599) Lab 4 0 401 572 1129 0 368 527 1088
Table B1 Summary Data for FACE Gasoline Blends with Ethanol
41
Specific Tests FACE Gasoline Blend A B Target Ethanol Content 0 10 15 30 0 10 15 30 Distillation (˚F) (ASTM D86) Lab 1 IBP 90 106 99 99 97 105 103 101 5 122 127 122 126 133 128 126 129 10 140 134 131 135 149 135 134 138 20 165 145 144 146 175 147 146 149 30 186 153 152 153 196 155 154 155 40 198 159 156 156 209 165 159 159 50 204 202 159 158 214 211 165 161 60 207 208 204 159 218 217 214 162 70 210 211 210 160 221 219 219 163 80 213 214 213 161 226 225 224 165 90 219 222 219 211 236 234 234 230 95 228 233 229 224 248 247 246 242 FBP 262 261 263 260 280 271 270 266
Specific Tests FACE Gasoline Blend C H Target Ethanol Content 0 10 15 30 0 10 15 30 Distillation (˚F) (ASTM D86) Lab 1 IBP 93 104 102 107 98 96 105 106 5 126 126 123 130 127 123 125 127 10 139 131 131 136 143 132 134 138 20 157 140 140 145 170 145 147 152 30 174 147 147 151 194 153 156 159 40 188 153 153 156 213 167 161 163 50 201 183 157 159 229 217 182 166 60 210 208 176 161 243 236 235 169 70 218 217 215 162 263 255 253 175 80 227 226 223 165 291 283 282 268 90 245 244 241 233 329 322 323 312 95 274 274 269 261 357 351 351 343 FBP 330 331 322 324 408 401 407 396
42

11
314 API Gravity and Density
The API gravities and densities of the fuels were measured using ASTM method D4052 (8) The
agreement between the values measured in this project and the values reported in the CPChem COAs
The individual values are listed in the Summary Table A1 in Appendix A The average of both values are
plotted in the bar charts in Figures 36 and 37 for API Gravity and density respectively As expected the
FACE Gasolines (D G H and J) having the highest aromatics content have the lowest API Gravities and
highest densities
Figure 36 API Gravities of FACE Gasolines
Figure 37 Densities of FACE Gasolines
7495
7135
7330
5870
6360
6860
54555580
7440
5910
0
5
10
15
20
25
30
35
40
45
50
55
60
65
70
75
80
A B C D E F G H I J
API G
ravity
FACE Gasoline
API Gravity ‐ FACE Gasolines
0685
0697
0691
0743
0725
0707
0760
0755
0697
0742
0645
065
0655
066
0665
067
0675
068
0685
069
0695
07
0705
071
0715
072
0725
073
0735
074
0745
075
0755
076
0765
077
A B C D E F G H I J
Density
(gml)
FACE Gasoline
Density ‐ FACE Gasolines
12
315 Net Heat of Combustion (NHC)
Net Heats of Combustion were measured using ASTM method D240 (9) The values are depicted in the
bar charts in Figure 38 In addition for two of the FACE Gasolines (C and J) the values were also
measured using ASTM method D4809 (10) The D4809 values were very close to those obtained from
method D240 (within 100 BTUlb) TheD240 values range from 18602 to 19251 BTUlb As expected
the FACE Gasolines having the highest aromatics content (D G H and J) have the lowest net heat of
combustion The FACE Gasolines having saturates content gt90 (A B C and I) have the highest net
heat of combustion
Figure 38 ASTM D240 Net Heats of Combustion of FACE Gasolines
19251
19187
19257
18649
18884
19072
1860218625
19225
18731
18200
18400
18600
18800
19000
19200
19400
A B C D E F G H I J
Net Heat o
f Com
bustion (BTU
lb) (A
STM D240)
FACE Gasoline
Net Heat of Combustion ‐ FACE Gasolines
13
32 CHEMICAL PROPERTIES OF FACE GASOLINES
The various types of hydrocarbons in the fuels were characterized by several techniques including
supercritical fluid chromatography (SFC) and detailed hydrocarbon analysis (DHA) by gas
chromatography using a flame ionization detector (GC‐FID) In addition the carbon hydrogen and
sulfur contents were measured Results are reported in the following sections
321 Aromatics by Supercritical Fluid Chromatography (SFC)
The SFC method of ASTM D5186 (11) separates the hydrocarbons into three fractions monoaromatics
polyaromatics and non‐aromatics and characterizes the composition in terms of mass Bar graphs of
the results are presented in Figure 39 Samples of FACE Gasolines B D E G and H were analyzed by
two labs The results from the two labs were very close to each other and so the averages are depicted
in the figure FACE Gasolines A B C and I have nonromatics levels gt90 wt FACE Gasolines D G and
H have the highest amounts of monoaromatics with values ranging from 394‐420 wt FACE
Gasolines E G and H appear to have about 1 wt polyaromatics
Figure 39 Compositions of FACE Gasolines by Supercritical Fluid Chromatography (ASTM D5186)
070 790 600
4175
14001000
39404200
040
3870
015
100
110125
030
9930
9210 9400
5810
85009000
59505675
9960
6100
0
10
20
30
40
50
60
70
80
90
100
A B C D E F G H I J
Composition (Wt )
FACE GASOLINE
SFC Composition ‐ FACE Gasolines
MonoAromatics PolyAromatics NonAromatics
14
322 Hydrocarbons by Detailed Hydrocarbon Analysis (DHA)
Detailed Hydrocarbon Analyses were performed by two labs using gas chromatography with flame
ionization detectors (GC‐FID) This technique enables the determination of concentration on a species‐
by‐species basis provided that retention factors have been determined for each species in the fuel The
results from both labs were very close to each other Bubble charts of the average concentration values
(in volume ) are depicted in Figure 310 for the low sensitivity fuels and Figure 311 for the high
sensitivity fuels on a carbon number basis for the five hydrocarbon classes n‐paraffins iso‐paraffins
naphthenes aromatics and olefins
In general the low sensitivity FACE Gasolines are characterized by large amounts of low sensitivity
components such as n‐paraffins and iso‐paraffins The high sensitivity FACE Gasolines contain more high
sensitivity components such as olefins and naphthenes than the low sensitivity fuels
The total concentration of components within each of the five hydrocarbon classes were added and the
sums are reported in the bar charts in Figure 312 The n‐paraffin levels range from 225‐316 vol for
the four FACE Gasolines (C D H and J) that had targets of 25 vol For the other FACE Gasolines that
had a target level of 5 vol the n‐paraffins levels range from 44‐117 vol The aromatics levels range
from 317‐358 vol for the four FACE Gasolines (D G H and J) that had targets of 35 vol For the
other six FACE Gasolines that had a target level of 5 vol the aromatics levels range from 0‐109 vol
The C7 aromatic is toluene the C8 aromatics consist of a mix of ethylbenzene and the xylene isomers
the C9 aromatics consist of a mix of trimethylbenzenes and methylethylbenzenes and the C10 aromatics
consist of a mix of tetramethylbenzenes dimethylethylbenzenes and methylpropylbenzenes FACE
Gasoline E a high sensitivity fuel has a naphthene content of 208 vol mainly cyclopentane and
cyclohexane Three other high sensitivity fuels (F G and H) have naphthenes concentrations of about
11 vol mainly cyclopentane Those high sensitivity fuels also have the highest olefins content with
concentrations ranging from 68‐127 vol FACE Gasoline I also has 64 vol olefins The C6 olefin is
1‐hexene The C5 olefins consist of a mix of 2‐pentene and methyl butenes In contrast to the high
sensitivity fuels Gasoline D which was designed to be low sensitivity but ended up in the high
sensitivity range has essentially no naphthenes or olefins Its high sensitivity is derived from its high
aromatics content
The C5 isoparaffin in all of the fuels is 2‐methylbutane The C6 isoparaffins consist of a mix of 2‐ and 3‐
methyl pentanes and 23 dimethyl butane The C7 isoparaffins in most of the FACE Gasolines consist of a
mix of 2‐ and 3‐methyl hexanes and 23‐ and 24‐dimethylpentanes The C8 isoparaffins are
predominantly trimethylpentanes with more than 50 of those being isooctane (224
trimethylpentane) The other isomers are mainly 24‐ and 25 dimethylhexanes and 2‐methyl 3‐ethyl
pentane
15
Figure 310 Detailed Hydrocarbon Analyses of Low Sensitivity FACE Gasolines
122 44 219 451 11
48 65
065
3 4 5 6 7 8 9 10 11
Carbon Number
FACE Gasoline A ‐ Detailed Hydrocarbon Analysis (vol)
isoparaffins
n‐paraffins
cycloparaffins
aromatics
olefins
104 13 137 587 16
59
39 37
3 4 5 6 7 8 9 10 11
Carbon Number
FACE Gasoline B ‐ Detailed Hydrocarbon Analysis (vol)
isoparaffins
cycloparaffins
aromatics
olefins
n‐paraffins
64 27 117 468 20 075
30 06
31 118 100
3 4 5 6 7 8 9 10 11
Carbon Number
FACE Gasoline C ‐ Detailed Hydrocarbon Analysis (vol)
isoparaffins
cycloparaffins
aromatics
olefins
n‐paraffins
12 410
99 35 150 46
47 114 70
3 4 5 6 7 8 9 10 11
Carbon Number
FACE Gasoline D ‐ Detailed Hydrocarbon Analysis (vol)
isoparaffins
cycloparaffins
aromatics
olefins
n‐paraffins
41 34 99 321 236 11
07 135
24
11
59
3 4 5 6 7 8 9 10 11
Carbon Number
FACE Gasoline I ‐ Detailed Hydrocarbon Analysis (vol)
isoparaffins
n‐paraffins
cycloparaffins
aromatics
olefins
327
90 124 95
22
14 131 145 29
06
3 4 5 6 7 8 9 10 11
Carbon Number
FACE Gasoline J ‐ Detailed Hydrocarbon Analysis (vol)
isoparaffins
n‐paraffins
cycloparaffins
aromatics
olefins
16
Figure 311 Detailed Hydrocarbon Analyses of High Sensitivity FACE Gasolines
64 68 143 165 18 07
70 105 19 10 04
46 17 18 16 08
21 82 09
29 06 37
3 4 5 6 7 8 9 10 11
Carbon Number
FACE Gasoline E ‐ Detailed Hydrocarbon Analysis (vol)
isoparaffins
cycloparaffins
aromatics
olefins
n‐paraffins
82 64 134 378 14
21 21
100
76
89
3 4 5 6 7 8 9 10 11
Carbon Number
FACE Gasoline F ‐ Detailed Hydrocarbon Analysis (vol)
isoparaffins
n‐paraffins
cycloparaffins
aromatics
olefins
65 66 72 152 16 10
74 09 16 10
15 33 218 54 14
36 25 10
37 07 10
3 4 5 6 7 8 9 10 11
Carbon Number
FACE Gasoline G ‐ Detailed Hydrocarbon Analysis (vol)
isoparaffins
cycloparaffins
aromatics
olefins
n‐paraffins
28 54 71 39 22 09
66 08 17 10
10 95 117 83 43 14
29 21 09
54 05 145 08
3 4 5 6 7 8 9 10 11
Carbon Number
FACE Gasoline H ‐ Detailed Hydrocarbon Analysis (vol)
isoparaffins
cycloparaffins
aromatics
olefins
n‐paraffins
17
Figure 312 Detailed Hydrocarbon Analyses Comparisons of FACE Gasolines
A comparison of the composition results from the DHA and SFC methods is presented in Figure 313 for
the low sensitivity fuels and Figure 314 for the high sensitivity fuels Also included are Fluorescent
Indicator Absorption (FIA ndash ASTM D1319 (12)) composition results reported on the CPChem COAs Since
the FIA method determines total saturates the DHA results for n‐paraffins iso‐paraffins and
naphthenes must be added together to enable the comparison between those two methods Similarly
since the SFC method directly measures aromatics and total non‐aromatics are determined by
difference the olefins amount must be added to the total saturate levels from FIA and DHA to enable
comparisons with the non‐aromatics values from SFC The appropriate comparison categories are
indicated by dashed lines in Figures 313 and 314 Of the three methods SFC generally gives the
highest level of aromatics and FIA the lowest The DHA aromatics values are closer to the FIA levels than
to the SFC levels The DHA olefins are fairly close to the FIA results
117
80
244 241
7944 67
225144
316
860
859
697
421
459
676
384
228
745336
16
01
01208
110
115105
33
23
13
127
94
8168
64
06
58 39
334
10977
336 358
12
317
0
10
20
30
40
50
60
70
80
90
100
A B C D E F G H I J
Composition ( vol)
FACE GASOLINE
DHA Composition ‐ FACE Gasolines
n‐paraffins isoparaffins naphthenes olefins aromatics
18
Figure 313 Comparison of Composition Methods FACE Low Sensitivity Gasolines
Figure 314 Comparison of Composition Methods FACE High Sensitivity Gasolines
117
80
244
144
316
860 859
697
745336
16
01 0433
23
13 64
06
58 3912
317
996951 975
929
712
04
07 04 62
10
42 21 09
278
993
921 940996
610
07
79 6004
390
0
10
20
30
40
50
60
70
80
90
100
DHA FIA SFC DHA FIA SFC DHA FIA SFC DHA FIA SFC DHA FIA SFC
Composition ( )
FACE GASOLINE
Composition ‐ Low Sensitivity FACE Gasolines
n‐paraffins isoparaffins naphthenes olefins aromatics saturates nonaromatics
A B C I J
241
7944 67
225
421
459
676
384
228
01
208
110
115 105
127
94
81 68
334
10977
336 358
701
780
856
587 568
04
99
86
7879
295
12158
335 353
581
850900
595568
419
150100
405432
0
10
20
30
40
50
60
70
80
90
100
DHA FIA SFC DHA FIA SFC DHA FIA SFC DHA FIA SFC DHA FIA SFC
Composition ( )
FACE GASOLINE
Composition ‐ High Sensitivity FACE Gasolines
n‐paraffins isoparaffins naphthenes olefins aromatics saturates nonaromatics
D E F G H
19
323 Elemental Analyses
Carbon and hydrogen contents were measured by two labs using ASTM method D5291 (13) The
average results are presented in the bar graphs in figure 315 The carbon contents range from 8399‐
8748 wt and the hydrogen contents range from1252‐1601 wt As expected the FACE Gasolines
having the highest aromatics content (D G H and J) have the highest carbon and lowest hydrogen
contents
Figure 315 Carbon and Hydrogen Elemental Analyses of FACE Gasolines
8399 8443 8453 8646 8547 8496 8670 87488414 8624
1601 1557 1547 1354 1453 1504 1330 12521586 1376
0
10
20
30
40
50
60
70
80
90
100
A B C D E F G H I J
Compo
sition
(wt)
FACE Gasoline
Carbon‐Hydrogen Elemental Analyses
Hydrogen
Carbon
20
Sulfur content was measured by one lab ASTM method D5453 (14) The results displayed in the bar
charts in Figure 316 are essentially identical to the values reported on the CPChem COAs All FACE
Gasolines had ultra‐low sulfur levels FACE Gasolines E G and H had the highest levels at 21 22 and 15
ppm sulfur The other fuels had levels ranging from 2‐6 ppm
Figure 316 Sulfur Levels of FACE Gasolines
6
4 4
2
21
2
22
15
2 2
0
5
10
15
20
25
A B C D E F G H I J
Sulfur Content (p
pm)
FACE Gasoline
Sulfur Content ‐ FACE Gasolines
21
4 ANALYTICAL RESULTS FOR FACE GASOLINES BLENDED WITH ETHANOL
Although the FACE Gasolines were not formulated with ethanol the expectation is that some potential
users will be interested in testing the fuels with ethanol added To assist selection of fuels for those
studies four FACE Gasolines were selected for blending with levels of 10 15 and 30 vol ethanol The
fuels selected for this purpose were A B C and H The positions of these fuels in the design matrix are
shown below
In this section results of the analyses of the ethanol blends are discussed Chevron Phillips 66 BP and
a contract laboratory conducted the analyses As mentioned previously future production runs that are
required to remake fuels that sell out likely will results in some changes to the fuel property values
reported here
41 ASTM TEST RESULTS
ASTM methods were used to measure the ethanol content RON MON API gravity density distillation
profiles RVP and net heats of combustion of all of the ethanol blends made with the FACE Gasolines
The results of these analyses are summarized below and in Table A2 located in the Appendix
411 Ethanol Content
FACE Gasolines A B C and H were blended with nominally 10 15 and 30 vol ethanol The
concentration of ethanol in each blend were determined using ASTM method D5599 (15) (coupled with
ASTM D4052 density measurement) and by detailed hydrocarbon analysis using gas chromatography
with a flame ionization detector The results for both methods were in excellent agreement for all fuels
as shown below in Table 41
Table 41 Measured Ethanol Content of FACE Gasoline Blends
Ethanol Content (vol)
A B C H
10 15 30 10 15 30 10 15 30 10 15 30
D5599 101 147 299 100 147 302 102 146 295 102 146 303
DHA 100 146 301 100 148 301 103 148 299 102 147 304
22
412 RON MON and Octane Sensitivity
RON values were measured in CFR engines per ASTM method D2699 (4) Although the measurements
were conducted in four labs the lab‐to‐lab reproducibility was very good so only the average values are
reported here (but individual values are reported in Table A2) Average RON values for each fuel are
presented in Figure 41 For all four of these FACE Gasolines the RON values continue to increase even
at the 30 ethanol level although the rates of increase are lower than at lower ethanol levels FACE
Gasoline B has the highest RON at all ethanol levels with a value of about 106 at the 30 ethanol level
FACE Gasolines A and C have essentially the same RON values at all ethanol levels with RON values of
about 102 at the 30 ethanol level FACE Gasoline H without ethanol has a higher RON than A and C
but a lower RON at the 15 and 30 ethanol levels
Figure 41 RON Values of FACE Gasoline Blends with Ethanol
MON values were measured in CFR engines per ASTM method D2700 (5) Although the measurements were conducted in four labs the lab‐to‐lab reproducibility was very good so only the average values are reported here (but individual values are reported in Appendix A2) The MON values for each fuel are
presented in Figure 42 FACE Gasoline B has the highest MON values at all ethanol levels but unlike the other FACE Gasolines the MON value did not increase with ethanol contents above 10 vol The MON values for FACE Gasolines A and C were essentially the same and higher than those for FACE Gasoline H
80081082083084085086087088089090091092093094095096097098099010001010102010301040105010601070108010901100
0 5 10 15 20 25 30 35
RON
Ethanol (vol)
RON Values ‐ FACE Gasoline + Ethanol Blends
FACE A
FACE B
FACE H
FACE C
23
Figure 42 MON Values of FACE Gasoline Blends with Ethanol
Octane Sensitivity (S=RON‐MON) values are presented in Figure 43 As expected due to the relatively high sensitivity of ethanol the sensitivities of all four FACE Gasolines increase as the ethanol content increases FACE Gasoline H has the highest sensitivity at all ethanol levels except at 30 vol ethanol where the sensitivity of the FACE Gasoline B blend becomes slightly higher with values of 124 and 132 respectively The sensitivities for FACE Gasolines A and C are very similar to each other and although lower than the blends for the other FACE Gasolines have the highest rates of increase at the 30 level
Figure 43 Octane Sensitivities FACE Gasoline Blends with Ethanol
750
760
770
780
790
800
810
820
830
840
850
860
870
880
890
900
910
920
930
940
950
0 5 10 15 20 25 30 35
MON
Ethanol (vol)
MON Values ‐ FACE Gasoline + Ethanol Blends
FACE A
FACE B
FACE H
FACE C
00
10
20
30
40
50
60
70
80
90
100
110
120
130
140
0 5 10 15 20 25 30 35
S
Ethanol (vol)
Octane Sensitivity (S) ‐ FACE Gasoline + Ethanol Blends
FACE A
FACE B
FACE H
FACE C
24
413 Distillation Characteristics
The distillation properties of the fuels were determined by ASTM D86 (6) The values are plotted in
Figure 44 and tabulated in Table A2 in the Appendix The behavior and shapes of the curves are very
similar For a given gasoline all of the ethanol blends start at about the same IBP The blends
containing ethanol then follow the same curve which is lower than the base gasoline At a certain point
the ethanol blends then rise quickly to rejoin the distillation curve of the base gasoline The lower the
ethanol content of the blend the earlier (lower distilled volume ) the curve rejoins the base gasoline
curve
Figure 44 ASTM D86 Distillation Profiles for FACE Gasoline Blends with Ethanol
50
100
150
200
250
300
0 10 20 30 40 50 60 70 80 90 100
Temperature (˚ C)
Volume Distilled
D86 Distillation ‐ FACE A Gasoline + Ethanol Blends
0 EtOH
10 EtOH
15 EtOH
30 EtOH
50
100
150
200
250
300
0 10 20 30 40 50 60 70 80 90 100
Temperature (˚ C)
Volume Distilled
D86 Distillation ‐ FACE B Gasoline + Ethanol Blends
0 EtOH
10 EtOH
15 EtOH
30 EtOH
50
100
150
200
250
300
350
0 10 20 30 40 50 60 70 80 90 100
Temperature (˚ C)
Volume Distilled
D86 Distillation ‐ FACE C Gasoline + Ethanol Blends
0 EtOH
10 EtOH
15 EtOH
30 EtOH
50
100
150
200
250
300
350
400
450
0 10 20 30 40 50 60 70 80 90 100
Temperature (˚ C)
Volume Distilled
D86 Distillation ‐ FACE H Gasoline + Ethanol Blends
0 EtOH
10 EtOH
15 EtOH
30 EtOH
25
414 Reid Vapor Pressure (RVP)
The RVPs were determined using ASTM method D5191 (7) The values are plotted in Figure 45 For all
fuels the RVP appears to peak between 10 and 15 vol ethanol and then starts to decrease as the
ethanol content increases further
Figure 45 Reid Vapor Pressures for FACE Gasoline Blends with Ethanol
415 API Gravity and Density
The API gravities and densities of the fuels were measured by two labs using ASTM method D4052 (8) The values from the two labs were in excellent agreement and are listed in Table A2 The average density values are presented in Figure 46 For all of the FACE Gasolines the density increased as the ethanol content increased
Figure 46 Densities of FACE Gasoline Blends with Ethanol
7
75
8
85
9
95
10
0 5 10 15 20 25 30 35
RVP (psi)
Ethanol (vol)
Reid Vapor Pressure (RVP) ‐ FACE Gasoline + Ethanol Blends
FACE A
FACE B
FACE H
FACE C
0685 0697 0691
0759
0696 0705 0699
0761
0700 0710 0704
0763
0716 0724 0719
0768
0
01
02
03
04
05
06
07
08
09
1
A B C H
Density
(gm
l)
Ethanol (vol)
Density ‐ FACE Gasoline Blends with Ethanol
0
10
15
30
26
416 Net Heat of Combustion (NHC)
Net Heats of Combustion were measured by 2 labs using ASTM method D240 (9) For some fuels ASTM
method D4809 (10) was also used The values from both labs and both methods were very close to each
other and the average values are plotted in Figure 47 As expected since the net heat of combustion of
ethanol is lower than that of gasoline for all FACE Gasolines the net heat of combustion decreased as
ethanol content increased The decrease appeared to be linear with ethanol content The decrease
appeared to be steepest for FACE Gasoline B
Figure 47 Net Heat of Combustion of FACE Gasoline Blends with Ethanol
16000
16250
16500
16750
17000
17250
17500
17750
18000
18250
18500
18750
19000
19250
19500
0 5 10 15 20 25 30 35
Net Heat of C
ombustion (B
TUlb)
Ethanol (vol)
Net Heat of Combustion ‐ FACE Gasoline + Ethanol Blends
FACE A
FACE B
FACE H
FACE C
27
5 SUMMARY AND CONCLUSIONS
A subteam of the CRC AVFL FACE Working Group has designed a matrix of reference gasolines
known as the FACE Gasolines A commercial vendor has produced and made the fuels available
for purchase in research quantities It is expected that this will enable consistent comparisons
of engine and combustion results from different laboratories and test platforms based on the
use of the same set of fuels
The matrix is designed around four parameters expected to be of importance for advanced
gasoline engines RON octane sensitivity aromatics content and n‐paraffins content
Statistical methods were used to identify potential candidate formulations and down‐select to a
tractable number of 10 formulations
Detailed analyses were performed on the physical and chemical properties of the final fuel
formulations
Generally the property values measured in the current study agreed very well with the values
reported on the fuel blender (ChevronPhillips Chemical Company ‐ CPChem) Certificates of
Analyses (COAs)
As expected conflicts in the target properties for some of the fuels (such as high aromatics level
coupled with low octane sensitivity) led to some trade‐offs that resulted in some deviation in
the actual properties from the design properties
The RON values come close to meeting the targets for most of the fuels Fuels E H and J have
values that are 24‐38 units higher than the targets
Three of the four ldquohighrdquo sensitivity fuels have measured values of 59‐71 that are lower than
the target value of 10 Two of the ldquolowrdquo sensitivity fuels have measured values (34‐37) that are
a bit higher than the target value of le2 One of the low sensitivity design fuels (ldquoDrdquo) has a value
of 72 that actually effectively makes it a high sensitivity fuel
Detailed hydrocarbon analyses (DHA) indicate that the n‐paraffins contents range from 225‐
316 vol for the four FACE Gasolines that had targets of 25 vol and from 44‐117 vol for
the six FACE Gasolines that had targets of 5 vol
DHAs indicate that the aromatics contents range from 317‐358 vol for the four FACE
Gasolines that had a target of 35 vol and 0‐109 vol for the other fuels that had a target of 5
vol
The high sensitivity fuels contained the high sensitivity components of naphthenes (105‐208
vol) and olefins (68‐127 vol) The exception was Gasoline ldquoDrdquo which had neither of these
components but whose high sensitivity was derived from aromatics components
Five of the FACE Gasolines (ldquoArdquo ldquoBrdquo ldquoCrdquo ldquoFrdquo and ldquoIrdquo) are very rich in isoparaffins with contents ge
676 vol
Aromatics values determined by SFC were generally higher than the values obtained from DHA
The DHA olefins values were close to the FIA values reported on the CPChem COAs
The fuels having the highest aromatics content also have the highest densities and highest net
heats of combustion on an energy content per volume basis
With regards to distillation properties for all fuels the initial boiling points (IBPs) are in a
narrow range of 90‐110˚F although the end boiling points (EBPs) range from 253‐410˚F Three
28
of the high sensitivity fuels have the highest EBPs The two low‐mid RON fuels having low n‐
paraffins and low aromatics have the lowest EBPs
All of the FACE Gasolines have ultra‐low levels of sulfur with the highest value at 22 ppm S and
most fuels having le 6 ppm S
For the four FACE Gasolines blended with ethanol RON continues to increase as the ethanol
levels increase to 30 vol although the rate of increase is lower as the ethanol content
increases FACE Gasoline B which has the highest RON of 96 has the highest RON at all ethanol
levels with a value of about 106 at 30 ethanol At the same ethanol level FACE Gasolines A
and C have essentially the same RON values FACE Gasoline H starts with a higher RON value
than those of A or C but has a lower value at blend levels of 15 and 30 vol
MON increased as the ethanol level increased for FACE Gasolines A C and H The MON values
for these fuels were essentially constant even though the highest MON values were found for
the ethanol blends with FACE Gasoline B
For all blends octane sensitivity increased as ethanol content increased with the highest values
of 12‐13 for 30 vol ethanol blends with FACE Gasolines B and H
The D86 distillation curve trends are similar for the four FACE Gasolines For a given gasoline all
blends start at the same point At around 10 vol distilled the curves for the blends with
ethanol diverge from and are lower than the curves for the base gasolines At a certain point
the distillation curves for the blends rise quickly and re‐join the curve for the parent base fuel
The distillation curves for the 30 vol ethanol blends are generally flat as a function of
increasing vol distilled and only start to increase again at about 70‐80 vol distilled when
most of the ethanol has been distilled from the liquid
The Reid Vapor Pressures (RVPs) peak at about 10‐15 vol
Densities increase slightly as ethanol increases while net heats of combustion decrease
29
6 REFERENCES
1 Alnajjar M Cannella B Dettman H Fairbridge C Franz J Gallant T Gieleciak R Hager D Lay C Lewis S Ratcliff M Sluder S Storey J Yin H Zigler B ldquoChemical and Physical Properties of the Fuels for Advanced Combustion Engines (FACE) Research Diesel Fuelsrdquo CRC Report No FACE‐1 (2010)
2 Gallant T Franz J Alnajjar M Storey J Lewis S Sluder S Cannella W Fairbridge C Hager D Dettman H Luecke J Ratcliff M Zigler ldquoFuels for Advanced Combustion Engines Research Diesel Fuels Analysis of Physical and Chemical Propertiesrdquo SAE Paper 2009‐01‐2769 (2009)
3 CannellaW Fairbridge C Arboleda P Bays T Dettman H Foster M Gieleciak R Gunter G Hager D Lay C Lewis S Luecke J Sluder S Zigler B ldquoDetailed Characterization of the Physical and Chemical Properties of the Reformulated FACE Diesel Fuels FD2B FD4B and FD7Brdquo CRC Report AVFL‐19‐1 (2013)
4 ASTM International Standard Test Method for Research Octane Number of Spark‐Ignition Engine Fuel ASTM D2699 (ASTM International Pennsylvania 2009)
5 ASTM International Standard Test Method for Motor Octane Number of Spark‐Ignition Engine Fuel ASTM D2700 (ASTM International Pennsylvania 2009)
6 ASTM International Standard Test Method for Distillation of Petroleum Products at Atmospheric Pressure ASTM D86‐09e1 (ASTM International Pennsylvania 2009)
7 ASTM International Standard Test Method for Vapor Pressure of Petroleum Products (Mini‐Method) ASTM D5191 (ASTM International Pennsylvania 2009)
8 ASTM International Standard Test Method for Density and Relative Density of Liquids by Digital Density Meter ASTM D4052‐96(2002)e1 (ASTM International Pennsylvania 2002)
9 ASTM International Standard Test Method for Heat of Combustion of Liquid Hydrocarbon Fuels by Bomb Calorimeter ASTM D240‐02(2007) (ASTM International Pennsylvania 2007)
10 ASTM International Standard Test Method for Heat of Combustion of Liquid Hydrocarbon Fuels by Bomb Calorimeter ASTM D4809 (2007) (ASTM International Pennsylvania 2007)
11 ASTM International Standard Test Method for Determination of Aromatic Content and Polynuclear Aromatic Content of Diesel Fuels and Aviation Turbine Fuels by Supercritical Fluid Chromatography ASTM D5186‐03(2009) (ASTM International Pennsylvania 2009)
12 ASTM International Standard Test Method for Hydrocarbon Types in Liquid Petroleum Products by Fluorescent Indicator Adsorption ASTM D1319‐08 (ASTM International Pennsylvania 2008)
13 ASTM International Standard Test Methods for Instrumental Determination of Carbon Hydrogen and Nitrogen in Petroleum Products and Lubricants ASTM D5291‐02(2007) (ASTM International Pennsylvania 2007)
14 ASTM International Standard Test Methods for Determination of Total Sulfur in Light Hydrocarbons Spark‐Ignition Engine Fuel Diesel Engine Fuel and Engine Oil by Ultraviolet Fluorescence ASTM D5453(2007) (ASTM International Pennsylvania 2007)
15 ASTM International Standard Test Methods for Determination of Oxygenates in Gasoline by Gas Chromatography and Oxygen Selective Flame Ionization Detection ASTM D5599 (2007) (ASTM International Pennsylvania 2007)
30
31
Appendix A
Properties of FACE Gasolines
32
Table A1 Summary Data for FACE Gasolines
Specific Tests FACE Gasoline A B C D E F G H I J Research Octane Number (RON) (ASTM D2699) -Lab 1 843 958 850 946 871 940 969 870 700 738 -Lab 2 839 960 840 939 877 960 869 -Lab 3 835 957 840 -Average 839 958 843 942 874 940 965 869 7015 738 -CPChem COA 835 960 847 932 875 944 968 869 703 718 Motor Octane Number (MON) (ASTM D2700) -Lab 1 836 923 830 872 813 881 857 797 695 701 -Lab 2 833 931 830 868 808 860 799 -Lab 3 835 919 829 -Average 835 924 830 870 811 881 858 798 695 701 -CPChem COA 836 926 836 878 815 888 858 793 696 688 Sensitivity (RON-MON) -Lab 1 07 35 20 74 58 59 112 73 05 37 -Lab 2 06 29 10 71 69 100 70 -Lab 3 0 38 11 -Average 04 34 13 72 63 59 107 72 05 37 -CPChem COA -01 34 11 54 60 56 110 76 07 30 API Gravity (API˚) (ASTM D4052) -CPChem COA 750 714 734 587 636 686 545 568 744 595 -Lab 1 749 713 732 587 636 686 546 548 744 587 -Average 7495 7135 733 587 636 686 5455 558 744 591 Density (ASTM D4052) -CPChem COA 0691 0743 0725 0707 0760 0697 0741 -Lab 1 0685 0697 0691 0743 0725 0707 0760 0759 0697 0743 -Average 0685 0697 0691 0743 0725 0707 0760 0759 0697 0742 RVP (psi) (D5191) -CPChem COA 81 74 74 68 67 78 72 75 75 75 -Lab 1 80 73 75 73 76 77 Net Heat of Combustion (BTUlb) (ASTM D4809) 19186 18680 Net Heat of Combustion (BTUlb) (ASTM D240) 19251 19187 19257 18649 18884 19072 18602 18625 19225 18731
33
TableA1 Summary Data for FACE Gasolines
Specific Tests FACE Gasoline A B C D E F G H I J Distillation (˚F) (ASTM D86) -CPChem IBP 93 95 95 88 110 108 93 94 100 101
5 104 128 120 129 131 129 122 123 123 111 10 132 145 136 148 142 142 135 140 156 162 20 160 172 154 176 155 156 158 168 177 206 30 183 194 171 198 166 168 183 192 186 217 40 197 207 187 212 177 180 210 211 191 224 50 203 213 200 221 186 193 240 227 195 231 60 207 216 210 229 197 206 270 242 199 242 70 210 220 218 235 208 217 306 262 203 261 80 213 225 226 280 222 225 328 291 207 291 90 219 235 243 330 267 240 343 327 213 316 95 227 248 270 340 343 261 363 358 220 330 FBP 269 283 328 363 405 294 403 410 259 358
-Lab 1 IBP 90 97 93 97 107 102 99 98 99 95 5 122 133 126 133 134 134 122 127 139 111
10 140 149 139 151 143 144 136 143 160 166 20 165 175 157 179 156 157 158 170 178 209 30 186 196 174 200 168 169 182 194 187 219 40 198 209 188 214 177 182 209 213 192 225 50 204 214 201 224 188 195 238 229 196 232 60 207 218 210 234 197 207 268 243 200 242 70 210 221 218 248 208 218 304 263 204 263 80 213 226 227 288 224 228 328 291 208 292
90 219 236 245 331 258 243 343 329 213 316 95 228 248 274 341 329 261 358 357 220 330 FBP 262 280 330 365 402 291 405 408 247 357
-Average IBP 915 96 94 925 1085 105 96 96 995 98 5 113 1305 123 131 1325 1315 122 125 131 111
10 136 147 1375 1495 1425 143 1355 1415 158 164 20 1625 1735 1555 1775 1555 1565 158 169 1775 203 30 1845 195 1725 199 167 1685 1825 193 1865 218 40 1975 208 1875 213 177 181 2095 212 1915 2245 50 2035 2135 2005 2225 187 194 239 228 1955 2315 60 207 217 210 2315 197 2065 269 2425 1995 242 70 210 2205 218 2415 208 2175 305 2625 2035 262 80 213 2255 2265 284 223 2265 328 291 2075 2915
90 219 2355 244 3305 2625 2415 343 328 213 316 95 2275 248 272 3405 336 261 3605 3575 220 330 FBP 2655 2815 329 364 4035 2925 404 409 253 3575
34
Table A1 Summary Data for FACE Gasolines
Specific Tests FACE Gasoline A B C D E F G H I J Elemental Analysis (ASTM D 5291) -Carbon (wt) -Lab 1 8398 8441 8497 8647 8547 8671 8792 8415 -Lab 4 8400 8444 8419 8645 8547 8496 8669 8703 8414 8624 -Average 8399 8443 8458 8646 8547 8496 8670 8748 8414 8624 -Hydrogen (wt) -Lab 1 1602 1559 1503 1353 1453 1329 1208 1585 -Lab 4 1600 1556 1585 1355 1453 1504 1331 1297 1586 1376 -Average 1601 1557 1547 1354 1453 1504 1330 1252 1586 1376 Sulfur by UV Fluorescence (ppmw) (ASTM D5453) -CPChem COA 4 4 3 2 21 2 20 15 2 2 -Lab 4 6 4 4 2 21 2 22 15 2 2 Hydrocarbons by FIA (vol) (ASTM D1319) -Aromatics (vol) CPChem COA 0 42 21 295 121 58 335 353 09 278 -Olefins (vol) CPChem COA 04 07 04 04 99 86 78 79 62 10 -Saturates (vol) CPChem COA 996 951 975 701 780 856 587 568 929 712 Aromatics by SFC (ASTM D5186) (Lab 1) -MonoAromatics (wt) -Lab 1 07 78 60 414 142 100 393 412 04 387 -Lab 2 80 421 138 395 428 -Average 07 79 60 4175 140 100 394 420 04 387 -PolyAromatics (wt) -Lab 1 0 0 0 03 11 0 10 10 0 03 -Lab 2 0 0 09 12 15 -Average 0 0 0 015 10 0 11 125 0 03 -NonAromatics (wt) -Lab 1 993 922 940 583 847 900 597 578 996 610 -Lab 2 920 579 850 593 557 -Average 993 921 940 581 8475 900 595 5675 996 610
35
Table A1 Summary Data for FACE Gasolines
Specific Tests FACE Gasolines A B C D E F G H I J Detailed Hydrocarbon Analyses by GC-FID -n-paraffins (vol) (Targets) (5) (5) (25) (25) (5) (5) (5) (25) (5) (25) -Lab 1 1144 783 2409 2346 771 434 662 2214 1441 3115 -Lab 2 1187 815 2476 2473 803 446 685 2283 1437 3212 -Average 1165 799 2443 2410 787 440 673 2249 1439 3164 -iso-paraffins (vol) -Lab 1 8562 8591 688 4206 4563 6765 3821 2322 7449 3362 -Lab 2 8635 8586 7066 4221 4621 6747 3864 2240 7459 3366 -Average 8599 8688 6973 4213 4592 6756 3843 2281 7454 3364 -cyclo-paraffins (vol) -Lab 1 192 021 048 010 2216 1078 1163 1035 324 234 -Lab 2 130 007 023 010 1945 1118 1140 1066 336 224 -Average 161 014 036 010 2081 1098 1152 1050 330 229 -aromatics (vol) (Targets) (5) (5) (5) (35) (5) (5) (35) (35) (5) (35) -Lab 1 073 601 409 3425 1121 805 3419 3597 120 3212 -Lab 2 003 568 374 3258 1062 739 3306 3555 110 3125 -Average 38 584 392 3341 1092 772 3363 3576 115 3169 -olefins (vol) -Lab 1 024 001 248 004 1146 978 851 714 643 066 -Lab 2 018 003 006 005 1392 905 771 650 627 054 -Average 021 002 127 04 1269 942 811 682 635 060
36
37
Appendix B
Properties of FACE Gasoline Blends with Ethanol
38
Table B1 Summary Data for FACE Gasoline Blends with Ethanol
Specific Tests FACE Gasoline Blend A B Ethanol Content (Vol ) 0 10 15 30 0 10 15 30 Ethanol Content (Vol ) (ASTM D5599) 0 1012 1469 2990 0 995 1473 3016 Research Octane Number (RON) (ASTM D2699) -Lab 1 843 922 951 1032 958 1015 1039 1067 -Lab 2 839 923 951 1017 960 1008 1023 1050 -Lab 3 835 917 946 1025 957 1012 1031 1069 -Lab 4 916 945 1018 1009 1026 1053 -Average 839 920 948 1023 958 1011 1030 1060 Motor Octane Number (MON) (ASTM D2700) -Lab 1 836 878 890 912 923 936 936 934 -Lab 2 833 874 891 917 931 935 934 931 -Lab 3 835 881 893 911 919 933 934 933 -Lab 4 884 901 916 935 936 933 -Average 835 879 894 914 924 935 935 933 Sensitivity (RON-MON) -Lab 1 07 44 61 120 35 79 103 133 -Lab 2 06 49 60 100 29 73 89 119 -Lab 3 0 36 53 114 38 79 97 136 -Lab 4 32 44 102 74 91 120 -Average 04 41 54 109 34 76 95 127 API Gravity (API˚) (ASTM D4052) -Lab 1 749 7164 7066 661 7131 690 6772 6375 -Lab 4 716 706 660 690 676 638 -Average 749 7162 7063 6605 7131 690 6766 6377 Density (ASTM D4052) -Lab 1 06849 06959 06992 07154 0697 07050 07096 07240 -Lab 4 06966 06999 07161 07055 07106 07244 -Average 06849 06963 06996 07158 0697 07053 07101 07242 RVP (psi) (D5191) Lab 1 83 95 94 91 73 87 86 83 Net Heat of Combustion (BTUlb) (ASTM D4809) 18308 Net Heat of Combustion (BTUlb) (ASTM D240) -Lab 1 19266 18294 18080 16751 19207 18319 17941 16631 -Lab 4 19236 18208 17963 16487 19168 18307 17696 16234 -Average 19251 18251 18021 16619 19187 18313 17818 16432
39
Table B1 Summary Data for FACE Gasoline Blends with Ethanol
Specific Tests FACE Gasoline Blend C H Target Ethanol Content (Vol ) 0 10 15 30 0 10 15 30 Ethanol Content (Vol) (ASTM D5599) 0 1018 1462 2949 0 1016 1459 3034 Research Octane Number (RON) (ASTM D2699) -Lab 1 850 918 951 1012 870 919 941 993 -Lab 2 840 920 950 1014 869 927 941 996 -Lab 3 840 917 946 1019 869 920 937 995 -Lab 4 914 945 1015 916 946 991 -Average 843 917 948 1015 869 921 941 994 Motor Octane Number (MON) (ASTM D2700) -Lab 1 830 876 893 921 797 821 835 861 -Lab 2 830 868 880 924 793 820 831 885 -Lab 3 829 876 887 909 799 817 829 858 -Lab 4 881 890 914 828 839 877 -Average 830 875 888 916 796 822 833 870 Sensitivity (RON-MON) -Lab 1 20 42 58 91 73 98 106 132 -Lab 2 10 52 70 90 76 107 110 111 -Lab 3 11 41 59 110 70 103 108 137 -Lab 4 33 55 101 88 107 114 -(RON)avg ndash (MON)avg 13 42 60 99 73 99 108 124 API Gravity (API˚) (ASTM D4052) -Lab 1 732 7069 6943 6523 5481 5416 5375 5247 -Lab 4 707 693 652 544 538 527 -Average 732 707 694 652 548 543 5377 526 Density (ASTM D4052) -Lab 1 06906 06991 07035 07186 07587 07614 07631 07684 -Lab 4 06997 07043 07192 07610 07636 07678 -Average 06994 07039 07189 07587 07612 07633 07681 RVP (psi) (D5191) Lab 1 75 86 85 83 76 88 87 84 Net Heat of Combustion (BTUlb) (ASTM D4809) 19186 18198 17955 16692 16265 Net Heat of Combustion (BTUlb) (ASTM D240) -Lab 1 19257 18375 18012 16739 18675 17891 17550 16369 -Lab 4 18576 17809 17408 16322 -Average 19257 18375 18012 16739 18625 17850 17479 16345
40
Table B1 Summary Data for FACE Gasoline Blends with Ethanol
Specific Tests FACE Gasoline Blend A B Target Ethanol Content 0 10 15 30 0 10 15 30 Ethanol Content (Vol) -ASTM D5599 0 1012 1469 2990 0 995 1473 3016 -Detailed Hydrocarbon Analysis - GCFID -Lab 1 0 1000 1463 3017 0 1001 1476 3014 Elemental Analysis (ASTM D 5291) -Carbon (wt) -Lab 1 8443 8178 7941 7306 8465 8172 8029 7346 -Lab 4 8433 8085 7823 7361 8471 8110 7921 7380 -Average 8438 8131 7882 7333 8468 8141 7975 7363 -Hydrogen (wt) -Lab 1 1543 1527 1484 1446 1473 1462 1442 1387 -Lab 4 1606 1573 1548 1515 1561 1540 1525 1487 -Average 1575 1550 1516 1481 1517 1501 1483 1437 -Oxygen (wt) (ASTM D5599) Lab 4 0 400 578 1150 0 389 571 1147
Specific Tests FACE Gasoline Blend C H Target Ethanol Content 0 10 15 30 0 10 15 30 Ethanol Content (Vol) -ASTM D5599 0 1018 1462 2949 0 1016 1459 3034 -Detailed Hydrocarbon Analysis - GCFID -Lab 1 0 1027 1483 2988 0 1021 1468 3040 Elemental Analysis (ASTM D 5291) -Carbon (wt) -Lab 1 8447 8200 7998 7336 8768 8402 8401 7624 -Lab 4 8419 8077 7909 7353 8720 8316 8150 7626 -Average 8433 8138 7954 7345 8744 8359 8276 7625 -Hydrogen (wt) -Lab 1 1494 1465 1465 1405 1205 1199 1207 1218 -Lab 4 1585 1668 1523 1509 1300 1305 1292 1316 -Average 1540 1567 1494 1457 1253 1252 1250 1267 -Oxygen (wt) (ASTM D5599) Lab 4 0 401 572 1129 0 368 527 1088
Table B1 Summary Data for FACE Gasoline Blends with Ethanol
41
Specific Tests FACE Gasoline Blend A B Target Ethanol Content 0 10 15 30 0 10 15 30 Distillation (˚F) (ASTM D86) Lab 1 IBP 90 106 99 99 97 105 103 101 5 122 127 122 126 133 128 126 129 10 140 134 131 135 149 135 134 138 20 165 145 144 146 175 147 146 149 30 186 153 152 153 196 155 154 155 40 198 159 156 156 209 165 159 159 50 204 202 159 158 214 211 165 161 60 207 208 204 159 218 217 214 162 70 210 211 210 160 221 219 219 163 80 213 214 213 161 226 225 224 165 90 219 222 219 211 236 234 234 230 95 228 233 229 224 248 247 246 242 FBP 262 261 263 260 280 271 270 266
Specific Tests FACE Gasoline Blend C H Target Ethanol Content 0 10 15 30 0 10 15 30 Distillation (˚F) (ASTM D86) Lab 1 IBP 93 104 102 107 98 96 105 106 5 126 126 123 130 127 123 125 127 10 139 131 131 136 143 132 134 138 20 157 140 140 145 170 145 147 152 30 174 147 147 151 194 153 156 159 40 188 153 153 156 213 167 161 163 50 201 183 157 159 229 217 182 166 60 210 208 176 161 243 236 235 169 70 218 217 215 162 263 255 253 175 80 227 226 223 165 291 283 282 268 90 245 244 241 233 329 322 323 312 95 274 274 269 261 357 351 351 343 FBP 330 331 322 324 408 401 407 396
42
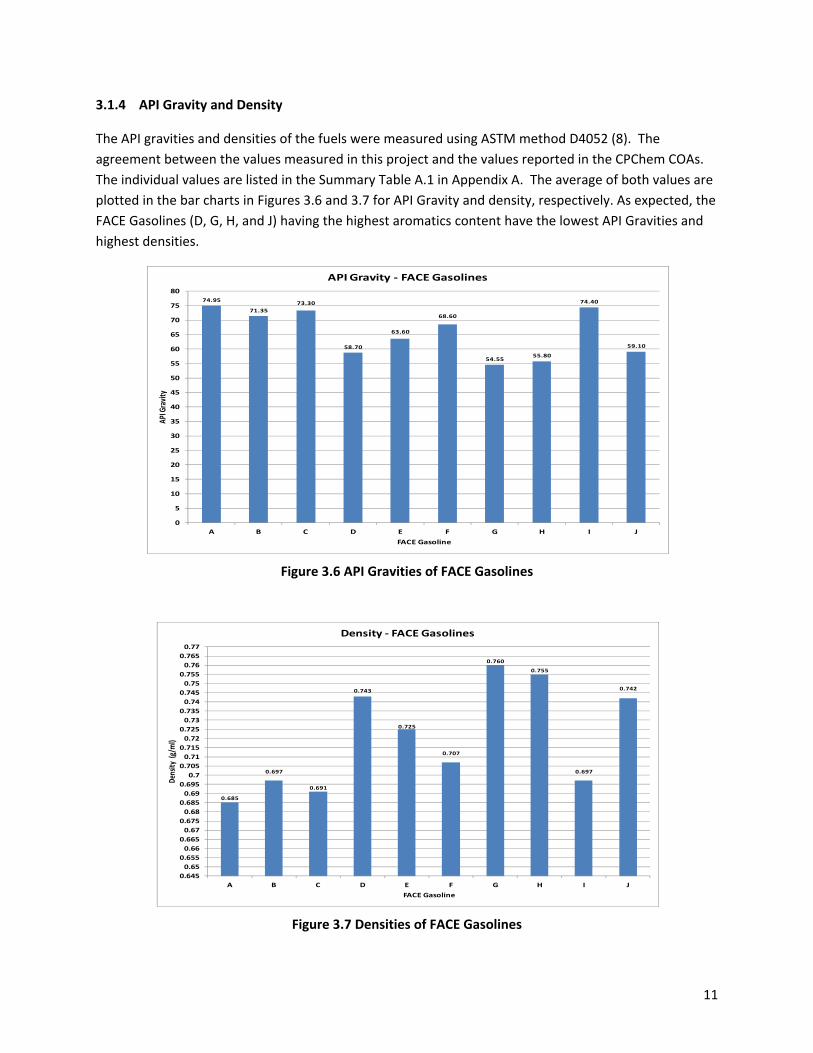
12
315 Net Heat of Combustion (NHC)
Net Heats of Combustion were measured using ASTM method D240 (9) The values are depicted in the
bar charts in Figure 38 In addition for two of the FACE Gasolines (C and J) the values were also
measured using ASTM method D4809 (10) The D4809 values were very close to those obtained from
method D240 (within 100 BTUlb) TheD240 values range from 18602 to 19251 BTUlb As expected
the FACE Gasolines having the highest aromatics content (D G H and J) have the lowest net heat of
combustion The FACE Gasolines having saturates content gt90 (A B C and I) have the highest net
heat of combustion
Figure 38 ASTM D240 Net Heats of Combustion of FACE Gasolines
19251
19187
19257
18649
18884
19072
1860218625
19225
18731
18200
18400
18600
18800
19000
19200
19400
A B C D E F G H I J
Net Heat o
f Com
bustion (BTU
lb) (A
STM D240)
FACE Gasoline
Net Heat of Combustion ‐ FACE Gasolines
13
32 CHEMICAL PROPERTIES OF FACE GASOLINES
The various types of hydrocarbons in the fuels were characterized by several techniques including
supercritical fluid chromatography (SFC) and detailed hydrocarbon analysis (DHA) by gas
chromatography using a flame ionization detector (GC‐FID) In addition the carbon hydrogen and
sulfur contents were measured Results are reported in the following sections
321 Aromatics by Supercritical Fluid Chromatography (SFC)
The SFC method of ASTM D5186 (11) separates the hydrocarbons into three fractions monoaromatics
polyaromatics and non‐aromatics and characterizes the composition in terms of mass Bar graphs of
the results are presented in Figure 39 Samples of FACE Gasolines B D E G and H were analyzed by
two labs The results from the two labs were very close to each other and so the averages are depicted
in the figure FACE Gasolines A B C and I have nonromatics levels gt90 wt FACE Gasolines D G and
H have the highest amounts of monoaromatics with values ranging from 394‐420 wt FACE
Gasolines E G and H appear to have about 1 wt polyaromatics
Figure 39 Compositions of FACE Gasolines by Supercritical Fluid Chromatography (ASTM D5186)
070 790 600
4175
14001000
39404200
040
3870
015
100
110125
030
9930
9210 9400
5810
85009000
59505675
9960
6100
0
10
20
30
40
50
60
70
80
90
100
A B C D E F G H I J
Composition (Wt )
FACE GASOLINE
SFC Composition ‐ FACE Gasolines
MonoAromatics PolyAromatics NonAromatics
14
322 Hydrocarbons by Detailed Hydrocarbon Analysis (DHA)
Detailed Hydrocarbon Analyses were performed by two labs using gas chromatography with flame
ionization detectors (GC‐FID) This technique enables the determination of concentration on a species‐
by‐species basis provided that retention factors have been determined for each species in the fuel The
results from both labs were very close to each other Bubble charts of the average concentration values
(in volume ) are depicted in Figure 310 for the low sensitivity fuels and Figure 311 for the high
sensitivity fuels on a carbon number basis for the five hydrocarbon classes n‐paraffins iso‐paraffins
naphthenes aromatics and olefins
In general the low sensitivity FACE Gasolines are characterized by large amounts of low sensitivity
components such as n‐paraffins and iso‐paraffins The high sensitivity FACE Gasolines contain more high
sensitivity components such as olefins and naphthenes than the low sensitivity fuels
The total concentration of components within each of the five hydrocarbon classes were added and the
sums are reported in the bar charts in Figure 312 The n‐paraffin levels range from 225‐316 vol for
the four FACE Gasolines (C D H and J) that had targets of 25 vol For the other FACE Gasolines that
had a target level of 5 vol the n‐paraffins levels range from 44‐117 vol The aromatics levels range
from 317‐358 vol for the four FACE Gasolines (D G H and J) that had targets of 35 vol For the
other six FACE Gasolines that had a target level of 5 vol the aromatics levels range from 0‐109 vol
The C7 aromatic is toluene the C8 aromatics consist of a mix of ethylbenzene and the xylene isomers
the C9 aromatics consist of a mix of trimethylbenzenes and methylethylbenzenes and the C10 aromatics
consist of a mix of tetramethylbenzenes dimethylethylbenzenes and methylpropylbenzenes FACE
Gasoline E a high sensitivity fuel has a naphthene content of 208 vol mainly cyclopentane and
cyclohexane Three other high sensitivity fuels (F G and H) have naphthenes concentrations of about
11 vol mainly cyclopentane Those high sensitivity fuels also have the highest olefins content with
concentrations ranging from 68‐127 vol FACE Gasoline I also has 64 vol olefins The C6 olefin is
1‐hexene The C5 olefins consist of a mix of 2‐pentene and methyl butenes In contrast to the high
sensitivity fuels Gasoline D which was designed to be low sensitivity but ended up in the high
sensitivity range has essentially no naphthenes or olefins Its high sensitivity is derived from its high
aromatics content
The C5 isoparaffin in all of the fuels is 2‐methylbutane The C6 isoparaffins consist of a mix of 2‐ and 3‐
methyl pentanes and 23 dimethyl butane The C7 isoparaffins in most of the FACE Gasolines consist of a
mix of 2‐ and 3‐methyl hexanes and 23‐ and 24‐dimethylpentanes The C8 isoparaffins are
predominantly trimethylpentanes with more than 50 of those being isooctane (224
trimethylpentane) The other isomers are mainly 24‐ and 25 dimethylhexanes and 2‐methyl 3‐ethyl
pentane
15
Figure 310 Detailed Hydrocarbon Analyses of Low Sensitivity FACE Gasolines
122 44 219 451 11
48 65
065
3 4 5 6 7 8 9 10 11
Carbon Number
FACE Gasoline A ‐ Detailed Hydrocarbon Analysis (vol)
isoparaffins
n‐paraffins
cycloparaffins
aromatics
olefins
104 13 137 587 16
59
39 37
3 4 5 6 7 8 9 10 11
Carbon Number
FACE Gasoline B ‐ Detailed Hydrocarbon Analysis (vol)
isoparaffins
cycloparaffins
aromatics
olefins
n‐paraffins
64 27 117 468 20 075
30 06
31 118 100
3 4 5 6 7 8 9 10 11
Carbon Number
FACE Gasoline C ‐ Detailed Hydrocarbon Analysis (vol)
isoparaffins
cycloparaffins
aromatics
olefins
n‐paraffins
12 410
99 35 150 46
47 114 70
3 4 5 6 7 8 9 10 11
Carbon Number
FACE Gasoline D ‐ Detailed Hydrocarbon Analysis (vol)
isoparaffins
cycloparaffins
aromatics
olefins
n‐paraffins
41 34 99 321 236 11
07 135
24
11
59
3 4 5 6 7 8 9 10 11
Carbon Number
FACE Gasoline I ‐ Detailed Hydrocarbon Analysis (vol)
isoparaffins
n‐paraffins
cycloparaffins
aromatics
olefins
327
90 124 95
22
14 131 145 29
06
3 4 5 6 7 8 9 10 11
Carbon Number
FACE Gasoline J ‐ Detailed Hydrocarbon Analysis (vol)
isoparaffins
n‐paraffins
cycloparaffins
aromatics
olefins
16
Figure 311 Detailed Hydrocarbon Analyses of High Sensitivity FACE Gasolines
64 68 143 165 18 07
70 105 19 10 04
46 17 18 16 08
21 82 09
29 06 37
3 4 5 6 7 8 9 10 11
Carbon Number
FACE Gasoline E ‐ Detailed Hydrocarbon Analysis (vol)
isoparaffins
cycloparaffins
aromatics
olefins
n‐paraffins
82 64 134 378 14
21 21
100
76
89
3 4 5 6 7 8 9 10 11
Carbon Number
FACE Gasoline F ‐ Detailed Hydrocarbon Analysis (vol)
isoparaffins
n‐paraffins
cycloparaffins
aromatics
olefins
65 66 72 152 16 10
74 09 16 10
15 33 218 54 14
36 25 10
37 07 10
3 4 5 6 7 8 9 10 11
Carbon Number
FACE Gasoline G ‐ Detailed Hydrocarbon Analysis (vol)
isoparaffins
cycloparaffins
aromatics
olefins
n‐paraffins
28 54 71 39 22 09
66 08 17 10
10 95 117 83 43 14
29 21 09
54 05 145 08
3 4 5 6 7 8 9 10 11
Carbon Number
FACE Gasoline H ‐ Detailed Hydrocarbon Analysis (vol)
isoparaffins
cycloparaffins
aromatics
olefins
n‐paraffins
17
Figure 312 Detailed Hydrocarbon Analyses Comparisons of FACE Gasolines
A comparison of the composition results from the DHA and SFC methods is presented in Figure 313 for
the low sensitivity fuels and Figure 314 for the high sensitivity fuels Also included are Fluorescent
Indicator Absorption (FIA ndash ASTM D1319 (12)) composition results reported on the CPChem COAs Since
the FIA method determines total saturates the DHA results for n‐paraffins iso‐paraffins and
naphthenes must be added together to enable the comparison between those two methods Similarly
since the SFC method directly measures aromatics and total non‐aromatics are determined by
difference the olefins amount must be added to the total saturate levels from FIA and DHA to enable
comparisons with the non‐aromatics values from SFC The appropriate comparison categories are
indicated by dashed lines in Figures 313 and 314 Of the three methods SFC generally gives the
highest level of aromatics and FIA the lowest The DHA aromatics values are closer to the FIA levels than
to the SFC levels The DHA olefins are fairly close to the FIA results
117
80
244 241
7944 67
225144
316
860
859
697
421
459
676
384
228
745336
16
01
01208
110
115105
33
23
13
127
94
8168
64
06
58 39
334
10977
336 358
12
317
0
10
20
30
40
50
60
70
80
90
100
A B C D E F G H I J
Composition ( vol)
FACE GASOLINE
DHA Composition ‐ FACE Gasolines
n‐paraffins isoparaffins naphthenes olefins aromatics
18
Figure 313 Comparison of Composition Methods FACE Low Sensitivity Gasolines
Figure 314 Comparison of Composition Methods FACE High Sensitivity Gasolines
117
80
244
144
316
860 859
697
745336
16
01 0433
23
13 64
06
58 3912
317
996951 975
929
712
04
07 04 62
10
42 21 09
278
993
921 940996
610
07
79 6004
390
0
10
20
30
40
50
60
70
80
90
100
DHA FIA SFC DHA FIA SFC DHA FIA SFC DHA FIA SFC DHA FIA SFC
Composition ( )
FACE GASOLINE
Composition ‐ Low Sensitivity FACE Gasolines
n‐paraffins isoparaffins naphthenes olefins aromatics saturates nonaromatics
A B C I J
241
7944 67
225
421
459
676
384
228
01
208
110
115 105
127
94
81 68
334
10977
336 358
701
780
856
587 568
04
99
86
7879
295
12158
335 353
581
850900
595568
419
150100
405432
0
10
20
30
40
50
60
70
80
90
100
DHA FIA SFC DHA FIA SFC DHA FIA SFC DHA FIA SFC DHA FIA SFC
Composition ( )
FACE GASOLINE
Composition ‐ High Sensitivity FACE Gasolines
n‐paraffins isoparaffins naphthenes olefins aromatics saturates nonaromatics
D E F G H
19
323 Elemental Analyses
Carbon and hydrogen contents were measured by two labs using ASTM method D5291 (13) The
average results are presented in the bar graphs in figure 315 The carbon contents range from 8399‐
8748 wt and the hydrogen contents range from1252‐1601 wt As expected the FACE Gasolines
having the highest aromatics content (D G H and J) have the highest carbon and lowest hydrogen
contents
Figure 315 Carbon and Hydrogen Elemental Analyses of FACE Gasolines
8399 8443 8453 8646 8547 8496 8670 87488414 8624
1601 1557 1547 1354 1453 1504 1330 12521586 1376
0
10
20
30
40
50
60
70
80
90
100
A B C D E F G H I J
Compo
sition
(wt)
FACE Gasoline
Carbon‐Hydrogen Elemental Analyses
Hydrogen
Carbon
20
Sulfur content was measured by one lab ASTM method D5453 (14) The results displayed in the bar
charts in Figure 316 are essentially identical to the values reported on the CPChem COAs All FACE
Gasolines had ultra‐low sulfur levels FACE Gasolines E G and H had the highest levels at 21 22 and 15
ppm sulfur The other fuels had levels ranging from 2‐6 ppm
Figure 316 Sulfur Levels of FACE Gasolines
6
4 4
2
21
2
22
15
2 2
0
5
10
15
20
25
A B C D E F G H I J
Sulfur Content (p
pm)
FACE Gasoline
Sulfur Content ‐ FACE Gasolines
21
4 ANALYTICAL RESULTS FOR FACE GASOLINES BLENDED WITH ETHANOL
Although the FACE Gasolines were not formulated with ethanol the expectation is that some potential
users will be interested in testing the fuels with ethanol added To assist selection of fuels for those
studies four FACE Gasolines were selected for blending with levels of 10 15 and 30 vol ethanol The
fuels selected for this purpose were A B C and H The positions of these fuels in the design matrix are
shown below
In this section results of the analyses of the ethanol blends are discussed Chevron Phillips 66 BP and
a contract laboratory conducted the analyses As mentioned previously future production runs that are
required to remake fuels that sell out likely will results in some changes to the fuel property values
reported here
41 ASTM TEST RESULTS
ASTM methods were used to measure the ethanol content RON MON API gravity density distillation
profiles RVP and net heats of combustion of all of the ethanol blends made with the FACE Gasolines
The results of these analyses are summarized below and in Table A2 located in the Appendix
411 Ethanol Content
FACE Gasolines A B C and H were blended with nominally 10 15 and 30 vol ethanol The
concentration of ethanol in each blend were determined using ASTM method D5599 (15) (coupled with
ASTM D4052 density measurement) and by detailed hydrocarbon analysis using gas chromatography
with a flame ionization detector The results for both methods were in excellent agreement for all fuels
as shown below in Table 41
Table 41 Measured Ethanol Content of FACE Gasoline Blends
Ethanol Content (vol)
A B C H
10 15 30 10 15 30 10 15 30 10 15 30
D5599 101 147 299 100 147 302 102 146 295 102 146 303
DHA 100 146 301 100 148 301 103 148 299 102 147 304
22
412 RON MON and Octane Sensitivity
RON values were measured in CFR engines per ASTM method D2699 (4) Although the measurements
were conducted in four labs the lab‐to‐lab reproducibility was very good so only the average values are
reported here (but individual values are reported in Table A2) Average RON values for each fuel are
presented in Figure 41 For all four of these FACE Gasolines the RON values continue to increase even
at the 30 ethanol level although the rates of increase are lower than at lower ethanol levels FACE
Gasoline B has the highest RON at all ethanol levels with a value of about 106 at the 30 ethanol level
FACE Gasolines A and C have essentially the same RON values at all ethanol levels with RON values of
about 102 at the 30 ethanol level FACE Gasoline H without ethanol has a higher RON than A and C
but a lower RON at the 15 and 30 ethanol levels
Figure 41 RON Values of FACE Gasoline Blends with Ethanol
MON values were measured in CFR engines per ASTM method D2700 (5) Although the measurements were conducted in four labs the lab‐to‐lab reproducibility was very good so only the average values are reported here (but individual values are reported in Appendix A2) The MON values for each fuel are
presented in Figure 42 FACE Gasoline B has the highest MON values at all ethanol levels but unlike the other FACE Gasolines the MON value did not increase with ethanol contents above 10 vol The MON values for FACE Gasolines A and C were essentially the same and higher than those for FACE Gasoline H
80081082083084085086087088089090091092093094095096097098099010001010102010301040105010601070108010901100
0 5 10 15 20 25 30 35
RON
Ethanol (vol)
RON Values ‐ FACE Gasoline + Ethanol Blends
FACE A
FACE B
FACE H
FACE C
23
Figure 42 MON Values of FACE Gasoline Blends with Ethanol
Octane Sensitivity (S=RON‐MON) values are presented in Figure 43 As expected due to the relatively high sensitivity of ethanol the sensitivities of all four FACE Gasolines increase as the ethanol content increases FACE Gasoline H has the highest sensitivity at all ethanol levels except at 30 vol ethanol where the sensitivity of the FACE Gasoline B blend becomes slightly higher with values of 124 and 132 respectively The sensitivities for FACE Gasolines A and C are very similar to each other and although lower than the blends for the other FACE Gasolines have the highest rates of increase at the 30 level
Figure 43 Octane Sensitivities FACE Gasoline Blends with Ethanol
750
760
770
780
790
800
810
820
830
840
850
860
870
880
890
900
910
920
930
940
950
0 5 10 15 20 25 30 35
MON
Ethanol (vol)
MON Values ‐ FACE Gasoline + Ethanol Blends
FACE A
FACE B
FACE H
FACE C
00
10
20
30
40
50
60
70
80
90
100
110
120
130
140
0 5 10 15 20 25 30 35
S
Ethanol (vol)
Octane Sensitivity (S) ‐ FACE Gasoline + Ethanol Blends
FACE A
FACE B
FACE H
FACE C
24
413 Distillation Characteristics
The distillation properties of the fuels were determined by ASTM D86 (6) The values are plotted in
Figure 44 and tabulated in Table A2 in the Appendix The behavior and shapes of the curves are very
similar For a given gasoline all of the ethanol blends start at about the same IBP The blends
containing ethanol then follow the same curve which is lower than the base gasoline At a certain point
the ethanol blends then rise quickly to rejoin the distillation curve of the base gasoline The lower the
ethanol content of the blend the earlier (lower distilled volume ) the curve rejoins the base gasoline
curve
Figure 44 ASTM D86 Distillation Profiles for FACE Gasoline Blends with Ethanol
50
100
150
200
250
300
0 10 20 30 40 50 60 70 80 90 100
Temperature (˚ C)
Volume Distilled
D86 Distillation ‐ FACE A Gasoline + Ethanol Blends
0 EtOH
10 EtOH
15 EtOH
30 EtOH
50
100
150
200
250
300
0 10 20 30 40 50 60 70 80 90 100
Temperature (˚ C)
Volume Distilled
D86 Distillation ‐ FACE B Gasoline + Ethanol Blends
0 EtOH
10 EtOH
15 EtOH
30 EtOH
50
100
150
200
250
300
350
0 10 20 30 40 50 60 70 80 90 100
Temperature (˚ C)
Volume Distilled
D86 Distillation ‐ FACE C Gasoline + Ethanol Blends
0 EtOH
10 EtOH
15 EtOH
30 EtOH
50
100
150
200
250
300
350
400
450
0 10 20 30 40 50 60 70 80 90 100
Temperature (˚ C)
Volume Distilled
D86 Distillation ‐ FACE H Gasoline + Ethanol Blends
0 EtOH
10 EtOH
15 EtOH
30 EtOH
25
414 Reid Vapor Pressure (RVP)
The RVPs were determined using ASTM method D5191 (7) The values are plotted in Figure 45 For all
fuels the RVP appears to peak between 10 and 15 vol ethanol and then starts to decrease as the
ethanol content increases further
Figure 45 Reid Vapor Pressures for FACE Gasoline Blends with Ethanol
415 API Gravity and Density
The API gravities and densities of the fuels were measured by two labs using ASTM method D4052 (8) The values from the two labs were in excellent agreement and are listed in Table A2 The average density values are presented in Figure 46 For all of the FACE Gasolines the density increased as the ethanol content increased
Figure 46 Densities of FACE Gasoline Blends with Ethanol
7
75
8
85
9
95
10
0 5 10 15 20 25 30 35
RVP (psi)
Ethanol (vol)
Reid Vapor Pressure (RVP) ‐ FACE Gasoline + Ethanol Blends
FACE A
FACE B
FACE H
FACE C
0685 0697 0691
0759
0696 0705 0699
0761
0700 0710 0704
0763
0716 0724 0719
0768
0
01
02
03
04
05
06
07
08
09
1
A B C H
Density
(gm
l)
Ethanol (vol)
Density ‐ FACE Gasoline Blends with Ethanol
0
10
15
30
26
416 Net Heat of Combustion (NHC)
Net Heats of Combustion were measured by 2 labs using ASTM method D240 (9) For some fuels ASTM
method D4809 (10) was also used The values from both labs and both methods were very close to each
other and the average values are plotted in Figure 47 As expected since the net heat of combustion of
ethanol is lower than that of gasoline for all FACE Gasolines the net heat of combustion decreased as
ethanol content increased The decrease appeared to be linear with ethanol content The decrease
appeared to be steepest for FACE Gasoline B
Figure 47 Net Heat of Combustion of FACE Gasoline Blends with Ethanol
16000
16250
16500
16750
17000
17250
17500
17750
18000
18250
18500
18750
19000
19250
19500
0 5 10 15 20 25 30 35
Net Heat of C
ombustion (B
TUlb)
Ethanol (vol)
Net Heat of Combustion ‐ FACE Gasoline + Ethanol Blends
FACE A
FACE B
FACE H
FACE C
27
5 SUMMARY AND CONCLUSIONS
A subteam of the CRC AVFL FACE Working Group has designed a matrix of reference gasolines
known as the FACE Gasolines A commercial vendor has produced and made the fuels available
for purchase in research quantities It is expected that this will enable consistent comparisons
of engine and combustion results from different laboratories and test platforms based on the
use of the same set of fuels
The matrix is designed around four parameters expected to be of importance for advanced
gasoline engines RON octane sensitivity aromatics content and n‐paraffins content
Statistical methods were used to identify potential candidate formulations and down‐select to a
tractable number of 10 formulations
Detailed analyses were performed on the physical and chemical properties of the final fuel
formulations
Generally the property values measured in the current study agreed very well with the values
reported on the fuel blender (ChevronPhillips Chemical Company ‐ CPChem) Certificates of
Analyses (COAs)
As expected conflicts in the target properties for some of the fuels (such as high aromatics level
coupled with low octane sensitivity) led to some trade‐offs that resulted in some deviation in
the actual properties from the design properties
The RON values come close to meeting the targets for most of the fuels Fuels E H and J have
values that are 24‐38 units higher than the targets
Three of the four ldquohighrdquo sensitivity fuels have measured values of 59‐71 that are lower than
the target value of 10 Two of the ldquolowrdquo sensitivity fuels have measured values (34‐37) that are
a bit higher than the target value of le2 One of the low sensitivity design fuels (ldquoDrdquo) has a value
of 72 that actually effectively makes it a high sensitivity fuel
Detailed hydrocarbon analyses (DHA) indicate that the n‐paraffins contents range from 225‐
316 vol for the four FACE Gasolines that had targets of 25 vol and from 44‐117 vol for
the six FACE Gasolines that had targets of 5 vol
DHAs indicate that the aromatics contents range from 317‐358 vol for the four FACE
Gasolines that had a target of 35 vol and 0‐109 vol for the other fuels that had a target of 5
vol
The high sensitivity fuels contained the high sensitivity components of naphthenes (105‐208
vol) and olefins (68‐127 vol) The exception was Gasoline ldquoDrdquo which had neither of these
components but whose high sensitivity was derived from aromatics components
Five of the FACE Gasolines (ldquoArdquo ldquoBrdquo ldquoCrdquo ldquoFrdquo and ldquoIrdquo) are very rich in isoparaffins with contents ge
676 vol
Aromatics values determined by SFC were generally higher than the values obtained from DHA
The DHA olefins values were close to the FIA values reported on the CPChem COAs
The fuels having the highest aromatics content also have the highest densities and highest net
heats of combustion on an energy content per volume basis
With regards to distillation properties for all fuels the initial boiling points (IBPs) are in a
narrow range of 90‐110˚F although the end boiling points (EBPs) range from 253‐410˚F Three
28
of the high sensitivity fuels have the highest EBPs The two low‐mid RON fuels having low n‐
paraffins and low aromatics have the lowest EBPs
All of the FACE Gasolines have ultra‐low levels of sulfur with the highest value at 22 ppm S and
most fuels having le 6 ppm S
For the four FACE Gasolines blended with ethanol RON continues to increase as the ethanol
levels increase to 30 vol although the rate of increase is lower as the ethanol content
increases FACE Gasoline B which has the highest RON of 96 has the highest RON at all ethanol
levels with a value of about 106 at 30 ethanol At the same ethanol level FACE Gasolines A
and C have essentially the same RON values FACE Gasoline H starts with a higher RON value
than those of A or C but has a lower value at blend levels of 15 and 30 vol
MON increased as the ethanol level increased for FACE Gasolines A C and H The MON values
for these fuels were essentially constant even though the highest MON values were found for
the ethanol blends with FACE Gasoline B
For all blends octane sensitivity increased as ethanol content increased with the highest values
of 12‐13 for 30 vol ethanol blends with FACE Gasolines B and H
The D86 distillation curve trends are similar for the four FACE Gasolines For a given gasoline all
blends start at the same point At around 10 vol distilled the curves for the blends with
ethanol diverge from and are lower than the curves for the base gasolines At a certain point
the distillation curves for the blends rise quickly and re‐join the curve for the parent base fuel
The distillation curves for the 30 vol ethanol blends are generally flat as a function of
increasing vol distilled and only start to increase again at about 70‐80 vol distilled when
most of the ethanol has been distilled from the liquid
The Reid Vapor Pressures (RVPs) peak at about 10‐15 vol
Densities increase slightly as ethanol increases while net heats of combustion decrease
29
6 REFERENCES
1 Alnajjar M Cannella B Dettman H Fairbridge C Franz J Gallant T Gieleciak R Hager D Lay C Lewis S Ratcliff M Sluder S Storey J Yin H Zigler B ldquoChemical and Physical Properties of the Fuels for Advanced Combustion Engines (FACE) Research Diesel Fuelsrdquo CRC Report No FACE‐1 (2010)
2 Gallant T Franz J Alnajjar M Storey J Lewis S Sluder S Cannella W Fairbridge C Hager D Dettman H Luecke J Ratcliff M Zigler ldquoFuels for Advanced Combustion Engines Research Diesel Fuels Analysis of Physical and Chemical Propertiesrdquo SAE Paper 2009‐01‐2769 (2009)
3 CannellaW Fairbridge C Arboleda P Bays T Dettman H Foster M Gieleciak R Gunter G Hager D Lay C Lewis S Luecke J Sluder S Zigler B ldquoDetailed Characterization of the Physical and Chemical Properties of the Reformulated FACE Diesel Fuels FD2B FD4B and FD7Brdquo CRC Report AVFL‐19‐1 (2013)
4 ASTM International Standard Test Method for Research Octane Number of Spark‐Ignition Engine Fuel ASTM D2699 (ASTM International Pennsylvania 2009)
5 ASTM International Standard Test Method for Motor Octane Number of Spark‐Ignition Engine Fuel ASTM D2700 (ASTM International Pennsylvania 2009)
6 ASTM International Standard Test Method for Distillation of Petroleum Products at Atmospheric Pressure ASTM D86‐09e1 (ASTM International Pennsylvania 2009)
7 ASTM International Standard Test Method for Vapor Pressure of Petroleum Products (Mini‐Method) ASTM D5191 (ASTM International Pennsylvania 2009)
8 ASTM International Standard Test Method for Density and Relative Density of Liquids by Digital Density Meter ASTM D4052‐96(2002)e1 (ASTM International Pennsylvania 2002)
9 ASTM International Standard Test Method for Heat of Combustion of Liquid Hydrocarbon Fuels by Bomb Calorimeter ASTM D240‐02(2007) (ASTM International Pennsylvania 2007)
10 ASTM International Standard Test Method for Heat of Combustion of Liquid Hydrocarbon Fuels by Bomb Calorimeter ASTM D4809 (2007) (ASTM International Pennsylvania 2007)
11 ASTM International Standard Test Method for Determination of Aromatic Content and Polynuclear Aromatic Content of Diesel Fuels and Aviation Turbine Fuels by Supercritical Fluid Chromatography ASTM D5186‐03(2009) (ASTM International Pennsylvania 2009)
12 ASTM International Standard Test Method for Hydrocarbon Types in Liquid Petroleum Products by Fluorescent Indicator Adsorption ASTM D1319‐08 (ASTM International Pennsylvania 2008)
13 ASTM International Standard Test Methods for Instrumental Determination of Carbon Hydrogen and Nitrogen in Petroleum Products and Lubricants ASTM D5291‐02(2007) (ASTM International Pennsylvania 2007)
14 ASTM International Standard Test Methods for Determination of Total Sulfur in Light Hydrocarbons Spark‐Ignition Engine Fuel Diesel Engine Fuel and Engine Oil by Ultraviolet Fluorescence ASTM D5453(2007) (ASTM International Pennsylvania 2007)
15 ASTM International Standard Test Methods for Determination of Oxygenates in Gasoline by Gas Chromatography and Oxygen Selective Flame Ionization Detection ASTM D5599 (2007) (ASTM International Pennsylvania 2007)
30
31
Appendix A
Properties of FACE Gasolines
32
Table A1 Summary Data for FACE Gasolines
Specific Tests FACE Gasoline A B C D E F G H I J Research Octane Number (RON) (ASTM D2699) -Lab 1 843 958 850 946 871 940 969 870 700 738 -Lab 2 839 960 840 939 877 960 869 -Lab 3 835 957 840 -Average 839 958 843 942 874 940 965 869 7015 738 -CPChem COA 835 960 847 932 875 944 968 869 703 718 Motor Octane Number (MON) (ASTM D2700) -Lab 1 836 923 830 872 813 881 857 797 695 701 -Lab 2 833 931 830 868 808 860 799 -Lab 3 835 919 829 -Average 835 924 830 870 811 881 858 798 695 701 -CPChem COA 836 926 836 878 815 888 858 793 696 688 Sensitivity (RON-MON) -Lab 1 07 35 20 74 58 59 112 73 05 37 -Lab 2 06 29 10 71 69 100 70 -Lab 3 0 38 11 -Average 04 34 13 72 63 59 107 72 05 37 -CPChem COA -01 34 11 54 60 56 110 76 07 30 API Gravity (API˚) (ASTM D4052) -CPChem COA 750 714 734 587 636 686 545 568 744 595 -Lab 1 749 713 732 587 636 686 546 548 744 587 -Average 7495 7135 733 587 636 686 5455 558 744 591 Density (ASTM D4052) -CPChem COA 0691 0743 0725 0707 0760 0697 0741 -Lab 1 0685 0697 0691 0743 0725 0707 0760 0759 0697 0743 -Average 0685 0697 0691 0743 0725 0707 0760 0759 0697 0742 RVP (psi) (D5191) -CPChem COA 81 74 74 68 67 78 72 75 75 75 -Lab 1 80 73 75 73 76 77 Net Heat of Combustion (BTUlb) (ASTM D4809) 19186 18680 Net Heat of Combustion (BTUlb) (ASTM D240) 19251 19187 19257 18649 18884 19072 18602 18625 19225 18731
33
TableA1 Summary Data for FACE Gasolines
Specific Tests FACE Gasoline A B C D E F G H I J Distillation (˚F) (ASTM D86) -CPChem IBP 93 95 95 88 110 108 93 94 100 101
5 104 128 120 129 131 129 122 123 123 111 10 132 145 136 148 142 142 135 140 156 162 20 160 172 154 176 155 156 158 168 177 206 30 183 194 171 198 166 168 183 192 186 217 40 197 207 187 212 177 180 210 211 191 224 50 203 213 200 221 186 193 240 227 195 231 60 207 216 210 229 197 206 270 242 199 242 70 210 220 218 235 208 217 306 262 203 261 80 213 225 226 280 222 225 328 291 207 291 90 219 235 243 330 267 240 343 327 213 316 95 227 248 270 340 343 261 363 358 220 330 FBP 269 283 328 363 405 294 403 410 259 358
-Lab 1 IBP 90 97 93 97 107 102 99 98 99 95 5 122 133 126 133 134 134 122 127 139 111
10 140 149 139 151 143 144 136 143 160 166 20 165 175 157 179 156 157 158 170 178 209 30 186 196 174 200 168 169 182 194 187 219 40 198 209 188 214 177 182 209 213 192 225 50 204 214 201 224 188 195 238 229 196 232 60 207 218 210 234 197 207 268 243 200 242 70 210 221 218 248 208 218 304 263 204 263 80 213 226 227 288 224 228 328 291 208 292
90 219 236 245 331 258 243 343 329 213 316 95 228 248 274 341 329 261 358 357 220 330 FBP 262 280 330 365 402 291 405 408 247 357
-Average IBP 915 96 94 925 1085 105 96 96 995 98 5 113 1305 123 131 1325 1315 122 125 131 111
10 136 147 1375 1495 1425 143 1355 1415 158 164 20 1625 1735 1555 1775 1555 1565 158 169 1775 203 30 1845 195 1725 199 167 1685 1825 193 1865 218 40 1975 208 1875 213 177 181 2095 212 1915 2245 50 2035 2135 2005 2225 187 194 239 228 1955 2315 60 207 217 210 2315 197 2065 269 2425 1995 242 70 210 2205 218 2415 208 2175 305 2625 2035 262 80 213 2255 2265 284 223 2265 328 291 2075 2915
90 219 2355 244 3305 2625 2415 343 328 213 316 95 2275 248 272 3405 336 261 3605 3575 220 330 FBP 2655 2815 329 364 4035 2925 404 409 253 3575
34
Table A1 Summary Data for FACE Gasolines
Specific Tests FACE Gasoline A B C D E F G H I J Elemental Analysis (ASTM D 5291) -Carbon (wt) -Lab 1 8398 8441 8497 8647 8547 8671 8792 8415 -Lab 4 8400 8444 8419 8645 8547 8496 8669 8703 8414 8624 -Average 8399 8443 8458 8646 8547 8496 8670 8748 8414 8624 -Hydrogen (wt) -Lab 1 1602 1559 1503 1353 1453 1329 1208 1585 -Lab 4 1600 1556 1585 1355 1453 1504 1331 1297 1586 1376 -Average 1601 1557 1547 1354 1453 1504 1330 1252 1586 1376 Sulfur by UV Fluorescence (ppmw) (ASTM D5453) -CPChem COA 4 4 3 2 21 2 20 15 2 2 -Lab 4 6 4 4 2 21 2 22 15 2 2 Hydrocarbons by FIA (vol) (ASTM D1319) -Aromatics (vol) CPChem COA 0 42 21 295 121 58 335 353 09 278 -Olefins (vol) CPChem COA 04 07 04 04 99 86 78 79 62 10 -Saturates (vol) CPChem COA 996 951 975 701 780 856 587 568 929 712 Aromatics by SFC (ASTM D5186) (Lab 1) -MonoAromatics (wt) -Lab 1 07 78 60 414 142 100 393 412 04 387 -Lab 2 80 421 138 395 428 -Average 07 79 60 4175 140 100 394 420 04 387 -PolyAromatics (wt) -Lab 1 0 0 0 03 11 0 10 10 0 03 -Lab 2 0 0 09 12 15 -Average 0 0 0 015 10 0 11 125 0 03 -NonAromatics (wt) -Lab 1 993 922 940 583 847 900 597 578 996 610 -Lab 2 920 579 850 593 557 -Average 993 921 940 581 8475 900 595 5675 996 610
35
Table A1 Summary Data for FACE Gasolines
Specific Tests FACE Gasolines A B C D E F G H I J Detailed Hydrocarbon Analyses by GC-FID -n-paraffins (vol) (Targets) (5) (5) (25) (25) (5) (5) (5) (25) (5) (25) -Lab 1 1144 783 2409 2346 771 434 662 2214 1441 3115 -Lab 2 1187 815 2476 2473 803 446 685 2283 1437 3212 -Average 1165 799 2443 2410 787 440 673 2249 1439 3164 -iso-paraffins (vol) -Lab 1 8562 8591 688 4206 4563 6765 3821 2322 7449 3362 -Lab 2 8635 8586 7066 4221 4621 6747 3864 2240 7459 3366 -Average 8599 8688 6973 4213 4592 6756 3843 2281 7454 3364 -cyclo-paraffins (vol) -Lab 1 192 021 048 010 2216 1078 1163 1035 324 234 -Lab 2 130 007 023 010 1945 1118 1140 1066 336 224 -Average 161 014 036 010 2081 1098 1152 1050 330 229 -aromatics (vol) (Targets) (5) (5) (5) (35) (5) (5) (35) (35) (5) (35) -Lab 1 073 601 409 3425 1121 805 3419 3597 120 3212 -Lab 2 003 568 374 3258 1062 739 3306 3555 110 3125 -Average 38 584 392 3341 1092 772 3363 3576 115 3169 -olefins (vol) -Lab 1 024 001 248 004 1146 978 851 714 643 066 -Lab 2 018 003 006 005 1392 905 771 650 627 054 -Average 021 002 127 04 1269 942 811 682 635 060
36
37
Appendix B
Properties of FACE Gasoline Blends with Ethanol
38
Table B1 Summary Data for FACE Gasoline Blends with Ethanol
Specific Tests FACE Gasoline Blend A B Ethanol Content (Vol ) 0 10 15 30 0 10 15 30 Ethanol Content (Vol ) (ASTM D5599) 0 1012 1469 2990 0 995 1473 3016 Research Octane Number (RON) (ASTM D2699) -Lab 1 843 922 951 1032 958 1015 1039 1067 -Lab 2 839 923 951 1017 960 1008 1023 1050 -Lab 3 835 917 946 1025 957 1012 1031 1069 -Lab 4 916 945 1018 1009 1026 1053 -Average 839 920 948 1023 958 1011 1030 1060 Motor Octane Number (MON) (ASTM D2700) -Lab 1 836 878 890 912 923 936 936 934 -Lab 2 833 874 891 917 931 935 934 931 -Lab 3 835 881 893 911 919 933 934 933 -Lab 4 884 901 916 935 936 933 -Average 835 879 894 914 924 935 935 933 Sensitivity (RON-MON) -Lab 1 07 44 61 120 35 79 103 133 -Lab 2 06 49 60 100 29 73 89 119 -Lab 3 0 36 53 114 38 79 97 136 -Lab 4 32 44 102 74 91 120 -Average 04 41 54 109 34 76 95 127 API Gravity (API˚) (ASTM D4052) -Lab 1 749 7164 7066 661 7131 690 6772 6375 -Lab 4 716 706 660 690 676 638 -Average 749 7162 7063 6605 7131 690 6766 6377 Density (ASTM D4052) -Lab 1 06849 06959 06992 07154 0697 07050 07096 07240 -Lab 4 06966 06999 07161 07055 07106 07244 -Average 06849 06963 06996 07158 0697 07053 07101 07242 RVP (psi) (D5191) Lab 1 83 95 94 91 73 87 86 83 Net Heat of Combustion (BTUlb) (ASTM D4809) 18308 Net Heat of Combustion (BTUlb) (ASTM D240) -Lab 1 19266 18294 18080 16751 19207 18319 17941 16631 -Lab 4 19236 18208 17963 16487 19168 18307 17696 16234 -Average 19251 18251 18021 16619 19187 18313 17818 16432
39
Table B1 Summary Data for FACE Gasoline Blends with Ethanol
Specific Tests FACE Gasoline Blend C H Target Ethanol Content (Vol ) 0 10 15 30 0 10 15 30 Ethanol Content (Vol) (ASTM D5599) 0 1018 1462 2949 0 1016 1459 3034 Research Octane Number (RON) (ASTM D2699) -Lab 1 850 918 951 1012 870 919 941 993 -Lab 2 840 920 950 1014 869 927 941 996 -Lab 3 840 917 946 1019 869 920 937 995 -Lab 4 914 945 1015 916 946 991 -Average 843 917 948 1015 869 921 941 994 Motor Octane Number (MON) (ASTM D2700) -Lab 1 830 876 893 921 797 821 835 861 -Lab 2 830 868 880 924 793 820 831 885 -Lab 3 829 876 887 909 799 817 829 858 -Lab 4 881 890 914 828 839 877 -Average 830 875 888 916 796 822 833 870 Sensitivity (RON-MON) -Lab 1 20 42 58 91 73 98 106 132 -Lab 2 10 52 70 90 76 107 110 111 -Lab 3 11 41 59 110 70 103 108 137 -Lab 4 33 55 101 88 107 114 -(RON)avg ndash (MON)avg 13 42 60 99 73 99 108 124 API Gravity (API˚) (ASTM D4052) -Lab 1 732 7069 6943 6523 5481 5416 5375 5247 -Lab 4 707 693 652 544 538 527 -Average 732 707 694 652 548 543 5377 526 Density (ASTM D4052) -Lab 1 06906 06991 07035 07186 07587 07614 07631 07684 -Lab 4 06997 07043 07192 07610 07636 07678 -Average 06994 07039 07189 07587 07612 07633 07681 RVP (psi) (D5191) Lab 1 75 86 85 83 76 88 87 84 Net Heat of Combustion (BTUlb) (ASTM D4809) 19186 18198 17955 16692 16265 Net Heat of Combustion (BTUlb) (ASTM D240) -Lab 1 19257 18375 18012 16739 18675 17891 17550 16369 -Lab 4 18576 17809 17408 16322 -Average 19257 18375 18012 16739 18625 17850 17479 16345
40
Table B1 Summary Data for FACE Gasoline Blends with Ethanol
Specific Tests FACE Gasoline Blend A B Target Ethanol Content 0 10 15 30 0 10 15 30 Ethanol Content (Vol) -ASTM D5599 0 1012 1469 2990 0 995 1473 3016 -Detailed Hydrocarbon Analysis - GCFID -Lab 1 0 1000 1463 3017 0 1001 1476 3014 Elemental Analysis (ASTM D 5291) -Carbon (wt) -Lab 1 8443 8178 7941 7306 8465 8172 8029 7346 -Lab 4 8433 8085 7823 7361 8471 8110 7921 7380 -Average 8438 8131 7882 7333 8468 8141 7975 7363 -Hydrogen (wt) -Lab 1 1543 1527 1484 1446 1473 1462 1442 1387 -Lab 4 1606 1573 1548 1515 1561 1540 1525 1487 -Average 1575 1550 1516 1481 1517 1501 1483 1437 -Oxygen (wt) (ASTM D5599) Lab 4 0 400 578 1150 0 389 571 1147
Specific Tests FACE Gasoline Blend C H Target Ethanol Content 0 10 15 30 0 10 15 30 Ethanol Content (Vol) -ASTM D5599 0 1018 1462 2949 0 1016 1459 3034 -Detailed Hydrocarbon Analysis - GCFID -Lab 1 0 1027 1483 2988 0 1021 1468 3040 Elemental Analysis (ASTM D 5291) -Carbon (wt) -Lab 1 8447 8200 7998 7336 8768 8402 8401 7624 -Lab 4 8419 8077 7909 7353 8720 8316 8150 7626 -Average 8433 8138 7954 7345 8744 8359 8276 7625 -Hydrogen (wt) -Lab 1 1494 1465 1465 1405 1205 1199 1207 1218 -Lab 4 1585 1668 1523 1509 1300 1305 1292 1316 -Average 1540 1567 1494 1457 1253 1252 1250 1267 -Oxygen (wt) (ASTM D5599) Lab 4 0 401 572 1129 0 368 527 1088
Table B1 Summary Data for FACE Gasoline Blends with Ethanol
41
Specific Tests FACE Gasoline Blend A B Target Ethanol Content 0 10 15 30 0 10 15 30 Distillation (˚F) (ASTM D86) Lab 1 IBP 90 106 99 99 97 105 103 101 5 122 127 122 126 133 128 126 129 10 140 134 131 135 149 135 134 138 20 165 145 144 146 175 147 146 149 30 186 153 152 153 196 155 154 155 40 198 159 156 156 209 165 159 159 50 204 202 159 158 214 211 165 161 60 207 208 204 159 218 217 214 162 70 210 211 210 160 221 219 219 163 80 213 214 213 161 226 225 224 165 90 219 222 219 211 236 234 234 230 95 228 233 229 224 248 247 246 242 FBP 262 261 263 260 280 271 270 266
Specific Tests FACE Gasoline Blend C H Target Ethanol Content 0 10 15 30 0 10 15 30 Distillation (˚F) (ASTM D86) Lab 1 IBP 93 104 102 107 98 96 105 106 5 126 126 123 130 127 123 125 127 10 139 131 131 136 143 132 134 138 20 157 140 140 145 170 145 147 152 30 174 147 147 151 194 153 156 159 40 188 153 153 156 213 167 161 163 50 201 183 157 159 229 217 182 166 60 210 208 176 161 243 236 235 169 70 218 217 215 162 263 255 253 175 80 227 226 223 165 291 283 282 268 90 245 244 241 233 329 322 323 312 95 274 274 269 261 357 351 351 343 FBP 330 331 322 324 408 401 407 396
42

13
32 CHEMICAL PROPERTIES OF FACE GASOLINES
The various types of hydrocarbons in the fuels were characterized by several techniques including
supercritical fluid chromatography (SFC) and detailed hydrocarbon analysis (DHA) by gas
chromatography using a flame ionization detector (GC‐FID) In addition the carbon hydrogen and
sulfur contents were measured Results are reported in the following sections
321 Aromatics by Supercritical Fluid Chromatography (SFC)
The SFC method of ASTM D5186 (11) separates the hydrocarbons into three fractions monoaromatics
polyaromatics and non‐aromatics and characterizes the composition in terms of mass Bar graphs of
the results are presented in Figure 39 Samples of FACE Gasolines B D E G and H were analyzed by
two labs The results from the two labs were very close to each other and so the averages are depicted
in the figure FACE Gasolines A B C and I have nonromatics levels gt90 wt FACE Gasolines D G and
H have the highest amounts of monoaromatics with values ranging from 394‐420 wt FACE
Gasolines E G and H appear to have about 1 wt polyaromatics
Figure 39 Compositions of FACE Gasolines by Supercritical Fluid Chromatography (ASTM D5186)
070 790 600
4175
14001000
39404200
040
3870
015
100
110125
030
9930
9210 9400
5810
85009000
59505675
9960
6100
0
10
20
30
40
50
60
70
80
90
100
A B C D E F G H I J
Composition (Wt )
FACE GASOLINE
SFC Composition ‐ FACE Gasolines
MonoAromatics PolyAromatics NonAromatics
14
322 Hydrocarbons by Detailed Hydrocarbon Analysis (DHA)
Detailed Hydrocarbon Analyses were performed by two labs using gas chromatography with flame
ionization detectors (GC‐FID) This technique enables the determination of concentration on a species‐
by‐species basis provided that retention factors have been determined for each species in the fuel The
results from both labs were very close to each other Bubble charts of the average concentration values
(in volume ) are depicted in Figure 310 for the low sensitivity fuels and Figure 311 for the high
sensitivity fuels on a carbon number basis for the five hydrocarbon classes n‐paraffins iso‐paraffins
naphthenes aromatics and olefins
In general the low sensitivity FACE Gasolines are characterized by large amounts of low sensitivity
components such as n‐paraffins and iso‐paraffins The high sensitivity FACE Gasolines contain more high
sensitivity components such as olefins and naphthenes than the low sensitivity fuels
The total concentration of components within each of the five hydrocarbon classes were added and the
sums are reported in the bar charts in Figure 312 The n‐paraffin levels range from 225‐316 vol for
the four FACE Gasolines (C D H and J) that had targets of 25 vol For the other FACE Gasolines that
had a target level of 5 vol the n‐paraffins levels range from 44‐117 vol The aromatics levels range
from 317‐358 vol for the four FACE Gasolines (D G H and J) that had targets of 35 vol For the
other six FACE Gasolines that had a target level of 5 vol the aromatics levels range from 0‐109 vol
The C7 aromatic is toluene the C8 aromatics consist of a mix of ethylbenzene and the xylene isomers
the C9 aromatics consist of a mix of trimethylbenzenes and methylethylbenzenes and the C10 aromatics
consist of a mix of tetramethylbenzenes dimethylethylbenzenes and methylpropylbenzenes FACE
Gasoline E a high sensitivity fuel has a naphthene content of 208 vol mainly cyclopentane and
cyclohexane Three other high sensitivity fuels (F G and H) have naphthenes concentrations of about
11 vol mainly cyclopentane Those high sensitivity fuels also have the highest olefins content with
concentrations ranging from 68‐127 vol FACE Gasoline I also has 64 vol olefins The C6 olefin is
1‐hexene The C5 olefins consist of a mix of 2‐pentene and methyl butenes In contrast to the high
sensitivity fuels Gasoline D which was designed to be low sensitivity but ended up in the high
sensitivity range has essentially no naphthenes or olefins Its high sensitivity is derived from its high
aromatics content
The C5 isoparaffin in all of the fuels is 2‐methylbutane The C6 isoparaffins consist of a mix of 2‐ and 3‐
methyl pentanes and 23 dimethyl butane The C7 isoparaffins in most of the FACE Gasolines consist of a
mix of 2‐ and 3‐methyl hexanes and 23‐ and 24‐dimethylpentanes The C8 isoparaffins are
predominantly trimethylpentanes with more than 50 of those being isooctane (224
trimethylpentane) The other isomers are mainly 24‐ and 25 dimethylhexanes and 2‐methyl 3‐ethyl
pentane
15
Figure 310 Detailed Hydrocarbon Analyses of Low Sensitivity FACE Gasolines
122 44 219 451 11
48 65
065
3 4 5 6 7 8 9 10 11
Carbon Number
FACE Gasoline A ‐ Detailed Hydrocarbon Analysis (vol)
isoparaffins
n‐paraffins
cycloparaffins
aromatics
olefins
104 13 137 587 16
59
39 37
3 4 5 6 7 8 9 10 11
Carbon Number
FACE Gasoline B ‐ Detailed Hydrocarbon Analysis (vol)
isoparaffins
cycloparaffins
aromatics
olefins
n‐paraffins
64 27 117 468 20 075
30 06
31 118 100
3 4 5 6 7 8 9 10 11
Carbon Number
FACE Gasoline C ‐ Detailed Hydrocarbon Analysis (vol)
isoparaffins
cycloparaffins
aromatics
olefins
n‐paraffins
12 410
99 35 150 46
47 114 70
3 4 5 6 7 8 9 10 11
Carbon Number
FACE Gasoline D ‐ Detailed Hydrocarbon Analysis (vol)
isoparaffins
cycloparaffins
aromatics
olefins
n‐paraffins
41 34 99 321 236 11
07 135
24
11
59
3 4 5 6 7 8 9 10 11
Carbon Number
FACE Gasoline I ‐ Detailed Hydrocarbon Analysis (vol)
isoparaffins
n‐paraffins
cycloparaffins
aromatics
olefins
327
90 124 95
22
14 131 145 29
06
3 4 5 6 7 8 9 10 11
Carbon Number
FACE Gasoline J ‐ Detailed Hydrocarbon Analysis (vol)
isoparaffins
n‐paraffins
cycloparaffins
aromatics
olefins
16
Figure 311 Detailed Hydrocarbon Analyses of High Sensitivity FACE Gasolines
64 68 143 165 18 07
70 105 19 10 04
46 17 18 16 08
21 82 09
29 06 37
3 4 5 6 7 8 9 10 11
Carbon Number
FACE Gasoline E ‐ Detailed Hydrocarbon Analysis (vol)
isoparaffins
cycloparaffins
aromatics
olefins
n‐paraffins
82 64 134 378 14
21 21
100
76
89
3 4 5 6 7 8 9 10 11
Carbon Number
FACE Gasoline F ‐ Detailed Hydrocarbon Analysis (vol)
isoparaffins
n‐paraffins
cycloparaffins
aromatics
olefins
65 66 72 152 16 10
74 09 16 10
15 33 218 54 14
36 25 10
37 07 10
3 4 5 6 7 8 9 10 11
Carbon Number
FACE Gasoline G ‐ Detailed Hydrocarbon Analysis (vol)
isoparaffins
cycloparaffins
aromatics
olefins
n‐paraffins
28 54 71 39 22 09
66 08 17 10
10 95 117 83 43 14
29 21 09
54 05 145 08
3 4 5 6 7 8 9 10 11
Carbon Number
FACE Gasoline H ‐ Detailed Hydrocarbon Analysis (vol)
isoparaffins
cycloparaffins
aromatics
olefins
n‐paraffins
17
Figure 312 Detailed Hydrocarbon Analyses Comparisons of FACE Gasolines
A comparison of the composition results from the DHA and SFC methods is presented in Figure 313 for
the low sensitivity fuels and Figure 314 for the high sensitivity fuels Also included are Fluorescent
Indicator Absorption (FIA ndash ASTM D1319 (12)) composition results reported on the CPChem COAs Since
the FIA method determines total saturates the DHA results for n‐paraffins iso‐paraffins and
naphthenes must be added together to enable the comparison between those two methods Similarly
since the SFC method directly measures aromatics and total non‐aromatics are determined by
difference the olefins amount must be added to the total saturate levels from FIA and DHA to enable
comparisons with the non‐aromatics values from SFC The appropriate comparison categories are
indicated by dashed lines in Figures 313 and 314 Of the three methods SFC generally gives the
highest level of aromatics and FIA the lowest The DHA aromatics values are closer to the FIA levels than
to the SFC levels The DHA olefins are fairly close to the FIA results
117
80
244 241
7944 67
225144
316
860
859
697
421
459
676
384
228
745336
16
01
01208
110
115105
33
23
13
127
94
8168
64
06
58 39
334
10977
336 358
12
317
0
10
20
30
40
50
60
70
80
90
100
A B C D E F G H I J
Composition ( vol)
FACE GASOLINE
DHA Composition ‐ FACE Gasolines
n‐paraffins isoparaffins naphthenes olefins aromatics
18
Figure 313 Comparison of Composition Methods FACE Low Sensitivity Gasolines
Figure 314 Comparison of Composition Methods FACE High Sensitivity Gasolines
117
80
244
144
316
860 859
697
745336
16
01 0433
23
13 64
06
58 3912
317
996951 975
929
712
04
07 04 62
10
42 21 09
278
993
921 940996
610
07
79 6004
390
0
10
20
30
40
50
60
70
80
90
100
DHA FIA SFC DHA FIA SFC DHA FIA SFC DHA FIA SFC DHA FIA SFC
Composition ( )
FACE GASOLINE
Composition ‐ Low Sensitivity FACE Gasolines
n‐paraffins isoparaffins naphthenes olefins aromatics saturates nonaromatics
A B C I J
241
7944 67
225
421
459
676
384
228
01
208
110
115 105
127
94
81 68
334
10977
336 358
701
780
856
587 568
04
99
86
7879
295
12158
335 353
581
850900
595568
419
150100
405432
0
10
20
30
40
50
60
70
80
90
100
DHA FIA SFC DHA FIA SFC DHA FIA SFC DHA FIA SFC DHA FIA SFC
Composition ( )
FACE GASOLINE
Composition ‐ High Sensitivity FACE Gasolines
n‐paraffins isoparaffins naphthenes olefins aromatics saturates nonaromatics
D E F G H
19
323 Elemental Analyses
Carbon and hydrogen contents were measured by two labs using ASTM method D5291 (13) The
average results are presented in the bar graphs in figure 315 The carbon contents range from 8399‐
8748 wt and the hydrogen contents range from1252‐1601 wt As expected the FACE Gasolines
having the highest aromatics content (D G H and J) have the highest carbon and lowest hydrogen
contents
Figure 315 Carbon and Hydrogen Elemental Analyses of FACE Gasolines
8399 8443 8453 8646 8547 8496 8670 87488414 8624
1601 1557 1547 1354 1453 1504 1330 12521586 1376
0
10
20
30
40
50
60
70
80
90
100
A B C D E F G H I J
Compo
sition
(wt)
FACE Gasoline
Carbon‐Hydrogen Elemental Analyses
Hydrogen
Carbon
20
Sulfur content was measured by one lab ASTM method D5453 (14) The results displayed in the bar
charts in Figure 316 are essentially identical to the values reported on the CPChem COAs All FACE
Gasolines had ultra‐low sulfur levels FACE Gasolines E G and H had the highest levels at 21 22 and 15
ppm sulfur The other fuels had levels ranging from 2‐6 ppm
Figure 316 Sulfur Levels of FACE Gasolines
6
4 4
2
21
2
22
15
2 2
0
5
10
15
20
25
A B C D E F G H I J
Sulfur Content (p
pm)
FACE Gasoline
Sulfur Content ‐ FACE Gasolines
21
4 ANALYTICAL RESULTS FOR FACE GASOLINES BLENDED WITH ETHANOL
Although the FACE Gasolines were not formulated with ethanol the expectation is that some potential
users will be interested in testing the fuels with ethanol added To assist selection of fuels for those
studies four FACE Gasolines were selected for blending with levels of 10 15 and 30 vol ethanol The
fuels selected for this purpose were A B C and H The positions of these fuels in the design matrix are
shown below
In this section results of the analyses of the ethanol blends are discussed Chevron Phillips 66 BP and
a contract laboratory conducted the analyses As mentioned previously future production runs that are
required to remake fuels that sell out likely will results in some changes to the fuel property values
reported here
41 ASTM TEST RESULTS
ASTM methods were used to measure the ethanol content RON MON API gravity density distillation
profiles RVP and net heats of combustion of all of the ethanol blends made with the FACE Gasolines
The results of these analyses are summarized below and in Table A2 located in the Appendix
411 Ethanol Content
FACE Gasolines A B C and H were blended with nominally 10 15 and 30 vol ethanol The
concentration of ethanol in each blend were determined using ASTM method D5599 (15) (coupled with
ASTM D4052 density measurement) and by detailed hydrocarbon analysis using gas chromatography
with a flame ionization detector The results for both methods were in excellent agreement for all fuels
as shown below in Table 41
Table 41 Measured Ethanol Content of FACE Gasoline Blends
Ethanol Content (vol)
A B C H
10 15 30 10 15 30 10 15 30 10 15 30
D5599 101 147 299 100 147 302 102 146 295 102 146 303
DHA 100 146 301 100 148 301 103 148 299 102 147 304
22
412 RON MON and Octane Sensitivity
RON values were measured in CFR engines per ASTM method D2699 (4) Although the measurements
were conducted in four labs the lab‐to‐lab reproducibility was very good so only the average values are
reported here (but individual values are reported in Table A2) Average RON values for each fuel are
presented in Figure 41 For all four of these FACE Gasolines the RON values continue to increase even
at the 30 ethanol level although the rates of increase are lower than at lower ethanol levels FACE
Gasoline B has the highest RON at all ethanol levels with a value of about 106 at the 30 ethanol level
FACE Gasolines A and C have essentially the same RON values at all ethanol levels with RON values of
about 102 at the 30 ethanol level FACE Gasoline H without ethanol has a higher RON than A and C
but a lower RON at the 15 and 30 ethanol levels
Figure 41 RON Values of FACE Gasoline Blends with Ethanol
MON values were measured in CFR engines per ASTM method D2700 (5) Although the measurements were conducted in four labs the lab‐to‐lab reproducibility was very good so only the average values are reported here (but individual values are reported in Appendix A2) The MON values for each fuel are
presented in Figure 42 FACE Gasoline B has the highest MON values at all ethanol levels but unlike the other FACE Gasolines the MON value did not increase with ethanol contents above 10 vol The MON values for FACE Gasolines A and C were essentially the same and higher than those for FACE Gasoline H
80081082083084085086087088089090091092093094095096097098099010001010102010301040105010601070108010901100
0 5 10 15 20 25 30 35
RON
Ethanol (vol)
RON Values ‐ FACE Gasoline + Ethanol Blends
FACE A
FACE B
FACE H
FACE C
23
Figure 42 MON Values of FACE Gasoline Blends with Ethanol
Octane Sensitivity (S=RON‐MON) values are presented in Figure 43 As expected due to the relatively high sensitivity of ethanol the sensitivities of all four FACE Gasolines increase as the ethanol content increases FACE Gasoline H has the highest sensitivity at all ethanol levels except at 30 vol ethanol where the sensitivity of the FACE Gasoline B blend becomes slightly higher with values of 124 and 132 respectively The sensitivities for FACE Gasolines A and C are very similar to each other and although lower than the blends for the other FACE Gasolines have the highest rates of increase at the 30 level
Figure 43 Octane Sensitivities FACE Gasoline Blends with Ethanol
750
760
770
780
790
800
810
820
830
840
850
860
870
880
890
900
910
920
930
940
950
0 5 10 15 20 25 30 35
MON
Ethanol (vol)
MON Values ‐ FACE Gasoline + Ethanol Blends
FACE A
FACE B
FACE H
FACE C
00
10
20
30
40
50
60
70
80
90
100
110
120
130
140
0 5 10 15 20 25 30 35
S
Ethanol (vol)
Octane Sensitivity (S) ‐ FACE Gasoline + Ethanol Blends
FACE A
FACE B
FACE H
FACE C
24
413 Distillation Characteristics
The distillation properties of the fuels were determined by ASTM D86 (6) The values are plotted in
Figure 44 and tabulated in Table A2 in the Appendix The behavior and shapes of the curves are very
similar For a given gasoline all of the ethanol blends start at about the same IBP The blends
containing ethanol then follow the same curve which is lower than the base gasoline At a certain point
the ethanol blends then rise quickly to rejoin the distillation curve of the base gasoline The lower the
ethanol content of the blend the earlier (lower distilled volume ) the curve rejoins the base gasoline
curve
Figure 44 ASTM D86 Distillation Profiles for FACE Gasoline Blends with Ethanol
50
100
150
200
250
300
0 10 20 30 40 50 60 70 80 90 100
Temperature (˚ C)
Volume Distilled
D86 Distillation ‐ FACE A Gasoline + Ethanol Blends
0 EtOH
10 EtOH
15 EtOH
30 EtOH
50
100
150
200
250
300
0 10 20 30 40 50 60 70 80 90 100
Temperature (˚ C)
Volume Distilled
D86 Distillation ‐ FACE B Gasoline + Ethanol Blends
0 EtOH
10 EtOH
15 EtOH
30 EtOH
50
100
150
200
250
300
350
0 10 20 30 40 50 60 70 80 90 100
Temperature (˚ C)
Volume Distilled
D86 Distillation ‐ FACE C Gasoline + Ethanol Blends
0 EtOH
10 EtOH
15 EtOH
30 EtOH
50
100
150
200
250
300
350
400
450
0 10 20 30 40 50 60 70 80 90 100
Temperature (˚ C)
Volume Distilled
D86 Distillation ‐ FACE H Gasoline + Ethanol Blends
0 EtOH
10 EtOH
15 EtOH
30 EtOH
25
414 Reid Vapor Pressure (RVP)
The RVPs were determined using ASTM method D5191 (7) The values are plotted in Figure 45 For all
fuels the RVP appears to peak between 10 and 15 vol ethanol and then starts to decrease as the
ethanol content increases further
Figure 45 Reid Vapor Pressures for FACE Gasoline Blends with Ethanol
415 API Gravity and Density
The API gravities and densities of the fuels were measured by two labs using ASTM method D4052 (8) The values from the two labs were in excellent agreement and are listed in Table A2 The average density values are presented in Figure 46 For all of the FACE Gasolines the density increased as the ethanol content increased
Figure 46 Densities of FACE Gasoline Blends with Ethanol
7
75
8
85
9
95
10
0 5 10 15 20 25 30 35
RVP (psi)
Ethanol (vol)
Reid Vapor Pressure (RVP) ‐ FACE Gasoline + Ethanol Blends
FACE A
FACE B
FACE H
FACE C
0685 0697 0691
0759
0696 0705 0699
0761
0700 0710 0704
0763
0716 0724 0719
0768
0
01
02
03
04
05
06
07
08
09
1
A B C H
Density
(gm
l)
Ethanol (vol)
Density ‐ FACE Gasoline Blends with Ethanol
0
10
15
30
26
416 Net Heat of Combustion (NHC)
Net Heats of Combustion were measured by 2 labs using ASTM method D240 (9) For some fuels ASTM
method D4809 (10) was also used The values from both labs and both methods were very close to each
other and the average values are plotted in Figure 47 As expected since the net heat of combustion of
ethanol is lower than that of gasoline for all FACE Gasolines the net heat of combustion decreased as
ethanol content increased The decrease appeared to be linear with ethanol content The decrease
appeared to be steepest for FACE Gasoline B
Figure 47 Net Heat of Combustion of FACE Gasoline Blends with Ethanol
16000
16250
16500
16750
17000
17250
17500
17750
18000
18250
18500
18750
19000
19250
19500
0 5 10 15 20 25 30 35
Net Heat of C
ombustion (B
TUlb)
Ethanol (vol)
Net Heat of Combustion ‐ FACE Gasoline + Ethanol Blends
FACE A
FACE B
FACE H
FACE C
27
5 SUMMARY AND CONCLUSIONS
A subteam of the CRC AVFL FACE Working Group has designed a matrix of reference gasolines
known as the FACE Gasolines A commercial vendor has produced and made the fuels available
for purchase in research quantities It is expected that this will enable consistent comparisons
of engine and combustion results from different laboratories and test platforms based on the
use of the same set of fuels
The matrix is designed around four parameters expected to be of importance for advanced
gasoline engines RON octane sensitivity aromatics content and n‐paraffins content
Statistical methods were used to identify potential candidate formulations and down‐select to a
tractable number of 10 formulations
Detailed analyses were performed on the physical and chemical properties of the final fuel
formulations
Generally the property values measured in the current study agreed very well with the values
reported on the fuel blender (ChevronPhillips Chemical Company ‐ CPChem) Certificates of
Analyses (COAs)
As expected conflicts in the target properties for some of the fuels (such as high aromatics level
coupled with low octane sensitivity) led to some trade‐offs that resulted in some deviation in
the actual properties from the design properties
The RON values come close to meeting the targets for most of the fuels Fuels E H and J have
values that are 24‐38 units higher than the targets
Three of the four ldquohighrdquo sensitivity fuels have measured values of 59‐71 that are lower than
the target value of 10 Two of the ldquolowrdquo sensitivity fuels have measured values (34‐37) that are
a bit higher than the target value of le2 One of the low sensitivity design fuels (ldquoDrdquo) has a value
of 72 that actually effectively makes it a high sensitivity fuel
Detailed hydrocarbon analyses (DHA) indicate that the n‐paraffins contents range from 225‐
316 vol for the four FACE Gasolines that had targets of 25 vol and from 44‐117 vol for
the six FACE Gasolines that had targets of 5 vol
DHAs indicate that the aromatics contents range from 317‐358 vol for the four FACE
Gasolines that had a target of 35 vol and 0‐109 vol for the other fuels that had a target of 5
vol
The high sensitivity fuels contained the high sensitivity components of naphthenes (105‐208
vol) and olefins (68‐127 vol) The exception was Gasoline ldquoDrdquo which had neither of these
components but whose high sensitivity was derived from aromatics components
Five of the FACE Gasolines (ldquoArdquo ldquoBrdquo ldquoCrdquo ldquoFrdquo and ldquoIrdquo) are very rich in isoparaffins with contents ge
676 vol
Aromatics values determined by SFC were generally higher than the values obtained from DHA
The DHA olefins values were close to the FIA values reported on the CPChem COAs
The fuels having the highest aromatics content also have the highest densities and highest net
heats of combustion on an energy content per volume basis
With regards to distillation properties for all fuels the initial boiling points (IBPs) are in a
narrow range of 90‐110˚F although the end boiling points (EBPs) range from 253‐410˚F Three
28
of the high sensitivity fuels have the highest EBPs The two low‐mid RON fuels having low n‐
paraffins and low aromatics have the lowest EBPs
All of the FACE Gasolines have ultra‐low levels of sulfur with the highest value at 22 ppm S and
most fuels having le 6 ppm S
For the four FACE Gasolines blended with ethanol RON continues to increase as the ethanol
levels increase to 30 vol although the rate of increase is lower as the ethanol content
increases FACE Gasoline B which has the highest RON of 96 has the highest RON at all ethanol
levels with a value of about 106 at 30 ethanol At the same ethanol level FACE Gasolines A
and C have essentially the same RON values FACE Gasoline H starts with a higher RON value
than those of A or C but has a lower value at blend levels of 15 and 30 vol
MON increased as the ethanol level increased for FACE Gasolines A C and H The MON values
for these fuels were essentially constant even though the highest MON values were found for
the ethanol blends with FACE Gasoline B
For all blends octane sensitivity increased as ethanol content increased with the highest values
of 12‐13 for 30 vol ethanol blends with FACE Gasolines B and H
The D86 distillation curve trends are similar for the four FACE Gasolines For a given gasoline all
blends start at the same point At around 10 vol distilled the curves for the blends with
ethanol diverge from and are lower than the curves for the base gasolines At a certain point
the distillation curves for the blends rise quickly and re‐join the curve for the parent base fuel
The distillation curves for the 30 vol ethanol blends are generally flat as a function of
increasing vol distilled and only start to increase again at about 70‐80 vol distilled when
most of the ethanol has been distilled from the liquid
The Reid Vapor Pressures (RVPs) peak at about 10‐15 vol
Densities increase slightly as ethanol increases while net heats of combustion decrease
29
6 REFERENCES
1 Alnajjar M Cannella B Dettman H Fairbridge C Franz J Gallant T Gieleciak R Hager D Lay C Lewis S Ratcliff M Sluder S Storey J Yin H Zigler B ldquoChemical and Physical Properties of the Fuels for Advanced Combustion Engines (FACE) Research Diesel Fuelsrdquo CRC Report No FACE‐1 (2010)
2 Gallant T Franz J Alnajjar M Storey J Lewis S Sluder S Cannella W Fairbridge C Hager D Dettman H Luecke J Ratcliff M Zigler ldquoFuels for Advanced Combustion Engines Research Diesel Fuels Analysis of Physical and Chemical Propertiesrdquo SAE Paper 2009‐01‐2769 (2009)
3 CannellaW Fairbridge C Arboleda P Bays T Dettman H Foster M Gieleciak R Gunter G Hager D Lay C Lewis S Luecke J Sluder S Zigler B ldquoDetailed Characterization of the Physical and Chemical Properties of the Reformulated FACE Diesel Fuels FD2B FD4B and FD7Brdquo CRC Report AVFL‐19‐1 (2013)
4 ASTM International Standard Test Method for Research Octane Number of Spark‐Ignition Engine Fuel ASTM D2699 (ASTM International Pennsylvania 2009)
5 ASTM International Standard Test Method for Motor Octane Number of Spark‐Ignition Engine Fuel ASTM D2700 (ASTM International Pennsylvania 2009)
6 ASTM International Standard Test Method for Distillation of Petroleum Products at Atmospheric Pressure ASTM D86‐09e1 (ASTM International Pennsylvania 2009)
7 ASTM International Standard Test Method for Vapor Pressure of Petroleum Products (Mini‐Method) ASTM D5191 (ASTM International Pennsylvania 2009)
8 ASTM International Standard Test Method for Density and Relative Density of Liquids by Digital Density Meter ASTM D4052‐96(2002)e1 (ASTM International Pennsylvania 2002)
9 ASTM International Standard Test Method for Heat of Combustion of Liquid Hydrocarbon Fuels by Bomb Calorimeter ASTM D240‐02(2007) (ASTM International Pennsylvania 2007)
10 ASTM International Standard Test Method for Heat of Combustion of Liquid Hydrocarbon Fuels by Bomb Calorimeter ASTM D4809 (2007) (ASTM International Pennsylvania 2007)
11 ASTM International Standard Test Method for Determination of Aromatic Content and Polynuclear Aromatic Content of Diesel Fuels and Aviation Turbine Fuels by Supercritical Fluid Chromatography ASTM D5186‐03(2009) (ASTM International Pennsylvania 2009)
12 ASTM International Standard Test Method for Hydrocarbon Types in Liquid Petroleum Products by Fluorescent Indicator Adsorption ASTM D1319‐08 (ASTM International Pennsylvania 2008)
13 ASTM International Standard Test Methods for Instrumental Determination of Carbon Hydrogen and Nitrogen in Petroleum Products and Lubricants ASTM D5291‐02(2007) (ASTM International Pennsylvania 2007)
14 ASTM International Standard Test Methods for Determination of Total Sulfur in Light Hydrocarbons Spark‐Ignition Engine Fuel Diesel Engine Fuel and Engine Oil by Ultraviolet Fluorescence ASTM D5453(2007) (ASTM International Pennsylvania 2007)
15 ASTM International Standard Test Methods for Determination of Oxygenates in Gasoline by Gas Chromatography and Oxygen Selective Flame Ionization Detection ASTM D5599 (2007) (ASTM International Pennsylvania 2007)
30
31
Appendix A
Properties of FACE Gasolines
32
Table A1 Summary Data for FACE Gasolines
Specific Tests FACE Gasoline A B C D E F G H I J Research Octane Number (RON) (ASTM D2699) -Lab 1 843 958 850 946 871 940 969 870 700 738 -Lab 2 839 960 840 939 877 960 869 -Lab 3 835 957 840 -Average 839 958 843 942 874 940 965 869 7015 738 -CPChem COA 835 960 847 932 875 944 968 869 703 718 Motor Octane Number (MON) (ASTM D2700) -Lab 1 836 923 830 872 813 881 857 797 695 701 -Lab 2 833 931 830 868 808 860 799 -Lab 3 835 919 829 -Average 835 924 830 870 811 881 858 798 695 701 -CPChem COA 836 926 836 878 815 888 858 793 696 688 Sensitivity (RON-MON) -Lab 1 07 35 20 74 58 59 112 73 05 37 -Lab 2 06 29 10 71 69 100 70 -Lab 3 0 38 11 -Average 04 34 13 72 63 59 107 72 05 37 -CPChem COA -01 34 11 54 60 56 110 76 07 30 API Gravity (API˚) (ASTM D4052) -CPChem COA 750 714 734 587 636 686 545 568 744 595 -Lab 1 749 713 732 587 636 686 546 548 744 587 -Average 7495 7135 733 587 636 686 5455 558 744 591 Density (ASTM D4052) -CPChem COA 0691 0743 0725 0707 0760 0697 0741 -Lab 1 0685 0697 0691 0743 0725 0707 0760 0759 0697 0743 -Average 0685 0697 0691 0743 0725 0707 0760 0759 0697 0742 RVP (psi) (D5191) -CPChem COA 81 74 74 68 67 78 72 75 75 75 -Lab 1 80 73 75 73 76 77 Net Heat of Combustion (BTUlb) (ASTM D4809) 19186 18680 Net Heat of Combustion (BTUlb) (ASTM D240) 19251 19187 19257 18649 18884 19072 18602 18625 19225 18731
33
TableA1 Summary Data for FACE Gasolines
Specific Tests FACE Gasoline A B C D E F G H I J Distillation (˚F) (ASTM D86) -CPChem IBP 93 95 95 88 110 108 93 94 100 101
5 104 128 120 129 131 129 122 123 123 111 10 132 145 136 148 142 142 135 140 156 162 20 160 172 154 176 155 156 158 168 177 206 30 183 194 171 198 166 168 183 192 186 217 40 197 207 187 212 177 180 210 211 191 224 50 203 213 200 221 186 193 240 227 195 231 60 207 216 210 229 197 206 270 242 199 242 70 210 220 218 235 208 217 306 262 203 261 80 213 225 226 280 222 225 328 291 207 291 90 219 235 243 330 267 240 343 327 213 316 95 227 248 270 340 343 261 363 358 220 330 FBP 269 283 328 363 405 294 403 410 259 358
-Lab 1 IBP 90 97 93 97 107 102 99 98 99 95 5 122 133 126 133 134 134 122 127 139 111
10 140 149 139 151 143 144 136 143 160 166 20 165 175 157 179 156 157 158 170 178 209 30 186 196 174 200 168 169 182 194 187 219 40 198 209 188 214 177 182 209 213 192 225 50 204 214 201 224 188 195 238 229 196 232 60 207 218 210 234 197 207 268 243 200 242 70 210 221 218 248 208 218 304 263 204 263 80 213 226 227 288 224 228 328 291 208 292
90 219 236 245 331 258 243 343 329 213 316 95 228 248 274 341 329 261 358 357 220 330 FBP 262 280 330 365 402 291 405 408 247 357
-Average IBP 915 96 94 925 1085 105 96 96 995 98 5 113 1305 123 131 1325 1315 122 125 131 111
10 136 147 1375 1495 1425 143 1355 1415 158 164 20 1625 1735 1555 1775 1555 1565 158 169 1775 203 30 1845 195 1725 199 167 1685 1825 193 1865 218 40 1975 208 1875 213 177 181 2095 212 1915 2245 50 2035 2135 2005 2225 187 194 239 228 1955 2315 60 207 217 210 2315 197 2065 269 2425 1995 242 70 210 2205 218 2415 208 2175 305 2625 2035 262 80 213 2255 2265 284 223 2265 328 291 2075 2915
90 219 2355 244 3305 2625 2415 343 328 213 316 95 2275 248 272 3405 336 261 3605 3575 220 330 FBP 2655 2815 329 364 4035 2925 404 409 253 3575
34
Table A1 Summary Data for FACE Gasolines
Specific Tests FACE Gasoline A B C D E F G H I J Elemental Analysis (ASTM D 5291) -Carbon (wt) -Lab 1 8398 8441 8497 8647 8547 8671 8792 8415 -Lab 4 8400 8444 8419 8645 8547 8496 8669 8703 8414 8624 -Average 8399 8443 8458 8646 8547 8496 8670 8748 8414 8624 -Hydrogen (wt) -Lab 1 1602 1559 1503 1353 1453 1329 1208 1585 -Lab 4 1600 1556 1585 1355 1453 1504 1331 1297 1586 1376 -Average 1601 1557 1547 1354 1453 1504 1330 1252 1586 1376 Sulfur by UV Fluorescence (ppmw) (ASTM D5453) -CPChem COA 4 4 3 2 21 2 20 15 2 2 -Lab 4 6 4 4 2 21 2 22 15 2 2 Hydrocarbons by FIA (vol) (ASTM D1319) -Aromatics (vol) CPChem COA 0 42 21 295 121 58 335 353 09 278 -Olefins (vol) CPChem COA 04 07 04 04 99 86 78 79 62 10 -Saturates (vol) CPChem COA 996 951 975 701 780 856 587 568 929 712 Aromatics by SFC (ASTM D5186) (Lab 1) -MonoAromatics (wt) -Lab 1 07 78 60 414 142 100 393 412 04 387 -Lab 2 80 421 138 395 428 -Average 07 79 60 4175 140 100 394 420 04 387 -PolyAromatics (wt) -Lab 1 0 0 0 03 11 0 10 10 0 03 -Lab 2 0 0 09 12 15 -Average 0 0 0 015 10 0 11 125 0 03 -NonAromatics (wt) -Lab 1 993 922 940 583 847 900 597 578 996 610 -Lab 2 920 579 850 593 557 -Average 993 921 940 581 8475 900 595 5675 996 610
35
Table A1 Summary Data for FACE Gasolines
Specific Tests FACE Gasolines A B C D E F G H I J Detailed Hydrocarbon Analyses by GC-FID -n-paraffins (vol) (Targets) (5) (5) (25) (25) (5) (5) (5) (25) (5) (25) -Lab 1 1144 783 2409 2346 771 434 662 2214 1441 3115 -Lab 2 1187 815 2476 2473 803 446 685 2283 1437 3212 -Average 1165 799 2443 2410 787 440 673 2249 1439 3164 -iso-paraffins (vol) -Lab 1 8562 8591 688 4206 4563 6765 3821 2322 7449 3362 -Lab 2 8635 8586 7066 4221 4621 6747 3864 2240 7459 3366 -Average 8599 8688 6973 4213 4592 6756 3843 2281 7454 3364 -cyclo-paraffins (vol) -Lab 1 192 021 048 010 2216 1078 1163 1035 324 234 -Lab 2 130 007 023 010 1945 1118 1140 1066 336 224 -Average 161 014 036 010 2081 1098 1152 1050 330 229 -aromatics (vol) (Targets) (5) (5) (5) (35) (5) (5) (35) (35) (5) (35) -Lab 1 073 601 409 3425 1121 805 3419 3597 120 3212 -Lab 2 003 568 374 3258 1062 739 3306 3555 110 3125 -Average 38 584 392 3341 1092 772 3363 3576 115 3169 -olefins (vol) -Lab 1 024 001 248 004 1146 978 851 714 643 066 -Lab 2 018 003 006 005 1392 905 771 650 627 054 -Average 021 002 127 04 1269 942 811 682 635 060
36
37
Appendix B
Properties of FACE Gasoline Blends with Ethanol
38
Table B1 Summary Data for FACE Gasoline Blends with Ethanol
Specific Tests FACE Gasoline Blend A B Ethanol Content (Vol ) 0 10 15 30 0 10 15 30 Ethanol Content (Vol ) (ASTM D5599) 0 1012 1469 2990 0 995 1473 3016 Research Octane Number (RON) (ASTM D2699) -Lab 1 843 922 951 1032 958 1015 1039 1067 -Lab 2 839 923 951 1017 960 1008 1023 1050 -Lab 3 835 917 946 1025 957 1012 1031 1069 -Lab 4 916 945 1018 1009 1026 1053 -Average 839 920 948 1023 958 1011 1030 1060 Motor Octane Number (MON) (ASTM D2700) -Lab 1 836 878 890 912 923 936 936 934 -Lab 2 833 874 891 917 931 935 934 931 -Lab 3 835 881 893 911 919 933 934 933 -Lab 4 884 901 916 935 936 933 -Average 835 879 894 914 924 935 935 933 Sensitivity (RON-MON) -Lab 1 07 44 61 120 35 79 103 133 -Lab 2 06 49 60 100 29 73 89 119 -Lab 3 0 36 53 114 38 79 97 136 -Lab 4 32 44 102 74 91 120 -Average 04 41 54 109 34 76 95 127 API Gravity (API˚) (ASTM D4052) -Lab 1 749 7164 7066 661 7131 690 6772 6375 -Lab 4 716 706 660 690 676 638 -Average 749 7162 7063 6605 7131 690 6766 6377 Density (ASTM D4052) -Lab 1 06849 06959 06992 07154 0697 07050 07096 07240 -Lab 4 06966 06999 07161 07055 07106 07244 -Average 06849 06963 06996 07158 0697 07053 07101 07242 RVP (psi) (D5191) Lab 1 83 95 94 91 73 87 86 83 Net Heat of Combustion (BTUlb) (ASTM D4809) 18308 Net Heat of Combustion (BTUlb) (ASTM D240) -Lab 1 19266 18294 18080 16751 19207 18319 17941 16631 -Lab 4 19236 18208 17963 16487 19168 18307 17696 16234 -Average 19251 18251 18021 16619 19187 18313 17818 16432
39
Table B1 Summary Data for FACE Gasoline Blends with Ethanol
Specific Tests FACE Gasoline Blend C H Target Ethanol Content (Vol ) 0 10 15 30 0 10 15 30 Ethanol Content (Vol) (ASTM D5599) 0 1018 1462 2949 0 1016 1459 3034 Research Octane Number (RON) (ASTM D2699) -Lab 1 850 918 951 1012 870 919 941 993 -Lab 2 840 920 950 1014 869 927 941 996 -Lab 3 840 917 946 1019 869 920 937 995 -Lab 4 914 945 1015 916 946 991 -Average 843 917 948 1015 869 921 941 994 Motor Octane Number (MON) (ASTM D2700) -Lab 1 830 876 893 921 797 821 835 861 -Lab 2 830 868 880 924 793 820 831 885 -Lab 3 829 876 887 909 799 817 829 858 -Lab 4 881 890 914 828 839 877 -Average 830 875 888 916 796 822 833 870 Sensitivity (RON-MON) -Lab 1 20 42 58 91 73 98 106 132 -Lab 2 10 52 70 90 76 107 110 111 -Lab 3 11 41 59 110 70 103 108 137 -Lab 4 33 55 101 88 107 114 -(RON)avg ndash (MON)avg 13 42 60 99 73 99 108 124 API Gravity (API˚) (ASTM D4052) -Lab 1 732 7069 6943 6523 5481 5416 5375 5247 -Lab 4 707 693 652 544 538 527 -Average 732 707 694 652 548 543 5377 526 Density (ASTM D4052) -Lab 1 06906 06991 07035 07186 07587 07614 07631 07684 -Lab 4 06997 07043 07192 07610 07636 07678 -Average 06994 07039 07189 07587 07612 07633 07681 RVP (psi) (D5191) Lab 1 75 86 85 83 76 88 87 84 Net Heat of Combustion (BTUlb) (ASTM D4809) 19186 18198 17955 16692 16265 Net Heat of Combustion (BTUlb) (ASTM D240) -Lab 1 19257 18375 18012 16739 18675 17891 17550 16369 -Lab 4 18576 17809 17408 16322 -Average 19257 18375 18012 16739 18625 17850 17479 16345
40
Table B1 Summary Data for FACE Gasoline Blends with Ethanol
Specific Tests FACE Gasoline Blend A B Target Ethanol Content 0 10 15 30 0 10 15 30 Ethanol Content (Vol) -ASTM D5599 0 1012 1469 2990 0 995 1473 3016 -Detailed Hydrocarbon Analysis - GCFID -Lab 1 0 1000 1463 3017 0 1001 1476 3014 Elemental Analysis (ASTM D 5291) -Carbon (wt) -Lab 1 8443 8178 7941 7306 8465 8172 8029 7346 -Lab 4 8433 8085 7823 7361 8471 8110 7921 7380 -Average 8438 8131 7882 7333 8468 8141 7975 7363 -Hydrogen (wt) -Lab 1 1543 1527 1484 1446 1473 1462 1442 1387 -Lab 4 1606 1573 1548 1515 1561 1540 1525 1487 -Average 1575 1550 1516 1481 1517 1501 1483 1437 -Oxygen (wt) (ASTM D5599) Lab 4 0 400 578 1150 0 389 571 1147
Specific Tests FACE Gasoline Blend C H Target Ethanol Content 0 10 15 30 0 10 15 30 Ethanol Content (Vol) -ASTM D5599 0 1018 1462 2949 0 1016 1459 3034 -Detailed Hydrocarbon Analysis - GCFID -Lab 1 0 1027 1483 2988 0 1021 1468 3040 Elemental Analysis (ASTM D 5291) -Carbon (wt) -Lab 1 8447 8200 7998 7336 8768 8402 8401 7624 -Lab 4 8419 8077 7909 7353 8720 8316 8150 7626 -Average 8433 8138 7954 7345 8744 8359 8276 7625 -Hydrogen (wt) -Lab 1 1494 1465 1465 1405 1205 1199 1207 1218 -Lab 4 1585 1668 1523 1509 1300 1305 1292 1316 -Average 1540 1567 1494 1457 1253 1252 1250 1267 -Oxygen (wt) (ASTM D5599) Lab 4 0 401 572 1129 0 368 527 1088
Table B1 Summary Data for FACE Gasoline Blends with Ethanol
41
Specific Tests FACE Gasoline Blend A B Target Ethanol Content 0 10 15 30 0 10 15 30 Distillation (˚F) (ASTM D86) Lab 1 IBP 90 106 99 99 97 105 103 101 5 122 127 122 126 133 128 126 129 10 140 134 131 135 149 135 134 138 20 165 145 144 146 175 147 146 149 30 186 153 152 153 196 155 154 155 40 198 159 156 156 209 165 159 159 50 204 202 159 158 214 211 165 161 60 207 208 204 159 218 217 214 162 70 210 211 210 160 221 219 219 163 80 213 214 213 161 226 225 224 165 90 219 222 219 211 236 234 234 230 95 228 233 229 224 248 247 246 242 FBP 262 261 263 260 280 271 270 266
Specific Tests FACE Gasoline Blend C H Target Ethanol Content 0 10 15 30 0 10 15 30 Distillation (˚F) (ASTM D86) Lab 1 IBP 93 104 102 107 98 96 105 106 5 126 126 123 130 127 123 125 127 10 139 131 131 136 143 132 134 138 20 157 140 140 145 170 145 147 152 30 174 147 147 151 194 153 156 159 40 188 153 153 156 213 167 161 163 50 201 183 157 159 229 217 182 166 60 210 208 176 161 243 236 235 169 70 218 217 215 162 263 255 253 175 80 227 226 223 165 291 283 282 268 90 245 244 241 233 329 322 323 312 95 274 274 269 261 357 351 351 343 FBP 330 331 322 324 408 401 407 396
42

15
Figure 310 Detailed Hydrocarbon Analyses of Low Sensitivity FACE Gasolines
122 44 219 451 11
48 65
065
3 4 5 6 7 8 9 10 11
Carbon Number
FACE Gasoline A ‐ Detailed Hydrocarbon Analysis (vol)
isoparaffins
n‐paraffins
cycloparaffins
aromatics
olefins
104 13 137 587 16
59
39 37
3 4 5 6 7 8 9 10 11
Carbon Number
FACE Gasoline B ‐ Detailed Hydrocarbon Analysis (vol)
isoparaffins
cycloparaffins
aromatics
olefins
n‐paraffins
64 27 117 468 20 075
30 06
31 118 100
3 4 5 6 7 8 9 10 11
Carbon Number
FACE Gasoline C ‐ Detailed Hydrocarbon Analysis (vol)
isoparaffins
cycloparaffins
aromatics
olefins
n‐paraffins
12 410
99 35 150 46
47 114 70
3 4 5 6 7 8 9 10 11
Carbon Number
FACE Gasoline D ‐ Detailed Hydrocarbon Analysis (vol)
isoparaffins
cycloparaffins
aromatics
olefins
n‐paraffins
41 34 99 321 236 11
07 135
24
11
59
3 4 5 6 7 8 9 10 11
Carbon Number
FACE Gasoline I ‐ Detailed Hydrocarbon Analysis (vol)
isoparaffins
n‐paraffins
cycloparaffins
aromatics
olefins
327
90 124 95
22
14 131 145 29
06
3 4 5 6 7 8 9 10 11
Carbon Number
FACE Gasoline J ‐ Detailed Hydrocarbon Analysis (vol)
isoparaffins
n‐paraffins
cycloparaffins
aromatics
olefins
16
Figure 311 Detailed Hydrocarbon Analyses of High Sensitivity FACE Gasolines
64 68 143 165 18 07
70 105 19 10 04
46 17 18 16 08
21 82 09
29 06 37
3 4 5 6 7 8 9 10 11
Carbon Number
FACE Gasoline E ‐ Detailed Hydrocarbon Analysis (vol)
isoparaffins
cycloparaffins
aromatics
olefins
n‐paraffins
82 64 134 378 14
21 21
100
76
89
3 4 5 6 7 8 9 10 11
Carbon Number
FACE Gasoline F ‐ Detailed Hydrocarbon Analysis (vol)
isoparaffins
n‐paraffins
cycloparaffins
aromatics
olefins
65 66 72 152 16 10
74 09 16 10
15 33 218 54 14
36 25 10
37 07 10
3 4 5 6 7 8 9 10 11
Carbon Number
FACE Gasoline G ‐ Detailed Hydrocarbon Analysis (vol)
isoparaffins
cycloparaffins
aromatics
olefins
n‐paraffins
28 54 71 39 22 09
66 08 17 10
10 95 117 83 43 14
29 21 09
54 05 145 08
3 4 5 6 7 8 9 10 11
Carbon Number
FACE Gasoline H ‐ Detailed Hydrocarbon Analysis (vol)
isoparaffins
cycloparaffins
aromatics
olefins
n‐paraffins
17
Figure 312 Detailed Hydrocarbon Analyses Comparisons of FACE Gasolines
A comparison of the composition results from the DHA and SFC methods is presented in Figure 313 for
the low sensitivity fuels and Figure 314 for the high sensitivity fuels Also included are Fluorescent
Indicator Absorption (FIA ndash ASTM D1319 (12)) composition results reported on the CPChem COAs Since
the FIA method determines total saturates the DHA results for n‐paraffins iso‐paraffins and
naphthenes must be added together to enable the comparison between those two methods Similarly
since the SFC method directly measures aromatics and total non‐aromatics are determined by
difference the olefins amount must be added to the total saturate levels from FIA and DHA to enable
comparisons with the non‐aromatics values from SFC The appropriate comparison categories are
indicated by dashed lines in Figures 313 and 314 Of the three methods SFC generally gives the
highest level of aromatics and FIA the lowest The DHA aromatics values are closer to the FIA levels than
to the SFC levels The DHA olefins are fairly close to the FIA results
117
80
244 241
7944 67
225144
316
860
859
697
421
459
676
384
228
745336
16
01
01208
110
115105
33
23
13
127
94
8168
64
06
58 39
334
10977
336 358
12
317
0
10
20
30
40
50
60
70
80
90
100
A B C D E F G H I J
Composition ( vol)
FACE GASOLINE
DHA Composition ‐ FACE Gasolines
n‐paraffins isoparaffins naphthenes olefins aromatics
18
Figure 313 Comparison of Composition Methods FACE Low Sensitivity Gasolines
Figure 314 Comparison of Composition Methods FACE High Sensitivity Gasolines
117
80
244
144
316
860 859
697
745336
16
01 0433
23
13 64
06
58 3912
317
996951 975
929
712
04
07 04 62
10
42 21 09
278
993
921 940996
610
07
79 6004
390
0
10
20
30
40
50
60
70
80
90
100
DHA FIA SFC DHA FIA SFC DHA FIA SFC DHA FIA SFC DHA FIA SFC
Composition ( )
FACE GASOLINE
Composition ‐ Low Sensitivity FACE Gasolines
n‐paraffins isoparaffins naphthenes olefins aromatics saturates nonaromatics
A B C I J
241
7944 67
225
421
459
676
384
228
01
208
110
115 105
127
94
81 68
334
10977
336 358
701
780
856
587 568
04
99
86
7879
295
12158
335 353
581
850900
595568
419
150100
405432
0
10
20
30
40
50
60
70
80
90
100
DHA FIA SFC DHA FIA SFC DHA FIA SFC DHA FIA SFC DHA FIA SFC
Composition ( )
FACE GASOLINE
Composition ‐ High Sensitivity FACE Gasolines
n‐paraffins isoparaffins naphthenes olefins aromatics saturates nonaromatics
D E F G H
19
323 Elemental Analyses
Carbon and hydrogen contents were measured by two labs using ASTM method D5291 (13) The
average results are presented in the bar graphs in figure 315 The carbon contents range from 8399‐
8748 wt and the hydrogen contents range from1252‐1601 wt As expected the FACE Gasolines
having the highest aromatics content (D G H and J) have the highest carbon and lowest hydrogen
contents
Figure 315 Carbon and Hydrogen Elemental Analyses of FACE Gasolines
8399 8443 8453 8646 8547 8496 8670 87488414 8624
1601 1557 1547 1354 1453 1504 1330 12521586 1376
0
10
20
30
40
50
60
70
80
90
100
A B C D E F G H I J
Compo
sition
(wt)
FACE Gasoline
Carbon‐Hydrogen Elemental Analyses
Hydrogen
Carbon
20
Sulfur content was measured by one lab ASTM method D5453 (14) The results displayed in the bar
charts in Figure 316 are essentially identical to the values reported on the CPChem COAs All FACE
Gasolines had ultra‐low sulfur levels FACE Gasolines E G and H had the highest levels at 21 22 and 15
ppm sulfur The other fuels had levels ranging from 2‐6 ppm
Figure 316 Sulfur Levels of FACE Gasolines
6
4 4
2
21
2
22
15
2 2
0
5
10
15
20
25
A B C D E F G H I J
Sulfur Content (p
pm)
FACE Gasoline
Sulfur Content ‐ FACE Gasolines
21
4 ANALYTICAL RESULTS FOR FACE GASOLINES BLENDED WITH ETHANOL
Although the FACE Gasolines were not formulated with ethanol the expectation is that some potential
users will be interested in testing the fuels with ethanol added To assist selection of fuels for those
studies four FACE Gasolines were selected for blending with levels of 10 15 and 30 vol ethanol The
fuels selected for this purpose were A B C and H The positions of these fuels in the design matrix are
shown below
In this section results of the analyses of the ethanol blends are discussed Chevron Phillips 66 BP and
a contract laboratory conducted the analyses As mentioned previously future production runs that are
required to remake fuels that sell out likely will results in some changes to the fuel property values
reported here
41 ASTM TEST RESULTS
ASTM methods were used to measure the ethanol content RON MON API gravity density distillation
profiles RVP and net heats of combustion of all of the ethanol blends made with the FACE Gasolines
The results of these analyses are summarized below and in Table A2 located in the Appendix
411 Ethanol Content
FACE Gasolines A B C and H were blended with nominally 10 15 and 30 vol ethanol The
concentration of ethanol in each blend were determined using ASTM method D5599 (15) (coupled with
ASTM D4052 density measurement) and by detailed hydrocarbon analysis using gas chromatography
with a flame ionization detector The results for both methods were in excellent agreement for all fuels
as shown below in Table 41
Table 41 Measured Ethanol Content of FACE Gasoline Blends
Ethanol Content (vol)
A B C H
10 15 30 10 15 30 10 15 30 10 15 30
D5599 101 147 299 100 147 302 102 146 295 102 146 303
DHA 100 146 301 100 148 301 103 148 299 102 147 304
22
412 RON MON and Octane Sensitivity
RON values were measured in CFR engines per ASTM method D2699 (4) Although the measurements
were conducted in four labs the lab‐to‐lab reproducibility was very good so only the average values are
reported here (but individual values are reported in Table A2) Average RON values for each fuel are
presented in Figure 41 For all four of these FACE Gasolines the RON values continue to increase even
at the 30 ethanol level although the rates of increase are lower than at lower ethanol levels FACE
Gasoline B has the highest RON at all ethanol levels with a value of about 106 at the 30 ethanol level
FACE Gasolines A and C have essentially the same RON values at all ethanol levels with RON values of
about 102 at the 30 ethanol level FACE Gasoline H without ethanol has a higher RON than A and C
but a lower RON at the 15 and 30 ethanol levels
Figure 41 RON Values of FACE Gasoline Blends with Ethanol
MON values were measured in CFR engines per ASTM method D2700 (5) Although the measurements were conducted in four labs the lab‐to‐lab reproducibility was very good so only the average values are reported here (but individual values are reported in Appendix A2) The MON values for each fuel are
presented in Figure 42 FACE Gasoline B has the highest MON values at all ethanol levels but unlike the other FACE Gasolines the MON value did not increase with ethanol contents above 10 vol The MON values for FACE Gasolines A and C were essentially the same and higher than those for FACE Gasoline H
80081082083084085086087088089090091092093094095096097098099010001010102010301040105010601070108010901100
0 5 10 15 20 25 30 35
RON
Ethanol (vol)
RON Values ‐ FACE Gasoline + Ethanol Blends
FACE A
FACE B
FACE H
FACE C
23
Figure 42 MON Values of FACE Gasoline Blends with Ethanol
Octane Sensitivity (S=RON‐MON) values are presented in Figure 43 As expected due to the relatively high sensitivity of ethanol the sensitivities of all four FACE Gasolines increase as the ethanol content increases FACE Gasoline H has the highest sensitivity at all ethanol levels except at 30 vol ethanol where the sensitivity of the FACE Gasoline B blend becomes slightly higher with values of 124 and 132 respectively The sensitivities for FACE Gasolines A and C are very similar to each other and although lower than the blends for the other FACE Gasolines have the highest rates of increase at the 30 level
Figure 43 Octane Sensitivities FACE Gasoline Blends with Ethanol
750
760
770
780
790
800
810
820
830
840
850
860
870
880
890
900
910
920
930
940
950
0 5 10 15 20 25 30 35
MON
Ethanol (vol)
MON Values ‐ FACE Gasoline + Ethanol Blends
FACE A
FACE B
FACE H
FACE C
00
10
20
30
40
50
60
70
80
90
100
110
120
130
140
0 5 10 15 20 25 30 35
S
Ethanol (vol)
Octane Sensitivity (S) ‐ FACE Gasoline + Ethanol Blends
FACE A
FACE B
FACE H
FACE C
24
413 Distillation Characteristics
The distillation properties of the fuels were determined by ASTM D86 (6) The values are plotted in
Figure 44 and tabulated in Table A2 in the Appendix The behavior and shapes of the curves are very
similar For a given gasoline all of the ethanol blends start at about the same IBP The blends
containing ethanol then follow the same curve which is lower than the base gasoline At a certain point
the ethanol blends then rise quickly to rejoin the distillation curve of the base gasoline The lower the
ethanol content of the blend the earlier (lower distilled volume ) the curve rejoins the base gasoline
curve
Figure 44 ASTM D86 Distillation Profiles for FACE Gasoline Blends with Ethanol
50
100
150
200
250
300
0 10 20 30 40 50 60 70 80 90 100
Temperature (˚ C)
Volume Distilled
D86 Distillation ‐ FACE A Gasoline + Ethanol Blends
0 EtOH
10 EtOH
15 EtOH
30 EtOH
50
100
150
200
250
300
0 10 20 30 40 50 60 70 80 90 100
Temperature (˚ C)
Volume Distilled
D86 Distillation ‐ FACE B Gasoline + Ethanol Blends
0 EtOH
10 EtOH
15 EtOH
30 EtOH
50
100
150
200
250
300
350
0 10 20 30 40 50 60 70 80 90 100
Temperature (˚ C)
Volume Distilled
D86 Distillation ‐ FACE C Gasoline + Ethanol Blends
0 EtOH
10 EtOH
15 EtOH
30 EtOH
50
100
150
200
250
300
350
400
450
0 10 20 30 40 50 60 70 80 90 100
Temperature (˚ C)
Volume Distilled
D86 Distillation ‐ FACE H Gasoline + Ethanol Blends
0 EtOH
10 EtOH
15 EtOH
30 EtOH
25
414 Reid Vapor Pressure (RVP)
The RVPs were determined using ASTM method D5191 (7) The values are plotted in Figure 45 For all
fuels the RVP appears to peak between 10 and 15 vol ethanol and then starts to decrease as the
ethanol content increases further
Figure 45 Reid Vapor Pressures for FACE Gasoline Blends with Ethanol
415 API Gravity and Density
The API gravities and densities of the fuels were measured by two labs using ASTM method D4052 (8) The values from the two labs were in excellent agreement and are listed in Table A2 The average density values are presented in Figure 46 For all of the FACE Gasolines the density increased as the ethanol content increased
Figure 46 Densities of FACE Gasoline Blends with Ethanol
7
75
8
85
9
95
10
0 5 10 15 20 25 30 35
RVP (psi)
Ethanol (vol)
Reid Vapor Pressure (RVP) ‐ FACE Gasoline + Ethanol Blends
FACE A
FACE B
FACE H
FACE C
0685 0697 0691
0759
0696 0705 0699
0761
0700 0710 0704
0763
0716 0724 0719
0768
0
01
02
03
04
05
06
07
08
09
1
A B C H
Density
(gm
l)
Ethanol (vol)
Density ‐ FACE Gasoline Blends with Ethanol
0
10
15
30
26
416 Net Heat of Combustion (NHC)
Net Heats of Combustion were measured by 2 labs using ASTM method D240 (9) For some fuels ASTM
method D4809 (10) was also used The values from both labs and both methods were very close to each
other and the average values are plotted in Figure 47 As expected since the net heat of combustion of
ethanol is lower than that of gasoline for all FACE Gasolines the net heat of combustion decreased as
ethanol content increased The decrease appeared to be linear with ethanol content The decrease
appeared to be steepest for FACE Gasoline B
Figure 47 Net Heat of Combustion of FACE Gasoline Blends with Ethanol
16000
16250
16500
16750
17000
17250
17500
17750
18000
18250
18500
18750
19000
19250
19500
0 5 10 15 20 25 30 35
Net Heat of C
ombustion (B
TUlb)
Ethanol (vol)
Net Heat of Combustion ‐ FACE Gasoline + Ethanol Blends
FACE A
FACE B
FACE H
FACE C
27
5 SUMMARY AND CONCLUSIONS
A subteam of the CRC AVFL FACE Working Group has designed a matrix of reference gasolines
known as the FACE Gasolines A commercial vendor has produced and made the fuels available
for purchase in research quantities It is expected that this will enable consistent comparisons
of engine and combustion results from different laboratories and test platforms based on the
use of the same set of fuels
The matrix is designed around four parameters expected to be of importance for advanced
gasoline engines RON octane sensitivity aromatics content and n‐paraffins content
Statistical methods were used to identify potential candidate formulations and down‐select to a
tractable number of 10 formulations
Detailed analyses were performed on the physical and chemical properties of the final fuel
formulations
Generally the property values measured in the current study agreed very well with the values
reported on the fuel blender (ChevronPhillips Chemical Company ‐ CPChem) Certificates of
Analyses (COAs)
As expected conflicts in the target properties for some of the fuels (such as high aromatics level
coupled with low octane sensitivity) led to some trade‐offs that resulted in some deviation in
the actual properties from the design properties
The RON values come close to meeting the targets for most of the fuels Fuels E H and J have
values that are 24‐38 units higher than the targets
Three of the four ldquohighrdquo sensitivity fuels have measured values of 59‐71 that are lower than
the target value of 10 Two of the ldquolowrdquo sensitivity fuels have measured values (34‐37) that are
a bit higher than the target value of le2 One of the low sensitivity design fuels (ldquoDrdquo) has a value
of 72 that actually effectively makes it a high sensitivity fuel
Detailed hydrocarbon analyses (DHA) indicate that the n‐paraffins contents range from 225‐
316 vol for the four FACE Gasolines that had targets of 25 vol and from 44‐117 vol for
the six FACE Gasolines that had targets of 5 vol
DHAs indicate that the aromatics contents range from 317‐358 vol for the four FACE
Gasolines that had a target of 35 vol and 0‐109 vol for the other fuels that had a target of 5
vol
The high sensitivity fuels contained the high sensitivity components of naphthenes (105‐208
vol) and olefins (68‐127 vol) The exception was Gasoline ldquoDrdquo which had neither of these
components but whose high sensitivity was derived from aromatics components
Five of the FACE Gasolines (ldquoArdquo ldquoBrdquo ldquoCrdquo ldquoFrdquo and ldquoIrdquo) are very rich in isoparaffins with contents ge
676 vol
Aromatics values determined by SFC were generally higher than the values obtained from DHA
The DHA olefins values were close to the FIA values reported on the CPChem COAs
The fuels having the highest aromatics content also have the highest densities and highest net
heats of combustion on an energy content per volume basis
With regards to distillation properties for all fuels the initial boiling points (IBPs) are in a
narrow range of 90‐110˚F although the end boiling points (EBPs) range from 253‐410˚F Three
28
of the high sensitivity fuels have the highest EBPs The two low‐mid RON fuels having low n‐
paraffins and low aromatics have the lowest EBPs
All of the FACE Gasolines have ultra‐low levels of sulfur with the highest value at 22 ppm S and
most fuels having le 6 ppm S
For the four FACE Gasolines blended with ethanol RON continues to increase as the ethanol
levels increase to 30 vol although the rate of increase is lower as the ethanol content
increases FACE Gasoline B which has the highest RON of 96 has the highest RON at all ethanol
levels with a value of about 106 at 30 ethanol At the same ethanol level FACE Gasolines A
and C have essentially the same RON values FACE Gasoline H starts with a higher RON value
than those of A or C but has a lower value at blend levels of 15 and 30 vol
MON increased as the ethanol level increased for FACE Gasolines A C and H The MON values
for these fuels were essentially constant even though the highest MON values were found for
the ethanol blends with FACE Gasoline B
For all blends octane sensitivity increased as ethanol content increased with the highest values
of 12‐13 for 30 vol ethanol blends with FACE Gasolines B and H
The D86 distillation curve trends are similar for the four FACE Gasolines For a given gasoline all
blends start at the same point At around 10 vol distilled the curves for the blends with
ethanol diverge from and are lower than the curves for the base gasolines At a certain point
the distillation curves for the blends rise quickly and re‐join the curve for the parent base fuel
The distillation curves for the 30 vol ethanol blends are generally flat as a function of
increasing vol distilled and only start to increase again at about 70‐80 vol distilled when
most of the ethanol has been distilled from the liquid
The Reid Vapor Pressures (RVPs) peak at about 10‐15 vol
Densities increase slightly as ethanol increases while net heats of combustion decrease
29
6 REFERENCES
1 Alnajjar M Cannella B Dettman H Fairbridge C Franz J Gallant T Gieleciak R Hager D Lay C Lewis S Ratcliff M Sluder S Storey J Yin H Zigler B ldquoChemical and Physical Properties of the Fuels for Advanced Combustion Engines (FACE) Research Diesel Fuelsrdquo CRC Report No FACE‐1 (2010)
2 Gallant T Franz J Alnajjar M Storey J Lewis S Sluder S Cannella W Fairbridge C Hager D Dettman H Luecke J Ratcliff M Zigler ldquoFuels for Advanced Combustion Engines Research Diesel Fuels Analysis of Physical and Chemical Propertiesrdquo SAE Paper 2009‐01‐2769 (2009)
3 CannellaW Fairbridge C Arboleda P Bays T Dettman H Foster M Gieleciak R Gunter G Hager D Lay C Lewis S Luecke J Sluder S Zigler B ldquoDetailed Characterization of the Physical and Chemical Properties of the Reformulated FACE Diesel Fuels FD2B FD4B and FD7Brdquo CRC Report AVFL‐19‐1 (2013)
4 ASTM International Standard Test Method for Research Octane Number of Spark‐Ignition Engine Fuel ASTM D2699 (ASTM International Pennsylvania 2009)
5 ASTM International Standard Test Method for Motor Octane Number of Spark‐Ignition Engine Fuel ASTM D2700 (ASTM International Pennsylvania 2009)
6 ASTM International Standard Test Method for Distillation of Petroleum Products at Atmospheric Pressure ASTM D86‐09e1 (ASTM International Pennsylvania 2009)
7 ASTM International Standard Test Method for Vapor Pressure of Petroleum Products (Mini‐Method) ASTM D5191 (ASTM International Pennsylvania 2009)
8 ASTM International Standard Test Method for Density and Relative Density of Liquids by Digital Density Meter ASTM D4052‐96(2002)e1 (ASTM International Pennsylvania 2002)
9 ASTM International Standard Test Method for Heat of Combustion of Liquid Hydrocarbon Fuels by Bomb Calorimeter ASTM D240‐02(2007) (ASTM International Pennsylvania 2007)
10 ASTM International Standard Test Method for Heat of Combustion of Liquid Hydrocarbon Fuels by Bomb Calorimeter ASTM D4809 (2007) (ASTM International Pennsylvania 2007)
11 ASTM International Standard Test Method for Determination of Aromatic Content and Polynuclear Aromatic Content of Diesel Fuels and Aviation Turbine Fuels by Supercritical Fluid Chromatography ASTM D5186‐03(2009) (ASTM International Pennsylvania 2009)
12 ASTM International Standard Test Method for Hydrocarbon Types in Liquid Petroleum Products by Fluorescent Indicator Adsorption ASTM D1319‐08 (ASTM International Pennsylvania 2008)
13 ASTM International Standard Test Methods for Instrumental Determination of Carbon Hydrogen and Nitrogen in Petroleum Products and Lubricants ASTM D5291‐02(2007) (ASTM International Pennsylvania 2007)
14 ASTM International Standard Test Methods for Determination of Total Sulfur in Light Hydrocarbons Spark‐Ignition Engine Fuel Diesel Engine Fuel and Engine Oil by Ultraviolet Fluorescence ASTM D5453(2007) (ASTM International Pennsylvania 2007)
15 ASTM International Standard Test Methods for Determination of Oxygenates in Gasoline by Gas Chromatography and Oxygen Selective Flame Ionization Detection ASTM D5599 (2007) (ASTM International Pennsylvania 2007)
30
31
Appendix A
Properties of FACE Gasolines
32
Table A1 Summary Data for FACE Gasolines
Specific Tests FACE Gasoline A B C D E F G H I J Research Octane Number (RON) (ASTM D2699) -Lab 1 843 958 850 946 871 940 969 870 700 738 -Lab 2 839 960 840 939 877 960 869 -Lab 3 835 957 840 -Average 839 958 843 942 874 940 965 869 7015 738 -CPChem COA 835 960 847 932 875 944 968 869 703 718 Motor Octane Number (MON) (ASTM D2700) -Lab 1 836 923 830 872 813 881 857 797 695 701 -Lab 2 833 931 830 868 808 860 799 -Lab 3 835 919 829 -Average 835 924 830 870 811 881 858 798 695 701 -CPChem COA 836 926 836 878 815 888 858 793 696 688 Sensitivity (RON-MON) -Lab 1 07 35 20 74 58 59 112 73 05 37 -Lab 2 06 29 10 71 69 100 70 -Lab 3 0 38 11 -Average 04 34 13 72 63 59 107 72 05 37 -CPChem COA -01 34 11 54 60 56 110 76 07 30 API Gravity (API˚) (ASTM D4052) -CPChem COA 750 714 734 587 636 686 545 568 744 595 -Lab 1 749 713 732 587 636 686 546 548 744 587 -Average 7495 7135 733 587 636 686 5455 558 744 591 Density (ASTM D4052) -CPChem COA 0691 0743 0725 0707 0760 0697 0741 -Lab 1 0685 0697 0691 0743 0725 0707 0760 0759 0697 0743 -Average 0685 0697 0691 0743 0725 0707 0760 0759 0697 0742 RVP (psi) (D5191) -CPChem COA 81 74 74 68 67 78 72 75 75 75 -Lab 1 80 73 75 73 76 77 Net Heat of Combustion (BTUlb) (ASTM D4809) 19186 18680 Net Heat of Combustion (BTUlb) (ASTM D240) 19251 19187 19257 18649 18884 19072 18602 18625 19225 18731
33
TableA1 Summary Data for FACE Gasolines
Specific Tests FACE Gasoline A B C D E F G H I J Distillation (˚F) (ASTM D86) -CPChem IBP 93 95 95 88 110 108 93 94 100 101
5 104 128 120 129 131 129 122 123 123 111 10 132 145 136 148 142 142 135 140 156 162 20 160 172 154 176 155 156 158 168 177 206 30 183 194 171 198 166 168 183 192 186 217 40 197 207 187 212 177 180 210 211 191 224 50 203 213 200 221 186 193 240 227 195 231 60 207 216 210 229 197 206 270 242 199 242 70 210 220 218 235 208 217 306 262 203 261 80 213 225 226 280 222 225 328 291 207 291 90 219 235 243 330 267 240 343 327 213 316 95 227 248 270 340 343 261 363 358 220 330 FBP 269 283 328 363 405 294 403 410 259 358
-Lab 1 IBP 90 97 93 97 107 102 99 98 99 95 5 122 133 126 133 134 134 122 127 139 111
10 140 149 139 151 143 144 136 143 160 166 20 165 175 157 179 156 157 158 170 178 209 30 186 196 174 200 168 169 182 194 187 219 40 198 209 188 214 177 182 209 213 192 225 50 204 214 201 224 188 195 238 229 196 232 60 207 218 210 234 197 207 268 243 200 242 70 210 221 218 248 208 218 304 263 204 263 80 213 226 227 288 224 228 328 291 208 292
90 219 236 245 331 258 243 343 329 213 316 95 228 248 274 341 329 261 358 357 220 330 FBP 262 280 330 365 402 291 405 408 247 357
-Average IBP 915 96 94 925 1085 105 96 96 995 98 5 113 1305 123 131 1325 1315 122 125 131 111
10 136 147 1375 1495 1425 143 1355 1415 158 164 20 1625 1735 1555 1775 1555 1565 158 169 1775 203 30 1845 195 1725 199 167 1685 1825 193 1865 218 40 1975 208 1875 213 177 181 2095 212 1915 2245 50 2035 2135 2005 2225 187 194 239 228 1955 2315 60 207 217 210 2315 197 2065 269 2425 1995 242 70 210 2205 218 2415 208 2175 305 2625 2035 262 80 213 2255 2265 284 223 2265 328 291 2075 2915
90 219 2355 244 3305 2625 2415 343 328 213 316 95 2275 248 272 3405 336 261 3605 3575 220 330 FBP 2655 2815 329 364 4035 2925 404 409 253 3575
34
Table A1 Summary Data for FACE Gasolines
Specific Tests FACE Gasoline A B C D E F G H I J Elemental Analysis (ASTM D 5291) -Carbon (wt) -Lab 1 8398 8441 8497 8647 8547 8671 8792 8415 -Lab 4 8400 8444 8419 8645 8547 8496 8669 8703 8414 8624 -Average 8399 8443 8458 8646 8547 8496 8670 8748 8414 8624 -Hydrogen (wt) -Lab 1 1602 1559 1503 1353 1453 1329 1208 1585 -Lab 4 1600 1556 1585 1355 1453 1504 1331 1297 1586 1376 -Average 1601 1557 1547 1354 1453 1504 1330 1252 1586 1376 Sulfur by UV Fluorescence (ppmw) (ASTM D5453) -CPChem COA 4 4 3 2 21 2 20 15 2 2 -Lab 4 6 4 4 2 21 2 22 15 2 2 Hydrocarbons by FIA (vol) (ASTM D1319) -Aromatics (vol) CPChem COA 0 42 21 295 121 58 335 353 09 278 -Olefins (vol) CPChem COA 04 07 04 04 99 86 78 79 62 10 -Saturates (vol) CPChem COA 996 951 975 701 780 856 587 568 929 712 Aromatics by SFC (ASTM D5186) (Lab 1) -MonoAromatics (wt) -Lab 1 07 78 60 414 142 100 393 412 04 387 -Lab 2 80 421 138 395 428 -Average 07 79 60 4175 140 100 394 420 04 387 -PolyAromatics (wt) -Lab 1 0 0 0 03 11 0 10 10 0 03 -Lab 2 0 0 09 12 15 -Average 0 0 0 015 10 0 11 125 0 03 -NonAromatics (wt) -Lab 1 993 922 940 583 847 900 597 578 996 610 -Lab 2 920 579 850 593 557 -Average 993 921 940 581 8475 900 595 5675 996 610
35
Table A1 Summary Data for FACE Gasolines
Specific Tests FACE Gasolines A B C D E F G H I J Detailed Hydrocarbon Analyses by GC-FID -n-paraffins (vol) (Targets) (5) (5) (25) (25) (5) (5) (5) (25) (5) (25) -Lab 1 1144 783 2409 2346 771 434 662 2214 1441 3115 -Lab 2 1187 815 2476 2473 803 446 685 2283 1437 3212 -Average 1165 799 2443 2410 787 440 673 2249 1439 3164 -iso-paraffins (vol) -Lab 1 8562 8591 688 4206 4563 6765 3821 2322 7449 3362 -Lab 2 8635 8586 7066 4221 4621 6747 3864 2240 7459 3366 -Average 8599 8688 6973 4213 4592 6756 3843 2281 7454 3364 -cyclo-paraffins (vol) -Lab 1 192 021 048 010 2216 1078 1163 1035 324 234 -Lab 2 130 007 023 010 1945 1118 1140 1066 336 224 -Average 161 014 036 010 2081 1098 1152 1050 330 229 -aromatics (vol) (Targets) (5) (5) (5) (35) (5) (5) (35) (35) (5) (35) -Lab 1 073 601 409 3425 1121 805 3419 3597 120 3212 -Lab 2 003 568 374 3258 1062 739 3306 3555 110 3125 -Average 38 584 392 3341 1092 772 3363 3576 115 3169 -olefins (vol) -Lab 1 024 001 248 004 1146 978 851 714 643 066 -Lab 2 018 003 006 005 1392 905 771 650 627 054 -Average 021 002 127 04 1269 942 811 682 635 060
36
37
Appendix B
Properties of FACE Gasoline Blends with Ethanol
38
Table B1 Summary Data for FACE Gasoline Blends with Ethanol
Specific Tests FACE Gasoline Blend A B Ethanol Content (Vol ) 0 10 15 30 0 10 15 30 Ethanol Content (Vol ) (ASTM D5599) 0 1012 1469 2990 0 995 1473 3016 Research Octane Number (RON) (ASTM D2699) -Lab 1 843 922 951 1032 958 1015 1039 1067 -Lab 2 839 923 951 1017 960 1008 1023 1050 -Lab 3 835 917 946 1025 957 1012 1031 1069 -Lab 4 916 945 1018 1009 1026 1053 -Average 839 920 948 1023 958 1011 1030 1060 Motor Octane Number (MON) (ASTM D2700) -Lab 1 836 878 890 912 923 936 936 934 -Lab 2 833 874 891 917 931 935 934 931 -Lab 3 835 881 893 911 919 933 934 933 -Lab 4 884 901 916 935 936 933 -Average 835 879 894 914 924 935 935 933 Sensitivity (RON-MON) -Lab 1 07 44 61 120 35 79 103 133 -Lab 2 06 49 60 100 29 73 89 119 -Lab 3 0 36 53 114 38 79 97 136 -Lab 4 32 44 102 74 91 120 -Average 04 41 54 109 34 76 95 127 API Gravity (API˚) (ASTM D4052) -Lab 1 749 7164 7066 661 7131 690 6772 6375 -Lab 4 716 706 660 690 676 638 -Average 749 7162 7063 6605 7131 690 6766 6377 Density (ASTM D4052) -Lab 1 06849 06959 06992 07154 0697 07050 07096 07240 -Lab 4 06966 06999 07161 07055 07106 07244 -Average 06849 06963 06996 07158 0697 07053 07101 07242 RVP (psi) (D5191) Lab 1 83 95 94 91 73 87 86 83 Net Heat of Combustion (BTUlb) (ASTM D4809) 18308 Net Heat of Combustion (BTUlb) (ASTM D240) -Lab 1 19266 18294 18080 16751 19207 18319 17941 16631 -Lab 4 19236 18208 17963 16487 19168 18307 17696 16234 -Average 19251 18251 18021 16619 19187 18313 17818 16432
39
Table B1 Summary Data for FACE Gasoline Blends with Ethanol
Specific Tests FACE Gasoline Blend C H Target Ethanol Content (Vol ) 0 10 15 30 0 10 15 30 Ethanol Content (Vol) (ASTM D5599) 0 1018 1462 2949 0 1016 1459 3034 Research Octane Number (RON) (ASTM D2699) -Lab 1 850 918 951 1012 870 919 941 993 -Lab 2 840 920 950 1014 869 927 941 996 -Lab 3 840 917 946 1019 869 920 937 995 -Lab 4 914 945 1015 916 946 991 -Average 843 917 948 1015 869 921 941 994 Motor Octane Number (MON) (ASTM D2700) -Lab 1 830 876 893 921 797 821 835 861 -Lab 2 830 868 880 924 793 820 831 885 -Lab 3 829 876 887 909 799 817 829 858 -Lab 4 881 890 914 828 839 877 -Average 830 875 888 916 796 822 833 870 Sensitivity (RON-MON) -Lab 1 20 42 58 91 73 98 106 132 -Lab 2 10 52 70 90 76 107 110 111 -Lab 3 11 41 59 110 70 103 108 137 -Lab 4 33 55 101 88 107 114 -(RON)avg ndash (MON)avg 13 42 60 99 73 99 108 124 API Gravity (API˚) (ASTM D4052) -Lab 1 732 7069 6943 6523 5481 5416 5375 5247 -Lab 4 707 693 652 544 538 527 -Average 732 707 694 652 548 543 5377 526 Density (ASTM D4052) -Lab 1 06906 06991 07035 07186 07587 07614 07631 07684 -Lab 4 06997 07043 07192 07610 07636 07678 -Average 06994 07039 07189 07587 07612 07633 07681 RVP (psi) (D5191) Lab 1 75 86 85 83 76 88 87 84 Net Heat of Combustion (BTUlb) (ASTM D4809) 19186 18198 17955 16692 16265 Net Heat of Combustion (BTUlb) (ASTM D240) -Lab 1 19257 18375 18012 16739 18675 17891 17550 16369 -Lab 4 18576 17809 17408 16322 -Average 19257 18375 18012 16739 18625 17850 17479 16345
40
Table B1 Summary Data for FACE Gasoline Blends with Ethanol
Specific Tests FACE Gasoline Blend A B Target Ethanol Content 0 10 15 30 0 10 15 30 Ethanol Content (Vol) -ASTM D5599 0 1012 1469 2990 0 995 1473 3016 -Detailed Hydrocarbon Analysis - GCFID -Lab 1 0 1000 1463 3017 0 1001 1476 3014 Elemental Analysis (ASTM D 5291) -Carbon (wt) -Lab 1 8443 8178 7941 7306 8465 8172 8029 7346 -Lab 4 8433 8085 7823 7361 8471 8110 7921 7380 -Average 8438 8131 7882 7333 8468 8141 7975 7363 -Hydrogen (wt) -Lab 1 1543 1527 1484 1446 1473 1462 1442 1387 -Lab 4 1606 1573 1548 1515 1561 1540 1525 1487 -Average 1575 1550 1516 1481 1517 1501 1483 1437 -Oxygen (wt) (ASTM D5599) Lab 4 0 400 578 1150 0 389 571 1147
Specific Tests FACE Gasoline Blend C H Target Ethanol Content 0 10 15 30 0 10 15 30 Ethanol Content (Vol) -ASTM D5599 0 1018 1462 2949 0 1016 1459 3034 -Detailed Hydrocarbon Analysis - GCFID -Lab 1 0 1027 1483 2988 0 1021 1468 3040 Elemental Analysis (ASTM D 5291) -Carbon (wt) -Lab 1 8447 8200 7998 7336 8768 8402 8401 7624 -Lab 4 8419 8077 7909 7353 8720 8316 8150 7626 -Average 8433 8138 7954 7345 8744 8359 8276 7625 -Hydrogen (wt) -Lab 1 1494 1465 1465 1405 1205 1199 1207 1218 -Lab 4 1585 1668 1523 1509 1300 1305 1292 1316 -Average 1540 1567 1494 1457 1253 1252 1250 1267 -Oxygen (wt) (ASTM D5599) Lab 4 0 401 572 1129 0 368 527 1088
Table B1 Summary Data for FACE Gasoline Blends with Ethanol
41
Specific Tests FACE Gasoline Blend A B Target Ethanol Content 0 10 15 30 0 10 15 30 Distillation (˚F) (ASTM D86) Lab 1 IBP 90 106 99 99 97 105 103 101 5 122 127 122 126 133 128 126 129 10 140 134 131 135 149 135 134 138 20 165 145 144 146 175 147 146 149 30 186 153 152 153 196 155 154 155 40 198 159 156 156 209 165 159 159 50 204 202 159 158 214 211 165 161 60 207 208 204 159 218 217 214 162 70 210 211 210 160 221 219 219 163 80 213 214 213 161 226 225 224 165 90 219 222 219 211 236 234 234 230 95 228 233 229 224 248 247 246 242 FBP 262 261 263 260 280 271 270 266
Specific Tests FACE Gasoline Blend C H Target Ethanol Content 0 10 15 30 0 10 15 30 Distillation (˚F) (ASTM D86) Lab 1 IBP 93 104 102 107 98 96 105 106 5 126 126 123 130 127 123 125 127 10 139 131 131 136 143 132 134 138 20 157 140 140 145 170 145 147 152 30 174 147 147 151 194 153 156 159 40 188 153 153 156 213 167 161 163 50 201 183 157 159 229 217 182 166 60 210 208 176 161 243 236 235 169 70 218 217 215 162 263 255 253 175 80 227 226 223 165 291 283 282 268 90 245 244 241 233 329 322 323 312 95 274 274 269 261 357 351 351 343 FBP 330 331 322 324 408 401 407 396
42

16
Figure 311 Detailed Hydrocarbon Analyses of High Sensitivity FACE Gasolines
64 68 143 165 18 07
70 105 19 10 04
46 17 18 16 08
21 82 09
29 06 37
3 4 5 6 7 8 9 10 11
Carbon Number
FACE Gasoline E ‐ Detailed Hydrocarbon Analysis (vol)
isoparaffins
cycloparaffins
aromatics
olefins
n‐paraffins
82 64 134 378 14
21 21
100
76
89
3 4 5 6 7 8 9 10 11
Carbon Number
FACE Gasoline F ‐ Detailed Hydrocarbon Analysis (vol)
isoparaffins
n‐paraffins
cycloparaffins
aromatics
olefins
65 66 72 152 16 10
74 09 16 10
15 33 218 54 14
36 25 10
37 07 10
3 4 5 6 7 8 9 10 11
Carbon Number
FACE Gasoline G ‐ Detailed Hydrocarbon Analysis (vol)
isoparaffins
cycloparaffins
aromatics
olefins
n‐paraffins
28 54 71 39 22 09
66 08 17 10
10 95 117 83 43 14
29 21 09
54 05 145 08
3 4 5 6 7 8 9 10 11
Carbon Number
FACE Gasoline H ‐ Detailed Hydrocarbon Analysis (vol)
isoparaffins
cycloparaffins
aromatics
olefins
n‐paraffins
17
Figure 312 Detailed Hydrocarbon Analyses Comparisons of FACE Gasolines
A comparison of the composition results from the DHA and SFC methods is presented in Figure 313 for
the low sensitivity fuels and Figure 314 for the high sensitivity fuels Also included are Fluorescent
Indicator Absorption (FIA ndash ASTM D1319 (12)) composition results reported on the CPChem COAs Since
the FIA method determines total saturates the DHA results for n‐paraffins iso‐paraffins and
naphthenes must be added together to enable the comparison between those two methods Similarly
since the SFC method directly measures aromatics and total non‐aromatics are determined by
difference the olefins amount must be added to the total saturate levels from FIA and DHA to enable
comparisons with the non‐aromatics values from SFC The appropriate comparison categories are
indicated by dashed lines in Figures 313 and 314 Of the three methods SFC generally gives the
highest level of aromatics and FIA the lowest The DHA aromatics values are closer to the FIA levels than
to the SFC levels The DHA olefins are fairly close to the FIA results
117
80
244 241
7944 67
225144
316
860
859
697
421
459
676
384
228
745336
16
01
01208
110
115105
33
23
13
127
94
8168
64
06
58 39
334
10977
336 358
12
317
0
10
20
30
40
50
60
70
80
90
100
A B C D E F G H I J
Composition ( vol)
FACE GASOLINE
DHA Composition ‐ FACE Gasolines
n‐paraffins isoparaffins naphthenes olefins aromatics
18
Figure 313 Comparison of Composition Methods FACE Low Sensitivity Gasolines
Figure 314 Comparison of Composition Methods FACE High Sensitivity Gasolines
117
80
244
144
316
860 859
697
745336
16
01 0433
23
13 64
06
58 3912
317
996951 975
929
712
04
07 04 62
10
42 21 09
278
993
921 940996
610
07
79 6004
390
0
10
20
30
40
50
60
70
80
90
100
DHA FIA SFC DHA FIA SFC DHA FIA SFC DHA FIA SFC DHA FIA SFC
Composition ( )
FACE GASOLINE
Composition ‐ Low Sensitivity FACE Gasolines
n‐paraffins isoparaffins naphthenes olefins aromatics saturates nonaromatics
A B C I J
241
7944 67
225
421
459
676
384
228
01
208
110
115 105
127
94
81 68
334
10977
336 358
701
780
856
587 568
04
99
86
7879
295
12158
335 353
581
850900
595568
419
150100
405432
0
10
20
30
40
50
60
70
80
90
100
DHA FIA SFC DHA FIA SFC DHA FIA SFC DHA FIA SFC DHA FIA SFC
Composition ( )
FACE GASOLINE
Composition ‐ High Sensitivity FACE Gasolines
n‐paraffins isoparaffins naphthenes olefins aromatics saturates nonaromatics
D E F G H
19
323 Elemental Analyses
Carbon and hydrogen contents were measured by two labs using ASTM method D5291 (13) The
average results are presented in the bar graphs in figure 315 The carbon contents range from 8399‐
8748 wt and the hydrogen contents range from1252‐1601 wt As expected the FACE Gasolines
having the highest aromatics content (D G H and J) have the highest carbon and lowest hydrogen
contents
Figure 315 Carbon and Hydrogen Elemental Analyses of FACE Gasolines
8399 8443 8453 8646 8547 8496 8670 87488414 8624
1601 1557 1547 1354 1453 1504 1330 12521586 1376
0
10
20
30
40
50
60
70
80
90
100
A B C D E F G H I J
Compo
sition
(wt)
FACE Gasoline
Carbon‐Hydrogen Elemental Analyses
Hydrogen
Carbon
20
Sulfur content was measured by one lab ASTM method D5453 (14) The results displayed in the bar
charts in Figure 316 are essentially identical to the values reported on the CPChem COAs All FACE
Gasolines had ultra‐low sulfur levels FACE Gasolines E G and H had the highest levels at 21 22 and 15
ppm sulfur The other fuels had levels ranging from 2‐6 ppm
Figure 316 Sulfur Levels of FACE Gasolines
6
4 4
2
21
2
22
15
2 2
0
5
10
15
20
25
A B C D E F G H I J
Sulfur Content (p
pm)
FACE Gasoline
Sulfur Content ‐ FACE Gasolines
21
4 ANALYTICAL RESULTS FOR FACE GASOLINES BLENDED WITH ETHANOL
Although the FACE Gasolines were not formulated with ethanol the expectation is that some potential
users will be interested in testing the fuels with ethanol added To assist selection of fuels for those
studies four FACE Gasolines were selected for blending with levels of 10 15 and 30 vol ethanol The
fuels selected for this purpose were A B C and H The positions of these fuels in the design matrix are
shown below
In this section results of the analyses of the ethanol blends are discussed Chevron Phillips 66 BP and
a contract laboratory conducted the analyses As mentioned previously future production runs that are
required to remake fuels that sell out likely will results in some changes to the fuel property values
reported here
41 ASTM TEST RESULTS
ASTM methods were used to measure the ethanol content RON MON API gravity density distillation
profiles RVP and net heats of combustion of all of the ethanol blends made with the FACE Gasolines
The results of these analyses are summarized below and in Table A2 located in the Appendix
411 Ethanol Content
FACE Gasolines A B C and H were blended with nominally 10 15 and 30 vol ethanol The
concentration of ethanol in each blend were determined using ASTM method D5599 (15) (coupled with
ASTM D4052 density measurement) and by detailed hydrocarbon analysis using gas chromatography
with a flame ionization detector The results for both methods were in excellent agreement for all fuels
as shown below in Table 41
Table 41 Measured Ethanol Content of FACE Gasoline Blends
Ethanol Content (vol)
A B C H
10 15 30 10 15 30 10 15 30 10 15 30
D5599 101 147 299 100 147 302 102 146 295 102 146 303
DHA 100 146 301 100 148 301 103 148 299 102 147 304
22
412 RON MON and Octane Sensitivity
RON values were measured in CFR engines per ASTM method D2699 (4) Although the measurements
were conducted in four labs the lab‐to‐lab reproducibility was very good so only the average values are
reported here (but individual values are reported in Table A2) Average RON values for each fuel are
presented in Figure 41 For all four of these FACE Gasolines the RON values continue to increase even
at the 30 ethanol level although the rates of increase are lower than at lower ethanol levels FACE
Gasoline B has the highest RON at all ethanol levels with a value of about 106 at the 30 ethanol level
FACE Gasolines A and C have essentially the same RON values at all ethanol levels with RON values of
about 102 at the 30 ethanol level FACE Gasoline H without ethanol has a higher RON than A and C
but a lower RON at the 15 and 30 ethanol levels
Figure 41 RON Values of FACE Gasoline Blends with Ethanol
MON values were measured in CFR engines per ASTM method D2700 (5) Although the measurements were conducted in four labs the lab‐to‐lab reproducibility was very good so only the average values are reported here (but individual values are reported in Appendix A2) The MON values for each fuel are
presented in Figure 42 FACE Gasoline B has the highest MON values at all ethanol levels but unlike the other FACE Gasolines the MON value did not increase with ethanol contents above 10 vol The MON values for FACE Gasolines A and C were essentially the same and higher than those for FACE Gasoline H
80081082083084085086087088089090091092093094095096097098099010001010102010301040105010601070108010901100
0 5 10 15 20 25 30 35
RON
Ethanol (vol)
RON Values ‐ FACE Gasoline + Ethanol Blends
FACE A
FACE B
FACE H
FACE C
23
Figure 42 MON Values of FACE Gasoline Blends with Ethanol
Octane Sensitivity (S=RON‐MON) values are presented in Figure 43 As expected due to the relatively high sensitivity of ethanol the sensitivities of all four FACE Gasolines increase as the ethanol content increases FACE Gasoline H has the highest sensitivity at all ethanol levels except at 30 vol ethanol where the sensitivity of the FACE Gasoline B blend becomes slightly higher with values of 124 and 132 respectively The sensitivities for FACE Gasolines A and C are very similar to each other and although lower than the blends for the other FACE Gasolines have the highest rates of increase at the 30 level
Figure 43 Octane Sensitivities FACE Gasoline Blends with Ethanol
750
760
770
780
790
800
810
820
830
840
850
860
870
880
890
900
910
920
930
940
950
0 5 10 15 20 25 30 35
MON
Ethanol (vol)
MON Values ‐ FACE Gasoline + Ethanol Blends
FACE A
FACE B
FACE H
FACE C
00
10
20
30
40
50
60
70
80
90
100
110
120
130
140
0 5 10 15 20 25 30 35
S
Ethanol (vol)
Octane Sensitivity (S) ‐ FACE Gasoline + Ethanol Blends
FACE A
FACE B
FACE H
FACE C
24
413 Distillation Characteristics
The distillation properties of the fuels were determined by ASTM D86 (6) The values are plotted in
Figure 44 and tabulated in Table A2 in the Appendix The behavior and shapes of the curves are very
similar For a given gasoline all of the ethanol blends start at about the same IBP The blends
containing ethanol then follow the same curve which is lower than the base gasoline At a certain point
the ethanol blends then rise quickly to rejoin the distillation curve of the base gasoline The lower the
ethanol content of the blend the earlier (lower distilled volume ) the curve rejoins the base gasoline
curve
Figure 44 ASTM D86 Distillation Profiles for FACE Gasoline Blends with Ethanol
50
100
150
200
250
300
0 10 20 30 40 50 60 70 80 90 100
Temperature (˚ C)
Volume Distilled
D86 Distillation ‐ FACE A Gasoline + Ethanol Blends
0 EtOH
10 EtOH
15 EtOH
30 EtOH
50
100
150
200
250
300
0 10 20 30 40 50 60 70 80 90 100
Temperature (˚ C)
Volume Distilled
D86 Distillation ‐ FACE B Gasoline + Ethanol Blends
0 EtOH
10 EtOH
15 EtOH
30 EtOH
50
100
150
200
250
300
350
0 10 20 30 40 50 60 70 80 90 100
Temperature (˚ C)
Volume Distilled
D86 Distillation ‐ FACE C Gasoline + Ethanol Blends
0 EtOH
10 EtOH
15 EtOH
30 EtOH
50
100
150
200
250
300
350
400
450
0 10 20 30 40 50 60 70 80 90 100
Temperature (˚ C)
Volume Distilled
D86 Distillation ‐ FACE H Gasoline + Ethanol Blends
0 EtOH
10 EtOH
15 EtOH
30 EtOH
25
414 Reid Vapor Pressure (RVP)
The RVPs were determined using ASTM method D5191 (7) The values are plotted in Figure 45 For all
fuels the RVP appears to peak between 10 and 15 vol ethanol and then starts to decrease as the
ethanol content increases further
Figure 45 Reid Vapor Pressures for FACE Gasoline Blends with Ethanol
415 API Gravity and Density
The API gravities and densities of the fuels were measured by two labs using ASTM method D4052 (8) The values from the two labs were in excellent agreement and are listed in Table A2 The average density values are presented in Figure 46 For all of the FACE Gasolines the density increased as the ethanol content increased
Figure 46 Densities of FACE Gasoline Blends with Ethanol
7
75
8
85
9
95
10
0 5 10 15 20 25 30 35
RVP (psi)
Ethanol (vol)
Reid Vapor Pressure (RVP) ‐ FACE Gasoline + Ethanol Blends
FACE A
FACE B
FACE H
FACE C
0685 0697 0691
0759
0696 0705 0699
0761
0700 0710 0704
0763
0716 0724 0719
0768
0
01
02
03
04
05
06
07
08
09
1
A B C H
Density
(gm
l)
Ethanol (vol)
Density ‐ FACE Gasoline Blends with Ethanol
0
10
15
30
26
416 Net Heat of Combustion (NHC)
Net Heats of Combustion were measured by 2 labs using ASTM method D240 (9) For some fuels ASTM
method D4809 (10) was also used The values from both labs and both methods were very close to each
other and the average values are plotted in Figure 47 As expected since the net heat of combustion of
ethanol is lower than that of gasoline for all FACE Gasolines the net heat of combustion decreased as
ethanol content increased The decrease appeared to be linear with ethanol content The decrease
appeared to be steepest for FACE Gasoline B
Figure 47 Net Heat of Combustion of FACE Gasoline Blends with Ethanol
16000
16250
16500
16750
17000
17250
17500
17750
18000
18250
18500
18750
19000
19250
19500
0 5 10 15 20 25 30 35
Net Heat of C
ombustion (B
TUlb)
Ethanol (vol)
Net Heat of Combustion ‐ FACE Gasoline + Ethanol Blends
FACE A
FACE B
FACE H
FACE C
27
5 SUMMARY AND CONCLUSIONS
A subteam of the CRC AVFL FACE Working Group has designed a matrix of reference gasolines
known as the FACE Gasolines A commercial vendor has produced and made the fuels available
for purchase in research quantities It is expected that this will enable consistent comparisons
of engine and combustion results from different laboratories and test platforms based on the
use of the same set of fuels
The matrix is designed around four parameters expected to be of importance for advanced
gasoline engines RON octane sensitivity aromatics content and n‐paraffins content
Statistical methods were used to identify potential candidate formulations and down‐select to a
tractable number of 10 formulations
Detailed analyses were performed on the physical and chemical properties of the final fuel
formulations
Generally the property values measured in the current study agreed very well with the values
reported on the fuel blender (ChevronPhillips Chemical Company ‐ CPChem) Certificates of
Analyses (COAs)
As expected conflicts in the target properties for some of the fuels (such as high aromatics level
coupled with low octane sensitivity) led to some trade‐offs that resulted in some deviation in
the actual properties from the design properties
The RON values come close to meeting the targets for most of the fuels Fuels E H and J have
values that are 24‐38 units higher than the targets
Three of the four ldquohighrdquo sensitivity fuels have measured values of 59‐71 that are lower than
the target value of 10 Two of the ldquolowrdquo sensitivity fuels have measured values (34‐37) that are
a bit higher than the target value of le2 One of the low sensitivity design fuels (ldquoDrdquo) has a value
of 72 that actually effectively makes it a high sensitivity fuel
Detailed hydrocarbon analyses (DHA) indicate that the n‐paraffins contents range from 225‐
316 vol for the four FACE Gasolines that had targets of 25 vol and from 44‐117 vol for
the six FACE Gasolines that had targets of 5 vol
DHAs indicate that the aromatics contents range from 317‐358 vol for the four FACE
Gasolines that had a target of 35 vol and 0‐109 vol for the other fuels that had a target of 5
vol
The high sensitivity fuels contained the high sensitivity components of naphthenes (105‐208
vol) and olefins (68‐127 vol) The exception was Gasoline ldquoDrdquo which had neither of these
components but whose high sensitivity was derived from aromatics components
Five of the FACE Gasolines (ldquoArdquo ldquoBrdquo ldquoCrdquo ldquoFrdquo and ldquoIrdquo) are very rich in isoparaffins with contents ge
676 vol
Aromatics values determined by SFC were generally higher than the values obtained from DHA
The DHA olefins values were close to the FIA values reported on the CPChem COAs
The fuels having the highest aromatics content also have the highest densities and highest net
heats of combustion on an energy content per volume basis
With regards to distillation properties for all fuels the initial boiling points (IBPs) are in a
narrow range of 90‐110˚F although the end boiling points (EBPs) range from 253‐410˚F Three
28
of the high sensitivity fuels have the highest EBPs The two low‐mid RON fuels having low n‐
paraffins and low aromatics have the lowest EBPs
All of the FACE Gasolines have ultra‐low levels of sulfur with the highest value at 22 ppm S and
most fuels having le 6 ppm S
For the four FACE Gasolines blended with ethanol RON continues to increase as the ethanol
levels increase to 30 vol although the rate of increase is lower as the ethanol content
increases FACE Gasoline B which has the highest RON of 96 has the highest RON at all ethanol
levels with a value of about 106 at 30 ethanol At the same ethanol level FACE Gasolines A
and C have essentially the same RON values FACE Gasoline H starts with a higher RON value
than those of A or C but has a lower value at blend levels of 15 and 30 vol
MON increased as the ethanol level increased for FACE Gasolines A C and H The MON values
for these fuels were essentially constant even though the highest MON values were found for
the ethanol blends with FACE Gasoline B
For all blends octane sensitivity increased as ethanol content increased with the highest values
of 12‐13 for 30 vol ethanol blends with FACE Gasolines B and H
The D86 distillation curve trends are similar for the four FACE Gasolines For a given gasoline all
blends start at the same point At around 10 vol distilled the curves for the blends with
ethanol diverge from and are lower than the curves for the base gasolines At a certain point
the distillation curves for the blends rise quickly and re‐join the curve for the parent base fuel
The distillation curves for the 30 vol ethanol blends are generally flat as a function of
increasing vol distilled and only start to increase again at about 70‐80 vol distilled when
most of the ethanol has been distilled from the liquid
The Reid Vapor Pressures (RVPs) peak at about 10‐15 vol
Densities increase slightly as ethanol increases while net heats of combustion decrease
29
6 REFERENCES
1 Alnajjar M Cannella B Dettman H Fairbridge C Franz J Gallant T Gieleciak R Hager D Lay C Lewis S Ratcliff M Sluder S Storey J Yin H Zigler B ldquoChemical and Physical Properties of the Fuels for Advanced Combustion Engines (FACE) Research Diesel Fuelsrdquo CRC Report No FACE‐1 (2010)
2 Gallant T Franz J Alnajjar M Storey J Lewis S Sluder S Cannella W Fairbridge C Hager D Dettman H Luecke J Ratcliff M Zigler ldquoFuels for Advanced Combustion Engines Research Diesel Fuels Analysis of Physical and Chemical Propertiesrdquo SAE Paper 2009‐01‐2769 (2009)
3 CannellaW Fairbridge C Arboleda P Bays T Dettman H Foster M Gieleciak R Gunter G Hager D Lay C Lewis S Luecke J Sluder S Zigler B ldquoDetailed Characterization of the Physical and Chemical Properties of the Reformulated FACE Diesel Fuels FD2B FD4B and FD7Brdquo CRC Report AVFL‐19‐1 (2013)
4 ASTM International Standard Test Method for Research Octane Number of Spark‐Ignition Engine Fuel ASTM D2699 (ASTM International Pennsylvania 2009)
5 ASTM International Standard Test Method for Motor Octane Number of Spark‐Ignition Engine Fuel ASTM D2700 (ASTM International Pennsylvania 2009)
6 ASTM International Standard Test Method for Distillation of Petroleum Products at Atmospheric Pressure ASTM D86‐09e1 (ASTM International Pennsylvania 2009)
7 ASTM International Standard Test Method for Vapor Pressure of Petroleum Products (Mini‐Method) ASTM D5191 (ASTM International Pennsylvania 2009)
8 ASTM International Standard Test Method for Density and Relative Density of Liquids by Digital Density Meter ASTM D4052‐96(2002)e1 (ASTM International Pennsylvania 2002)
9 ASTM International Standard Test Method for Heat of Combustion of Liquid Hydrocarbon Fuels by Bomb Calorimeter ASTM D240‐02(2007) (ASTM International Pennsylvania 2007)
10 ASTM International Standard Test Method for Heat of Combustion of Liquid Hydrocarbon Fuels by Bomb Calorimeter ASTM D4809 (2007) (ASTM International Pennsylvania 2007)
11 ASTM International Standard Test Method for Determination of Aromatic Content and Polynuclear Aromatic Content of Diesel Fuels and Aviation Turbine Fuels by Supercritical Fluid Chromatography ASTM D5186‐03(2009) (ASTM International Pennsylvania 2009)
12 ASTM International Standard Test Method for Hydrocarbon Types in Liquid Petroleum Products by Fluorescent Indicator Adsorption ASTM D1319‐08 (ASTM International Pennsylvania 2008)
13 ASTM International Standard Test Methods for Instrumental Determination of Carbon Hydrogen and Nitrogen in Petroleum Products and Lubricants ASTM D5291‐02(2007) (ASTM International Pennsylvania 2007)
14 ASTM International Standard Test Methods for Determination of Total Sulfur in Light Hydrocarbons Spark‐Ignition Engine Fuel Diesel Engine Fuel and Engine Oil by Ultraviolet Fluorescence ASTM D5453(2007) (ASTM International Pennsylvania 2007)
15 ASTM International Standard Test Methods for Determination of Oxygenates in Gasoline by Gas Chromatography and Oxygen Selective Flame Ionization Detection ASTM D5599 (2007) (ASTM International Pennsylvania 2007)
30
31
Appendix A
Properties of FACE Gasolines
32
Table A1 Summary Data for FACE Gasolines
Specific Tests FACE Gasoline A B C D E F G H I J Research Octane Number (RON) (ASTM D2699) -Lab 1 843 958 850 946 871 940 969 870 700 738 -Lab 2 839 960 840 939 877 960 869 -Lab 3 835 957 840 -Average 839 958 843 942 874 940 965 869 7015 738 -CPChem COA 835 960 847 932 875 944 968 869 703 718 Motor Octane Number (MON) (ASTM D2700) -Lab 1 836 923 830 872 813 881 857 797 695 701 -Lab 2 833 931 830 868 808 860 799 -Lab 3 835 919 829 -Average 835 924 830 870 811 881 858 798 695 701 -CPChem COA 836 926 836 878 815 888 858 793 696 688 Sensitivity (RON-MON) -Lab 1 07 35 20 74 58 59 112 73 05 37 -Lab 2 06 29 10 71 69 100 70 -Lab 3 0 38 11 -Average 04 34 13 72 63 59 107 72 05 37 -CPChem COA -01 34 11 54 60 56 110 76 07 30 API Gravity (API˚) (ASTM D4052) -CPChem COA 750 714 734 587 636 686 545 568 744 595 -Lab 1 749 713 732 587 636 686 546 548 744 587 -Average 7495 7135 733 587 636 686 5455 558 744 591 Density (ASTM D4052) -CPChem COA 0691 0743 0725 0707 0760 0697 0741 -Lab 1 0685 0697 0691 0743 0725 0707 0760 0759 0697 0743 -Average 0685 0697 0691 0743 0725 0707 0760 0759 0697 0742 RVP (psi) (D5191) -CPChem COA 81 74 74 68 67 78 72 75 75 75 -Lab 1 80 73 75 73 76 77 Net Heat of Combustion (BTUlb) (ASTM D4809) 19186 18680 Net Heat of Combustion (BTUlb) (ASTM D240) 19251 19187 19257 18649 18884 19072 18602 18625 19225 18731
33
TableA1 Summary Data for FACE Gasolines
Specific Tests FACE Gasoline A B C D E F G H I J Distillation (˚F) (ASTM D86) -CPChem IBP 93 95 95 88 110 108 93 94 100 101
5 104 128 120 129 131 129 122 123 123 111 10 132 145 136 148 142 142 135 140 156 162 20 160 172 154 176 155 156 158 168 177 206 30 183 194 171 198 166 168 183 192 186 217 40 197 207 187 212 177 180 210 211 191 224 50 203 213 200 221 186 193 240 227 195 231 60 207 216 210 229 197 206 270 242 199 242 70 210 220 218 235 208 217 306 262 203 261 80 213 225 226 280 222 225 328 291 207 291 90 219 235 243 330 267 240 343 327 213 316 95 227 248 270 340 343 261 363 358 220 330 FBP 269 283 328 363 405 294 403 410 259 358
-Lab 1 IBP 90 97 93 97 107 102 99 98 99 95 5 122 133 126 133 134 134 122 127 139 111
10 140 149 139 151 143 144 136 143 160 166 20 165 175 157 179 156 157 158 170 178 209 30 186 196 174 200 168 169 182 194 187 219 40 198 209 188 214 177 182 209 213 192 225 50 204 214 201 224 188 195 238 229 196 232 60 207 218 210 234 197 207 268 243 200 242 70 210 221 218 248 208 218 304 263 204 263 80 213 226 227 288 224 228 328 291 208 292
90 219 236 245 331 258 243 343 329 213 316 95 228 248 274 341 329 261 358 357 220 330 FBP 262 280 330 365 402 291 405 408 247 357
-Average IBP 915 96 94 925 1085 105 96 96 995 98 5 113 1305 123 131 1325 1315 122 125 131 111
10 136 147 1375 1495 1425 143 1355 1415 158 164 20 1625 1735 1555 1775 1555 1565 158 169 1775 203 30 1845 195 1725 199 167 1685 1825 193 1865 218 40 1975 208 1875 213 177 181 2095 212 1915 2245 50 2035 2135 2005 2225 187 194 239 228 1955 2315 60 207 217 210 2315 197 2065 269 2425 1995 242 70 210 2205 218 2415 208 2175 305 2625 2035 262 80 213 2255 2265 284 223 2265 328 291 2075 2915
90 219 2355 244 3305 2625 2415 343 328 213 316 95 2275 248 272 3405 336 261 3605 3575 220 330 FBP 2655 2815 329 364 4035 2925 404 409 253 3575
34
Table A1 Summary Data for FACE Gasolines
Specific Tests FACE Gasoline A B C D E F G H I J Elemental Analysis (ASTM D 5291) -Carbon (wt) -Lab 1 8398 8441 8497 8647 8547 8671 8792 8415 -Lab 4 8400 8444 8419 8645 8547 8496 8669 8703 8414 8624 -Average 8399 8443 8458 8646 8547 8496 8670 8748 8414 8624 -Hydrogen (wt) -Lab 1 1602 1559 1503 1353 1453 1329 1208 1585 -Lab 4 1600 1556 1585 1355 1453 1504 1331 1297 1586 1376 -Average 1601 1557 1547 1354 1453 1504 1330 1252 1586 1376 Sulfur by UV Fluorescence (ppmw) (ASTM D5453) -CPChem COA 4 4 3 2 21 2 20 15 2 2 -Lab 4 6 4 4 2 21 2 22 15 2 2 Hydrocarbons by FIA (vol) (ASTM D1319) -Aromatics (vol) CPChem COA 0 42 21 295 121 58 335 353 09 278 -Olefins (vol) CPChem COA 04 07 04 04 99 86 78 79 62 10 -Saturates (vol) CPChem COA 996 951 975 701 780 856 587 568 929 712 Aromatics by SFC (ASTM D5186) (Lab 1) -MonoAromatics (wt) -Lab 1 07 78 60 414 142 100 393 412 04 387 -Lab 2 80 421 138 395 428 -Average 07 79 60 4175 140 100 394 420 04 387 -PolyAromatics (wt) -Lab 1 0 0 0 03 11 0 10 10 0 03 -Lab 2 0 0 09 12 15 -Average 0 0 0 015 10 0 11 125 0 03 -NonAromatics (wt) -Lab 1 993 922 940 583 847 900 597 578 996 610 -Lab 2 920 579 850 593 557 -Average 993 921 940 581 8475 900 595 5675 996 610
35
Table A1 Summary Data for FACE Gasolines
Specific Tests FACE Gasolines A B C D E F G H I J Detailed Hydrocarbon Analyses by GC-FID -n-paraffins (vol) (Targets) (5) (5) (25) (25) (5) (5) (5) (25) (5) (25) -Lab 1 1144 783 2409 2346 771 434 662 2214 1441 3115 -Lab 2 1187 815 2476 2473 803 446 685 2283 1437 3212 -Average 1165 799 2443 2410 787 440 673 2249 1439 3164 -iso-paraffins (vol) -Lab 1 8562 8591 688 4206 4563 6765 3821 2322 7449 3362 -Lab 2 8635 8586 7066 4221 4621 6747 3864 2240 7459 3366 -Average 8599 8688 6973 4213 4592 6756 3843 2281 7454 3364 -cyclo-paraffins (vol) -Lab 1 192 021 048 010 2216 1078 1163 1035 324 234 -Lab 2 130 007 023 010 1945 1118 1140 1066 336 224 -Average 161 014 036 010 2081 1098 1152 1050 330 229 -aromatics (vol) (Targets) (5) (5) (5) (35) (5) (5) (35) (35) (5) (35) -Lab 1 073 601 409 3425 1121 805 3419 3597 120 3212 -Lab 2 003 568 374 3258 1062 739 3306 3555 110 3125 -Average 38 584 392 3341 1092 772 3363 3576 115 3169 -olefins (vol) -Lab 1 024 001 248 004 1146 978 851 714 643 066 -Lab 2 018 003 006 005 1392 905 771 650 627 054 -Average 021 002 127 04 1269 942 811 682 635 060
36
37
Appendix B
Properties of FACE Gasoline Blends with Ethanol
38
Table B1 Summary Data for FACE Gasoline Blends with Ethanol
Specific Tests FACE Gasoline Blend A B Ethanol Content (Vol ) 0 10 15 30 0 10 15 30 Ethanol Content (Vol ) (ASTM D5599) 0 1012 1469 2990 0 995 1473 3016 Research Octane Number (RON) (ASTM D2699) -Lab 1 843 922 951 1032 958 1015 1039 1067 -Lab 2 839 923 951 1017 960 1008 1023 1050 -Lab 3 835 917 946 1025 957 1012 1031 1069 -Lab 4 916 945 1018 1009 1026 1053 -Average 839 920 948 1023 958 1011 1030 1060 Motor Octane Number (MON) (ASTM D2700) -Lab 1 836 878 890 912 923 936 936 934 -Lab 2 833 874 891 917 931 935 934 931 -Lab 3 835 881 893 911 919 933 934 933 -Lab 4 884 901 916 935 936 933 -Average 835 879 894 914 924 935 935 933 Sensitivity (RON-MON) -Lab 1 07 44 61 120 35 79 103 133 -Lab 2 06 49 60 100 29 73 89 119 -Lab 3 0 36 53 114 38 79 97 136 -Lab 4 32 44 102 74 91 120 -Average 04 41 54 109 34 76 95 127 API Gravity (API˚) (ASTM D4052) -Lab 1 749 7164 7066 661 7131 690 6772 6375 -Lab 4 716 706 660 690 676 638 -Average 749 7162 7063 6605 7131 690 6766 6377 Density (ASTM D4052) -Lab 1 06849 06959 06992 07154 0697 07050 07096 07240 -Lab 4 06966 06999 07161 07055 07106 07244 -Average 06849 06963 06996 07158 0697 07053 07101 07242 RVP (psi) (D5191) Lab 1 83 95 94 91 73 87 86 83 Net Heat of Combustion (BTUlb) (ASTM D4809) 18308 Net Heat of Combustion (BTUlb) (ASTM D240) -Lab 1 19266 18294 18080 16751 19207 18319 17941 16631 -Lab 4 19236 18208 17963 16487 19168 18307 17696 16234 -Average 19251 18251 18021 16619 19187 18313 17818 16432
39
Table B1 Summary Data for FACE Gasoline Blends with Ethanol
Specific Tests FACE Gasoline Blend C H Target Ethanol Content (Vol ) 0 10 15 30 0 10 15 30 Ethanol Content (Vol) (ASTM D5599) 0 1018 1462 2949 0 1016 1459 3034 Research Octane Number (RON) (ASTM D2699) -Lab 1 850 918 951 1012 870 919 941 993 -Lab 2 840 920 950 1014 869 927 941 996 -Lab 3 840 917 946 1019 869 920 937 995 -Lab 4 914 945 1015 916 946 991 -Average 843 917 948 1015 869 921 941 994 Motor Octane Number (MON) (ASTM D2700) -Lab 1 830 876 893 921 797 821 835 861 -Lab 2 830 868 880 924 793 820 831 885 -Lab 3 829 876 887 909 799 817 829 858 -Lab 4 881 890 914 828 839 877 -Average 830 875 888 916 796 822 833 870 Sensitivity (RON-MON) -Lab 1 20 42 58 91 73 98 106 132 -Lab 2 10 52 70 90 76 107 110 111 -Lab 3 11 41 59 110 70 103 108 137 -Lab 4 33 55 101 88 107 114 -(RON)avg ndash (MON)avg 13 42 60 99 73 99 108 124 API Gravity (API˚) (ASTM D4052) -Lab 1 732 7069 6943 6523 5481 5416 5375 5247 -Lab 4 707 693 652 544 538 527 -Average 732 707 694 652 548 543 5377 526 Density (ASTM D4052) -Lab 1 06906 06991 07035 07186 07587 07614 07631 07684 -Lab 4 06997 07043 07192 07610 07636 07678 -Average 06994 07039 07189 07587 07612 07633 07681 RVP (psi) (D5191) Lab 1 75 86 85 83 76 88 87 84 Net Heat of Combustion (BTUlb) (ASTM D4809) 19186 18198 17955 16692 16265 Net Heat of Combustion (BTUlb) (ASTM D240) -Lab 1 19257 18375 18012 16739 18675 17891 17550 16369 -Lab 4 18576 17809 17408 16322 -Average 19257 18375 18012 16739 18625 17850 17479 16345
40
Table B1 Summary Data for FACE Gasoline Blends with Ethanol
Specific Tests FACE Gasoline Blend A B Target Ethanol Content 0 10 15 30 0 10 15 30 Ethanol Content (Vol) -ASTM D5599 0 1012 1469 2990 0 995 1473 3016 -Detailed Hydrocarbon Analysis - GCFID -Lab 1 0 1000 1463 3017 0 1001 1476 3014 Elemental Analysis (ASTM D 5291) -Carbon (wt) -Lab 1 8443 8178 7941 7306 8465 8172 8029 7346 -Lab 4 8433 8085 7823 7361 8471 8110 7921 7380 -Average 8438 8131 7882 7333 8468 8141 7975 7363 -Hydrogen (wt) -Lab 1 1543 1527 1484 1446 1473 1462 1442 1387 -Lab 4 1606 1573 1548 1515 1561 1540 1525 1487 -Average 1575 1550 1516 1481 1517 1501 1483 1437 -Oxygen (wt) (ASTM D5599) Lab 4 0 400 578 1150 0 389 571 1147
Specific Tests FACE Gasoline Blend C H Target Ethanol Content 0 10 15 30 0 10 15 30 Ethanol Content (Vol) -ASTM D5599 0 1018 1462 2949 0 1016 1459 3034 -Detailed Hydrocarbon Analysis - GCFID -Lab 1 0 1027 1483 2988 0 1021 1468 3040 Elemental Analysis (ASTM D 5291) -Carbon (wt) -Lab 1 8447 8200 7998 7336 8768 8402 8401 7624 -Lab 4 8419 8077 7909 7353 8720 8316 8150 7626 -Average 8433 8138 7954 7345 8744 8359 8276 7625 -Hydrogen (wt) -Lab 1 1494 1465 1465 1405 1205 1199 1207 1218 -Lab 4 1585 1668 1523 1509 1300 1305 1292 1316 -Average 1540 1567 1494 1457 1253 1252 1250 1267 -Oxygen (wt) (ASTM D5599) Lab 4 0 401 572 1129 0 368 527 1088
Table B1 Summary Data for FACE Gasoline Blends with Ethanol
41
Specific Tests FACE Gasoline Blend A B Target Ethanol Content 0 10 15 30 0 10 15 30 Distillation (˚F) (ASTM D86) Lab 1 IBP 90 106 99 99 97 105 103 101 5 122 127 122 126 133 128 126 129 10 140 134 131 135 149 135 134 138 20 165 145 144 146 175 147 146 149 30 186 153 152 153 196 155 154 155 40 198 159 156 156 209 165 159 159 50 204 202 159 158 214 211 165 161 60 207 208 204 159 218 217 214 162 70 210 211 210 160 221 219 219 163 80 213 214 213 161 226 225 224 165 90 219 222 219 211 236 234 234 230 95 228 233 229 224 248 247 246 242 FBP 262 261 263 260 280 271 270 266
Specific Tests FACE Gasoline Blend C H Target Ethanol Content 0 10 15 30 0 10 15 30 Distillation (˚F) (ASTM D86) Lab 1 IBP 93 104 102 107 98 96 105 106 5 126 126 123 130 127 123 125 127 10 139 131 131 136 143 132 134 138 20 157 140 140 145 170 145 147 152 30 174 147 147 151 194 153 156 159 40 188 153 153 156 213 167 161 163 50 201 183 157 159 229 217 182 166 60 210 208 176 161 243 236 235 169 70 218 217 215 162 263 255 253 175 80 227 226 223 165 291 283 282 268 90 245 244 241 233 329 322 323 312 95 274 274 269 261 357 351 351 343 FBP 330 331 322 324 408 401 407 396
42
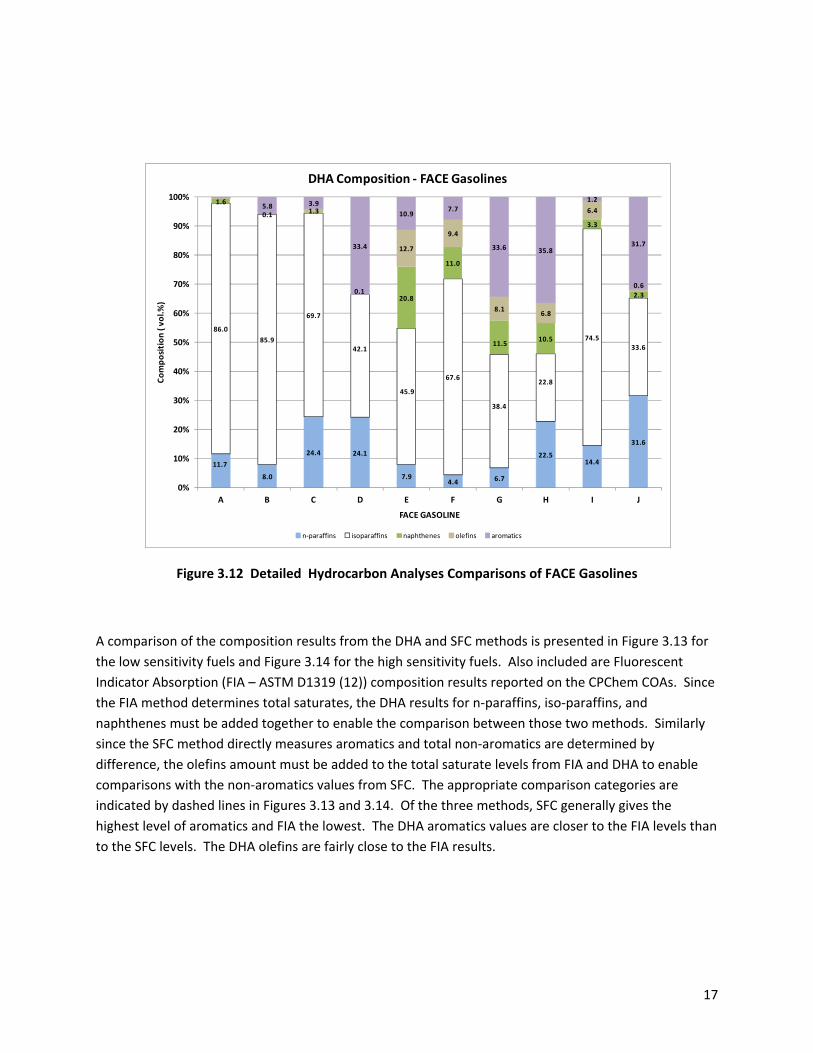
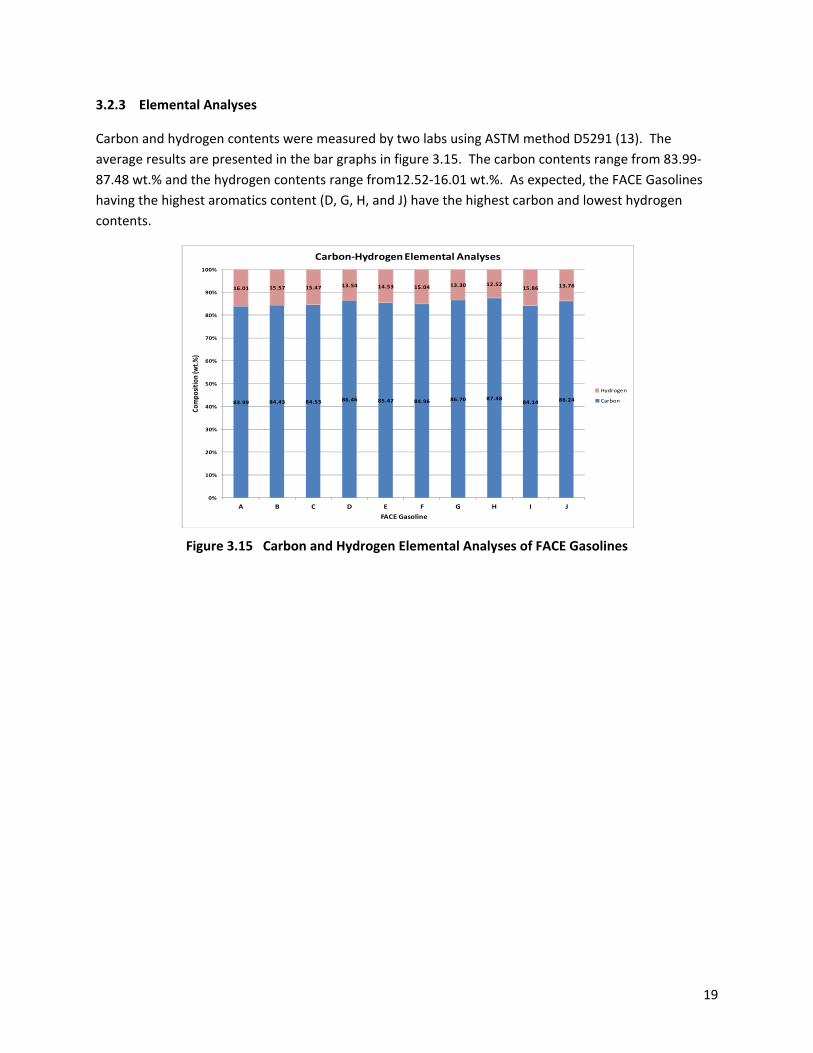
20
Sulfur content was measured by one lab ASTM method D5453 (14) The results displayed in the bar
charts in Figure 316 are essentially identical to the values reported on the CPChem COAs All FACE
Gasolines had ultra‐low sulfur levels FACE Gasolines E G and H had the highest levels at 21 22 and 15
ppm sulfur The other fuels had levels ranging from 2‐6 ppm
Figure 316 Sulfur Levels of FACE Gasolines
6
4 4
2
21
2
22
15
2 2
0
5
10
15
20
25
A B C D E F G H I J
Sulfur Content (p
pm)
FACE Gasoline
Sulfur Content ‐ FACE Gasolines
21
4 ANALYTICAL RESULTS FOR FACE GASOLINES BLENDED WITH ETHANOL
Although the FACE Gasolines were not formulated with ethanol the expectation is that some potential
users will be interested in testing the fuels with ethanol added To assist selection of fuels for those
studies four FACE Gasolines were selected for blending with levels of 10 15 and 30 vol ethanol The
fuels selected for this purpose were A B C and H The positions of these fuels in the design matrix are
shown below
In this section results of the analyses of the ethanol blends are discussed Chevron Phillips 66 BP and
a contract laboratory conducted the analyses As mentioned previously future production runs that are
required to remake fuels that sell out likely will results in some changes to the fuel property values
reported here
41 ASTM TEST RESULTS
ASTM methods were used to measure the ethanol content RON MON API gravity density distillation
profiles RVP and net heats of combustion of all of the ethanol blends made with the FACE Gasolines
The results of these analyses are summarized below and in Table A2 located in the Appendix
411 Ethanol Content
FACE Gasolines A B C and H were blended with nominally 10 15 and 30 vol ethanol The
concentration of ethanol in each blend were determined using ASTM method D5599 (15) (coupled with
ASTM D4052 density measurement) and by detailed hydrocarbon analysis using gas chromatography
with a flame ionization detector The results for both methods were in excellent agreement for all fuels
as shown below in Table 41
Table 41 Measured Ethanol Content of FACE Gasoline Blends
Ethanol Content (vol)
A B C H
10 15 30 10 15 30 10 15 30 10 15 30
D5599 101 147 299 100 147 302 102 146 295 102 146 303
DHA 100 146 301 100 148 301 103 148 299 102 147 304
22
412 RON MON and Octane Sensitivity
RON values were measured in CFR engines per ASTM method D2699 (4) Although the measurements
were conducted in four labs the lab‐to‐lab reproducibility was very good so only the average values are
reported here (but individual values are reported in Table A2) Average RON values for each fuel are
presented in Figure 41 For all four of these FACE Gasolines the RON values continue to increase even
at the 30 ethanol level although the rates of increase are lower than at lower ethanol levels FACE
Gasoline B has the highest RON at all ethanol levels with a value of about 106 at the 30 ethanol level
FACE Gasolines A and C have essentially the same RON values at all ethanol levels with RON values of
about 102 at the 30 ethanol level FACE Gasoline H without ethanol has a higher RON than A and C
but a lower RON at the 15 and 30 ethanol levels
Figure 41 RON Values of FACE Gasoline Blends with Ethanol
MON values were measured in CFR engines per ASTM method D2700 (5) Although the measurements were conducted in four labs the lab‐to‐lab reproducibility was very good so only the average values are reported here (but individual values are reported in Appendix A2) The MON values for each fuel are
presented in Figure 42 FACE Gasoline B has the highest MON values at all ethanol levels but unlike the other FACE Gasolines the MON value did not increase with ethanol contents above 10 vol The MON values for FACE Gasolines A and C were essentially the same and higher than those for FACE Gasoline H
80081082083084085086087088089090091092093094095096097098099010001010102010301040105010601070108010901100
0 5 10 15 20 25 30 35
RON
Ethanol (vol)
RON Values ‐ FACE Gasoline + Ethanol Blends
FACE A
FACE B
FACE H
FACE C
23
Figure 42 MON Values of FACE Gasoline Blends with Ethanol
Octane Sensitivity (S=RON‐MON) values are presented in Figure 43 As expected due to the relatively high sensitivity of ethanol the sensitivities of all four FACE Gasolines increase as the ethanol content increases FACE Gasoline H has the highest sensitivity at all ethanol levels except at 30 vol ethanol where the sensitivity of the FACE Gasoline B blend becomes slightly higher with values of 124 and 132 respectively The sensitivities for FACE Gasolines A and C are very similar to each other and although lower than the blends for the other FACE Gasolines have the highest rates of increase at the 30 level
Figure 43 Octane Sensitivities FACE Gasoline Blends with Ethanol
750
760
770
780
790
800
810
820
830
840
850
860
870
880
890
900
910
920
930
940
950
0 5 10 15 20 25 30 35
MON
Ethanol (vol)
MON Values ‐ FACE Gasoline + Ethanol Blends
FACE A
FACE B
FACE H
FACE C
00
10
20
30
40
50
60
70
80
90
100
110
120
130
140
0 5 10 15 20 25 30 35
S
Ethanol (vol)
Octane Sensitivity (S) ‐ FACE Gasoline + Ethanol Blends
FACE A
FACE B
FACE H
FACE C
24
413 Distillation Characteristics
The distillation properties of the fuels were determined by ASTM D86 (6) The values are plotted in
Figure 44 and tabulated in Table A2 in the Appendix The behavior and shapes of the curves are very
similar For a given gasoline all of the ethanol blends start at about the same IBP The blends
containing ethanol then follow the same curve which is lower than the base gasoline At a certain point
the ethanol blends then rise quickly to rejoin the distillation curve of the base gasoline The lower the
ethanol content of the blend the earlier (lower distilled volume ) the curve rejoins the base gasoline
curve
Figure 44 ASTM D86 Distillation Profiles for FACE Gasoline Blends with Ethanol
50
100
150
200
250
300
0 10 20 30 40 50 60 70 80 90 100
Temperature (˚ C)
Volume Distilled
D86 Distillation ‐ FACE A Gasoline + Ethanol Blends
0 EtOH
10 EtOH
15 EtOH
30 EtOH
50
100
150
200
250
300
0 10 20 30 40 50 60 70 80 90 100
Temperature (˚ C)
Volume Distilled
D86 Distillation ‐ FACE B Gasoline + Ethanol Blends
0 EtOH
10 EtOH
15 EtOH
30 EtOH
50
100
150
200
250
300
350
0 10 20 30 40 50 60 70 80 90 100
Temperature (˚ C)
Volume Distilled
D86 Distillation ‐ FACE C Gasoline + Ethanol Blends
0 EtOH
10 EtOH
15 EtOH
30 EtOH
50
100
150
200
250
300
350
400
450
0 10 20 30 40 50 60 70 80 90 100
Temperature (˚ C)
Volume Distilled
D86 Distillation ‐ FACE H Gasoline + Ethanol Blends
0 EtOH
10 EtOH
15 EtOH
30 EtOH
25
414 Reid Vapor Pressure (RVP)
The RVPs were determined using ASTM method D5191 (7) The values are plotted in Figure 45 For all
fuels the RVP appears to peak between 10 and 15 vol ethanol and then starts to decrease as the
ethanol content increases further
Figure 45 Reid Vapor Pressures for FACE Gasoline Blends with Ethanol
415 API Gravity and Density
The API gravities and densities of the fuels were measured by two labs using ASTM method D4052 (8) The values from the two labs were in excellent agreement and are listed in Table A2 The average density values are presented in Figure 46 For all of the FACE Gasolines the density increased as the ethanol content increased
Figure 46 Densities of FACE Gasoline Blends with Ethanol
7
75
8
85
9
95
10
0 5 10 15 20 25 30 35
RVP (psi)
Ethanol (vol)
Reid Vapor Pressure (RVP) ‐ FACE Gasoline + Ethanol Blends
FACE A
FACE B
FACE H
FACE C
0685 0697 0691
0759
0696 0705 0699
0761
0700 0710 0704
0763
0716 0724 0719
0768
0
01
02
03
04
05
06
07
08
09
1
A B C H
Density
(gm
l)
Ethanol (vol)
Density ‐ FACE Gasoline Blends with Ethanol
0
10
15
30
26
416 Net Heat of Combustion (NHC)
Net Heats of Combustion were measured by 2 labs using ASTM method D240 (9) For some fuels ASTM
method D4809 (10) was also used The values from both labs and both methods were very close to each
other and the average values are plotted in Figure 47 As expected since the net heat of combustion of
ethanol is lower than that of gasoline for all FACE Gasolines the net heat of combustion decreased as
ethanol content increased The decrease appeared to be linear with ethanol content The decrease
appeared to be steepest for FACE Gasoline B
Figure 47 Net Heat of Combustion of FACE Gasoline Blends with Ethanol
16000
16250
16500
16750
17000
17250
17500
17750
18000
18250
18500
18750
19000
19250
19500
0 5 10 15 20 25 30 35
Net Heat of C
ombustion (B
TUlb)
Ethanol (vol)
Net Heat of Combustion ‐ FACE Gasoline + Ethanol Blends
FACE A
FACE B
FACE H
FACE C
27
5 SUMMARY AND CONCLUSIONS
A subteam of the CRC AVFL FACE Working Group has designed a matrix of reference gasolines
known as the FACE Gasolines A commercial vendor has produced and made the fuels available
for purchase in research quantities It is expected that this will enable consistent comparisons
of engine and combustion results from different laboratories and test platforms based on the
use of the same set of fuels
The matrix is designed around four parameters expected to be of importance for advanced
gasoline engines RON octane sensitivity aromatics content and n‐paraffins content
Statistical methods were used to identify potential candidate formulations and down‐select to a
tractable number of 10 formulations
Detailed analyses were performed on the physical and chemical properties of the final fuel
formulations
Generally the property values measured in the current study agreed very well with the values
reported on the fuel blender (ChevronPhillips Chemical Company ‐ CPChem) Certificates of
Analyses (COAs)
As expected conflicts in the target properties for some of the fuels (such as high aromatics level
coupled with low octane sensitivity) led to some trade‐offs that resulted in some deviation in
the actual properties from the design properties
The RON values come close to meeting the targets for most of the fuels Fuels E H and J have
values that are 24‐38 units higher than the targets
Three of the four ldquohighrdquo sensitivity fuels have measured values of 59‐71 that are lower than
the target value of 10 Two of the ldquolowrdquo sensitivity fuels have measured values (34‐37) that are
a bit higher than the target value of le2 One of the low sensitivity design fuels (ldquoDrdquo) has a value
of 72 that actually effectively makes it a high sensitivity fuel
Detailed hydrocarbon analyses (DHA) indicate that the n‐paraffins contents range from 225‐
316 vol for the four FACE Gasolines that had targets of 25 vol and from 44‐117 vol for
the six FACE Gasolines that had targets of 5 vol
DHAs indicate that the aromatics contents range from 317‐358 vol for the four FACE
Gasolines that had a target of 35 vol and 0‐109 vol for the other fuels that had a target of 5
vol
The high sensitivity fuels contained the high sensitivity components of naphthenes (105‐208
vol) and olefins (68‐127 vol) The exception was Gasoline ldquoDrdquo which had neither of these
components but whose high sensitivity was derived from aromatics components
Five of the FACE Gasolines (ldquoArdquo ldquoBrdquo ldquoCrdquo ldquoFrdquo and ldquoIrdquo) are very rich in isoparaffins with contents ge
676 vol
Aromatics values determined by SFC were generally higher than the values obtained from DHA
The DHA olefins values were close to the FIA values reported on the CPChem COAs
The fuels having the highest aromatics content also have the highest densities and highest net
heats of combustion on an energy content per volume basis
With regards to distillation properties for all fuels the initial boiling points (IBPs) are in a
narrow range of 90‐110˚F although the end boiling points (EBPs) range from 253‐410˚F Three
28
of the high sensitivity fuels have the highest EBPs The two low‐mid RON fuels having low n‐
paraffins and low aromatics have the lowest EBPs
All of the FACE Gasolines have ultra‐low levels of sulfur with the highest value at 22 ppm S and
most fuels having le 6 ppm S
For the four FACE Gasolines blended with ethanol RON continues to increase as the ethanol
levels increase to 30 vol although the rate of increase is lower as the ethanol content
increases FACE Gasoline B which has the highest RON of 96 has the highest RON at all ethanol
levels with a value of about 106 at 30 ethanol At the same ethanol level FACE Gasolines A
and C have essentially the same RON values FACE Gasoline H starts with a higher RON value
than those of A or C but has a lower value at blend levels of 15 and 30 vol
MON increased as the ethanol level increased for FACE Gasolines A C and H The MON values
for these fuels were essentially constant even though the highest MON values were found for
the ethanol blends with FACE Gasoline B
For all blends octane sensitivity increased as ethanol content increased with the highest values
of 12‐13 for 30 vol ethanol blends with FACE Gasolines B and H
The D86 distillation curve trends are similar for the four FACE Gasolines For a given gasoline all
blends start at the same point At around 10 vol distilled the curves for the blends with
ethanol diverge from and are lower than the curves for the base gasolines At a certain point
the distillation curves for the blends rise quickly and re‐join the curve for the parent base fuel
The distillation curves for the 30 vol ethanol blends are generally flat as a function of
increasing vol distilled and only start to increase again at about 70‐80 vol distilled when
most of the ethanol has been distilled from the liquid
The Reid Vapor Pressures (RVPs) peak at about 10‐15 vol
Densities increase slightly as ethanol increases while net heats of combustion decrease
29
6 REFERENCES
1 Alnajjar M Cannella B Dettman H Fairbridge C Franz J Gallant T Gieleciak R Hager D Lay C Lewis S Ratcliff M Sluder S Storey J Yin H Zigler B ldquoChemical and Physical Properties of the Fuels for Advanced Combustion Engines (FACE) Research Diesel Fuelsrdquo CRC Report No FACE‐1 (2010)
2 Gallant T Franz J Alnajjar M Storey J Lewis S Sluder S Cannella W Fairbridge C Hager D Dettman H Luecke J Ratcliff M Zigler ldquoFuels for Advanced Combustion Engines Research Diesel Fuels Analysis of Physical and Chemical Propertiesrdquo SAE Paper 2009‐01‐2769 (2009)
3 CannellaW Fairbridge C Arboleda P Bays T Dettman H Foster M Gieleciak R Gunter G Hager D Lay C Lewis S Luecke J Sluder S Zigler B ldquoDetailed Characterization of the Physical and Chemical Properties of the Reformulated FACE Diesel Fuels FD2B FD4B and FD7Brdquo CRC Report AVFL‐19‐1 (2013)
4 ASTM International Standard Test Method for Research Octane Number of Spark‐Ignition Engine Fuel ASTM D2699 (ASTM International Pennsylvania 2009)
5 ASTM International Standard Test Method for Motor Octane Number of Spark‐Ignition Engine Fuel ASTM D2700 (ASTM International Pennsylvania 2009)
6 ASTM International Standard Test Method for Distillation of Petroleum Products at Atmospheric Pressure ASTM D86‐09e1 (ASTM International Pennsylvania 2009)
7 ASTM International Standard Test Method for Vapor Pressure of Petroleum Products (Mini‐Method) ASTM D5191 (ASTM International Pennsylvania 2009)
8 ASTM International Standard Test Method for Density and Relative Density of Liquids by Digital Density Meter ASTM D4052‐96(2002)e1 (ASTM International Pennsylvania 2002)
9 ASTM International Standard Test Method for Heat of Combustion of Liquid Hydrocarbon Fuels by Bomb Calorimeter ASTM D240‐02(2007) (ASTM International Pennsylvania 2007)
10 ASTM International Standard Test Method for Heat of Combustion of Liquid Hydrocarbon Fuels by Bomb Calorimeter ASTM D4809 (2007) (ASTM International Pennsylvania 2007)
11 ASTM International Standard Test Method for Determination of Aromatic Content and Polynuclear Aromatic Content of Diesel Fuels and Aviation Turbine Fuels by Supercritical Fluid Chromatography ASTM D5186‐03(2009) (ASTM International Pennsylvania 2009)
12 ASTM International Standard Test Method for Hydrocarbon Types in Liquid Petroleum Products by Fluorescent Indicator Adsorption ASTM D1319‐08 (ASTM International Pennsylvania 2008)
13 ASTM International Standard Test Methods for Instrumental Determination of Carbon Hydrogen and Nitrogen in Petroleum Products and Lubricants ASTM D5291‐02(2007) (ASTM International Pennsylvania 2007)
14 ASTM International Standard Test Methods for Determination of Total Sulfur in Light Hydrocarbons Spark‐Ignition Engine Fuel Diesel Engine Fuel and Engine Oil by Ultraviolet Fluorescence ASTM D5453(2007) (ASTM International Pennsylvania 2007)
15 ASTM International Standard Test Methods for Determination of Oxygenates in Gasoline by Gas Chromatography and Oxygen Selective Flame Ionization Detection ASTM D5599 (2007) (ASTM International Pennsylvania 2007)
30
31
Appendix A
Properties of FACE Gasolines
32
Table A1 Summary Data for FACE Gasolines
Specific Tests FACE Gasoline A B C D E F G H I J Research Octane Number (RON) (ASTM D2699) -Lab 1 843 958 850 946 871 940 969 870 700 738 -Lab 2 839 960 840 939 877 960 869 -Lab 3 835 957 840 -Average 839 958 843 942 874 940 965 869 7015 738 -CPChem COA 835 960 847 932 875 944 968 869 703 718 Motor Octane Number (MON) (ASTM D2700) -Lab 1 836 923 830 872 813 881 857 797 695 701 -Lab 2 833 931 830 868 808 860 799 -Lab 3 835 919 829 -Average 835 924 830 870 811 881 858 798 695 701 -CPChem COA 836 926 836 878 815 888 858 793 696 688 Sensitivity (RON-MON) -Lab 1 07 35 20 74 58 59 112 73 05 37 -Lab 2 06 29 10 71 69 100 70 -Lab 3 0 38 11 -Average 04 34 13 72 63 59 107 72 05 37 -CPChem COA -01 34 11 54 60 56 110 76 07 30 API Gravity (API˚) (ASTM D4052) -CPChem COA 750 714 734 587 636 686 545 568 744 595 -Lab 1 749 713 732 587 636 686 546 548 744 587 -Average 7495 7135 733 587 636 686 5455 558 744 591 Density (ASTM D4052) -CPChem COA 0691 0743 0725 0707 0760 0697 0741 -Lab 1 0685 0697 0691 0743 0725 0707 0760 0759 0697 0743 -Average 0685 0697 0691 0743 0725 0707 0760 0759 0697 0742 RVP (psi) (D5191) -CPChem COA 81 74 74 68 67 78 72 75 75 75 -Lab 1 80 73 75 73 76 77 Net Heat of Combustion (BTUlb) (ASTM D4809) 19186 18680 Net Heat of Combustion (BTUlb) (ASTM D240) 19251 19187 19257 18649 18884 19072 18602 18625 19225 18731
33
TableA1 Summary Data for FACE Gasolines
Specific Tests FACE Gasoline A B C D E F G H I J Distillation (˚F) (ASTM D86) -CPChem IBP 93 95 95 88 110 108 93 94 100 101
5 104 128 120 129 131 129 122 123 123 111 10 132 145 136 148 142 142 135 140 156 162 20 160 172 154 176 155 156 158 168 177 206 30 183 194 171 198 166 168 183 192 186 217 40 197 207 187 212 177 180 210 211 191 224 50 203 213 200 221 186 193 240 227 195 231 60 207 216 210 229 197 206 270 242 199 242 70 210 220 218 235 208 217 306 262 203 261 80 213 225 226 280 222 225 328 291 207 291 90 219 235 243 330 267 240 343 327 213 316 95 227 248 270 340 343 261 363 358 220 330 FBP 269 283 328 363 405 294 403 410 259 358
-Lab 1 IBP 90 97 93 97 107 102 99 98 99 95 5 122 133 126 133 134 134 122 127 139 111
10 140 149 139 151 143 144 136 143 160 166 20 165 175 157 179 156 157 158 170 178 209 30 186 196 174 200 168 169 182 194 187 219 40 198 209 188 214 177 182 209 213 192 225 50 204 214 201 224 188 195 238 229 196 232 60 207 218 210 234 197 207 268 243 200 242 70 210 221 218 248 208 218 304 263 204 263 80 213 226 227 288 224 228 328 291 208 292
90 219 236 245 331 258 243 343 329 213 316 95 228 248 274 341 329 261 358 357 220 330 FBP 262 280 330 365 402 291 405 408 247 357
-Average IBP 915 96 94 925 1085 105 96 96 995 98 5 113 1305 123 131 1325 1315 122 125 131 111
10 136 147 1375 1495 1425 143 1355 1415 158 164 20 1625 1735 1555 1775 1555 1565 158 169 1775 203 30 1845 195 1725 199 167 1685 1825 193 1865 218 40 1975 208 1875 213 177 181 2095 212 1915 2245 50 2035 2135 2005 2225 187 194 239 228 1955 2315 60 207 217 210 2315 197 2065 269 2425 1995 242 70 210 2205 218 2415 208 2175 305 2625 2035 262 80 213 2255 2265 284 223 2265 328 291 2075 2915
90 219 2355 244 3305 2625 2415 343 328 213 316 95 2275 248 272 3405 336 261 3605 3575 220 330 FBP 2655 2815 329 364 4035 2925 404 409 253 3575
34
Table A1 Summary Data for FACE Gasolines
Specific Tests FACE Gasoline A B C D E F G H I J Elemental Analysis (ASTM D 5291) -Carbon (wt) -Lab 1 8398 8441 8497 8647 8547 8671 8792 8415 -Lab 4 8400 8444 8419 8645 8547 8496 8669 8703 8414 8624 -Average 8399 8443 8458 8646 8547 8496 8670 8748 8414 8624 -Hydrogen (wt) -Lab 1 1602 1559 1503 1353 1453 1329 1208 1585 -Lab 4 1600 1556 1585 1355 1453 1504 1331 1297 1586 1376 -Average 1601 1557 1547 1354 1453 1504 1330 1252 1586 1376 Sulfur by UV Fluorescence (ppmw) (ASTM D5453) -CPChem COA 4 4 3 2 21 2 20 15 2 2 -Lab 4 6 4 4 2 21 2 22 15 2 2 Hydrocarbons by FIA (vol) (ASTM D1319) -Aromatics (vol) CPChem COA 0 42 21 295 121 58 335 353 09 278 -Olefins (vol) CPChem COA 04 07 04 04 99 86 78 79 62 10 -Saturates (vol) CPChem COA 996 951 975 701 780 856 587 568 929 712 Aromatics by SFC (ASTM D5186) (Lab 1) -MonoAromatics (wt) -Lab 1 07 78 60 414 142 100 393 412 04 387 -Lab 2 80 421 138 395 428 -Average 07 79 60 4175 140 100 394 420 04 387 -PolyAromatics (wt) -Lab 1 0 0 0 03 11 0 10 10 0 03 -Lab 2 0 0 09 12 15 -Average 0 0 0 015 10 0 11 125 0 03 -NonAromatics (wt) -Lab 1 993 922 940 583 847 900 597 578 996 610 -Lab 2 920 579 850 593 557 -Average 993 921 940 581 8475 900 595 5675 996 610
35
Table A1 Summary Data for FACE Gasolines
Specific Tests FACE Gasolines A B C D E F G H I J Detailed Hydrocarbon Analyses by GC-FID -n-paraffins (vol) (Targets) (5) (5) (25) (25) (5) (5) (5) (25) (5) (25) -Lab 1 1144 783 2409 2346 771 434 662 2214 1441 3115 -Lab 2 1187 815 2476 2473 803 446 685 2283 1437 3212 -Average 1165 799 2443 2410 787 440 673 2249 1439 3164 -iso-paraffins (vol) -Lab 1 8562 8591 688 4206 4563 6765 3821 2322 7449 3362 -Lab 2 8635 8586 7066 4221 4621 6747 3864 2240 7459 3366 -Average 8599 8688 6973 4213 4592 6756 3843 2281 7454 3364 -cyclo-paraffins (vol) -Lab 1 192 021 048 010 2216 1078 1163 1035 324 234 -Lab 2 130 007 023 010 1945 1118 1140 1066 336 224 -Average 161 014 036 010 2081 1098 1152 1050 330 229 -aromatics (vol) (Targets) (5) (5) (5) (35) (5) (5) (35) (35) (5) (35) -Lab 1 073 601 409 3425 1121 805 3419 3597 120 3212 -Lab 2 003 568 374 3258 1062 739 3306 3555 110 3125 -Average 38 584 392 3341 1092 772 3363 3576 115 3169 -olefins (vol) -Lab 1 024 001 248 004 1146 978 851 714 643 066 -Lab 2 018 003 006 005 1392 905 771 650 627 054 -Average 021 002 127 04 1269 942 811 682 635 060
36
37
Appendix B
Properties of FACE Gasoline Blends with Ethanol
38
Table B1 Summary Data for FACE Gasoline Blends with Ethanol
Specific Tests FACE Gasoline Blend A B Ethanol Content (Vol ) 0 10 15 30 0 10 15 30 Ethanol Content (Vol ) (ASTM D5599) 0 1012 1469 2990 0 995 1473 3016 Research Octane Number (RON) (ASTM D2699) -Lab 1 843 922 951 1032 958 1015 1039 1067 -Lab 2 839 923 951 1017 960 1008 1023 1050 -Lab 3 835 917 946 1025 957 1012 1031 1069 -Lab 4 916 945 1018 1009 1026 1053 -Average 839 920 948 1023 958 1011 1030 1060 Motor Octane Number (MON) (ASTM D2700) -Lab 1 836 878 890 912 923 936 936 934 -Lab 2 833 874 891 917 931 935 934 931 -Lab 3 835 881 893 911 919 933 934 933 -Lab 4 884 901 916 935 936 933 -Average 835 879 894 914 924 935 935 933 Sensitivity (RON-MON) -Lab 1 07 44 61 120 35 79 103 133 -Lab 2 06 49 60 100 29 73 89 119 -Lab 3 0 36 53 114 38 79 97 136 -Lab 4 32 44 102 74 91 120 -Average 04 41 54 109 34 76 95 127 API Gravity (API˚) (ASTM D4052) -Lab 1 749 7164 7066 661 7131 690 6772 6375 -Lab 4 716 706 660 690 676 638 -Average 749 7162 7063 6605 7131 690 6766 6377 Density (ASTM D4052) -Lab 1 06849 06959 06992 07154 0697 07050 07096 07240 -Lab 4 06966 06999 07161 07055 07106 07244 -Average 06849 06963 06996 07158 0697 07053 07101 07242 RVP (psi) (D5191) Lab 1 83 95 94 91 73 87 86 83 Net Heat of Combustion (BTUlb) (ASTM D4809) 18308 Net Heat of Combustion (BTUlb) (ASTM D240) -Lab 1 19266 18294 18080 16751 19207 18319 17941 16631 -Lab 4 19236 18208 17963 16487 19168 18307 17696 16234 -Average 19251 18251 18021 16619 19187 18313 17818 16432
39
Table B1 Summary Data for FACE Gasoline Blends with Ethanol
Specific Tests FACE Gasoline Blend C H Target Ethanol Content (Vol ) 0 10 15 30 0 10 15 30 Ethanol Content (Vol) (ASTM D5599) 0 1018 1462 2949 0 1016 1459 3034 Research Octane Number (RON) (ASTM D2699) -Lab 1 850 918 951 1012 870 919 941 993 -Lab 2 840 920 950 1014 869 927 941 996 -Lab 3 840 917 946 1019 869 920 937 995 -Lab 4 914 945 1015 916 946 991 -Average 843 917 948 1015 869 921 941 994 Motor Octane Number (MON) (ASTM D2700) -Lab 1 830 876 893 921 797 821 835 861 -Lab 2 830 868 880 924 793 820 831 885 -Lab 3 829 876 887 909 799 817 829 858 -Lab 4 881 890 914 828 839 877 -Average 830 875 888 916 796 822 833 870 Sensitivity (RON-MON) -Lab 1 20 42 58 91 73 98 106 132 -Lab 2 10 52 70 90 76 107 110 111 -Lab 3 11 41 59 110 70 103 108 137 -Lab 4 33 55 101 88 107 114 -(RON)avg ndash (MON)avg 13 42 60 99 73 99 108 124 API Gravity (API˚) (ASTM D4052) -Lab 1 732 7069 6943 6523 5481 5416 5375 5247 -Lab 4 707 693 652 544 538 527 -Average 732 707 694 652 548 543 5377 526 Density (ASTM D4052) -Lab 1 06906 06991 07035 07186 07587 07614 07631 07684 -Lab 4 06997 07043 07192 07610 07636 07678 -Average 06994 07039 07189 07587 07612 07633 07681 RVP (psi) (D5191) Lab 1 75 86 85 83 76 88 87 84 Net Heat of Combustion (BTUlb) (ASTM D4809) 19186 18198 17955 16692 16265 Net Heat of Combustion (BTUlb) (ASTM D240) -Lab 1 19257 18375 18012 16739 18675 17891 17550 16369 -Lab 4 18576 17809 17408 16322 -Average 19257 18375 18012 16739 18625 17850 17479 16345
40
Table B1 Summary Data for FACE Gasoline Blends with Ethanol
Specific Tests FACE Gasoline Blend A B Target Ethanol Content 0 10 15 30 0 10 15 30 Ethanol Content (Vol) -ASTM D5599 0 1012 1469 2990 0 995 1473 3016 -Detailed Hydrocarbon Analysis - GCFID -Lab 1 0 1000 1463 3017 0 1001 1476 3014 Elemental Analysis (ASTM D 5291) -Carbon (wt) -Lab 1 8443 8178 7941 7306 8465 8172 8029 7346 -Lab 4 8433 8085 7823 7361 8471 8110 7921 7380 -Average 8438 8131 7882 7333 8468 8141 7975 7363 -Hydrogen (wt) -Lab 1 1543 1527 1484 1446 1473 1462 1442 1387 -Lab 4 1606 1573 1548 1515 1561 1540 1525 1487 -Average 1575 1550 1516 1481 1517 1501 1483 1437 -Oxygen (wt) (ASTM D5599) Lab 4 0 400 578 1150 0 389 571 1147
Specific Tests FACE Gasoline Blend C H Target Ethanol Content 0 10 15 30 0 10 15 30 Ethanol Content (Vol) -ASTM D5599 0 1018 1462 2949 0 1016 1459 3034 -Detailed Hydrocarbon Analysis - GCFID -Lab 1 0 1027 1483 2988 0 1021 1468 3040 Elemental Analysis (ASTM D 5291) -Carbon (wt) -Lab 1 8447 8200 7998 7336 8768 8402 8401 7624 -Lab 4 8419 8077 7909 7353 8720 8316 8150 7626 -Average 8433 8138 7954 7345 8744 8359 8276 7625 -Hydrogen (wt) -Lab 1 1494 1465 1465 1405 1205 1199 1207 1218 -Lab 4 1585 1668 1523 1509 1300 1305 1292 1316 -Average 1540 1567 1494 1457 1253 1252 1250 1267 -Oxygen (wt) (ASTM D5599) Lab 4 0 401 572 1129 0 368 527 1088
Table B1 Summary Data for FACE Gasoline Blends with Ethanol
41
Specific Tests FACE Gasoline Blend A B Target Ethanol Content 0 10 15 30 0 10 15 30 Distillation (˚F) (ASTM D86) Lab 1 IBP 90 106 99 99 97 105 103 101 5 122 127 122 126 133 128 126 129 10 140 134 131 135 149 135 134 138 20 165 145 144 146 175 147 146 149 30 186 153 152 153 196 155 154 155 40 198 159 156 156 209 165 159 159 50 204 202 159 158 214 211 165 161 60 207 208 204 159 218 217 214 162 70 210 211 210 160 221 219 219 163 80 213 214 213 161 226 225 224 165 90 219 222 219 211 236 234 234 230 95 228 233 229 224 248 247 246 242 FBP 262 261 263 260 280 271 270 266
Specific Tests FACE Gasoline Blend C H Target Ethanol Content 0 10 15 30 0 10 15 30 Distillation (˚F) (ASTM D86) Lab 1 IBP 93 104 102 107 98 96 105 106 5 126 126 123 130 127 123 125 127 10 139 131 131 136 143 132 134 138 20 157 140 140 145 170 145 147 152 30 174 147 147 151 194 153 156 159 40 188 153 153 156 213 167 161 163 50 201 183 157 159 229 217 182 166 60 210 208 176 161 243 236 235 169 70 218 217 215 162 263 255 253 175 80 227 226 223 165 291 283 282 268 90 245 244 241 233 329 322 323 312 95 274 274 269 261 357 351 351 343 FBP 330 331 322 324 408 401 407 396
42

42