Exposure to Carbon leakage for the Lime Industry · Exposure to Carbon leakage for the Lime...
17
ECCP WG on ETS Ad Hoc meeting 1 11 April 2008 Exposure to Carbon leakage for the Lime Industry Dr M. Wyart-Remy EuLA / IMA-Europe Secretary-General
Transcript of Exposure to Carbon leakage for the Lime Industry · Exposure to Carbon leakage for the Lime...

ECCP WG on ETS Ad Hoc meeting111 April 2008
Exposure to Carbon leakage
for the Lime IndustryDr M. Wyart-Remy
EuLA / IMA-Europe Secretary-General
ESMA
EUROSIL
EUBA
IDPA
KPC-Europe
EBA
EUROFEL
CCA-Europe
EUROTALC
EUROGYPSUM
EULA
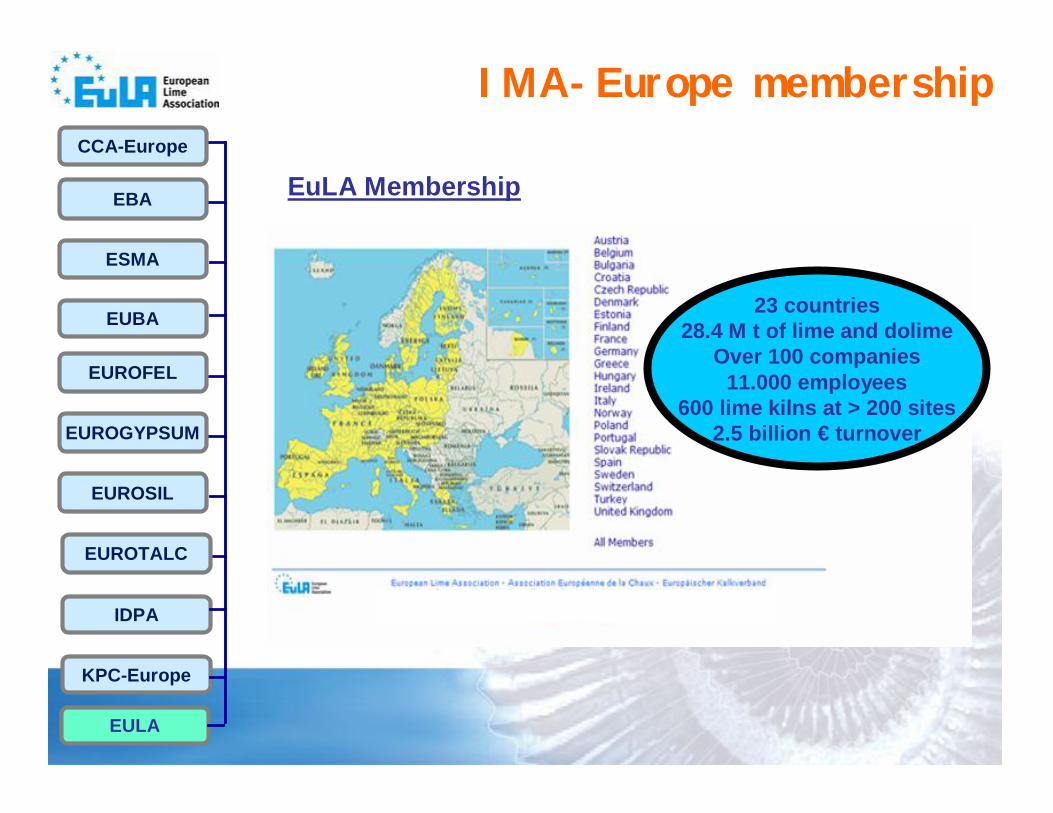
IMA-Europe membership
EuLA Membership
23 countries28.4 M t of lime and dolime
Over 100 companies11.000 employees
600 lime kilns at > 200 sites2.5 billion € turnover
ECCP WG on ETS Ad Hoc meeting311 April 2008
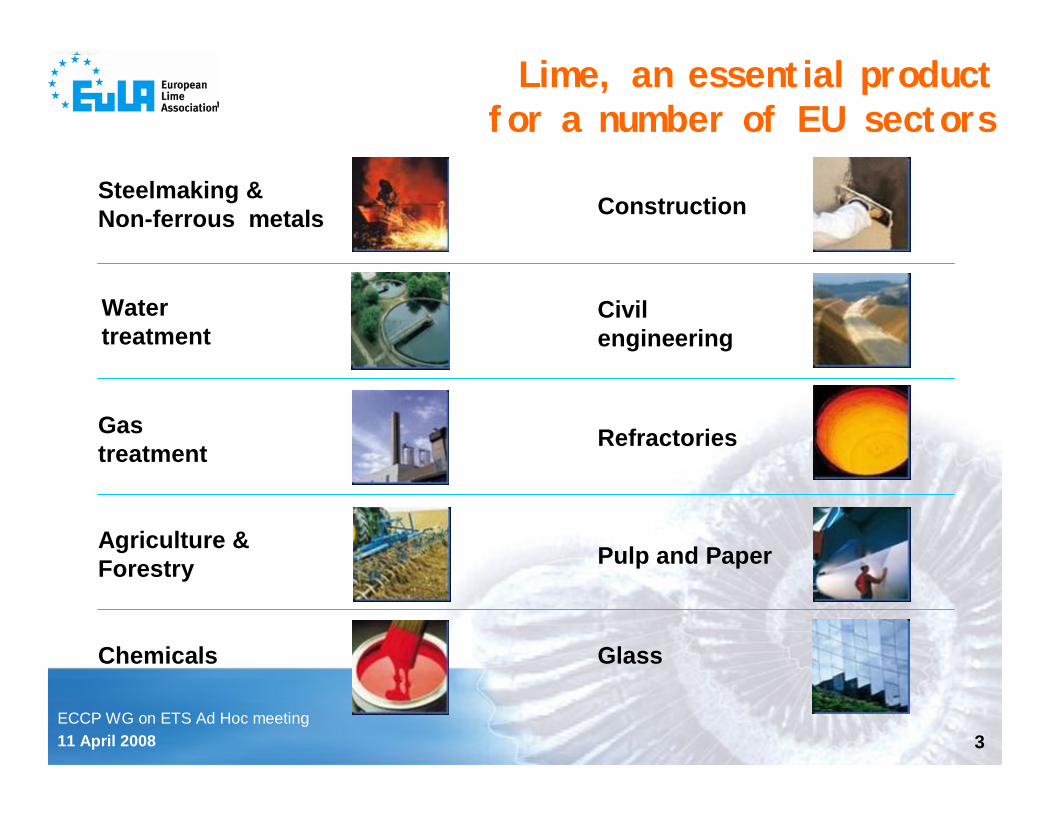
Steelmaking & Non-ferrous metals
Water treatment
Gas treatment
Chemicals
Agriculture & Forestry
Construction
Civil engineering
Refractories
Pulp and Paper
Glass
Lime, an essential productfor a number of EU sectors

ECCP WG on ETS Ad Hoc meeting411 April 2008
The Lime production process
CaCO3 + energy CaO + CO2Calcium Lime
carbonate
100 g 56 g 44 gProcess CO2
Combustion CO2
• The production of 1 tonne of lime generates 1 to 1.6 tonne of CO2
• 2/3 of CO2 emissions come from the decarbonation of limestone: i.e. “process CO2”• 1/3 of CO2 emissions comes from the fuel combustion: i.e. “combustion CO2”

ECCP WG on ETS Ad Hoc meeting511 April 2008
The most exposed industry
Hourcade et al. (2008) Differentiation and Dynamics of EU ETS Competitiveness Impacts

ECCP WG on ETS Ad Hoc meeting611 April 2008
0%
20%
40%
60%
80%
100%
120%
140%
Lime Cement Basic Ironand Steel
Refinedpetroleum
Fertilisersand
Nitrogen
Aluminium Otherinorganic
basicchemicals
Pulp andPaper
Pote
nita
l max
imim
um v
alue
at s
take
The most exposed industry
Source: Hourcade et al. (2008) Differentiation and Dynamics of EU ETS Competitiveness Impacts

ECCP WG on ETS Ad Hoc meeting711 April 2008
Capital
0%
20%
40%
60%
80%
100%
120%
140%
160%Pr
opor
tion
of P
rodu
ctio
n C
ost E
xclu
ding
CO
2
Sources: NERA analysis of data provided byEuLA member companies
Note: Assumes a CO2 price of €30/tCO2
CO2 (€30/tCO2)
Other
Raw materials
Fuel
Average cost of EU lime production
CO2 value & Lime costs structure

ECCP WG on ETS Ad Hoc meeting811 April 2008
CO2 costs of Lime production are currently not passed through to prices
• Lime prices have risen with higher fuel costs
• However, prices did not rise with CO2 costs in 2005-6
• Fuel costs are global, CO2costs are EU-specific
• Fuel costs are direct costs; with free allocation CO2 costs are opportunity costs
Sources: NERA calculations based on data from PointCarbon, EuLA member companies, Eurostat, Platts, McCloskey
Notes: Calculations do not account for all factors that couldaffect prices, but are based on 2006 production costdata and historic fuel and CO2 prices.
EU lime production cost and prices (2003-2006)
60%
80%
100%
120%
140%
160%
2003 2004 2005 2006
Prop
ortio
n of
200
6 Pr
oduc
tion
Cos
t Exc
ludi
ng C
O2
EU average cost incl. CO2EU average cost excl. CO2EU-wide average lime price

ECCP WG on ETS Ad Hoc meeting911 April 2008
0%
50%
100%
150%
200%
Quartile 1 Quartile 2 Quartile 3 Quartile 4 N. Africa FSU China
Prop
ortio
n of
Ave
rage
EU
Pr
oduc
tion
Cos
t Exc
ludi
ng C
O2
EU production cost CO2 cost Non-EU production cost Transport cost
EU Supply Non-EU Supply
CO2 Costs comparedto Transport Costs
• A CO2 price of €30/tCO2 could make economic supply of lime from several non-EU regions.
Sources: NERA calculations based on data from EuLA member companies and literature survey of shipping costs.Notes: Assumes CO2 price of €30/tCO2. The first four bars show the average cost for quartiles of EU volumes
produced. Non-EU production cost are assumed to be €45/t lime, a central estimate based on limited data provided by EuLA member companies. Transport costs are estimates to EU border and not varied by EU region.

Sea transport costs

Sea transport costs

Sea transport costs

Road transport costs

Rail transport costs

ECCP WG on ETS Ad Hoc meeting1511 April 2008
Total CO2 costs = abatement cost + purchase of allowances
Total allowances required according toEuLA's Global Allocation BM
Allocation of allowances to the lime sector according to the provisions under Art 10 a of EU ETS proposal
15,000,000
20,000,000
25,000,000
30,000,000
2013 2014 2015 2016 2017 2018 2019 2020
Year
CO
2al
low
ance
s (to
nnes
)
Total allowances required whenconsidering a BM based on the 10%best kilnsEstimated total allowances availableaccording to EU ETS provisions (sector correction)
Amount of technically feasible CO emissions reductions
2
2Additional CO allowances shortage required by the provisions set underArt 10 a
Breakthrough TechnologiesPROGRESS

ECCP WG on ETS Ad Hoc meeting1611 April 2008
In Summary
• Based on collection of data’s by an independent party:
Cost structure in EU
Market value in Europe
CO2 cost
Transportation cost
Cost of production in countries without comparable carbon constraints
Carbon leakage is related to the gap between Production Costs in the EU including CO2 costs and Production Costs of products imported from outside the EU incl. transport costs

ECCP WG on ETS Ad Hoc meeting1711 April 2008
Thank you for your attentionFor more information
Please contactEuLA c/o IMA-Europe
26 Rue des Deux Eglises, 1000 BrusselsTel: +32 2 210 44 10 – Fax: +32 2 210 44 29
E-mail : [email protected]