Quartile Deviationsand Standard Deviation
19
Quartiles Quartiles are the values that divide a list of numbers into quarters. • First put the list of numbers in order • Then cut the list into four equal pa rts • The Quartiles are at the "cuts" Like this: Example: 5, 8, 4, 4, 6, 3, 8 Put them in order: 3, 4, 4, , !, , #ut the list into quarters: $nd the result is: • Quartile % &Q%' ( 4 • Quartile ) &Q)', *hich is also the +edian, ( 5 • Quartile 3 &Q3' ( 8 ometimes a "cut" is bet*een t*o numbers ... the Quartile is the avera-e of the t*o numbers. Example: 1, 3, 3, 4, 5, 6, 6, 7, 8, 8 The numbers are alread in order #ut the list into quarters:
-
Upload
anonymous-z3iht9dj1v -
Category
Documents
-
view
227 -
download
0
Transcript of Quartile Deviationsand Standard Deviation
8/17/2019 Quartile Deviationsand Standard Deviation
http://slidepdf.com/reader/full/quartile-deviationsand-standard-deviation 1/19
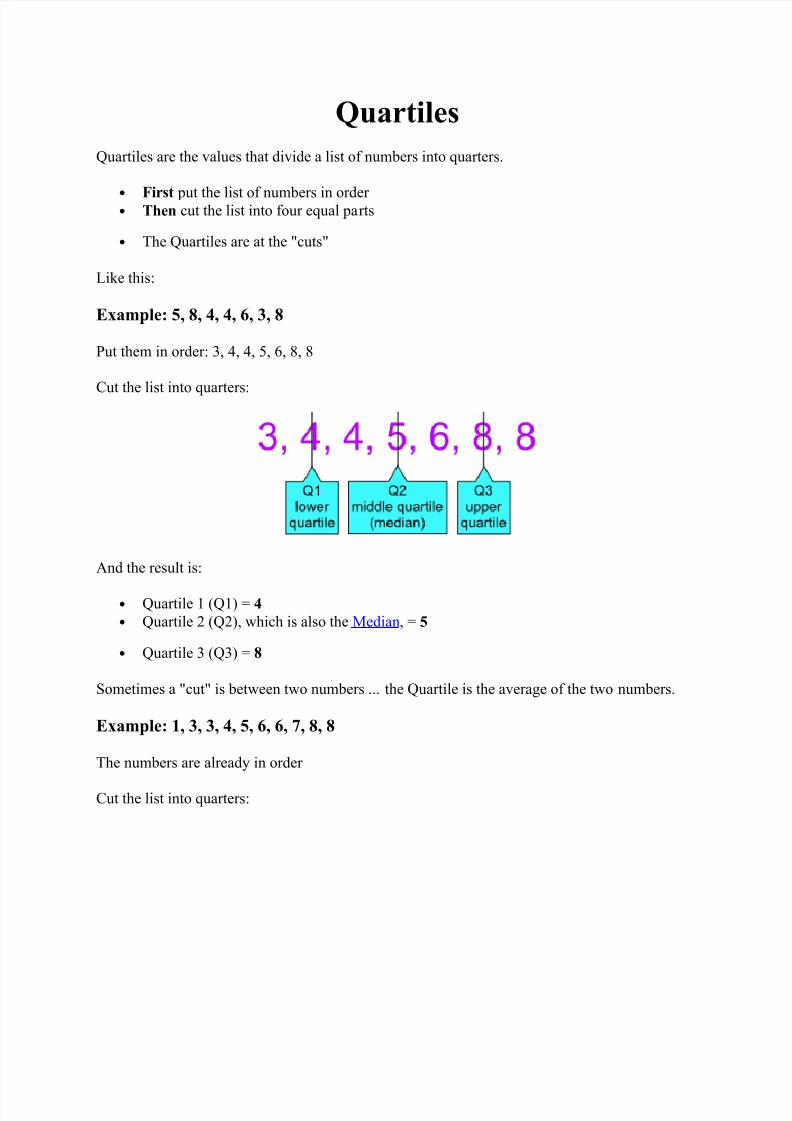
Quartiles
Quartiles are the values that divide a list of numbers into quarters.
•
First put the list of numbers in order • Then cut the list into four equal parts
• The Quartiles are at the "cuts"
Like this:
Example: 5, 8, 4, 4, 6, 3, 8
Put them in order: 3, 4, 4, , !, ,
#ut the list into quarters:
$nd the result is:
• Quartile % &Q%' ( 4
• Quartile ) &Q)', *hich is also the +edian, ( 5
• Quartile 3 &Q3' ( 8
ometimes a "cut" is bet*een t*o numbers ... the Quartile is the avera-e of the t*o numbers.
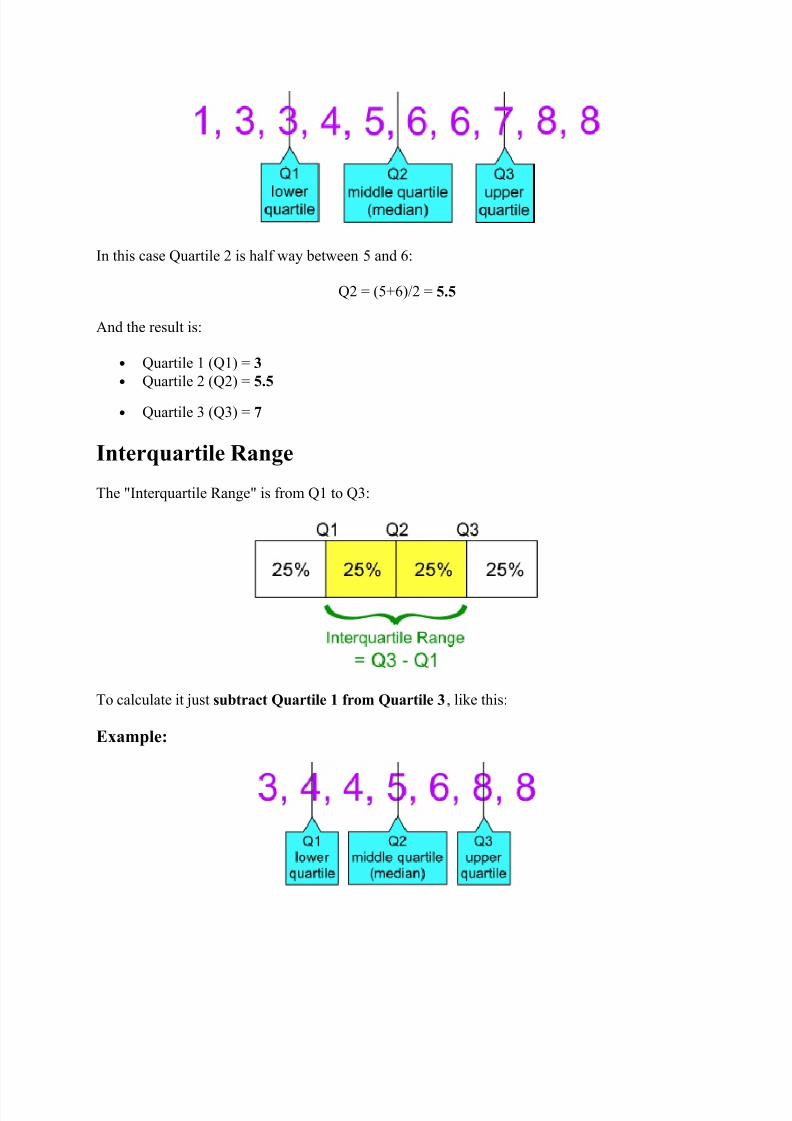
Example: 1, 3, 3, 4, 5, 6, 6, 7, 8, 8
The numbers are alread in order
#ut the list into quarters:
8/17/2019 Quartile Deviationsand Standard Deviation
http://slidepdf.com/reader/full/quartile-deviationsand-standard-deviation 2/19
/n this case Quartile ) is half *a bet*een and !:
Q) ( &0!'1) ( 5.5
$nd the result is:
• Quartile % &Q%' ( 3
• Quartile ) &Q)' ( 5.5
• Quartile 3 &Q3' ( 7
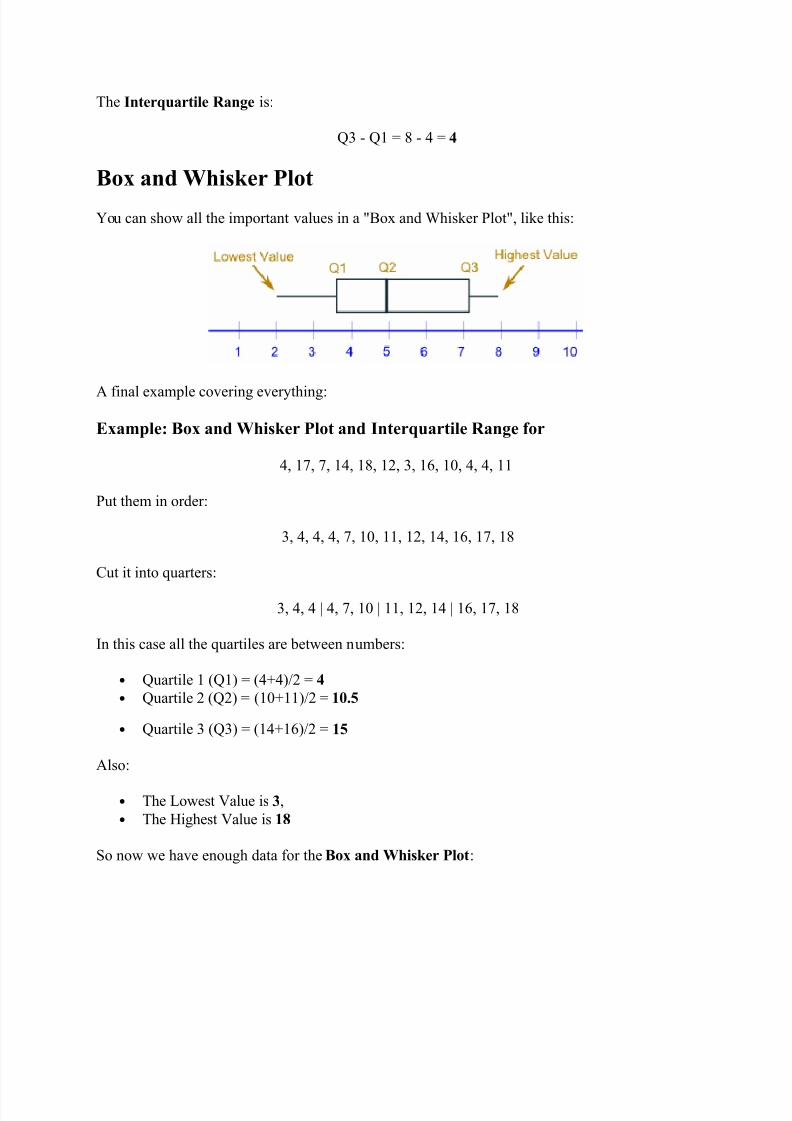
Interquartile Rane
The "/nterquartile 2an-e" is from Q% to Q3:
To calculate it ust su!tra"t Quartile 1 #r$m Quartile 3, like this:
Example:
8/17/2019 Quartile Deviationsand Standard Deviation
http://slidepdf.com/reader/full/quartile-deviationsand-standard-deviation 3/19
The Interquartile Rane is:
Q3 Q% ( 4 ( 4
%$x an& 'his(er )l$t
5ou can sho* all the important values in a "6o7 and 8hisker Plot", like this:
$ final e7ample coverin- everthin-:
Example: %$x an& 'his(er )l$t an& Interquartile Rane #$r
4, %9, 9, %4, %, %), 3, %!, %, 4, 4, %%
Put them in order:
3, 4, 4, 4, 9, %, %%, %), %4, %!, %9, %
#ut it into quarters:
3, 4, 4 ; 4, 9, % ; %%, %), %4 ; %!, %9, %
/n this case all the quartiles are bet*een numbers:
• Quartile % &Q%' ( &404'1) ( 4
• Quartile ) &Q)' ( &%0%%'1) ( 1*.5
• Quartile 3 &Q3' ( &%40%!'1) ( 15
$lso:
• The Lo*est <alue is 3,
• The =i-hest <alue is 18
o no* *e have enou-h data for the %$x an& 'his(er )l$t:
8/17/2019 Quartile Deviationsand Standard Deviation
http://slidepdf.com/reader/full/quartile-deviationsand-standard-deviation 4/19
$nd the Interquartile Rane is:
Q3 Q% ( % 4 ( 11
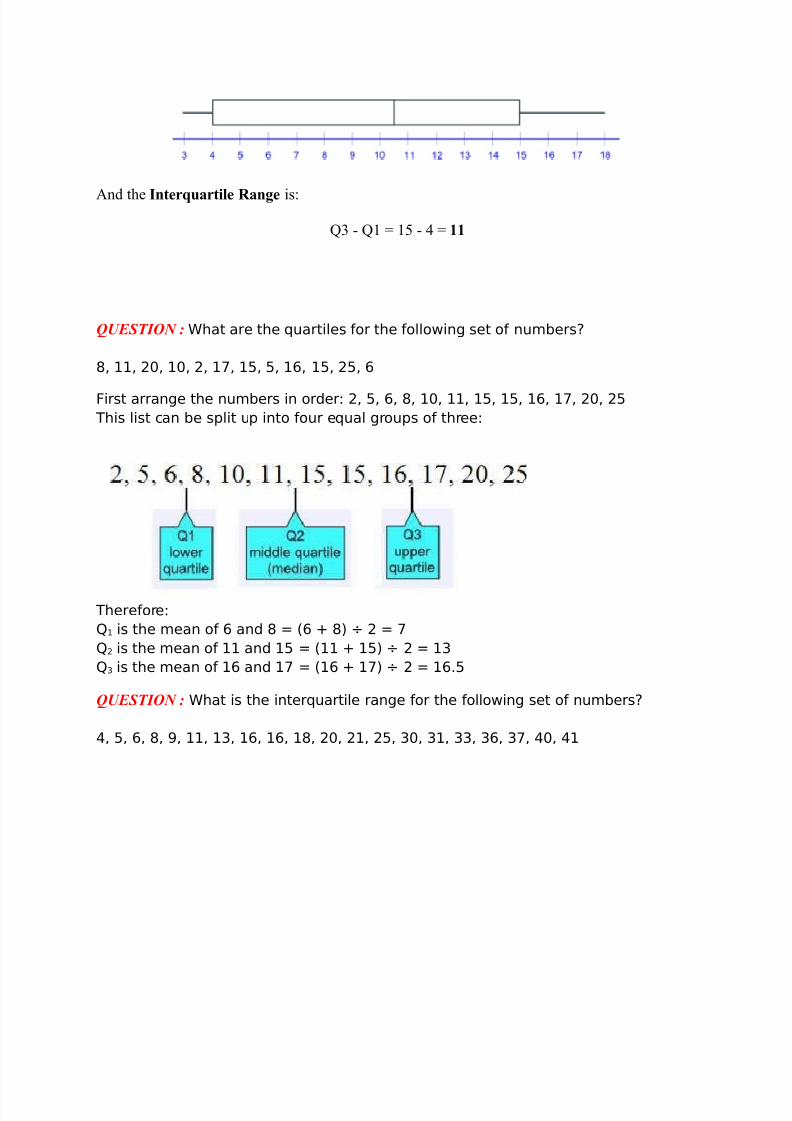
QUESTION : What are the quartiles for the following set of numbers?
8, 11, 20, 10, 2, 17, 15, 5, 16, 15, 25, 6
First arrange the numbers in order: 2, 5, 6, 8, 10, 11, 15, 15, 16, 17, 20, 25
his list !an be s"lit u" into four equal grou"s of three:
herefore:
#1 is the mean of 6 and 8 $ %6 & 8' ( 2 $ 7
#2 is the mean of 11 and 15 $ %11 & 15' ( 2 $ 1)
#) is the mean of 16 and 17 $ %16 & 17' ( 2 $ 16*5
QUESTION : What is the interquartile range for the following set of numbers?
+, 5, 6, 8, , 11, 1), 16, 16, 18, 20, 21, 25, )0, )1, )), )6, )7, +0, +1
8/17/2019 Quartile Deviationsand Standard Deviation
http://slidepdf.com/reader/full/quartile-deviationsand-standard-deviation 5/19
his list !an be s"lit u" into four equal grou"s of -.e:
herefore:
#1 is the mean of and 11 $ % & 11' ( 2 $ 10
#2 is the mean of 18 and 20 $ %18 & 20' ( 2 $ 1
#) is the mean of 16 and 17 $ %)1 & ))' ( 2 $ )2
herefore the interquartile range $ #) / #1 $ )2 / 10 $ 22
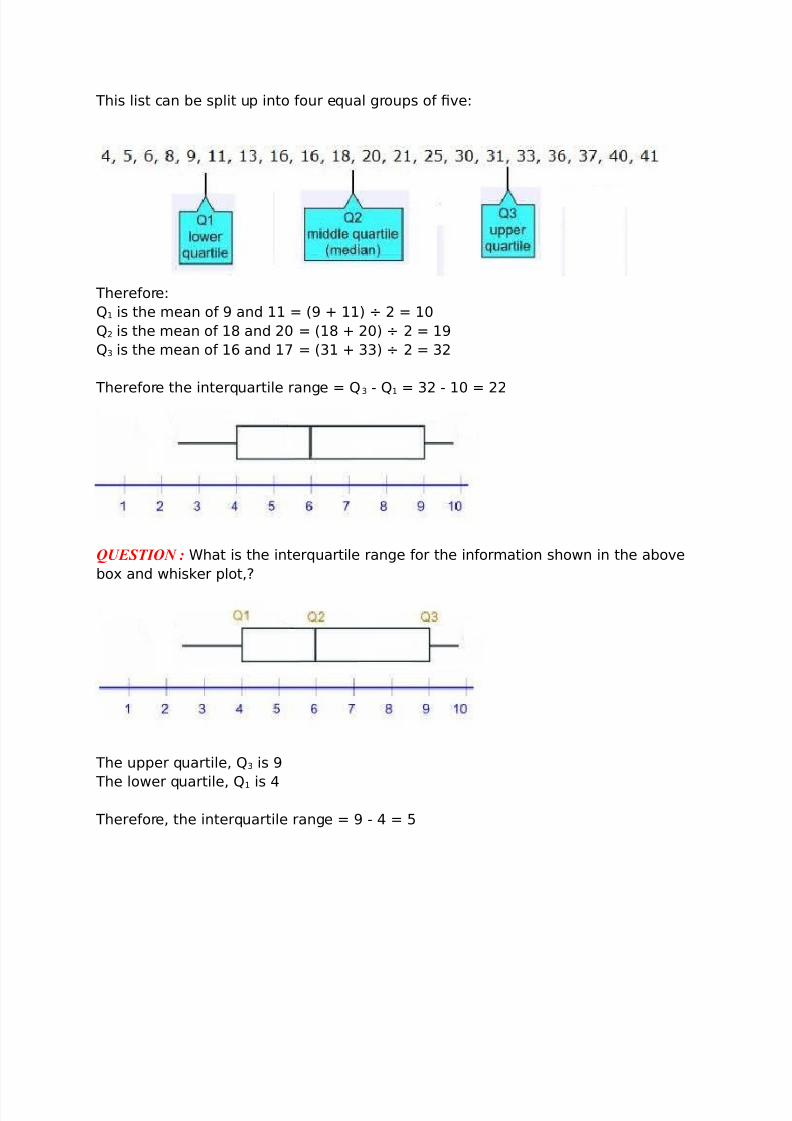
QUESTION : What is the interquartile range for the information shown in the abo.e
bo and whiser "lot,?
he u""er quartile, #) is
he lower quartile, #1 is +
herefore, the interquartile range $ / + $ 5
8/17/2019 Quartile Deviationsand Standard Deviation
http://slidepdf.com/reader/full/quartile-deviationsand-standard-deviation 6/19
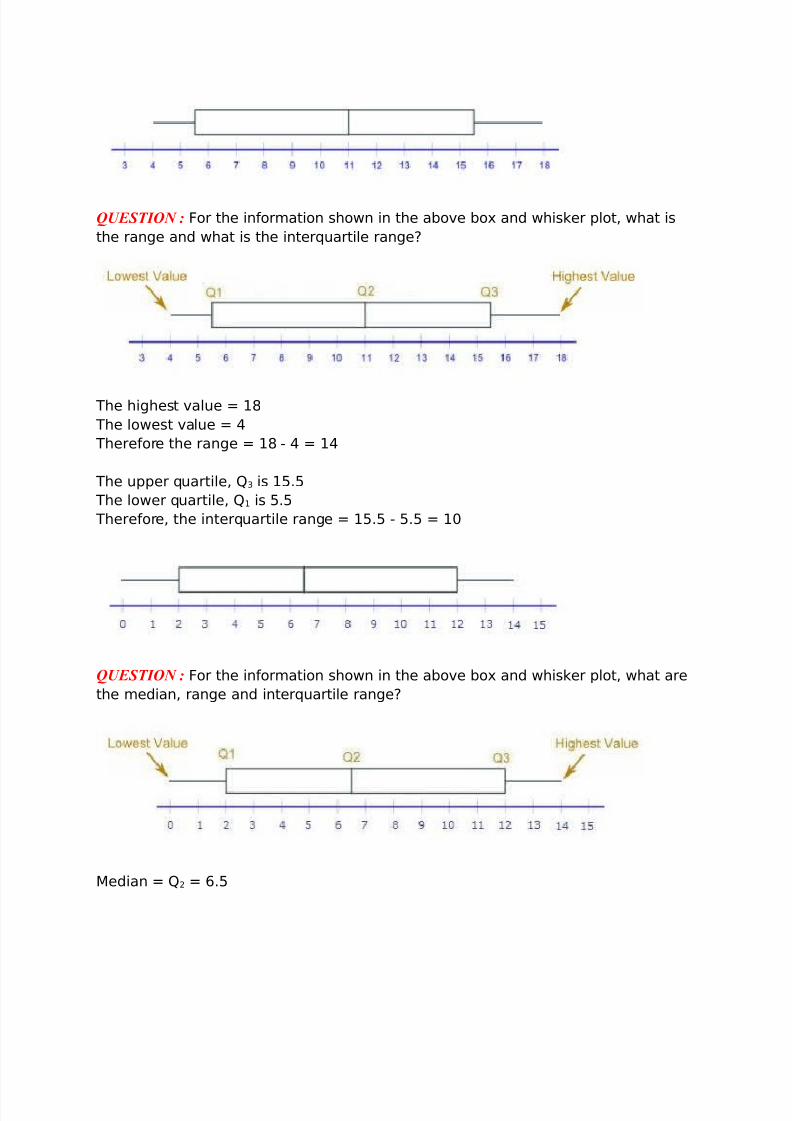
QUESTION : For the information shown in the abo.e bo and whiser "lot, what is
the range and what is the interquartile range?
he highest .alue $ 18
he lowest .alue $ +
herefore the range $ 18 / + $ 1+
he u""er quartile, #) is 15*5
he lower quartile, #1 is 5*5
herefore, the interquartile range $ 15*5 / 5*5 $ 10
QUESTION : For the information shown in the abo.e bo and whiser "lot, what are
the median, range and interquartile range?
edian $ #2 $ 6*5
8/17/2019 Quartile Deviationsand Standard Deviation
http://slidepdf.com/reader/full/quartile-deviationsand-standard-deviation 7/19
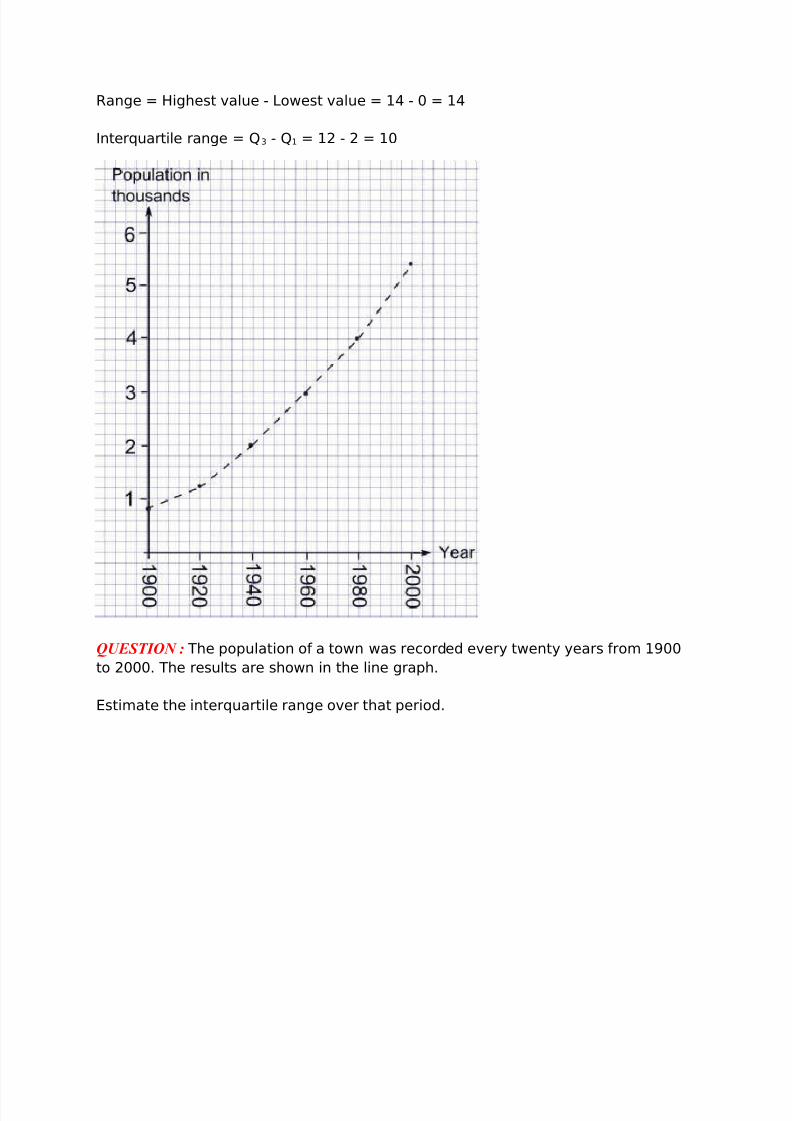
3ange $ 4ighest .alue / owest .alue $ 1+ / 0 $ 1+
nterquartile range $ #) / #1 $ 12 / 2 $ 10
QUESTION : he "o"ulation of a town was re!orded e.er twent ears from 100
to 2000* he results are shown in the line gra"h*
stimate the interquartile range o.er that "eriod*
8/17/2019 Quartile Deviationsand Standard Deviation
http://slidepdf.com/reader/full/quartile-deviationsand-standard-deviation 8/19
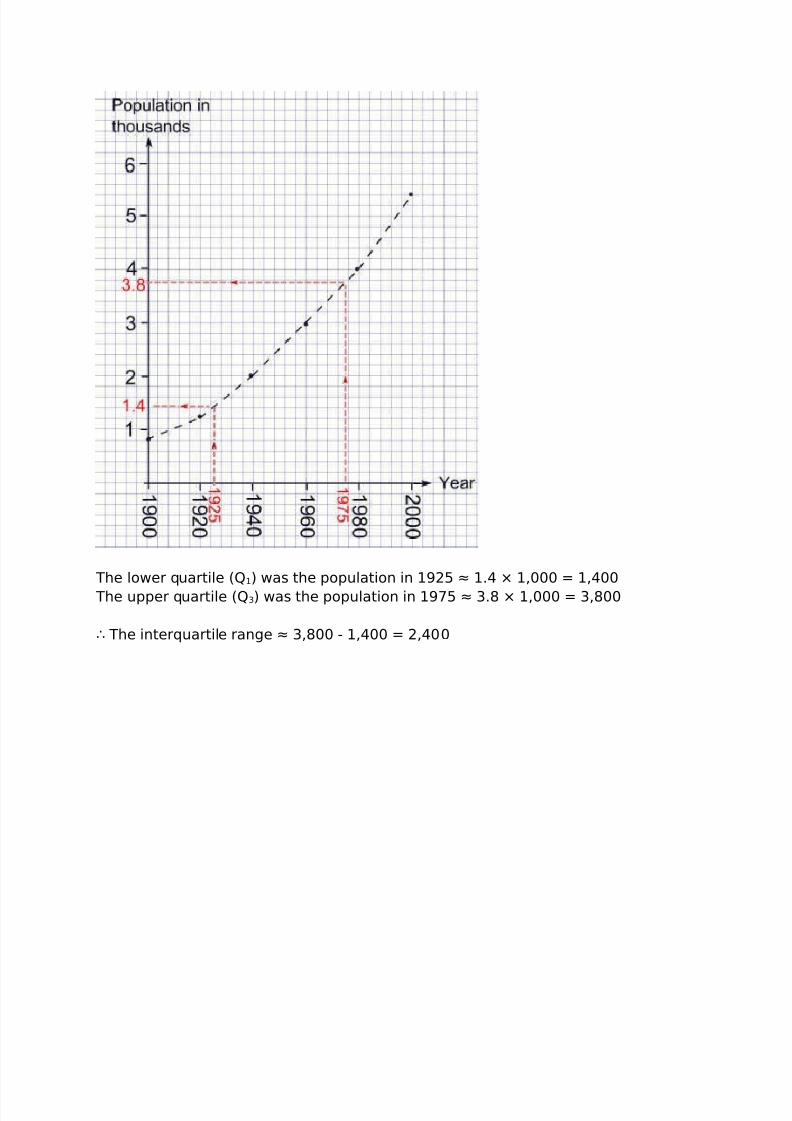
he lower quartile %#1' was the "o"ulation in 125 9 1*+ 1,000 $ 1,+00
he u""er quartile %#)' was the "o"ulation in 175 9 )*8 1,000 $ ),800
; he interquartile range 9 ),800 / 1,+00 $ 2,+00
8/17/2019 Quartile Deviationsand Standard Deviation
http://slidepdf.com/reader/full/quartile-deviationsand-standard-deviation 9/19
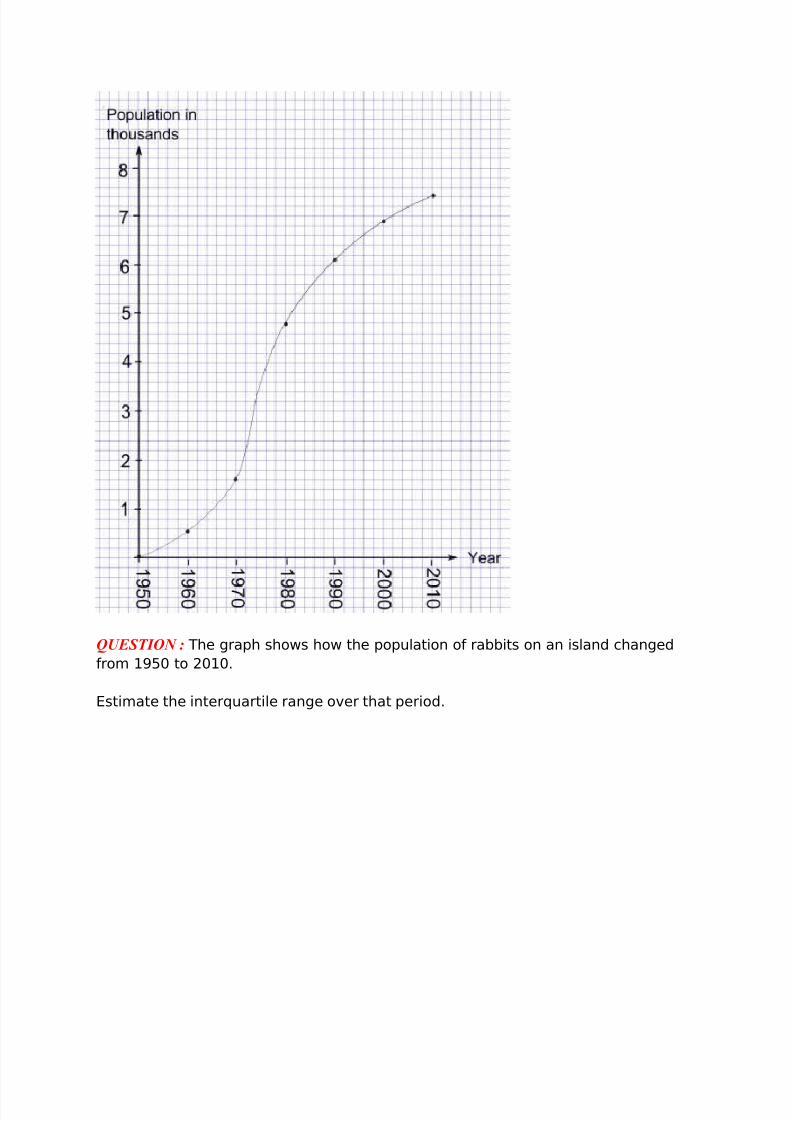
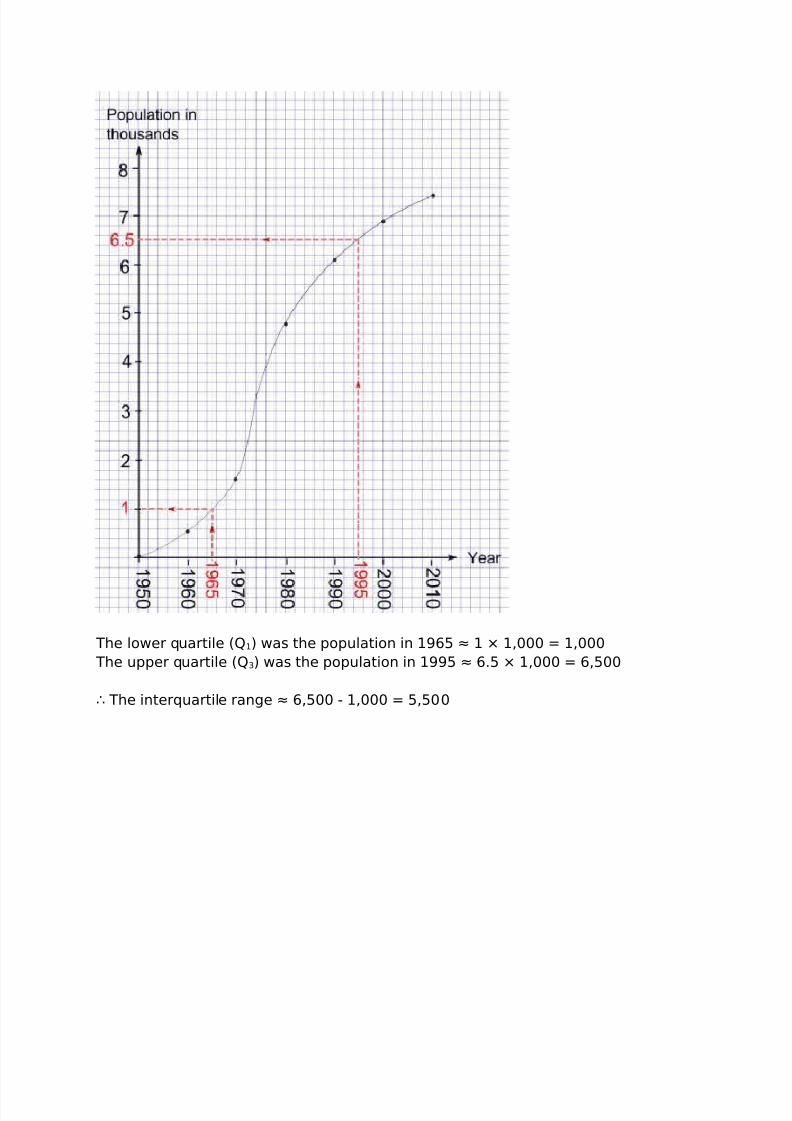
QUESTION : he gra"h shows how the "o"ulation of rabbits on an island !hanged
from 150 to 2010*
stimate the interquartile range o.er that "eriod*
8/17/2019 Quartile Deviationsand Standard Deviation
http://slidepdf.com/reader/full/quartile-deviationsand-standard-deviation 10/19
he lower quartile %#1' was the "o"ulation in 165 9 1 1,000 $ 1,000
he u""er quartile %#)' was the "o"ulation in 15 9 6*5 1,000 $ 6,500
; he interquartile range 9 6,500 / 1,000 $ 5,500
8/17/2019 Quartile Deviationsand Standard Deviation
http://slidepdf.com/reader/full/quartile-deviationsand-standard-deviation 11/19
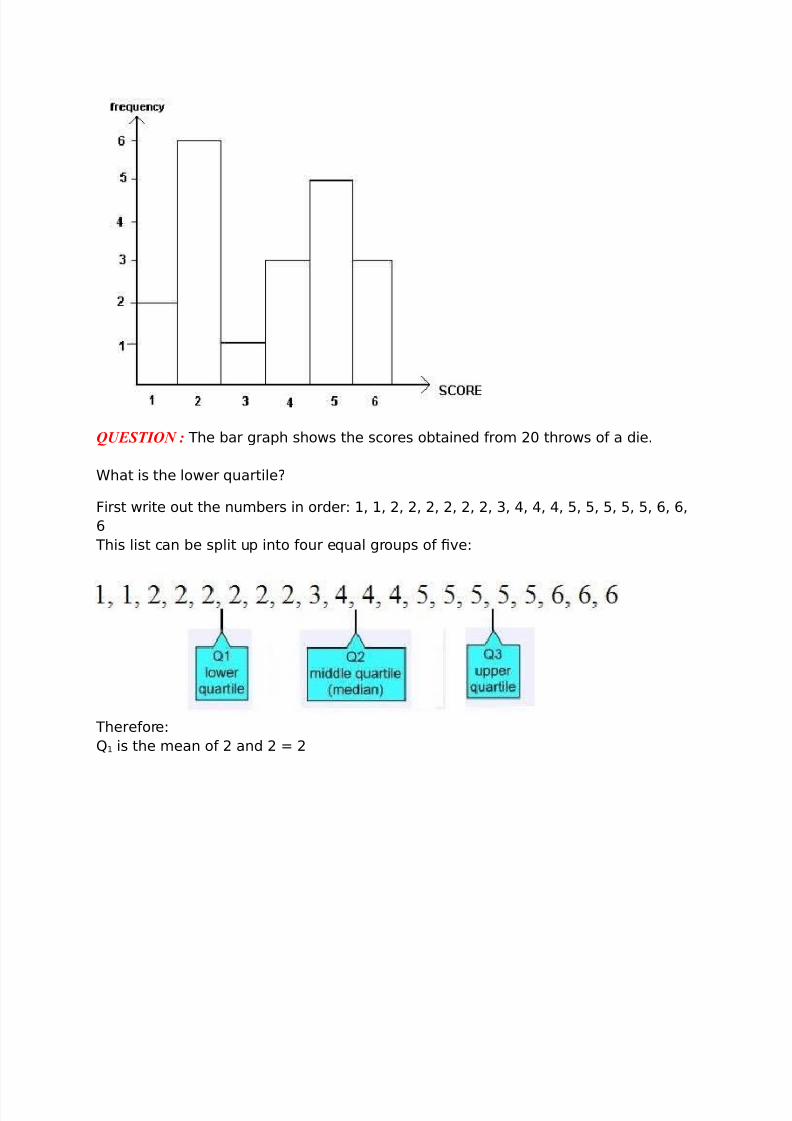
QUESTION : he bar gra"h shows the s!ores obtained from 20 throws of a die*
What is the lower quartile?
First write out the numbers in order: 1, 1, 2, 2, 2, 2, 2, 2, ), +, +, +, 5, 5, 5, 5, 5, 6, 6,
6
his list !an be s"lit u" into four equal grou"s of -.e:
herefore:
#1 is the mean of 2 and 2 $ 2
8/17/2019 Quartile Deviationsand Standard Deviation
http://slidepdf.com/reader/full/quartile-deviationsand-standard-deviation 12/19
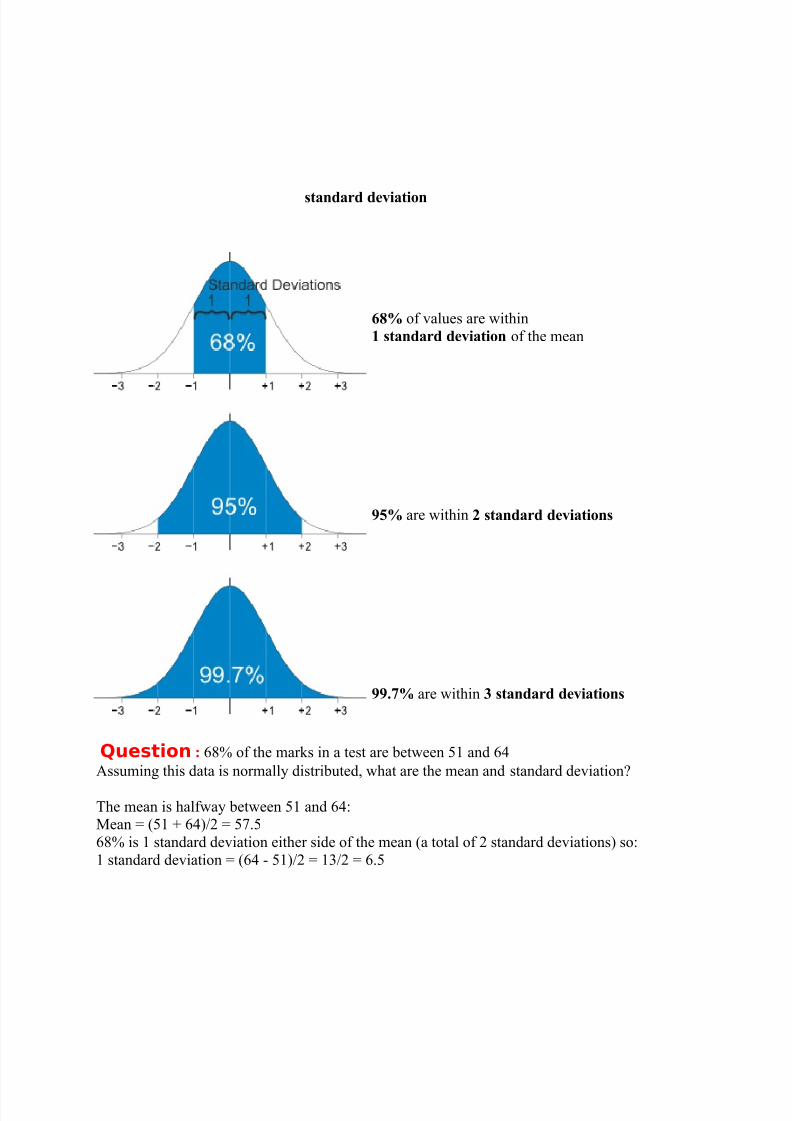
stan&ar& &e+iati$n
68 of values are *ithin
1 stan&ar& &e+iati$n of the mean
-5 are *ithin stan&ar& &e+iati$ns
--.7 are *ithin 3 stan&ar& &e+iati$ns
Question : !> of the marks in a test are bet*een % and !4
$ssumin- this data is normall distributed, *hat are the mean and standard deviation?
The mean is half*a bet*een % and !4:+ean ( &% 0 !4'1) ( 9.
!> is % standard deviation either side of the mean &a total of ) standard deviations' so:
% standard deviation ( &!4 %'1) ( %31) ( !.
8/17/2019 Quartile Deviationsand Standard Deviation
http://slidepdf.com/reader/full/quartile-deviationsand-standard-deviation 13/19
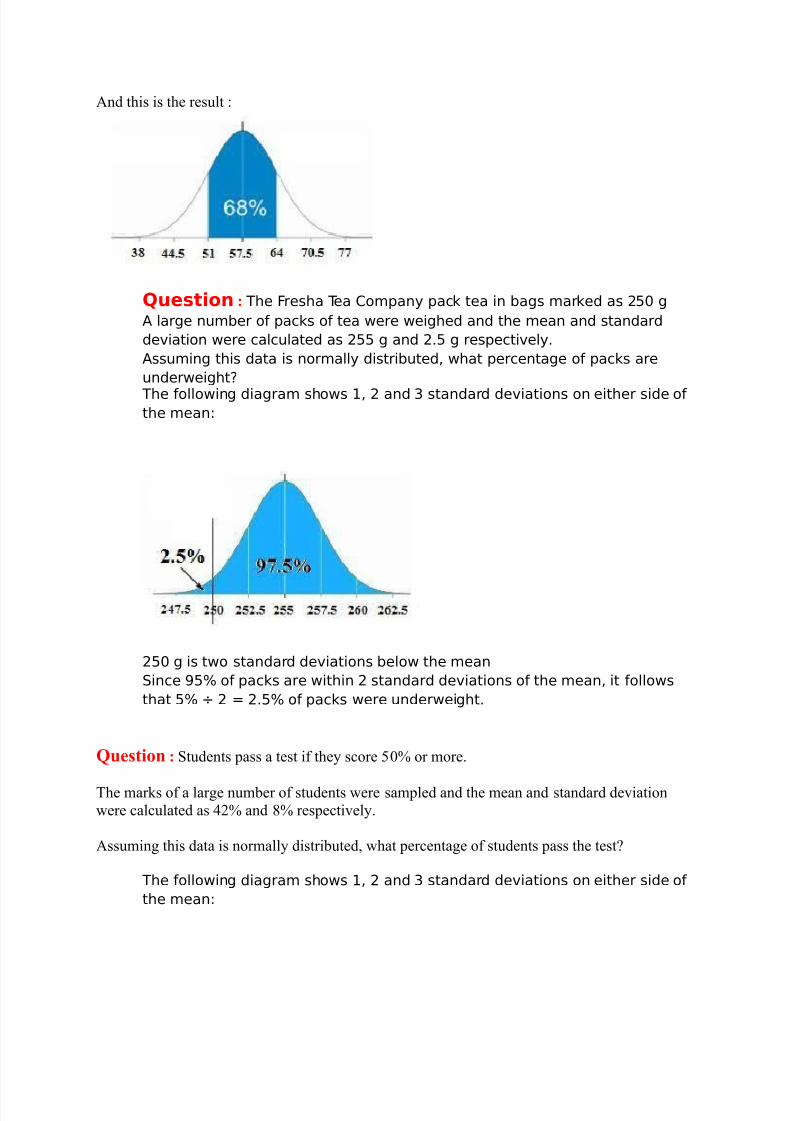
$nd this is the result :
Question : he Fresha ea <om"an "a! tea in bags mared as 250 g
= large number of "a!s of tea were weighed and the mean and standard
de.iation were !al!ulated as 255 g and 2*5 g res"e!ti.el*
=ssuming this data is normall distributed, what "er!entage of "a!s are
underweight?
he following diagram shows 1, 2 and ) standard de.iations on either side ofthe mean:
250 g is two standard de.iations below the mean
>in!e 5 of "a!s are within 2 standard de.iations of the mean, it follows
that 5 ( 2 $ 2*5 of "a!s were underweight*
Questi$n : tudents pass a test if the score > or more.
The marks of a lar-e number of students *ere sampled and the mean and standard deviation
*ere calculated as 4)> and > respectivel.
$ssumin- this data is normall distributed, *hat percenta-e of students pass the test?
he following diagram shows 1, 2 and ) standard de.iations on either side of
the mean:
8/17/2019 Quartile Deviationsand Standard Deviation
http://slidepdf.com/reader/full/quartile-deviationsand-standard-deviation 14/19
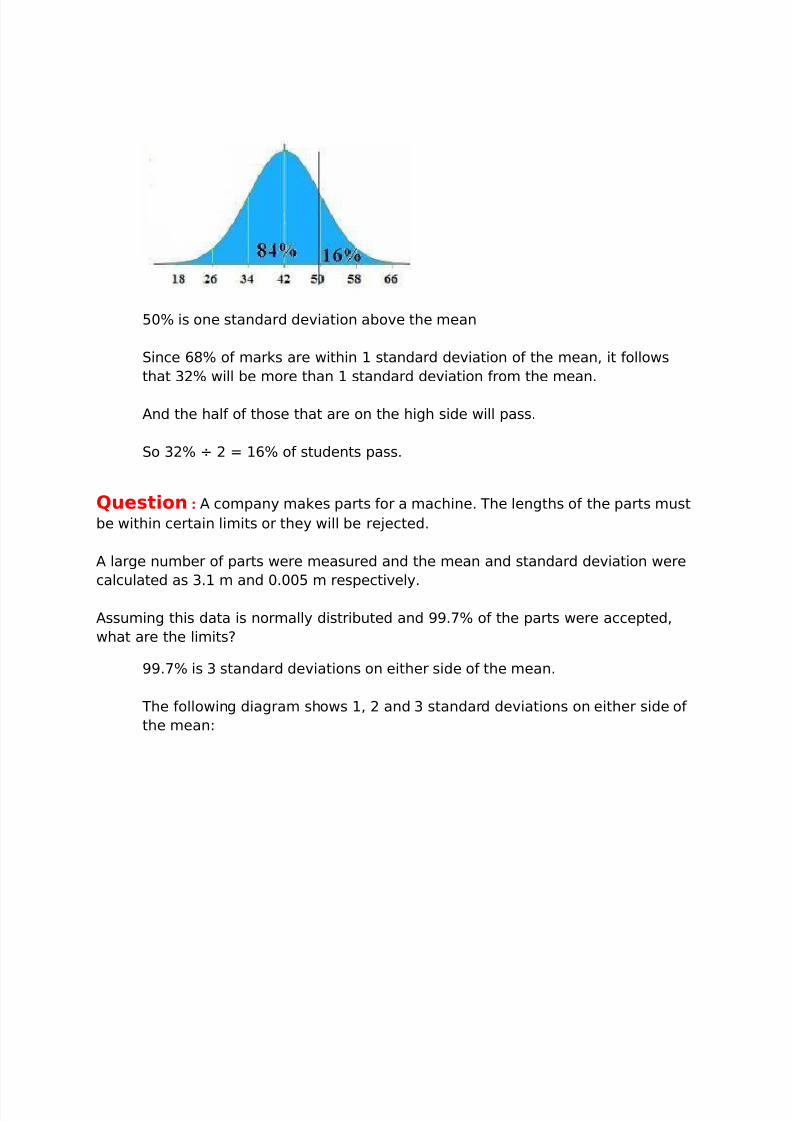
50 is one standard de.iation abo.e the mean
>in!e 68 of mars are within 1 standard de.iation of the mean, it follows
that )2 will be more than 1 standard de.iation from the mean*
=nd the half of those that are on the high side will "ass*
>o )2 ( 2 $ 16 of students "ass*
Question : = !om"an maes "arts for a ma!hine* he lengths of the "arts must
be within !ertain limits or the will be re@e!ted*
= large number of "arts were measured and the mean and standard de.iation were
!al!ulated as )*1 m and 0*005 m res"e!ti.el*
=ssuming this data is normall distributed and *7 of the "arts were a!!e"ted,
what are the limits?
*7 is ) standard de.iations on either side of the mean*
he following diagram shows 1, 2 and ) standard de.iations on either side of
the mean:
8/17/2019 Quartile Deviationsand Standard Deviation
http://slidepdf.com/reader/full/quartile-deviationsand-standard-deviation 15/19
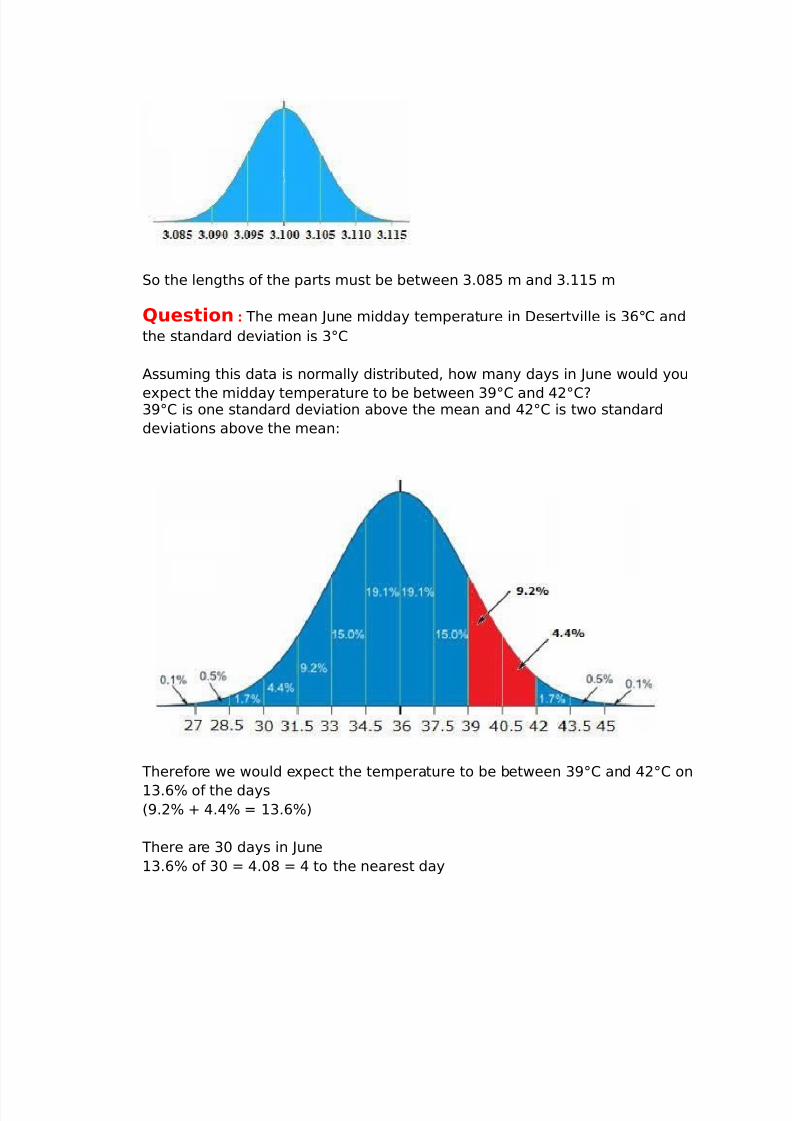
>o the lengths of the "arts must be between )*085 m and )*115 m
Question : he mean Aune midda tem"erature in Besert.ille is )6C< and
the standard de.iation is )C<
=ssuming this data is normall distributed, how man das in Aune would ou
e"e!t the midda tem"erature to be between )C< and +2C<?)C< is one standard de.iation abo.e the mean and +2C< is two standard
de.iations abo.e the mean:
herefore we would e"e!t the tem"erature to be between )C< and +2C< on
1)*6 of the das
%*2 & +*+ $ 1)*6'
here are )0 das in Aune
1)*6 of )0 $ +*08 $ + to the nearest da
8/17/2019 Quartile Deviationsand Standard Deviation
http://slidepdf.com/reader/full/quartile-deviationsand-standard-deviation 16/19
Question he heights of male adults are Dormall distributed with mean
1*7 m and standard de.iation 0*2 m
n a "o"ulation of +00 male adults, how man would ou e"e!t to ha.e a
height between 1*+ m and 1*6 m?
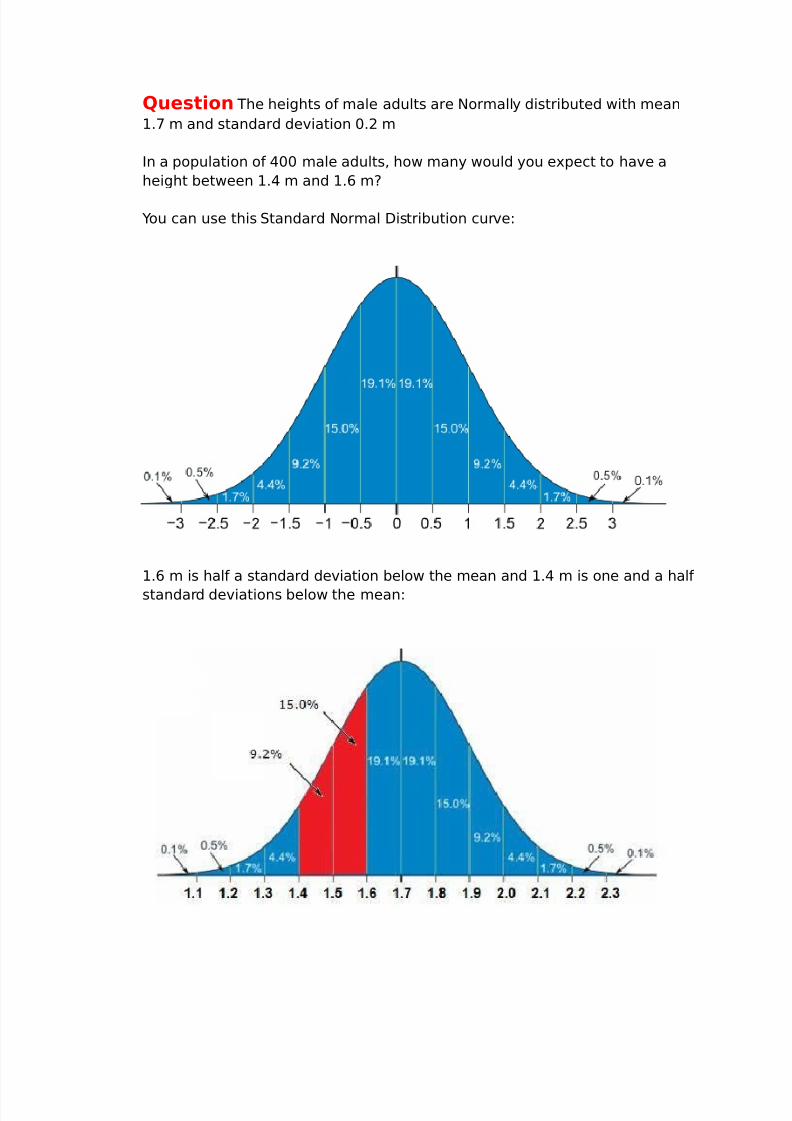
Eou !an use this >tandard Dormal Bistribution !ur.e:
1*6 m is half a standard de.iation below the mean and 1*+ m is one and a half
standard de.iations below the mean:
8/17/2019 Quartile Deviationsand Standard Deviation
http://slidepdf.com/reader/full/quartile-deviationsand-standard-deviation 17/19
herefore the "er!entage of male adults with heights between 1*+ m and 1*6
m
$ 15*0 & *2 $ 2+*2
2+*2 of +00 $ 6*8
herefore we would e"e!t 7 male adults with heights between 1*+ m and
1*6 m
he mean Aul dail rainfall in Water.ille is 10 mm and the standard de.iation
is 1*5 mm
=ssuming this data is normall distributed, how man das in Aul would ou
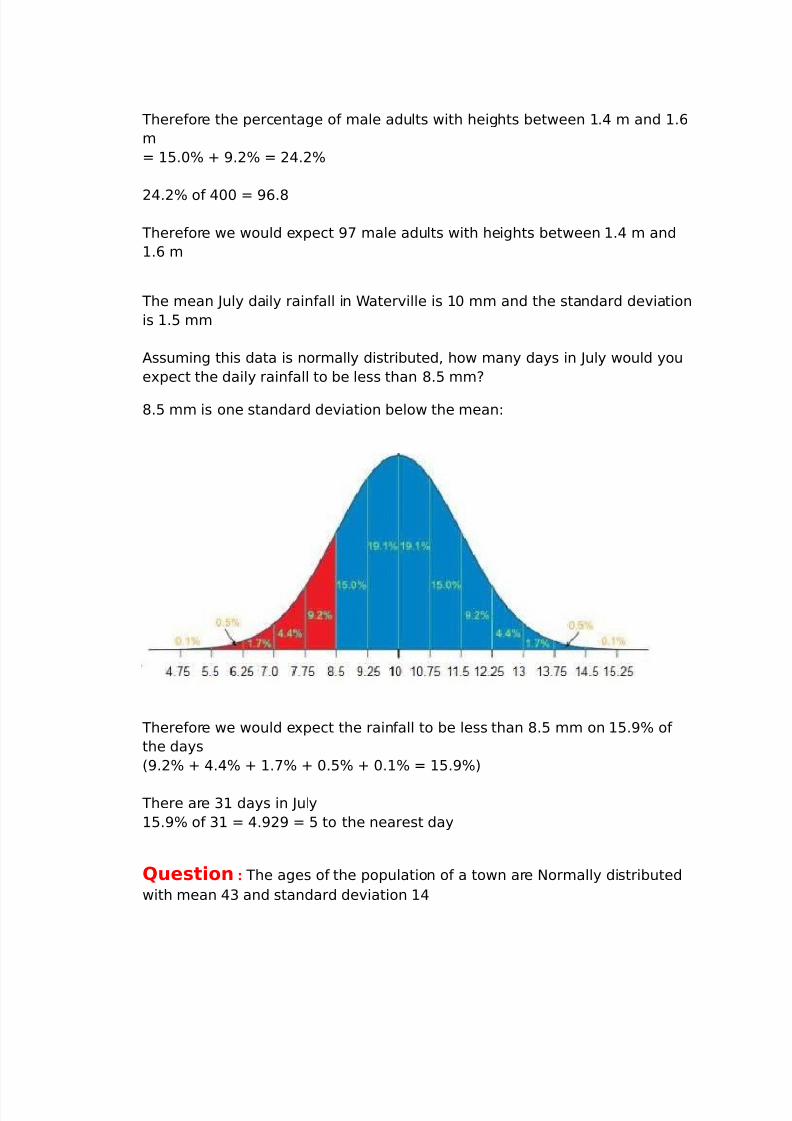
e"e!t the dail rainfall to be less than 8*5 mm?
8*5 mm is one standard de.iation below the mean:
herefore we would e"e!t the rainfall to be less than 8*5 mm on 15* of
the das
%*2 & +*+ & 1*7 & 0*5 & 0*1 $ 15*'
here are )1 das in Aul
15* of )1 $ +*2 $ 5 to the nearest da
Question : he ages of the "o"ulation of a town are Dormall distributed
with mean +) and standard de.iation 1+
8/17/2019 Quartile Deviationsand Standard Deviation
http://slidepdf.com/reader/full/quartile-deviationsand-standard-deviation 18/19
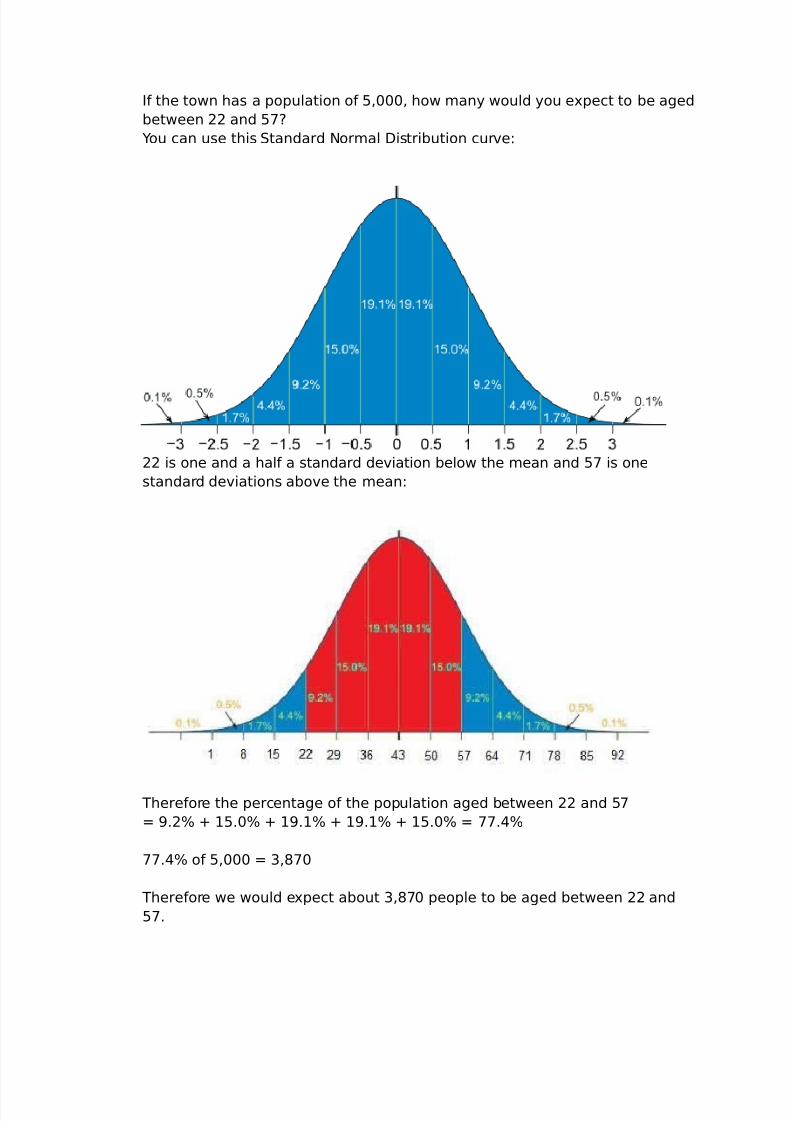
f the town has a "o"ulation of 5,000, how man would ou e"e!t to be aged
between 22 and 57?
Eou !an use this >tandard Dormal Bistribution !ur.e:
22 is one and a half a standard de.iation below the mean and 57 is one
standard de.iations abo.e the mean:
herefore the "er!entage of the "o"ulation aged between 22 and 57
$ *2 & 15*0 & 1*1 & 1*1 & 15*0 $ 77*+
77*+ of 5,000 $ ),870
herefore we would e"e!t about ),870 "eo"le to be aged between 22 and
57*

8/17/2019 Quartile Deviationsand Standard Deviation
http://slidepdf.com/reader/full/quartile-deviationsand-standard-deviation 19/19