Experiments on streamers in pure gasses and mixtures
17
Probing photo-ionization: experiments on positive streamers in pure gases and mixtures This article has been downloaded from IOPscience. Please scroll down to see the full text article. 2010 J. Phys. D: Appl. Phys. 43 145204 (http://iopscience.iop.org/0022-3727/43/14/145204) Download details: IP Address: 192.16.184.152 The article was downloaded on 24/03/2010 at 14:50 Please note that terms and conditions apply. The Table of Contents and more related content is available Home Search Collections Journals About Contact us My IOPscience
Transcript of Experiments on streamers in pure gasses and mixtures

Probing photo-ionization: experiments on positive streamers in pure gases and mixtures
This article has been downloaded from IOPscience. Please scroll down to see the full text article.
2010 J. Phys. D: Appl. Phys. 43 145204
(http://iopscience.iop.org/0022-3727/43/14/145204)
Download details:
IP Address: 192.16.184.152
The article was downloaded on 24/03/2010 at 14:50
Please note that terms and conditions apply.
The Table of Contents and more related content is available
Home Search Collections Journals About Contact us My IOPscience
IOP PUBLISHING JOURNAL OF PHYSICS D: APPLIED PHYSICS
J. Phys. D: Appl. Phys. 43 (2010) 145204 (16pp) doi:10.1088/0022-3727/43/14/145204
Probing photo-ionization: experimentson positive streamers in pure gases andmixturesS Nijdam1, F M J H van de Wetering1, R Blanc1,2, E M van Veldhuizen1
and U Ebert1,3
1 Eindhoven University of Technology, Department Applied Physics, PO Box 513, 5600 MB Eindhoven,The Netherlands2 Ecole Polytechnique de l’Universite d’Orleans, Orleans, France3 Centrum Wiskunde and Informatica, Amsterdam, The Netherlands
E-mail: [email protected]
Received 4 December 2009, in final form 8 February 2010Published 23 March 2010Online at stacks.iop.org/JPhysD/43/145204
AbstractPositive streamers are thought to propagate by photo-ionization; the parameters ofphoto-ionization depend on the nitrogen : oxygen ratio. Therefore we study streamers innitrogen with 20%, 0.2% and 0.01% oxygen and in pure nitrogen as well as in pure oxygenand argon. Our new experimental set-up guarantees contamination of the pure gases to be wellbelow 1 ppm. Streamers in oxygen are difficult to measure as they emit considerably less lightin the sensitivity range of our fast ICCD camera than the other gases. Streamers in purenitrogen and in all nitrogen–oxygen mixtures look generally similar, but become somewhatthinner and branch more with decreasing oxygen content. In pure nitrogen the streamers canbranch so much that they resemble feathers. This feature is even more pronounced in pureargon, with approximately 102 hair tips cm−3 in the feathers at 200 mbar; this density can beinterpreted as the free electron density creating avalanches towards the streamer stem. It isremarkable that the streamer velocity is essentially the same for similar voltage and pressure inall nitrogen–oxygen mixtures as well as in pure nitrogen, while the oxygen concentration andtherefore the photo-ionization lengths vary by more than five orders of magnitude. Streamersin argon have essentially the same velocity as well. The physical similarity of streamers atdifferent pressures is confirmed in all gases; the minimal diameters are smaller than in earliermeasurements.
S Online supplementary data available from stacks.iop.org/JPhysD/43/145204/mmedia
(Some figures in this article are in colour only in the electronic version)
1. Introduction
1.1. Positive streamers and photo-ionization
Streamers are the first stage of electric breakdown, when a highvoltage is applied to gas volumes [1–3]. The discharge can laterdevelop into spark or lightning, but it also can stay completelyin the streamer phase. An example of a discharge that remainsessentially in the streamer phase is a sprite discharge, a hugedischarge at 40 to 90 km altitude above thunderclouds [4, 5].In a wide field of technical applications, the voltage pulse
is intentionally kept short to suppress inefficient gas heatingduring later stages of the discharge [6, 7], and this technologybuilds on streamers. Streamers enhance the electric field attheir tip to values above the breakdown value and create aregion of active local ionization dynamics; in nanosecondresolved intensified CCD-photographs, these active areas canbe seen as bright spots [8–10]. For further reading onstreamers and sprites, we refer to a recent cluster issue inJ. Phys. D: Appl. Phys. [11] and to the AGU Chapmanconference on Effects of Thunderstorms and Lightning in theUpper Atmosphere (Pennsylvania, May 2009) [12] with its
0022-3727/10/145204+16$30.00 1 © 2010 IOP Publishing Ltd Printed in the UK & the USA
J. Phys. D: Appl. Phys. 43 (2010) 145204 S Nijdam et al
forthcoming issue in J. Geophys. Res. as well as to the manyoriginal papers cited there.
While negative streamers naturally propagate throughelectron drift (possibly supported by additional mechanisms),positive streamers are typically easier to generate, but moredifficult to explain [13], as they propagate against the electrondrift direction with velocities comparable to this velocity.While Townsend [14] in 1915 still assumed symmetry betweenpositive and negative charge carriers, it soon became clearthat positive ions were not suitable for impact ionizationand too slow. The commonly accepted explanation for thepropagation of positive streamers in air is photo-ionization;this was suggested in 1935 by Flegler and Raether inMunich [15], by Bradley and Snoddy in Virginia [16] and byCravath in California [17]: the active ionization region emitsUV radiation that at some distance (in particular, ahead ofthe front) can generate additional electron–ion pairs. Thetheoretical understanding of photo-ionization in nitrogen–oxygen mixtures was quantified by Teich [18, 19]: the energeticelectrons in the high field region of the streamer excite certainlevels of molecular nitrogen with energies above the ionizationenergy of oxygen. The levels deexcite by emission of aphoton that can ionize molecular oxygen. Teich determinedthe dominant wave lengths, and he also identified quenchingat higher air pressures as a mechanism suppressing photo-ionization.
There has hardly been any experimental work publishedon measuring photo-ionization directly in the past 40 years.Cravath [17, 20] already in 1935 suggested two ionizationlengths of 1 and of 5 mm in air at standard temperature andpressure, and Raether [21] measured 5 mm in 1938 where healso investigated hydrogen and oxygen. After the second worldwar, Przybylski and Teich continued this work in Raether’s labin Hamburg and published their results in German in 1958 and1967 [18, 19, 22]. Penney and Hummert [23] in Pennsylvaniainvestigated the process again and found in 1970 full agreementwith the earlier measurements of Przybylski and Teich, andwith those of Sroka in ‘pure’ oxygen, ‘pure’ nitrogen and air.The results show that photo-ionization in air is about 1 or 2orders of magnitude more effective than in pure oxygen or purenitrogen, but they still see significant photo-ionization in bothpure gases. However, the only information about the purityof the gases is that ‘commercial-grade’ gases have been used.This probably refers to purities in the order of 0.1% to 1%.They do not discuss which mechanisms could be responsiblefor the photo-ionization in any of the gases, in contrast to Teich.In recent years Aints et al [24] have used the same methodas Penney and Hummert to investigate the effects of watercontent in air on photo-ionization. Their results are similar tothe results of Penney and Hummert, with small corrections forthe effects of water content.
The data of Przybylski, Teich, Penney and Hummertand the theoretical understanding of Teich were merged byZhelezniak et al [25] into a model of photo-ionization thatnowadays is used in most streamer simulations [26–31].
On the other hand, the reliability of the photo-ionizationdata and of the resulting Zhelezniak model has beenquestioned; for a recent discussion, we refer to the introduction
of Nudnova and Starikovskii [32]. Background ionizationhas been suggested as an alternative to photo-ionization;in early simulations, photo-ionization was even replaced bybackground ionization to reduce the computational complexity[33]. The background ionization could either be due toradioactivity and cosmic radiation, or due to left over chargesat high repetition rates of the discharge as elaborated byPancheshnyi [34]. In the present experiments, high repetitionrates are avoided, we use a 1 Hz repetition frequency for allexperiments.
As photo-ionization is a vital part of streamer theory,and as direct measurements are difficult, Luque et al [31]have suggested indirect measurements through studying theinteraction of two streamer heads propagating next to eachother: they typically would repel each other electrostatically,but could merge through the non-local effect of photo-ionization. In an attempt to confirm this theory, Nijdam et alhave performed experiments with two streamers emitted fromadjacent needles [35], but a common parameter regime hasnot yet been explored for theory and experiment, and thephoto-ionization could not yet be investigated along these lines.Kashiwagi and Itoh have shown that UV and VUV radiationfrom a surface streamer discharge can trigger a synchronousstreamer discharge [36]. They have found that radiation around115 nm is most effective, which is somewhat higher than thelimit of 102.5 nm that is associated with nitrogen–oxygenphoto-ionization. However, in the case of surface discharges,photo-electron emission from the insulator surface itself canreplace photo-ionization of oxygen molecules in bulk streamerdischarges. The photo-electron emission from the surface canoccur at longer wavelengths than the bulk photo-ionization ofoxygen molecules.
Here we follow a different experimental track. Accordingto Teich’s photo-ionization mechanism in nitrogen–oxygenmixtures, the density of emitted photons is proportionalto the nitrogen concentration and the absorption lengthsof the photons are inversely proportional to the oxygenconcentration. If positive streamers in air indeed propagatethrough this mechanism, one would expect that their propertieschange when the ratio of nitrogen and oxygen is changed.The main purpose of this paper is therefore to investigatepositive streamers in varying nitrogen–oxygen mixturesexperimentally. To set the limits, we also investigate streamersin pure nitrogen and in pure oxygen, and for comparison, wealso investigate them in pure argon.
1.2. Previous experiments on streamers in different gases
Streamers in nitrogen–oxygen mixtures. Streamers in varyingnitrogen–oxygen mixtures have been investigated before by Yiand Williams [37], Ono and Oda [38] and Briels et al [39, 40].
Yi and Williams [37] use a 130 mm plane–plane geometrywith protruding point, where the protruding point is a 3.2 mmdiameter rod ground to a sharp tip (radius ≈100 µm). Theyuse both positive and negative voltages pulses with amplitudesbetween 70 and 130 kV and rise times of the order of 50 ns.Nitrogen–oxygen mixtures with oxygen fractions between‘0%’ and 15% are investigated. The purity of their pure
2
J. Phys. D: Appl. Phys. 43 (2010) 145204 S Nijdam et al
nitrogen is not specified but it is presumably significantlybelow 0.1%, as this is the oxygen content of their nextgas mixture. They claim that their measurements stronglysuggest that photo-ionization plays an important role because(especially positive) streamers propagate faster at higheroxygen concentrations. For high voltages (>100 kV), thepropagation velocity of positive streamers increases withroughly a factor of five when going from their pure nitrogento 10% oxygen in nitrogen. In negative streamers the sameconcentration change leads to a velocity increase of lessthan 40%.
Ono and Oda [38] also use a point-plane geometry, butwith a 13 mm gap. Their tips are made by cutting a 0.3 mmstainless steel wire and have no well-defined tip profile. Theyapply positive voltage pulses with amplitudes between 13 and37 kV, rise times in the order of tens of nanoseconds anddurations of a few hundred nanoseconds on nitrogen–oxygenmixtures containing oxygen fractions between ‘0%’ and 20%.Again, the purity of the nitrogen used in the experiments is notspecified. Their next purest mixture contains 0.2% oxygen.They claim that propagation velocity, diameter and shape of thestreamers are strongly influenced by the oxygen concentration.No measured value varied by more than a factor of five whenchanging the oxygen concentration from 20% to 0%. Thestreamer diameter increases from 0.2–0.4 mm in pure nitrogento more than 1 mm in air. At 18 kV, the propagation velocityincreases from ∼2×10⁵ m s−1 in pure nitrogen to 5×10⁵ m s−1
in air.Briels et al [39, 40] have measured in air, a mixture with
0.2% oxygen in nitrogen and ‘pure nitrogen’. They use 5 to45 kV positive pulses with rise times of the order of 20–200 nsin point-plane gaps of 40 and 160 mm at pressures between100 mbar and 1 bar. They have shown that at lower-oxygenconcentrations, streamers branch and zigzag more, they arebrighter and thinner (about 40% thinner in pure nitrogenthan in air). They have not found a clear effect of oxygenconcentration on propagation velocity; at 1 bar they are lowestin pure nitrogen, while at lower pressures they are the same orhighest in pure nitrogen. However, the set-up that was used inthese experiments is not designed for high purity gas handling.Therefore, it is not known what the exact purity of the purenitrogen was in all of the experiments described by Briels et al.
In order to better investigate the effects of low oxygenconcentrations, here we will present results in which the purityof the gases can be guaranteed to ppm (parts per million) levels.
Streamers in argon. Aleksandrov et al [41] have performedexperiments on streamers in pure argon (99.99% purity) anda mixture of 1 to 5% oxygen in argon, all at atmosphericpressure. They present streak photography of discharges ina 250 mm rod-plane gap with 10 to 60 kV voltage pulse with1 µs rise time. They conclude that a non-thermal mechanism ofstreamer breakdown in the case of argon discharges gives wayto leader breakdown when 1% or more of oxygen is added.This addition also leads to a decay of the streamer channelthat is an order of magnitude faster and therefore a noticeablyhigher electric field is needed for the streamers to bridge thegap. Their simulations show that this can be explained by the
quenching of excited argon molecules by oxygen molecules.Van Veldhuizen and Rutgers [42] have used air and argon.They found that streamers in argon branch less and can onlybe produced in a narrow voltage range.
Measurements similar to the ones presented in thispaper on two planetary gas mixtures (Venus and Jupiter) arepresented in a paper by Dubrovin et al [43].
1.3. Advantages of short pulses
Past measurements by Briels et al [39, 40, 44, 45] andothers [37, 38, 41] have been performed with voltage pulseswith durations of many hundred nanoseconds up to manymicroseconds and with rise times of tens of nanoseconds ormore. This approach has two disadvantages: firstly, the slowrise time means that the streamers may initiate at a significantlylower voltage than the reported maximum voltage. Therefore,they may not exhibit the properties (such as diameter andpropagating velocity) that are representative for this voltage,but for a lower voltage. Secondly, a long pulse durationmay lead to a streamer-to-spark transition. Because a sparkis usually much brighter than a streamer, it may damage thephoto-cathode of an ICCD camera, and is therefore avoided.
One way to overcome these two problems is to use apower supply based on a Blumlein pulser [46, 47]. With sucha circuit, it is possible to make pulses with a well-definedduration (depending on the cable length) and a fast rise time(order 1 to 10 ns). Briels et al have investigated the effect ofrise time on streamer properties. We extend this to lower risetimes.
1.4. Content of the paper
In this paper we present experimental measurements onstreamer discharges in different gas mixtures, with an emphasison nitrogen–oxygen mixtures, focusing on photo-ionization.We will repeat some measurements by Briels et al [40], butwith a better defined purity of the gases and better optics tomeasure streamer diameters. We also extend the measuredrange to nitrogen of 1 ppm purity and to argon and oxygen of10 ppm purity and we discuss implications for the propagationmechanism. We measure at various pressures to further teststreamer similarity laws.
2. Experimental set-up
We have built a set-up that is specifically designed to ensurethe purity of the enclosed gases. For this reason, the set-upcan be baked to reduce out-gassing, it contains no plasticparts, except for the o-ring seals and it stays closed all ofthe time. When not in use, the set-up is pumped down to apressure of about 2 ×10⁻⁷ mbar. The leak rate (including out-gassing) under vacuum is about 8 × 10⁻⁷ mbar min−1, whichis considerably lower than the 5 × 10⁻³ mbar min−1 reportedby Yi and Williams [37]. We have used a helium leak tester tocheck for any leaks, but have not found any.
During use, the gas inside the set-up is flushed withsuch a flow rate that all gas is replaced every 25 min. The
3
J. Phys. D: Appl. Phys. 43 (2010) 145204 S Nijdam et al
160
10 230
450
10
1.0
30º
Glassfeedthrough
High
(a)
(b)
voltage
Grounded
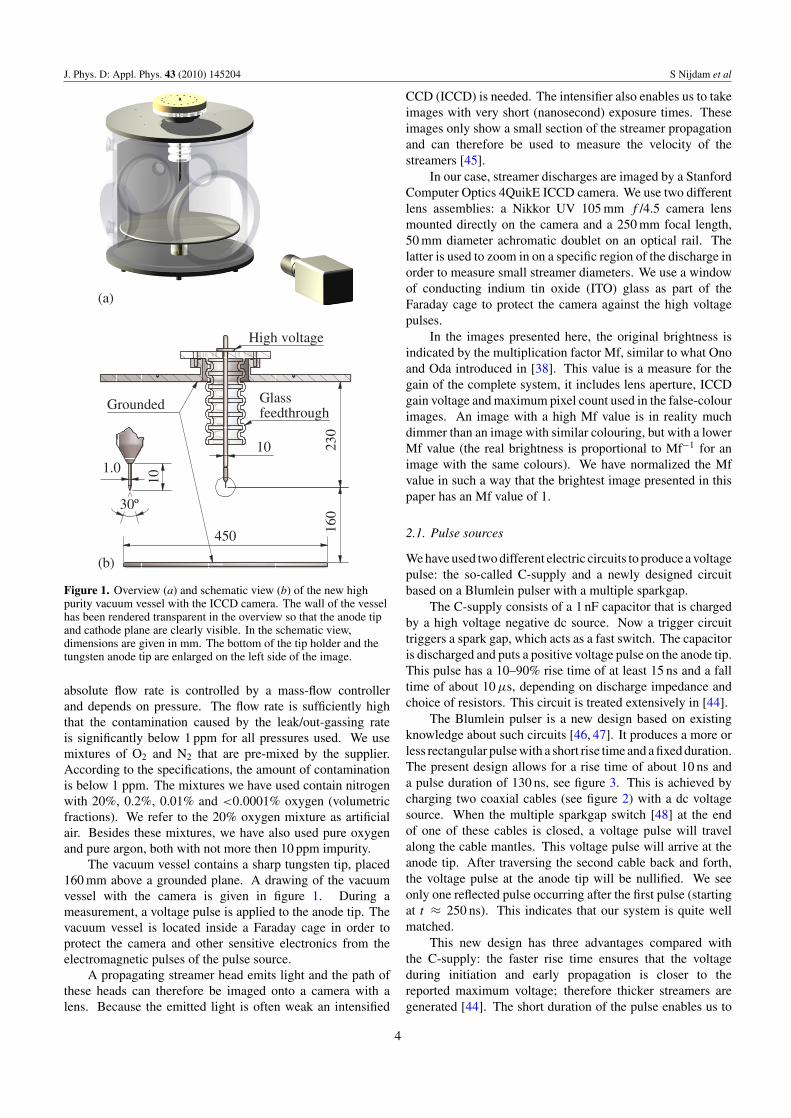
Figure 1. Overview (a) and schematic view (b) of the new highpurity vacuum vessel with the ICCD camera. The wall of the vesselhas been rendered transparent in the overview so that the anode tipand cathode plane are clearly visible. In the schematic view,dimensions are given in mm. The bottom of the tip holder and thetungsten anode tip are enlarged on the left side of the image.
absolute flow rate is controlled by a mass-flow controllerand depends on pressure. The flow rate is sufficiently highthat the contamination caused by the leak/out-gassing rateis significantly below 1 ppm for all pressures used. We usemixtures of O2 and N2 that are pre-mixed by the supplier.According to the specifications, the amount of contaminationis below 1 ppm. The mixtures we have used contain nitrogenwith 20%, 0.2%, 0.01% and <0.0001% oxygen (volumetricfractions). We refer to the 20% oxygen mixture as artificialair. Besides these mixtures, we have also used pure oxygenand pure argon, both with not more then 10 ppm impurity.
The vacuum vessel contains a sharp tungsten tip, placed160 mm above a grounded plane. A drawing of the vacuumvessel with the camera is given in figure 1. During ameasurement, a voltage pulse is applied to the anode tip. Thevacuum vessel is located inside a Faraday cage in order toprotect the camera and other sensitive electronics from theelectromagnetic pulses of the pulse source.
A propagating streamer head emits light and the path ofthese heads can therefore be imaged onto a camera with alens. Because the emitted light is often weak an intensified
CCD (ICCD) is needed. The intensifier also enables us to takeimages with very short (nanosecond) exposure times. Theseimages only show a small section of the streamer propagationand can therefore be used to measure the velocity of thestreamers [45].
In our case, streamer discharges are imaged by a StanfordComputer Optics 4QuikE ICCD camera. We use two differentlens assemblies: a Nikkor UV 105 mm f /4.5 camera lensmounted directly on the camera and a 250 mm focal length,50 mm diameter achromatic doublet on an optical rail. Thelatter is used to zoom in on a specific region of the discharge inorder to measure small streamer diameters. We use a windowof conducting indium tin oxide (ITO) glass as part of theFaraday cage to protect the camera against the high voltagepulses.
In the images presented here, the original brightness isindicated by the multiplication factor Mf, similar to what Onoand Oda introduced in [38]. This value is a measure for thegain of the complete system, it includes lens aperture, ICCDgain voltage and maximum pixel count used in the false-colourimages. An image with a high Mf value is in reality muchdimmer than an image with similar colouring, but with a lowerMf value (the real brightness is proportional to Mf−1 for animage with the same colours). We have normalized the Mfvalue in such a way that the brightest image presented in thispaper has an Mf value of 1.
2.1. Pulse sources
We have used two different electric circuits to produce a voltagepulse: the so-called C-supply and a newly designed circuitbased on a Blumlein pulser with a multiple sparkgap.
The C-supply consists of a 1 nF capacitor that is chargedby a high voltage negative dc source. Now a trigger circuittriggers a spark gap, which acts as a fast switch. The capacitoris discharged and puts a positive voltage pulse on the anode tip.This pulse has a 10–90% rise time of at least 15 ns and a falltime of about 10 µs, depending on discharge impedance andchoice of resistors. This circuit is treated extensively in [44].
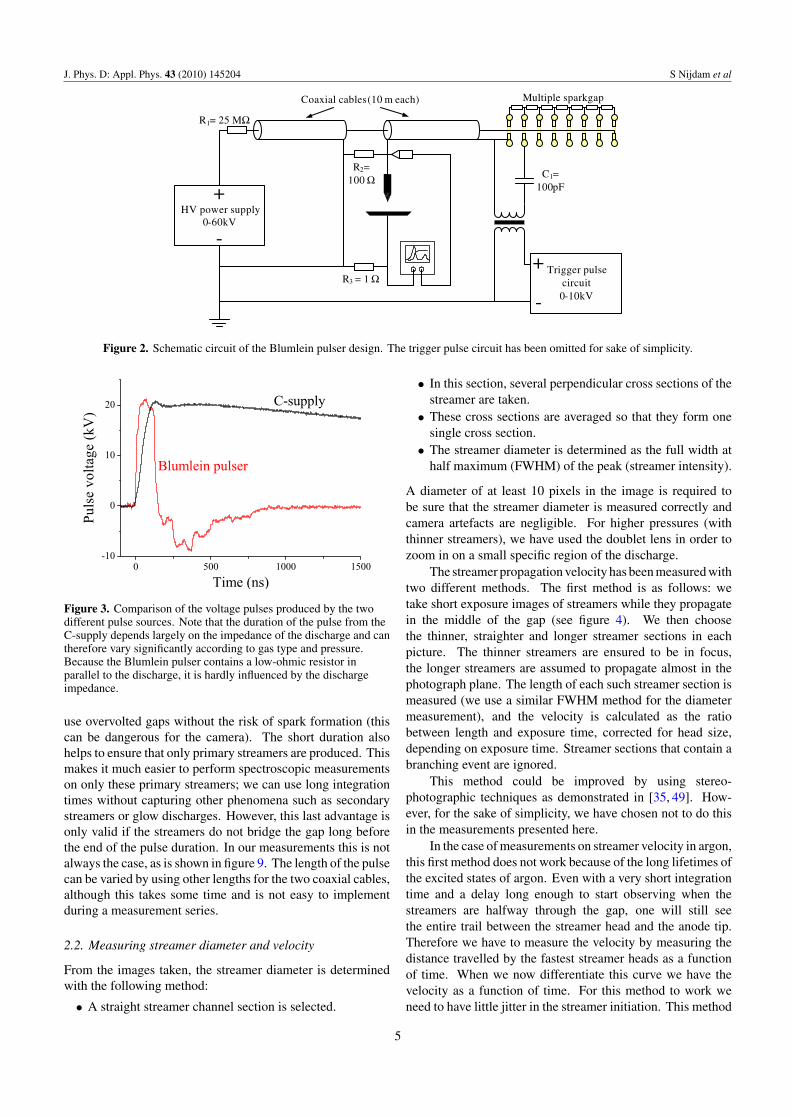
The Blumlein pulser is a new design based on existingknowledge about such circuits [46, 47]. It produces a more orless rectangular pulse with a short rise time and a fixed duration.The present design allows for a rise time of about 10 ns anda pulse duration of 130 ns, see figure 3. This is achieved bycharging two coaxial cables (see figure 2) with a dc voltagesource. When the multiple sparkgap switch [48] at the endof one of these cables is closed, a voltage pulse will travelalong the cable mantles. This voltage pulse will arrive at theanode tip. After traversing the second cable back and forth,the voltage pulse at the anode tip will be nullified. We seeonly one reflected pulse occurring after the first pulse (startingat t ≈ 250 ns). This indicates that our system is quite wellmatched.
This new design has three advantages compared withthe C-supply: the faster rise time ensures that the voltageduring initiation and early propagation is closer to thereported maximum voltage; therefore thicker streamers aregenerated [44]. The short duration of the pulse enables us to
4
J. Phys. D: Appl. Phys. 43 (2010) 145204 S Nijdam et al
R3 = 1 Ω
R1= 25 MΩ
R2=100 Ω
HV power supply0-60kV
-
+C1=
100pF
Multiple sparkgapCoaxial cables (10 m each)
Trigger pulse circuit0-10kV-
+
Figure 2. Schematic circuit of the Blumlein pulser design. The trigger pulse circuit has been omitted for sake of simplicity.
Figure 3. Comparison of the voltage pulses produced by the twodifferent pulse sources. Note that the duration of the pulse from theC-supply depends largely on the impedance of the discharge and cantherefore vary significantly according to gas type and pressure.Because the Blumlein pulser contains a low-ohmic resistor inparallel to the discharge, it is hardly influenced by the dischargeimpedance.
use overvolted gaps without the risk of spark formation (thiscan be dangerous for the camera). The short duration alsohelps to ensure that only primary streamers are produced. Thismakes it much easier to perform spectroscopic measurementson only these primary streamers; we can use long integrationtimes without capturing other phenomena such as secondarystreamers or glow discharges. However, this last advantage isonly valid if the streamers do not bridge the gap long beforethe end of the pulse duration. In our measurements this is notalways the case, as is shown in figure 9. The length of the pulsecan be varied by using other lengths for the two coaxial cables,although this takes some time and is not easy to implementduring a measurement series.
2.2. Measuring streamer diameter and velocity
From the images taken, the streamer diameter is determinedwith the following method:
• A straight streamer channel section is selected.
• In this section, several perpendicular cross sections of thestreamer are taken.
• These cross sections are averaged so that they form onesingle cross section.
• The streamer diameter is determined as the full width athalf maximum (FWHM) of the peak (streamer intensity).
A diameter of at least 10 pixels in the image is required tobe sure that the streamer diameter is measured correctly andcamera artefacts are negligible. For higher pressures (withthinner streamers), we have used the doublet lens in order tozoom in on a small specific region of the discharge.
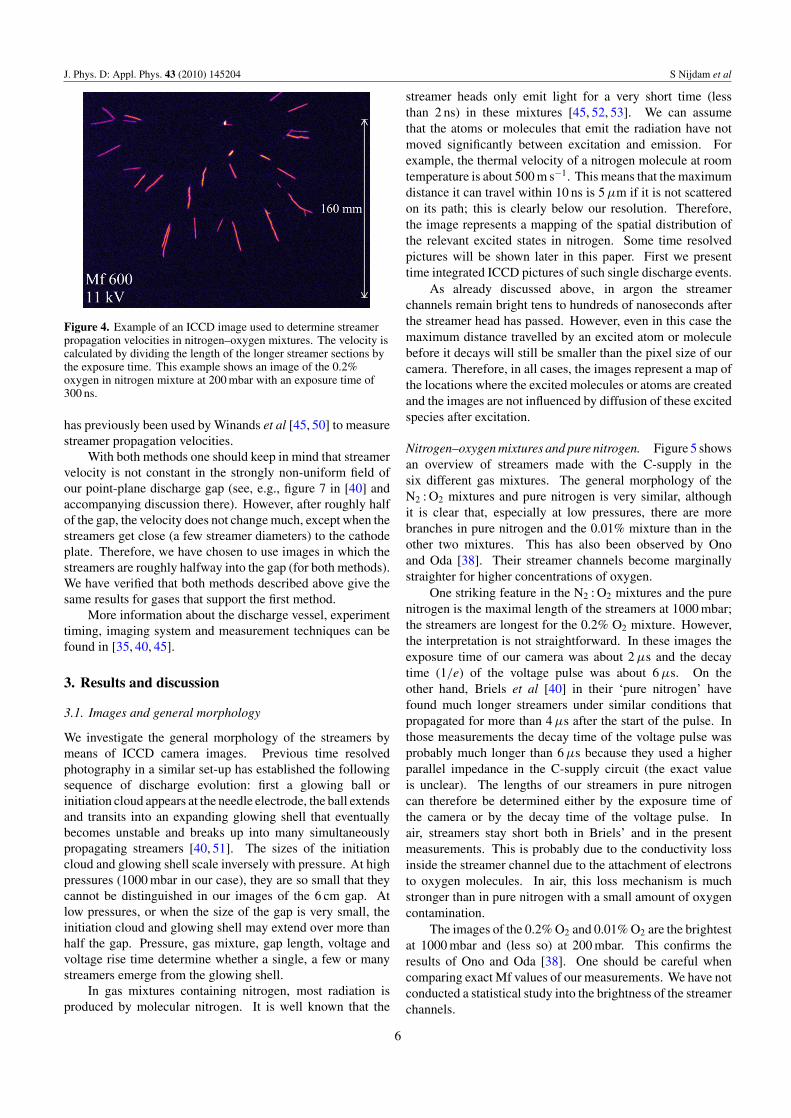
The streamer propagation velocity has been measured withtwo different methods. The first method is as follows: wetake short exposure images of streamers while they propagatein the middle of the gap (see figure 4). We then choosethe thinner, straighter and longer streamer sections in eachpicture. The thinner streamers are ensured to be in focus,the longer streamers are assumed to propagate almost in thephotograph plane. The length of each such streamer section ismeasured (we use a similar FWHM method for the diametermeasurement), and the velocity is calculated as the ratiobetween length and exposure time, corrected for head size,depending on exposure time. Streamer sections that contain abranching event are ignored.
This method could be improved by using stereo-photographic techniques as demonstrated in [35, 49]. How-ever, for the sake of simplicity, we have chosen not to do thisin the measurements presented here.
In the case of measurements on streamer velocity in argon,this first method does not work because of the long lifetimes ofthe excited states of argon. Even with a very short integrationtime and a delay long enough to start observing when thestreamers are halfway through the gap, one will still seethe entire trail between the streamer head and the anode tip.Therefore we have to measure the velocity by measuring thedistance travelled by the fastest streamer heads as a functionof time. When we now differentiate this curve we have thevelocity as a function of time. For this method to work weneed to have little jitter in the streamer initiation. This method
5
J. Phys. D: Appl. Phys. 43 (2010) 145204 S Nijdam et al
Figure 4. Example of an ICCD image used to determine streamerpropagation velocities in nitrogen–oxygen mixtures. The velocity iscalculated by dividing the length of the longer streamer sections bythe exposure time. This example shows an image of the 0.2%oxygen in nitrogen mixture at 200 mbar with an exposure time of300 ns.
has previously been used by Winands et al [45, 50] to measurestreamer propagation velocities.
With both methods one should keep in mind that streamervelocity is not constant in the strongly non-uniform field ofour point-plane discharge gap (see, e.g., figure 7 in [40] andaccompanying discussion there). However, after roughly halfof the gap, the velocity does not change much, except when thestreamers get close (a few streamer diameters) to the cathodeplate. Therefore, we have chosen to use images in which thestreamers are roughly halfway into the gap (for both methods).We have verified that both methods described above give thesame results for gases that support the first method.
More information about the discharge vessel, experimenttiming, imaging system and measurement techniques can befound in [35, 40, 45].
3. Results and discussion
3.1. Images and general morphology
We investigate the general morphology of the streamers bymeans of ICCD camera images. Previous time resolvedphotography in a similar set-up has established the followingsequence of discharge evolution: first a glowing ball orinitiation cloud appears at the needle electrode, the ball extendsand transits into an expanding glowing shell that eventuallybecomes unstable and breaks up into many simultaneouslypropagating streamers [40, 51]. The sizes of the initiationcloud and glowing shell scale inversely with pressure. At highpressures (1000 mbar in our case), they are so small that theycannot be distinguished in our images of the 6 cm gap. Atlow pressures, or when the size of the gap is very small, theinitiation cloud and glowing shell may extend over more thanhalf the gap. Pressure, gas mixture, gap length, voltage andvoltage rise time determine whether a single, a few or manystreamers emerge from the glowing shell.
In gas mixtures containing nitrogen, most radiation isproduced by molecular nitrogen. It is well known that the
streamer heads only emit light for a very short time (lessthan 2 ns) in these mixtures [45, 52, 53]. We can assumethat the atoms or molecules that emit the radiation have notmoved significantly between excitation and emission. Forexample, the thermal velocity of a nitrogen molecule at roomtemperature is about 500 m s−1. This means that the maximumdistance it can travel within 10 ns is 5 µm if it is not scatteredon its path; this is clearly below our resolution. Therefore,the image represents a mapping of the spatial distribution ofthe relevant excited states in nitrogen. Some time resolvedpictures will be shown later in this paper. First we presenttime integrated ICCD pictures of such single discharge events.
As already discussed above, in argon the streamerchannels remain bright tens to hundreds of nanoseconds afterthe streamer head has passed. However, even in this case themaximum distance travelled by an excited atom or moleculebefore it decays will still be smaller than the pixel size of ourcamera. Therefore, in all cases, the images represent a map ofthe locations where the excited molecules or atoms are createdand the images are not influenced by diffusion of these excitedspecies after excitation.
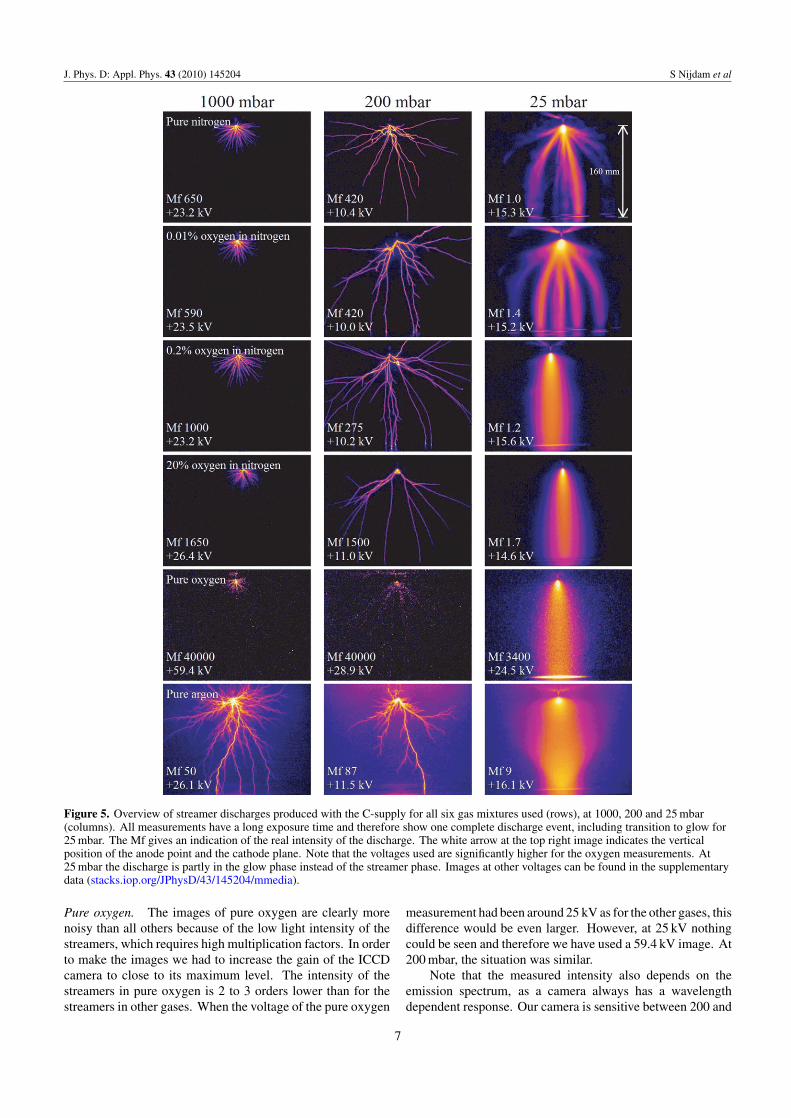
Nitrogen–oxygen mixtures and pure nitrogen. Figure 5 showsan overview of streamers made with the C-supply in thesix different gas mixtures. The general morphology of theN2 : O2 mixtures and pure nitrogen is very similar, althoughit is clear that, especially at low pressures, there are morebranches in pure nitrogen and the 0.01% mixture than in theother two mixtures. This has also been observed by Onoand Oda [38]. Their streamer channels become marginallystraighter for higher concentrations of oxygen.
One striking feature in the N2 : O2 mixtures and the purenitrogen is the maximal length of the streamers at 1000 mbar;the streamers are longest for the 0.2% O2 mixture. However,the interpretation is not straightforward. In these images theexposure time of our camera was about 2 µs and the decaytime (1/e) of the voltage pulse was about 6 µs. On theother hand, Briels et al [40] in their ‘pure nitrogen’ havefound much longer streamers under similar conditions thatpropagated for more than 4 µs after the start of the pulse. Inthose measurements the decay time of the voltage pulse wasprobably much longer than 6 µs because they used a higherparallel impedance in the C-supply circuit (the exact valueis unclear). The lengths of our streamers in pure nitrogencan therefore be determined either by the exposure time ofthe camera or by the decay time of the voltage pulse. Inair, streamers stay short both in Briels’ and in the presentmeasurements. This is probably due to the conductivity lossinside the streamer channel due to the attachment of electronsto oxygen molecules. In air, this loss mechanism is muchstronger than in pure nitrogen with a small amount of oxygencontamination.
The images of the 0.2% O2 and 0.01% O2 are the brightestat 1000 mbar and (less so) at 200 mbar. This confirms theresults of Ono and Oda [38]. One should be careful whencomparing exact Mf values of our measurements. We have notconducted a statistical study into the brightness of the streamerchannels.
6
J. Phys. D: Appl. Phys. 43 (2010) 145204 S Nijdam et al
Figure 5. Overview of streamer discharges produced with the C-supply for all six gas mixtures used (rows), at 1000, 200 and 25 mbar(columns). All measurements have a long exposure time and therefore show one complete discharge event, including transition to glow for25 mbar. The Mf gives an indication of the real intensity of the discharge. The white arrow at the top right image indicates the verticalposition of the anode point and the cathode plane. Note that the voltages used are significantly higher for the oxygen measurements. At25 mbar the discharge is partly in the glow phase instead of the streamer phase. Images at other voltages can be found in the supplementarydata (stacks.iop.org/JPhysD/43/145204/mmedia).
Pure oxygen. The images of pure oxygen are clearly morenoisy than all others because of the low light intensity of thestreamers, which requires high multiplication factors. In orderto make the images we had to increase the gain of the ICCDcamera to close to its maximum level. The intensity of thestreamers in pure oxygen is 2 to 3 orders lower than for thestreamers in other gases. When the voltage of the pure oxygen
measurement had been around 25 kV as for the other gases, thisdifference would be even larger. However, at 25 kV nothingcould be seen and therefore we have used a 59.4 kV image. At200 mbar, the situation was similar.
Note that the measured intensity also depends on theemission spectrum, as a camera always has a wavelengthdependent response. Our camera is sensitive between 200 and
7
J. Phys. D: Appl. Phys. 43 (2010) 145204 S Nijdam et al
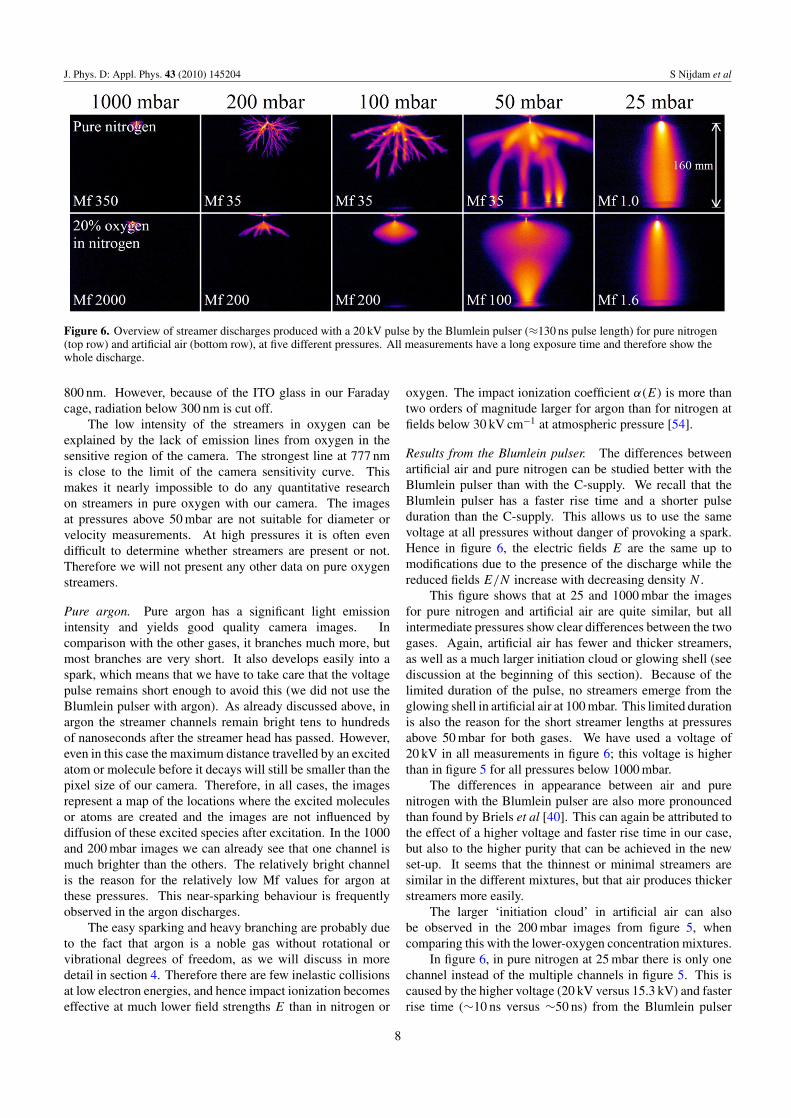
Figure 6. Overview of streamer discharges produced with a 20 kV pulse by the Blumlein pulser (≈130 ns pulse length) for pure nitrogen(top row) and artificial air (bottom row), at five different pressures. All measurements have a long exposure time and therefore show thewhole discharge.
800 nm. However, because of the ITO glass in our Faradaycage, radiation below 300 nm is cut off.
The low intensity of the streamers in oxygen can beexplained by the lack of emission lines from oxygen in thesensitive region of the camera. The strongest line at 777 nmis close to the limit of the camera sensitivity curve. Thismakes it nearly impossible to do any quantitative researchon streamers in pure oxygen with our camera. The imagesat pressures above 50 mbar are not suitable for diameter orvelocity measurements. At high pressures it is often evendifficult to determine whether streamers are present or not.Therefore we will not present any other data on pure oxygenstreamers.
Pure argon. Pure argon has a significant light emissionintensity and yields good quality camera images. Incomparison with the other gases, it branches much more, butmost branches are very short. It also develops easily into aspark, which means that we have to take care that the voltagepulse remains short enough to avoid this (we did not use theBlumlein pulser with argon). As already discussed above, inargon the streamer channels remain bright tens to hundredsof nanoseconds after the streamer head has passed. However,even in this case the maximum distance travelled by an excitedatom or molecule before it decays will still be smaller than thepixel size of our camera. Therefore, in all cases, the imagesrepresent a map of the locations where the excited moleculesor atoms are created and the images are not influenced bydiffusion of these excited species after excitation. In the 1000and 200 mbar images we can already see that one channel ismuch brighter than the others. The relatively bright channelis the reason for the relatively low Mf values for argon atthese pressures. This near-sparking behaviour is frequentlyobserved in the argon discharges.
The easy sparking and heavy branching are probably dueto the fact that argon is a noble gas without rotational orvibrational degrees of freedom, as we will discuss in moredetail in section 4. Therefore there are few inelastic collisionsat low electron energies, and hence impact ionization becomeseffective at much lower field strengths E than in nitrogen or
oxygen. The impact ionization coefficient α(E) is more thantwo orders of magnitude larger for argon than for nitrogen atfields below 30 kV cm−1 at atmospheric pressure [54].
Results from the Blumlein pulser. The differences betweenartificial air and pure nitrogen can be studied better with theBlumlein pulser than with the C-supply. We recall that theBlumlein pulser has a faster rise time and a shorter pulseduration than the C-supply. This allows us to use the samevoltage at all pressures without danger of provoking a spark.Hence in figure 6, the electric fields E are the same up tomodifications due to the presence of the discharge while thereduced fields E/N increase with decreasing density N .
This figure shows that at 25 and 1000 mbar the imagesfor pure nitrogen and artificial air are quite similar, but allintermediate pressures show clear differences between the twogases. Again, artificial air has fewer and thicker streamers,as well as a much larger initiation cloud or glowing shell (seediscussion at the beginning of this section). Because of thelimited duration of the pulse, no streamers emerge from theglowing shell in artificial air at 100 mbar. This limited durationis also the reason for the short streamer lengths at pressuresabove 50 mbar for both gases. We have used a voltage of20 kV in all measurements in figure 6; this voltage is higherthan in figure 5 for all pressures below 1000 mbar.
The differences in appearance between air and purenitrogen with the Blumlein pulser are also more pronouncedthan found by Briels et al [40]. This can again be attributed tothe effect of a higher voltage and faster rise time in our case,but also to the higher purity that can be achieved in the newset-up. It seems that the thinnest or minimal streamers aresimilar in the different mixtures, but that air produces thickerstreamers more easily.
The larger ‘initiation cloud’ in artificial air can alsobe observed in the 200 mbar images from figure 5, whencomparing this with the lower-oxygen concentration mixtures.
In figure 6, in pure nitrogen at 25 mbar there is only onechannel instead of the multiple channels in figure 5. This iscaused by the higher voltage (20 kV versus 15.3 kV) and fasterrise time (∼10 ns versus ∼50 ns) from the Blumlein pulser
8
J. Phys. D: Appl. Phys. 43 (2010) 145204 S Nijdam et al
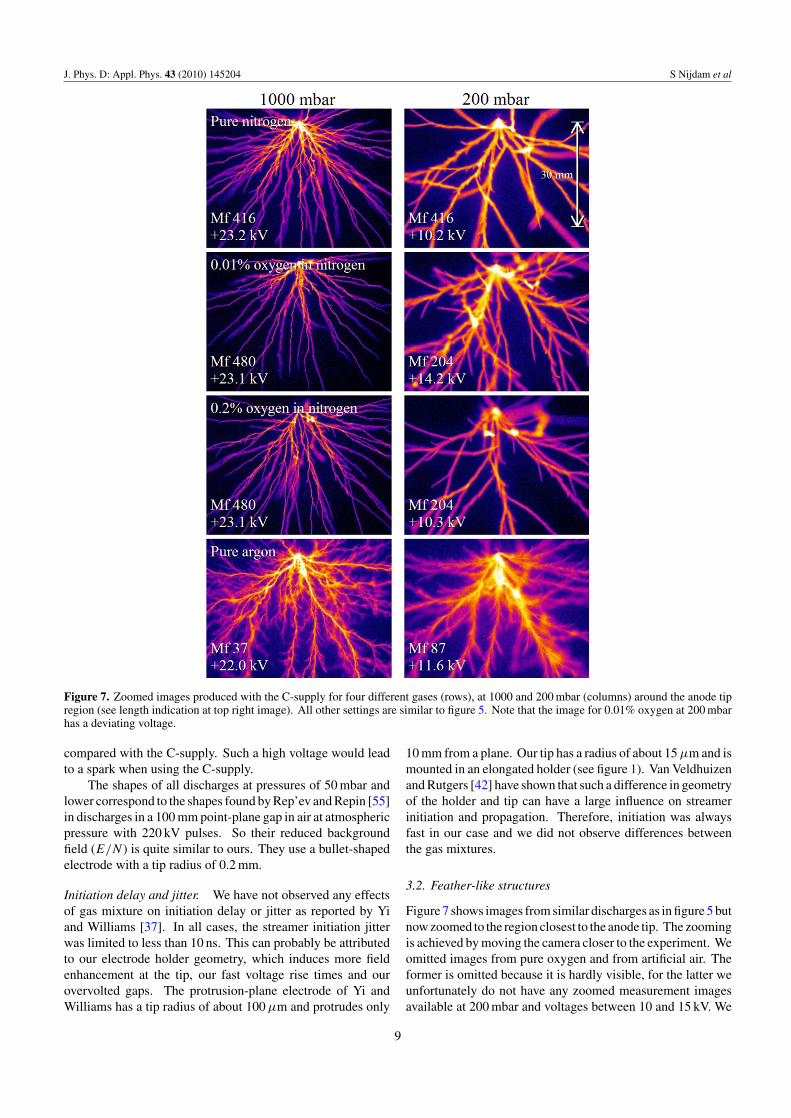
Figure 7. Zoomed images produced with the C-supply for four different gases (rows), at 1000 and 200 mbar (columns) around the anode tipregion (see length indication at top right image). All other settings are similar to figure 5. Note that the image for 0.01% oxygen at 200 mbarhas a deviating voltage.
compared with the C-supply. Such a high voltage would leadto a spark when using the C-supply.
The shapes of all discharges at pressures of 50 mbar andlower correspond to the shapes found by Rep’ev and Repin [55]in discharges in a 100 mm point-plane gap in air at atmosphericpressure with 220 kV pulses. So their reduced backgroundfield (E/N ) is quite similar to ours. They use a bullet-shapedelectrode with a tip radius of 0.2 mm.
Initiation delay and jitter. We have not observed any effectsof gas mixture on initiation delay or jitter as reported by Yiand Williams [37]. In all cases, the streamer initiation jitterwas limited to less than 10 ns. This can probably be attributedto our electrode holder geometry, which induces more fieldenhancement at the tip, our fast voltage rise times and ourovervolted gaps. The protrusion-plane electrode of Yi andWilliams has a tip radius of about 100 µm and protrudes only
10 mm from a plane. Our tip has a radius of about 15 µm and ismounted in an elongated holder (see figure 1). Van Veldhuizenand Rutgers [42] have shown that such a difference in geometryof the holder and tip can have a large influence on streamerinitiation and propagation. Therefore, initiation was alwaysfast in our case and we did not observe differences betweenthe gas mixtures.
3.2. Feather-like structures
Figure 7 shows images from similar discharges as in figure 5 butnow zoomed to the region closest to the anode tip. The zoomingis achieved by moving the camera closer to the experiment. Weomitted images from pure oxygen and from artificial air. Theformer is omitted because it is hardly visible, for the latter weunfortunately do not have any zoomed measurement imagesavailable at 200 mbar and voltages between 10 and 15 kV. We
9
J. Phys. D: Appl. Phys. 43 (2010) 145204 S Nijdam et al
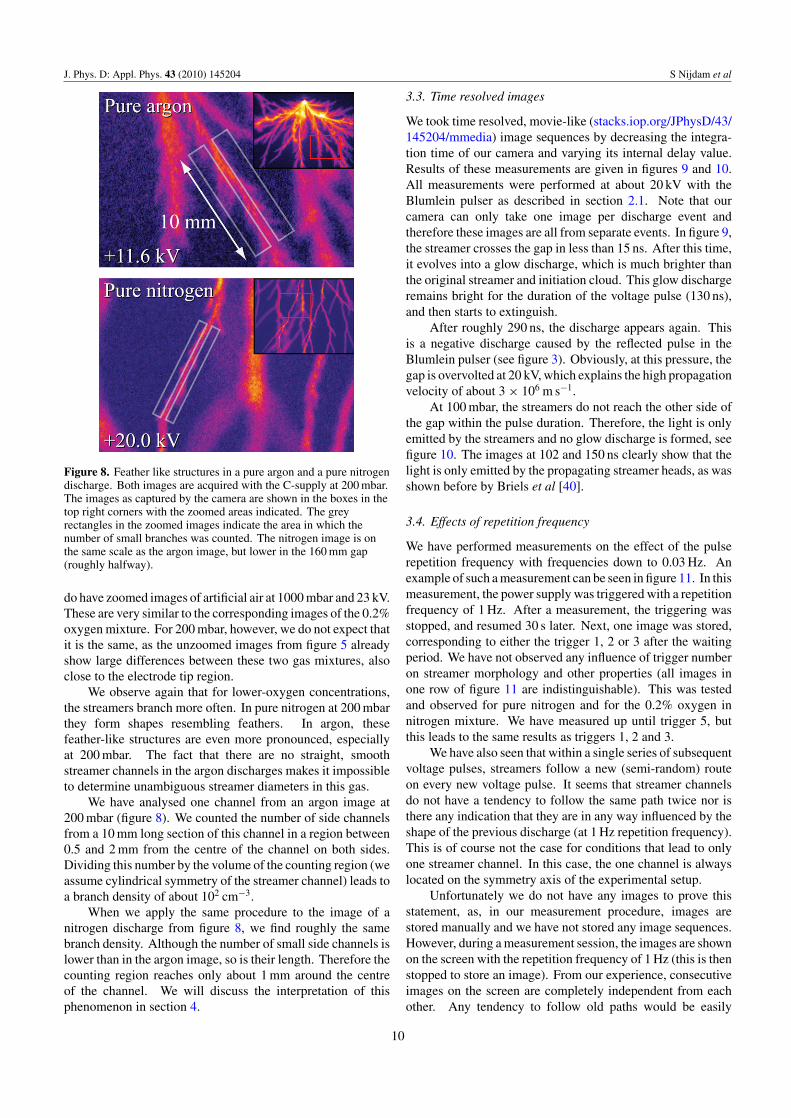
Figure 8. Feather like structures in a pure argon and a pure nitrogendischarge. Both images are acquired with the C-supply at 200 mbar.The images as captured by the camera are shown in the boxes in thetop right corners with the zoomed areas indicated. The greyrectangles in the zoomed images indicate the area in which thenumber of small branches was counted. The nitrogen image is onthe same scale as the argon image, but lower in the 160 mm gap(roughly halfway).
do have zoomed images of artificial air at 1000 mbar and 23 kV.These are very similar to the corresponding images of the 0.2%oxygen mixture. For 200 mbar, however, we do not expect thatit is the same, as the unzoomed images from figure 5 alreadyshow large differences between these two gas mixtures, alsoclose to the electrode tip region.
We observe again that for lower-oxygen concentrations,the streamers branch more often. In pure nitrogen at 200 mbarthey form shapes resembling feathers. In argon, thesefeather-like structures are even more pronounced, especiallyat 200 mbar. The fact that there are no straight, smoothstreamer channels in the argon discharges makes it impossibleto determine unambiguous streamer diameters in this gas.
We have analysed one channel from an argon image at200 mbar (figure 8). We counted the number of side channelsfrom a 10 mm long section of this channel in a region between0.5 and 2 mm from the centre of the channel on both sides.Dividing this number by the volume of the counting region (weassume cylindrical symmetry of the streamer channel) leads toa branch density of about 102 cm−3.
When we apply the same procedure to the image of anitrogen discharge from figure 8, we find roughly the samebranch density. Although the number of small side channels islower than in the argon image, so is their length. Therefore thecounting region reaches only about 1 mm around the centreof the channel. We will discuss the interpretation of thisphenomenon in section 4.
3.3. Time resolved images
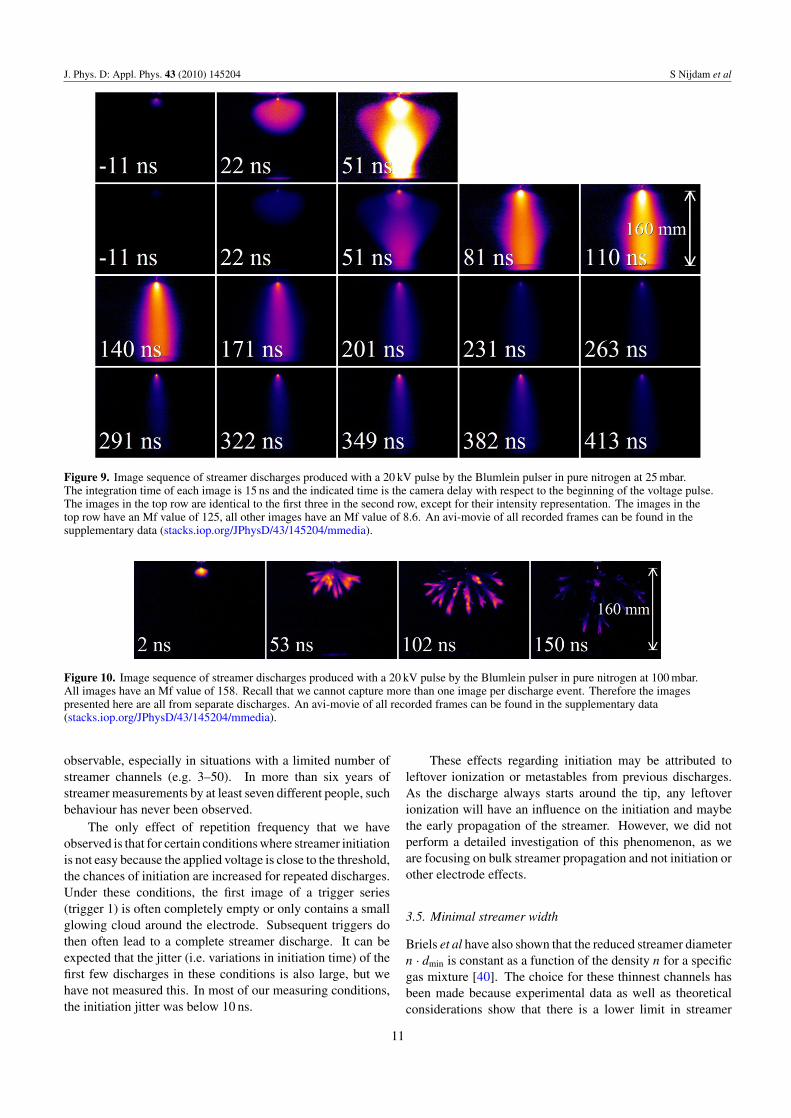
We took time resolved, movie-like (stacks.iop.org/JPhysD/43/145204/mmedia) image sequences by decreasing the integra-tion time of our camera and varying its internal delay value.Results of these measurements are given in figures 9 and 10.All measurements were performed at about 20 kV with theBlumlein pulser as described in section 2.1. Note that ourcamera can only take one image per discharge event andtherefore these images are all from separate events. In figure 9,the streamer crosses the gap in less than 15 ns. After this time,it evolves into a glow discharge, which is much brighter thanthe original streamer and initiation cloud. This glow dischargeremains bright for the duration of the voltage pulse (130 ns),and then starts to extinguish.
After roughly 290 ns, the discharge appears again. Thisis a negative discharge caused by the reflected pulse in theBlumlein pulser (see figure 3). Obviously, at this pressure, thegap is overvolted at 20 kV, which explains the high propagationvelocity of about 3 × 10⁶ m s−1.
At 100 mbar, the streamers do not reach the other side ofthe gap within the pulse duration. Therefore, the light is onlyemitted by the streamers and no glow discharge is formed, seefigure 10. The images at 102 and 150 ns clearly show that thelight is only emitted by the propagating streamer heads, as wasshown before by Briels et al [40].
3.4. Effects of repetition frequency
We have performed measurements on the effect of the pulserepetition frequency with frequencies down to 0.03 Hz. Anexample of such a measurement can be seen in figure 11. In thismeasurement, the power supply was triggered with a repetitionfrequency of 1 Hz. After a measurement, the triggering wasstopped, and resumed 30 s later. Next, one image was stored,corresponding to either the trigger 1, 2 or 3 after the waitingperiod. We have not observed any influence of trigger numberon streamer morphology and other properties (all images inone row of figure 11 are indistinguishable). This was testedand observed for pure nitrogen and for the 0.2% oxygen innitrogen mixture. We have measured up until trigger 5, butthis leads to the same results as triggers 1, 2 and 3.
We have also seen that within a single series of subsequentvoltage pulses, streamers follow a new (semi-random) routeon every new voltage pulse. It seems that streamer channelsdo not have a tendency to follow the same path twice nor isthere any indication that they are in any way influenced by theshape of the previous discharge (at 1 Hz repetition frequency).This is of course not the case for conditions that lead to onlyone streamer channel. In this case, the one channel is alwayslocated on the symmetry axis of the experimental setup.
Unfortunately we do not have any images to prove thisstatement, as, in our measurement procedure, images arestored manually and we have not stored any image sequences.However, during a measurement session, the images are shownon the screen with the repetition frequency of 1 Hz (this is thenstopped to store an image). From our experience, consecutiveimages on the screen are completely independent from eachother. Any tendency to follow old paths would be easily
10
J. Phys. D: Appl. Phys. 43 (2010) 145204 S Nijdam et al
Figure 9. Image sequence of streamer discharges produced with a 20 kV pulse by the Blumlein pulser in pure nitrogen at 25 mbar.The integration time of each image is 15 ns and the indicated time is the camera delay with respect to the beginning of the voltage pulse.The images in the top row are identical to the first three in the second row, except for their intensity representation. The images in thetop row have an Mf value of 125, all other images have an Mf value of 8.6. An avi-movie of all recorded frames can be found in thesupplementary data (stacks.iop.org/JPhysD/43/145204/mmedia).
Figure 10. Image sequence of streamer discharges produced with a 20 kV pulse by the Blumlein pulser in pure nitrogen at 100 mbar.All images have an Mf value of 158. Recall that we cannot capture more than one image per discharge event. Therefore the imagespresented here are all from separate discharges. An avi-movie of all recorded frames can be found in the supplementary data(stacks.iop.org/JPhysD/43/145204/mmedia).
observable, especially in situations with a limited number ofstreamer channels (e.g. 3–50). In more than six years ofstreamer measurements by at least seven different people, suchbehaviour has never been observed.
The only effect of repetition frequency that we haveobserved is that for certain conditions where streamer initiationis not easy because the applied voltage is close to the threshold,the chances of initiation are increased for repeated discharges.Under these conditions, the first image of a trigger series(trigger 1) is often completely empty or only contains a smallglowing cloud around the electrode. Subsequent triggers dothen often lead to a complete streamer discharge. It can beexpected that the jitter (i.e. variations in initiation time) of thefirst few discharges in these conditions is also large, but wehave not measured this. In most of our measuring conditions,the initiation jitter was below 10 ns.
These effects regarding initiation may be attributed toleftover ionization or metastables from previous discharges.As the discharge always starts around the tip, any leftoverionization will have an influence on the initiation and maybethe early propagation of the streamer. However, we did notperform a detailed investigation of this phenomenon, as weare focusing on bulk streamer propagation and not initiation orother electrode effects.
3.5. Minimal streamer width
Briels et al have also shown that the reduced streamer diametern · dmin is constant as a function of the density n for a specificgas mixture [40]. The choice for these thinnest channels hasbeen made because experimental data as well as theoreticalconsiderations show that there is a lower limit in streamer
11
J. Phys. D: Appl. Phys. 43 (2010) 145204 S Nijdam et al
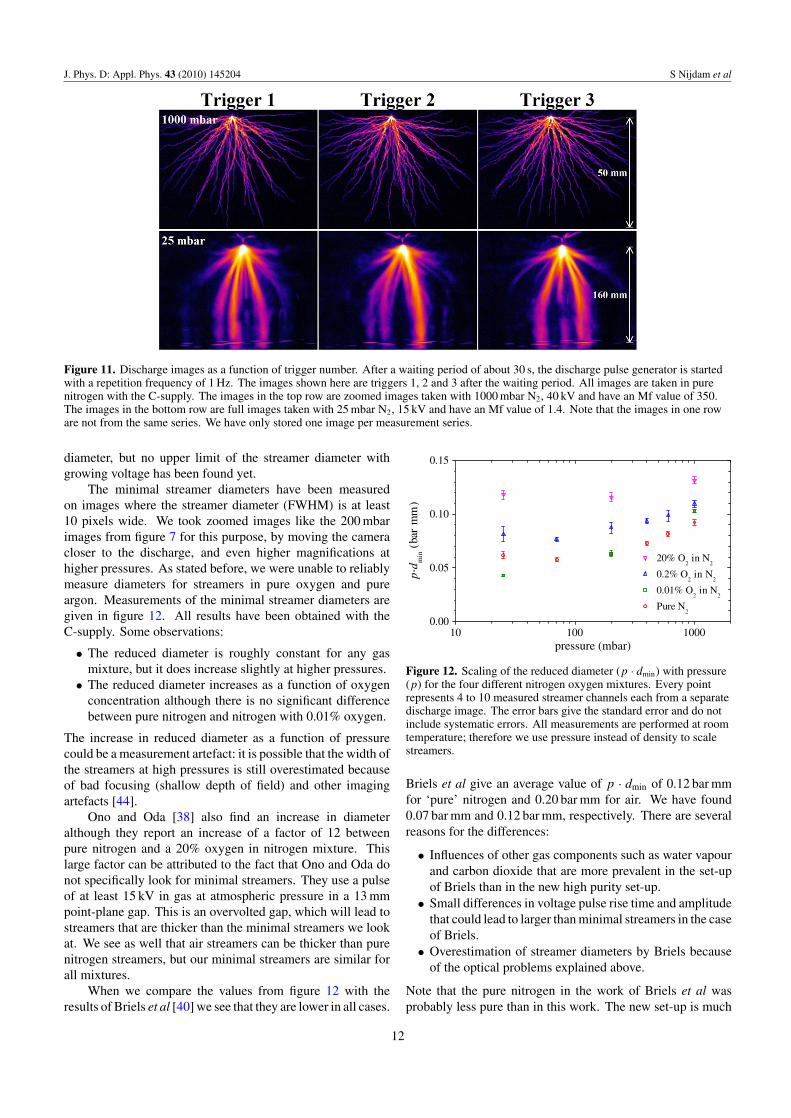
Figure 11. Discharge images as a function of trigger number. After a waiting period of about 30 s, the discharge pulse generator is startedwith a repetition frequency of 1 Hz. The images shown here are triggers 1, 2 and 3 after the waiting period. All images are taken in purenitrogen with the C-supply. The images in the top row are zoomed images taken with 1000 mbar N2, 40 kV and have an Mf value of 350.The images in the bottom row are full images taken with 25 mbar N2, 15 kV and have an Mf value of 1.4. Note that the images in one roware not from the same series. We have only stored one image per measurement series.
diameter, but no upper limit of the streamer diameter withgrowing voltage has been found yet.
The minimal streamer diameters have been measuredon images where the streamer diameter (FWHM) is at least10 pixels wide. We took zoomed images like the 200 mbarimages from figure 7 for this purpose, by moving the cameracloser to the discharge, and even higher magnifications athigher pressures. As stated before, we were unable to reliablymeasure diameters for streamers in pure oxygen and pureargon. Measurements of the minimal streamer diameters aregiven in figure 12. All results have been obtained with theC-supply. Some observations:
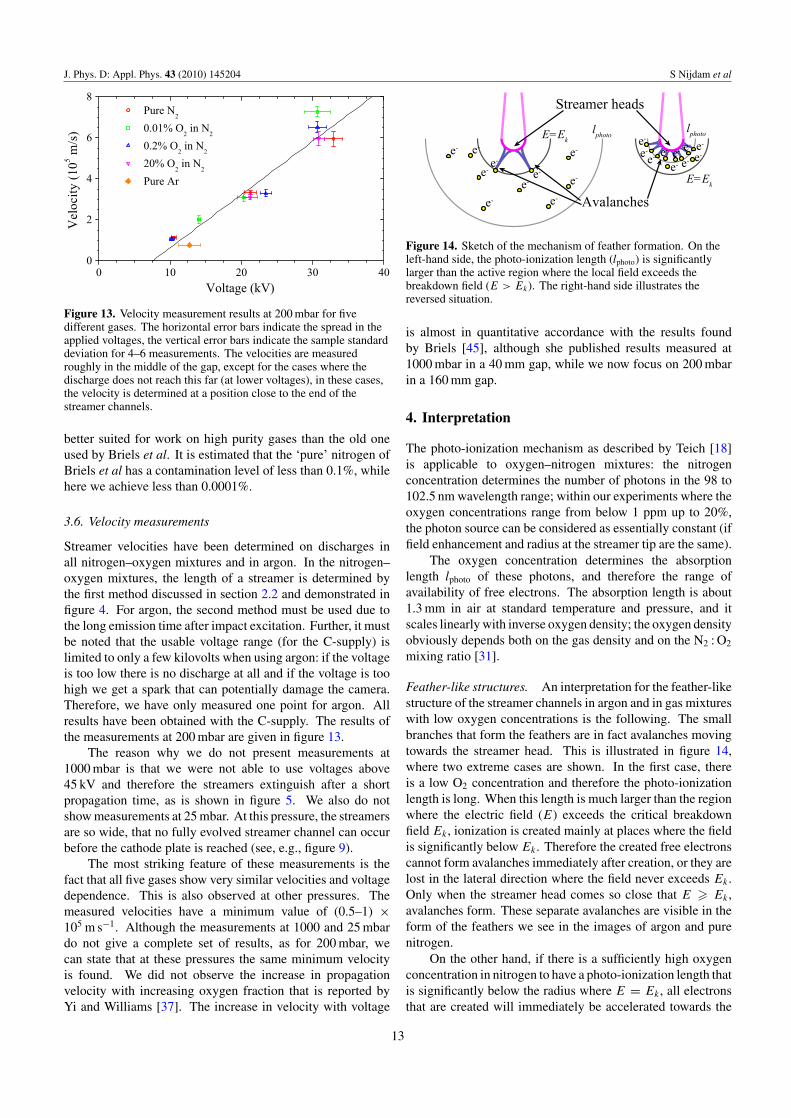
• The reduced diameter is roughly constant for any gasmixture, but it does increase slightly at higher pressures.
• The reduced diameter increases as a function of oxygenconcentration although there is no significant differencebetween pure nitrogen and nitrogen with 0.01% oxygen.
The increase in reduced diameter as a function of pressurecould be a measurement artefact: it is possible that the width ofthe streamers at high pressures is still overestimated becauseof bad focusing (shallow depth of field) and other imagingartefacts [44].
Ono and Oda [38] also find an increase in diameteralthough they report an increase of a factor of 12 betweenpure nitrogen and a 20% oxygen in nitrogen mixture. Thislarge factor can be attributed to the fact that Ono and Oda donot specifically look for minimal streamers. They use a pulseof at least 15 kV in gas at atmospheric pressure in a 13 mmpoint-plane gap. This is an overvolted gap, which will lead tostreamers that are thicker than the minimal streamers we lookat. We see as well that air streamers can be thicker than purenitrogen streamers, but our minimal streamers are similar forall mixtures.
When we compare the values from figure 12 with theresults of Briels et al [40] we see that they are lower in all cases.
10 100 10000.00
0.05
0.10
0.15
20% O2 in N
2
0.2% O2 in N
2
0.01% O2 in N
2
Pure N2
p·d m
in (
bar
mm
)
pressure (mbar)
Figure 12. Scaling of the reduced diameter (p · dmin) with pressure(p) for the four different nitrogen oxygen mixtures. Every pointrepresents 4 to 10 measured streamer channels each from a separatedischarge image. The error bars give the standard error and do notinclude systematic errors. All measurements are performed at roomtemperature; therefore we use pressure instead of density to scalestreamers.
Briels et al give an average value of p · dmin of 0.12 bar mmfor ‘pure’ nitrogen and 0.20 bar mm for air. We have found0.07 bar mm and 0.12 bar mm, respectively. There are severalreasons for the differences:
• Influences of other gas components such as water vapourand carbon dioxide that are more prevalent in the set-upof Briels than in the new high purity set-up.
• Small differences in voltage pulse rise time and amplitudethat could lead to larger than minimal streamers in the caseof Briels.
• Overestimation of streamer diameters by Briels becauseof the optical problems explained above.
Note that the pure nitrogen in the work of Briels et al wasprobably less pure than in this work. The new set-up is much
12
J. Phys. D: Appl. Phys. 43 (2010) 145204 S Nijdam et al
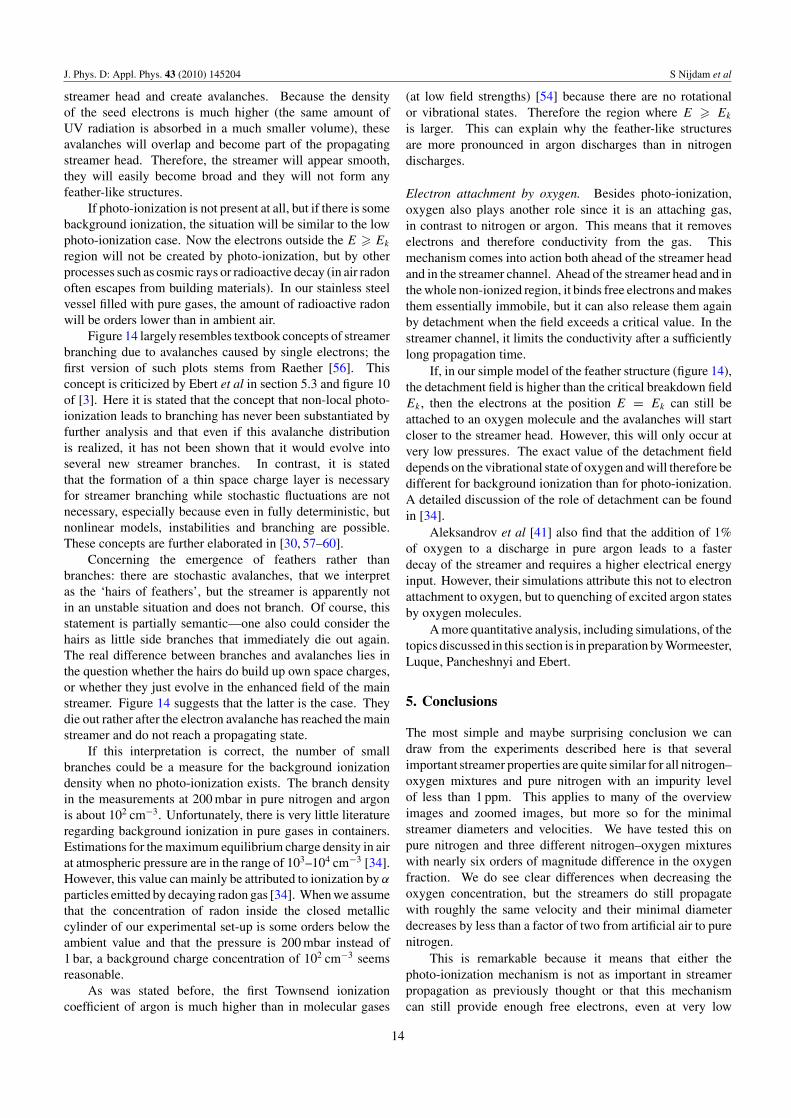
Figure 13. Velocity measurement results at 200 mbar for fivedifferent gases. The horizontal error bars indicate the spread in theapplied voltages, the vertical error bars indicate the sample standarddeviation for 4–6 measurements. The velocities are measuredroughly in the middle of the gap, except for the cases where thedischarge does not reach this far (at lower voltages), in these cases,the velocity is determined at a position close to the end of thestreamer channels.
better suited for work on high purity gases than the old oneused by Briels et al. It is estimated that the ‘pure’ nitrogen ofBriels et al has a contamination level of less than 0.1%, whilehere we achieve less than 0.0001%.
3.6. Velocity measurements
Streamer velocities have been determined on discharges inall nitrogen–oxygen mixtures and in argon. In the nitrogen–oxygen mixtures, the length of a streamer is determined bythe first method discussed in section 2.2 and demonstrated infigure 4. For argon, the second method must be used due tothe long emission time after impact excitation. Further, it mustbe noted that the usable voltage range (for the C-supply) islimited to only a few kilovolts when using argon: if the voltageis too low there is no discharge at all and if the voltage is toohigh we get a spark that can potentially damage the camera.Therefore, we have only measured one point for argon. Allresults have been obtained with the C-supply. The results ofthe measurements at 200 mbar are given in figure 13.
The reason why we do not present measurements at1000 mbar is that we were not able to use voltages above45 kV and therefore the streamers extinguish after a shortpropagation time, as is shown in figure 5. We also do notshow measurements at 25 mbar. At this pressure, the streamersare so wide, that no fully evolved streamer channel can occurbefore the cathode plate is reached (see, e.g., figure 9).
The most striking feature of these measurements is thefact that all five gases show very similar velocities and voltagedependence. This is also observed at other pressures. Themeasured velocities have a minimum value of (0.5–1) ×105 m s−1. Although the measurements at 1000 and 25 mbardo not give a complete set of results, as for 200 mbar, wecan state that at these pressures the same minimum velocityis found. We did not observe the increase in propagationvelocity with increasing oxygen fraction that is reported byYi and Williams [37]. The increase in velocity with voltage
e-
e-
e-
e-
e-e-
e-
e-
e-
e-
E=Ek
e- e-
e-
e-e-e-
e-
e-
e-
e-
E=Ek
lphotol
photo
Streamer heads
Avalanches
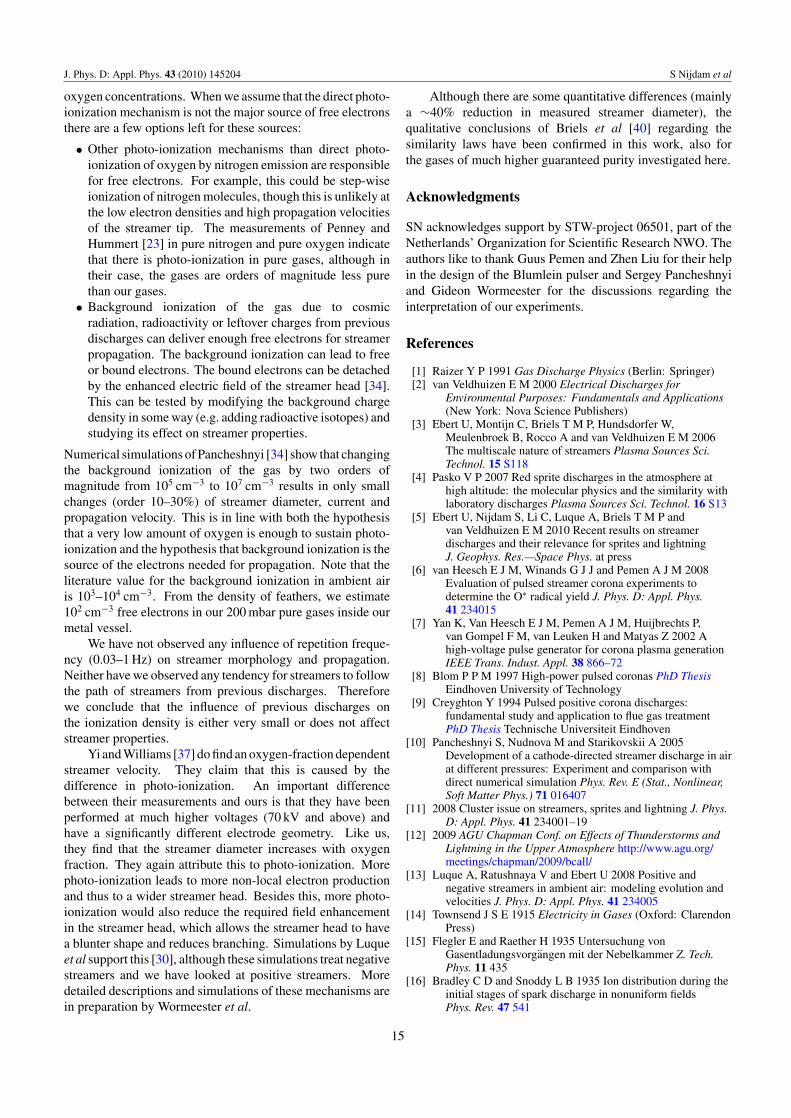
Figure 14. Sketch of the mechanism of feather formation. On theleft-hand side, the photo-ionization length (lphoto) is significantlylarger than the active region where the local field exceeds thebreakdown field (E > Ek). The right-hand side illustrates thereversed situation.
is almost in quantitative accordance with the results foundby Briels [45], although she published results measured at1000 mbar in a 40 mm gap, while we now focus on 200 mbarin a 160 mm gap.
4. Interpretation
The photo-ionization mechanism as described by Teich [18]is applicable to oxygen–nitrogen mixtures: the nitrogenconcentration determines the number of photons in the 98 to102.5 nm wavelength range; within our experiments where theoxygen concentrations range from below 1 ppm up to 20%,the photon source can be considered as essentially constant (iffield enhancement and radius at the streamer tip are the same).
The oxygen concentration determines the absorptionlength lphoto of these photons, and therefore the range ofavailability of free electrons. The absorption length is about1.3 mm in air at standard temperature and pressure, and itscales linearly with inverse oxygen density; the oxygen densityobviously depends both on the gas density and on the N2 : O2
mixing ratio [31].
Feather-like structures. An interpretation for the feather-likestructure of the streamer channels in argon and in gas mixtureswith low oxygen concentrations is the following. The smallbranches that form the feathers are in fact avalanches movingtowards the streamer head. This is illustrated in figure 14,where two extreme cases are shown. In the first case, thereis a low O2 concentration and therefore the photo-ionizationlength is long. When this length is much larger than the regionwhere the electric field (E) exceeds the critical breakdownfield Ek , ionization is created mainly at places where the fieldis significantly below Ek . Therefore the created free electronscannot form avalanches immediately after creation, or they arelost in the lateral direction where the field never exceeds Ek .Only when the streamer head comes so close that E Ek ,avalanches form. These separate avalanches are visible in theform of the feathers we see in the images of argon and purenitrogen.
On the other hand, if there is a sufficiently high oxygenconcentration in nitrogen to have a photo-ionization length thatis significantly below the radius where E = Ek , all electronsthat are created will immediately be accelerated towards the
13
J. Phys. D: Appl. Phys. 43 (2010) 145204 S Nijdam et al
streamer head and create avalanches. Because the densityof the seed electrons is much higher (the same amount ofUV radiation is absorbed in a much smaller volume), theseavalanches will overlap and become part of the propagatingstreamer head. Therefore, the streamer will appear smooth,they will easily become broad and they will not form anyfeather-like structures.
If photo-ionization is not present at all, but if there is somebackground ionization, the situation will be similar to the lowphoto-ionization case. Now the electrons outside the E Ek
region will not be created by photo-ionization, but by otherprocesses such as cosmic rays or radioactive decay (in air radonoften escapes from building materials). In our stainless steelvessel filled with pure gases, the amount of radioactive radonwill be orders lower than in ambient air.
Figure 14 largely resembles textbook concepts of streamerbranching due to avalanches caused by single electrons; thefirst version of such plots stems from Raether [56]. Thisconcept is criticized by Ebert et al in section 5.3 and figure 10of [3]. Here it is stated that the concept that non-local photo-ionization leads to branching has never been substantiated byfurther analysis and that even if this avalanche distributionis realized, it has not been shown that it would evolve intoseveral new streamer branches. In contrast, it is statedthat the formation of a thin space charge layer is necessaryfor streamer branching while stochastic fluctuations are notnecessary, especially because even in fully deterministic, butnonlinear models, instabilities and branching are possible.These concepts are further elaborated in [30, 57–60].
Concerning the emergence of feathers rather thanbranches: there are stochastic avalanches, that we interpretas the ‘hairs of feathers’, but the streamer is apparently notin an unstable situation and does not branch. Of course, thisstatement is partially semantic—one also could consider thehairs as little side branches that immediately die out again.The real difference between branches and avalanches lies inthe question whether the hairs do build up own space charges,or whether they just evolve in the enhanced field of the mainstreamer. Figure 14 suggests that the latter is the case. Theydie out rather after the electron avalanche has reached the mainstreamer and do not reach a propagating state.
If this interpretation is correct, the number of smallbranches could be a measure for the background ionizationdensity when no photo-ionization exists. The branch densityin the measurements at 200 mbar in pure nitrogen and argonis about 102 cm−3. Unfortunately, there is very little literatureregarding background ionization in pure gases in containers.Estimations for the maximum equilibrium charge density in airat atmospheric pressure are in the range of 103–104 cm−3 [34].However, this value can mainly be attributed to ionization by α
particles emitted by decaying radon gas [34]. When we assumethat the concentration of radon inside the closed metalliccylinder of our experimental set-up is some orders below theambient value and that the pressure is 200 mbar instead of1 bar, a background charge concentration of 102 cm−3 seemsreasonable.
As was stated before, the first Townsend ionizationcoefficient of argon is much higher than in molecular gases
(at low field strengths) [54] because there are no rotationalor vibrational states. Therefore the region where E Ek
is larger. This can explain why the feather-like structuresare more pronounced in argon discharges than in nitrogendischarges.
Electron attachment by oxygen. Besides photo-ionization,oxygen also plays another role since it is an attaching gas,in contrast to nitrogen or argon. This means that it removeselectrons and therefore conductivity from the gas. Thismechanism comes into action both ahead of the streamer headand in the streamer channel. Ahead of the streamer head and inthe whole non-ionized region, it binds free electrons and makesthem essentially immobile, but it can also release them againby detachment when the field exceeds a critical value. In thestreamer channel, it limits the conductivity after a sufficientlylong propagation time.
If, in our simple model of the feather structure (figure 14),the detachment field is higher than the critical breakdown fieldEk , then the electrons at the position E = Ek can still beattached to an oxygen molecule and the avalanches will startcloser to the streamer head. However, this will only occur atvery low pressures. The exact value of the detachment fielddepends on the vibrational state of oxygen and will therefore bedifferent for background ionization than for photo-ionization.A detailed discussion of the role of detachment can be foundin [34].
Aleksandrov et al [41] also find that the addition of 1%of oxygen to a discharge in pure argon leads to a fasterdecay of the streamer and requires a higher electrical energyinput. However, their simulations attribute this not to electronattachment to oxygen, but to quenching of excited argon statesby oxygen molecules.
A more quantitative analysis, including simulations, of thetopics discussed in this section is in preparation by Wormeester,Luque, Pancheshnyi and Ebert.
5. Conclusions
The most simple and maybe surprising conclusion we candraw from the experiments described here is that severalimportant streamer properties are quite similar for all nitrogen–oxygen mixtures and pure nitrogen with an impurity levelof less than 1 ppm. This applies to many of the overviewimages and zoomed images, but more so for the minimalstreamer diameters and velocities. We have tested this onpure nitrogen and three different nitrogen–oxygen mixtureswith nearly six orders of magnitude difference in the oxygenfraction. We do see clear differences when decreasing theoxygen concentration, but the streamers do still propagatewith roughly the same velocity and their minimal diameterdecreases by less than a factor of two from artificial air to purenitrogen.
This is remarkable because it means that either thephoto-ionization mechanism is not as important in streamerpropagation as previously thought or that this mechanismcan still provide enough free electrons, even at very low
14
J. Phys. D: Appl. Phys. 43 (2010) 145204 S Nijdam et al
oxygen concentrations. When we assume that the direct photo-ionization mechanism is not the major source of free electronsthere are a few options left for these sources:
• Other photo-ionization mechanisms than direct photo-ionization of oxygen by nitrogen emission are responsiblefor free electrons. For example, this could be step-wiseionization of nitrogen molecules, though this is unlikely atthe low electron densities and high propagation velocitiesof the streamer tip. The measurements of Penney andHummert [23] in pure nitrogen and pure oxygen indicatethat there is photo-ionization in pure gases, although intheir case, the gases are orders of magnitude less purethan our gases.
• Background ionization of the gas due to cosmicradiation, radioactivity or leftover charges from previousdischarges can deliver enough free electrons for streamerpropagation. The background ionization can lead to freeor bound electrons. The bound electrons can be detachedby the enhanced electric field of the streamer head [34].This can be tested by modifying the background chargedensity in some way (e.g. adding radioactive isotopes) andstudying its effect on streamer properties.
Numerical simulations of Pancheshnyi [34] show that changingthe background ionization of the gas by two orders ofmagnitude from 105 cm−3 to 107 cm−3 results in only smallchanges (order 10–30%) of streamer diameter, current andpropagation velocity. This is in line with both the hypothesisthat a very low amount of oxygen is enough to sustain photo-ionization and the hypothesis that background ionization is thesource of the electrons needed for propagation. Note that theliterature value for the background ionization in ambient airis 103–104 cm−3. From the density of feathers, we estimate102 cm−3 free electrons in our 200 mbar pure gases inside ourmetal vessel.
We have not observed any influence of repetition freque-ncy (0.03–1 Hz) on streamer morphology and propagation.Neither have we observed any tendency for streamers to followthe path of streamers from previous discharges. Thereforewe conclude that the influence of previous discharges onthe ionization density is either very small or does not affectstreamer properties.
Yi and Williams [37] do find an oxygen-fraction dependentstreamer velocity. They claim that this is caused by thedifference in photo-ionization. An important differencebetween their measurements and ours is that they have beenperformed at much higher voltages (70 kV and above) andhave a significantly different electrode geometry. Like us,they find that the streamer diameter increases with oxygenfraction. They again attribute this to photo-ionization. Morephoto-ionization leads to more non-local electron productionand thus to a wider streamer head. Besides this, more photo-ionization would also reduce the required field enhancementin the streamer head, which allows the streamer head to havea blunter shape and reduces branching. Simulations by Luqueet al support this [30], although these simulations treat negativestreamers and we have looked at positive streamers. Moredetailed descriptions and simulations of these mechanisms arein preparation by Wormeester et al.
Although there are some quantitative differences (mainlya ∼40% reduction in measured streamer diameter), thequalitative conclusions of Briels et al [40] regarding thesimilarity laws have been confirmed in this work, also forthe gases of much higher guaranteed purity investigated here.
Acknowledgments
SN acknowledges support by STW-project 06501, part of theNetherlands’ Organization for Scientific Research NWO. Theauthors like to thank Guus Pemen and Zhen Liu for their helpin the design of the Blumlein pulser and Sergey Pancheshnyiand Gideon Wormeester for the discussions regarding theinterpretation of our experiments.
References
[1] Raizer Y P 1991 Gas Discharge Physics (Berlin: Springer)[2] van Veldhuizen E M 2000 Electrical Discharges for
Environmental Purposes: Fundamentals and Applications(New York: Nova Science Publishers)
[3] Ebert U, Montijn C, Briels T M P, Hundsdorfer W,Meulenbroek B, Rocco A and van Veldhuizen E M 2006The multiscale nature of streamers Plasma Sources Sci.Technol. 15 S118
[4] Pasko V P 2007 Red sprite discharges in the atmosphere athigh altitude: the molecular physics and the similarity withlaboratory discharges Plasma Sources Sci. Technol. 16 S13
[5] Ebert U, Nijdam S, Li C, Luque A, Briels T M P andvan Veldhuizen E M 2010 Recent results on streamerdischarges and their relevance for sprites and lightningJ. Geophys. Res.—Space Phys. at press
[6] van Heesch E J M, Winands G J J and Pemen A J M 2008Evaluation of pulsed streamer corona experiments todetermine the O∗ radical yield J. Phys. D: Appl. Phys.41 234015
[7] Yan K, Van Heesch E J M, Pemen A J M, Huijbrechts P,van Gompel F M, van Leuken H and Matyas Z 2002 Ahigh-voltage pulse generator for corona plasma generationIEEE Trans. Indust. Appl. 38 866–72
[8] Blom P P M 1997 High-power pulsed coronas PhD ThesisEindhoven University of Technology
[9] Creyghton Y 1994 Pulsed positive corona discharges:fundamental study and application to flue gas treatmentPhD Thesis Technische Universiteit Eindhoven
[10] Pancheshnyi S, Nudnova M and Starikovskii A 2005Development of a cathode-directed streamer discharge in airat different pressures: Experiment and comparison withdirect numerical simulation Phys. Rev. E (Stat., Nonlinear,Soft Matter Phys.) 71 016407
[11] 2008 Cluster issue on streamers, sprites and lightning J. Phys.D: Appl. Phys. 41 234001–19
[12] 2009 AGU Chapman Conf. on Effects of Thunderstorms andLightning in the Upper Atmosphere http://www.agu.org/meetings/chapman/2009/bcall/
[13] Luque A, Ratushnaya V and Ebert U 2008 Positive andnegative streamers in ambient air: modeling evolution andvelocities J. Phys. D: Appl. Phys. 41 234005
[14] Townsend J S E 1915 Electricity in Gases (Oxford: ClarendonPress)
[15] Flegler E and Raether H 1935 Untersuchung vonGasentladungsvorgangen mit der Nebelkammer Z. Tech.Phys. 11 435
[16] Bradley C D and Snoddy L B 1935 Ion distribution during theinitial stages of spark discharge in nonuniform fieldsPhys. Rev. 47 541
15
J. Phys. D: Appl. Phys. 43 (2010) 145204 S Nijdam et al
[17] Cravath A M 1935 Photoelectric effect and spark mechanismPhys. Rev. 47 254 (abstract for APS december meeting)
[18] Teich T H 1967 Emission gasionisierender Strahlung ausElektronenlawinen: I. Messanordnung und Messverfahren.Messungen in Sauerstoff Z. Phys. 199 378–94
[19] Teich T H 1967 Emission gasionisierender Strahlung ausElektronenlawinen: II. Messungen in O2–He-Gemischen,Daempfen, CO2 und Luft; Datenzusammenstellung Z. Phys.199 395–410
[20] Loeb L B 1936 The problem of the mechanism of static sparkdischarge Rev. Mod. Phys. 8 267
[21] Raether H 1938 Uber eine gasionisierende strahlung einerfunkenentladung Z. Phys. 110 611
[22] Przybylski A 1958 Untersuchung uber die ‘gasionisierende’Strahlung einer Entladung Z. Phys. 151 264
[23] Penney G W and Hummert G T 1970 Photoionizationmeasurements in air, oxygen, and nitrogen J. Appl. Phys.41 572
[24] Aints M, Haljaste A, Plank T and Roots L 2008 Absorption ofPhoto-Ionizing radiation of corona discharges in air PlasmaProcess. Polym. 5 672–80
[25] Zhelezniak M B, Mnatsakanian A K H and Sizykh S V 1982Photoionization of nitrogen and oxygen mixtures byradiation from a gas discharge High Temp. 20 357
[26] Morrow R and Lowke J J 1997 Streamer propagation in airJ. Phys. D: Appl. Phys. 30 614
[27] Kulikovsky A A 2000 The role of photoionization inpositive streamer dynamics J. Phys. D: Appl. Phys.33 1514–24
[28] Naidis G V 2006 On photoionization produced by dischargesin air Plasma Sources Sci. Technol. 15 253–5
[29] Bourdon A, Pasko V P, Liu N Y, Celestin S, Segur P andMarode E 2007 Efficient models for photoionizationproduced by non-thermal gas discharges in air based onradiative transfer and the helmholtz equations PlasmaSources Sci. Technol. 16 656
[30] Luque A, Ebert U, Montijn C and Hundsdorfer W 2007Photoionization in negative streamers: fast computationsand two propagation modes Appl. Phys. Lett. 90 081501
[31] Luque A, Ebert U and Hundsdorfer W 2008 Interaction ofstreamer discharges in air and other oxygen–nitrogenmixtures Phys. Rev. Lett. 101 075005
[32] Nudnova M M and Starikovskii A Y 2008 Streamer headstructure: role of ionization and photoionization J. Phys. D:Appl. Phys. 41 234003
[33] Dhali S K and Williams P F 1987 Two-dimensional studies ofstreamers in gases J. Appl. Phys. 62 4696–707
[34] Pancheshnyi S 2005 Role of electronegative gas admixtures instreamer start, propagation and branching phenomenaPlasma Sources Sci. Technol. 14 645
[35] Nijdam S, Geurts C G C, van Veldhuizen E M and Ebert U2009 Reconnection and merging of positive streamers in airJ. Phys. D: Appl. Phys. 42 045201
[36] Kashiwagi Y and Itoh H 2006 Positive surface streamers byVUV J. Phys. D: Appl. Phys. 39 113–8
[37] Yi W J and Williams P F 2002 Experimental study ofstreamers in pure N2 and N2/O2 mixtures and a ≈13 cm gapJ. Phys. D: Appl. Phys. 35 205–18
[38] Ono R and Oda T 2003 Formation and structure of primaryand secondary streamers in positive pulsed coronadischarge—effect of oxygen concentration and appliedvoltage J. Phys. D: Appl. Phys. 36 1952–8
[39] Briels T M P, van Veldhuizen E M and Ebert U 2008 Positivestreamers in ambient air and a N2 : O2-mixture (99.8: 0.2)IEEE Trans. Plasma. Sci. 36 906–7
[40] Briels T M P, van Veldhuizen E M and Ebert U 2008Positive streamers in air and nitrogen of varying density:
experiments on similarity laws J. Phys. D: Appl. Phys.41 234008
[41] Aleksandrov N L, Bazelyan E M and Novitskii G A 2001The effect of small O2 addition on the properties of along positive streamer in Ar J. Phys. D: Appl. Phys.34 1374–8
[42] van Veldhuizen E M and Rutgers W R 2002 Pulsed positivecorona streamer propagation and branching J. Phys. D:Appl. Phys. 35 2169
[43] Dubrovin D, Nijdam S, van Veldhuizen E M, Ebert U, Yair Yand Price C 2010 Sprite discharges on Venus andJupiter-like planets: a laboratory investigation J. Geophys.Res.-Space Phys. at press
[44] Briels T M P, Kos J, van Veldhuizen E M and Ebert U 2006Circuit dependence of the diameter of pulsed positivestreamers in air J. Phys. D: Appl. Phys. 39 5201
[45] Briels T M P, Kos J, Winands G J J, van Veldhuizen E M andEbert U 2008 Positive and negative streamers in ambientair: measuring diameter, velocity and dissipated energy.J. Phys. D: Appl. Phys. 41 234004
[46] Smith P W 2002 Transient Electronics: Pulsed CircuitTechnology (Chichester: Wiley)
[47] Liu Z, Yan K, Winands G J J, Van Heesch E J M andPemen A J M 2006 Novel multiple-switch blumleingenerator Rev. Sci. Instrum. 77 033502
[48] Liu Z, Yan K, Winands G J J, Pemen A J M, Van Heesch E J Mand Pawelek D B 2006 Multiple-gap spark gap switch Rev.Sci. Instrum. 77 073501
[49] Nijdam S, Moerman J S, Briels T M P, van Veldhuizen E Mand Ebert U 2008 Stereo-photography of streamers in airAppl. Phys. Lett. 92 101502
[50] Winands G J J, Liu Z, Pemen A J M, van Heesch E J M andYan K 2008 Analysis of streamer properties in air asfunction of pulse and reactor parameters by iccdphotography J. Phys. D: Appl. Phys. 41 234001
[51] Briels T M P, van Veldhuizen E M and Ebert U 2008 Timeresolved measurements of streamer inception in air IEEETrans. Plasma. Sci. 36 908–9
[52] Blom P P M, Smit C, Lemmens R H P and van Heesch E J M1994 Combined Optical and Electrical Measurements onPulsed Corona Discharges Gaseous Dielectrics vol 7ed L G Christophorou and D R James (New York: Plenum)
[53] Shcherbakov Y V and Sigmond R S 2007 Subnanosecondspectral diagnostics of streamer discharges: I. Basicexperimental results J. Phys. D: Appl. Phys. 40 460
[54] The Siglo Data base, CPAT and Kinema Software. http://www.siglo-kinema.com
[55] Rep’ev A G and Repin P B 2006 Dynamics of the opticalemission from a high-voltage diffuse discharge in arod-plane electrode system in atmospheric-pressure airPlasma Phys. Rep. 32 72–8
[56] Raether H 1939 Die Entwicklung der Elektronenlawine in denFunkenkanal Z. Phys. A Hadrons Nucl. 112 464–89
[57] Montijn C, Ebert U and Hundsdorfer W 2006 Numericalconvergence of the branching time of negative streamersPhys. Rev. E 73 065401
[58] Derks G, Ebert U and Meulenbroek B 2008 Laplacianinstability of planar streamer ionization fronts—an exampleof pulled front analysis J. Nonlinear Sci. 18 551–90
[59] Tanveer S, Schafer L, Brau F and Ebert U 2009 A movingboundary problem motivated by electric breakdown: I.Spectrum of linear perturbations Phys. D: NonlinearPhenom. 238 888–901
[60] Kao C Y, Brau F, Ebert U, Schafer L and Tanveer S 2009 Amoving boundary model motivated by electric breakdown:II. Initial value problem Physica D arXiv:0908.2521submitted
16