Notes: Properties of Solids, Liquids, Gasses, and Kinetic ...-+Units+2...Notes: Properties of...
32
Notes: Properties of Solids, Liquids, Gasses, and Kinetic Theory, 2014, S1 Gasses, Pressure, Kinetic Theory, Temperature, Pressure, Heating Curve, Diffusion
-
Upload
truongkhanh -
Category
Documents
-
view
224 -
download
2
Transcript of Notes: Properties of Solids, Liquids, Gasses, and Kinetic ...-+Units+2...Notes: Properties of...

Notes: Properties of Solids, Liquids, Gasses, and Kinetic
Theory, 2014, S1 Gasses, Pressure, Kinetic Theory,
Temperature, Pressure, Heating Curve, Diffusion
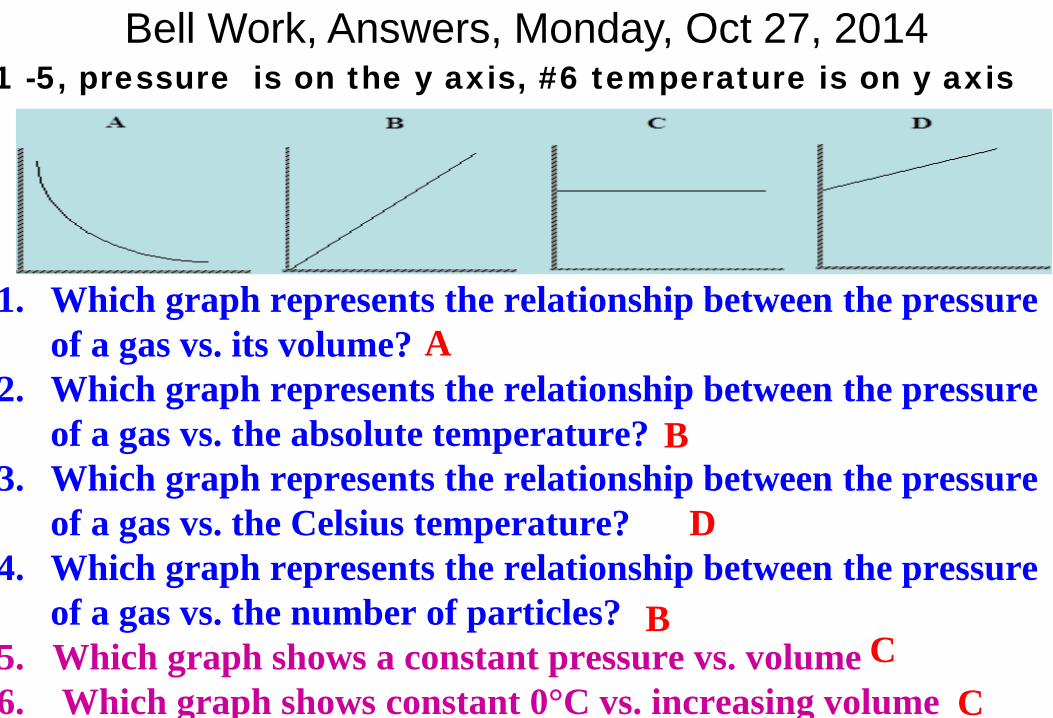
Bell Work, Answers, Monday, Oct 27, 2014
1. Which graph represents the relationship between the pressure of a gas vs. its volume?
2. Which graph represents the relationship between the pressure of a gas vs. the absolute temperature?
3. Which graph represents the relationship between the pressure of a gas vs. the Celsius temperature?
4. Which graph represents the relationship between the pressure of a gas vs. the number of particles?
5. Which graph shows a constant pressure vs. volume 6. Which graph shows constant 0°C vs. increasing volume
1 -5, pressure is on the y axis, #6 temperature is on y axis
A
B
D
B C
C
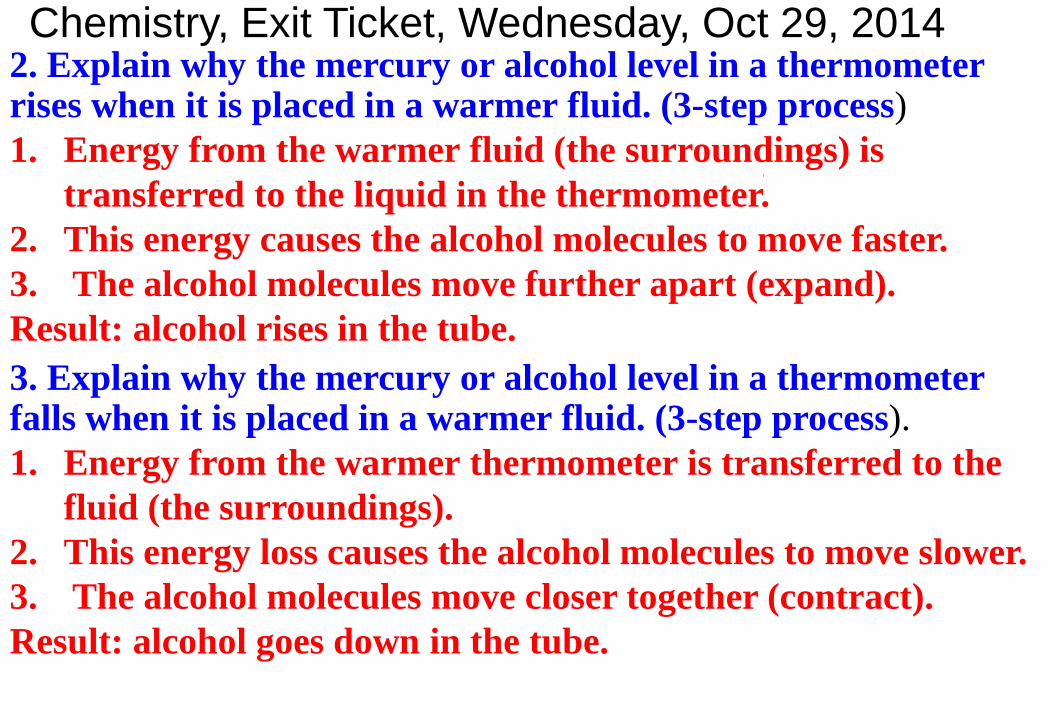
Chemistry, Exit Ticket, Wednesday, Oct 29, 2014 2. Explain why the mercury or alcohol level in a thermometer rises when it is placed in a warmer fluid. (3-step process) 1. Energy from the warmer fluid (the surroundings) is
transferred to the liquid in the thermometer. 2. This energy causes the alcohol molecules to move faster. 3. The alcohol molecules move further apart (expand). Result: alcohol rises in the tube. 3. Explain why the mercury or alcohol level in a thermometer falls when it is placed in a warmer fluid. (3-step process). 1. Energy from the warmer thermometer is transferred to the
fluid (the surroundings). 2. This energy loss causes the alcohol molecules to move slower. 3. The alcohol molecules move closer together (contract). Result: alcohol goes down in the tube.
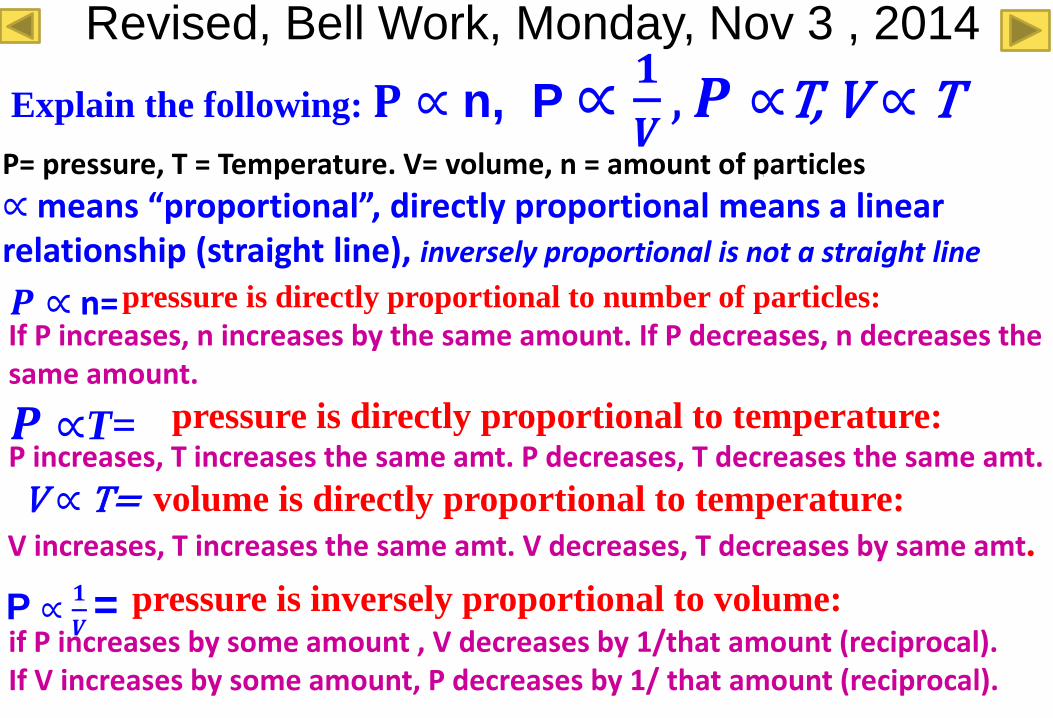
Revised, Bell Work, Monday, Nov 3 , 2014 Explain the following: 𝐏 ∝ n, P ∝ 𝟏
𝑽,𝑷 ∝T, V ∝ T
P= pressure, T = Temperature. V= volume, n = amount of particles ∝ means “proportional”, directly proportional means a linear relationship (straight line), inversely proportional is not a straight line
pressure is directly proportional to number of particles: If P increases, n increases by the same amount. If P decreases, n decreases the same amount. pressure is directly proportional to temperature:
P increases, T increases the same amt. P decreases, T decreases the same amt. volume is directly proportional to temperature:
V increases, T increases the same amt. V decreases, T decreases by same amt. pressure is inversely proportional to volume:
if P increases by some amount , V decreases by 1/that amount (reciprocal). If V increases by some amount, P decreases by 1/ that amount (reciprocal).
𝑷 ∝ n=
𝑷 ∝T=
V ∝ T=
P ∝ 𝟏𝑽
=
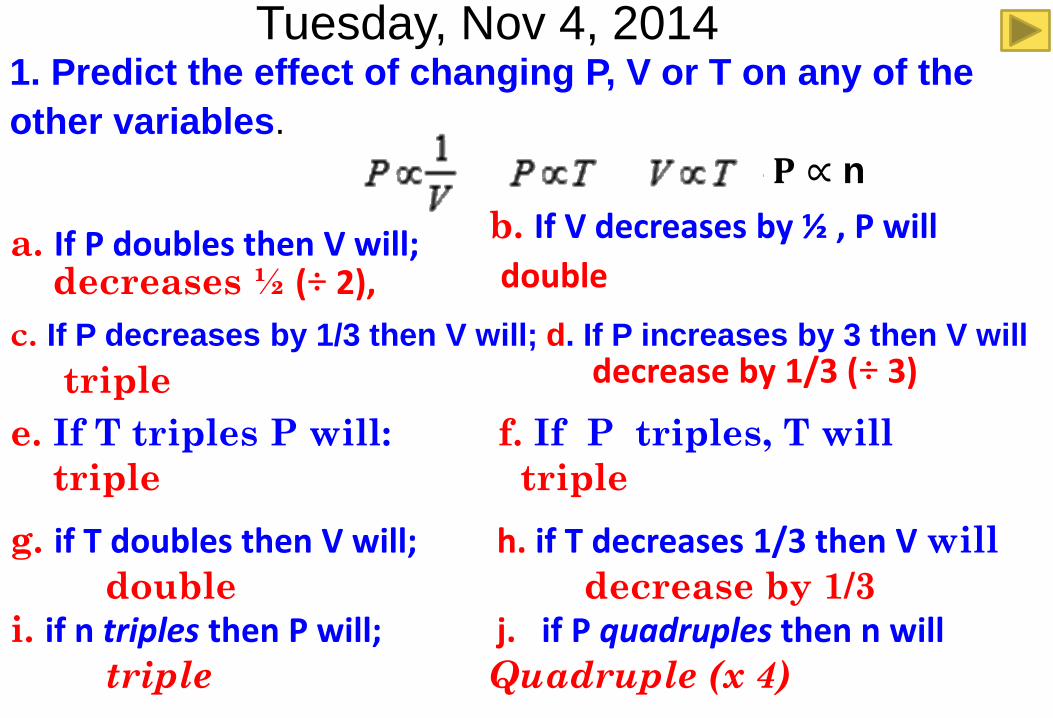
Tuesday, Nov 4, 2014 1. Predict the effect of changing P, V or T on any of the other variables. 𝐏 ∝ n
a. If P doubles then V will; decreases ½ (÷ 2), c. If P decreases by 1/3 then V will; d. If P increases by 3 then V will triple e. If T triples P will: f. If P triples, T will triple triple
g. if T doubles then V will; h. if T decreases 1/3 then V will double decrease by 1/3 i. if n triples then P will; j. if P quadruples then n will triple Quadruple (x 4)
b. If V decreases by ½ , P will double
decrease by 1/3 (÷ 3)
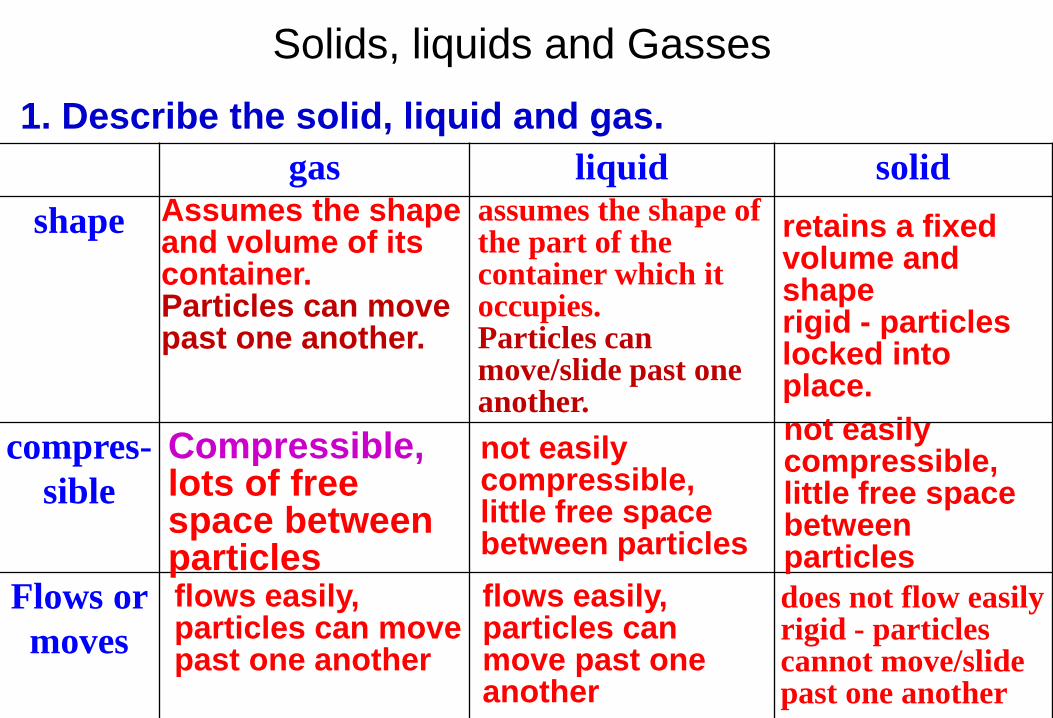
Solids, liquids and Gasses 1. Describe the solid, liquid and gas.
gas liquid solid shape
compres-sible
Flows or moves
Assumes the shape and volume of its container. Particles can move past one another.
assumes the shape of the part of the container which it occupies. Particles can move/slide past one another.
retains a fixed volume and shape rigid - particles locked into place.
Compressible, lots of free space between particles
not easily compressible, little free space between particles
not easily compressible, little free space between particles
flows easily, particles can move past one another
flows easily, particles can move past one another
does not flow easily rigid - particles cannot move/slide past one another
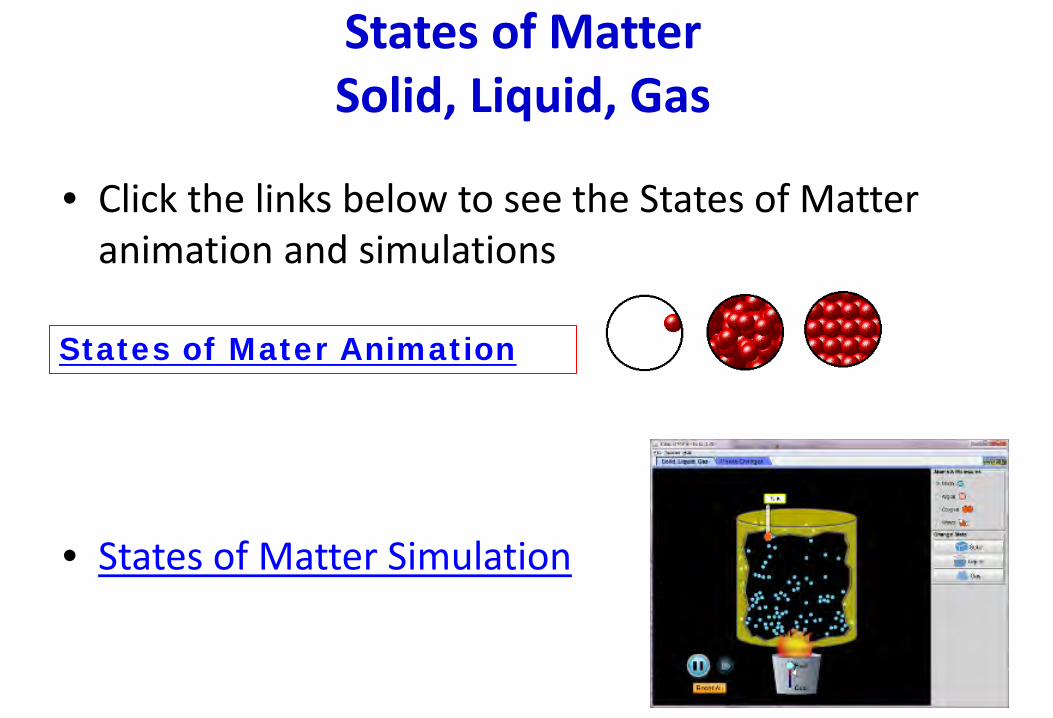
States of Matter Solid, Liquid, Gas
• Click the links below to see the States of Matter animation and simulations
• States of Matter Simulation
States of Mater Animation
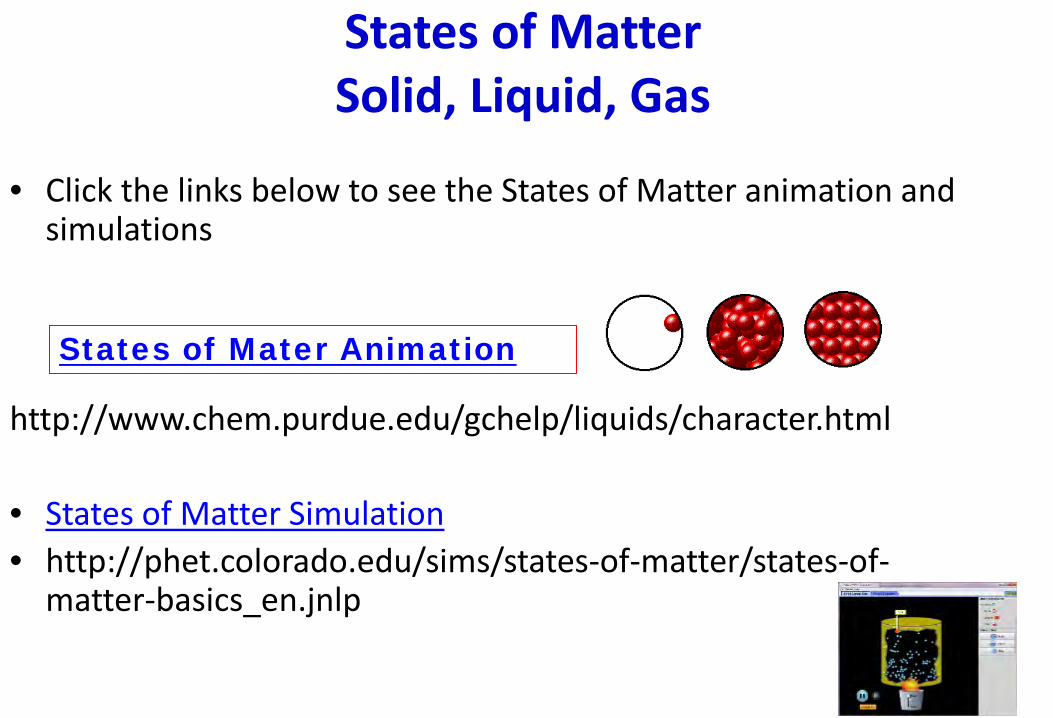
States of Matter Solid, Liquid, Gas
• Click the links below to see the States of Matter animation and simulations
http://www.chem.purdue.edu/gchelp/liquids/character.html • States of Matter Simulation • http://phet.colorado.edu/sims/states-of-matter/states-of-
matter-basics_en.jnlp
States of Mater Animation

States of Water
• Identify the solid, liquid & gas • Remember, ice floats in water • Remember, the less dense item floats!!
liquid solid gas
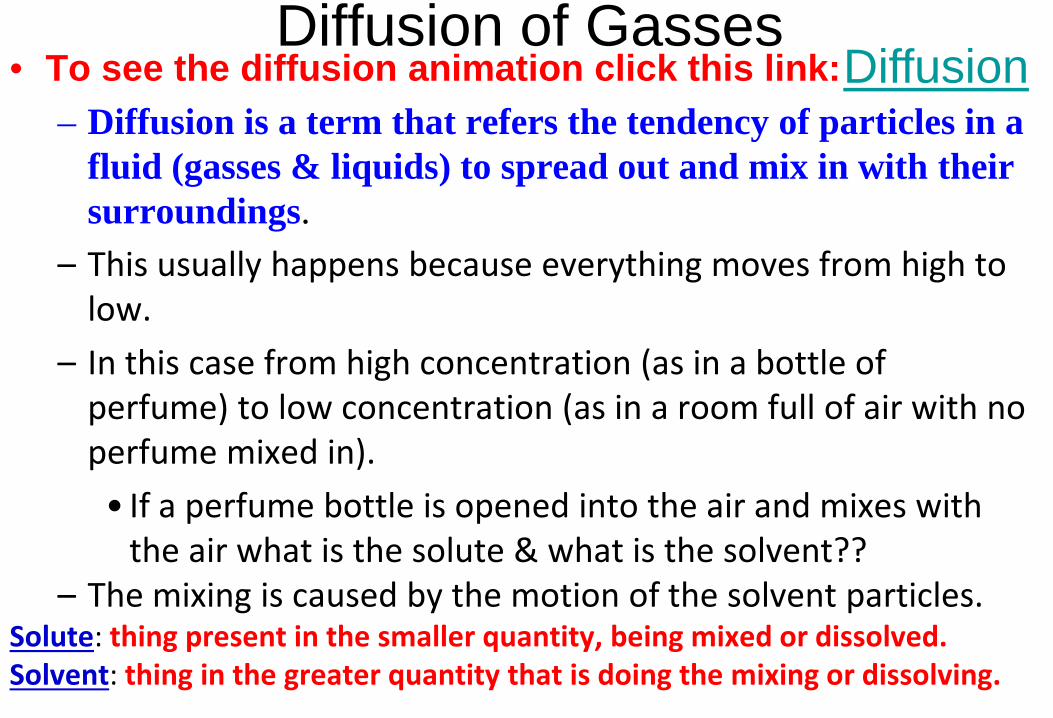
Diffusion of Gasses • To see the diffusion animation click this link:
– Diffusion is a term that refers the tendency of particles in a fluid (gasses & liquids) to spread out and mix in with their surroundings.
– This usually happens because everything moves from high to low.
– In this case from high concentration (as in a bottle of perfume) to low concentration (as in a room full of air with no perfume mixed in). • If a perfume bottle is opened into the air and mixes with
the air what is the solute & what is the solvent?? – The mixing is caused by the motion of the solvent particles.
Solute: thing present in the smaller quantity, being mixed or dissolved. Solvent: thing in the greater quantity that is doing the mixing or dissolving.
Diffusion

Heat and Temperature.
• Temperature = speed of molecules. Faster is hotter, slower is colder.
• Temperature does not depend on mass (how much stuff there is).
• Heat is temperature and mass. Heat depends on the degree of hotness (also called temperature) and how much stuff there is (mass). – A bucket of 50º water has more heat in it than a tea
cup of 100º water.

Pressure 1. Define pressure: the amount of force exerted per unit area
of a surface. Explain why the railroad tanker car was crushed. Clink the link to
see the simulation of pressure, volume and temperature.

Temperature
Alcohol Thermometer
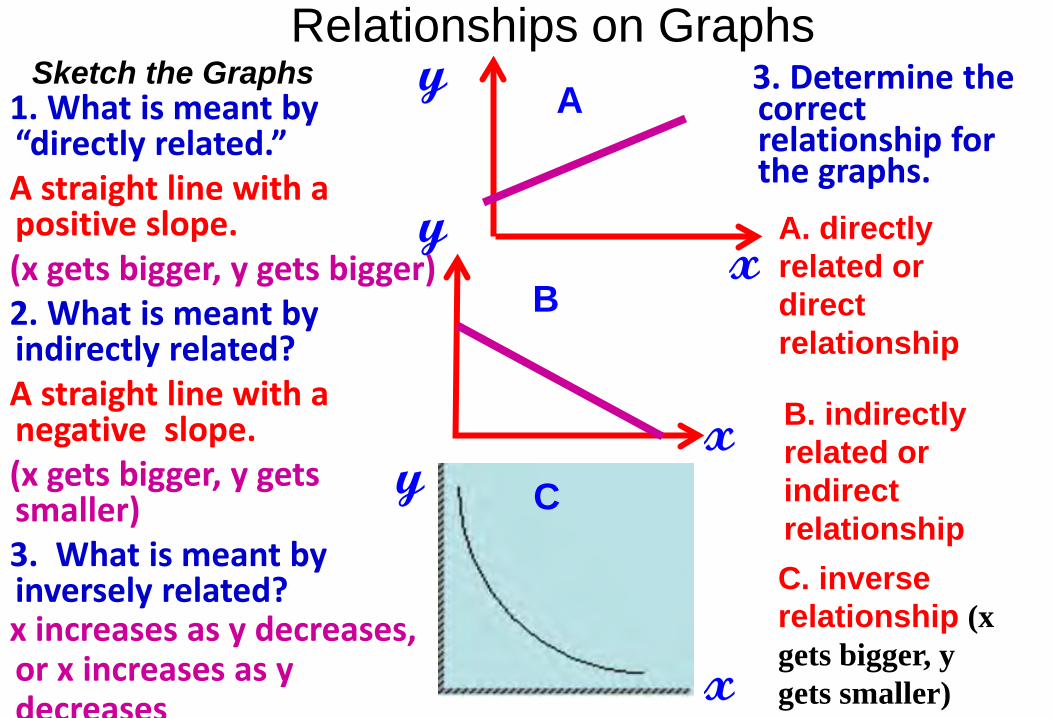
Relationships on Graphs 1. What is meant by “directly related.” A straight line with a positive slope. (x gets bigger, y gets bigger) 2. What is meant by indirectly related? A straight line with a negative slope. (x gets bigger, y gets smaller) 3. What is meant by inversely related? x increases as y decreases, or x increases as y decreases
y
x y
x
A. directly related or direct relationship
B. indirectly related or indirect relationship
Sketch the Graphs
C. inverse relationship (x gets bigger, y gets smaller)
A
B
C y
x
3. Determine the correct relationship for the graphs.
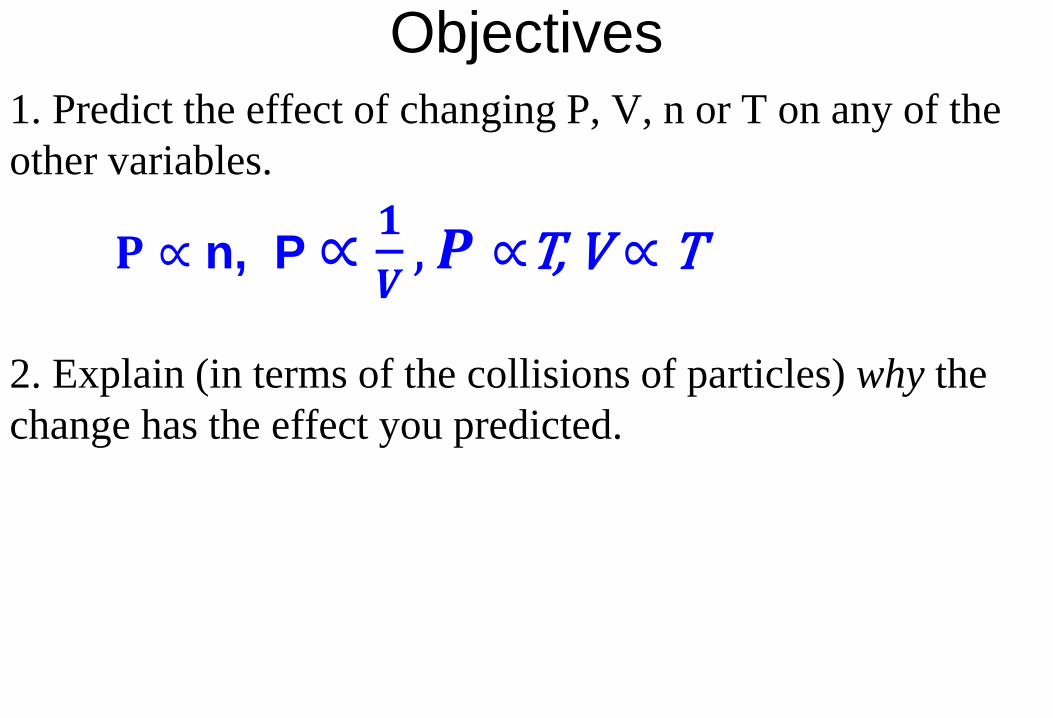
Objectives
1. Predict the effect of changing P, V, n or T on any of the other variables.
𝐏 ∝ n, P ∝ 𝟏𝑽
,𝑷 ∝T, V ∝ T
2. Explain (in terms of the collisions of particles) why the change has the effect you predicted.

Gas Labs
P, V, T, n (# of particles) are related Draw representations of the particles in the box that correspond to the shown positions along the graph. Use “whooshies” to show temperature.
1
2
3
3
2 1
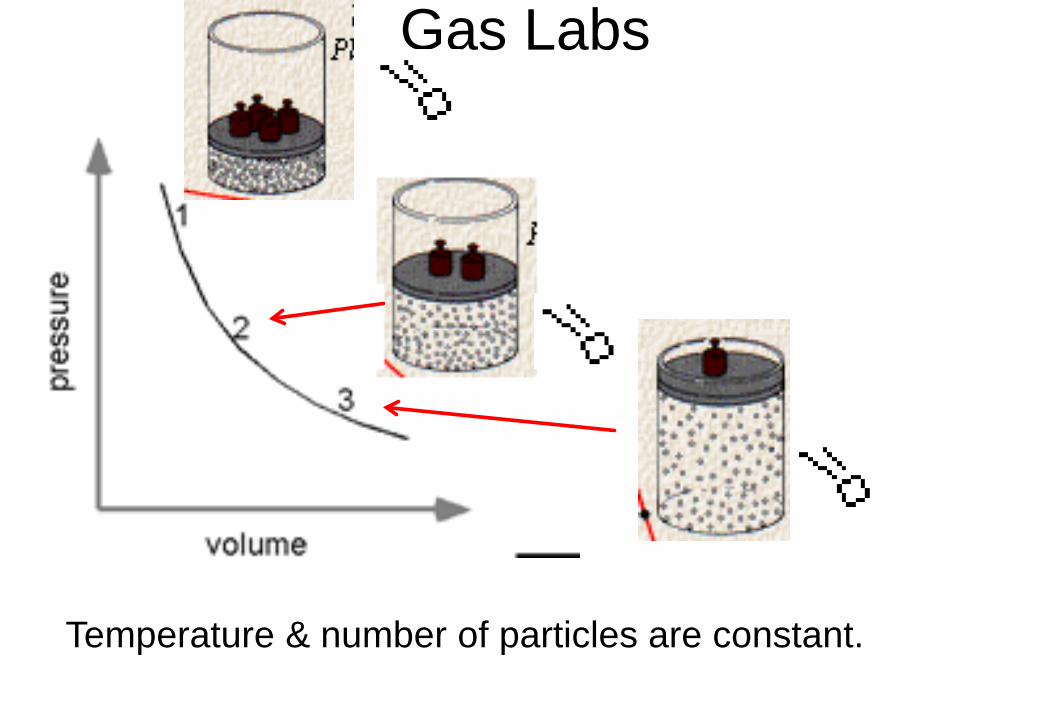
Gas Labs
Temperature & number of particles are constant.

Temperature and volume are constant
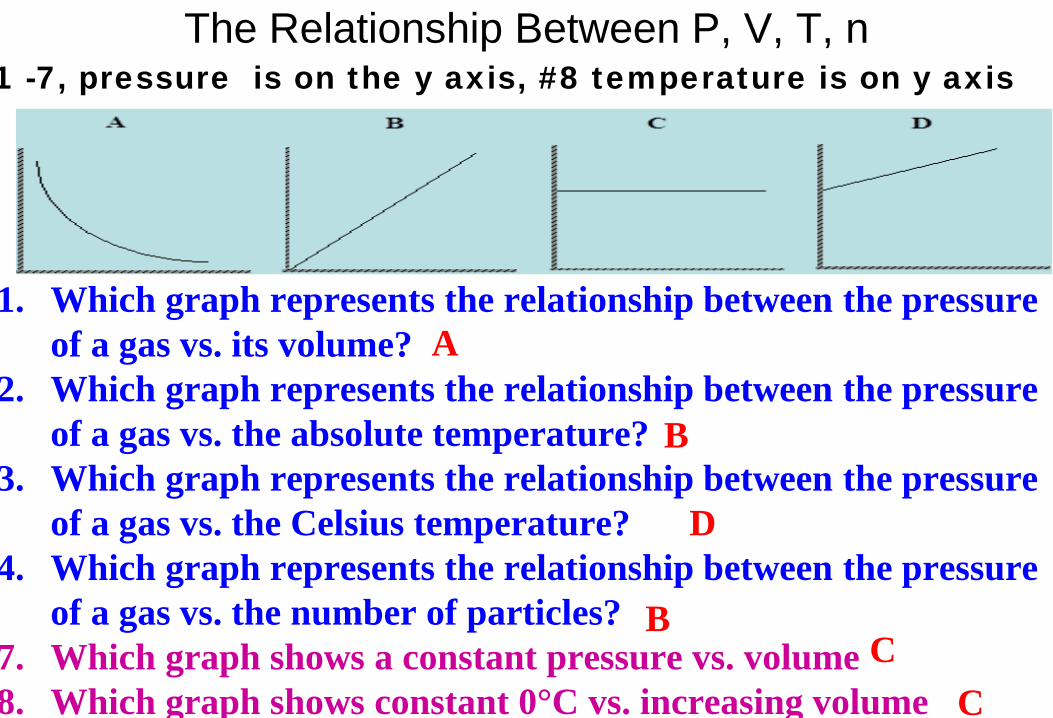
The Relationship Between P, V, T, n
1. Which graph represents the relationship between the pressure of a gas vs. its volume?
2. Which graph represents the relationship between the pressure of a gas vs. the absolute temperature?
3. Which graph represents the relationship between the pressure of a gas vs. the Celsius temperature?
4. Which graph represents the relationship between the pressure of a gas vs. the number of particles?
7. Which graph shows a constant pressure vs. volume 8. Which graph shows constant 0°C vs. increasing volume
1 -7, pressure is on the y axis, #8 temperature is on y axis
A
B
D
B C
C
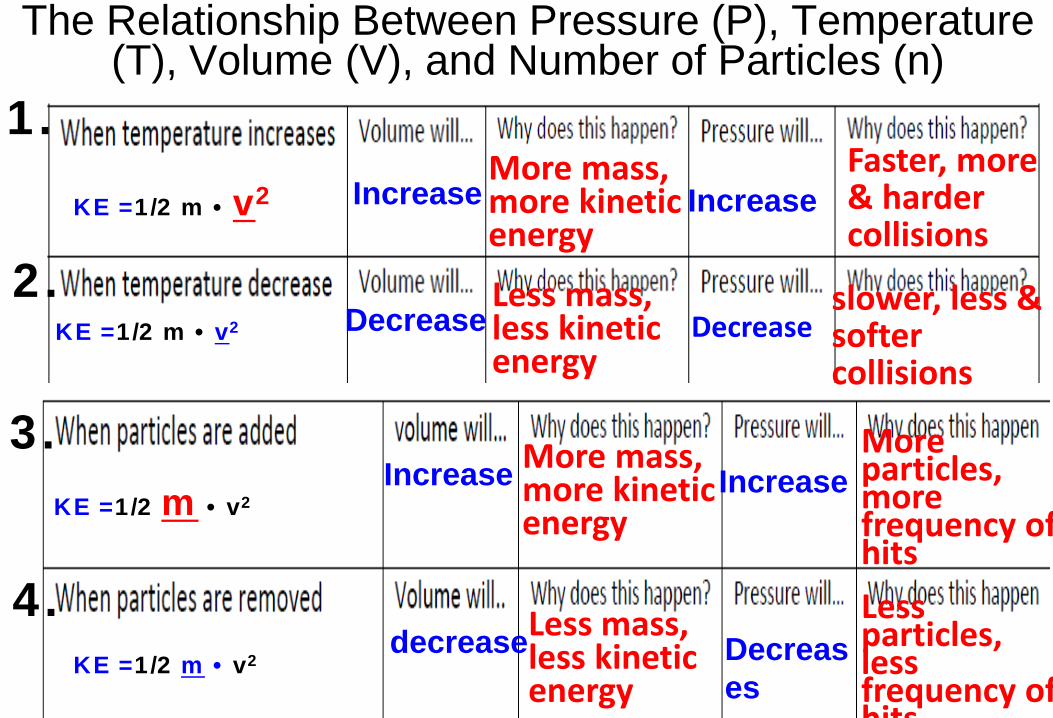
The Relationship Between Pressure (P), Temperature (T), Volume (V), and Number of Particles (n)
1.
2.
3.
4.
More mass, more kinetic energy
Faster, more & harder collisions
Increase Increase
Less mass, less kinetic energy
slower, less & softer collisions
Decrease Decrease
More mass, more kinetic energy
More particles, more frequency of hits
Increase Increase
Less mass, less kinetic energy
Less particles, less frequency of hits
decrease Decreases
KE =1/2 m • v2
KE =1/2 m • v2
KE =1/2 m • v2
KE =1/2 m • v2
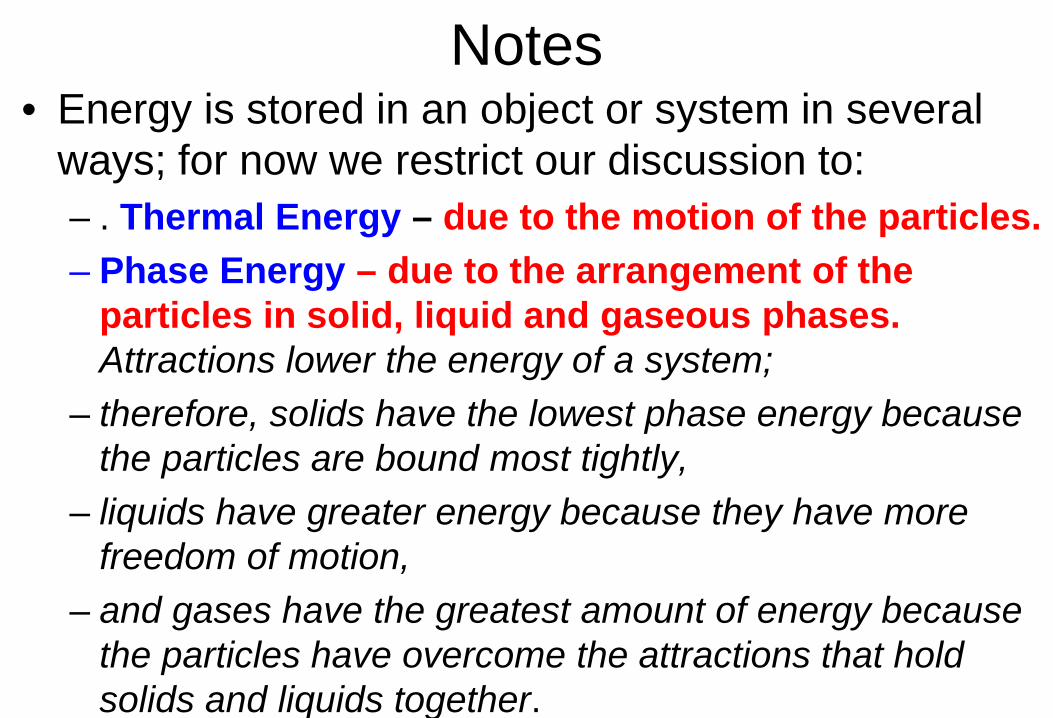
Notes • Energy is stored in an object or system in several
ways; for now we restrict our discussion to: – . Thermal Energy – due to the motion of the particles. – Phase Energy – due to the arrangement of the
particles in solid, liquid and gaseous phases. Attractions lower the energy of a system;
– therefore, solids have the lowest phase energy because the particles are bound most tightly,
– liquids have greater energy because they have more freedom of motion,
– and gases have the greatest amount of energy because the particles have overcome the attractions that hold solids and liquids together.

• Chemistry – Unit 3 Work sheet
11.On the graph above right sketch the curve that describes the following:
a. Initial state: 200 g liquid water at 40 ˚C. b. Final state: half of the water has boiled away at 100˚C.

Energy, Thermal Energy, Phase Energy • Energy •Think of energy as a quantity that is always involved when there is a change in the state of matter. When a substance gets hotter or colder or changes phase, energy is either transferred into or out of the system. The two key ways energy is stored is thermal (due to the motion of the particles) and phase (due to attractions between the particles). • •Remember that attractions lower the energy state, so one must add energy to a system to pull particles apart. The three ways that energy is transferred is by heating (Q), working (W) and radiating (R); this course focuses on Q. •
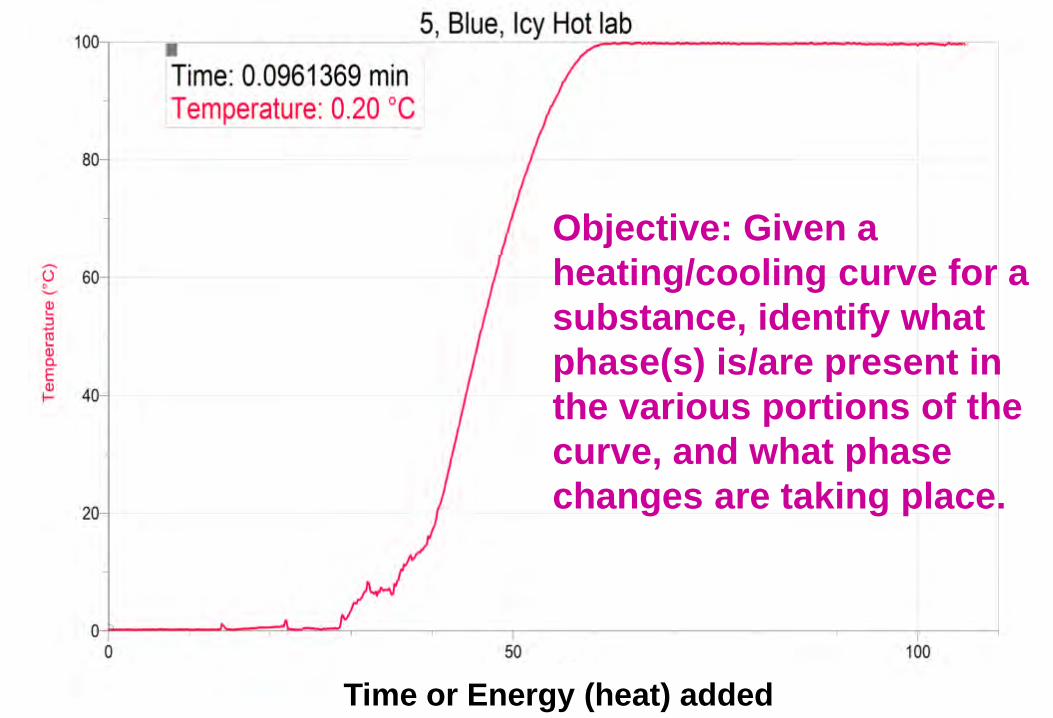
Objective: Given a heating/cooling curve for a substance, identify what phase(s) is/are present in the various portions of the curve, and what phase changes are taking place.
Time or Energy (heat) added

Bell Work Answers, Mon, Nov, 4
a = solid
c = liquid e = gas
11.

Amount of Energy or Time
D
-5 E
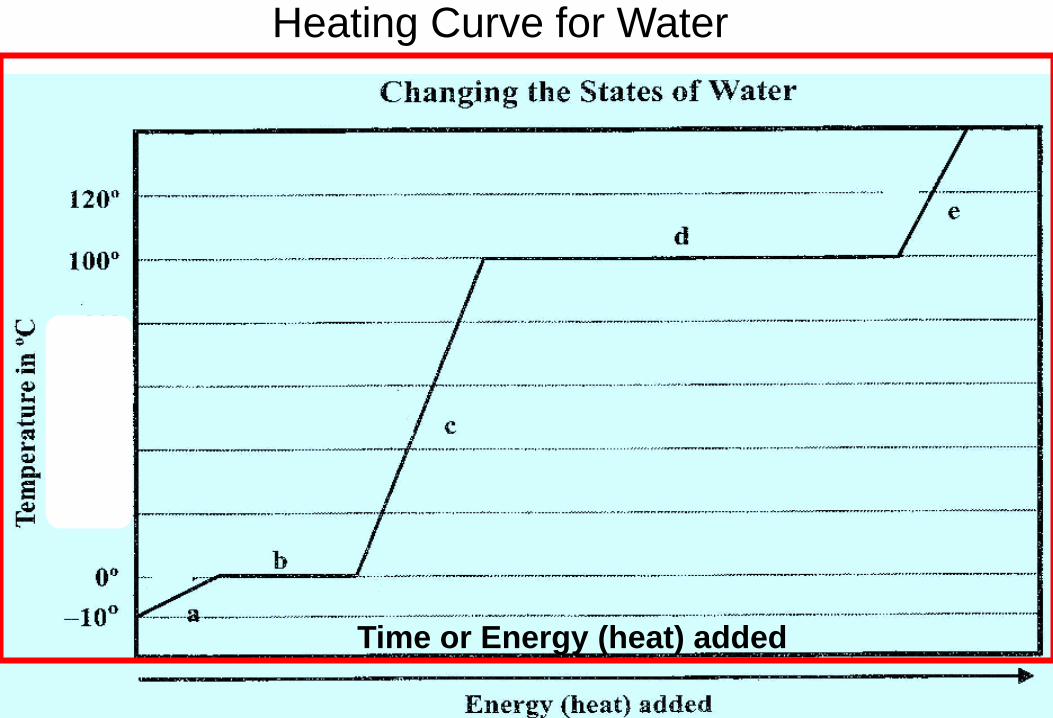
Heating Curve for Water
Time or Energy (heat) added
Heating Curve for Water
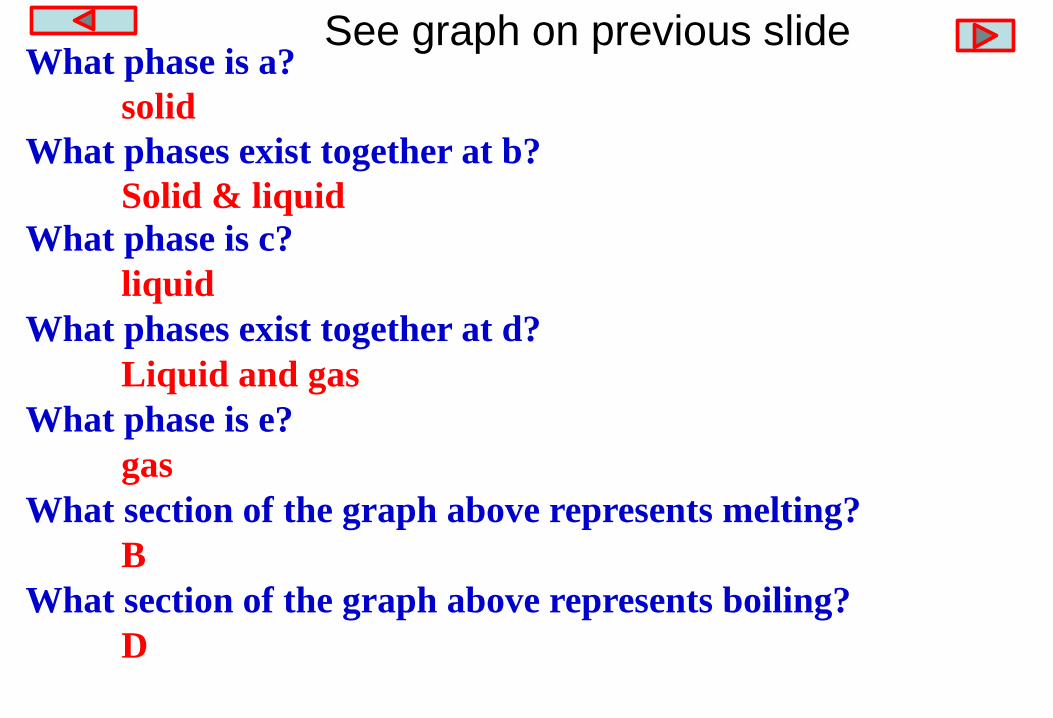
See graph on previous slide What phase is a? solid What phases exist together at b? Solid & liquid What phase is c? liquid What phases exist together at d? Liquid and gas What phase is e? gas What section of the graph above represents melting? B What section of the graph above represents boiling?
D

a = solid
c = liquid e = gas
At b = melting, water & ice (liquid & solid) exist
At d = evaporation , water & vapor (liquid & gas ) exist together.
At d = boiling

Time or Energy (heat) added
Bell Work, Thursday, Nov 6, 2014
Where is phase energy increasing? b, d Where is phase energy staying the same? a, c, e Where is thermal energy increasing?
a, c, e Where is thermal energy staying the same? b, d
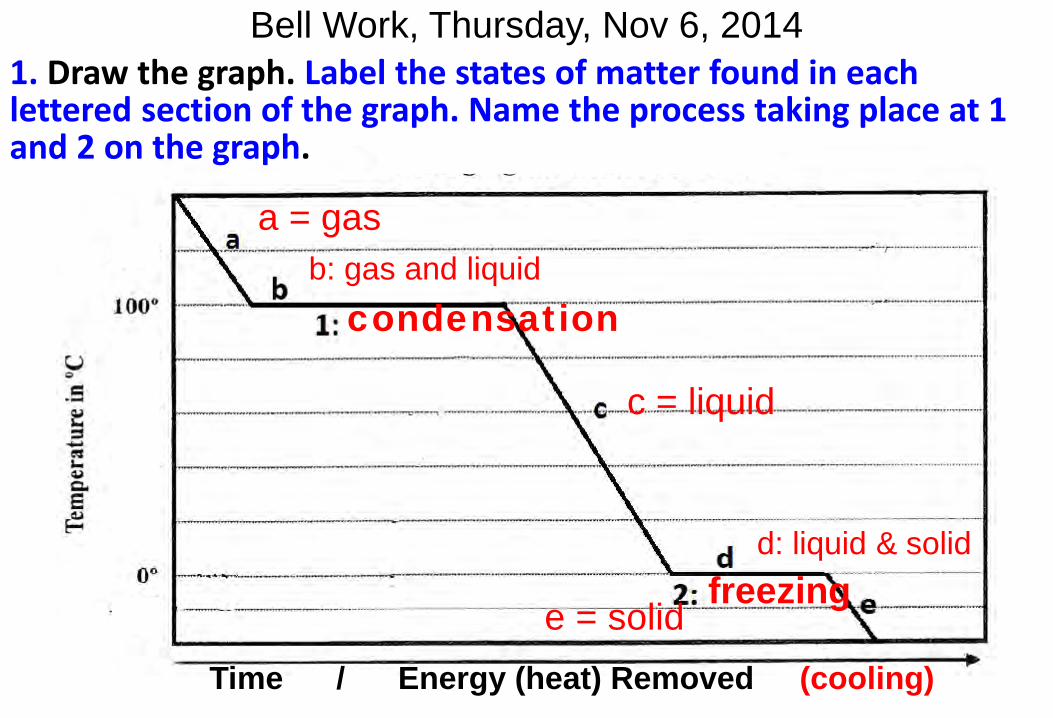
Bell Work, Thursday, Nov 6, 2014
a = gas
c = liquid
e = solid
condensation b: gas and liquid
d: liquid & solid
Time / Energy (heat) Removed (cooling)
1. Draw the graph. Label the states of matter found in each lettered section of the graph. Name the process taking place at 1 and 2 on the graph.
freezing
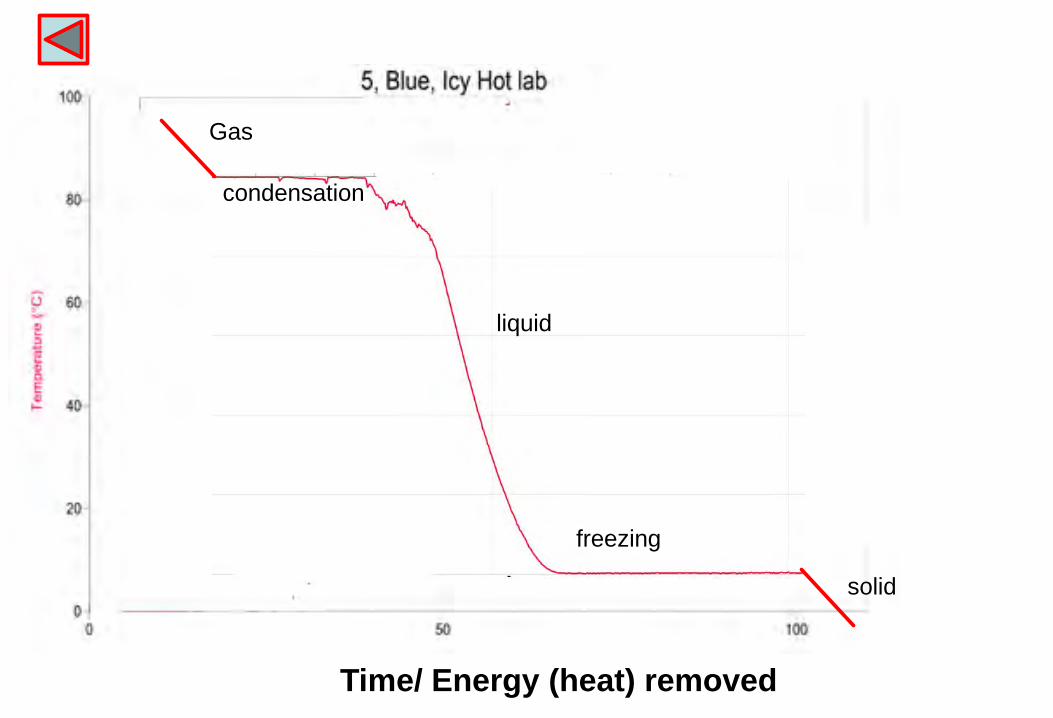
Gas
condensation
liquid
freezing
solid
Time/ Energy (heat) removed