Experiencesofdiscrimination:Validityandreliabilityofa self...
21
Social Science & Medicine 61 (2005) 1576–1596 Experiences of discrimination: Validity and reliability of a self-report measure for population health research on racism and health Nancy Krieger a, , Kevin Smith b,1 , Deepa Naishadham b , Cathy Hartman c , Elizabeth M. Barbeau d a Harvard School of Public Health, Department of Society, Human Development, and Health, 677 Huntington Avenue, Boston, MA 02115, USA b New England Research Institute, 9 Galen Street, Watertown, MA 02472, USA c Dana-Farber Cancer Institute, 44 Binney Street, Boston, MA 02115, USA d Center for Community-Based Research, Dana-Farber Cancer Institute,44 Binney Street, Boston, MA 02115, USA Available online 21 April 2005 Abstract Population health research on racial discrimination is hampered by a paucity of psychometrically validated instruments that can be feasibly used in large-scale studies. We therefore sought to investigate the validity and reliability of a short self-report instrument, the ‘‘Experiences of Discrimination’’ (EOD) measure, based on a prior instrument used in the Coronary Artery Risk Development in Young Adults (CARDIA) study. Study participants were drawn from a cohort of working class adults, age 25–64, based in the Greater Boston area, Massachusetts (USA). The main study analytic sample included 159 black, 249 Latino, and 208 white participants; the validation study included 98 African American and 110 Latino participants who completed a re-test survey two to four weeks after the initial survey. The main and validation survey instruments included the EOD and several single-item discrimination questions; the validation survey also included the Williams Major and Everyday discrimination measures. Key findings indicated the EOD can be validly and reliably employed. Scale reliability was high, as demonstrated by confirmatory factor analysis, Cronbach’s alpha (0.74 or greater), and test–re-test reliability coefficients (0.70). Structural equation modeling demonstrated the EOD had the highest correlation (r ¼ 0:79) with an underlying discrimination construct compared to other self-report discrimination measures employed. It was significantly associated with psychological distress and tended to be associated with cigarette smoking among blacks and Latinos, and it was not associated with social desirability in either group. By contrast, single-item measures were notably less reliable and had low correlations with the multi-item measures. These results underscore the need for using validated, multi-item measures of experiences of racial discrimination and suggest the EOD may be one such measure that can be validly employed with working class African Americans and Latino Americans. r 2005 Elsevier Ltd. All rights reserved. Keywords: Racial discrimination; Validity; Reliability; Psychometric; Black; Latino; USA ARTICLE IN PRESS www.elsevier.com/locate/socscimed 0277-9536/$ - see front matter r 2005 Elsevier Ltd. All rights reserved. doi:10.1016/j.socscimed.2005.03.006 Corresponding author. Tel.: +1 617 432 1571; fax: +1 617 432 3123. E-mail addresses: [email protected] (N. Krieger), [email protected] (K. Smith), [email protected] (D. Naishadham), [email protected] (C. Hartman), [email protected] (E.M. Barbeau). 1 Now at: Research Triangle Institute, USA.
Transcript of Experiencesofdiscrimination:Validityandreliabilityofa self...

ARTICLE IN PRESS
0277-9536/$ - se
doi:10.1016/j.so
�CorrespondE-mail addr
(D. Naishadham1Now at: Res
Social Science & Medicine 61 (2005) 1576–1596
www.elsevier.com/locate/socscimed
Experiences of discrimination: Validity and reliability of aself-report measure for population health research on
racism and health
Nancy Kriegera,�, Kevin Smithb,1, Deepa Naishadhamb, Cathy Hartmanc,Elizabeth M. Barbeaud
aHarvard School of Public Health, Department of Society, Human Development, and Health, 677 Huntington Avenue,
Boston, MA 02115, USAbNew England Research Institute, 9 Galen Street, Watertown, MA 02472, USA
cDana-Farber Cancer Institute, 44 Binney Street, Boston, MA 02115, USAdCenter for Community-Based Research, Dana-Farber Cancer Institute,44 Binney Street, Boston, MA 02115, USA
Available online 21 April 2005
Abstract
Population health research on racial discrimination is hampered by a paucity of psychometrically validated
instruments that can be feasibly used in large-scale studies. We therefore sought to investigate the validity and reliability
of a short self-report instrument, the ‘‘Experiences of Discrimination’’ (EOD) measure, based on a prior instrument
used in the Coronary Artery Risk Development in Young Adults (CARDIA) study.
Study participants were drawn from a cohort of working class adults, age 25–64, based in the Greater Boston area,
Massachusetts (USA). The main study analytic sample included 159 black, 249 Latino, and 208 white participants; the
validation study included 98 African American and 110 Latino participants who completed a re-test survey two to four
weeks after the initial survey. The main and validation survey instruments included the EOD and several single-item
discrimination questions; the validation survey also included theWilliamsMajor and Everyday discrimination measures.
Key findings indicated the EOD can be validly and reliably employed. Scale reliability was high, as demonstrated by
confirmatory factor analysis, Cronbach’s alpha (0.74 or greater), and test–re-test reliability coefficients (0.70).
Structural equation modeling demonstrated the EOD had the highest correlation (r ¼ 0:79) with an underlying
discrimination construct compared to other self-report discrimination measures employed. It was significantly
associated with psychological distress and tended to be associated with cigarette smoking among blacks and Latinos,
and it was not associated with social desirability in either group. By contrast, single-item measures were notably less
reliable and had low correlations with the multi-item measures. These results underscore the need for using validated,
multi-item measures of experiences of racial discrimination and suggest the EOD may be one such measure that can be
validly employed with working class African Americans and Latino Americans.
r 2005 Elsevier Ltd. All rights reserved.
Keywords: Racial discrimination; Validity; Reliability; Psychometric; Black; Latino; USA
e front matter r 2005 Elsevier Ltd. All rights reserved.
cscimed.2005.03.006
ing author. Tel.: +1617 432 1571; fax: +1 617 432 3123.
esses: [email protected] (N. Krieger), [email protected] (K. Smith), [email protected]
), [email protected] (C. Hartman), [email protected] (E.M. Barbeau).
earch Triangle Institute, USA.

ARTICLE IN PRESSN. Krieger et al. / Social Science & Medicine 61 (2005) 1576–1596 1577
Introduction
Although the idea that racial injustice harms health
has appeared in the public health and medical literature
since the 18th century (Krieger, 2000; Banton, 1998;
Byrd & Clayton, 2000; Willie, Kramer, & Brown, 1973),
research on specific measures that could be used in
empirical health research is more recent. During the
1960s and 1970s, a variety of measures were introduced
into the psychological literature, concerned with under-
standing the impact of racism on mental health
(Barbarin, Good, Pharr, & Siskind, 1981) and evaluat-
ing the US Army’s ‘‘racial climate’’ (Hiett et al., 1978).
Social science research likewise began to explore
assessing how racial discrimination restricts opportu-
nities for employment, housing, and education (Blank,
Dabady, & Citro, 2004). It was not until the 1990s,
however, that a small but growing number of public
health studies, both quantitative and qualitative, began
to investigate explicitly associations of self-reported
experiences of racial discrimination with somatic and
also mental health (reviewed in Krieger, Rowley, Her-
man, Avery, & Phillips, 1993; Krieger, 2000; Williams,
Neighbors, & Jackson, 2003), with additional work
focused on racial discrimination in the provision of
health care (Smedley, Stith, & Nelson, 2003).
For population health research to contribute mean-
ingfully to understand links between racial discrimina-
tion and health, studies need valid and reliable measures
that can feasibly be used in large-scale population-based
studies. Yet, because work in this area is in its infancy,
the field is hampered by an important problem: a
paucity of instruments whose psychometric properties
have been rigorously assessed (Krieger, 2000; Williams
et al., 2003; Blank et al., 2004). Moreover, to the extent
psychometric validation studies have been done, they
have been conducted principally among US black
participants, mostly recruited from university students,
faculty, and staff (Utsey, 1998; Landrine & Klonoff,
1996; McNeilly et al., 1996; Vines et al., 2001). Whether
these measures can be used among working class and
low income African Americans, or among other racial/
ethnic groups, remains unknown and is a salient
question, given their concentration among persons with
less education and low-wage jobs (Smith, 2001).
The objectives of our study were thus to investigate,
within a US study population comprised of African
American, Latino, and white working class participants,
the validity and reliability of a short self-report
instrument to measure exposure to racial discrimination.
The selected instrument, which we call the ‘‘Experiences
of Discrimination’’ (EOD) measure, is based on a prior
instrument developed by Krieger (1990), used in the
Coronary Artery Risk Development in Young Adults
(CARDIA) study (Krieger & Sidney, 1996) and in
other epidemiologic investigations (e.g., Yen, Ragland,
Greiner, & Fisher, 1999; Stancil, Hertz-Picciotto,
Schramm, & Watt-Morse, 2000; Stuber, Galea, Ahern,
Blaney, & Fuller, 2003; Dole et al., 2004). To aid
investigation of the EODs validity, we also employed the
Major and Everyday discrimination measure developed
by Williams (Williams, Yu, Jackson, & Anderson, 1997),
plus several single-item questions.
Methods
Study population
Study participants were drawn from a cohort of
working adults, age 25–64, recruited for United for
Health, a study of the health impacts of physical and
social hazards at work among union members employed
in a variety of manufacturing and retail sites located in
or near Boston, Massachusetts (USA). The validation
study was designed to recruit the first 100 African
American and first 100 Latino workers who agreed to
participate in the main and validation survey, thereby
ensuring adequate sample size (n ¼ 200) for factor
analysis (MacCallum, Widaman, Preacher, & Hong,
2001; Boomsma & Hoogland, 2001). Recruitment for
the validation study occurred from March 2003 through
March 2004; recruitment for the main study continued
through August 2004.
Study protocol
Study staff worked with the leadership of the selected
unions and management of participating worksites to
design the recruitment protocol. Permission of manage-
ment was required to gain entry to the worksites.
Management, union, and the funders did not have
access to study data, nor did management or funders
have any role in the collection, analysis, or interpreta-
tion of the data or preparation, review, or approval of
the study’s scientific papers. All participants received an
informed consent reference sheet and provided verbal
informed consent; conduct of the study was approved by
the Human Subjects Committees of the Harvard School
of Public Health and the Dana-Farber Cancer Institute.
Fig. 1 delineates the recruitment and interview
protocol, including eligibility criteria, incentives, and
participation rates. Briefly, workers were screened and
recruited on-site by study staff, after having been sent an
introductory letter, based on a list of union members by
worksite. The main survey was administered on-site,
typically during work hours, in a private room, and
consisted of a 40–45min survey, administered by
computer (in either English or Spanish), followed by a
15-min health check. We used Audio-Computer Assisted
Self-Interviewing (ACASI) both to improve likelihood
of obtaining sensitive information and to enable persons

ARTICLE IN PRESS
Participants Recruitment and survey protocol Participation rates
Initial sample Recruitment pool: list of union members, by worksite Eligible: 25 – 64 years old; employed at worksite 2+ months; English or Spanish
1,275 working adults aged 25-64 years recruited for United for Health Study (response rate = 69.9%)
717 workers from 9 worksites completed main survey
616 workers with complete racial/ethnic data
Main study Interview mode: Audio-Computer Assisted Self-Interviewing (ACASI) Incentive: at completion, given $25 pre-paid grocery card and 1-hour paid work release, or, if no paid work-release, $50 pre-paid grocery card
159 Black workers 249 Latino workers 208 white workers
Validation study
Recruitment pool: up to 50 African Americans and 50 Latinos per worksite Eligible: African American born in US with at least 1 parent born in US; Latino Interview mode: ACASI Incentive: at completion, $20 pre-paid grocery card
108 scheduled 98 completed survey (response rate = 90.7%)
137 scheduled 110 completed survey(response rate = 80.3%)
Key informant study
Recruitment pool: family, friend, or co-workers of validation study participant Eligible: any person named by validation study participant Interview mode: mailed self-administered surveyIncentive: at completion, $20 pre-paid grocery card
78 sent survey51 completed survey(response rate = 65.4%)
91 sent survey55 completed survey(response rate = 60.4%)
Fig. 1. Recruitment protocol and participation rates for the main, validation, and key informant studies, United for Health, Greater
Boston area, MA, 2004.
N. Krieger et al. / Social Science & Medicine 61 (2005) 1576–15961578
with low literacy to respond (Office of Applied Studies,
2001). With ACASI, questions shown on the screen are
also read out-loud, over a headphone, via the digitally
recorded audio component; participants respond by
pressing the indicated keys on a masked keyboard. The
Spanish version of the survey was translated from
English and then back-translated to ensure accuracy.
One or more of the interview staff were bilingual in
English and Spanish and were available to answer
participants’ questions.
Eligible participants who agreed to be part of the
validation study and who met the screening eligibility
criteria took the ACASI re-test survey (in either English
or Spanish) between two and four weeks after the initial
survey. Participation was restricted to workers who
identified as being either: (a) African American, born in
the US, with at least 1 parent born in the US, or (b)
Latino. These criteria were employed to distinguish
between African Americans with a family history in the
US and other black Americans who immigrated from or
were 1st generation immigrants from diverse Caribbean
or African nations, since research indicates that percep-
tions, experiences, and responses to racial discrimination
in the US may differ across these groups (Waters, 1999;
Williams & Jackson, 2000). At the conclusion of re-test
survey, participants were asked to provide contact
information for a key informant who was knowledge-
able about their experiences of discrimination. These key
informants were contacted by mail and sent a ques-
tionnaire to fill out, plus a self-addressed stamped
envelope for return.
Sociodemographic variables
All sociodemographic data on race/ethnicity, gender,
age, socioeconomic position, and country of birth of the
participants and of their parents were based on
self-report. Language of survey administration was
tracked. For the validation study, the handful of
participants under age 25 (n ¼ 2) and age 65 and older
(n ¼ 17) were retained, as were the 6 black participants
who self-identified as being eligible for the validation
study, based on the screening interview, but who in the
survey indicated that both of their parents were born
outside of the US, as were 3 of these participants
themselves.
Extensive socioeconomic data were obtained on
job characteristics and economic resources. In this
study we report on the type of firm in which the
participants worked, plus their occupational class,
hourly wage, household poverty level, and highest
level of education completed. In 2003, the US federal
poverty line for a household of 2 adults and 2 children
equaled $18,660 (US Census Bureau, 2004). Wages
were categorized in relation to the estimated living wage
for the Boston area, equal to $10.54/h in 2003
(Association of Community Organizations for Reform
Now, 2004).
Measures of self-reports of racial discrimination and
response to unfair treatment
The main survey included the EOD questionnaire
(Appendix 1), based on the prior closed-format ques-
tions developed by Krieger (1990) and used in the
CARDIA study (Krieger & Sidney, 1996). The CAR-
DIA version asked about having ever experienced
discrimination in each of seven specified situations,
and also about responses to unfair treatment. This
instrument is conceptualized as measuring ‘‘self-reported
experiences of discrimination,’’ not ‘‘perceived discrimi-
nation,’’ because while self-reported experiences must be

ARTICLE IN PRESSN. Krieger et al. / Social Science & Medicine 61 (2005) 1576–1596 1579
perceived, not all perceived experiences are necessarily
reported, depending upon individuals’ willingness or
ability to report them (Krieger, 2000). The revised
version, used in this study, newly asked about the
frequency of occurrence, plus added two situations
(‘‘getting service in a store or restaurant,’’ and ‘‘getting
credit, bank loans, or a mortgage’’). The ‘‘situation’’
version was scored by counting the number of situations
in which a participant reported experiencing racial
discrimination. The ‘‘frequency’’ version measured total
occurrences, assigning the value of 0 to ‘‘never,’’ 1 to
‘‘once,’’ 2.5 to ‘‘2–3 times,’’ and 5 to ‘‘4 or more times,’’
and summed across items. Response to unfair treatment
was scored as engaged (response ¼ ‘‘do something (act)/
talk to others (talk)’’; score ¼ 2), moderate (respon-
se ¼ ‘‘act/keep to self (quiet)’’ or ‘‘accept/talk’’;
score ¼ 1), or passive (response ¼ ‘‘accept/quiet’’;
score ¼ 0) (Stancil et al., 2000).
Also included were: (a) ‘‘worry’’ questions, about how
much participants worried about racial discrimination
as a child and in the past year, personally and for
their racial/ethnic group; (b) global questions on how
often participants felt members of their racial/ethnic
group and themselves personally experience racial
discrimination; and (c) a question about filing a formal
complaint because of racial discrimination (Appendix
1). A five-item social desirability scale (Hays, 1989) was
likewise included to gauge its impact on responses to
questions about discrimination. To minimize problems
of order effects, participants were randomly assigned
different versions of the main and repeat surveys, with
questions differently ordered within the discrimination
section.
The re-test survey included the same discrimination
questions asked in the main survey, plus the Williams
Major and Everyday discrimination questions (Appen-
dix 1). The Major questions pertain to nine situations;
for each one, participants are asked if they have
experienced unfair treatment and, if so, which of 11
options (‘‘ancestry or national origin’’; ‘‘gender’’;
‘‘race’’; ‘‘age’’; ‘‘religion’’; ‘‘height or weight’’; ‘‘shade
of skin color’’; ‘‘sexual orientation’’; ‘‘physical disabil-
ity’’; ‘‘other’’) was the ‘‘main reason for this experience.’’
Following prior usage (Williams, Neighbors, & Jackson,
1997), the summary score was a count of the number of
situations for which participants reported having
experienced the unfair treatment for a racial reason.
The Everyday questions asked participants to indicate
how often they had been treated badly in 10 situations;
participants who experienced such treatment at least
once in at least one of the situations were then asked to
select among 11 options to indicate the main reason for
‘‘this/these experiences,’’ overall. Recognizing this mea-
sure has been scored as both a unidimensional scale
(Williams et al., 1997; Kessler, Michelson, & Williams,
1999) and a two-factor scale (Guyll, Matthews, &
Bromberger, 2001), we conducted an exploratory
factor analysis, found that all items had their highest
loadings on the first factor, and therefore used the
conventional scoring approach of counting the number
of situations for which participants reported having
experienced unfair treatment among those attributing a
racial reason as the overall main reason for the selected
experiences.
Finally, the key informant survey closed-format
queries were modeled on the EOD and the other
discrimination questions in the main survey. Additional
questions asked the key informants how they knew the
participants and for how long.
Health outcomes
As an additional check on the EODs validity, we
assessed its association with two health outcomes
previously shown to be correlated with self-reported
experiences of racial discrimination: (a) psychological
distress (Kessler et al., 1999; Williams & Williams-
Morris, 2000) and (b) smoking (Landrine & Klonoff,
2000; Guthrie, Young, Williams, Boyd, & Kintner,
2002). Psychological distress was measured using a six-
item instrument validated by Kessler et al. (2002). ‘‘Ever
smokers’’ were defined as persons who reported they
had ever smoked at least 100 cigarettes (Trosclair,
Husten, Pederson, & Dhillon, 2002).
Statistical analysis
The main study analytic sample (N ¼ 616) was
restricted to participants who identified as either black
(N ¼ 159), Latino (N ¼ 249), or white (non- Hispanic)
(N ¼ 208); among them were 98 African American and
110 Latino validation study participants, for whom data
were obtained for 107 key informants. We examined the
distribution of sociodemographic characteristics and the
response patterns for the items in all of the scales. When
multiple items were unanswered, we set the scale to
missing. When reasons for discrimination were not
provided for the Williams items, instead of excluding the
case as missing, we scored the partial responses
conservatively by assuming the situation was not the
result of racial discrimination.
We then specified a series of three structural equation
models (SEMs), estimated using LISREL 8.5 (Joreskog
& Sorbom, 1993) to explore the structure of the different
measures of discrimination. First, using data from the
main study, we tested a confirmatory factor model of the
nine EOD items. Second, we tested the EOD items for
differential item functioning (DIF) among respondents
in the main study. DIF occurs when members of a
particular group give responses to specific items that are
higher or lower than would be expected on the basis of
their underlying trait level; if present, it can lead to

ARTICLE IN PRESSN. Krieger et al. / Social Science & Medicine 61 (2005) 1576–15961580
biased comparison of scale scores. We used the multiple-
indicator multiple-cause (MIMIC) approach (Fleishman
& Lawrence, 2003) with age, gender, educational
attainment, racial/ethnic group, place of birth, and
social desirability as potential sources of DIF. Language
of survey administration was not included because of its
high correlation with both race/ethnicity (r ¼ 0:81) andplace of birth (r ¼ 0:65). We estimated a no-DIF base
model (no direct effects of covariates on individual items
after adjusting for the latent trait) and examined
modification indices for evidence of DIF.
Third, among the validation study participants, we
tested a validation model consisting of the various
discrimination measures (scales and global questions) to
determine if they were all tapping the same underlying
construct. The fit of these SEMs was evaluated by the
Comparative Fit Index (CFI) and the Root Mean
Square Error of Approximation (RMSEA).
Scale reliability was assessed by Cronbach’s alpha
and, for the EOD items, by test–re-test correlations
between the main study and validation study adminis-
trations. All analyses other than the SEMs were
conducted in SAS (SAS Institute, 2001).
Results
Sociodemographic characteristics
Table 1 presents data on the sociodemographic
characteristics of the main (n ¼ 616) and validation
(n ¼ 208) study populations. Within the main study, the
159 black, 249 Latino, and 208 white participants were,
on average, in their late 30 s to early 40 s, evenly split
among women and men, and mainly working class non-
supervisory employees; 60–80% had completed at most
a high school education or its equivalent. Despite being
predominantly union members, 53% earned less than a
living wage ($6.00–$10.54/h) and 42% lived in poverty,
with such economic hardship 1.7–2 times more likely to
affect the black and Latino as compared to the white
workers. One-quarter of the black and three-quarters of
the Latino participants were foreign-born. African
American and Latino participants in the validation
study closely resembled those in the main survey, except
as planned regarding nativity for the former.
EOD: main study results
Data on the EOD for the 616 main study participants
are provided in Table 2; only 4% of participants gave
incomplete responses. Analyses based on the 9- and 7-
item versions of the EOD yielded similar results, as did
analyses for the situation and frequency versions of this
measure. Suggesting good internal reliability, Cron-
bach’s alpha for the 9-item version for all groups was
0.74 or higher; similar results were obtained for the 7-
item version. As expected, EOD values were highest for
the black, somewhat lower for the Latino, and much
lower for the white participants; by contrast, within all
three groups a similar proportion (6–9%) reported
having filed a formal complaint about racial discrimina-
tion. Summary scores for responses to unfair treatment
were also similar.
All of the EOD items for frequency of discrimination
were positively correlated, with inter-item correlations
ranging from 0.14 to 0.53. The confirmatory factor
analysis identified three correlated error variances,
including those for the two most common situations
(‘‘on the street’’ and ‘‘in stores’’), and also between the
‘‘getting hired’’ and ‘‘at work’’ items. With the inclusion
of these correlated variances, the model produced an
acceptable fit to the data for a single underlying factor
(CFI ¼ 0.935; RMSEA ¼ 0.080). Factor loadings
ranged from 0.47 to 0.72; all loadings were highly
significant.
Fig. 2 shows the model for the DIF analysis, in which
EOD is a latent variable. Four findings stand out. First,
the no-DIF specification provided an excellent fit to the
data (CFI ¼ 0.935; RMSEA ¼ 0.054). Of the 63 possi-
ble DIF effects, only one path had a modification index
exceeding 10 (black participants were more likely than
expected to report discrimination for store service), but
this had no impact on the fit of the model. The overall
pattern indicated that no group-specific bias was present
in the item responses. Second, scores on the latent
variables were significantly higher for the black
(b ¼ 0:40) and Latino (b ¼ 0:25) compared to the white
participants. They were also significantly lower for
women compared to men (b ¼ �0:17) and for person
born outside of the US (b ¼ �0:19). Third, EOD levels
were not influenced by social desirability, age, or
educational attainment. Fourth, the model confirmed
the prior analysis of the structure of the EOD scale, with
factor loadings for individual items ranging from 0.49
to 0.73.
Validation study results
Univariate analyses
Results for the EOD, including Cronbach’s alpha,
and for filing a formal complaint were similar for the
main and validation study analyses (Table 3), with one
exception: self-reports of discrimination (especially
‘‘from the police and in the courts’’) and of filing a
formal complaint were greater for the African American
validation participants compared to black main survey
participants. Both Williams’ measures likewise indicated
higher levels of self-reported racial discrimination for
the African American compared to the Latino partici-
pants, as did the ‘‘worry’’ and ‘‘global’’ questions.

ARTICLE IN PRESS
Table 1
Sociodemographic characteristics of the main (n ¼ 616) and validation (n ¼ 208) study populations: United for Health cohort, Greater
Boston area, MA, 2004
Characteristic Missing (%) Black Latino White (%)
(n ¼ 208)Main (%)
(n ¼ 159)
Validation
(%) (n ¼ 98)
Main (%)
(n ¼ 249)
Validation
(%) (n ¼ 110)
Age: 4.7
o25 years 0.0 0.0 0.9 0.0 0.0
25–44 years 63.2 58.8 67.7 72.9 47.0
45–64 years 35.5 40.2 30.6 26.2 46.5
X65 years 1.3 1.0 0.9 0.9 6.5
Gender: 0.8
Women 57.2 59.1 44.9 43.5 40.0
Men 41.8 40.8 55.1 56.5 60.0
Type of worksite: 0.0
Manufacturing 6.3 0 78.3 61.8 22.6
Retail 93.7 100.0 21.7 38.2 77.4
Currently a union member: 1.3
Yes 91.2 91.8 74.9 79.6 96.1
No 8.8 8.2 25.1 20.4 3.9
Parents nativity: 4.5
One or both parents born in US 71.3 96.9 13.8 15.5 85.0
Both parents born out of US 28.7 3.1 86.2 84.5 15.0
Nativity: 4.7
Born in US state or territory 75.8 3.1 26.8 36.5 91.7
Foreign-born 24.2 96.9 73.2 63.5 8.3
Language of survey: 0.0
English 100.0 100.0 22.1 35.4 99.5
Spanish 0.0 0.0 77.9 64.6 0.5
Class position: 8.6
Own or run business 5.2 5.2 6.8 9.4 6.4
Self-employed/freelance 6.4 6.2 16.1 15.6 2.5
Supervisory employee 35.5 27.1 20.0 27.1 31.0
Non-supervisory employee 52.9 47.9 57.1 47.9 60.1
Hourly wage, as % of living wage
(LW):
9.1
$6.00–$10.54/h (p100% LW) 74.2 75.8 67.3 78.2 39.8
$10.55–$13.16/h (4100, o125%
LW)
11.9 10.5 21.6 12.9 15.9
$13.17–$15.80/h (125–149% LW) 6.6 6.3 6.7 5.0 12.4
X$15.81/h (X150% LW) 7.3 7.4 4.3 3.9 31.8
Poverty level (household): 14.5
o100% poverty 59.0 57.6 61.8 61.1 29.6
100–199% poverty 16.7 14.1 22.5 22.1 29.6
X200% poverty 24.3 28.3 15.7 16.8 40.7
Education: highest level completed: 9.7
o12th grade 19.6 18.4 48.0 50.5 17.4
High school degree/GED 47.7 53.1 28.2 28.9 41.3
Some college/vocational school 24.8 21.4 15.8 14.4 26.9
4 years of college 3.9 2.0 6.9 5.2 10.4
Graduate degree 3.9 5.1 1.0 1.0 4.0
Social desirability score: mean (SD) 4.7 47.4 (34.0) 50.5 (34.2) 35.7 (31.4) 33.2 (31.1) 33.2 (31.6)
N. Krieger et al. / Social Science & Medicine 61 (2005) 1576–1596 1581

ARTICLE IN PRESS
Table 2
Experiences of Discrimination measure (EOD), plus filing of formal complaint about racial discrimination at work: United for Health
cohort (n ¼ 616), Greater Boston area, MA, 2004
Characteristic Black (%) (n ¼ 156)a Latino (%) (n ¼ 299)a White (%) (n ¼ 205)a
Experience of Discrimination (n ¼ 590): N ¼ 156 n ¼ 299 n ¼ 205
At school:
Never 79.5 91.3 90.2
Once 3.8 3.5 2.9
2–3 times 7.7 3.1 2.9
4 or more times 9.0 2.2 3.9
Getting hired or getting at job:
Never 72.4 80.4 85.8
Once 10.9 7.9 5.8
2–3 times 9.6 6.1 5.8
4 or more times 7.0 5.7 2.4
At work:
Never 80.8 85.6 88.3
Once 6.4 6.1 2.9
2–3 times 6.4 5.2 5.8
4 or more times 6.4 3.1 2.9
Getting housing:
Never 74.4 89.5 89.8
Once 10.9 4.8 4.9
2–3 times 10.9 5.2 3.9
4 or more times 3.8 0.4 1.5
Getting medical care:
Never 82.7 86.0 94.2
Once 8.3 8.3 1.5
2–3 times 4.5 3.5 2.4
4 or more times 4.5 2.2 2.0
Getting services in a store or restaurant:
Never 59.0 80.4 89.8
Once 11.5 7.9 3.4
2–3 times 14.1 8.3 3.9
4 or more times 15.4 3.5 2.9
Getting credit, bank loans, or a mortgage:
Never 74.4 83.8 92.2
Once 9.0 7.4 2.0
2–3 times 10.3 5.7 4.9
4 or more times 6.4 3.1 1.0
On the street or in a public setting:
Never 68.0 76.0 84.9
Once 5.1 8.7 2.0
2–3 times 17.3 10.5 6.3
4 or more times 9.6 4.8 6.8
From the police or in the courts:
Never 78.2 82.5 93.7
Once 6.4 7.9 2.4
2–3 times 6.4 6.6 1.5
4 or more times 9.0 3.1 2.4
N. Krieger et al. / Social Science & Medicine 61 (2005) 1576–15961582

ARTICLE IN PRESS
Table 2 (continued )
Characteristic Black (%) (n ¼ 156)a Latino (%) (n ¼ 299)a White (%) (n ¼ 205)a
Experience of Discrimination (n ¼ 590): N ¼ 156 n ¼ 299 n ¼ 205
Situations mentioned: EOD, 9-item
0 33.3 52.8 58.5
1–2 28.8 23.1 29.3
3+ 37.8 24.0 12.2
Situations mentioned: EOD, 7-item
0 41.0 55.9 60.5
1–2 31.4 26.2 31.2
3+ 27.6 17.9 8.3
Summary score: EOD, 9-item: mean (SD)
Situation (possible range: 0–9) 2.31 (2.46) 1.44 (2.06) 0.91 (1.62)
Frequency (possible range: 0–45) 6.46 (8.92) 3.37 (5.72) 2.51 (4.94)
Summary score: EOD, 7-item: mean (SD)
Situation (possible range: 0–7) 1.64 (1.91) 1.09 (1.59) 0.73 (1.28)
Frequency (possible range: 0–35) 4.56 (6.80) 2.54 (4.31) 2.04 (4.01)
Cronbach’s alpha:
EOD, 9-item, situation 0.81 0.81 0.77
EOD, 9 item, frequency 0.86 0.79 0.74
EOD, 7-item, situation 0.87 0.75 0.70
EOD, 7-item, frequency 0.82 0.71 0.67
Response to unfair treatment: SD SD SD
Summary score: mean (SD) 1.32 (0.77) 1.13 (0.77) 1.25 (0.76)
Cronbach’s alpha 0.56 0.37 0.49
Filed a formal complaint about racial
discrimination: % yes
7.0% 8.7% 6.3%
aBased on participants with no missing data.
N. Krieger et al. / Social Science & Medicine 61 (2005) 1576–1596 1583
Test–re-test reliability
Table 4 presents data on test–re-test reliability
for African American and Latino participants com-
bined, since results were similar for both groups.
Reliability was high (correlations of 0.69 and higher)
for the EOD scores, but much lower for the single-item
‘‘worry,’’ ‘‘global,’’ and filing a formal complaint
questions.
Multi-variable analyses
The correlation matrix for the different discrimination
measures in the validation study is provided in Table 5.
Statistically significant correlations in excess of 0.55
occurred between the EOD and Williams Major and
Everyday measures; correlations between 0.30 and 0.54
occurred between both the ‘‘worry’’ and ‘‘global’’
questions and the EOD and Everyday measure; and
correlations between 0.20 and 0.40 occurred between
filing a formal complaint and all of the discrimination
measures except for the ‘‘global’’ questions. Social
desirability was not correlated with any of the dis-
crimination measures except for the Everyday measure
(r ¼ �0:246; p ¼ 0:0014).The validation SEM was designed to determine
whether the various discrimination measures in the
matrix tapped into a single construct of self-reported
racial discrimination. The resulting model, controlling
for social desirability, is shown in Fig. 3. The proposed
single-construct model provided an excellent fit to the
data (CFI ¼ 0.966; RMSEA ¼ 0.069). The EOD scale,
which includes minor and major situations, had the
largest correlation with the underlying discrimination
construct (r ¼ 0:79), followed by the two Williams scales
and the global frequency item. Correlations for the less
reliable ‘‘worry’’ and ‘‘filing a complaint’’ items were
smaller. Social desirability effects were in the expected
direction (those with higher desirability levels reported
less discrimination); this was due largely to the influence
of the Everyday scale.
Additional tests of validity
Data from the key informants (n ¼ 106) were
obtained for 51% of the validation study participants,

ARTICLE IN PRESS
All coefficients are standardized (betas); betas >.15 are significantly greater than zero at p<.01 Chi-square =200.5, df=80, p<.05; RMSEA =.054; CFI=.935
-0.23
0.66
-0.47
0.40
0.25
-0.19
-0.17
-0.05
0.04
-0.07
0.60
0.61
0.55
0.73
0.49
0.58
0.55
0.62
0.56 School
Female
Born outside of US
Experiences of
Discrimination
Education
Public setting
Hired
Work
Housing
Medical care
Store services
Credit loans
Social Desirability
Age
Police, Courts
Latino
Black
Fig. 2. Experiences of Discrimination (EOD) differential item functioning model, main study (n ¼ 521), United for Health, Greater
Boston area, MA, 2004.
N. Krieger et al. / Social Science & Medicine 61 (2005) 1576–15961584
75% of whom had known the participant for at least 5
years. Concordance between the key informants and
participants on whether the participants had ever
experienced racial discrimination was 68% (kstatistic ¼ 0.35, 95% CI ¼ 0.18, 0.52).
Lastly, Table 6 presents data for the main survey
participants on associations between the EOD and the
two health outcomes. A positive association with
psychological distress was statistically significant in all
racial/ethnic groups; the positive association with like-
lihood of having ever smoked cigarettes tended towards
statistical significance for the blacks and Latinos, but
not whites.
Discussion
Our study is among the first to evaluate the
psychometric properties of a self-report measure of
racial discrimination specifically among working class
African American, Latino, and white adults for public
health research. The results provide evidence that the 9-
item EOD scale, whether scored by frequency of
occurrence or by situation counts, is a valid and reliable
self-report measure of racial discrimination. The con-
firmatory factor analysis indicated that the EOD items
comprised a unidimensional measure of discrimination,
with adequate internal consistency and test–re-test
reliability; responses were neither associated with social
responsibility nor affected by DIF. In our validation
analysis, the EOD scale had a higher correlation
(r ¼ 0:79) with an underlying latent discrimination
factor than other indicators. It was also significantly
associated with psychological stress, and tended towards
being significantly associated with smoking status. The
7-item CARDIA version had similar psychometric
properties. Single-item discrimination measures were
notably less reliable.
Lending credence to these results, the study response
rate was high and, to minimize effects of low literacy and
interviewer–interviewee dynamics, we employed ACASI
methodology for interview administration, in its first use
in research on racial discrimination and health. More-
over, the reported levels of racial discrimination,
including higher levels for African Americans compared
to Latinos, are similar to those observed in studies using
the same or similar measures among working class, less
educated, and lower income African Americans and

ARTICLE IN PRESS
Table 3 (continued)
Characteristic Africana
Latinoa (%)
N. Krieger et al. / Social Science & Medicine 61 (2005) 1576–1596 1585
Latinos (Yen et al., 1999; Stancil et al., 2000; Stuber et
al., 2003; Kessler et al., 1999). Additionally, the multi-
item EOD and Williams’ measures had much greater
Table 3
Prevalence of self-reported racial discrimination and response
to unfair treatment, validation sub-study measures, African
Americans (n ¼ 98) and Latinos (n ¼ 110), United for Health,
Greater Boston area, MA, 2004
Characteristic African
Americana (%)
Latinoa (%)
Experience of discrimination
(n ¼ 207)
n ¼ 98 n ¼ 109
Situations mentioned: 9-item
0 27.6 43.1
1–2 26.5 30.3
3+ 45.9 26.6
Situations mentioned: 7-item
0 32.6 45.9
1–2 31.6 32.1
3+ 35.7 22.0
Summary score: 9-item, mean (SD)
Situation 2.76 (2.62) 1.72 (2.24)
Frequency 6.55 (7.50) 3.63 (5.84)
Summary score: 7-item, mean (SD)
Situation 1.98 (2.10) 1.36 (1.82)
Frequency 4.68 (6.08) 2.91 (4.75)
Cronbach’s alpha
EOD, 9-item, situation 0.82 0.82
EOD, 9-item, frequency 0.82 0.83
EOD, 7-item, situation 0.79 0.79
EOD, 7-item, frequency 0.80 0.78
Worry about unfair treatment
due to race (n ¼ 205)
n ¼ 98 n ¼ 107
Worried as a child or teenager about own group
Most of the time 25.5 10.4
Some of the time 35.7 40.6
Rarely or never 38.8 49.1
Worried as child or teenager about self
Most of the time 18.6 11.3
Some of the time 35.0 37.7
Rarely or never 46.4 50.9
Worried in last year about own group
Most of the time 17.4 11.2
Some of the time 39.8 36.4
Rarely or never 42.9 52.3
Worried in last year about self
Most of the time 11.3 8.4
Some of the time 34.0 34.6
Rarely or never 54.6 57.0
Global: racial discrimination
(n ¼ 204)
n ¼ 97 n ¼ 107
How often feel that racial/ethnic groups who are not white,
such as African Americans and Latinos, are discriminated
against
Never 16.5 20.6
Rarely 9.3 13.1
Sometimes 37.1 44.9
Often 37.1 21.5
How often feel personally
discriminated against
Never 18.6 35.5
Rarely 30.9 24.3
Sometimes 34.0 30.8
Often 16.5 9.4
Filed a formal complaint
(n ¼ 204)
n ¼ 97 n ¼ 107
Filed formal complaint about racial discrimination
Yes 12.4 5.6
Willams: Major
discrimination (n ¼ 200)
n ¼ 95 n ¼ 105
Situations mentioned with racial reason for discrimination
0 48.2 69.5
1–2 33.7 25.7
3+ 17.9 4.8
Summary score: mean (SD) 1.20 (1.68) 0.50 (0.93)
Cronbach’s alpha 0.71 0.52
Williams: Everyday
discrimination (n ¼ 172)
n ¼ 85 n ¼ 87
Main reason for these experiences (asked if person replied
‘‘yes’’ to at least one query)
Racial 69.4 40.2
Other or unstated reason 30.6 59.8
Situations mentioned with racial reason for discrimination
0 11.8 18.4
1–2 5.9 19.5
3+ 82.4 62.1
Summary score: mean (SD) 6.35 (3.26) 4.41 (3.39)
Cronbach’s alpha 0.88 0.88
aBased on participants with no missing data, as indicated for
each question.
American (%)
reliability than the single-item questions, findings which
raise questions about the use of single-item measures in
prior research and caution against their use in future

ARTICLE IN PRESS
Table 4
Test–re-test reliability, for measures of racial discrimination and response to unfair treatment (n ¼ 190; 94 African Americans, 96
Latinos), ‘‘United for Health,’’ Greater Boston area, MA, 2004
Measure continuous Total (n ¼ 190)
Score: mean (SD) Correlation (95% CI)
Initial Re-test
EOD: Frequency, 9-item 5.66 (8.12) 5.30 (6.99) 0.70 (0.61, 0.76)
EOD: Situation, 9-item 2.04 (2.36) 2.30 (2.53) 0.69 (0.61, 0.76)
EOD: Frequency, 7-item 3.98 (6.03) 3.99 (5.64) 0.72 (0.64, 0.78)
EOD: Situation, 7-item 1.46 (1.81) 1.74 (2.02) 0.69 (0.61, 0.76)
EOD: Response to unfair treatment 1.25 (0.79) 1.41 (0.78) 0.35 (0.22, 0.47)
Worry: Own group 2.36 (0.70) 2.32 (0.72) 0.30 (0.17, 0.43)
Worry: Self 2.41 (0.74) 2.44 (0.68) 0.42 (0.30, 0.53)
Global: Group 2.72 (1.03) 2.84 (1.06) 0.46 (0.34, 0.56)
Global: Self 2.20 (1.05) 2.34 (1.02) 0.50 (0.38, 0.60)
Categorical
Initial (%) Re-test (%) Kappa (95% CI)
Filed complaint 8.4 8.4 0.18 (�0.03, 0.39)
EOD: Response to unfair treatment
% Act 56.3 66.3 0.33 (0.20, 0.46)
% Accept 43.7 33.7
% Talk 68.4 74.7 0.30 (0.16, 0.45)
% Quiet 31.6 25.3
N. Krieger et al. / Social Science & Medicine 61 (2005) 1576–15961586
studies. Further suggesting the single-item self-report
data on filing a formal complaint are unreliable,
national data indicate that black Americans are 55
times more likely than white Americans to file com-
plaints about racial discrimination at work (Pincus,
2003, p. 109) and new empirical research indicates
that claims of workplace discrimination by white
Americans are more likely to be ideological rather
than evidence-based (Bonilla-Silva, 2003; Pincus, 2003;
Crosby, 2004).
Despite its promising psychometric properties, the
EOD, like any other self-report measure, necessarily is
subject to the same social and cognitive limitations
as other self-report measures, regarding perception,
interpretation, and disclosure (Stone et al., 2000;
Blank et al., 2004; Krieger, 2003). The deliberate
focus on a working class population, in which people
of color are disproportionately represented (Smith,
2001), necessarily limited ability to compare results by
socioeconomic position. Additional research is needed
to determine whether our findings can be generalized
to US black and Latino professionals, to different
Latino sub-populations (e.g., Mexican, Puerto Rican,
Cuban, other Central and South American) and to
other racial/ethnic groups, and whether differences
exist by nativity and immigration history. Under-
scoring the need for this research, to date US
studies on racial discrimination and health have
generally ignored differences regarding socioeconomic
position and nativity among the US black population
(Krieger, 2000; Williams et al., 2003; Poston et al.,
2001).
Data on associations between the discrimination
measures and the health outcomes were intended
only as a gauge of validity, not detailed analysis.
Nevertheless, the magnitude and direction of the
crude correlations are comparable to those reported in
recent studies regarding: (a) psychological distress
among US black and Latino adults (Stuber et al.,
2003; Kessler et al., 1999; Williams et al., 1997; Finch,
Kolody, & Vega, 2000), and (b) cigarette smoking
among US black adults and African American girls
(Landrine & Klonoff, 2000; Guthrie et al., 2002); no
previous analyses have reported on this association for
Latinos. Once data collection for the full United for
Health cohort is complete, future analyses will system-
atically investigate the relationship between self-re-
ported experiences of racial discrimination with these
and other health outcomes, taking into account neces-
sary confounders and other covariates; speculation on
the reasons for the crude correlations reported in this
study is premature.
Utilizing valid self-report measures of exposure,
however vital, nevertheless addresses only one aspect
of the myriad complexities affecting analyses of how
racism harms health, via diverse pathways involving

ARTIC
LEIN
PRES
S
Table 5
Correlation matrix of the racial discrimination instruments: Experience of Discrimination (EOD), worry, global, and Williams’, plus social desirability scale, for all participants
(n ¼ 165; 84 African Americans, 81 Latinos) with no missing data for any of these items in the validation sub-study, United for Health, Greater Boston area, MA, 2004
Measure of
discrimination
All participants with no missing data for any item in matrix (n ¼ 165)
Pearson correlation coefficient
(p-value)
Experience of
Discrimination (EOD):
score (9 variable version)
Worry during past year for Global measure, for Williams Social
desirability
Filed
complaint
Frequency Situation Own group Self Racial/ethnic
groups
Self Major Everyday
EOD: 1
Frequency, 9 variable
EOD: 0.900 1
Situation, 9 variable (po0:0001)Worry: own group 0.423 0.412 1
(po0:0001) (po0:0001)Worry: self 0.411 0.376 0.640 1
(po0:0001) (po0:0001) (po0:0001)Global: group 0.412 0.404 0.338 0.380 1
(po0:0001) (po0:0001) (po0:0001) (po0:0001)Global: self 0557 0.531 0.416 0.403 0.498 1
(po0:0001) (po0:0001) (po0:0001) (po0:0001) (po0:0001)Williams: major 0.646 0.612 0.311 0.244 0.171 0.335 1
(po0:0001) (po0:0001) (po0:0001) (p ¼ 0:0016) (p ¼ 0:0280) (po0:0001)Williams: everyday 0.564 0.612 0.355 0.318 0.399 0.528 0.463 1
(po0:0001) (po0:0001) (po0:0001) (po0:0001) (po0:0001) (po0:0001) (po0:0001)Social desirability �0.065 �0.048 0.060 0.027 0.005 �0.008 �0.108 �0.246 1
(p ¼ 0:4097) (p ¼ 0:542) (p ¼ 0:4462) (p ¼ 0:734) (p ¼ 0:9500) (p ¼ 0:9221) (p ¼ 0:1682) (p ¼ 0:0014)Filed complaint 0.274 0.387 0.200 0.145 0.091 0.201 0.333 0.194 �0.068 1
(p ¼ 0:0004) (po0:0001) (p ¼ 0:0101) (p ¼ 0:625) (p ¼ 0:2456) (p ¼ 0:0096) (po0:0001) (p ¼ 0:3874) (p ¼ 0:0123)
N.
Krieg
eret
al.
/S
ocia
lS
cience
&M
edicin
e6
1(
20
05
)1
57
6–
15
96
1587

ARTICLE IN PRESS
Chi-square =21.3, df =12, p=0.046; RMSEA =0.069; CFI=0.966 Model includes correlated errors between EOD and Major scores (r = 0.13)
and between Major and often discriminated scores (r = -0.13)
0.49
0.33
0.79
-0.13
0.65
0.72
Social desirability
Perceived discrimination
EOD Frequencyscore
Major situations
Everydaysituations
How often Discriminated
against
How often worry
Filed complaint
0.72
Fig. 3. Construct validity model for multiple measures of racial discrimination, validation sub-study (n ¼ 165), United for Health,
Greater Boston area, MA, 2004.
N. Krieger et al. / Social Science & Medicine 61 (2005) 1576–15961588
structural, institutional, interpersonal, and internalized
racism (Krieger, 2000, 2003; Williams et al., 2003; Blank
et al., 2004). For observational studies, challenges
include: (a) confounding by other socially patterned
covariates, and (b) aptly measuring relevant variables in
relation to the relevant etiologic period and chronicity
and level of exposure (Krieger, 2000, 2001, 2003; Krieger
& Davey Smith, 2004; Davey Smith & Ebrahim, 2002;
Williams et al., 2003). For experimental investigations,
additional concerns pertain to the feasibility of devel-
oping socially and biologically realistic exposure scenar-
ios and relating them to meaningful changes in health
status (Blank et al., 2004; Harrell, Hall, & Taliaferro,
2003).
In conclusion, our study underscores the need for the
newly emerging research on how racism harms health to
use validated, multi-item self-report measures of experi-
ences of racial discrimination. By testing the validity and
reliability of the EOD in a population of working class
African American and Latino adults and ascertaining it
has promising psychometric properties, our study lends
credence to prior investigations using related versions of
this instrument while also expanding possibilities for
furthering research on—and generating evidence to
galvanize action to address—social inequalities in
health.
Acknowledgements
This validation study was supported by the American
Legacy Foundation (PI ¼ Krieger) and the parent study
in which it was nested, ‘‘United for Health,’’ was funded
by the National Institute of Occupational Safety and
Health (grant # 1R01 OHO7366-01; PI ¼ Barbeau).
Both institutions solely provided funding and had no
involvement in: the design or conduct of the study; the
collection, management, analysis, or interpretation of
the data; or the preparation, review, or approval of the
manuscript.
The authors thank, in alphabetical order, the follow-
ing team members of the ‘‘United for Health’’ study for
the work that made our validation sub-study possible:
(a) interviewers: Vanessa Costa, Maribel Melendez,
Michael Ostler, Elizabeth Pratt, Roona Ray, and Marie
Recupero; (b) instrument formatting and data manage-
ment: Lisa Bates and Ruth Lederman; and (c) additional
co-investigators and team members engaged in the overall
project: Margaret Quinn, Grace Sembajwe, Glorian
Sorensen, Anne Stoddard, Pamela D. Waterman, and
Richard Youngstrom.
The authors also thank David Williams for permis-
sion to include his instrument and for instructions on
how it should be scored.

ARTIC
LEIN
PRES
S
Table 6
Distribution of psychological distress and cigarette smoking and association with Experiences of Discrimination (EOD) for main survey participants (n ¼ 616), United for Health,
Greater Boston area, MA, 2004
Variable Psychological distress % ever smokers
Main study (n ¼ 616) Black (n ¼ 159) Latino (n ¼ 249) White (n ¼ 208) Black (n ¼ 159) Latino (n ¼ 249) White (n ¼ 208)
Distribution 39.1% 27.0% 57.3%
Categorical: %
Continuous: mean (SD) 6.92 (5.12) 8.60 (5.33) 7.30 (4.84)
Missing data: n (%) 6 (3.8%) 20 (8.0%) 3 (1.4%) 3 (1.9%) 19 (7.6%) 2 (1.0%)
Distribution by
discrimination strata:*
n Mean score
(SD)
n Mean score
(SD)
n Mean score
(SD)
n % n % N %
EOD: situations
mentioned, 9 variables:
0 51 4.56 (3.94) 120 7.08 (4.80) 121 6.25 (4.29) 52 34.6 123 21.3 121 54.6
1–2 44 6.57 (5.43) 53 9.40 (5.96) 59 8.02 (4.74) 45 37.8 53 28.3 60 65.0
3+ 58 9.24 (4.86) 54 11.33 (4.64) 24 10.63 (5.95) 59 44.1 55 38.1 25 52.0
p value** o0.0001 o0.0001 o0.0001 0.1644 0.0112 0.2611
Regression analysis:*** b(95% CI)
0.71 (0.40, 1.02) 0.84 (0.52, 1.16) 0.93 (0.54, 1.32) 1.12 (0.98, 1.28) 1.12 (0.98, 1.28) 1.06 (0.88, 1.26)
*analyses based on participants with no missing data.**p-value: for psychological distress, for the F statistic (ANOVA); for ever smoker, for the Cochran-Armitage test for trend
***Regression analysis: psychological distress ¼ ordinary least squares linear regression; ever smoker ¼ logistic regression.
N.
Krieg
eret
al.
/S
ocia
lS
cience
&M
edicin
e6
1(
20
05
)1
57
6–
15
96
1589
ARTICLE IN PRESSN. Krieger et al. / Social Science & Medicine 61 (2005) 1576–15961590
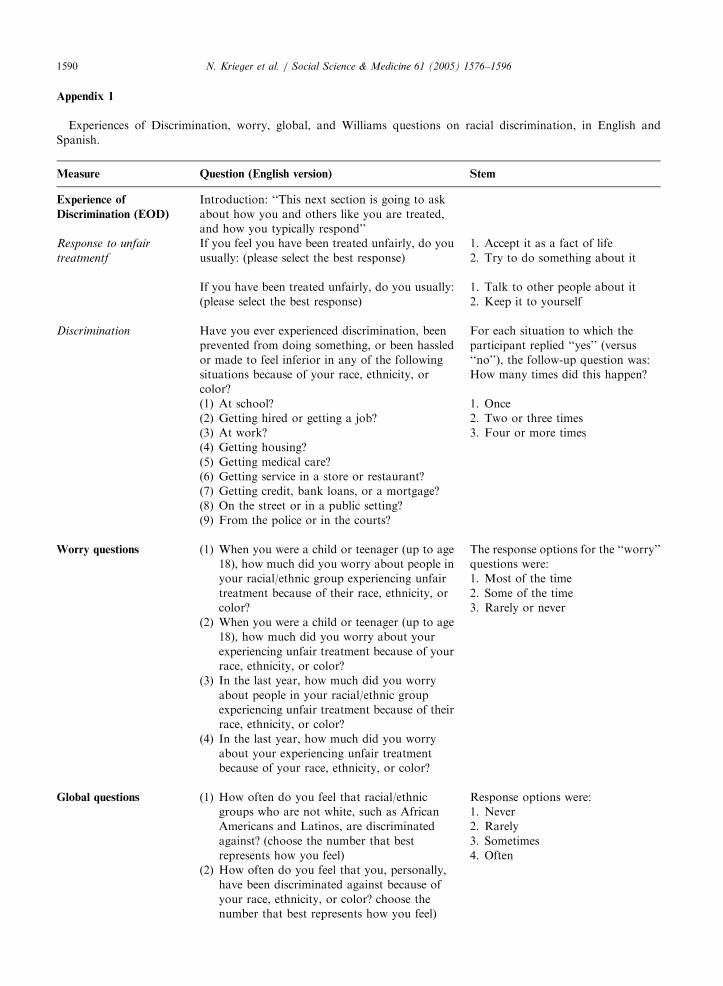
Appendix 1
Experiences of Discrimination, worry, global, and Williams questions on racial discrimination, in English and
Spanish.
Measure
Question (English version) StemExperience of
Discrimination (EOD)
Introduction: ‘‘This next section is going to ask
about how you and others like you are treated,
and how you typically respond’’
Response to unfair
treatmentf
If you feel you have been treated unfairly, do you
usually: (please select the best response)
1. Accept it as a fact of life
2. Try to do something about it
If you have been treated unfairly, do you usually:
(please select the best response)
1. Talk to other people about it
2. Keep it to yourself
Discrimination
Have you ever experienced discrimination, beenprevented from doing something, or been hassled
or made to feel inferior in any of the following
situations because of your race, ethnicity, or
color?
For each situation to which the
participant replied ‘‘yes’’ (versus
‘‘no’’), the follow-up question was:
How many times did this happen?
(1) At school?
(2) Getting hired or getting a job?
(3) At work?
(4) Getting housing?
(5) Getting medical care?
(6) Getting service in a store or restaurant?
(7) Getting credit, bank loans, or a mortgage?
(8) On the street or in a public setting?
(9) From the police or in the courts?
1. Once
2. Two or three times
3. Four or more times
Worry questions
(1) When you were a child or teenager (up to age18), how much did you worry about people in
your racial/ethnic group experiencing unfair
treatment because of their race, ethnicity, or
color?
(2) When you were a child or teenager (up to age
18), how much did you worry about your
experiencing unfair treatment because of your
race, ethnicity, or color?
(3) In the last year, how much did you worry
about people in your racial/ethnic group
experiencing unfair treatment because of their
race, ethnicity, or color?
(4) In the last year, how much did you worry
about your experiencing unfair treatment
because of your race, ethnicity, or color?
The response options for the ‘‘worry’’
questions were:
1. Most of the time
2. Some of the time
3. Rarely or never
Global questions
(1) How often do you feel that racial/ethnicgroups who are not white, such as African
Americans and Latinos, are discriminated
against? (choose the number that best
represents how you feel)
(2) How often do you feel that you, personally,
have been discriminated against because of
your race, ethnicity, or color? choose the
number that best represents how you feel)
Response options were:
1. Never
2. Rarely
3. Sometimes
4. Often

ARTICLE IN PRESSN. Krieger et al. / Social Science & Medicine 61 (2005) 1576–1596 1591
Have you ever filed a formal complaint because of
Filed complaintracial discrimination?
1. Yes
2. No
Williams questions
Introduction: ‘‘In the following questions, we areinterested in the way other people have treated
you or your beliefs about how other people have
treated you. Can you tell me if any of the
following has ever happened to you:’’
Major discrimination
(1) At any time in your life, have you ever beenunfairly fired?
(2) For unfair reasons, have you ever not been
hired for a job?
(3) Have you ever been unfairly denied a
promotion?
(4) Have you ever been unfairly stopped,
searched, questioned, physically threatened or
abused by the police?
(5) Have you ever been unfairly discouraged by a
teacher or advisor from continuing your
education?
(6) Have you ever been unfairly prevented from
moving into a neighborhood because the
landlord or a realtor refused to sell or rent you
a house or apartment?
(7) Have you ever moved into a neighborhood
where neighbors made life difficult for you or
your family?
(8) Have you ever been unfairly denied a bank
loan?
(9) Have you ever received service from someone
such as a plumber or car mechanic that was
worse than what other people get?
For each situation to which the
participant replied ‘‘yes,’’ the follow-
up question was:
What do you think was the main
reason for this experience?
1. Your ancestry or national origins
2. Your gender
3. Your race
4. Your age
5. Your religion
6. Your height or weight
7. Your shade of skin color
8. Your sexual orientation
9. Your education or income level
10. A physical disability
11. Other
Day-to-day unfair
treatment
In your day-to-day life, how often have any of the
following things happened to you?
Response options were:
(1) You have been treated with less courtesy
than other people
(2) You have been treated with less respect than
other people
(3) You have received poorer service than other
people at restaurants or stores
(4) People have acted as if they think you are not
smart
(5) People have acted as if they are afraid of you
(6) People have acted as if they think you are
dishonest
(7) People have acted as if they’re better than
you are
(8) You have been called names or insulted
(9) You have been threatened or harassed
(10) You have been followed around in stores
1. Four or more times
2. Two or three times
3. Once
4. Never
Respondents who indicated any of
these events occurred at least once
were then asked one question,
covering all the situations:
What do you think was the main
reason for this/these experience(s)?
1. Your ancestry or national origins
2. Your gender
3. Your race
4. Your age
5. Your religion
6. Your height or weight
7. Your shade of skin color
8. Your sexual orientation
9. Your education or income level
10. A physical disability
11. Other

ARTICLE IN PRESSN. Krieger et al. / Social Science & Medicine 61 (2005) 1576–15961592
Response option for each item:
Response to unfairtreatment
How did you respond to this/these experience(s)?
Please tell me if you did each of the following
things.
(1) Tried to do something about it
(2) Accepted it as a fact of life
(3) Worked harder to prove them wrong
(4) Realized that you brought it on yourself
(5) Talked to someone about who you were
feeling
(6) Expressed anger or got mad
(7) Prayed about the situation
1. Yes
2. No
Measure
Question (Spanish version) StemExperience of
Discrimination (EOD)
Introduction: ‘‘En esta seccion se le preguntara
acerca de como usted, y otros como usted, son
tratados, y como usted responde tıpicamente’’
Response to unfair
treatment
En caso de sentir que ha sido tratado de manera
injusta, usted normalmente: (por favor elija la
mejor respuesta)
1. lo toma como un hecho de su vida
2. trata de hacer algo al respecto
Si usted ha sido tratado injustamente, usted
normalmente: (por favor elija la mejor respuesta)
1. habla acerca de esto con otras
personas
2. se lo guarda para sı mismo
Discrimination
+Alguna vez ha experimentado discriminacion, nose le ha permitido hacer algo, se le ha molestado o
hecho sentir inferior en alguna de las siguientes
situaciones debido a su raza, etnia o color?
For each situation to which the
participant replied ‘‘Sı’’ (versus
‘‘No’’), the follow-up question was:
+Cuantas veces ocurrio esto?
(1) +En la escuela?
(2) +Al ser contratado u obtener un empleo?
(3) +En el trabajo?
(4) +Al obtener una casa?
(5) +Al obtener asistencia medica?
(6) +El requerir servicio en una tienda o
restaurante?
(7) +Al obtener credito, prestamos bancarios o
hipotecarios?
(8) +En la calle, en un lugar publico?
(9) +De la policıa o en las cortes?
1. una vez
2. dos o tres veces
3. cuatro o mas veces
Worry questions
(1) Cuando era nino o adolescente (hasta los 18anos), +cuanto se preocupo de que gente de su
grupo racial/etnico experimentara trato
injusto debido a su raza, etnia o color?
(2) Cuando era nino o adolescente (hasta los 18
anos), +cuanto se preocupo de que usted
experimentara trato injusto debido a su raza,
etnia o color?
(3) Durante el ano pasado, +cuanto se preocupo
de que gente de su grupo racial/etnico
experimentara trato injusto debido a su raza,
etnia o color?
(4) Durante el ano pasado, +cuanto se preocupo
de que usted experimentara trato injusto
debido a su raza, etnia o color?
The response options for the ‘‘worry’’
questions were:
1. Casi todo el tiempo
2. Algunas veces
3. Rara vez o nunca
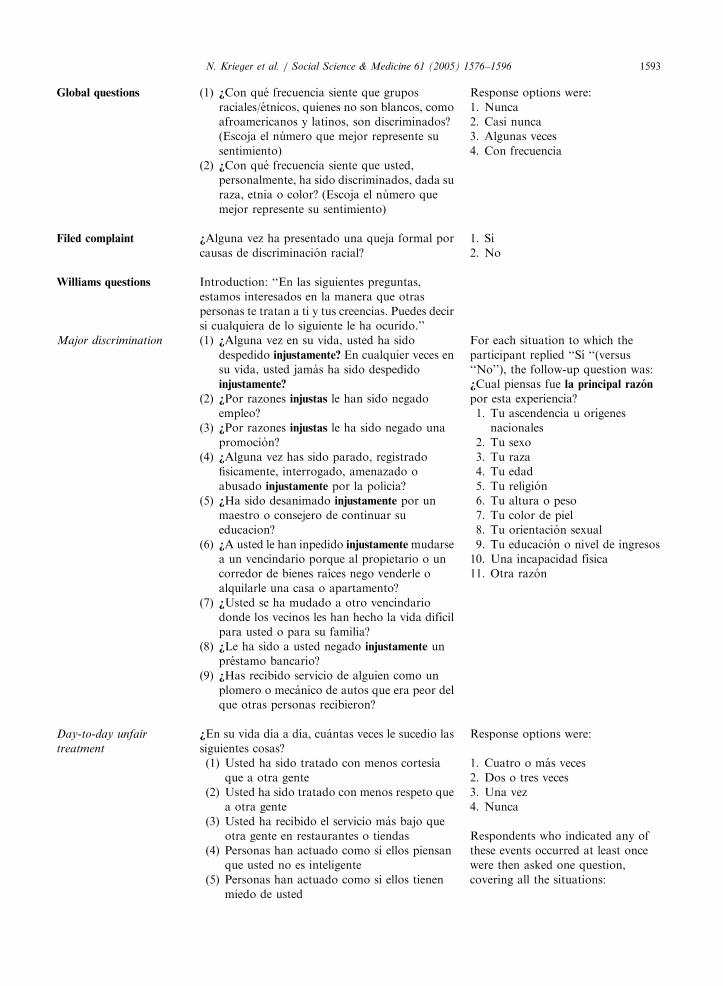
ARTICLE IN PRESSN. Krieger et al. / Social Science & Medicine 61 (2005) 1576–1596 1593
Global questions
(1) +Con que frecuencia siente que gruposraciales/etnicos, quienes no son blancos, como
afroamericanos y latinos, son discriminados?
(Escoja el numero que mejor represente su
sentimiento)
(2) +Con que frecuencia siente que usted,
personalmente, ha sido discriminados, dada su
raza, etnia o color? (Escoja el numero que
mejor represente su sentimiento)
Response options were:
1. Nunca
2. Casi nunca
3. Algunas veces
4. Con frecuencia
Filed complaint
+Alguna vez ha presentado una queja formal porcausas de discriminacion racial?
1. Sı
2. No
Williams questions
Introduction: ‘‘En las siguientes preguntas,estamos interesados en la manera que otras
personas te tratan a ti y tus creencias. Puedes decir
si cualquiera de lo siguiente le ha ocurido.’’
Major discrimination
(1) +Alguna vez en su vida, usted ha sidodespedido injustamente? En cualquier veces en
su vida, usted jamas ha sido despedido
injustamente?
(2) +Por razones injustas le han sido negado
empleo?
(3) +Por razones injustas le ha sido negado una
promocion?
(4) +Alguna vez has sido parado, registrado
fisicamente, interrogado, amenazado o
abusado injustamente por la policia?
(5) +Ha sido desanimado injustamente por un
maestro o consejero de continuar su
educacion?
(6) +A usted le han inpedido injustamentemudarse
a un vencindario porque al propietario o un
corredor de bienes raıces nego venderle o
alquilarle una casa o apartamento?
(7) +Usted se ha mudado a otro vencindario
donde los vecinos les han hecho la vida difıcil
para usted o para su familia?
(8) +Le ha sido a usted negado injustamente un
prestamo bancario?
(9) +Has recibido servicio de alguien como un
plomero o mecanico de autos que era peor del
que otras personas recibieron?
For each situation to which the
participant replied ‘‘Sı ‘‘(versus
‘‘No’’), the follow-up question was:
+Cual piensas fue la principal razon
por esta experiencia?
1. Tu ascendencia u orıgenes
nacionales
2. Tu sexo
3. Tu raza
4. Tu edad
5. Tu religion
6. Tu altura o peso
7. Tu color de piel
8. Tu orientacion sexual
9. Tu educacion o nivel de ingresos
10. Una incapacidad fısica
11. Otra razon
Day-to-day unfair
treatment
+En su vida dıa a dıa, cuantas veces le sucedio las
siguientes cosas?
Response options were:
(1) Usted ha sido tratado con menos cortesıa
que a otra gente
(2) Usted ha sido tratado con menos respeto que
a otra gente
(3) Usted ha recibido el servicio mas bajo que
otra gente en restaurantes o tiendas
(4) Personas han actuado como si ellos piensan
que usted no es inteligente
(5) Personas han actuado como si ellos tienen
miedo de usted
1. Cuatro o mas veces
2. Dos o tres veces
3. Una vez
4. Nunca
Respondents who indicated any of
these events occurred at least once
were then asked one question,
covering all the situations:
ARTICLE IN PRESSN. Krieger et al. / Social Science & Medicine 61 (2005) 1576–15961594
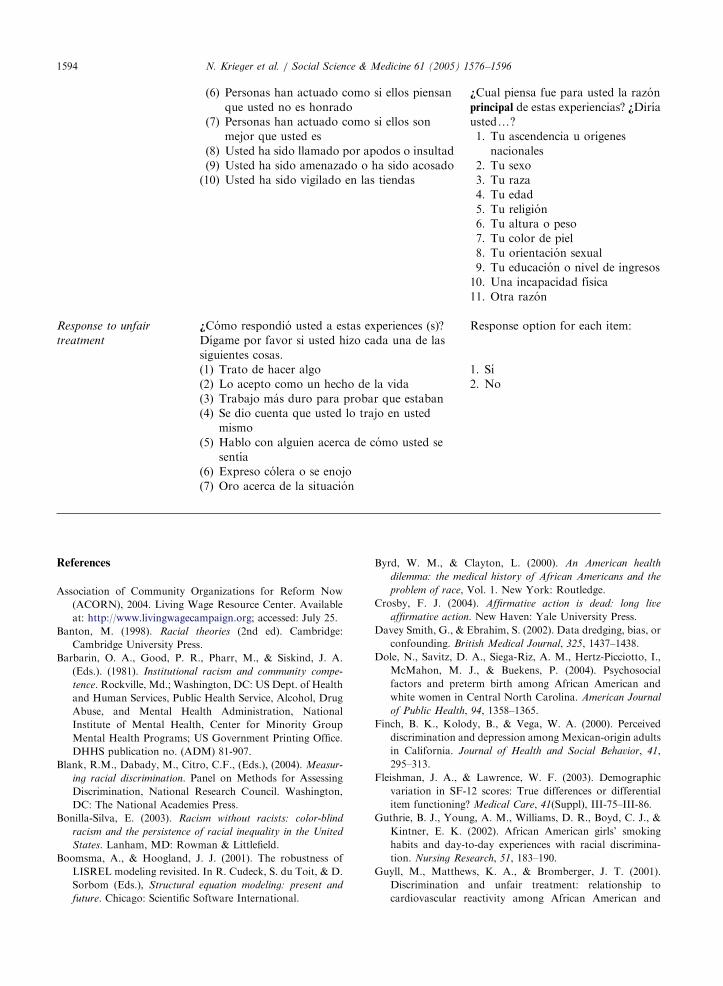
(6) Personas han actuado como si ellos piensan
que usted no es honrado
(7) Personas han actuado como si ellos son
mejor que usted es
(8) Usted ha sido llamado por apodos o insultad
(9) Usted ha sido amenazado o ha sido acosado
(10) Usted ha sido vigilado en las tiendas
+Cual piensa fue para usted la razon
principal de estas experiencias? +Dirıa
ustedy?
1. Tu ascendencia u orıgenes
nacionales
2. Tu sexo
3. Tu raza
4. Tu edad
5. Tu religion
6. Tu altura o peso
7. Tu color de piel
8. Tu orientacion sexual
9. Tu educacion o nivel de ingresos
10. Una incapacidad fısica
11. Otra razon
Response to unfair
treatment
+Como respondio usted a estas experiences (s)?
Dıgame por favor si usted hizo cada una de las
siguientes cosas.
Response option for each item:
(1) Trato de hacer algo
(2) Lo acepto como un hecho de la vida
(3) Trabajo mas duro para probar que estaban
(4) Se dio cuenta que usted lo trajo en usted
mismo
(5) Hablo con alguien acerca de como usted se
sentıa
(6) Expreso colera o se enojo
(7) Oro acerca de la situacion
1. Sı
2. No
References
Association of Community Organizations for Reform Now
(ACORN), 2004. Living Wage Resource Center. Available
at: http://www.livingwagecampaign.org; accessed: July 25.
Banton, M. (1998). Racial theories (2nd ed). Cambridge:
Cambridge University Press.
Barbarin, O. A., Good, P. R., Pharr, M., & Siskind, J. A.
(Eds.). (1981). Institutional racism and community compe-
tence. Rockville, Md.; Washington, DC: US Dept. of Health
and Human Services, Public Health Service, Alcohol, Drug
Abuse, and Mental Health Administration, National
Institute of Mental Health, Center for Minority Group
Mental Health Programs; US Government Printing Office.
DHHS publication no. (ADM) 81-907.
Blank, R.M., Dabady, M., Citro, C.F., (Eds.), (2004). Measur-
ing racial discrimination. Panel on Methods for Assessing
Discrimination, National Research Council. Washington,
DC: The National Academies Press.
Bonilla-Silva, E. (2003). Racism without racists: color-blind
racism and the persistence of racial inequality in the United
States. Lanham, MD: Rowman & Littlefield.
Boomsma, A., & Hoogland, J. J. (2001). The robustness of
LISREL modeling revisited. In R. Cudeck, S. du Toit, & D.
Sorbom (Eds.), Structural equation modeling: present and
future. Chicago: Scientific Software International.
Byrd, W. M., & Clayton, L. (2000). An American health
dilemma: the medical history of African Americans and the
problem of race, Vol. 1. New York: Routledge.
Crosby, F. J. (2004). Affirmative action is dead: long live
affirmative action. New Haven: Yale University Press.
Davey Smith, G., & Ebrahim, S. (2002). Data dredging, bias, or
confounding. British Medical Journal, 325, 1437–1438.
Dole, N., Savitz, D. A., Siega-Riz, A. M., Hertz-Picciotto, I.,
McMahon, M. J., & Buekens, P. (2004). Psychosocial
factors and preterm birth among African American and
white women in Central North Carolina. American Journal
of Public Health, 94, 1358–1365.
Finch, B. K., Kolody, B., & Vega, W. A. (2000). Perceived
discrimination and depression among Mexican-origin adults
in California. Journal of Health and Social Behavior, 41,
295–313.
Fleishman, J. A., & Lawrence, W. F. (2003). Demographic
variation in SF-12 scores: True differences or differential
item functioning? Medical Care, 41(Suppl), III-75–III-86.
Guthrie, B. J., Young, A. M., Williams, D. R., Boyd, C. J., &
Kintner, E. K. (2002). African American girls’ smoking
habits and day-to-day experiences with racial discrimina-
tion. Nursing Research, 51, 183–190.
Guyll, M., Matthews, K. A., & Bromberger, J. T. (2001).
Discrimination and unfair treatment: relationship to
cardiovascular reactivity among African American and

ARTICLE IN PRESSN. Krieger et al. / Social Science & Medicine 61 (2005) 1576–1596 1595
European American women. Health Psychology, 20,
315–325.
Harrell, J. P., Hall, S., & Taliaferro, J. (2003). Physiological
responses to racism and discrimination: an assessment of the
evidence. American Journal of Public Health, 93, 242–248.
Hays, R. D. & the RAND Corporation. (1989). A five-item
measure of socially desirable response set. Educational
Psychology Measurement, 49, 629–636.
Hiett, R. L., McBride, R. S., Fiman, B. G., Thomas, J. A.,
O’Mara, F. E., & Sevilla, E. (1978). The racial attitudes and
perceptions survey (RAPS) Technical Paper 338. Monterey,
CA: US Army Research Institute for the Behavioral and
Social Sciences.
Joreskog, K., & Sorbom, D. (1993). LISREL 8: structural
equation modeling with the SIMPLIS Command Language.
Hillsdale, NJ: Lawrence Erlbaum Association.
Kessler, R. C., Andrew, G., Colpe, L. J., Hiripi, E., Mroczek,
D. K., Normand, S. L. T., Walters, E. E., & Zaslovsky, A.
(2002). Short screening scales to monitor population
prevalences and trends in nonspecific psychological distress.
Psychological Medicine, 32, 959–976.
Kessler, R. C., Michelson, K. D., &Williams, D. R. (1999). The
prevalence, distribution and mental health correlates of
perceived discrimination in the United States. Journal of
Health and Social Behavior, 40, 208–230.
Krieger, N. (1990). Racial and gender discrimination: risk
factors for high blood pressure? Social Science & Medicine,
30, 1273–1281.
Krieger, N. (2000). Discrimination and health. In L. Berkman,
& I. Kawachi (Eds.), Social epidemiology (pp. 36–75). New
York: Oxford University Press.
Krieger, N. (2001). Theories for social epidemiology in the 21st
century: An ecosocial perspective. International Journal of
Epidemiology, 30, 668–677.
Krieger, N. (2003). Does racism harm health? Did child abuse
exist before 1962? On explicit questions, critical science, and
current controversies: An ecosocial perspective. American
Journal of Public Health, 93, 194–199.
Krieger, N., Rowley, D., Herman, A. A., Avery, B., & Phillips,
M. T. (1993). Racism, sexism, and social class: Implications
for studies of health, disease, and well-being. American
Journal of Preventive Medicine, 6(Suppl), 82–122.
Krieger, N., & Sidney, S. (1996). Racial discrimination and
blood pressure: the CARDIA study of young black and
white adults. American Journal of Public Health, 86,
1370–1378.
Landrine, H., & Klonoff, E. A. (2000). Racial discrimination
and cigarette smoking among Blacks: Findings from two
studies. Ethnicity & Disease, 10, 195–202.
MacCallum, R. C., Widaman, K. F., Preacher, K. J., & Hong,
S. (2001). Sample size in factor analysis: The role of model
error. Multivariate Behavioral Research, 36, 611–637.
McNeilly, M. D., Anderson, N. B., Armstead, C. A., Clark, R.,
Corbett, M., Robinson, E. L., Pieper, C. F., & Lepisto, E.
M. (1996). The perceived racism scale: A multidimensional
assessment of the experience of white racism among African
Americans. Ethnicity & Disease, 6, 156–166.
Office of Applied Studies, Substance Abuse and Mental Health
Services Administration, US Department of Health and
Human Services, (2001). Development of computer-assisted
interviewing procedures for the national household survey
on drug abuse. Available at: http://www.oas.samhsa.gov/
nhsda/CompAssistInterview/toc.htm#TopOfPage. Accessed
on: July 29, 2004.
Pincus, F. L. (2003). Reverse discrimination: Dismantling the
myth. Boulder, CO: Lynne Rienner.
Poston, W. S., Pavlik, V. N., Hyman, D. J., Ogbonnaya, K.,
Hanis, C. L., Haddock, C. K., Hyder, M. L., & Foreyt, J. P.
(2001). Genetic bottlenecks, perceived racism, and hyper-
tension risk among African Americans and first-generation
African immigrants. Journal of Human Hypertension, 15,
341–351.
SAS Institute, Inc. (2001). SAS Language Reference, Version 8.
Cary, NC: SAS Institute.
Smedley, B. D., Stith, A. Y., & Nelson, A. R. (Eds.). (2003).
Unequal treatment: Confronting racial and ethnic disparities
in health care. Committee on Understanding and Eliminat-
ing Racial and Ethnic Disparities in Health Care, Board on
Health Sciences Policy, Institute of Medicine. Washington,
DC: National Academy Press.
Smith, J. P. (2001). Race and ethnicity in the labor market:
trends over the short and long term. In N. J. Smelser, W. J.
Wilson, & F. Mitchell (Eds.), American becoming: Racial
trends and their consequences, Vol. II (pp. 52–97). Commis-
sion on Behavioral and Social Sciences and Education,
National Research Council. Washington, DC: National
Academy Press.
Stancil, T. R., Hertz-Picciotto, I., Schramm, M., & Watt-
Morse, M. (2000). Stress and pregnancy among African–A-
merican women. Paediatric and Perinatal Epidemiology, 14,
127–135.
Stone, A. A., Turkann, J. S., Bachrach, C. A., Jobe, J. B.,
Kurtzmann, H. S., & Cain, V. S. (Eds.). (2000). The science
of self-report: Implications for research and practice.
Mahwah, NJ: Lawrence Erlbaum Associates.
Stuber, J., Galea, S., Ahern, J., Blaney, S., & Fuller, C. (2003).
The association between multiple domains of discrimination
and self-assessed health: A multilevel analysis of Latinos
and blacks in four low-income New York City neighbor-
hoods. Health Service Research, 38(6 Part 2), 1735–1759.
Trosclair, A., Husten, C., Pederson, L., & Dhillon, I. (2002).
Centers for disease control and prevention: Cigarette
smoking among adults—United States, 2000. MMWR
Morbidity and Mortality Weekly Report, 51, 642–645.
US Census Bureau, 2004. Poverty thresholds, 2003. Available
at: http://www.census.gov/hhes/poverty/threshld/thresh03.
html. Accessed: July 4.
Utsey, S. O. (1998). Assessing the stressful effects of racism: A
review of instrumentation. Journal of Black Psychology, 24,
269–288.
Vines, A. I., McNeilly, M. D., Stevens, J., Hertz-Picciotto, I.,
Baird, M., & Baird, D. D. (2001). Development and
reliability of a telephone-administered perceived racism
scale (TPRS): A tool for epidemiological use. Ethnicity &
Disease, 11, 251–262.
Waters, M. C. (1999). Black identities: West Indian immigrant
dreams and American realities. Cambridge, MA: Harvard
University Press.
Williams, D. R., & Jackson, J. S. (2000). Race/ethnicity and the
2000 census: recommendations for African American and
other black populations in the United States. American
Journal of Public Health, 90, 1728–1730.

ARTICLE IN PRESSN. Krieger et al. / Social Science & Medicine 61 (2005) 1576–15961596
Williams, D. R., Neighbors, H. W., & Jackson, J. S. (2003).
Racial/ethnic discrimination and health: findings from
community studies. American Journal of Public Health, 93,
200–208.
Williams, D. R., & Williams-Morris, R. (2000). Racism and
mental health: The African American experience. Ethnicity
& Health, 5, 243–268.
Williams, D. R., Yu, Y., Jackson, J. S., & Anderson, N. B.
(1997). Racial differences in physical and mental health:
Socio-economic status, stress and discrimination. Journal of
Health Psychology, 2, 335–351.
Willie, C. V., Kramer, B. M., & Brown, B. S. (Eds.). (1973).
Racism and mental health. Pittsburgh: University of
Pittsburgh Press.
Yen, I. H., Ragland, D. R., Greiner, B. A., & Fisher, J. M. (1999).
Racial discrimination and alcohol-related behavior in urban
transit operators: Findings from the San Francisco Muni
Health and Safety Study. Public Health Reports, 114, 448–458.