Evaluating InSync Performance in Microsimulation Aleksandar Stevanovic, PhD, PE Florida Atlantic...
50
Evaluating InSync Performance in Microsimulation Aleksandar Stevanovic, PhD, PE Florida Atlantic University Transpo 2012 Bonita Springs, FL October 29, 2012
-
Upload
magnus-charles -
Category
Documents
-
view
218 -
download
0
Transcript of Evaluating InSync Performance in Microsimulation Aleksandar Stevanovic, PhD, PE Florida Atlantic...

Evaluating InSync Performance in Microsimulation
Aleksandar Stevanovic, PhD, PE
Florida Atlantic University
Transpo 2012Bonita Springs, FLOctober 29, 2012

Why Simulating InSync?
• Comprehensive evaluation of its performance
• Controlled experiments• Abundance of outputs• Better understanding of pros &
cons• Repeatability and comparability

Originality of this Study
• No comprehensive evaluation of InSync in microsimulation
• Regular operations modeled with no attention to special conditions/situations
• Evaluation of InSync for regular operations (AM, MD, and PM) +• Freeway Incident• Rail Preemption• Extra Demand• Inclement Weather

About SR 421 - Dunlawton Ave
• 12 signalized intersections (11 analyzed)
• Divided 4-6 lane facility
• Left turns• RR crossing
& school zones
• 35-50 mph speed limits

Why SR421 in Volusia County?
• A common (sub)urban corridor
• Difficult to retime
• Seasonal and annual variations in traffic flows
• Evacuation route
10,000
15,000
20,000
25,000
30,000
35,000
40,000
Vehicles/day
Williamson to Clyde Morris Blvd. Clyde Morris Blvd. to SR 5A/Nova Rd.
SR5A/Nova Rd. to Spruce Creek Rd. Spruce Creek Rd. to US 1
Data Collection for VISSIM Model
• Turning movement counts• Travel times along
mainline (GPS & video)• Signal timing sheets &
Synchro files• Other data – RR gate
timings, school zone hours, etc.

Google Map as Background
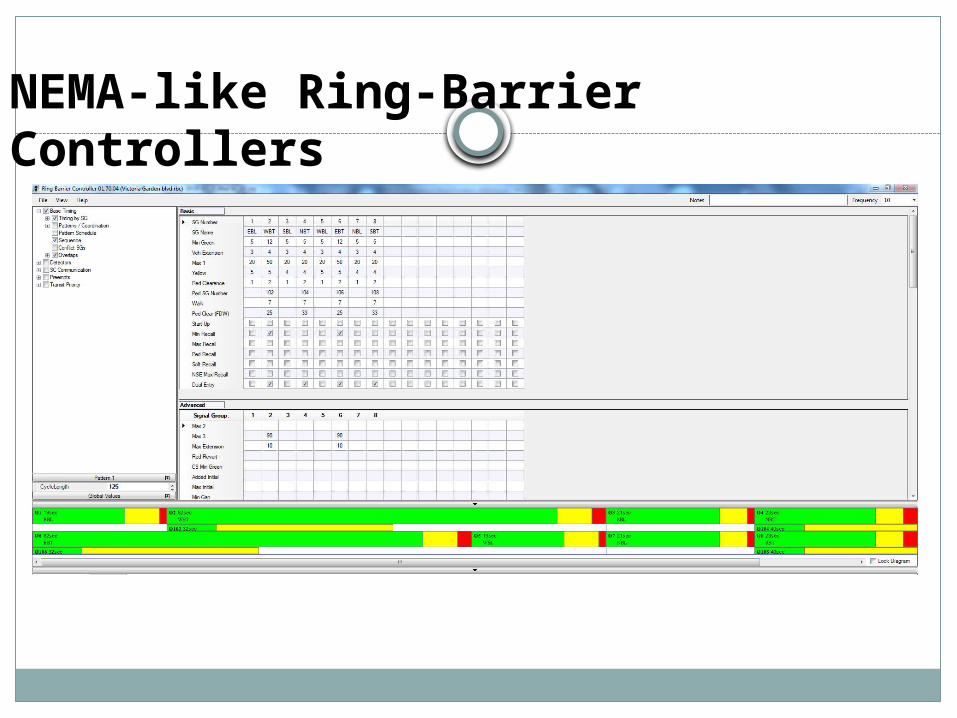
NEMA-like Ring-Barrier Controllers

Calibration
• Making sure that modeled and simulated volumes are equal
• Volume balancing• Sources and sinks• Saturation flow rates• Manual process

Calibration Details – Nova Rd

Calibration Results
R² = 0.9985
0
5000
10000
15000
20000
25000
0 5000 10000 15000 20000 25000
Sim
ula
tion
TM
C
Field TMC
Field vs Simulation AM Peak
R² = 0.9917
0
5000
10000
15000
20000
25000
0 5000 10000 15000 20000 25000
Sim
ula
tion
TM
C
Field TMC
Field vs Simulation MD Peak
R² = 0.9962
0
5000
10000
15000
20000
25000
0 5000 10000 15000 20000 25000
Sim
ula
tion
TM
C
Field TMC
Field vs Simulation PM Peak

Validation
• Verifying that segment travel times from model and field are comparable
• Speed distributions• Acceleration &
deceleration• Offsets & detectors• Understand limitations

Validation Results
0.0
20.0
40.0
60.0
80.0
100.0
120.0
140.0
160.0
180.0
200.0
Eastbound
VISSIM
GPS
0.0
20.0
40.0
60.0
80.0
100.0
120.0
140.0
160.0
Westbound
VISSIM
GPS
0.0
20.0
40.0
60.0
80.0
100.0
120.0
140.0
160.0
Eastbound
VISSIM
GPS
0.0
20.0
40.0
60.0
80.0
100.0
120.0
140.0
160.0
180.0
Westbound
VISSIM
GPS
0.0
50.0
100.0
150.0
200.0
250.0
Eastbound
VISSIM
GPS
0.0
20.0
40.0
60.0
80.0
100.0
120.0
140.0
160.0
180.0
Westbound
VISSIM
GPS
AM Peak MD Peak PM Peak

TOD Signal Timings
Intersection Field SS Optimized MS Optimized Field SS Optimized MS Optimized Field SS Optimized MS Optimized
Williamson 115 110 68 120 124 76 125 144 100
I-95 SB 115 110 68 120 124 76 125 144 100
I-95 NB 115 110 68 120 124 76 125 144 100
Taylor rd 115 110 68 120 124 76 125 144 100
Yorktowne 115 110 68 120 124 76 125 144 80
Clyde Morris 115 110 116 120 124 130 125 144 160
Victoria 115 110 116 120 124 130 125 144 160
Village 115 110 116 120 124 130 125 144 160
Nova A 110 116 A 124 130 A 144 160
Spruce A 110 90 A 124 74 A 144 88
US 1 140 110 90 140 124 74 145 144 88
MD PeakAM Peak PM Peak

InSync – Controllers Run Free
1) Disable all coordination (set controller into “free/uncoordinated” mode)2) Enable Detector Diagnostic Failure Mode
a. Set On failure to 250 minutesb. Set Off failure to 5 minutes
i) Diagnostic failure mode on a 170 will allow itself to come out of failure.3) Set all “Minimum Green” times to 5 sec., or as client feels comfortable4) Leave “Maximum Green” times as before5) Set “Passage Gap” or “Observed Gap” to 1 sec.6) For protected/permitted left turns, omit the left turn call when the opposing thrumovement is green.
• Notes:o This will prevent a yellow trap if the controller receives calls onpermitted left turn phases when the opposing thru is green, but maynot bring on the adjacent green thru movement to allow the left turna permitted movement.
7) Enable “Soft Recall” on the mainline phases8) Disable “Yellow Lock” and “Red Lock” detector locking9) Set all “Detector Delays” to 0 sec.10) Disable all recalls: Max, Min, Hard, Vehicle, Phase, etc.11) Remove “Extensions”12) Disable “Anti-Backup” or “Left Turn Trap”13) Enable “Max Recall Inhibit”

InSync Detectors in VISSIM

InSync-VISSIM Interface

Field-like InSync Dialog Box
If a picture is used, use this layout. Pics are much preferred over bullets or other text.
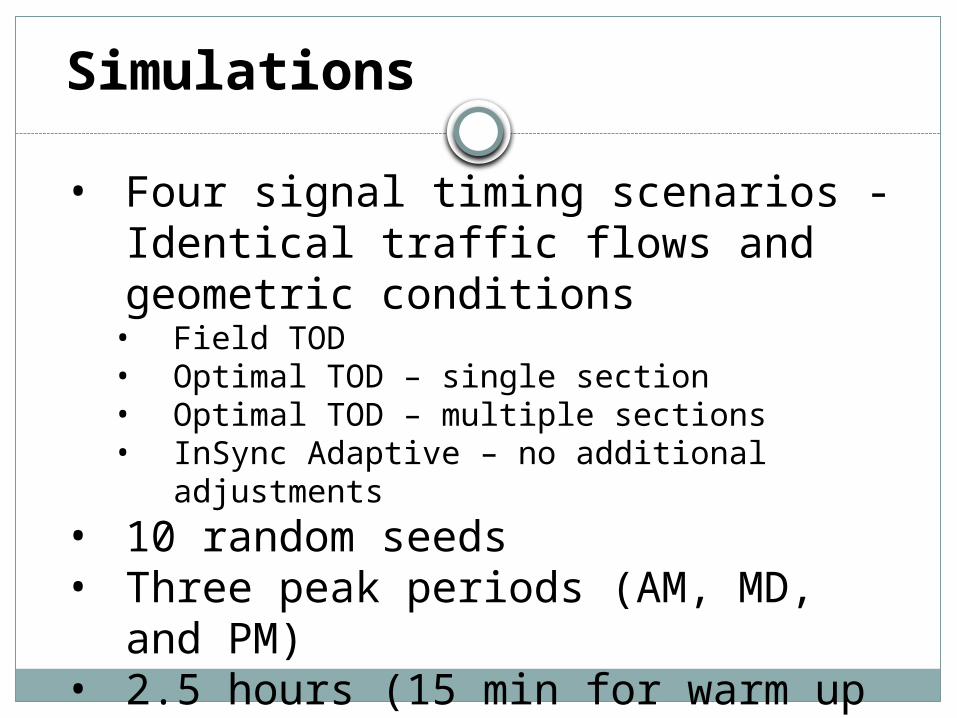
Simulations
• Four signal timing scenarios - Identical traffic flows and geometric conditions• Field TOD• Optimal TOD – single section• Optimal TOD – multiple sections• InSync Adaptive – no additional adjustments
• 10 random seeds• Three peak periods (AM, MD, and
PM)• 2.5 hours (15 min for warm up and
15 min for cool off) for each peak period
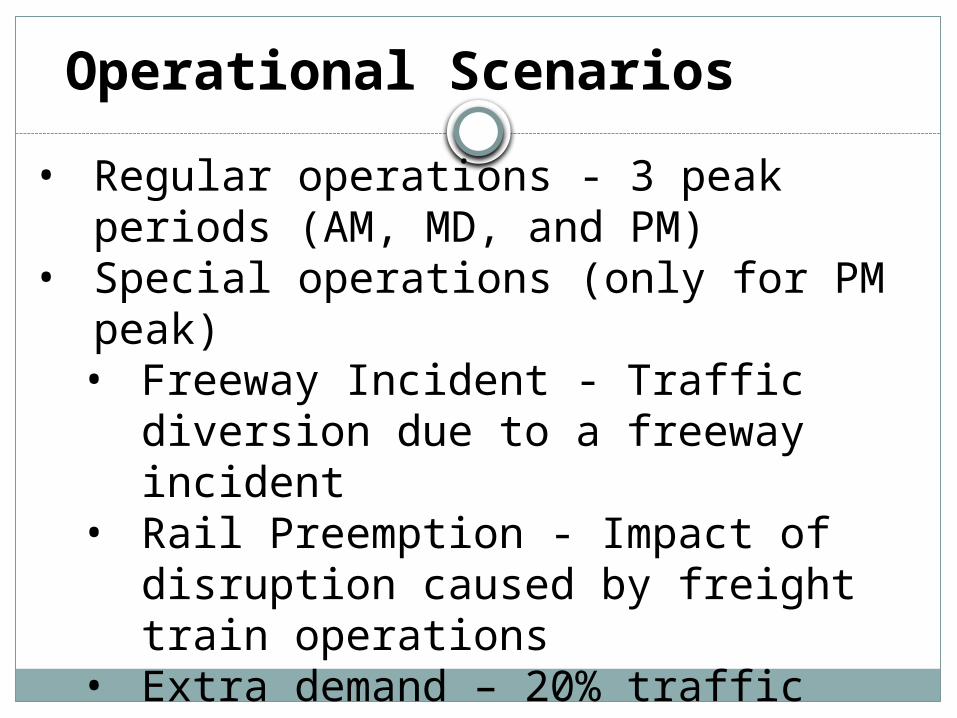
Operational Scenarios
• Regular operations - 3 peak periods (AM, MD, and PM)
• Special operations (only for PM peak)• Freeway Incident - Traffic diversion
due to a freeway incident• Rail Preemption - Impact of
disruption caused by freight train operations
• Extra demand – 20% traffic growth (flat)
• Inclement Weather - Reduction in speed and sat. flows due to a heavy rain

Freeway Incident
• An 1-hour incident on I-95 freeway between SR 421 and SR 400
• One lane closed – traffic diverts to SR 421
• AADT ~ 50,000 veh/day; k factor ~ 15%; d factor ~ 55%; 4 lanes
• 1,000 veh – diverted to SR 421 during one hour

Diversion Routes
300
300
200
2001000
vph
Incident
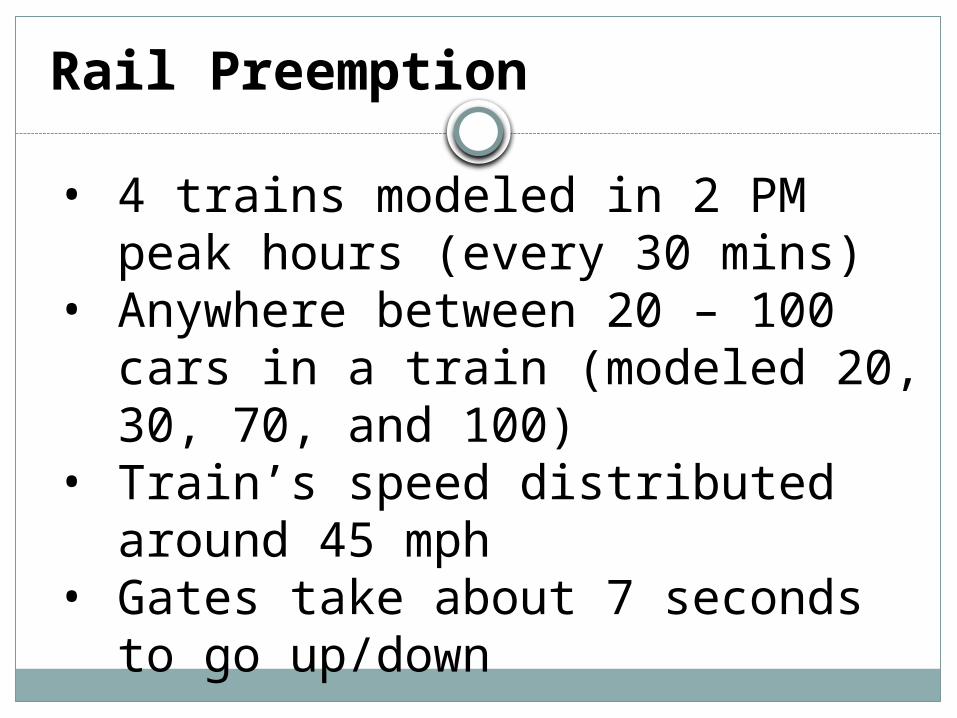
Rail Preemption
• 4 trains modeled in 2 PM peak hours (every 30 mins)
• Anywhere between 20 – 100 cars in a train (modeled 20, 30, 70, and 100)
• Train’s speed distributed around 45 mph
• Gates take about 7 seconds to go up/down

SR 421 & FEC Railway
FEC RR

Extra Demand
• Flat increase of 20% for all of the traffic demand generators
• Turning movement proportions remain the same
• Impact on intersections – almost all intersections worsen LOS by one grade
• Oversaturated network (8 ints. at LOS D or worse; 4 ints. at LOS E or worse)

Inclement Weather
• Inclement weather conditions (heavy rain) in Florida
• PM Peak traffic demand unaltered (worst-case scenario)
• Travelling speeds reduced by ~ 15% (from - 20% to -10%)
• Saturation flows reduced by ~ 20% (~ ~ 1500 vph)

What was Evaluated?
• Intersection performance
• Main-corridor travel times
• Main street vs. Side street
• Network performance

Results Examples

Intersection Performance
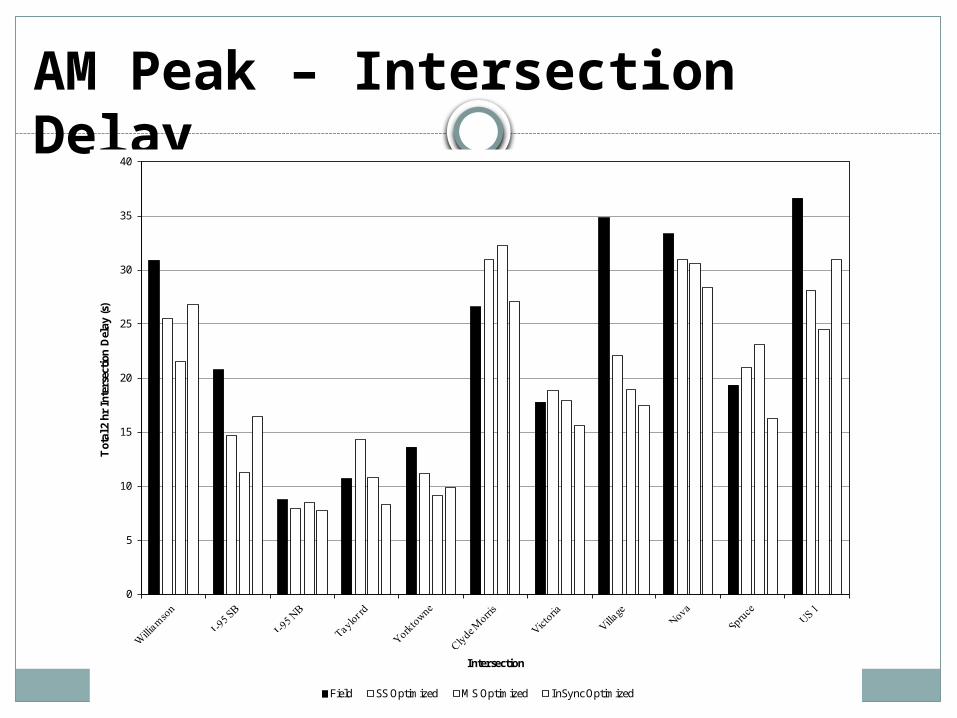
AM Peak – Intersection Delay
0
5
10
15
20
25
30
35
40
Tot
al 2
hr
Inte
rsec
tion
Del
ay (s
)
Intersection
Field SS Optimized MS Optimized InSync Optimized

MD Peak – Number of Stops
0.00
0.10
0.20
0.30
0.40
0.50
0.60
0.70
0.80
0.90
Num
ber
of S
tops
per
Veh
icle
Intersection
Field SS Optimized MS Optimized InSync Optimized
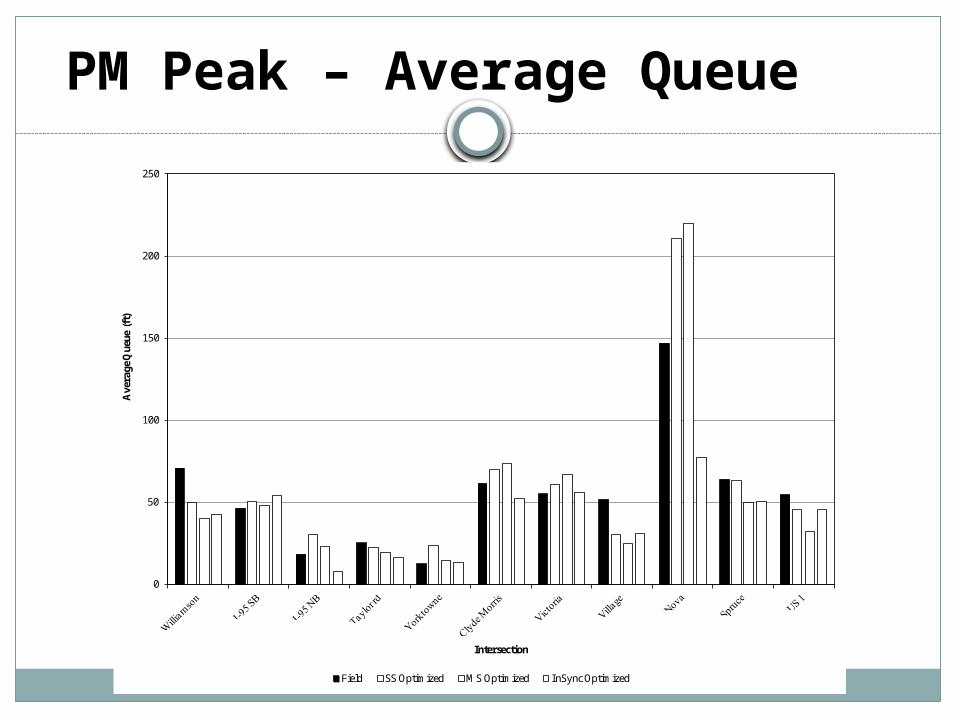
PM Peak – Average Queue
0
50
100
150
200
250
Ave
rage
Que
ue (
ft)
Intersection
Field SS Optimized MS Optimized InSync Optimized

Intersection Field SS Optimized MS Optimized InSync Optimized
Williamson E D C DI-95 SB D D C DI-95 NB B B B ATaylor rd C C C BYorktowne C D C CClyde Morris E E E EVictoria D E E DVillage D F E BNova F F F ESpruce F D C DUS 1 D D C D
LOS
ED – Level of Service

Main-Corridor Travel Times

IW Travel Times EB
0
50
100
150
200
250
300
350
Tra
vel T
ime
(s)
Segments
Field SS Optimized MS Optimized InSync Optimized

IW Travel Times WB
0
50
100
150
Tra
vel T
ime
(s)
Segments
Field SS Optimized MS Optimized InSync Optimized

IW Travel Times All
0
100
200
300
400
500
600
700
800
900
Tra
vel T
ime
(s)
Direction
Field SS Optimized MS Optimized InSync Optimized

IW Travel Times - Summary
Percent improvement
No. From To TT (s) Speed (mph) LOS TT (s) Speed (mph) LOS TT (s) Speed (mph) LOS TT (s) Speed (mph) LOS InSync vs Field InSync vs SS Synchro InSync vs MS Synchro
1 Williamson I-95 SB 25.4 19.0 D 26.3 18.3 D 22.6 21.3 D 24.6 19.6 D -3.36 -6.54 8.572 I-95 SB I-95 NB 9.3 35.0 A 9.2 35.2 A 13.5 24.1 C 10.0 32.5 B 7.60 8.35 -25.973 I-95 NB Taylor 23.4 21.3 D 22.2 22.5 C 20.9 24.0 C 18.6 26.8 C -20.53 -16.15 -10.694 Taylor Yorktowne 28.7 38.5 A 31.1 35.5 A 34.8 31.7 B 33.5 33.0 B 16.61 7.67 -3.865 Yorktowne Clyde Morris 44.0 27.6 C 68.7 17.7 D 66.8 18.2 D 45.0 27.0 C 2.21 -34.44 -32.596 Clyde Morris Victoria 51.2 28.4 B 48.9 29.7 B 54.2 26.8 C 44.0 33.0 B -13.92 -9.92 -18.727 Victoria/City Swallowtail 72.2 20.4 D 57.7 25.6 C 58.0 25.4 C 57.1 25.8 C -20.91 -1.10 -1.648 Swallowtail Nova 198.7 9.2 F 300.9 6.1 F 295.2 6.2 F 93.3 19.5 D -53.05 -69.00 -68.409 Nova Spruce 101.8 32.2 B 108.7 30.2 B 114.6 28.6 B 88.6 37.0 A -12.94 -18.46 -22.7010 Spruce US 1 148.8 17.3 D 98.0 26.2 C 120.8 21.3 D 120.8 21.3 D -18.83 23.33 -0.04
11 US 1 Spruce 134.6 19.2 D 78.2 33.0 B 104.7 24.6 C 81.8 31.5 B -39.19 4.63 -21.8212 Spruce Nova 134.9 24.2 C 141.3 23.1 C 143.3 22.8 C 124.8 26.1 C -7.49 -11.65 -12.8913 Nova Swallowtail 67.7 26.9 C 53.7 33.9 B 52.9 34.5 B 56.2 32.5 B -17.06 4.49 6.1514 Swallowtail Victoria 53.8 27.4 C 57.0 25.9 C 57.5 25.6 C 62.4 23.6 C 16.12 9.41 8.5215 Victoria/City Clyde Morris 55.2 26.5 C 61.3 23.9 C 59.9 24.4 C 50.3 29.1 B -8.89 -17.93 -16.0816 Clyde Morris Yorktowne 40.2 30.8 B 59.7 20.7 D 48.8 25.4 C 42.1 29.4 B 4.75 -29.51 -13.7917 Yorktowne Taylor 33.7 32.8 B 32.8 33.7 B 34.2 32.3 B 30.3 36.4 A -9.99 -7.59 -11.4118 Taylor I-95 NB 23.3 19.8 D 20.8 22.2 C 28.3 16.3 E 17.2 26.8 C -26.13 -16.98 -39.1619 I-95 NB I-95 SB 14.0 23.2 C 14.8 21.8 D 21.5 15.0 E 14.1 23.0 C 0.88 -5.04 -34.5520 I-95 SB Williamson 49.9 9.7 F 32.2 15.0 E 30.5 15.8 E 21.4 22.6 C -57.17 -33.74 -30.1021 Williamson US 1 681.8 20.9 D 763.5 18.6 D 802.2 17.7 D 548.5 25.9 C -19.55 -28.16 -31.6222 US 1 Williamson 585.0 24.3 C 548.0 25.9 C 559.3 25.4 C 521.6 27.2 C -10.83 -4.81 -6.74
InSync Optimized % Change
EA
STB
OU
ND
WE
STB
OU
ND
S
Field SS Optimized MS Optimized
-19.55 -28.16 -31.62
-10.83 -4.81 -6.74

Main Street vs. Side Street

RP Main vs. Side Street T & L
0.0
10.0
20.0
30.0
40.0
50.0
60.0
70.0
Agg
rega
te D
elay
per
Veh
icle
(s)
Street / Movement
Field SS Optimized MS Optimized InSync Optimized
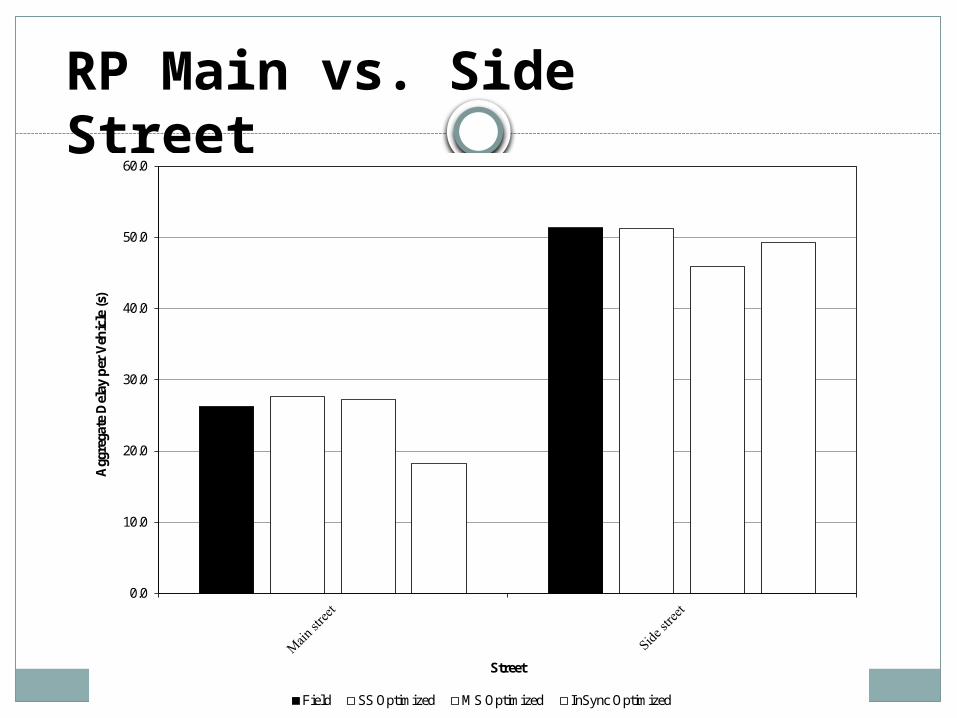
RP Main vs. Side Street
0.0
10.0
20.0
30.0
40.0
50.0
60.0
Agg
rega
te D
elay
per
Veh
icle
(s)
Street
Field SS Optimized MS Optimized InSync Optimized

Network Performance

FI Total Network Delay
0
100
200
300
400
500
600
700
800
900
Tot
al N
etw
ork
Del
ay (h
)
Signal Timings
Field SS Optimized MS Optimized InSync Optimized

FI Total Number of Stops
47000
48000
49000
50000
51000
52000
53000
54000
55000
56000
57000
Tot
al N
um
ber
of S
top
s
Signal Timings
Field SS Optimized MS Optimized InSync Optimized

FI Total Travel Time
1450
1500
1550
1600
1650
1700
1750
Tot
al T
rave
l Tim
e (h
)
Signal Timings
Field SS Optimized MS Optimized InSync Optimized

FI Network Summary
Parameter Field SS Optimized MS Optimized InSync InSync vs Field InSync vs SS Opt InSync vs MS Opt
Average delay time per vehicle [s] 90.0 93.8 88.4 74.0 -17.8 -21.1 -16.3 Average number of stops per vehicles 1.77 1.80 1.79 1.64 -7.7 -9.1 -8.7 Average speed [mph] 20.5 20.1 20.7 22.3 8.9 11.1 8.0 Average stopped delay per vehicle [s] 61.7 63.0 57.7 48.2 -21.8 -23.5 -16.4 Total delay time [h] 771.3 804.4 756.9 633.4 -17.9 -21.3 -16.3 Total Distance Traveled [mi] 34419.8 34384.4 34360.2 34380.3 -0.1 0.0 0.1 Latent delay time [h] 2.3 2.4 2.2 2.2 -6.9 -9.2 -3.5 Latent demand 14.0 14.3 11.6 12.7 -9.3 -11.2 9.5 Number of Stops 54737.7 55652.4 55293.7 50461.7 -7.8 -9.3 -8.7 Number of vehicles in the network 627 629 598 593 -5.5 -5.8 -1.0 Number of vehicles that have left the network 30218 30244 30231 30216 0.0 -0.1 0.0Total number of vehicles (network throughput)30845 30873 30830 30809 -0.1 -0.2 -0.1 Total stopped delay [h] 528.4 540.6 494.1 412.8 -21.9 -23.6 -16.5 Total travel time [h] 1678.1 1710.3 1661.8 1539.0 -8.3 -10.0 -7.4
% change

Summary of Results
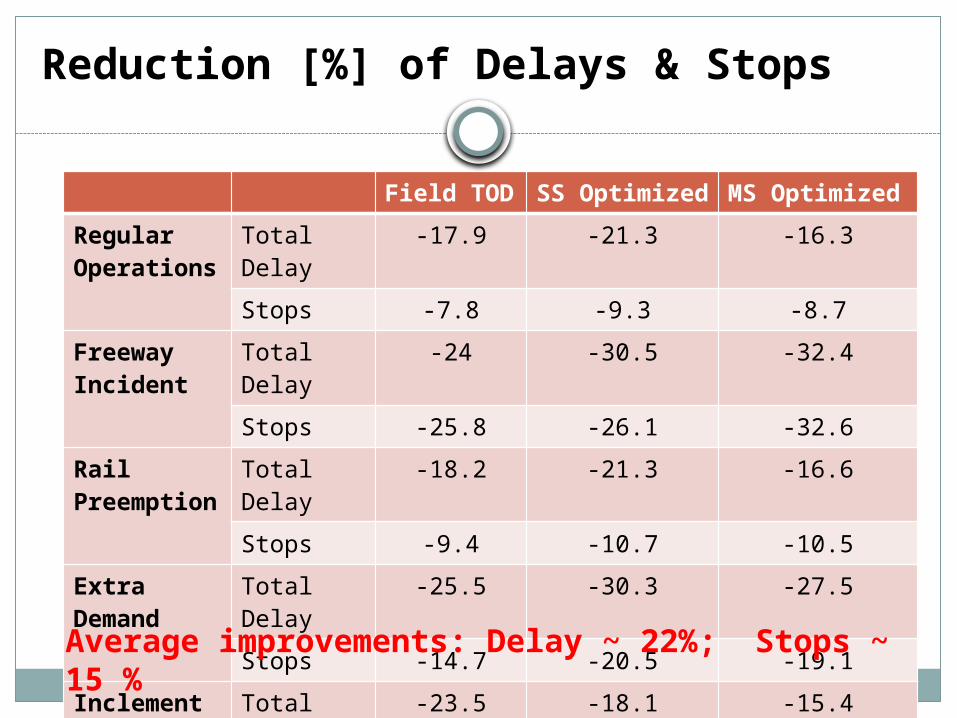
Reduction [%] of Delays & Stops
Field TOD
SS Optimized
MS Optimized
Regular Operations
Total Delay
-17.9 -21.3 -16.3
Stops -7.8 -9.3 -8.7
Freeway Incident
Total Delay
-24 -30.5 -32.4
Stops -25.8 -26.1 -32.6
Rail Preemption
Total Delay
-18.2 -21.3 -16.6
Stops -9.4 -10.7 -10.5
Extra Demand
Total Delay
-25.5 -30.3 -27.5
Stops -14.7 -20.5 -19.1
Inclement Weather
Total Delay
-23.5 -18.1 -15.4
Stops -11.6 -7.4 -8.7
Average improvements: Delay ~ 22%; Stops ~ 15 %

Summary – All Scenarios
Field TOD SS Optimized
MS Optimized
PM Peak
Intersections
Travel times
Main vs. Side
Network
InSync better than a respective TOD signal timingResults are not definite or TOD is better