Estimating EV diffusion and charging infrastructure demand ...
11
EVS33 1 33 nd Electric Vehicle Symposium (EVS33) Portland, Oregon, June 14 - 17, 2020 Estimating EV diffusion and charging infrastructure demand per neighbourhood Nazir Refa ElaadNL, Utrechtseweg 310, Arnhem, the Netherlands, [email protected] Summary The transition from internal combustion cars towards electric vehicles (EV) is a massive operation within the mobility sector with obvious consequences for automotive industry, energy sector, and the built environment. In order to facilitate this transition it is relevant to quantify when, and where one can project the adoption of EVs. Based on the local adoption scenario’s one can also strategically plan the deployment of charging infrastructure. This research provides a detailed insight into the adoption of EVs by using a new bottom-up approach. In addition, estimates are given for quantity, and the type of charging infrastructure at neighbourhood level in the Netherlands till 2035. Keywords: electric vehicle, charging, infrastructure, modelling, scenario 1 Introduction In countries such as the Netherlands and Norway electrification of passenger vehicles is expected to happen within a relatively short period of time [1]. In the case of the Netherlands the share of electric vehicles (EV) is increasing rapidly in the last two years [2]. In addition, national targets are set in order to achieve CO2- emission reduction within the mobility sector [3]. However, the exact growth path is still unknown, and in addition little is known about the local adoption of EVs. For local governments (e.g. municipalities), and distribution system operators (DSO) it is essential to have insights in the potential EV adoption at the local level. Municipalities find it important to have insights on the potential EV penetration in their administrative area. These types of information could be useful in strategic roll-out policies for charging infrastructure in order to facilitate the charging need of EV-users. Charging points are new objects which needs to be added in the existing power infrastructure. The DSO are interested in the growth path of charging infrastructure because it helps them to plan their workload. Furthermore, by knowing the EV penetration rate the DSO can quantify the potential grid impact of EVs and take the necessary action. In recent years multiple studies, and reports have been conducted to understand the EV growth, and the charging infrastructure demand in the Netherlands [4 – 10]. Although, many of these studies are partially based on a bottom-up approach but the necessary level of transparency, reproducibility, and depth (covering time span, geographical implications, and charging infrastructure dimensions) is missing in these studies. In this research we have combined several data sources to map the potential for EV adoption, and charging infrastructure developments in the coming 15 year. These data includes i.e. socio-demographic data with insights from charging data, property data (residential, and non-residential buildings), and market information. Based on these input sources we have created bottom-up models for EV diffusion, and charging infrastructure demand.
Transcript of Estimating EV diffusion and charging infrastructure demand ...

EVS33 1
33nd Electric Vehicle Symposium (EVS33)
Portland, Oregon, June 14 - 17, 2020
Estimating EV diffusion and charging infrastructure
demand per neighbourhood
Nazir Refa
ElaadNL, Utrechtseweg 310, Arnhem, the Netherlands, [email protected]
Summary
The transition from internal combustion cars towards electric vehicles (EV) is a massive operation within the
mobility sector with obvious consequences for automotive industry, energy sector, and the built environment.
In order to facilitate this transition it is relevant to quantify when, and where one can project the adoption of
EVs. Based on the local adoption scenario’s one can also strategically plan the deployment of charging
infrastructure. This research provides a detailed insight into the adoption of EVs by using a new bottom-up
approach. In addition, estimates are given for quantity, and the type of charging infrastructure at
neighbourhood level in the Netherlands till 2035.
Keywords: electric vehicle, charging, infrastructure, modelling, scenario
1 Introduction
In countries such as the Netherlands and Norway electrification of passenger vehicles is expected to happen
within a relatively short period of time [1]. In the case of the Netherlands the share of electric vehicles (EV)
is increasing rapidly in the last two years [2]. In addition, national targets are set in order to achieve CO2-
emission reduction within the mobility sector [3]. However, the exact growth path is still unknown, and in
addition little is known about the local adoption of EVs. For local governments (e.g. municipalities), and
distribution system operators (DSO) it is essential to have insights in the potential EV adoption at the local
level. Municipalities find it important to have insights on the potential EV penetration in their administrative
area. These types of information could be useful in strategic roll-out policies for charging infrastructure in
order to facilitate the charging need of EV-users. Charging points are new objects which needs to be added
in the existing power infrastructure. The DSO are interested in the growth path of charging infrastructure
because it helps them to plan their workload. Furthermore, by knowing the EV penetration rate the DSO can
quantify the potential grid impact of EVs and take the necessary action.
In recent years multiple studies, and reports have been conducted to understand the EV growth, and the
charging infrastructure demand in the Netherlands [4 – 10]. Although, many of these studies are partially
based on a bottom-up approach but the necessary level of transparency, reproducibility, and depth (covering
time span, geographical implications, and charging infrastructure dimensions) is missing in these studies. In
this research we have combined several data sources to map the potential for EV adoption, and charging
infrastructure developments in the coming 15 year. These data includes i.e. socio-demographic data with
insights from charging data, property data (residential, and non-residential buildings), and market
information. Based on these input sources we have created bottom-up models for EV diffusion, and charging
infrastructure demand.

EVS33 2
2 Methods
As a first step we have developed three scenarios to estimate the EV adoption on national level. Second, we
have built a model in order to estimate the EV adoption rate per neighbourhood till 2035. Third, considering
the EV adoption rate, we estimate the demand for charging infrastructure. In addition, we have studied
charging data in order to support the relevant assumptions for future need of public charging infrastructure.
In this section we elaborate on the input datasets, and we describe the generic steps taken to build both
models.
2.1 Input data
The Dutch national bureau of statistics (CBS) is publishing an elaborated sets of socio-demographic related
data at the neighbourhood (in Dutch buurten) level [11]. This so called neighbourhood statistics include
mainly socio-demographic data which describe the characteristics of an ‘average’ household per
neighbourhood. This data includes variables such as income, education level, car ownership, dwelling types
and ownership. For the purpose of this study we are making extensive use of this data from several years in
order to map the characteristics of each neighbourhood as detailed as possible.
In addition, we have enriched these data with other publicly available dataset about the building
characteristics [12]. For each building there information available about it main function (e.g. residential,
office, or shop), land size, and construction year. For each residential building we have also identified the
physical availability of a private parking spot (e.g. driveway).
In this study we are focusing on neighbourhood level for three main reasons. First, there is historical socio-
demographic data (including passenger car fleet) available on this geographical level, and the CBS is
updating these datasets every year. Second, the boundaries of each individual neighbourhood is created based
on the dominant function of its buildings (e.g. living, work/industry, or recreation). Finally, in general the
official boundaries of neighbourhoods remain constant. So, given these three reasons, this geographical scale
can be seen as a relevant for the purpose of this study. There are about 13.400 neighbourhoods in the
Netherlands. An average neighbourhoods has an area of about 2.5 km2, around 1.300 inhabitants divided over
590 households. In each neighbourhood there about 600 passenger cars registered.
Figure 1: Overview of input variables per geographical level
Figure 2: Map of the Netherlands on
neigbourhood level (>13.400 grid cells)

EVS33 3
For the purpose of this research we have created an extensive dataset whereby all available, and analysed
information per neighbourhood has been included. One of the relevant indicator for adoption, and type of
charging infrastructure demand related to indicator whether households possess over their own driveway. By
analysis the Dutch building stock we have been able to quantify what percentage of the households are per
neighbourhood with a driveway. In general, this group of households live in detached house or semi-detached
house. On average 30% of the Dutch houses have their own parking spot on their premises. Figure 3 shows
the geographical distribution of this indicator on municipality level. Overall, one can notice that relatively
lower percentages of the households in more urban areas (western part of the country which also called
Randstad) have a driveway compared to more rural areas (mainly northern part of the Netherlands).
Figure 3: Share of households with driveway per municipality (based on analysis of residential building stock)
2.3 EV adoption model
Primarily, we have defined three scenarios for EV adoption rate in the Netherlands based on literature [4, 6-
9] analysis, historical development of the passenger cars in the Netherlands, and we mainly focused on the
share of EVs in annual sales of passenger vehicles till 2035. Second, we allocated the national scenarios into
neighbourhood level. In this process we define the maximum market size for EVS based on the current
number of passenger vehicles per neighbourhood. We also extrapolate the number of passenger cars based
historical developments in the las ten years. In addition, we aim to distinguish the EV adoption rate between
neighbourhoods. Therefore, we have composed an indicator which we call the local adoption factor (LAF)
for EVs.
To determine this indicator we have tried to decompose factors which explain the current car ownership per
household. The indicator car ownership per household can be seen as an major determinant for potential EV
adoption in the future. On neighbourhood level we mapped the correlation between the car ownership per
household with the following indicators; percentage of owner-occupied homes, the value of homes, income
distribution, address density (number of addresses per km2). We also included the percentage of houses with
driveway.
In addition, based on the current EV adoption rate (data from March 2019, and adjusted for lease vehicles)
we created a multiple linear regression model. From this model we only used the relative importance value

EVS33 4
(weight) for each variable (predictor) to define the LAF. In order to quantify the LAF per neighbourhood we
multiply the weight of each variable with the relative position score of each neighbourhood in the distribution
per variable. For the relative position score we first defined 0.20, 0.40, 0.60, and 0.80 quantile values (on
country level) per variable. Subsequently, we compare the value of each variable per neighbourhood with the
corresponding quantile values on the national level. For example, if the average household income per
neighbourhood is below the 0.20 quantile value, then this neighbourhood gets 0.2 score for variable income.
Thus, the LAF is value (0 - 1) is an multiplication of the position scores per variable with the corresponding
weight per variable (from the regression model).
Finally, the cumulative number of EVs (N) in year t and in scenario s within a neighbourhood is defined as
follows;
𝐍𝐭,𝐬 = 𝑎𝑑𝑜𝑝𝑡𝑖𝑜𝑛 𝑟𝑎𝑡𝑒𝑡,𝑠 ∗ 𝑚𝑎𝑟𝑘𝑒𝑡 𝑠𝑖𝑧𝑒𝑡,𝑠 ∗ 𝐿𝐴𝐹 ∗ 𝑎𝑑𝑗𝑢𝑠𝑡𝑚𝑒𝑛𝑡 𝑓𝑎𝑐𝑡𝑜𝑟 (1)
So, in this equation the first two elements (national EV adoption rate, and market size) are changing over
time, and the LAF is assumed as a constant factor. Adjustment factor (≈ 1.15 in this case) is also a constant
in order to match with the national EV projections.
2.4 Charging infrastructure model
Based on the EV diffusion model we estimate the number of EVs which will be adopted by the households
per neighbourhood. However, these vehicles will need charging infrastructure. In addition, the total demand
of charging infrastructure consists from three type of EVs within a neighbourhood. Furthermore, our EV
diffusion model only allocates EVs to households within a neighbourhood. By doing this, we avoid the issue
of double counting the number of estimated EVs in the Netherlands.
In addition, we have built a model to estimate the charging need of EVs at workplaces. This charging need
(quantified in number of EVs which people will use to commute to their workplace) per neighbourhood is
derived from four indicators; number offices, job types, average commute distance, and percentage of
commutes whom travel from other municipalities to their workplace.
Figure 4 depicts the allocation model applied in this study in order to estimate the amount, and type of
charging points at local level.
Figure 4: Allocation model for charging infrastructure
As it can be seen in the figure, for EVs which have the possibility to charge at home (having a driveway), or
at workplace (having sufficient parking spots), we have allocated home chargers (with a ratio of 1 charging
point per EV), and workplace chargers (ratio 0.5). Finally, EVs which cannot charge at home or at workplaces
EVS33 5
will be dependent on public chargers. In addition, within each neighbourhood there will be an extra demand
for public charging by the so called visitors.
The ratio between number of EVs, and the required number of public charging stations is an much debated
topic when it comes to the roll-out policy for public chargers. In this study, we have analysed the current
usage of public charges in two Dutch cities (The Hague, and Utrecht) with an already ‘mature’ charging
network. More specially, we looked into current ratios between EVs, and amount of charging point per
neighbourhood within these two cities. Currently, we see a ratio between 2.5 and 3 ‘overnight’ chargers per
charging station. However, we assume that this ratio will change over time. Due to maturity of public
charging networks, higher battery capacities of EVs, and more EV users with lower annual mileage, we
expect a decrease in frequency for charging per EV-user. In our model we have defined a function for the
ratio between the projected number of EVs whom are dependent on public charging, and the number of public
chargers to meet the charging need of EVs. For example, at this moment we have installed about 25 charging
stations (50 sockets) in neighbourhood where there are less than 100 ‘overnight’ chargers. In the future, we
expect that there are about half of these amount is needed to fulfil the charging need of an equal group of EV
users per neighbourhood.
In this study we distinguish the category public chargers into two types; charging plaza (between 4 - 40
charging points or sockets per location), and single charging stations (two sockets). In order the quantify the
potential for charging plaza solution per neighbourhood we have analysed about 8.000 public parking
locations. Based on the availability of points of interests (e.g. theatres, sport facilities etc.) near each location,
and, address density we have identified about 1.750 potential locations which could be suitable as charging
plazas. In this study, we prioritize charging plazas above single charging stations. So, per neighbourhood,
and per year our model takes into account the demand for public chargers. If this demand can be fulfilled
with potential offered by charging plaza, then we only allocated number of charging points at charging plaza.
Finally, based on the current usage of different type if charging points, we provide general usage patterns of
the different categories of chargers.
3 Results
In this study we have developed two different bottom-up models to map EV related development in the
Netherlands in coming 15 years. The first model includes the local EV diffusion at neighbourhood level. In
addition, a second model has been developed to quantify the demand for charging infrastructure for each
neighbourhood. In this section we describe the outcome of both models.
3.1 EV diffusion
The number of EVs will continue to increase in the Netherlands. The fall in battery prices, the increasing
production numbers, investments by car companies, the tax benefits and more (fast) charging points mean
that electric cars are becoming a serious option for a wider group of people. However, the exact speed of
adoption is related to the above variables and future (political) choices. Already, a lot of research has already
been done regarding possible growth curves for electric mobility. We have studied these reports [4, 6 – 10]
to define three potential growth scenarios. Figure 5 shows the results of our scenarios.

EVS33 6
Figure 5: EV diffusion scenarios for the Netherlands till 2035
The adoption of electric transport is highly dependent on the percentage of EVs compared to the total numbers
of passenger vehicles. In the Netherlands, between 400,000 and 500,000 new passenger vehicles are sold
annually, of which 1.1% were fully electric in 2016 and 13.7% in 2019 [2]. These percentages are expected
to rise between 29.6%, and 58.0% in respectively low, and high scenario in 2030.
The profile of EV users will also change over time. The current electric drivers drive relatively many electric
kilometers and, also uses his/her vehicle for commuting. In the future we will have more and more EV users
whom use an EV mainly for other activities than commuting, and make fewer kilometers per year. The early
adopters will be followed up by the masses with more ‘average’ mobility pattern.
3.2 Local EV diffusion
As described in section 2.3, we have developed a model to spread the outcome of these scenarios into local
adoption scenarios based the indicator LAF. The adoption of EVs will not develop at the same rate
everywhere. The choice of people to drive electric depends on several socio-demographic factors (e.g.
income). Our distribution model indicates where EV users live, work, and visit in the coming 15 years. After
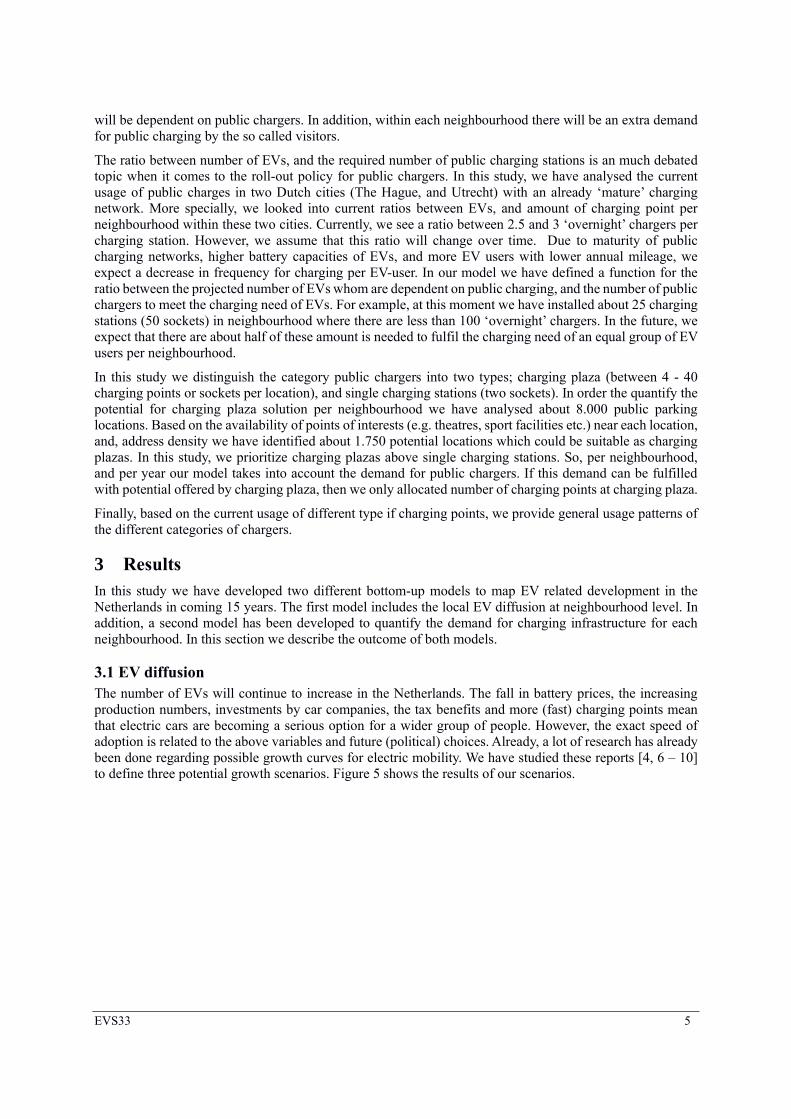
all, these are the locations where EV users can park their vehicles, and possibly charge them. Figure 6 includes
the result of middle scenario for year 2030.
EVS33 7
Figure 6: Projected number of EVs per neighbourhood in 2035
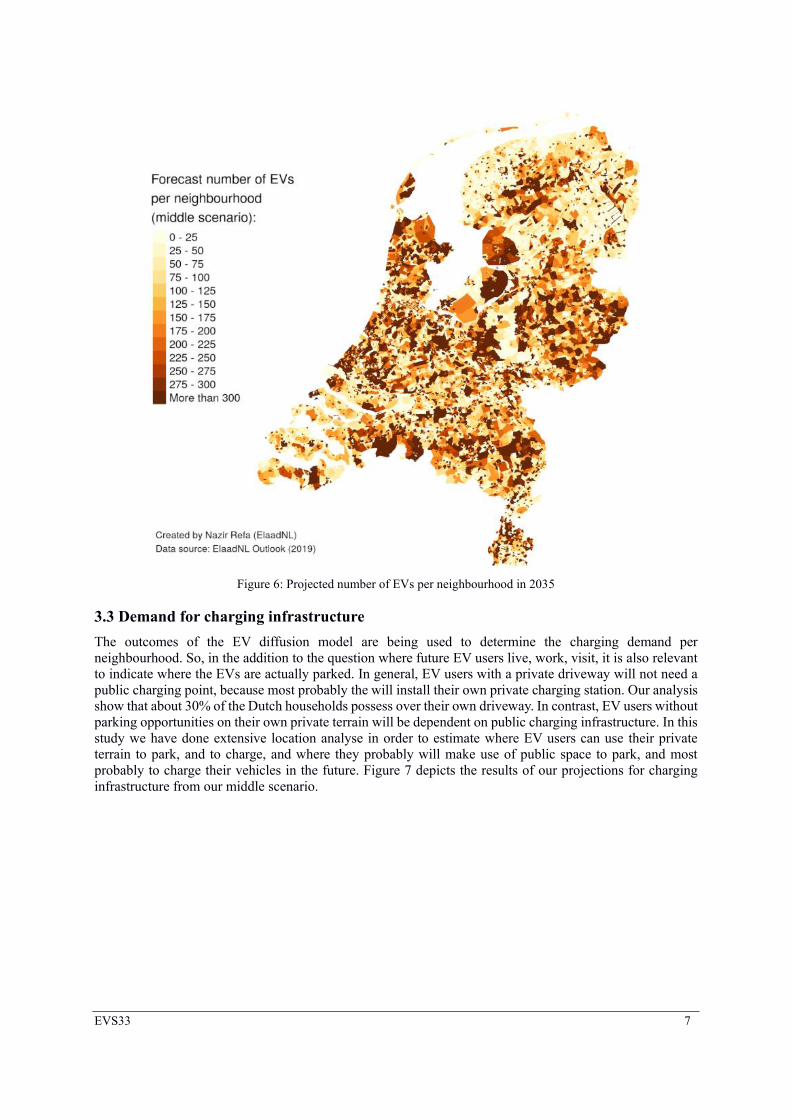
3.3 Demand for charging infrastructure
The outcomes of the EV diffusion model are being used to determine the charging demand per
neighbourhood. So, in the addition to the question where future EV users live, work, visit, it is also relevant
to indicate where the EVs are actually parked. In general, EV users with a private driveway will not need a
public charging point, because most probably the will install their own private charging station. Our analysis
show that about 30% of the Dutch households possess over their own driveway. In contrast, EV users without
parking opportunities on their own private terrain will be dependent on public charging infrastructure. In this
study we have done extensive location analyse in order to estimate where EV users can use their private
terrain to park, and to charge, and where they probably will make use of public space to park, and most
probably to charge their vehicles in the future. Figure 7 depicts the results of our projections for charging
infrastructure from our middle scenario.
EVS33 8
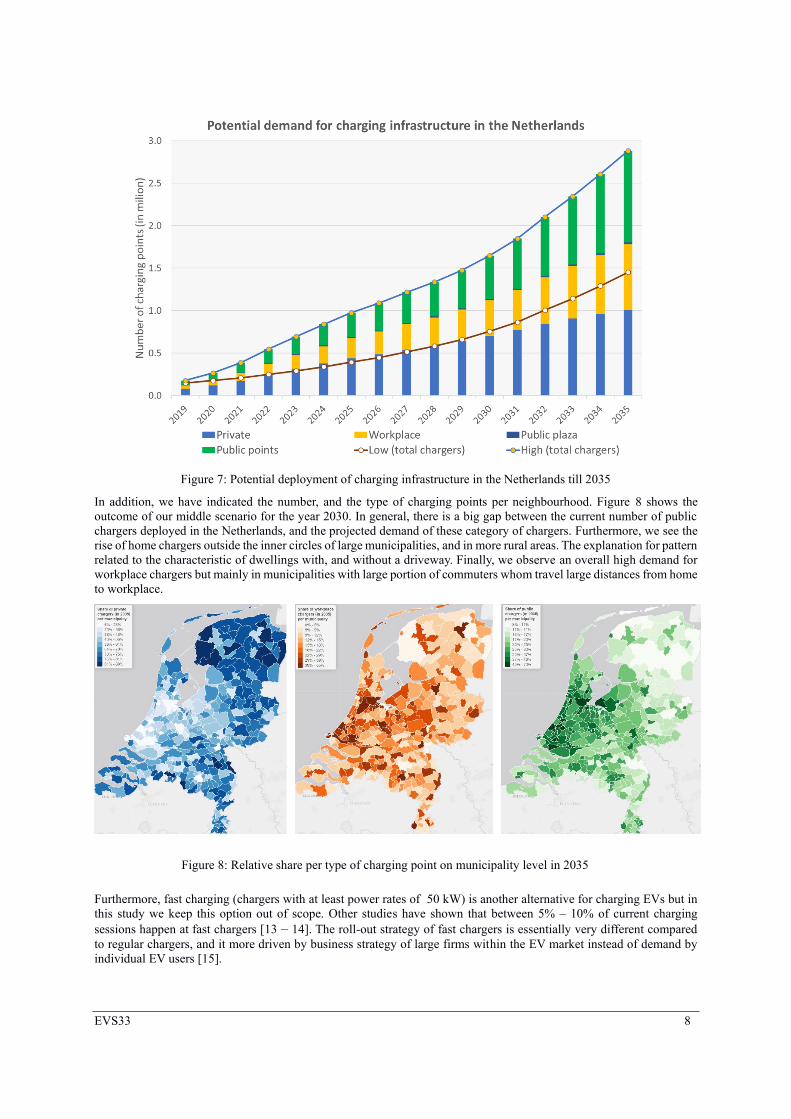
Figure 7: Potential deployment of charging infrastructure in the Netherlands till 2035
In addition, we have indicated the number, and the type of charging points per neighbourhood. Figure 8 shows the
outcome of our middle scenario for the year 2030. In general, there is a big gap between the current number of public
chargers deployed in the Netherlands, and the projected demand of these category of chargers. Furthermore, we see the
rise of home chargers outside the inner circles of large municipalities, and in more rural areas. The explanation for pattern
related to the characteristic of dwellings with, and without a driveway. Finally, we observe an overall high demand for
workplace chargers but mainly in municipalities with large portion of commuters whom travel large distances from home
to workplace.
Furthermore, fast charging (chargers with at least power rates of 50 kW) is another alternative for charging EVs but in
this study we keep this option out of scope. Other studies have shown that between 5% – 10% of current charging
sessions happen at fast chargers [13 – 14]. The roll-out strategy of fast chargers is essentially very different compared
to regular chargers, and it more driven by business strategy of large firms within the EV market instead of demand by
individual EV users [15].
Figure 8: Relative share per type of charging point on municipality level in 2035

EVS33 9
3.4 Usage of charging infrastructure
The share of battery electric vehicles (BEV) has grown strongly in recent years. Where plug-in hybrid
vehicles often use 3.7 kW (single phase 16 Ampere), the BEV vehicles are often equipped with 7.4 kW, 11
kW or even 22 kW AC chargers. As a result, on average the BEVs require more capacity from the power
grid. So, this additional demand by the EVs will have a clear impact on the low-voltage grid.
The regular charging process of EVs which is the dominant strategy nowadays. This means that power is
immediately supplied with the maximum power that the charging point and EV can handle, as soon as EV is
connected to the charging point. The charging process often starts at times when people arrive at home from
work or arrive at work. Figure 9 depicts the current charging behaviour of EV users per location type.
Figure 9: Distribution of arrival times per location type
The regular charging strategy increase the current peaks (morning, and evening) on the low-voltage grid.
Therefore, the addition power demand of EVs can cause local bottlenecks, if one continues with the regular
charging behaviour. Our EV adoption model shows that EV diffusion is not homogenous. The emergence of
bottlenecks due to EVs will be more urgent in neighbourhoods whereby the combination of high EV adoption
goes along with already ‘overloaded’ local power grid.
However, at the same time EVs also offer an opportunity to foster the energy transition by matching the
power demand of the mobility sector with the renewable energy generation [16]. Within the regular charging
patterns, we observe that EVs are connected to the power grid for a long period while the battery is fully
recharged after a few hours. Earlier research shows that mainly "overnight” charging sessions are for 75% of
the total connect time, not charging [17]. This idle time offers opportunity to introduce Smart Charging.
This form of charging takes into account the situation on the local grid capacity while keeping in mind the
preferences (e.g. time of departure, and minimum state of charge) of the EV users. Smart Charging could
facilitate large scale introduction of EVs without reinforcing the current peaks on the power grid. However,
more large scale experimental research is needed in order to map the potential, technical feasibility, impact
on the electricity grid, benefits for the user, business rules, communication protocols, and overall optimization
strategies.
EVS33 10
4. Conclusions and recommendations
In the coming years, the growth of EVs will result in high demand of of new charging points with the
associated grid impact and demand for new grid connections. The growth in the public charging infrastructure
is not expected to increase in a constant proportion due to decreasing charging need per EV.
In the medium term, charging frequency of EVs will decrease due to the fact that the new EVs will be
introduced on the market with larger batteries, and higher charging power. In addition, there will be a new
group of EV users who make fewer kilometers than the average company car driver, and therefore will have
to charge less often. These factors will increase the efficiency in terms of usage of mainly public charging
networks.
Nevertheless, the electrification of the passenger car fleet will lead to substantial demand of new grid
connections (charging points) which the grid operators need to install. The grid impact of EVs will be another
issue in the coming years. Given that fact that Smart Charging is not yet an available option to apply at large
scale and everywhere. Further research, and widespread pilots into the impact of different types of Smart
Charging strategies and, systems are needed to increase its real feasibility.

EVS33 11
References
[1] Bunsen T. et al. (2019), Global EV Outlook 2019: Scaling-up the transition to electric mobility, International
Energy Agency, IEA.
[2] RVO.nl, Cijfers elektrisch vervoer, URL accessed on 2020-02-24;
https://www.rvo.nl/onderwerpen/duurzaam-ondernemen/energie-en-milieu-innovaties/elektrisch-
rijden/stand-van-zaken/cijfers
[3] Nationale Agenda Laadinfrastructuur. URL accessed on 2020-02-24;
https://www.klimaatakkoord.nl/binaries/klimaatakkoord/documenten/publicaties/2019/01/08/achtergrondnot
itie-mobiliteit-laadinfrastructuur/Mobiliteit+-
+achtergrondnotitie+Nationale+Agenda+Laadinfrastructuur.pdf
[4] Ecofys & TU Eindhoven (2016), Toekomstverkenning elektrisch vervoer.
[5] Over Morgen, EVConsult & Enpulse (2018), EV-Prognose Atlas.
[6] ZEnMo (2018), Sparkcity prediction model.
[7] Bernards, R. (2018). Smart planning: integration of statistical and stochastic methods in distribution network
planning, Eindhoven: Technische Universiteit Eindhoven.
[8] Eising, J.W., Van Onna, T., Alkemade, F. (2014), Towards smart grids: Identifying the risks that arise from
the integration of energy and transport supply chains. Applied Energy. 123. 448–455.
[9] Van der Kam, M., et al. (2018), Diffusion of solar photovoltaic systems and electric vehicles among Dutch
consumers: Implications for the energy transition. Energy Research & Social Science. 46. 68-85.
[10] Montfort, K., Van der Poel, G., Visser, J. & Ban den Hoed, Robert. (2016). Prediction of necessary public
charging infrastructure of electric vehicles. 6th Hybrid and Electric Vehicles Conference (HEVC 2016)
[11] CBS, Wijk- en buurtstatistieken, URL accessed on 2020-02-24; https://www.cbs.nl/nl-nl/dossier/nederland-
regionaal/wijk-en-buurtstatistieken
[12] Basisregistratie Adressen en Gebouwen, URL accessed on 2020-02-24;
https://data.overheid.nl/dataset/basisregistratie-adressen-en-gebouwen--bag-
[13] Hardman, S., Jenn, A., Axsen, J. et al. (2018), A review of consumer preferences of and interactions with
electric vehicle charging infrastructure. Transportation Research Part D: Transport and Environment 62, 508
– 523.
[14] Refa, N. & Hubbers N. (2019), Impact of Smart Charging on EVs Charging Behaviour Assessed from Real
Charging Events. 32th International Electric Vehicle Symposium. May 2019.
[14] ElaadNL (2019), Snel, sneller, snelst - de ontwikkeling van snelladers in Nederland t/m 2025. URL accessed
on 2020-02-24; https://www.elaad.nl/news/forse-groei-snellaadstations-verwacht/
[16] ElaadNL, Smart Charging Guide, URL accessed on 2020-03-05;
https://www.elaad.nl/uploads/files/Final_report_TKI-1_definitieve_versie_190214-1.pdf
[17] National data research Smart Charging strategies, URL accessed on 2020-03-05;
https://www.elaad.nl/uploads/files/Final_report_TKI-1_definitieve_versie_190214-1.pdf
Authors
Nazir Refa received his Master of Science degree in 2015 from Utrecht University, Netherlands.
Currently, he is working as a data scientist at ElaadNL. His primarily research interests are in the
field of EV grid impact, and smart charging studies. Within ElaadNL he is responsible for
monitoring, and analysis of various smart charging pilots in collaboration with the Dutch grid
operators, and research institutes. He has co-developed several bottom-up models for EV diffusion,
and deployment of EV charging infrastructure.