ERT461 BIOSYSTEMS ENGINEERING DESIGN 1 ERT424 BIOPROCESS PLANT DESIGN 1 1.
59
ERT461 BIOSYSTEMS ENGINEERING DESIGN 1 ERT424 BIOPROCESS PLANT DESIGN 1 1
-
Upload
elinor-whitehead -
Category
Documents
-
view
215 -
download
0
Transcript of ERT461 BIOSYSTEMS ENGINEERING DESIGN 1 ERT424 BIOPROCESS PLANT DESIGN 1 1.
ERT461 BIOSYSTEMS ENGINEERING DESIGN 1
ERT424 BIOPROCESS PLANT DESIGN 1
1
The Interest Rate Simple Interest Compound Interest Amortizing a Loan Compounding More Than Once per
Year
The Interest Rate Simple Interest Compound Interest Amortizing a Loan Compounding More Than Once per
Year
Which would you prefer -- $10,000 today $10,000 today or $10,000 in $10,000 in
5 years5 years?
TIMETIME allows you the opportunity to postpone consumption and earn
INTERESTINTEREST.
Why is TIMETIME such an important element in your decision?
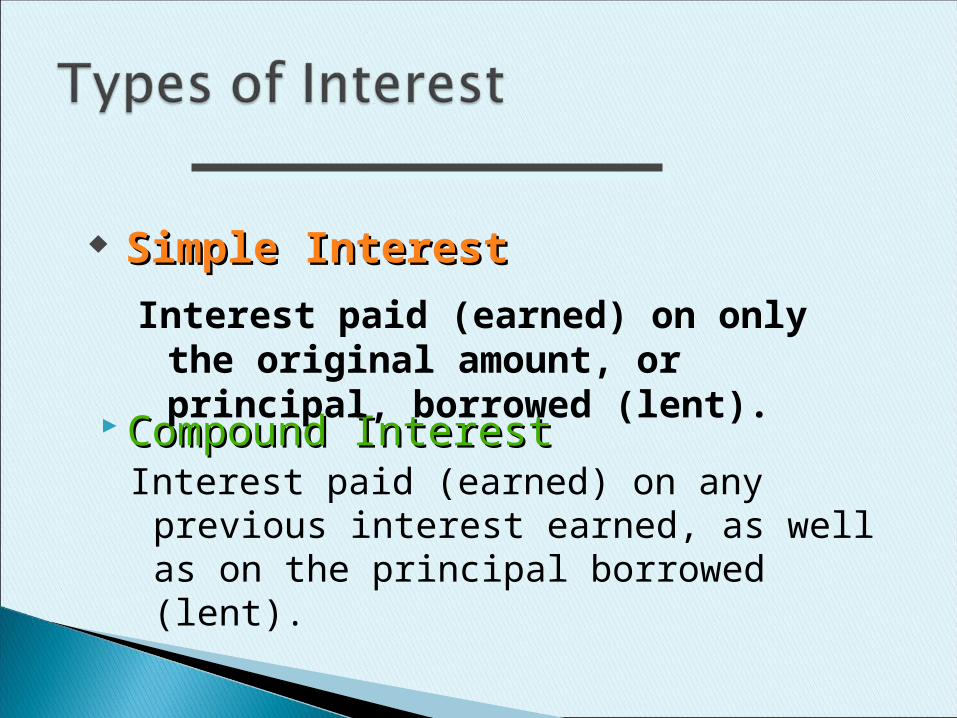
Compound InterestCompound InterestInterest paid (earned) on any previous
interest earned, as well as on the principal borrowed (lent).
Simple InterestSimple Interest
Interest paid (earned) on only the original amount, or principal, borrowed (lent).
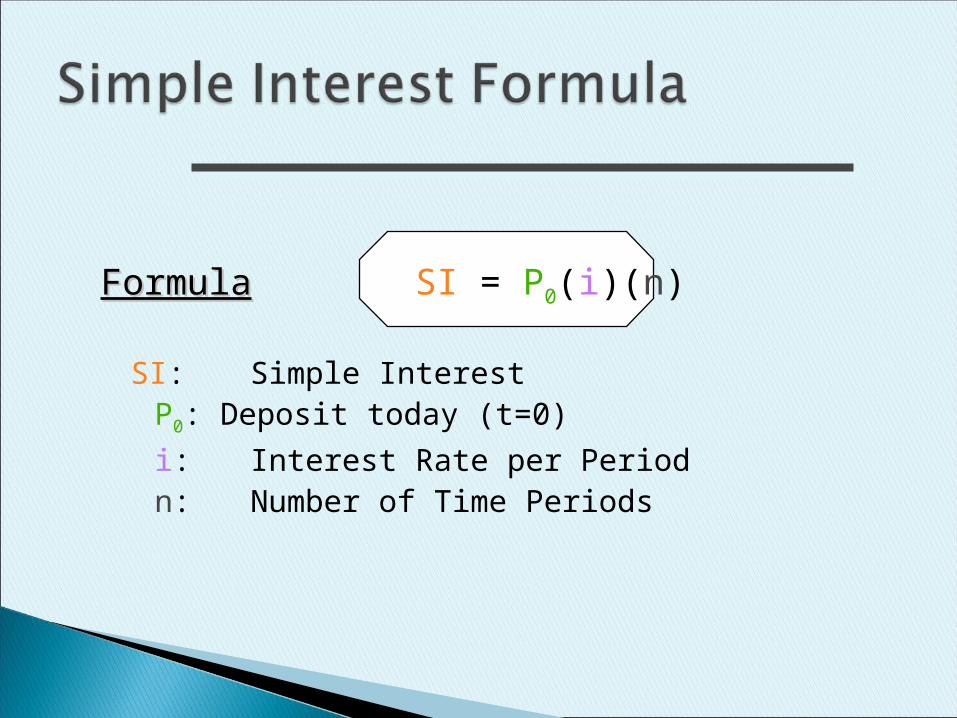
FormulaFormula SI = P0(i)(n)
SI: Simple InterestP0: Deposit today (t=0)
i: Interest Rate per Periodn: Number of Time Periods
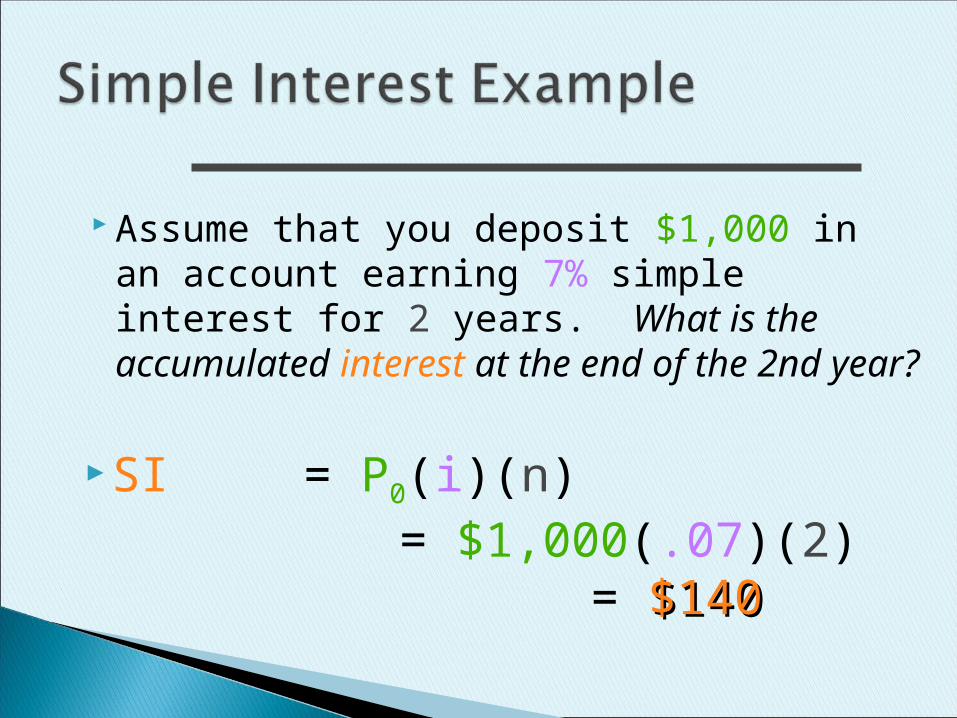
SI = P0(i)(n)= $1,000(.07)(2)
= $140$140
Assume that you deposit $1,000 in an account earning 7% simple interest for 2 years. What is the accumulated interest at the end of the 2nd year?
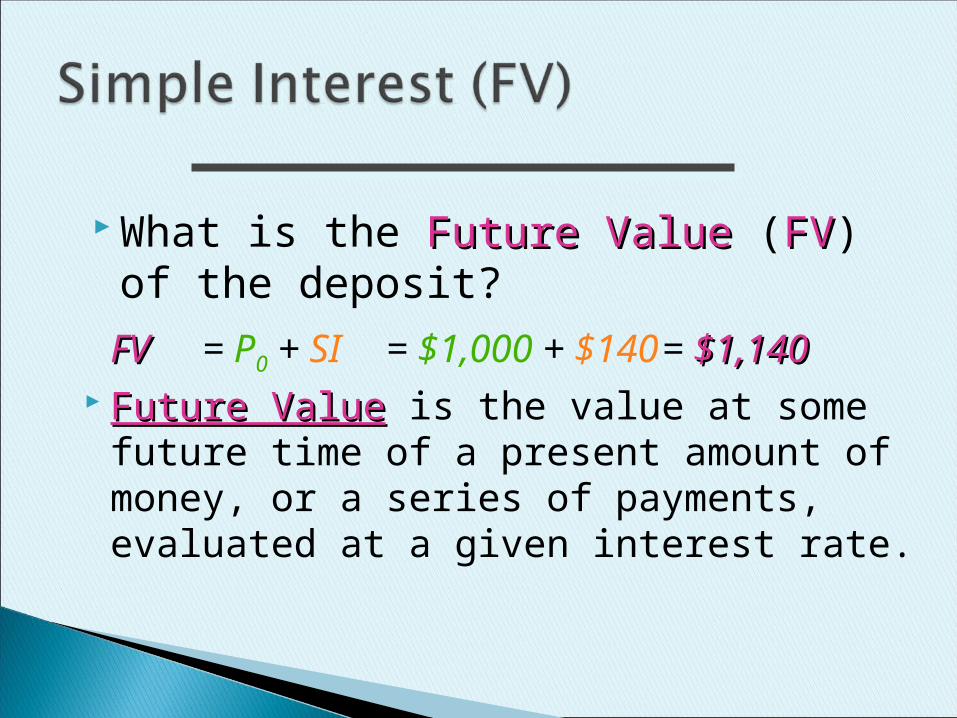
FVFV = P0 + SI = $1,000 + $140= $1,140$1,140
Future ValueFuture Value is the value at some future time of a present amount of money, or a series of payments, evaluated at a given interest rate.
What is the Future Value Future Value (FVFV) of the deposit?
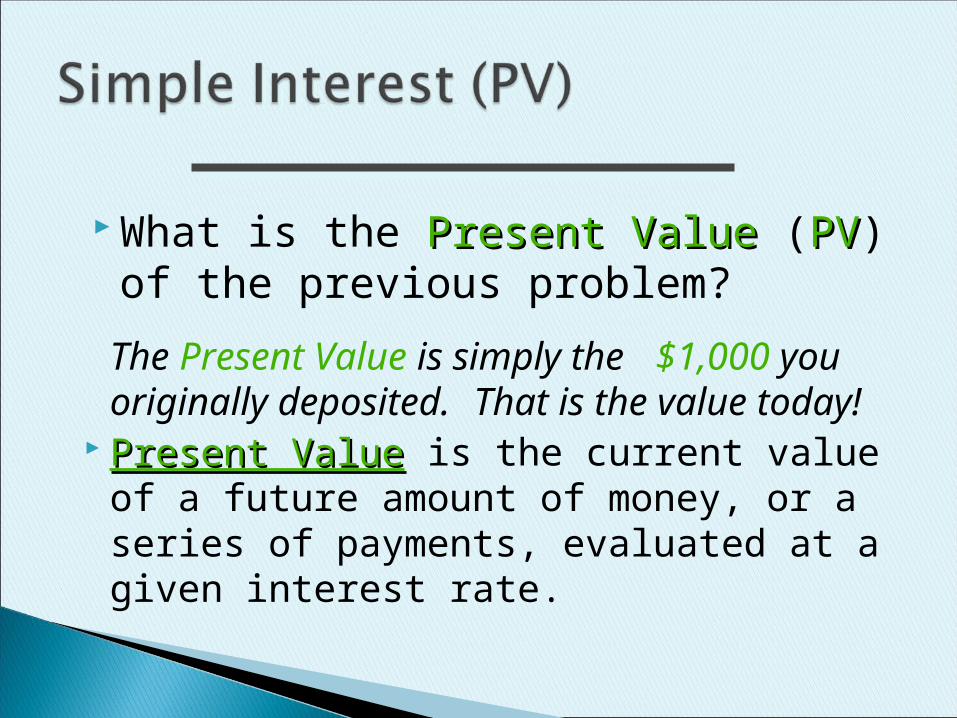
The Present Value is simply the $1,000 you originally deposited. That is the value today!
Present ValuePresent Value is the current value of a future amount of money, or a series of payments, evaluated at a given interest rate.
What is the Present Value Present Value (PVPV) of the previous problem?
0
5000
10000
15000
20000
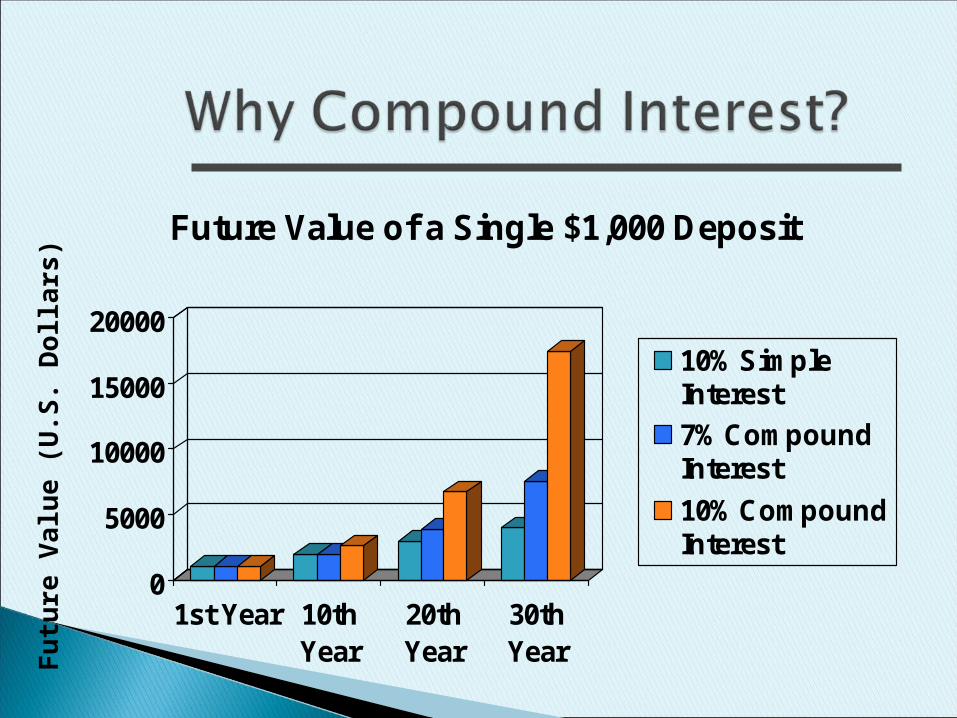
1st Year 10thYear
20thYear
30thYear
Future Value of a Single $1,000 Deposit
10% SimpleInterest
7% CompoundInterest
10% CompoundInterest
Fu
ture
Val
ue
(U.S
. Dol
lars
)
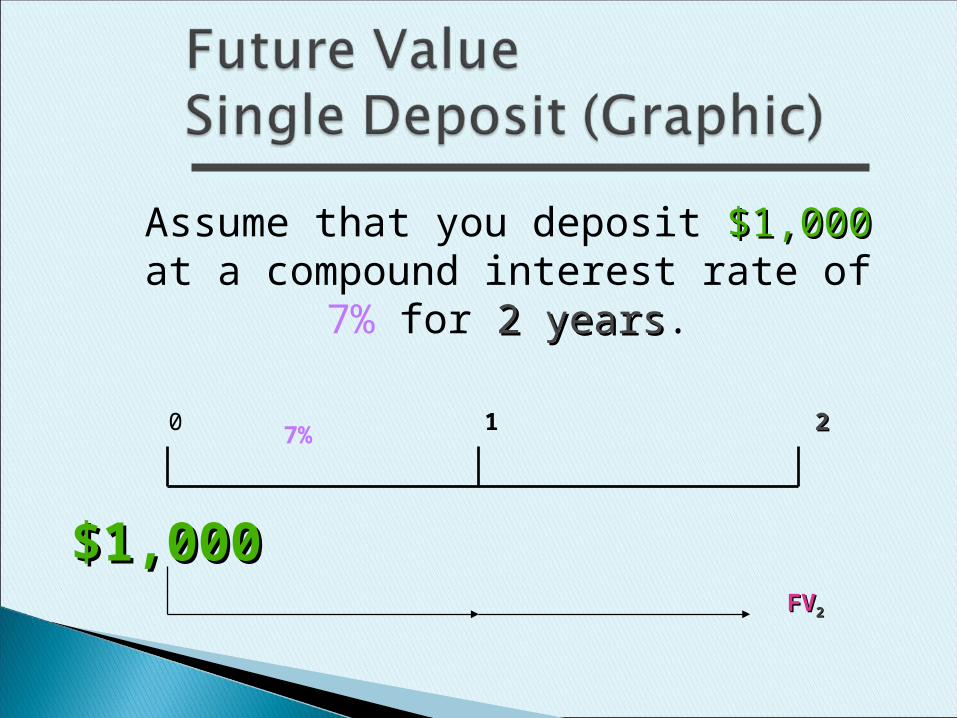
Assume that you deposit $1,000$1,000 at a compound interest rate of
7% for 2 years2 years.
0 1 22
$1,000$1,000FVFV22
7%
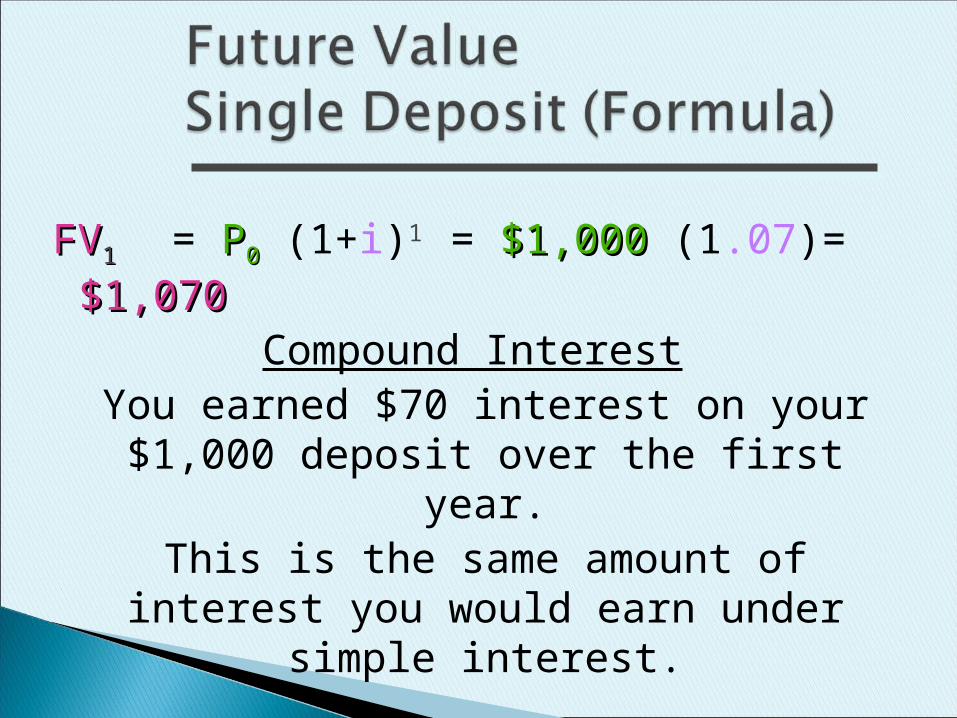
FVFV11 = PP00 (1+i)1 = $1,000$1,000 (1.07) = $1,070$1,070
Compound InterestYou earned $70 interest on your
$1,000 deposit over the first year.This is the same amount of interest
you would earn under simple interest.
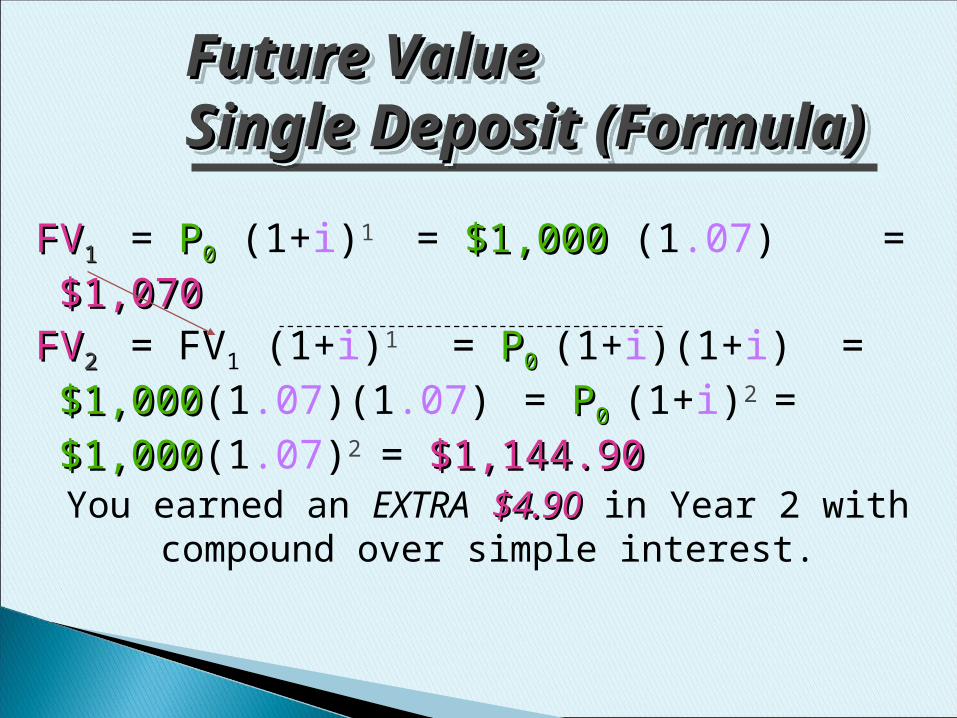
FVFV11 = PP00 (1+i)1 = $1,000$1,000 (1.07) = $1,070$1,070
FVFV22 = FV1 (1+i)1 = PP0 0 (1+i)(1+i) = $1,000$1,000(1.07)(1.07)= PP00 (1+i)2 = $1,000$1,000(1.07)2
= $1,144.90$1,144.90You earned an EXTRA $4.90$4.90 in Year 2 with
compound over simple interest.
Future ValueFuture ValueSingle Deposit (Formula)Single Deposit (Formula)Future ValueFuture ValueSingle Deposit (Formula)Single Deposit (Formula)
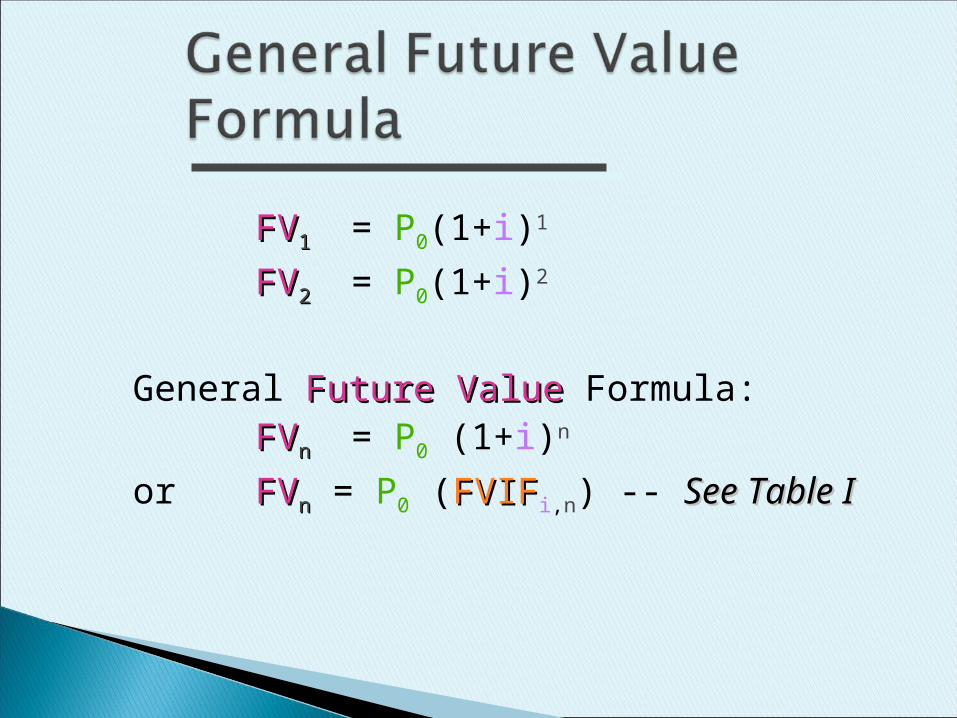
FVFV11 = P0(1+i)1
FVFV22 = P0(1+i)2
General Future Value Future Value Formula:FVFVnn = P0 (1+i)n
or FVFVnn = P0 (FVIFFVIFi,n) -- See Table ISee Table I
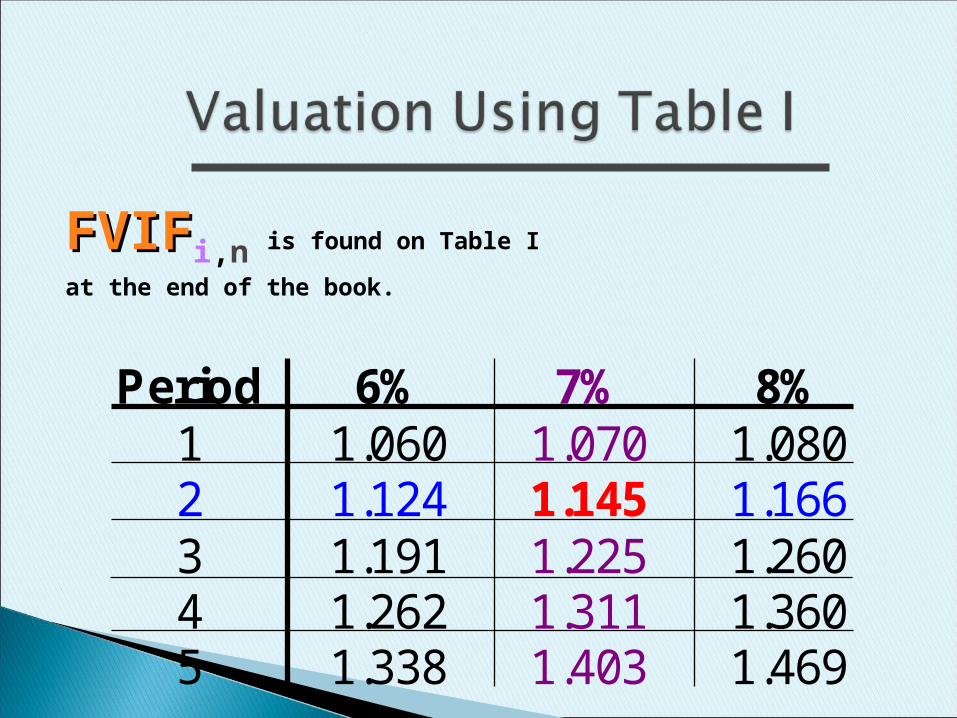
FVIFFVIFi,n is found on Table I
at the end of the book.
Period 6% 7% 8%1 1.060 1.070 1.0802 1.124 1.145 1.1663 1.191 1.225 1.2604 1.262 1.311 1.3605 1.338 1.403 1.469
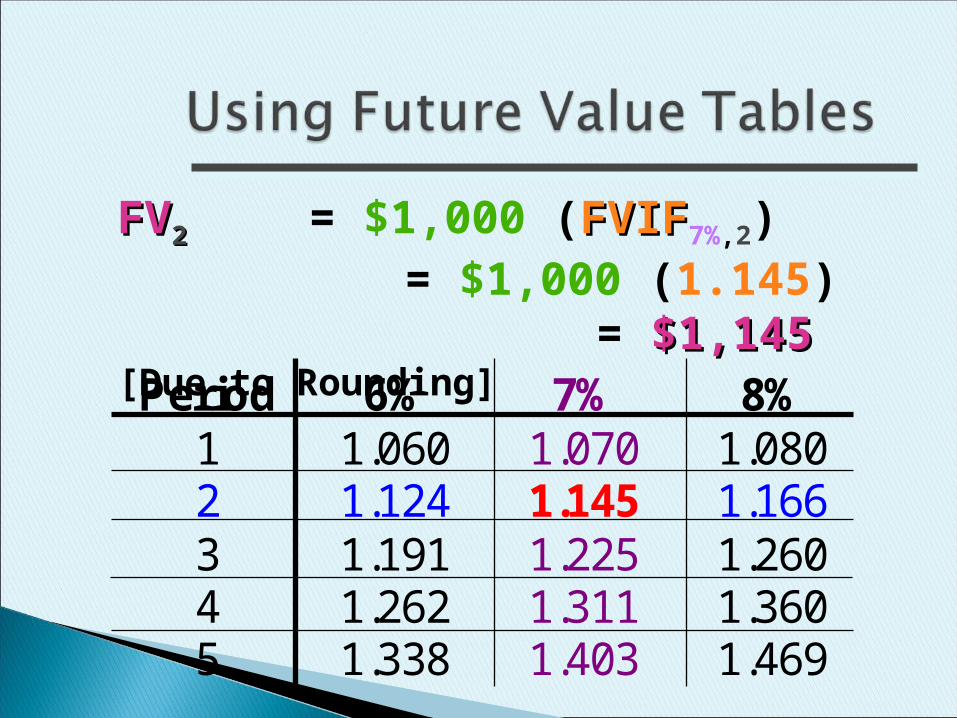
FVFV22 = $1,000 (FVIFFVIF7%,2)= $1,000 (1.145)
= $1,145$1,145 [Due to Rounding]
Period 6% 7% 8%1 1.060 1.070 1.0802 1.124 1.145 1.1663 1.191 1.225 1.2604 1.262 1.311 1.3605 1.338 1.403 1.469
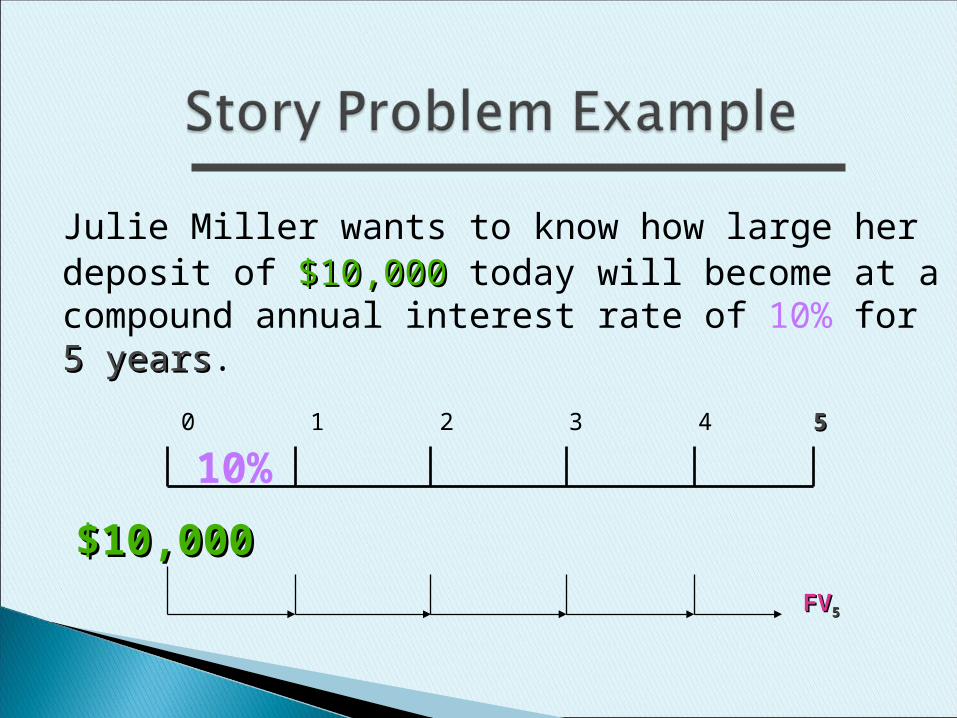
Julie Miller wants to know how large her deposit of $10,000$10,000 today will become at a compound annual interest rate of 10% for 5 5 yearsyears.
0 1 2 3 4 55
$10,000$10,000FVFV55
10%
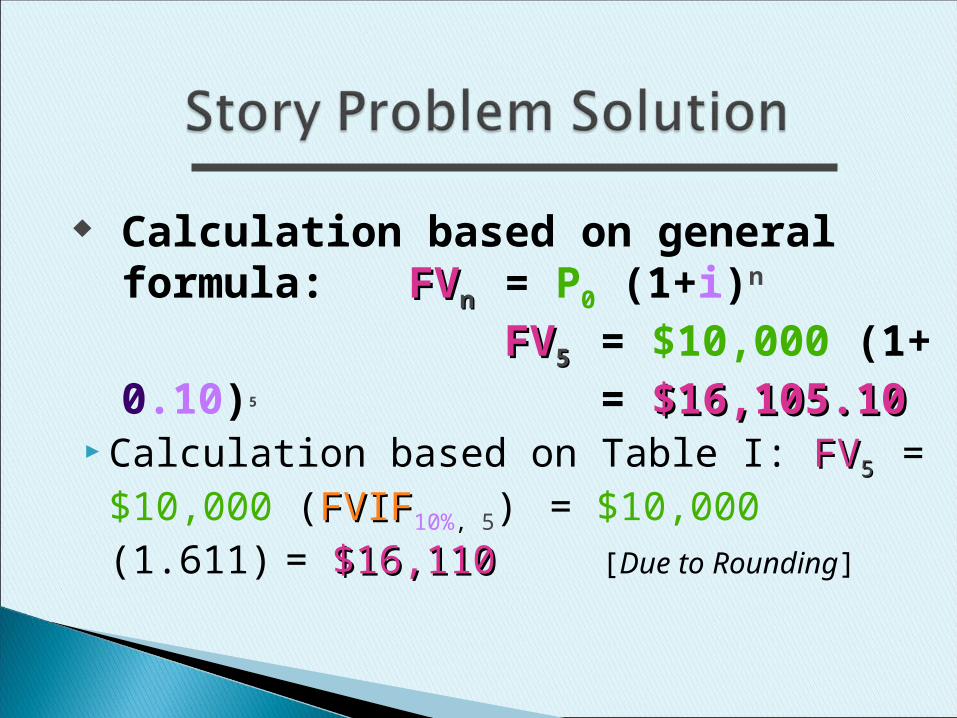
Calculation based on Table I:FVFV55 = $10,000 (FVIFFVIF10%, 5)
= $10,000 (1.611)= $16,110$16,110 [Due to
Rounding]
Calculation based on general formula:FVFVnn = P0 (1+i)n
FVFV55 = $10,000 (1+ 0.10)5
= $16,105.10$16,105.10
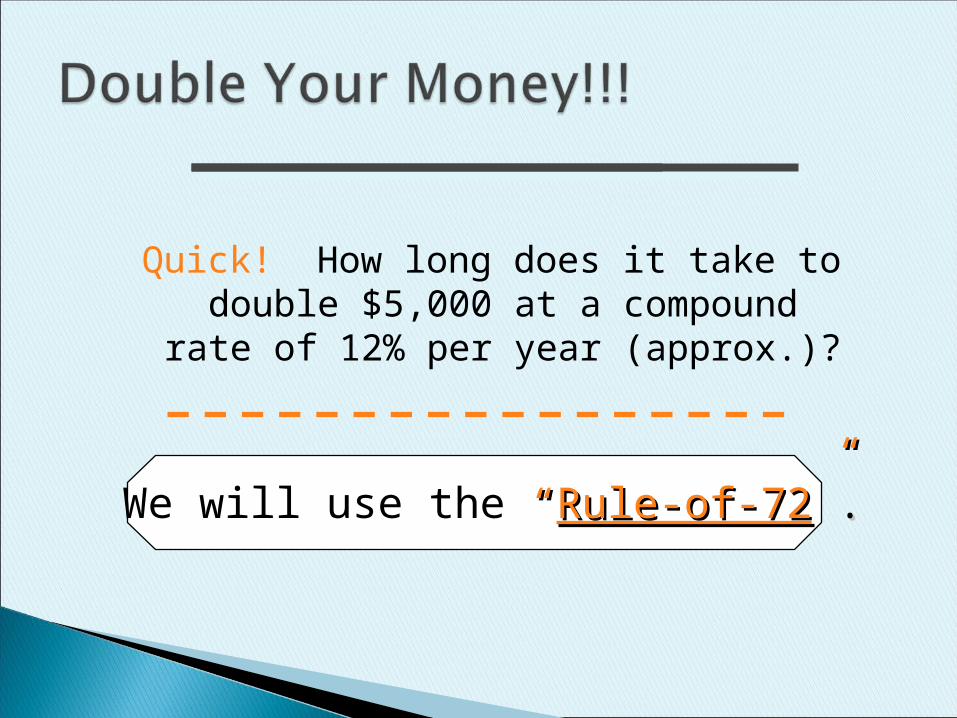
We will use the ““Rule-of-72Rule-of-72””..
Quick! How long does it take to double $5,000 at a compound rate
of 12% per year (approx.)?
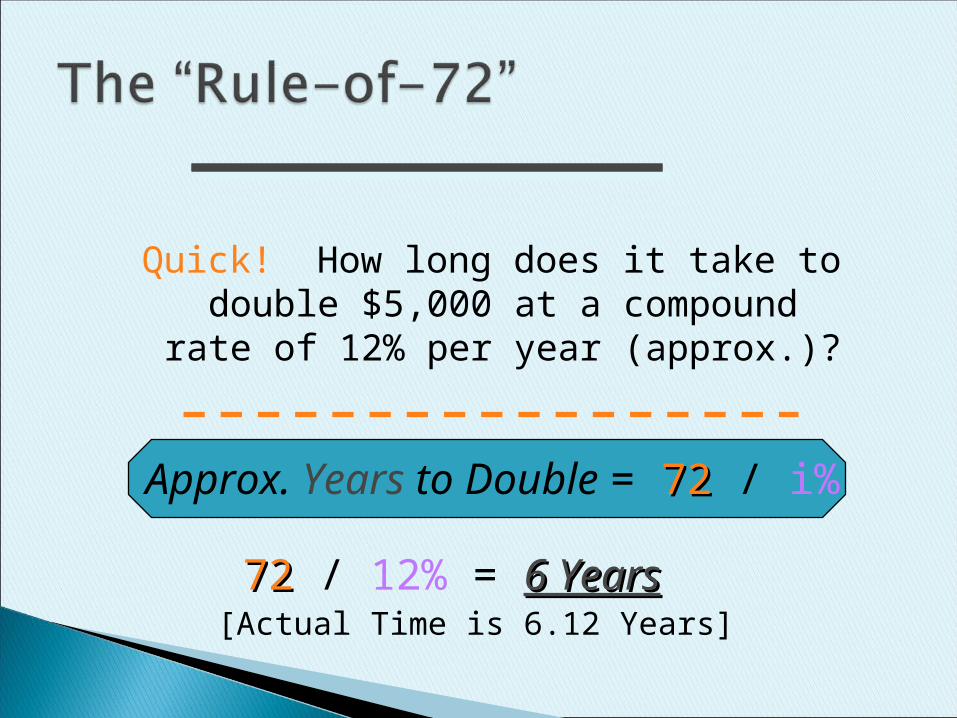
Approx. Years to Double = 7272 / i%
7272 / 12% = 6 Years6 Years[Actual Time is 6.12 Years]
Quick! How long does it take to double $5,000 at a compound rate
of 12% per year (approx.)?
Estimating Cost/Benefit for Engineering Projects
Incremental Cash Flows
Developing Cash Flow Statements
Generalized Cash Flow Approach
21
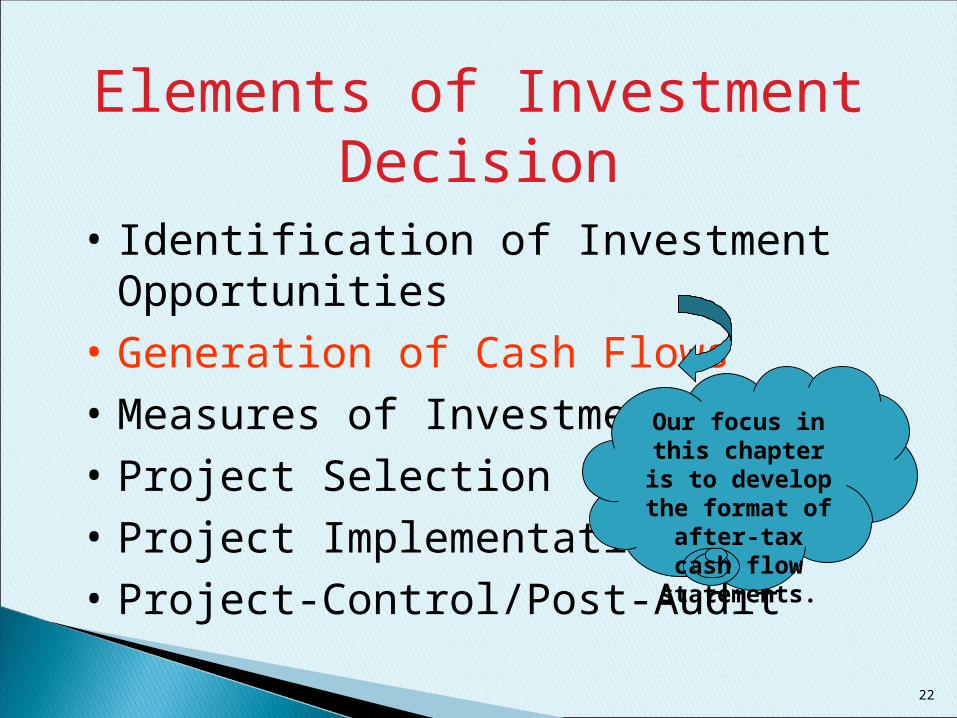
Elements of Investment Decision
• Identification of Investment Opportunities
• Generation of Cash Flows
• Measures of Investment Worth
• Project Selection
• Project Implementation
• Project-Control/Post-Audit
Our focus in this chapter is to
develop the format of after-tax cash flow statements.
22
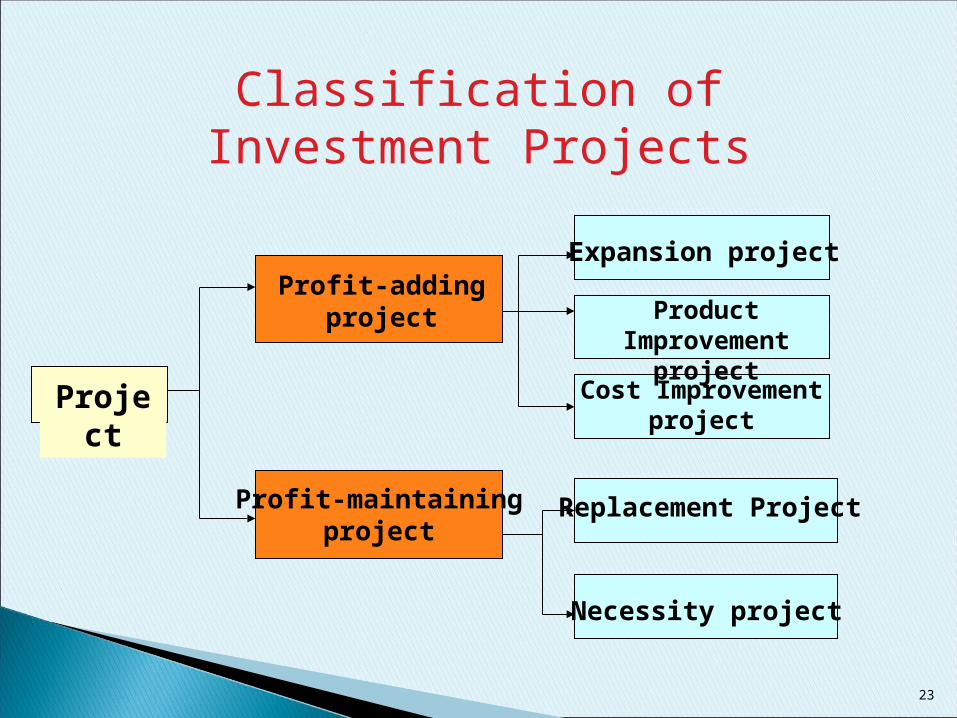
Classification of Investment Projects
Project
Profit-addingproject
Profit-maintainingproject
Expansion project
Product Improvement project
Necessity project
Replacement Project
Cost Improvementproject
23
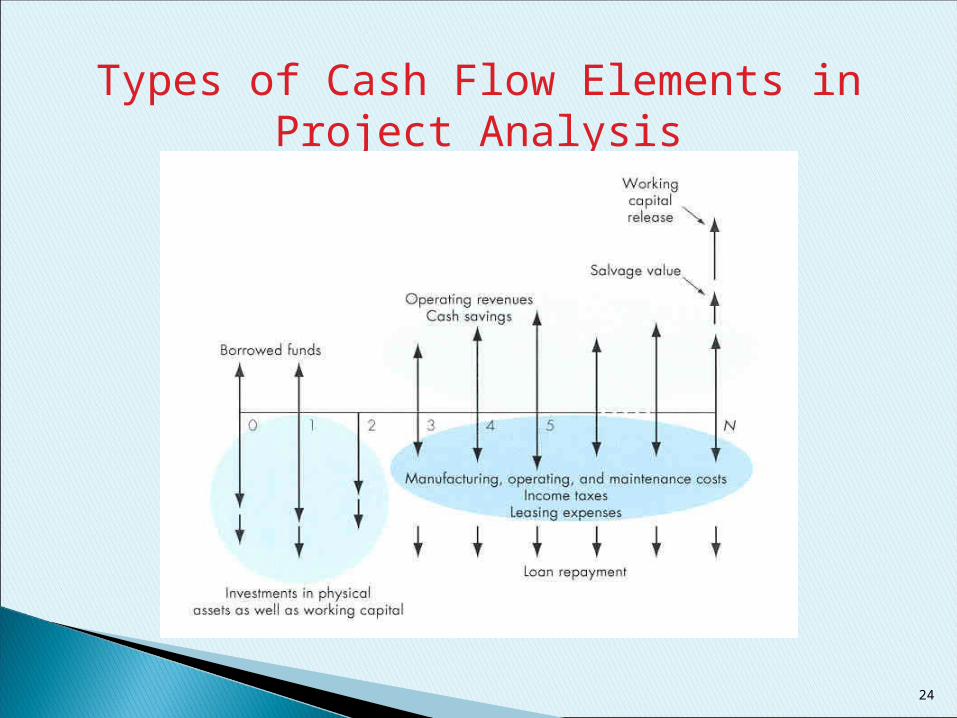
Types of Cash Flow Elements in Project Analysis
24
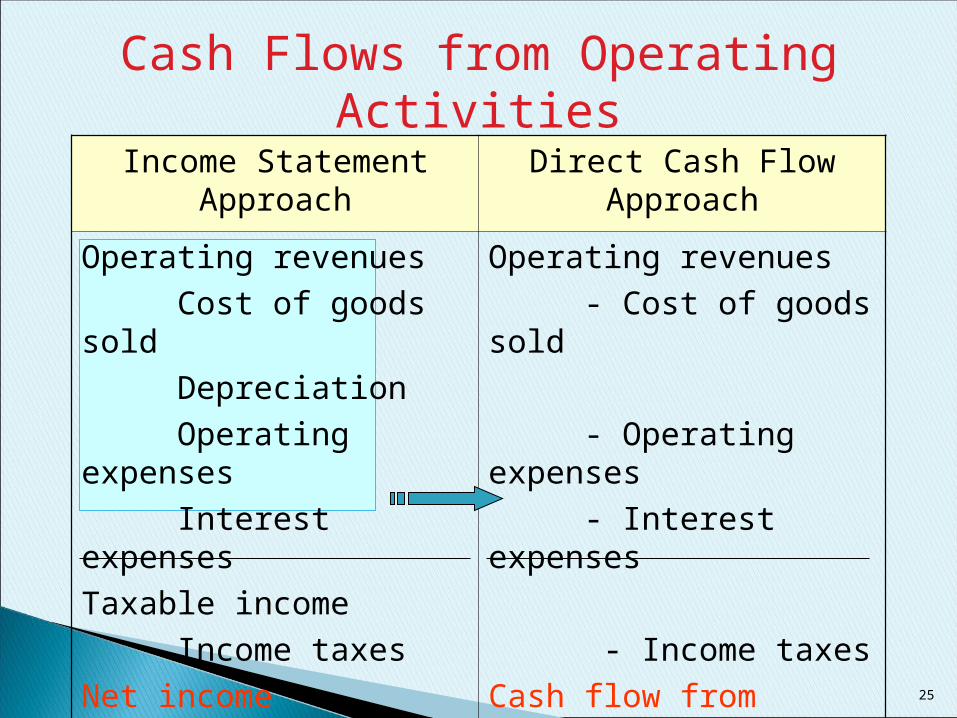
Income Statement Approach Direct Cash Flow Approach
Operating revenues
Cost of goods sold
Depreciation
Operating expenses
Interest expenses
Taxable income
Income taxes
Net income
+ Depreciation
Operating revenues
- Cost of goods sold
- Operating expenses
- Interest expenses
- Income taxes
Cash flow from operation
Cash Flows from Operating Activities
25
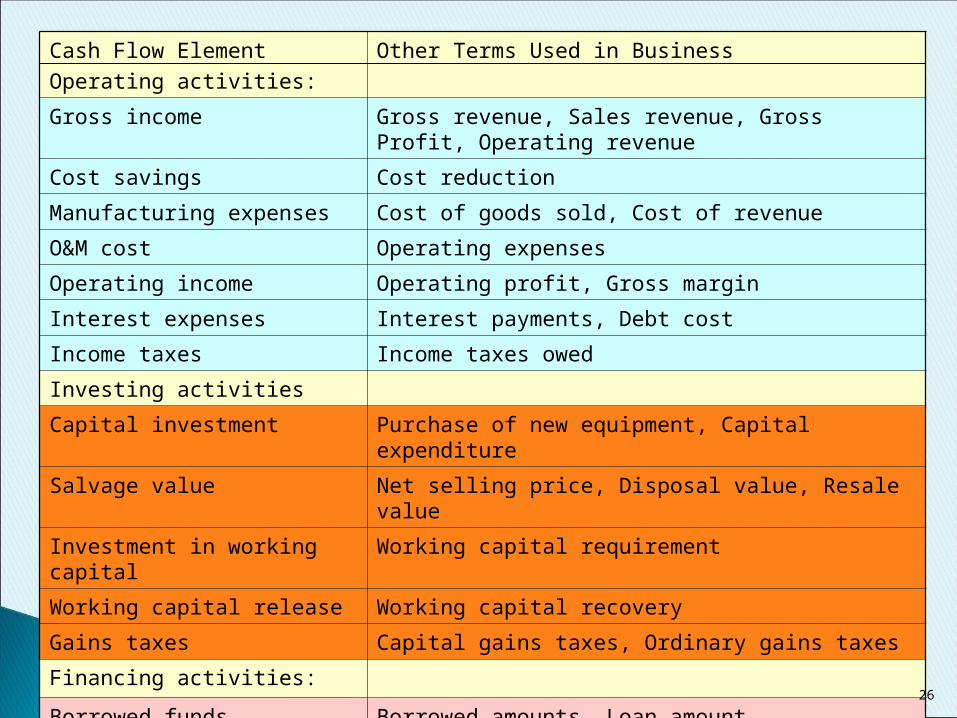
Cash Flow Element
Operating activities:
Other Terms Used in Business
Gross income Gross revenue, Sales revenue, Gross Profit, Operating revenue
Cost savings Cost reduction
Manufacturing expenses Cost of goods sold, Cost of revenue
O&M cost Operating expenses
Operating income Operating profit, Gross margin
Interest expenses Interest payments, Debt cost
Income taxes Income taxes owed
Investing activities
Capital investment Purchase of new equipment, Capital expenditure
Salvage value Net selling price, Disposal value, Resale value
Investment in working capital Working capital requirement
Working capital release Working capital recovery
Gains taxes Capital gains taxes, Ordinary gains taxes
Financing activities:
Borrowed funds Borrowed amounts, Loan amount
Principal repayments Loan repayment
26
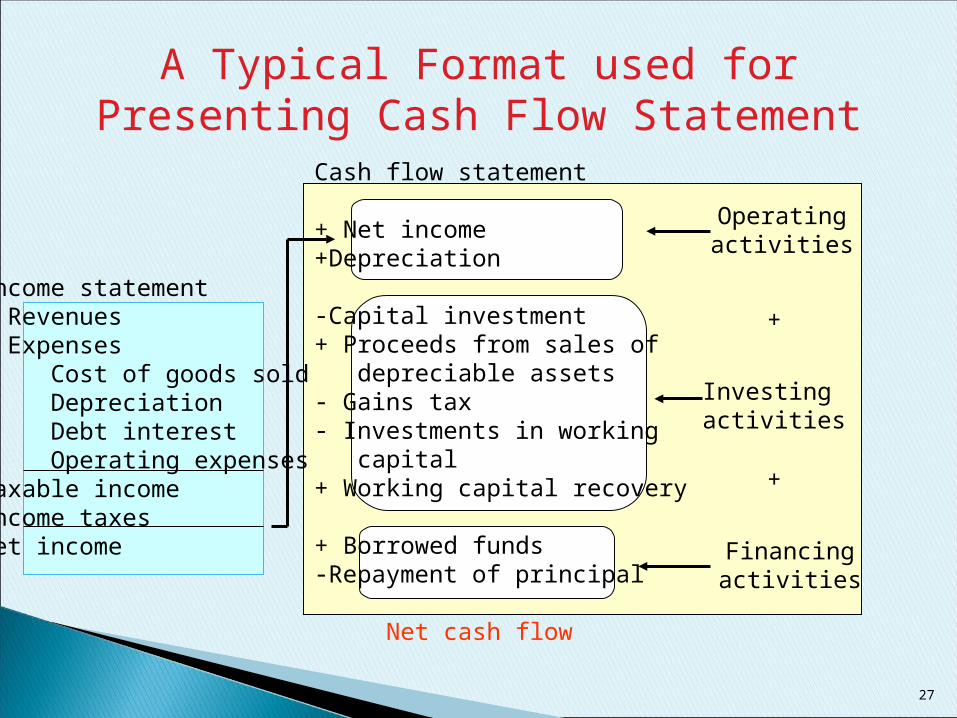
A Typical Format used for Presenting Cash Flow Statement
Income statement Revenues Expenses Cost of goods sold Depreciation Debt interest Operating expensesTaxable incomeIncome taxesNet income
Cash flow statement
+ Net income+Depreciation
-Capital investment+ Proceeds from sales of depreciable assets- Gains tax- Investments in working capital+ Working capital recovery
+ Borrowed funds-Repayment of principal Net cash flow
Operatingactivities
Investing activities
Financingactivities
+
+
27
defines depreciation as the ‘allocation of the depreciable amount of an asset over its estimated life’.
According to the matching concept, revenues should be matched with expenses in order to determine the accounting profit.
The cost of the asset purchased should be spread over the periods in which the asset will benefit a company.
The assets are acquired or constructed with the intention of being used and not with the intention for resale.
regards assets as depreciable when they◦ Are expected to be used in more than one
accounting period.◦ Have a finite useful life, and◦ Are held for use in the production or supply of
goods and services, for rental to others, or for administrative purposes.
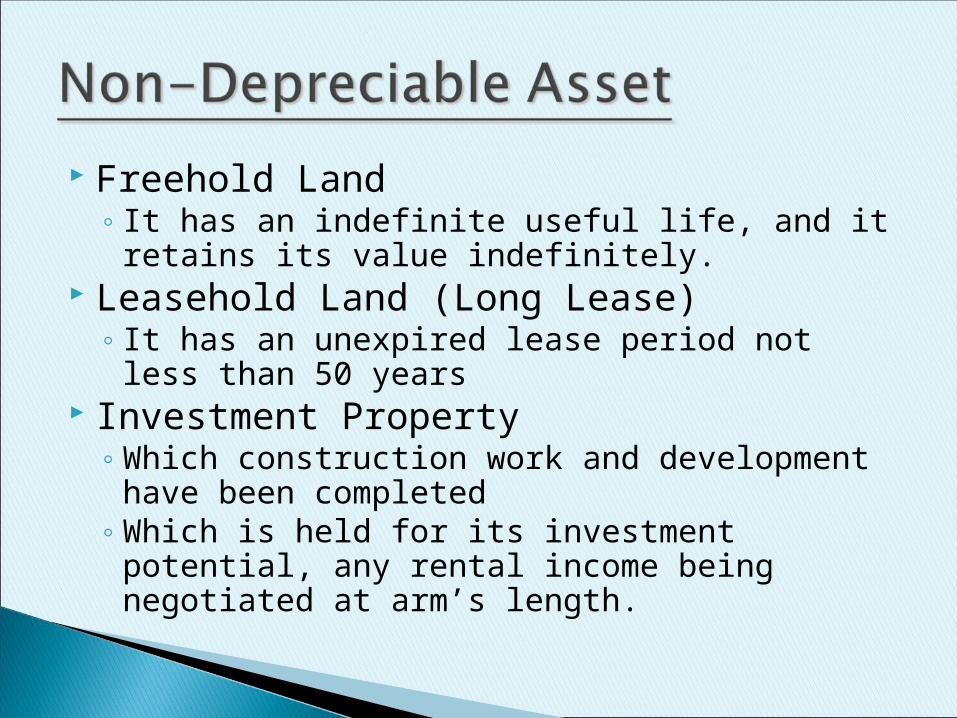
Freehold Land◦ It has an indefinite useful life, and it retains its
value indefinitely. Leasehold Land (Long Lease)
◦ It has an unexpired lease period not less than 50 years
Investment Property◦ Which construction work and development have
been completed◦ Which is held for its investment potential, any
rental income being negotiated at arm’s length.
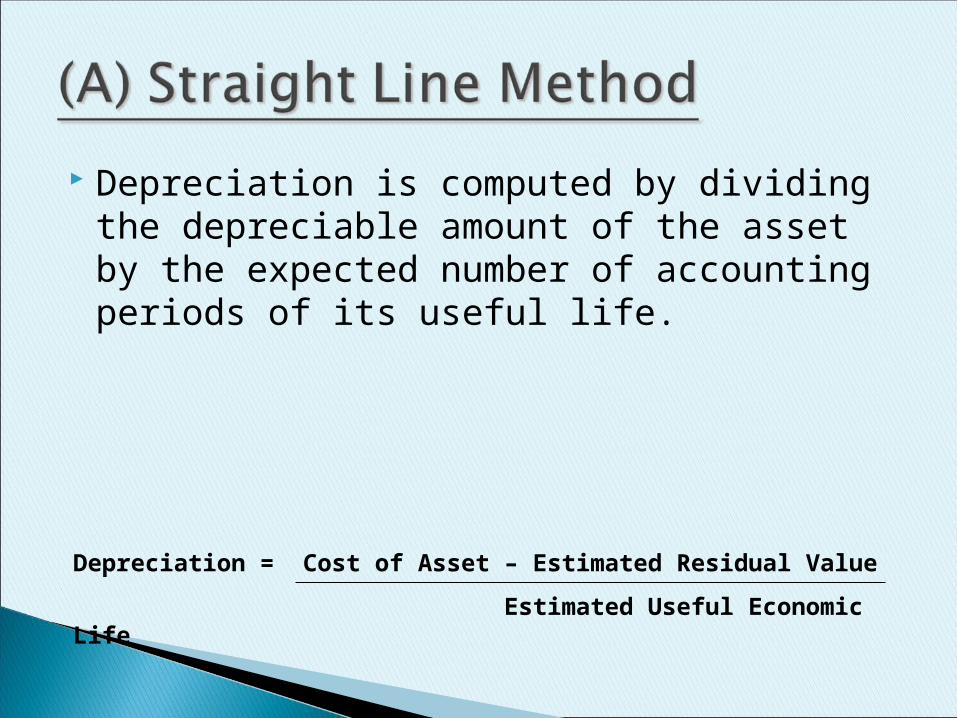
Depreciation is computed by dividing the depreciable amount of the asset by the expected number of accounting periods of its useful life.
Depreciation = Cost of Asset – Estimated Residual Value
Estimated Useful Economic Life
Useful economic life is not equal to physical life
It is the period over which the present owner intends to use the asset
It is the amount received after disposal of the asset
Cost of asset - Residual value = Total amount to be depreciated
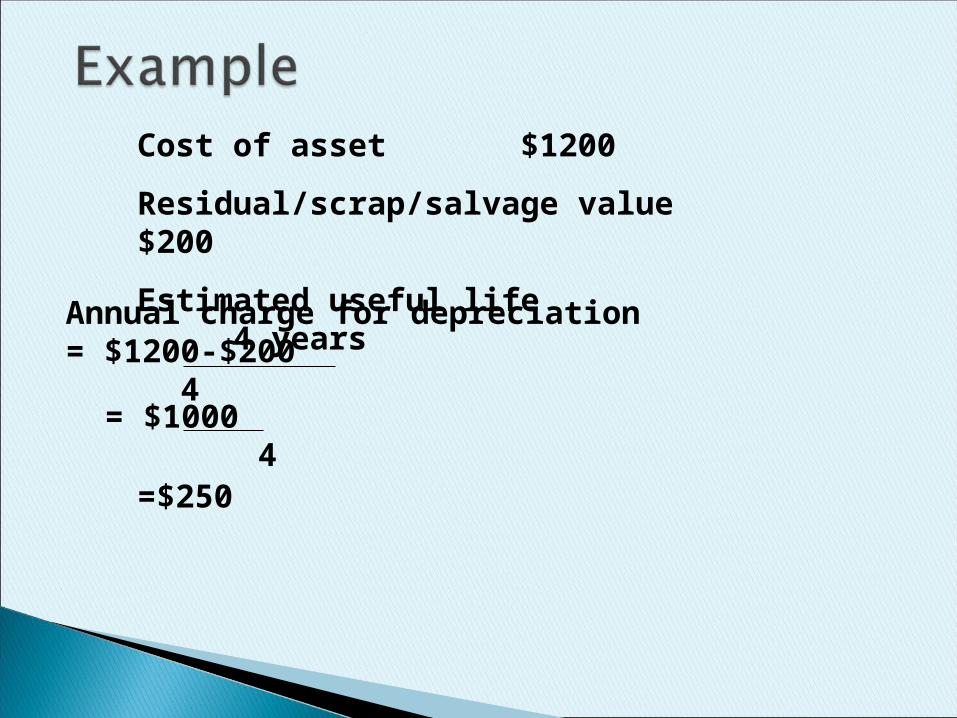
Cost of asset $1200
Residual/scrap/salvage value $200
Estimated useful life 4 years
Annual charge for depreciation= $1200-$200
4= $1000 4=$250
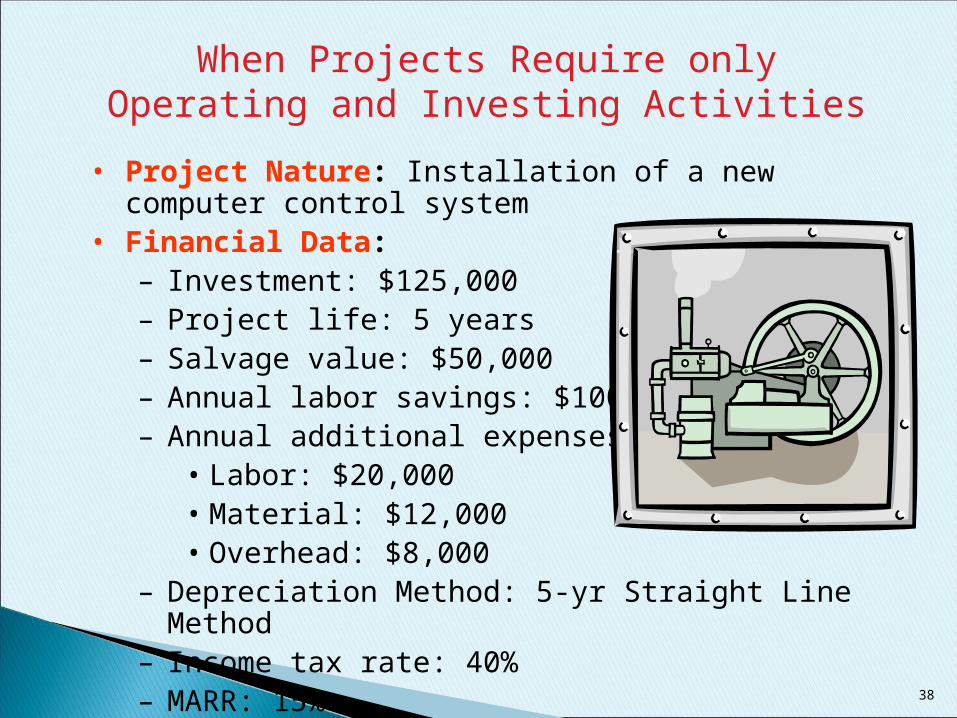
When Projects Require only Operating and Investing Activities
• Project Nature: Installation of a new computer control system • Financial Data:
– Investment: $125,000– Project life: 5 years– Salvage value: $50,000– Annual labor savings: $100,000– Annual additional expenses:
• Labor: $20,000• Material: $12,000• Overhead: $8,000
– Depreciation Method: 5-yr Straight Line Method– Income tax rate: 40%– MARR: 15%
38
Questions
• (a) Develop the project’s cash flows over its project life.
• (b) Is this project justifiable at a MARR of 15%?
• (c) What is the internal rate of return of this project?
39
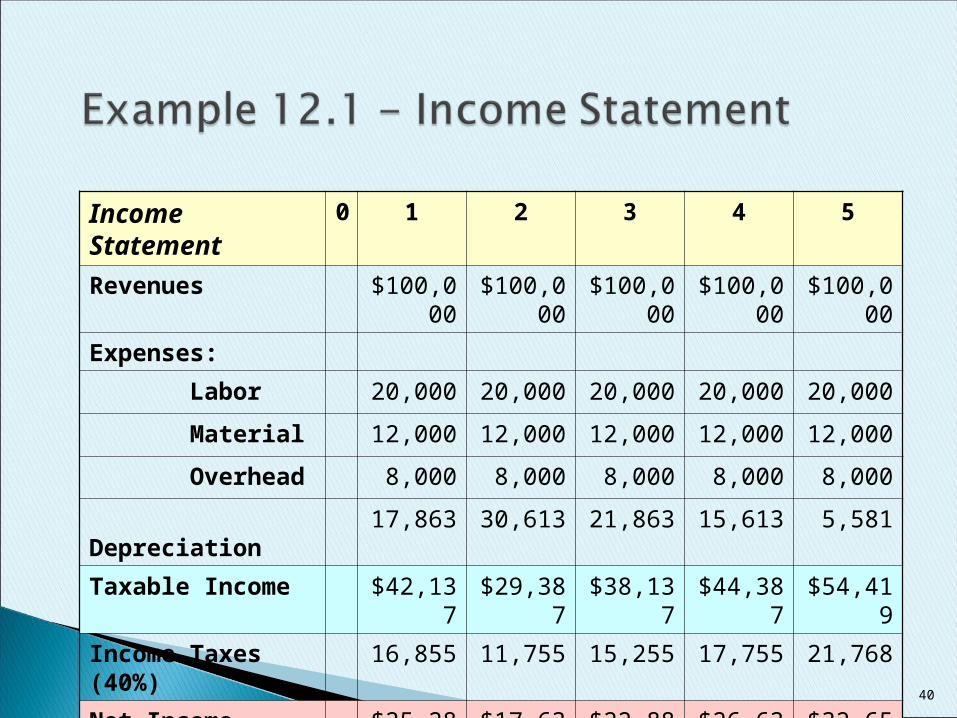
Income Statement 0 1 2 3 4 5
Revenues $100,000 $100,000 $100,000 $100,000 $100,000
Expenses:
Labor 20,000 20,000 20,000 20,000 20,000
Material 12,000 12,000 12,000 12,000 12,000
Overhead 8,000 8,000 8,000 8,000 8,000
Depreciation 17,863 30,613 21,863 15,613 5,581
Taxable Income $42,137 $29,387 $38,137 $44,387 $54,419
Income Taxes (40%) 16,855 11,755 15,255 17,755 21,768
Net Income $25,282 $17,632 $22,882 $26,632 $32,651
40
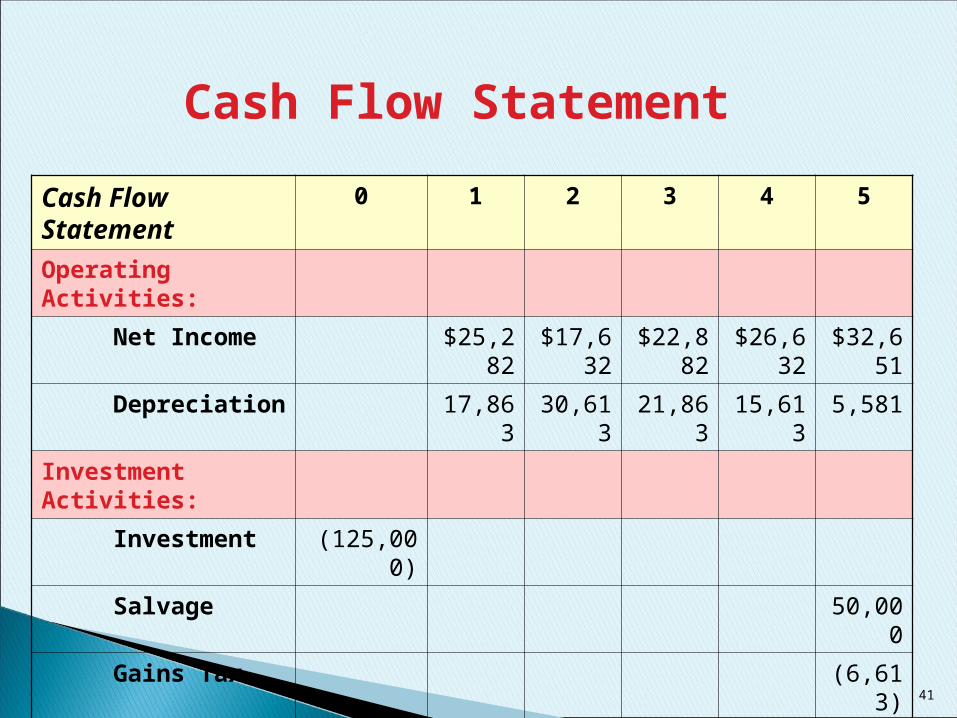
Cash Flow Statement
Cash Flow Statement 0 1 2 3 4 5
Operating Activities:
Net Income $25,282 $17,632 $22,882 $26,632 $32,651
Depreciation 17,863 30,613 21,863 15,613 5,581
Investment Activities:
Investment (125,000)
Salvage 50,000
Gains Tax (6,613)
Net Cash Flow ($125,000) $43,145 $48,245 $44,745 $42,245 $81,619
41
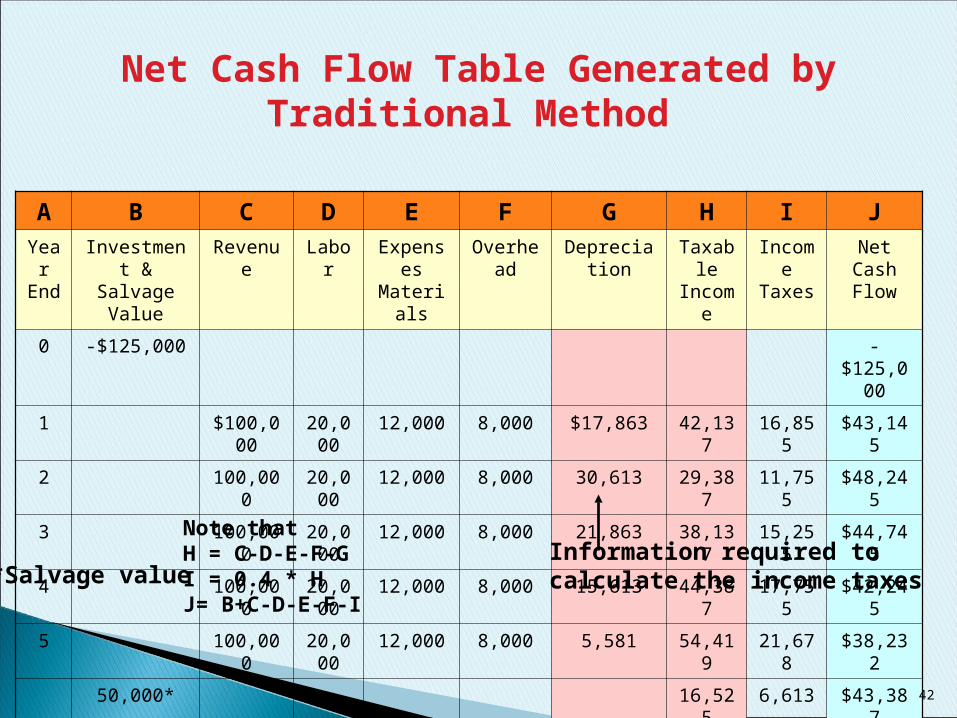
Net Cash Flow Table Generated by Traditional Method
A B C D E F G H I J
Year End
Investment & Salvage Value
Revenue Labor Expenses Materials
Overhead Depreciation
Taxable Income
Income Taxes
Net Cash Flow
0 -$125,000 -$125,000
1 $100,000 20,000
12,000 8,000 $17,863 42,137 16,855 $43,145
2 100,000 20,000
12,000 8,000 30,613 29,387 11,755 $48,245
3 100,000 20,000
12,000 8,000 21,863 38,137 15,255 $44,745
4 100,000 20,000
12,000 8,000 15,613 44,387 17,755 $42,245
5 100,000 20,000
12,000 8,000 5,581 54,419 21,678 $38,232
50,000* 16,525 6,613 $43,387
Information required tocalculate the income taxes*Salvage value
Note thatH = C-D-E-F-GI = 0.4 * HJ= B+C-D-E-F-I
42
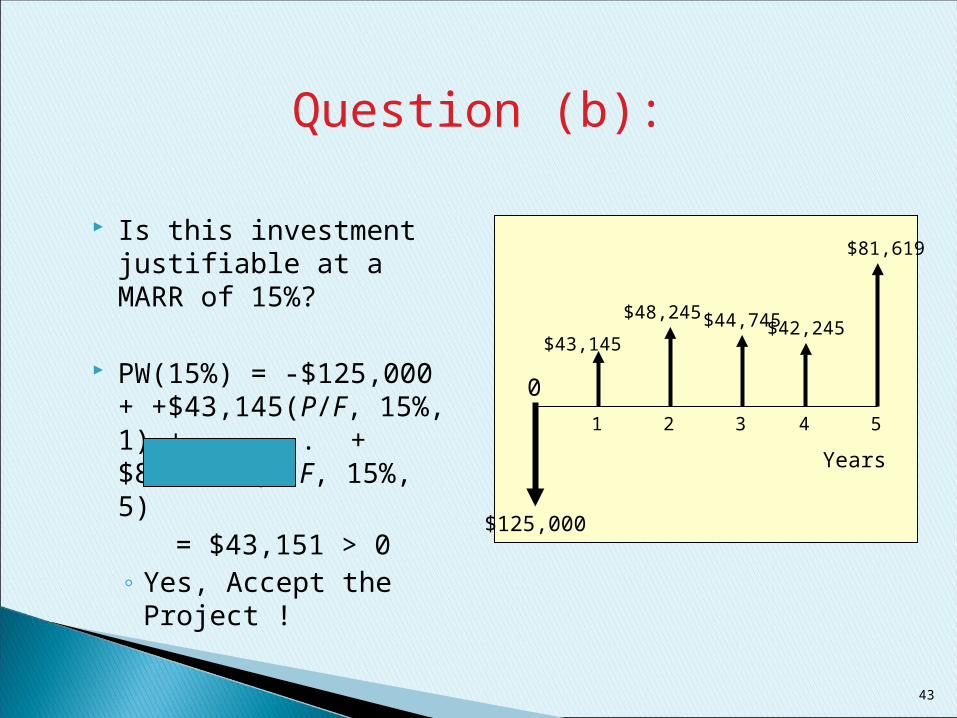
Is this investment justifiable at a MARR of 15%?
PW(15%) = -$125,000 + +$43,145(P/F, 15%, 1) + . . . . + $81,620 (P/F, 15%, 5)
= $43,151 > 0 ◦ Yes, Accept the
Project !
Question (b):
0
1 2 3 4 5
$125,000
$43,145
$48,245 $44,745 $42,245
$81,619
Years
43
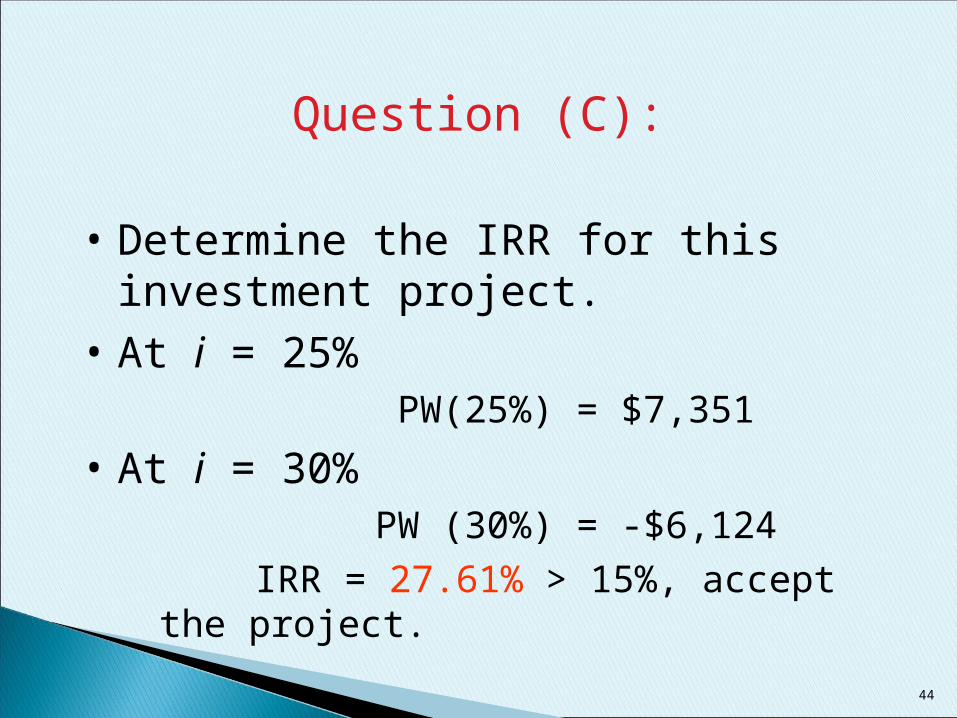
Question (C):
• Determine the IRR for this investment project.
• At i = 25% PW(25%) = $7,351
• At i = 30% PW (30%) = -$6,124
IRR = 27.61% > 15%, accept the project.
44
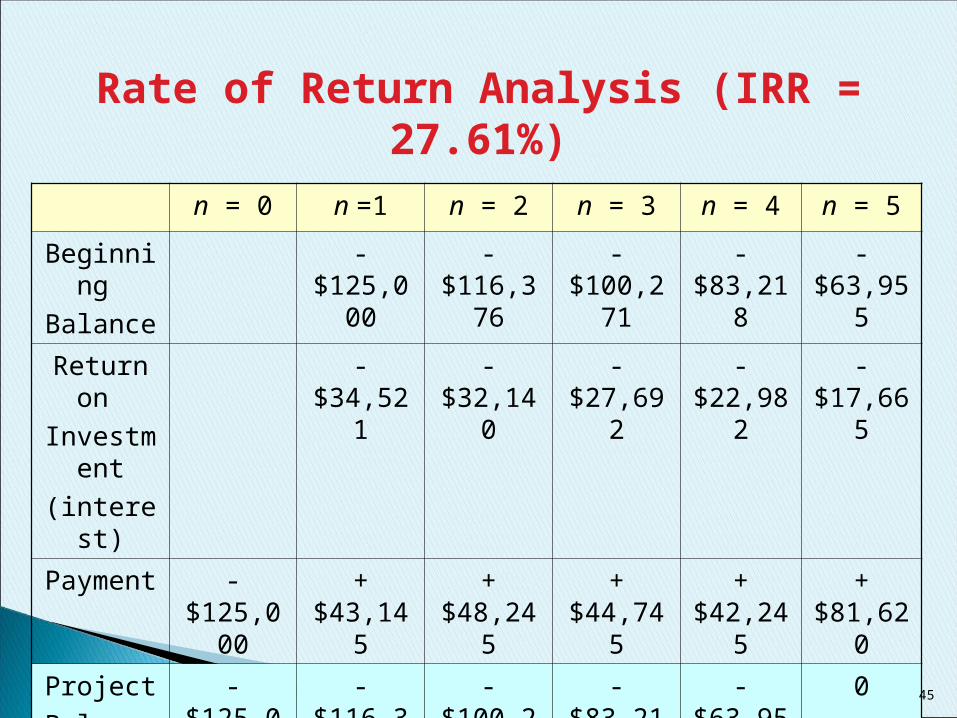
Rate of Return Analysis (IRR = 27.61%)
n = 0 n =1 n = 2 n = 3 n = 4 n = 5
Beginning
Balance
-$125,000
-$116,376
-$100,271
-$83,218 -$63,955
Return on
Investment
(interest)
-$34,521 -$32,140 -$27,692 -$22,982 -$17,665
Payment -$125,000
+$43,145 +$48,245 +$44,745 +$42,245
+$81,620
Project
Balance
-$125,000
-$116,376
-$100,271
-$83,218 -$63,955 0
45
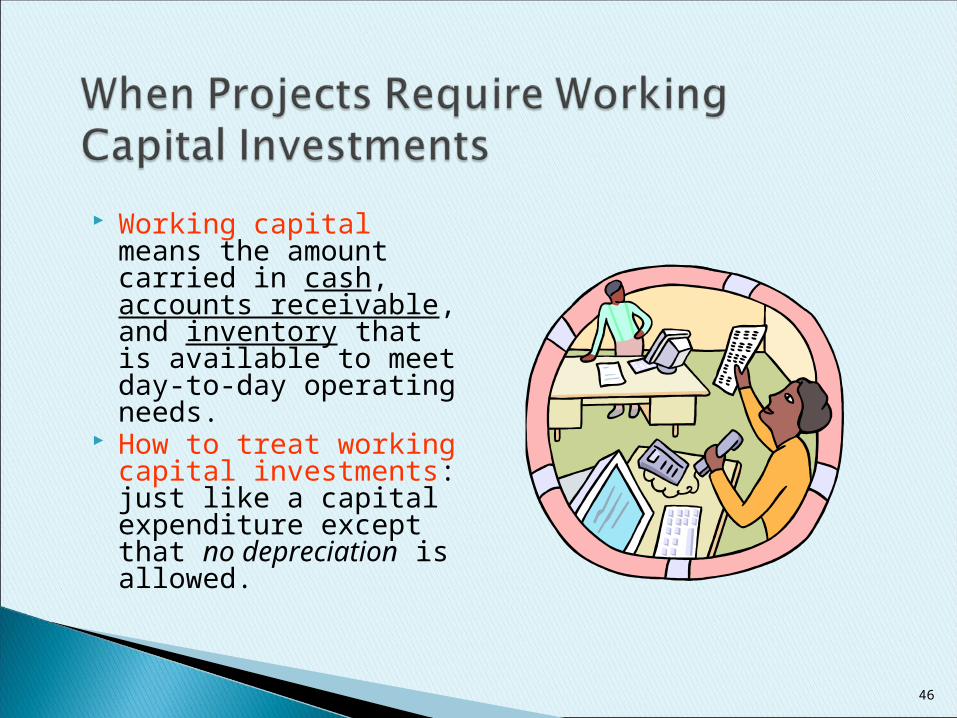
Working capital means the amount carried in cash, accounts receivable, and inventory that is available to meet day-to-day operating needs.
How to treat working capital investments: just like a capital expenditure except that no depreciation is allowed.
46
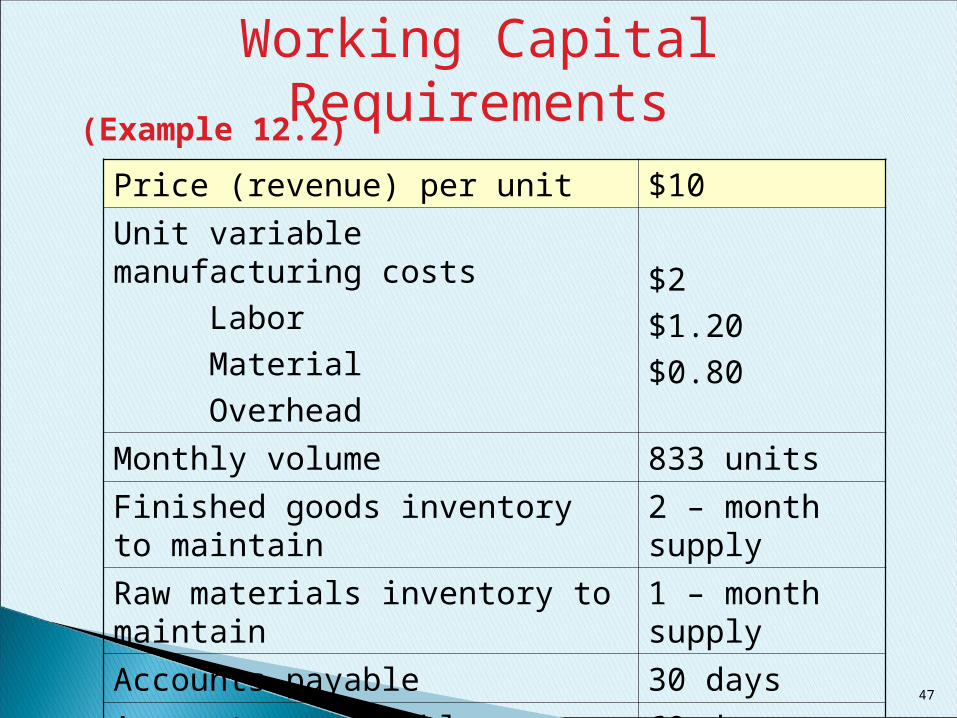
Working Capital Requirements
Price (revenue) per unit $10
Unit variable manufacturing costs
Labor
Material
Overhead
$2
$1.20
$0.80
Monthly volume 833 units
Finished goods inventory to maintain 2 – month supply
Raw materials inventory to maintain 1 – month supply
Accounts payable 30 days
Accounts receivable 60 days
(Example 12.2)
47
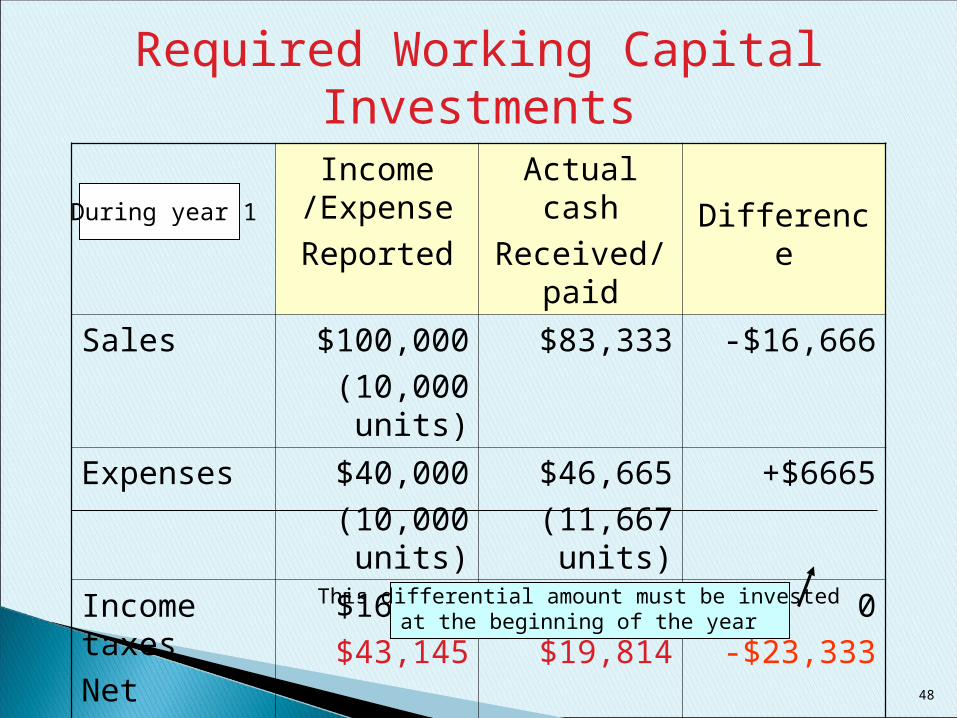
Income /Expense
Reported
Actual cash
Received/paid Difference
Sales $100,000
(10,000 units)
$83,333 -$16,666
Expenses $40,000
(10,000 units)
$46,665
(11,667 units)
+$6665
Income taxes
Net amount
$16,855
$43,145
$16,855
$19,814
0
-$23,333
During year 1
Required Working Capital Investments
This differential amount must be investedat the beginning of the year
48
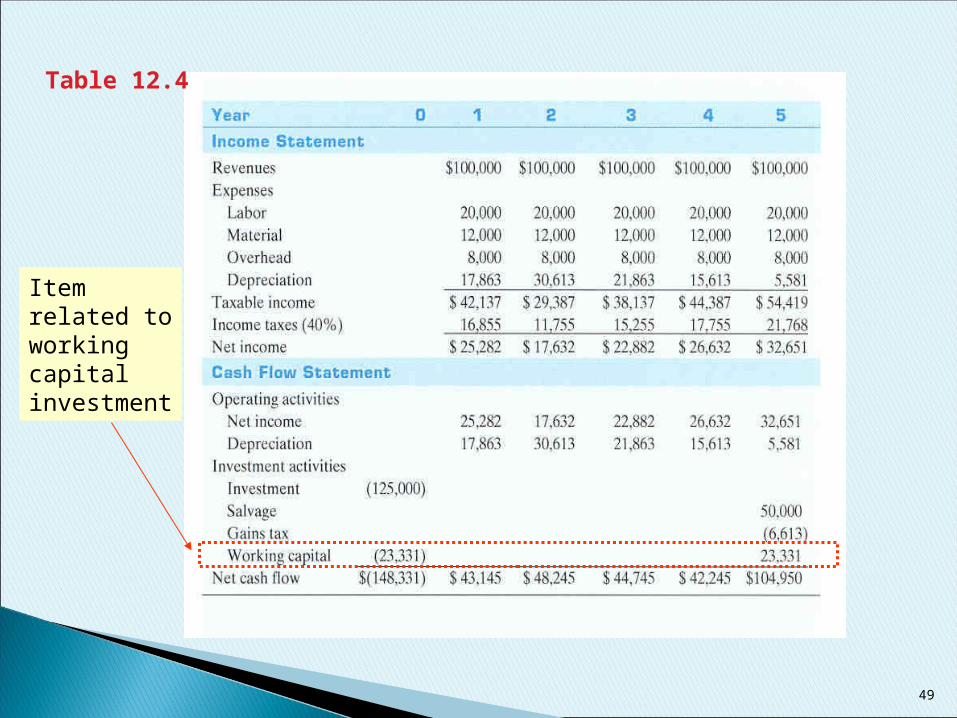
Table 12.4
Item related toworkingcapitalinvestment
49
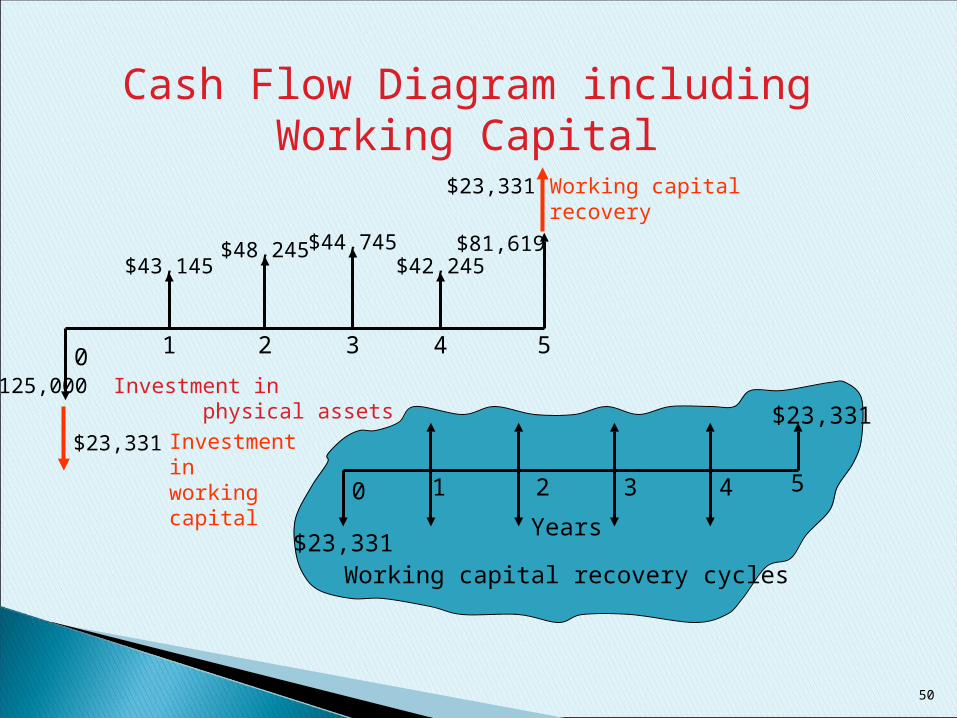
Cash Flow Diagram including Working Capital
0 1 2 3 4 5
$23,331Years
$23,331
Working capital recovery cycles
0 1 2 3 4 5
$43,145$48,245 $44,745
$42,245$81,619
Working capitalrecovery
$23,331
$125,000 Investment in physical assets
$23,331 Investment inworking capital
50
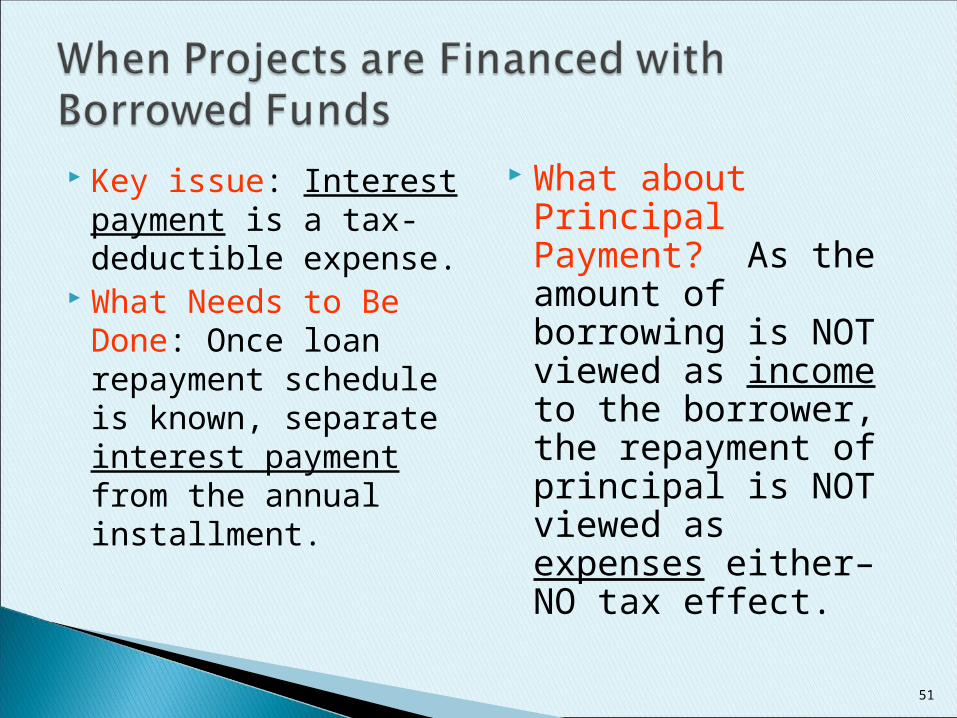
Key issue: Interest payment is a tax-deductible expense.
What Needs to Be Done: Once loan repayment schedule is known, separate interest payment from the annual installment.
What about Principal Payment? As the amount of borrowing is NOT viewed as income to the borrower, the repayment of principal is NOT viewed as expenses either– NO tax effect.
51

Loan Repayment Schedule (Example 12.4)
End of
Year
Beginning
Balance
Interest Payment
Principal Payment
Ending
Balance
1 $62,500 $6,250 $10,237 $52,263
2 52,263 5,226 11,261 41,002
3 41,002 4,100 12,387 28,615
4 28,615 2,861 13,626 14,989
5 14,989 1,499 14,988 0
Amount financed: $62,500, or 50% of total capital expenditureFinancing rate: 10% per yearAnnual installment: $16,487 or, A = $62,500(A/P, 10%, 5)
$16,487
52
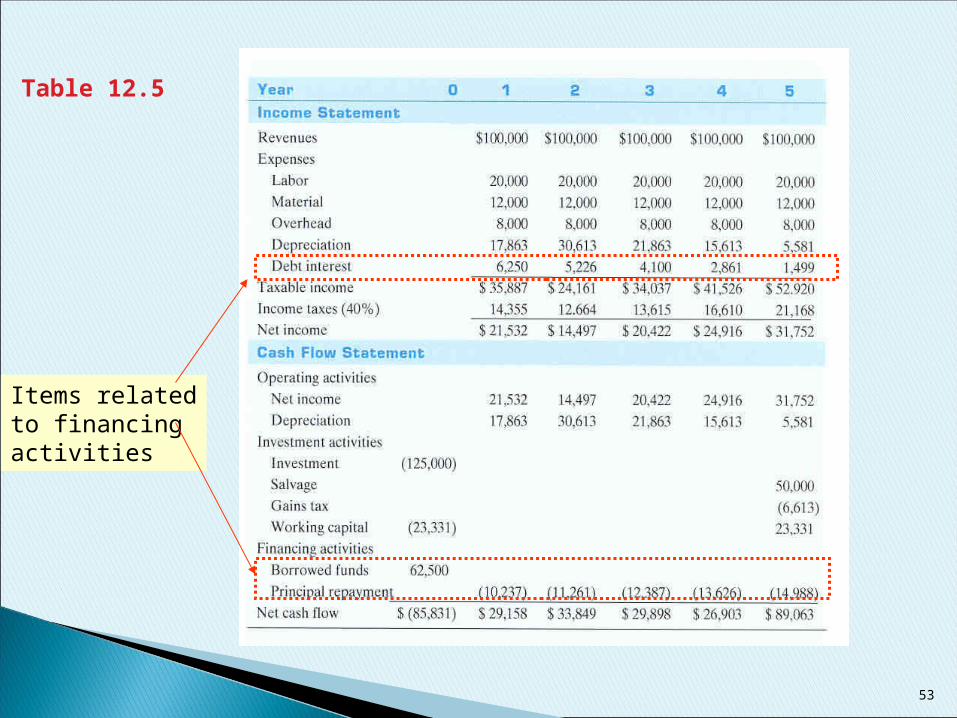
Items relatedto financingactivities
Table 12.5
53
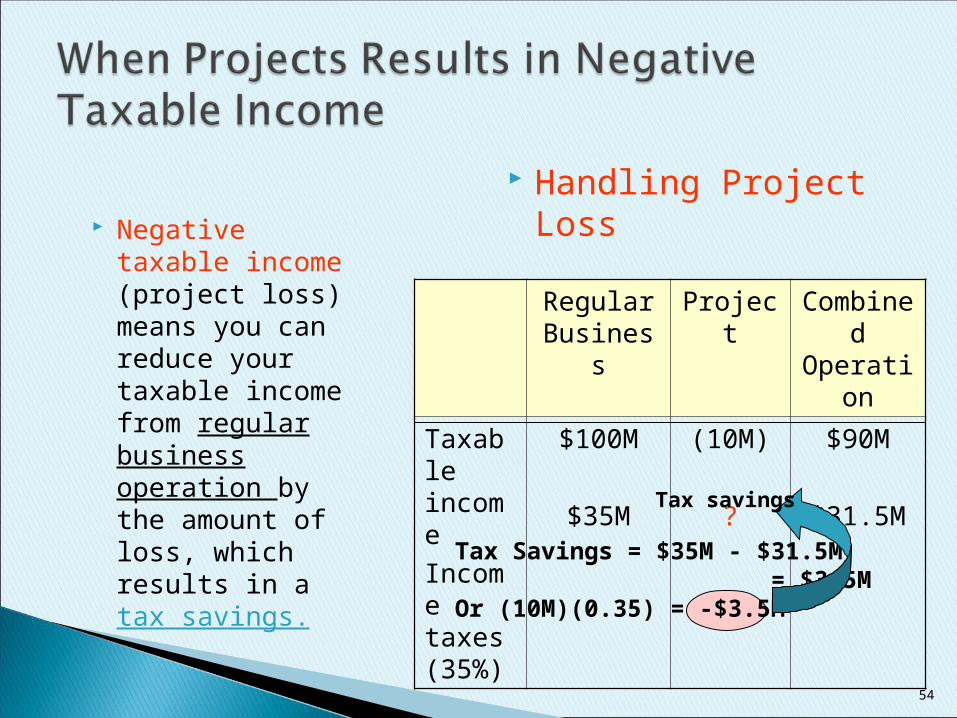
Negative taxable income (project loss) means you can reduce your taxable income from regular business operation by the amount of loss, which results in a tax savings.
Handling Project Loss
Regular Business
Project Combined Operation
Taxable income
Income taxes (35%)
$100M
$35M
(10M)
?
$90M
$31.5M
Tax Savings = $35M - $31.5M = $3.5MOr (10M)(0.35) = -$3.5M
Tax savings
54

When to Use: When undertaking a project does not change a company’s marginal tax rate.
Pros: The cash flows can be generated more quickly.
Cons: The process is less intuitive and not commonly understood by business people.
55
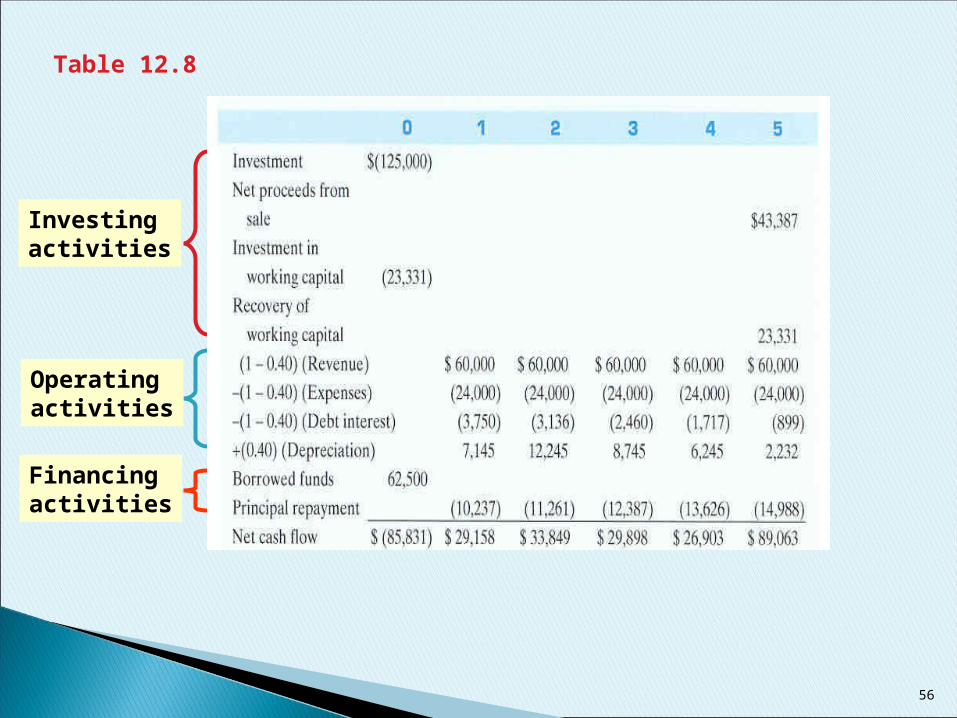
Table 12.8
Investing activities
Operatingactivities
Financingactivities
56
Summary
• Identifying and estimating relevant project cash flows is perhaps the most challenging aspect of engineering economic analysis. All cash flows can be organized into one of the following three categories:
1. Operating activities.2. Investing activities3. Financing activities.
57
•Cash Items
1. New investment and disposal of existing assets
2. Salvage value (or net selling price)
3. Working capital
4. Working capital release
5. Cash revenues/savings
6. Manufacturing, operating, and maintenance costs.
7. Interest and loan payments
8. Taxes and tax credits
58
• Non-cash items1. Depreciation expenses2. Amortization expenses
• The income statement approach is typically used in organizing project cash flows. This approach groups cash flows according to whether they are operating, investing, or financing functions.
• The generalized cash flow approach to organizing cash flows can be used when a project does not change a company’s marginal tax rate. The cash flows can be generated more quickly and the formatting of the results is less elaborate than with the income statement approach. However, the generalized approach is less intuitive and not commonly understood by business people.
59