
ERCIM News 105
52
Special theme Planning and Logistics ERCIM NEWS Number 105 April 2016 Research and Innovation: Business Process Execution Analysis through Coverage-based Monitoring by Antonello Calabrò, Francesca Lonetti, Eda Marchetti, ISTI-CNR www.ercim.eu Also in this issue: Keynote: Trends and Challenges in Logistics and Supply Chain Management by Henk Zijm, Professor of Production and Supply Chain Management, University of Twente
-
Upload
peter-kunz -
Category
Documents
-
view
218 -
download
3
description
Special theme: Planning and Logistics Research and innovation: News about research activities and innovative developments from European research institutes
Transcript of ERCIM News 105

Special theme
Planning and
Logistics
ERCIM NEWSNumber 105 April 2016
Research and Innovation:
Business Process Execution
Analysis through Coverage-based
Monitoring
by Antonello Calabrò, Francesca
Lonetti, Eda Marchetti, ISTI-CNR
www.ercim.eu
Also in this issue: Keynote:
Trends and Challenges in Logistics
and Supply Chain Management
by Henk Zijm, Professor of
Production and Supply Chain
Management, University of Twente
ERCIM News is the magazine of ERCIM. Published quarterly, it reports on
joint actions of the ERCIM partners, and aims to reflect the contribution
made by ERCIM to the European Community in Information Technology
and Applied Mathematics. Through short articles and news items, it pro-
vides a forum for the exchange of information between the institutes and
also with the wider scientific community. This issue has a circulation of
about 6,000 printed copies and is also available online.
ERCIM News is published by ERCIM EEIG
BP 93, F-06902 Sophia Antipolis Cedex, France
Tel: +33 4 9238 5010, E-mail: [email protected]
Director: Jérôme Chailloux
ISSN 0926-4981
Contributions
Contributions should be submitted to the local editor of your country
Copyright�notice
All authors, as identified in each article, retain copyright of their work
ERCIM News is licensed under a Creative Commons Attribution 4.0
International License (CC-BY).
Advertising
For current advertising rates and conditions, see
http://ercim-news.ercim.eu/ or contact [email protected]
ERCIM�News�online�edition�
The online edition is published at http://ercim-news.ercim.eu/
Next�issue
July 2016, Special theme: Cybersecurity
Subscription
Subscribe to ERCIM News by sending an email to
[email protected] or by filling out the form at the ERCIM News
website: http://ercim-news.ercim.eu/
Editorial�Board:
Central editor:
Peter Kunz, ERCIM office ([email protected])
Local Editors:
Austria: Erwin Schoitsch ([email protected])
Belgium:Benoît Michel ([email protected])
Cyprus: Ioannis Krikidis ([email protected])
Czech Republic:Michal Haindl ([email protected])
France: Steve Kremer ([email protected])
Germany: Michael Krapp ([email protected])
Greece: Eleni Orphanoudakis ([email protected]),
Artemios Voyiatzis ([email protected])
Hungary: Erzsébet Csuhaj-Varjú ([email protected])
Italy: Carol Peters ([email protected])
Luxembourg: Thomas Tamisier ([email protected])
Norway: Poul Heegaard ([email protected])
Poland: Hung Son Nguyen ([email protected])
Portugal: Joaquim Jorge ([email protected])
Spain: Silvia Abrahão ([email protected])
Sweden: Kersti Hedman ([email protected])
Switzerland: Harry Rudin ([email protected])
The Netherlands: Annette Kik ([email protected])
W3C: Marie-Claire Forgue ([email protected])
Cover photo by courtesy of Electrocomponents plc.
Editorial Information
ERCIM NEWS 105 April 2016
ERCIM NEWS 105 April 2016
Keynote
3
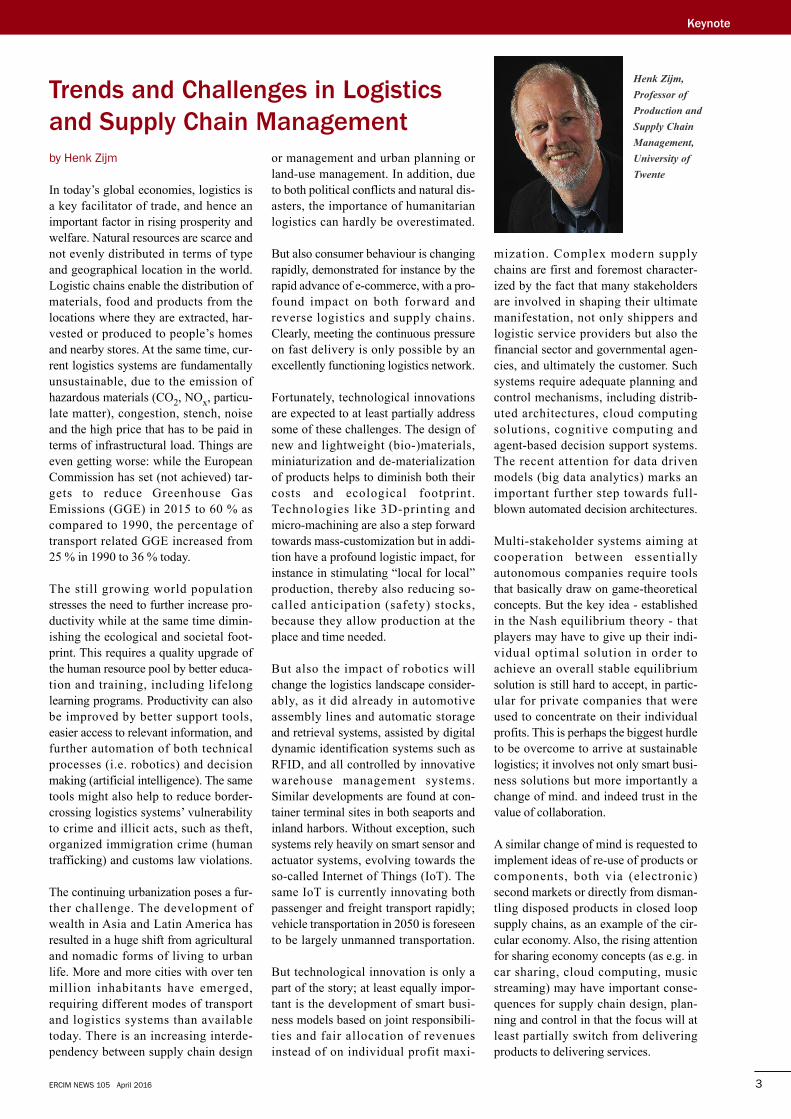
Henk�Zijm,
Professor�of
Production�and
Supply�Chain
Management,
University�of
Twente
or management and urban planning orland-use management. In addition, dueto both political conflicts and natural dis-asters, the importance of humanitarianlogistics can hardly be overestimated.
But also consumer behaviour is changingrapidly, demonstrated for instance by therapid advance of e-commerce, with a pro-found impact on both forward andreverse logistics and supply chains.Clearly, meeting the continuous pressureon fast delivery is only possible by anexcellently functioning logistics network.
Fortunately, technological innovationsare expected to at least partially addresssome of these challenges. The design ofnew and lightweight (bio-)materials,miniaturization and de-materializationof products helps to diminish both theircosts and ecological footprint.Technologies like 3D-printing andmicro-machining are also a step forwardtowards mass-customization but in addi-tion have a profound logistic impact, forinstance in stimulating “local for local”production, thereby also reducing so-called anticipation (safety) stocks,because they allow production at theplace and time needed.
But also the impact of robotics willchange the logistics landscape consider-ably, as it did already in automotiveassembly lines and automatic storageand retrieval systems, assisted by digitaldynamic identification systems such asRFID, and all controlled by innovativewarehouse management systems.Similar developments are found at con-tainer terminal sites in both seaports andinland harbors. Without exception, suchsystems rely heavily on smart sensor andactuator systems, evolving towards theso-called Internet of Things (IoT). Thesame IoT is currently innovating bothpassenger and freight transport rapidly;vehicle transportation in 2050 is foreseento be largely unmanned transportation.
But technological innovation is only apart of the story; at least equally impor-tant is the development of smart busi-ness models based on joint responsibili-ties and fair allocation of revenuesinstead of on individual profit maxi-
mization. Complex modern supplychains are first and foremost character-ized by the fact that many stakeholdersare involved in shaping their ultimatemanifestation, not only shippers andlogistic service providers but also thefinancial sector and governmental agen-cies, and ultimately the customer. Suchsystems require adequate planning andcontrol mechanisms, including distrib-uted architectures, cloud computingsolutions, cognitive computing andagent-based decision support systems.The recent attention for data drivenmodels (big data analytics) marks animportant further step towards full-blown automated decision architectures.
Multi-stakeholder systems aiming atcooperation between essentiallyautonomous companies require toolsthat basically draw on game-theoreticalconcepts. But the key idea - establishedin the Nash equilibrium theory - thatplayers may have to give up their indi-vidual optimal solution in order toachieve an overall stable equilibriumsolution is still hard to accept, in partic-ular for private companies that wereused to concentrate on their individualprofits. This is perhaps the biggest hurdleto be overcome to arrive at sustainablelogistics; it involves not only smart busi-ness solutions but more importantly achange of mind. and indeed trust in thevalue of collaboration.
A similar change of mind is requested toimplement ideas of re-use of products orcomponents, both via (electronic)second markets or directly from disman-tling disposed products in closed loopsupply chains, as an example of the cir-cular economy. Also, the rising attentionfor sharing economy concepts (as e.g. incar sharing, cloud computing, musicstreaming) may have important conse-quences for supply chain design, plan-ning and control in that the focus will atleast partially switch from deliveringproducts to delivering services.
Trends and Challenges in Logistics
and Supply Chain Management
by Henk Zijm
In today’s global economies, logistics isa key facilitator of trade, and hence animportant factor in rising prosperity andwelfare. Natural resources are scarce andnot evenly distributed in terms of typeand geographical location in the world.Logistic chains enable the distribution ofmaterials, food and products from thelocations where they are extracted, har-vested or produced to people’s homesand nearby stores. At the same time, cur-rent logistics systems are fundamentallyunsustainable, due to the emission ofhazardous materials (CO2, NOx, particu-late matter), congestion, stench, noiseand the high price that has to be paid interms of infrastructural load. Things areeven getting worse: while the EuropeanCommission has set (not achieved) tar-gets to reduce Greenhouse GasEmissions (GGE) in 2015 to 60 % ascompared to 1990, the percentage oftransport related GGE increased from 25 % in 1990 to 36 % today.
The still growing world populationstresses the need to further increase pro-ductivity while at the same time dimin-ishing the ecological and societal foot-print. This requires a quality upgrade ofthe human resource pool by better educa-tion and training, including lifelonglearning programs. Productivity can alsobe improved by better support tools,easier access to relevant information, andfurther automation of both technicalprocesses (i.e. robotics) and decisionmaking (artificial intelligence). The sametools might also help to reduce border-crossing logistics systems’ vulnerabilityto crime and illicit acts, such as theft,organized immigration crime (humantrafficking) and customs law violations.
The continuing urbanization poses a fur-ther challenge. The development ofwealth in Asia and Latin America hasresulted in a huge shift from agriculturaland nomadic forms of living to urbanlife. More and more cities with over tenmillion inhabitants have emerged,requiring different modes of transportand logistics systems than availabletoday. There is an increasing interde-pendency between supply chain design
ERCIM NEWS 105 April 20164
Contents
JoINT ERCIM ACTIoNS
6 ManyVal 2015 - Workshop on Many-
Valued Logics
by Carles Noguera
6 ERCIM Cor Baayen Award
7 How Science can Improve Marine
Ecosystem Predictions: the BlueBRIDGE
Case
by Sara Garavelli
KEyNoTE
3 Trends and Challenges in Logistics and
Supply Chain Management
by Henk Zijm, Professor of Production andSupply Chain Management, University ofTwente
SPECIAL THEME
The special theme section “Planning and Logistics”has been coordinated by Rob van der Mei, CWI andAriona Shashaj, SICS.
Introduction to the Special Theme8 Visions of the Future: Towards the Next
Generation of Logistics and Planning Systems
by Rob van der Mei, CWI, and Ariona Shashaj,SICS
Simulation Models and Test Beds10 Defining the Best Distribution Network for
Grocery Retail Stores
by Pedro Amorim, Sara Martins, Eduardo Curcioand Bernardo Almada-Lobo, INESC TEC
11 Planning Production Efficiently
by Andreas Halm, Fraunhofer Austria
12 ICT for a Logistics Demonstration Centre
by Miguel A. Barcelona, Aragón Institute ofTechnology
14 Production Planning on Supply Network and
Plant Levels: The RobustPlaNet Approach
by Péter Egri, Dávid Gyulai, Botond Kádár andLászló Monostori, SZTAKI
Case Studies15 Modelling and Validating an Import/Export
Shipping Process
by Giorgio O. Spagnolo, Eda Marchetti, AlessandroCoco and Stefania Gnesi, ISTI-CNR
16 Where is the Money? - Optimizing Cash Supply
Chain Networks
by Leendert Kok and Joaquim Gromicho, ORTEC
18 An Industrial Take on Breast Cancer Treatment
by Sara Gestrelius and Martin Aronsson, SICSSwedish ICT
19 Evaluating Operational Feasibility before
Investing: Shunting Yards in Sweden
by Sara Gestrelius, SICS Swedish ICT
20 Boosting the Responsiveness of Firefighter
Services with Mathematical Programming
by Pieter van den Berg, TU Delft, GuidoLegemaate, Amsterdam Fire Department, and Robvan der Mei, CWI
22 Predicting the Demand for Charging Stations for
Electric Vehicles
by Merel Steenbrink, Elenna Dugundji and Rob vander Mei, CWI
ERCIM NEWS 105 April 2016 5
Cutting-Edge Technologies 23 Data-driven Optimization for Intelligent and
Efficient Transport
by Björn Bjurling and Fehmi Ben Abdesslem, SICSSwedish ICT
24 Adopting a Machine Learning Approach in the
Design of Smart Transportation Systems
by Davide Bacciu, Antonio Carta, Stefania Gnesiand Laura Semini, ISTI-CNR
25 Remote Service Using Augmented Reality
by Björn Löfvendahl, SICS Swedish ICT
Sustainable Logistics and Planning26 Value Stream Mapping with VASCO - From
Reducing Lead Time to Sustainable Production
Management
by René Berndt and Alexander Sunk, FraunhoferAustria
28 Risk Analysis for a Synchro-modal Supply Chain
Combined with Smart Steaming Concepts
by Denise Holfeld and Axel Simroth, FraunhoferIVI
Mathematical Tools for Logistics and Planning29 Designing Sustainable Last-Mile Delivery
Services in Online Retailing
by Niels Agatz, Leo Kroon, Remy Spliet and AlbertWagelmans, Erasmus University Rotterdam
30 Spare Parts Stocking and Expediting in a
Fluctuating Demand Environment
by Joachim Arts, TU Eindhoven
32 Packing with Complex Shapes
by Abderrahmane Aggoun, KLS OPTIM, NicolasBeldiceanu, Gilles Chabert, École des Mines deNantes and François Fages, Inria
33 Allocating Railway Tracks Using Market
Mechanisms and Optimization
by Victoria Svedberg, SICS Swedish ICT
34 OscaR, an Open Source Toolbox for Optimising
Logistics and Supply Chain Systems
by Renaud De Landtsheer, Christophe Ponsard andYoann Guyot, CETIC
35 Integrated Resource Planning in Maintenance
Logistics
by Ahmad Al Hanbali, Sajjad Rahimi-Ghahroodi,and Henk Zijm
36 Utilising the Uniqueness of Operation Days to
better Fulfil Customer Requirements
by Sara Gestrelius
38 Planning Complex Supply Networks Facing High
Variability
by Ulrich Schimpel and Stefan Wörner, IBMResearch
RESEARCH ANd INNoVATIoN
This section features news about research activitiesand innovative developments from Europeanresearch institutes
40 Business Process Execution Analysis throughCoverage-based Monitoring
by Antonello Calabrò, Francesca Lonetti, EdaMarchetti, ISTI-CNR
42 Quality of Experience-assessment of WebRTCBased Video Communication
by Doreid Ammar, Katrien De Moor and PoulHeegaard, NTNU
43 D2V – Understanding the Dynamics of Evolv-ing Data: A Case Study in the Life Sciencesby Kostas Stefanidis, Giorgos Flouris, IoannisChrysakis and Yannis Roussakis, ICS-FORTH
45 Detection of Data Leaks in Collaborative
Data Driven Research
by Peter Kieseberg, Edgar Weippl, SBAResearch, and Sebastian Schrittwieser, TARGET
46 HOBBIT: Holistic Benchmarking of Big
Linked Data
by AxelCyrille Ngonga Ngomo, InfAI, AlejandraGarcía Rojas, ONTOS, and Irini Fundulaki, ICS-FORTH
48 Smart Solutions for the CNR Campus in Pisaby Erina Ferro, ISTI-CNR
EVENTS, IN BRIEf
Announcements47 ERCIM “Alain Bensoussan” Fellowship
Programme
49 Minerva Informatics Equality Award
49 FMICS-AVoCS 2016: International Workshop
on Formal Methods for Industrial Critical
Systems and Automated Verification of
Critical Systems
50 ERCIM Membership
In Brief50 SHIFT2RAIL - European Railway Research
of 2015-2024
50 The ExaNeSt project - Fitting Ten Million
Computers into a Single Supercomputer
Joint ERCIM Actions
ManyVal 2015 - Workshop
on Many-Valued Logics
by Carles Noguera
ManyVal is a series of international workshops on the
logical and algebraic aspects of many-valued reasoning.
The 2015 workshop served as the official meeting of
the ERCIM Working Group of the same name.
The aim of the workshop series is to bring together bothestablished and young researchers sharing an interest for aspecific topic. Accordingly, each edition has a sharp focus.The attendance is limited in order to facilitate close andinformal interaction. There are no parallel sessions and con-tributed talks are allocated ample time.
The chosen topic this year was modal and first-order many-valued logics. The workshop took place at Hotel Les Sourcesin Les Diablerets, Switzerland, from 11-13 December 2015.The program committee was chaired by George Metcalfe(University of Bern) and the organizing committee waschaired by Denisa Diaconescu (University of Bern), withassistance from other members of the Logic group at theMathematical Institute.
There were 28 participants at the meeting from 10 countries.The program included invited talks by Itaï Ben Yaacov(Université Claude Bernard, Lyon 1, France), Marta Bílková(Charles University, Prague, Czech Republic), XavierCaicedo (Universidad de los Andes, Colombia), Petr Cintula(Academy of Sciences, Prague, Czech Republic), RafaelPeñaloza (Free University of Bozen-Bolzano, Italy). It alsoincluded eleven selected contributed talks of half an hour.
Sponsors of ManyVal 2015 included the Swiss NationalScience Foundation (SNF) and the European ResearchConsortium for Informatics and Mathematics (ERCIM).
Past editions of ManyVal took place in Gargnano (2006),Milan (2008), Varese (2010), Salerno (2012), and Prague(2013).
Link: http://mathsites.unibe.ch/manyval2015/
Please contact:
Carles Noguera, Institute of Information Theory andAutomation (UTIA), Czech Academy of Sciences/CRCIMChair of the ERCIM ManyVal Working GroupTel: +420 26605 [email protected]
ERCIM NEWS 105 April 20166
Call for Nominations
Cor Baayen Award 2016
The Cor Baayen Award is given each year to a promisingyoung researcher in computer science and applied mathe-matics. The award was created in 1995 to honour the firstERCIM President.
The award consists of a cheque for 5000 Euro together withan award certificate. The winner of the 2016 Award will beinvited to present her or his work at the European ComputerScience Summit 2016 in Budapest, co-located with theannual ERCIM and Informatics Europe fall meetings.
EligibilityNominees must have carried out their work in one of the“ERCIM countries”: Austria, Belgium, Cyprus, CzechRepublic, Finland, France, Germany, Greece, Hungary, Italy,Luxembourg, Norway, Poland, Portugal, Spain, Sweden, TheNetherlands and the United Kingdom. Nominees must havebeen awarded their PhD (or equivalent) after 30 April 2013.A person can only be nominated once for the Cor BaayenAward.
Submitting a nominationNominations should be made by a staff member of anERCIM member institute. Self nominations are not accepted.Nominees must have performed their research at anyresearch organisation from the country of the nominatinginstitution. Nominations must be submitted online. Deadlineis 15 May 2016.
Cor Baayen Award Selection CommitteeThe selection of the Cor Baayen award winner is the respon-sibility of ERCIM’s Human Capital Task Group, who mayconsult expert opinion in reaching its decision.
More information and submission form:
http://www.ercim.eu/activity/cor-baayen-award
Please contact:
The ERCIM representative of your country (see http://www.ercim.eu/about/member-representation)or Claude Kirchner, InriaERCIM Cor Baayen Award coordinator [email protected]
The�Cor�Baayen�Award�is
named�after�the�first
president�of�ERCIM�and
the�ERCIM�‘president
d’honneur’.�Cor�Baayen
played�an�important�role�in�its�foundation.�Cor�Baayen�was�scientific
director�of�the�Centrum�Wiskunde�&�Informatica�(CWI)�in�the
Netherlands��from�1980�to�1994.
ERCIM NEWS 105 April 2016
“Through the EwE models available via the software pro-vided by the Ecopath Consortium the project leaders of theVancouver port were able to understand in advance theimpact of the extension of the port on the marine resourcedynamics”, continues Steenbeek, “EwE infact has shownthat the building of the extension to the port may not be thatenvironmentally impactful and that not all of the countermeasures foreseen by the initial project may be needed”.
EwE has proved how useful it can be displaying its potentialin the research toward the impacts of climate change andhuman activities on marine ecosystems. However, todaythere are still a set of technical limitations that prevent awider adoption of the EwE approach. The key for good pre-dictions are, in addition to thorough understanding of amarine ecosystem, good data. Different data in different for-mats, which correspond to a majority of the situations inwhich the users of EwE work, requires a huge effort andresources just too initially set up the simulation models. Inaddition, running ecosystem simulation models requireslarge computational resources to which nor everyone hasaccess.
That’s why the Ecopath Consortium has joined theBlueBRIDGE project. BlueBRIDGE - Building Researchenvironments fostering innovation, decision making, gover-nance and education - is the newly funded H2020 projectaimed at providing innovative data services to scientists,researchers and data managers to address key challengesrelated to sustainable growth in the marine and maritime sec-tors referred to as the “Blue Growth long term strategy”.
BlueBRIDGE can support the process of Ecopath model cre-ation by making available for Ecopath a seamless access todifferent species, fisheries and environmental data sources.
In the doing this, users of Ecopath do not need to worry aboutdata harmonization or conversion and can focus on theecosystem modelling, which inevitably speeds up theirresearch. In addition, the BlueBRIDGE underlying infra-structure D4Science, can equip Ecopath with cloud capabili-ties on which they can run their model (at the moment EwEis only available via a desktop version). BlueBRIDGE canenhance the EwE capabilities and expand its usage to a wideraudience, contributing to the creation of more powerful andaccurate instruments for the prediction of human activitieson seas and ecosystems. The results of the BlueBRIDGE andEwE collaboration will be available for all the researchersworldwide. Keep your eye on BlueBRIDGE!
The project is coordinated by ISTI-CNR, the ERCIM Officecontributes with expertise for administrative and financialmanagement.
Links:
http://www.bluebridge-vres.eu@BlueBridgeVREshttp://www.ecopath.orghttp://www.d4science.org
Please contact:
Donatella Castelli, ISTI-CNR, [email protected]
7
How Science can Improve
Marine Ecosystem
Predictions:
the BlueBRIdGE Case
by Sara Garavelli
BlueBRIDGE - Building Research environments fostering
innovation, decision making, governance and education
- is a European project aimed at providing innovative
data services to scientists, researchers and data
managers to address key challenges related to
sustainable growth in the marine and maritime sectors.
Imagine yourself wanting to build a wonderful new threestorey house in the countryside. You go to the local authori-ties and they say that unfortunately you can only have twostoreys, due to birds nesting nearby and having a higherbuilding will affect their habitat. Or imagine that a localcouncil wants to move a flood defence system seaward butit’s not possible because the beach and environment in thesurrounding areas will be damaged. Human decisions arehighly influenced by ecosystems.
A central problem in ecology is determining the processesthat shape the complex networks known as food websformed by species and their feeding relationships. Thetopology of these networks is a major determinant of ecosys-tems’ dynamics and is ultimately responsible for theirresponses to human impacts.
A real example is documented by the Vancouver harbourcase. The Robert Bank Terminal 2 (RBT2), Vancouver, BC,project proposed to increase the size of the port, adapting tothe increase in demand for container shipping traffic which isexpected to triple by 2030. To understand the impact of thischange on the ecosystem, the project leaders enlisted helpfrom food web models, in particular of the Ecopath withEcosim (EwE) model.
Jeroen Steenbeek, Head Technical Committee at EcopathResearch and Development Consortium, explains that“Making predictions of the future state of the marineecosystem of the Vancouver port was an exciting experiencebecause we were able to see how ecosystem models couldimpact real world decisions. Single-species fisheries models,which are usually adopted for management evaluation, mustbe complemented as they are unable to capture interactionsbetween species and information on their spatial distribution.The ecosystem modelling approach of EwE offers a means toincorporate interactions and spatial constraints into a usefultool for ecosystem-based fisheries management”.
Introduction to the Special Theme
Visions of the future:
Towards the Next Generation
of Logistics and Planning
Systems
by Rob van der Mei, CWI, and Ariona Shashaj, SICS
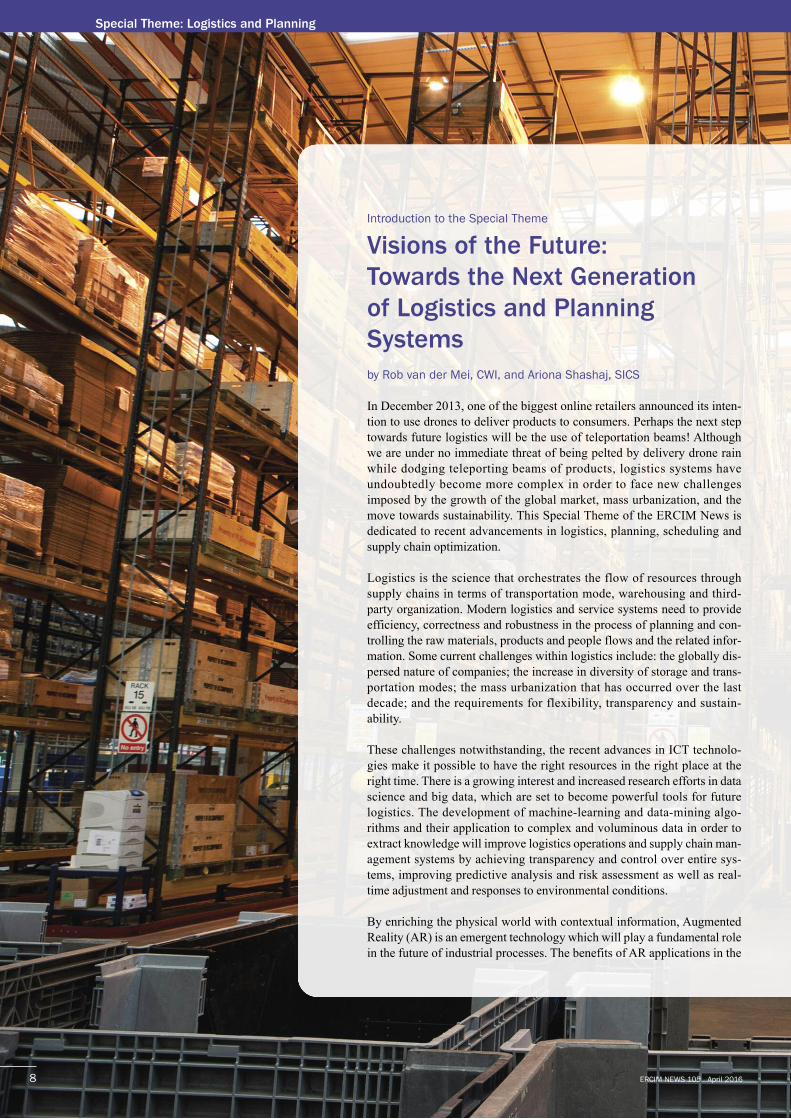
In December 2013, one of the biggest online retailers announced its inten-tion to use drones to deliver products to consumers. Perhaps the next steptowards future logistics will be the use of teleportation beams! Althoughwe are under no immediate threat of being pelted by delivery drone rainwhile dodging teleporting beams of products, logistics systems haveundoubtedly become more complex in order to face new challengesimposed by the growth of the global market, mass urbanization, and themove towards sustainability. This Special Theme of the ERCIM News isdedicated to recent advancements in logistics, planning, scheduling andsupply chain optimization.
Logistics is the science that orchestrates the flow of resources throughsupply chains in terms of transportation mode, warehousing and third-party organization. Modern logistics and service systems need to provideefficiency, correctness and robustness in the process of planning and con-trolling the raw materials, products and people flows and the related infor-mation. Some current challenges within logistics include: the globally dis-persed nature of companies; the increase in diversity of storage and trans-portation modes; the mass urbanization that has occurred over the lastdecade; and the requirements for flexibility, transparency and sustain-ability.
These challenges notwithstanding, the recent advances in ICT technolo-gies make it possible to have the right resources in the right place at theright time. There is a growing interest and increased research efforts in datascience and big data, which are set to become powerful tools for futurelogistics. The development of machine-learning and data-mining algo-rithms and their application to complex and voluminous data in order toextract knowledge will improve logistics operations and supply chain man-agement systems by achieving transparency and control over entire sys-tems, improving predictive analysis and risk assessment as well as real-time adjustment and responses to environmental conditions.
By enriching the physical world with contextual information, AugmentedReality (AR) is an emergent technology which will play a fundamental rolein the future of industrial processes. The benefits of AR applications in the
Special Theme: Logistics and Planning
ERCIM NEWS 105 April 20168

fields of logistics and planning operations range from sensory integrativemodels to intelligent transportation and execution of maintenance/ware-house operations.
A selection of articles in this special theme discusses the potential use ofthese cutting-edge technologies to logistics operations, such as data-drivemodels derived through big data techniques and the potential use ofmachine-learning approaches for intelligent transportation systems, aswell as remote maintenance systems through AR applications.
Although the improvement of emerging technologies will lead us to thefuture of logistics, what stands behind today’s efficient logistics operationsand planning is the application of mathematical tools. This special themeincludes a selection of publications that provide an overview of these toolsand their application. In particular, an open source optimization frameworkis discussed and used within specific case studies in logistics, such as riskassessment and vehicle route optimization. Stochastic optimization is dis-cussed in two different contexts: firstly, in solving placement and packingproblems in scenarios involving complex industrial objects, and secondlyto efficiently plan complex supply network and logistics maintenanceoperations. Mixed integer programming techniques are used to optimizetrain timetables and reduce losses on railway infrastructure capacitieswhile satisfying time constraints and quality of service.
A selection of four articles describe the simulation models and test beds inthe field of logistics and planning operations: application of simulation-based optimization approach in order to improve the distribution networkof grocery retail stores, description of a 3D modelling software for produc-tion factory planning, development of a test bed infrastructure for logisticsand transportation, and the study of new models towards global collabora-tive and robust production networks.
Finally, some real world case studies are included in this special theme:modelling and validation of a system for shipping lane management; studyof the impact of patient logistics management on breast cancer treatment;improving the planning and distribution of fire-fighter stations and vehi-cles; study of the challenges related to the cash supply chain network; andoptimizing the planning of railway shunting yards.
Please ocntact: Rob van der Mei, [email protected]
Ariona Shashaj, [email protected]
ERCIM NEWS 105 April 2016 9
In the food retail sector, maintainingfood quality across the supply chain is ofvital importance. Product quality isdependent on storage and transportationconditions. Compared with other typesof retailers the supply chain is very com-plex, and is best considered as an amal-gamation of three types of intertwinedfood supply chains: frozen, chilled andambient [1].
Store formats vary among food retailers,in terms of size, product ranges and salesvolumes. To be closer to and more con-venient for their customers, retailers areopening new stores every year in newlocations. The allocation of new storesto the distribution centres is frequentlydefined ad hoc. These allocations affectthe distribution of the different productcategories (temperatures) and the opera-tional capacity of the warehouses [2].Furthermore, poor distribution planningmight result in low vehicle utilizationand consequently in an overestimatedfleet size and/or a fleet mix that isunnecessarily costly. Since product-warehouse-outlet assignment (assign-ment to distribution centres), productdelivery mode planning (direct shippingand/or hub-and-spoke) and fleet sizing
(types and dimensions) are inter-related, solving them separately resultsin oversimplification. However, tack-ling these decisions simultaneouslyrequires extremely complex mathemat-ical programming which is unfeasiblefor the real world. Furthermore, existingliterature in this field fails to includecritical ingredients, such as the consis-tency of the operations throughout theyear, rendering the proposedapproaches not applicable.
A real-world caseSonae MC is the leading groceryretailer in Portugal. Its store outlet isdivided in three segments: hypermar-kets, supermarkets and conveniencestores. To supply its 210 stores (fran-chising stores are not considered here)with 60,000 products, it relies on twohubs and two specialized warehouses(for fish and meat). Stores are suppliedevery day with a dedicated, heteroge-neous fleet and transportation relatedannual costs amount to around 40 mil-lion euros.
Recently, thanks to an optimization-simulation driven approach developedat INESC TEC, Sonae MC has
improved its distribution network andit was able to cut transportation relatedcosts by more than 750 thousandeuros, while maintaining the sameservice level to stores. After severaliterations, Sonae MC selected a solu-tion that simplifies and segregates thedistribution of the different productcategories. This allowed for a reduc-tion of the fleet size and a change inthe fleet mix. Additionally, it has per-formed some adjustments in the ware-house-outlet assignment that hasresulted in reduced warehouse opera-tional costs.
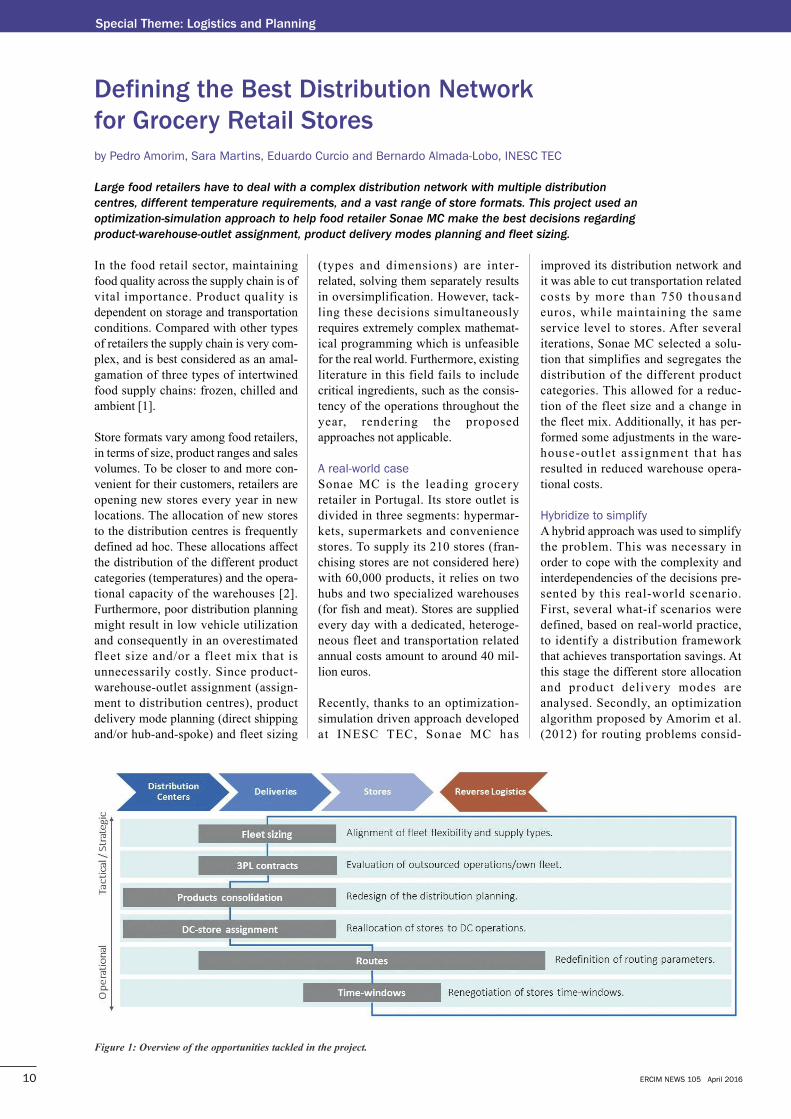
Hybridize to simplifyA hybrid approach was used to simplifythe problem. This was necessary inorder to cope with the complexity andinterdependencies of the decisions pre-sented by this real-world scenario.First, several what-if scenarios weredefined, based on real-world practice,to identify a distribution frameworkthat achieves transportation savings. Atthis stage the different store allocationand product delivery modes areanalysed. Secondly, an optimizationalgorithm proposed by Amorim et al.(2012) for routing problems consid-
ERCIM NEWS 105 April 201610
Special Theme: Logistics and Planning
defining the Best distribution Network
for Grocery Retail Stores
by Pedro Amorim, Sara Martins, Eduardo Curcio and Bernardo Almada-Lobo, INESC TEC
Large food retailers have to deal with a complex distribution network with multiple distribution
centres, different temperature requirements, and a vast range of store formats. This project used an
optimization-simulation approach to help food retailer Sonae MC make the best decisions regarding
product-warehouse-outlet assignment, product delivery modes planning and fleet sizing.
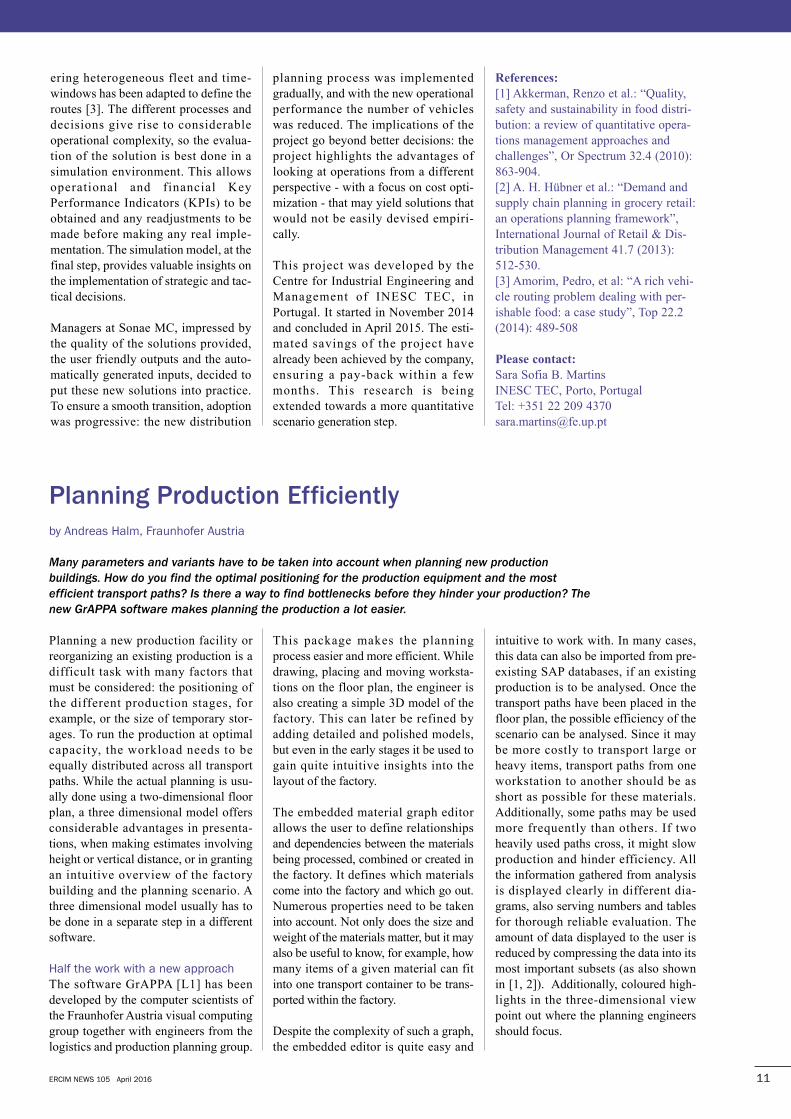
Figure�1:�Overview�of�the�opportunities�tackled�in�the�project.
ering heterogeneous fleet and time-windows has been adapted to define theroutes [3]. The different processes anddecisions give rise to considerableoperational complexity, so the evalua-tion of the solution is best done in asimulation environment. This allowsoperational and financial KeyPerformance Indicators (KPIs) to beobtained and any readjustments to bemade before making any real imple-mentation. The simulation model, at thefinal step, provides valuable insights onthe implementation of strategic and tac-tical decisions.
Managers at Sonae MC, impressed bythe quality of the solutions provided,the user friendly outputs and the auto-matically generated inputs, decided toput these new solutions into practice.To ensure a smooth transition, adoptionwas progressive: the new distribution
planning process was implementedgradually, and with the new operationalperformance the number of vehicleswas reduced. The implications of theproject go beyond better decisions: theproject highlights the advantages oflooking at operations from a differentperspective - with a focus on cost opti-mization - that may yield solutions thatwould not be easily devised empiri-cally.
This project was developed by theCentre for Industrial Engineering andManagement of INESC TEC, inPortugal. It started in November 2014and concluded in April 2015. The esti-mated savings of the project havealready been achieved by the company,ensuring a pay-back within a fewmonths. This research is beingextended towards a more quantitativescenario generation step.
References:
[1] Akkerman, Renzo et al.: “Quality,safety and sustainability in food distri-bution: a review of quantitative opera-tions management approaches andchallenges”, Or Spectrum 32.4 (2010):863-904.[2] A. H. Hübner et al.: “Demand andsupply chain planning in grocery retail:an operations planning framework”,International Journal of Retail & Dis-tribution Management 41.7 (2013):512-530.[3] Amorim, Pedro, et al: “A rich vehi-cle routing problem dealing with per-ishable food: a case study”, Top 22.2(2014): 489-508
Please contact:
Sara Sofia B. MartinsINESC TEC, Porto, PortugalTel: +351 22 209 [email protected]
ERCIM NEWS 105 April 2016 11
Planning a new production facility orreorganizing an existing production is adifficult task with many factors thatmust be considered: the positioning ofthe different production stages, forexample, or the size of temporary stor-ages. To run the production at optimalcapacity, the workload needs to beequally distributed across all transportpaths. While the actual planning is usu-ally done using a two-dimensional floorplan, a three dimensional model offersconsiderable advantages in presenta-tions, when making estimates involvingheight or vertical distance, or in grantingan intuitive overview of the factorybuilding and the planning scenario. Athree dimensional model usually has tobe done in a separate step in a differentsoftware.
Half the work with a new approachThe software GrAPPA [L1] has beendeveloped by the computer scientists ofthe Fraunhofer Austria visual computinggroup together with engineers from thelogistics and production planning group.
This package makes the planningprocess easier and more efficient. Whiledrawing, placing and moving worksta-tions on the floor plan, the engineer isalso creating a simple 3D model of thefactory. This can later be refined byadding detailed and polished models,but even in the early stages it be used togain quite intuitive insights into thelayout of the factory.
The embedded material graph editorallows the user to define relationshipsand dependencies between the materialsbeing processed, combined or created inthe factory. It defines which materialscome into the factory and which go out.Numerous properties need to be takeninto account. Not only does the size andweight of the materials matter, but it mayalso be useful to know, for example, howmany items of a given material can fitinto one transport container to be trans-ported within the factory.
Despite the complexity of such a graph,the embedded editor is quite easy and
intuitive to work with. In many cases,this data can also be imported from pre-existing SAP databases, if an existingproduction is to be analysed. Once thetransport paths have been placed in thefloor plan, the possible efficiency of thescenario can be analysed. Since it maybe more costly to transport large orheavy items, transport paths from oneworkstation to another should be asshort as possible for these materials.Additionally, some paths may be usedmore frequently than others. If twoheavily used paths cross, it might slowproduction and hinder efficiency. Allthe information gathered from analysisis displayed clearly in different dia-grams, also serving numbers and tablesfor thorough reliable evaluation. Theamount of data displayed to the user isreduced by compressing the data into itsmost important subsets (as also shownin [1, 2]). Additionally, coloured high-lights in the three-dimensional viewpoint out where the planning engineersshould focus.
Planning Production Efficiently
by Andreas Halm, Fraunhofer Austria
Many parameters and variants have to be taken into account when planning new production
buildings. How do you find the optimal positioning for the production equipment and the most
efficient transport paths? Is there a way to find bottlenecks before they hinder your production? The
new GrAPPA software makes planning the production a lot easier.
Easily adaptable and extendableMost of the algorithms, diagrams andanalysis tools in GrAPPA are pro-grammed in a specially tailored scriptlanguage. Whenever part of the factorylayout or the data changes, the scriptsget notified of the change and mayrecalculate results, modify informationor rebuild diagrams. This has the advan-tage that all the diagrams, computations
and the data layout can be easilyadapted to fit the needs of a given fac-tory. In the simplest case, this may bejust a colouring issue, to get the dia-grams to fit into the corporate identityof the business. Modifying the algo-rithms is more complex, for exampleadding a new transportation systemwould change the outcome of the wholeanalysis. One key advantage is that it
also means that the data layout, bywhich data is imported into the pro-gram, is not fixed but can be adapted tothe layout that is already in place in thebusiness’s databases. Also imple-menting new algorithms or integratingdifferent data combinations is an easytask, thereby making this a perfect testplatform for new developments in thearea.
Link:
[L1] http://www.fraunhofer.at/grappa
References:
[1] A. Halm et al.: “Energy Balance: Aweb-based Visualization of Energy forAutomotive Engineering usingX3DOM”, in “Proceeding of theInternational Conference CONTENT”,2013, pp. 1 - 10[2] A. Halm et al.: “Time-basedVisualization of Large Data-Sets -- AnExample in the Context of AutomotiveEngineering”, in “International journalon advances in software”, 2014, pp.139 - 149
Please contact:
Andreas HalmFraunhofer Austria Visual ComputingTel +43 316 873 [email protected]
ERCIM NEWS 105 April 201612
Special Theme: Logistics and Planning
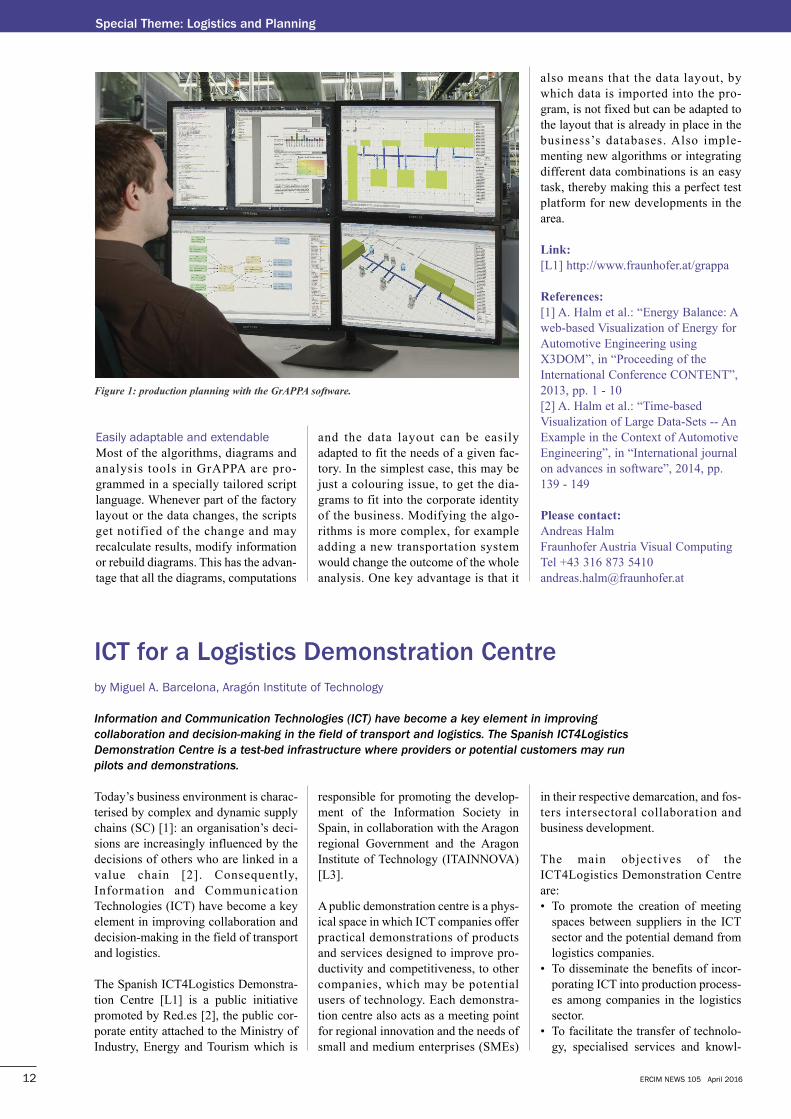
Figure�1:�production�planning�with�the�GrAPPA�software.�
Today’s business environment is charac-terised by complex and dynamic supplychains (SC) [1]: an organisation’s deci-sions are increasingly influenced by thedecisions of others who are linked in avalue chain [2]. Consequently,Information and CommunicationTechnologies (ICT) have become a keyelement in improving collaboration anddecision-making in the field of transportand logistics.
The Spanish ICT4Logistics Demonstra-tion Centre [L1] is a public initiativepromoted by Red.es [2], the public cor-porate entity attached to the Ministry ofIndustry, Energy and Tourism which is
responsible for promoting the develop-ment of the Information Society inSpain, in collaboration with the Aragonregional Government and the AragonInstitute of Technology (ITAINNOVA)[L3].
A public demonstration centre is a phys-ical space in which ICT companies offerpractical demonstrations of productsand services designed to improve pro-ductivity and competitiveness, to othercompanies, which may be potentialusers of technology. Each demonstra-tion centre also acts as a meeting pointfor regional innovation and the needs ofsmall and medium enterprises (SMEs)
in their respective demarcation, and fos-ters intersectoral collaboration andbusiness development.
The main objectives of theICT4Logistics Demonstration Centreare:• To promote the creation of meeting
spaces between suppliers in the ICTsector and the potential demand fromlogistics companies.
• To disseminate the benefits of incor-porating ICT into production process-es among companies in the logisticssector.
• To facilitate the transfer of technolo-gy, specialised services and knowl-
ICT for a Logistics demonstration Centre
by Miguel A. Barcelona, Aragón Institute of Technology
Information and Communication Technologies (ICT) have become a key element in improving
collaboration and decision-making in the field of transport and logistics. The Spanish ICT4Logistics
Demonstration Centre is a test-bed infrastructure where providers or potential customers may run
pilots and demonstrations.
ERCIM NEWS 105 April 2016 13
edge between the ICT sector andlogistics companies.
• To advise, train, develop and transfertechnology into companies, in partic-ular SMEs.
• To provide logistics companies withthe necessary infrastructure for test-ing the innovation technologies.
To this end the centre is composed offour elements:
• Smart warehouse: includes technolo-gies applied to reception, picking,shipping, storage and automatic char-acterisation for freight, as well as tocreate a test-bed infrastructure for anintelligent warehouse scenario.
• Smart store: composed of technolo-gies for the identification and collec-tion of products, for real-time infor-mation about the existing stock of
each product on the shelf and meth-ods to efficiently replace products.
• Smart transport: contains equipmentdesigned for the simulation of vehicletraffic allowing static and dynamicmapping.
• Smart supply chain: used to evaluatethe potential application of identifica-tion, monitoring and control systemsinto the management of flow prod-ucts in order to simulate and coordi-nate a better decision-makingprocess.
Since the official opening in April 2013,more than 1000 people and 350 enter-prises have attended more than 100events, workshops, training sessions,demonstrations and sectorial eventshosted in this centre. In particular, ithosted the 6th European Conference on
ICT for Transport Logistics in 2013 andpromotes the annual Spanish ICT4Logevent.
The centre is being used to promote thetransfer of knowledge into SMEs inpractice. As a success story, in theModel and Inference Driven -Automated testing of services architec-tures (MIDAS) EU Project [L4], theICT4Logistics Centre has been used todevelop a test-bed infrastructure toguarantee the successful integration ofservice-based supply chain manage-ment systems according to GS1Logistics Interoperability Model stan-dard [3].
In the future we will work to extend thistest-bed infrastructure by adding elec-tronics, sensors and robotics as anInternet of Things (IoT) laboratorywhere providers or purchasers may runpilots and practical demonstrations.
Links:
[L1] http://www.cdlogistica.es/en [L2] http://www.red.es [L3] http://www.ict4log.eu[L4] http://www.midas-project.eu
References:
[1] Chopra, S. & Meindl, P. Supplychain management: Strategy, planning& operation. Springer, 2007.[2] Jardim-Goncalves, R., Agostinho,C., Sarraipa, J., Grilo, A., &Mendonça, J. P. Reference frameworkfor enhanced interoperablecollaborative networks in industrialorganisations. International Journal ofComputer IntegratedManufacturing,2013.[3] GS1, GS1 LogisticsInteroperability Model v1.0,http://www.gs1.org/lim
Please contact:
Miguel Ángel BarcelonaITAINNOVA (Aragón Institute ofTechnology)C/ María de Luna 7, 50018, Zaragoza,[email protected]
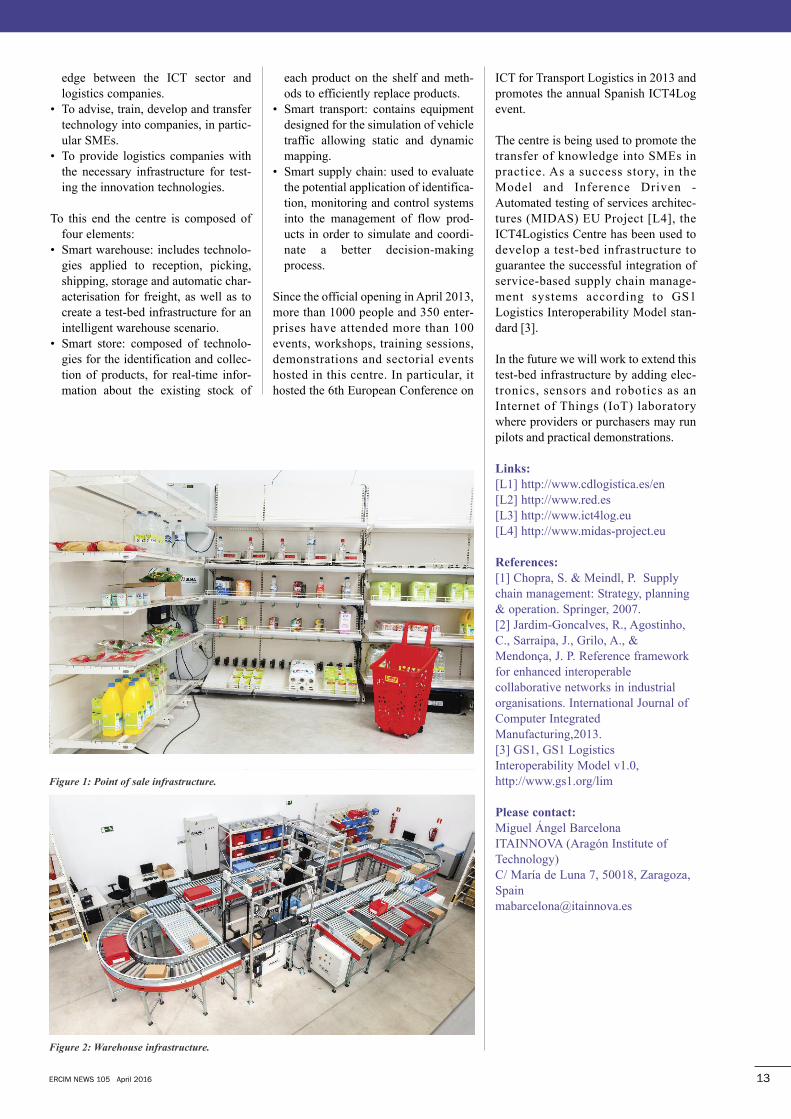
Figure�2:�Warehouse�infrastructure.
Figure�1:�Point�of�sale�infrastructure.
European manufacturing industry wouldbenefit by transforming the current hier-archical supply chains into networks,based on partnerships with a new under-standing of business approaches andservices provided to the partners (B2B)and to the final customers (B2C). To thisend, we investigated innovative deci-sion-making methods that integrate pro-duction planning at single plants into themanagement of the whole global net-work. The research is funded by theEuropean Union within theRobustPlaNet 7th Framework project,involving four academic and sevenindustrial partners from Hungary,Germany, Italy and The Netherlands.
Robustness aspects of productionplanningIn general, production planning methodsrely on deterministic input data, hencefail to cope with the dynamic effects ofthe execution environment and the con-siderable uncertainty of the underlyingplanning information. Robust tech-
niques that can provide feasible produc-tion plans are required to address thesechallenges. Robustness in productionplanning involves refined approachesthat can handle predictable or unpre-dictable changes and disturbances,respond to the occurrence of uncertainevents (reactive approaches) or protectthe performance of the plan by antici-pating uncertain events (proactiveapproaches) [1]. In our methodology,robust planning is the logical layer ofthe robust production. A productionplan is considered robust if it achievesan acceptable level of the selected per-formance indicators even when unpre-dictable disruptions occur during theexecution of the plan. The robustness ofthe system often works against otherefficiency criteria, hence a trade-off isrequired if the objective is to increasesystem’s robustness. In theRobustPlaNet project, robust planningmethods are defined both at the networkand plant levels of the production hier-archy (Figure 1).
Planning in supply networksThe main goal on the network level is toenable robust and system-wide efficientproduction in a dynamic, unpredictableand global environment. Performancecan be improved by implementing threecomplementary tasks. Firstly, the net-work design deals with configurationand re-configuration in order to providea structure that is robust against diverse,largely unpredictable supply chainrisks. Secondly, the supply chain plan-ning matches supply and demand byconsidering statistically predictablefluctuations and disturbances. Finally,the coordination mechanism harmo-nizes the decisions made in a distributedmanner, and supplements the risk man-agement toolkit with risk sharingschemes.
The proposed methodology for supplynetwork planning starts with identifyingand analyzing the main sources of dis-turbances. Possible ways of managingthese problems are then investigated,including estimated cost analysis.Owing to the complexity of a net-worked production system, the resultantalternative action plans are then evalu-ated in a multi-method simulation envi-ronment, enabling the combination ofmulti-agent, discrete event, and systemdynamic modelling aspects in a generalframework. This planning process willenable the network to respond to var-ious circumstances, supporting efficientoperations on the lower levels of theproduction hierarchy.
Robust production at the plant levelAt the plant level in the production hier-archy, planning methods are aimed atcalculating robust production plans thatrespect the possible uncertainties of areal production environment, main-taining the target level of key perform-ance indicators, although disturbancesoccur during the execution of the plan.The robustness of the plans is provided
ERCIM NEWS 105 April 201614
Special Theme: Logistics and Planning
Production Planning on Supply Network
and Plant Levels: The RobustPlaNet Approach
by Péter Egri, Dávid Gyulai, Botond Kádár and László Monostori, SZTAKI
In today’s competitive manufacturing industry, efficient production planning is of crucial importance
to match the supply with the customer order stream. The RobustPlaNet approach aims to support
the decision makers at different hierarchical levels of production enterprises to react or even to
proactively plan and manage their activities in a more robust way than it used to be in the
traditional practice.
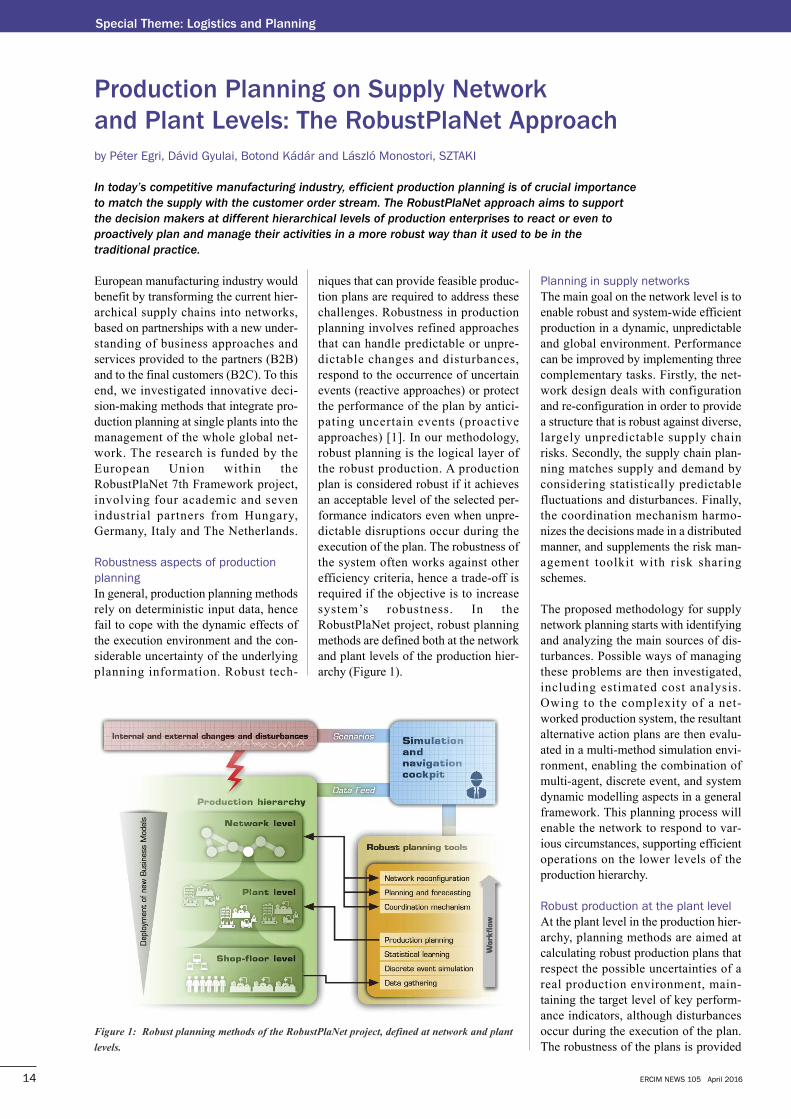
Figure�1:��Robust�planning�methods�of�the�RobustPlaNet�project,�defined�at�network�and�plant
levels.
by proactive, simulation-optimizationapproaches that mostly rely on near realtime algorithms processing actual his-torical production data that is used indiscrete-event simulation models toanalyze possible future production sce-narios. By applying statistical learningmethods on the dataset provided by thesimulation experiments, the outcome offuture scenarios can be predicted ana-lytically, even considering the sto-chastic parameters and random eventsthat were represented in the simulationmodel. The prediction models are inte-grated into the mathematical optimiza-tion models that are responsible for cal-culating the robust production plans [2].
IT platform to support the planningactivitiesThese novel planning tools and modelsare all integrated in a common softwareplatform called Simulation andNavigation Cockpit. Each of the func-
tional modules can be triggered inde-pendently directly from this platformwhich employs the modules as black-boxes in the background and offers anintuitive web-based GUI on role-basis.Additionally, the integrated platformallows the user to define custom,problem-specific workflow mecha-nisms where the modules are chainedsequentially, each operating on the samedatabase. Depending on the organiza-tional requirements of a productioncompany, different roles can be grantedwith different data access levels withinthe integrated platform, ensuring thatusers can only access data that they arepermitted to.
This research is supported the by theEuropean Union 7th FrameworkProgramme Project No: NMP2013-609087, Shock-robust Design of Plantsand their Supply Chain Networks(RobustPlaNet).
Links:
www.robustplanet.euhttps://www.linkedin.com/groups/8137114
References:
[1] T. Tolio, M. Urgo, J. Váncza:“Robust production control againstpropagation of disruptions” CIRPAnnals-Manufacturing Technology,vol. 60, no. 1, 2011.[2] D. Gyulai, B. Kádár and L.Monostori: “Robust productionplanning and capacity control forflexible assembly lines” IFAC-PapersOnLine, vol. 48, no. 3, 2015.
Please contact:
Botond KádárFraunhofer PMI, SZTAKI, HungarianAcademy of Sciences, HungaryTel: + 36 1 279 [email protected]
ERCIM NEWS 105 April 2016 15
Business process management usuallyrelies on a Business Process Model(BPM), specified using one of the avail-able Business Process ModellingNotations (BPMN). Working with theLivorno Port Authority, we successfullyadopted BPM data analysis to find com-monalities and discrepancies betweenthe mandatory guidelines for controllingthe arrival and departure of goods andthe current implementation of the ship-ping systems known as the Tuscan PortCommunity System (TPCS) [3].
TPCS is a web-services based platformwith multilevel access control and datarecovery facilities, which aims to sup-port and strengthen the management ofshipping lanes according to Italian regu-lations. TPCS processes a huge amountof information, enabling a reduction in
costs and the streamlining of adminis-trative procedures. It can be used for thecomplete management of all connectedapplications handling cargo movementsand import/export operations, andinvolving all the actors interested in theinformation flow, such as shippingagencies, custom forwarders, freightforwarders, terminals, hauliers, and alsothe Control Authorities.
The users can generate and manageCargo Manifests during export, andUnloading Lists during import opera-tions. In both operations, users caninteract with the platform in order toknow the status of goods (e.g. loaded orunloaded, cleared for customs etc.).They can also request and receive goodscertificates and authorizations (e.g.phytosanitary authorization) for dan-
gerous goods via the SUD (SportelloUnico Doganale - Customs SingleWindow) interface.
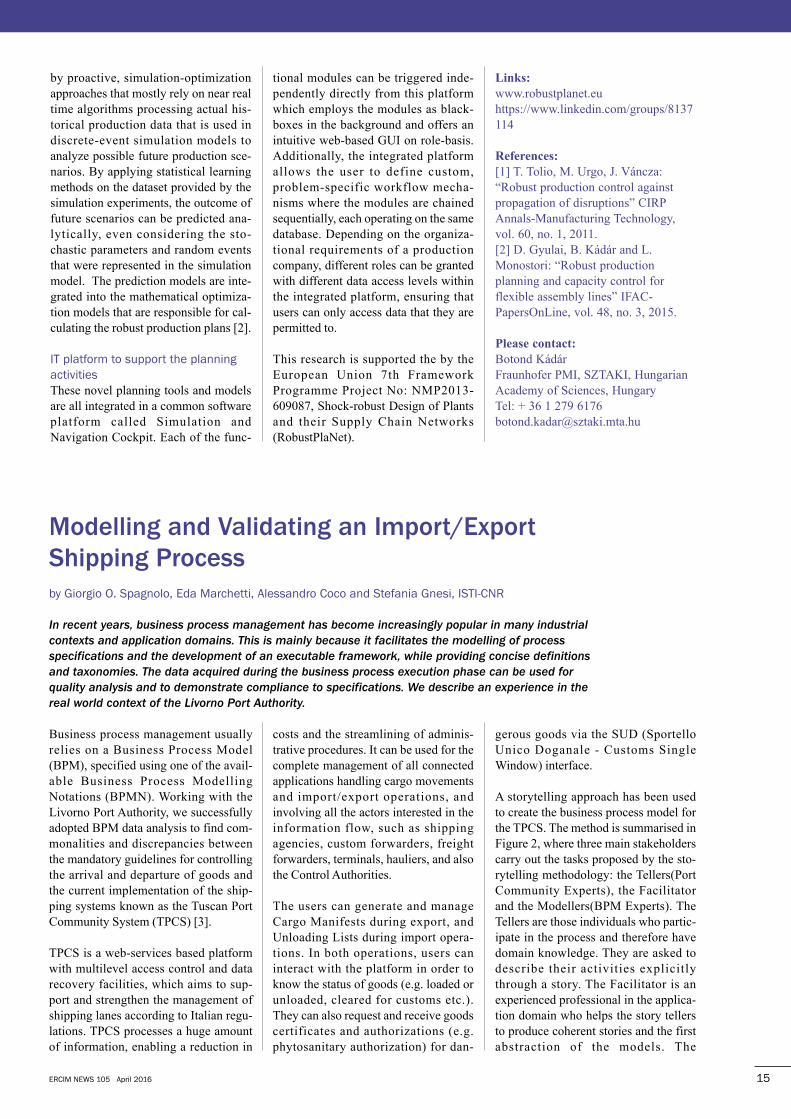
A storytelling approach has been usedto create the business process model forthe TPCS. The method is summarised inFigure 2, where three main stakeholderscarry out the tasks proposed by the sto-rytelling methodology: the Tellers(PortCommunity Experts), the Facilitatorand the Modellers(BPM Experts). TheTellers are those individuals who partic-ipate in the process and therefore havedomain knowledge. They are asked todescribe their activities explicitlythrough a story. The Facilitator is anexperienced professional in the applica-tion domain who helps the story tellersto produce coherent stories and the firstabstraction of the models. The
Modelling and Validating an Import/Export
Shipping Process
by Giorgio O. Spagnolo, Eda Marchetti, Alessandro Coco and Stefania Gnesi, ISTI-CNR
In recent years, business process management has become increasingly popular in many industrial
contexts and application domains. This is mainly because it facilitates the modelling of process
specifications and the development of an executable framework, while providing concise definitions
and taxonomies. The data acquired during the business process execution phase can be used for
quality analysis and to demonstrate compliance to specifications. We describe an experience in the
real world context of the Livorno Port Authority.
Modellers are process analysts whorefine the graphical model developedbased on abstractions extracted from thestories.
An event logger has been integrated intothe TPCS code system in order to mon-itor the information exchange within theplatform and between the different web-services, and to collect data to assessconformance to the BPM specification.
Conformance checking techniques havebeen used to relate events in the eventlog to activities in the process modeland compare them [1-2]. The experi-ence highlights important challenges inthe application of process mining tech-niques and enables inconsistenciesdetected during the process execution tobe promptly corrected. The miningactivity has been confirmed to be auseful means for quality assurance and
the checking of software in operation.However, this experiment has alsoshown that the identification of theBPM elements can be a key factor forthe final results. The identification ofthe rules, the policies, the roles, and theresponsibilities, as well as the interac-tions between users and the platformrepresent the main criticalities whenderiving an accurate business processesmodel and when correctly managing it.
Once the business process of the TPCSplatform was derived using the storytelling techniques, the platform wasthen equipped with the activity processlog. Next, using process mining tech-niques on the log of the platform withthe process model derived, we per-formed conformance analysis. Theresults obtained were used to investi-gate the behaviour of the platform andvalidate the process model.
This work is a contribution to the indus-trial application of formal techniquesfor the monitoring of businessprocesses.
References:
[1] W. van der Aalst, et al.: “Replayinghistory on process models for confor-mance checking and performanceanalysis”, Wiley Int. Rev. Data Min.and Knowl. Disc., March 2012.[2] R. M. Dijkman, et al.: “Semanticsand analysis of business process mod-els in BPMN”, Inf. Softw. Technol.,November 2008.[3] G. O. Spagnolo, et al.: “An experi-ence on applying process mining tech-niques to the Tuscan Port CommunitySystem”, LNBI Proc., 238, 2016.
Please contact:
Giorgio O. Spagnolo, ISTI-CNR, [email protected]
ERCIM NEWS 105 April 201616
Special Theme: Logistics and Planning
Figure�1:�The�actors�involved�in�the�TPCS�and�their�interaction. Figure�2:�Methodology�applied�to�create�the�model.
One of the goals in cash supply chainsis to manage the inventory of ATMs.GSN, a cooperation of banks, managesthe inventory of the majority of ATMsin the Netherlands. To this end, they
generate money pickup and deliveryorders which they outsource to Cashin Transit (CIT) companies to deliverthe money to and from the ATMs.Since trucks carrying money are
attractive to robbers, an importantgoal in planning the delivery routes(besides being eff icient to lowertransport costs), is to make the routesunpredictable.
Where is the Money? - optimizing Cash Supply
Chain Networks
by Leendert Kok and Joaquim Gromicho, ORTEC
“German CIT truck robbed with Bazooka” 12-12-2015, “Attack on CIT in Amsterdam” 4-06-2015,
“Failed robbery on the Italian highways” 15-05-2015. These are three examples of the motivation
of one part of a joint research project of ORTEC, Geldservice Nederland (GSN), and the Vrije
Universiteit (VU) Amsterdam called ‘Optimizing cash supply chain networks’.
ERCIM NEWS 105 April 2016 17
In 2015, three PhD students at the VUstarted working on this problem. Theproblem can be seen as a special case ofthe inventory routing problem, see [1],where the goal is to manage the inven-tory of fuel for a set of customers, forexample, by making sure that they donot run out of stock. The long term goalis to minimize transport costs. Theproblem is a generalization of the well-known vehicle routing problem (VRP),by adding two extra decisions to theproblem: when to deliver and howmuch.
Within the cash replenishment business,an extra requirement appears for thesedelivery routes: they should be unpre-dictable. In a sense, the problem is theopposite of the consistent VRP [2],where the goal is to deliver to the samecustomer at the same time of the dayand the same day of the week. There aredifferent measures for the unpre-dictability of vehicle routes: the time ofreplenishment, the sequence of replen-ishments, and the routes driven betweentwo replenishments (K-shortest paths).
The PhD students developed a modelfor varying the time of delivery by gen-erating multiple non-overlapping timewindows with the last delivery for eachspecific ATM. The VRP with multipletime windows has received little atten-tion in the literature. A special model-ling characteristic in cash supply is thatwaiting time at customers (ATMs in thiscase) is not allowed. Especially whentime windows are tight, this extra con-straint has a major impact on solutionmethods for this vehicle routingproblem.
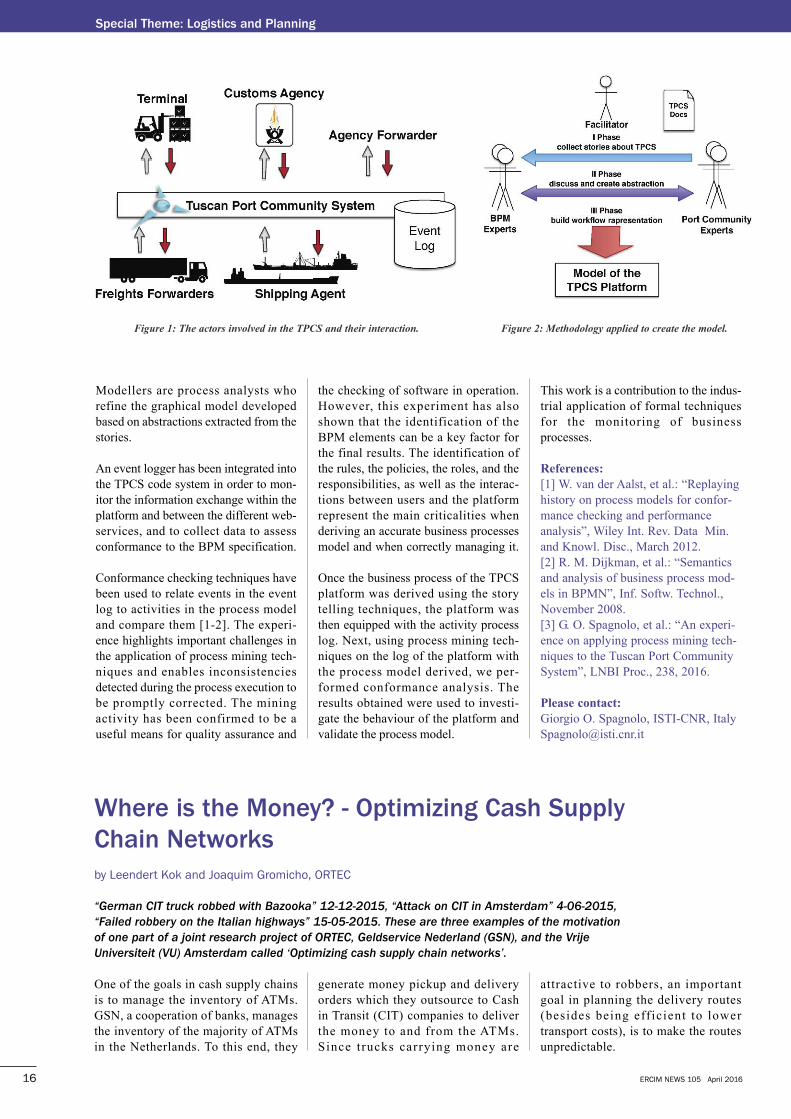
As mentioned above, a key decisionwithin inventory routing is the momentof delivery and the amount to deliver.To minimize the long run transportcosts, an objective was introduced by[3] which minimizes transport costs bydelivered volume. Figure 1 illustrateshow a larger transport cost still leads toa better plan with respect to the longterm transport costs.
ORTEC, one of the world’s largest sup-pliers of advanced planning software,has extensive experience in solvingInventory Routing Problems and, withthe involvement of many master’s stu-dents, is continuously updating its inno-vative solutions. One of the currentmaster’s students is looking at ways toimprove the inventory routing solutionsby making a clever preselection inwhich customers are selected fordelivery. The student developed amechanism that decides which so-called may-go orders (orders that maybe postponed until the next day) shouldbe included in the batch for the planningday. The results are very promising andindicate that with minimal computa-tional effort, the long term transporta-tion costs can be reduced by more than5%.
The final part of the research projectfocuses on contract design. Currently,GSN decides on the orders, and thirdparties are responsible for delivering themoney. This leads to suboptimal solu-tions (the preferred amount to delivermay depend on the driven vehicleroutes). Moreover, service level agree-ments are done between GSN and thebanks, but the logistics companies are
crucial for fulfilling them. This researchaims to develop incentives to better dealwith all these challenges.
References:
[1] L. Bertazzi, S. Bertazzi, M. Grazia:“Inventory routing problems: anintroduction”, EURO Journal onTransportation and Logistics, Vol. 1,No. 4, pp. 307-326; 2012[2] C. Groër, B. Golden, E. Wasil:“The Consistent Vehicle RoutingProblem”, Manufacturing & ServiceOperations Management, Vol. 11, No.4, pp. 630–643, 2009.[3] W. J. Bell, et al.: “Improving thedistribution of industrial gases with anonline computerized routing andscheduling optimizer”, Interfaces, 13,pp. 4–23, 1983.
Please contact:
Leendert KokORTEC, The [email protected]
Figure�1:�Example�of�improving�the�long�term�transport�costs�per�delivered�volume�([3]).
In early 2013 the health authorities ofRegion Östergötland in Sweden wereinvestigating why the time between thefirst doctor’s appointment and the startof treatment was longer than the goal of28 days for breast cancer patients at thehospital in Linköping. To help answertheir question, researchers from SICSSwedish ICT were tasked with pro-posing and testing operational researchmethods that could elucidate how thedifferent process steps contributed to theoverall lead time. The methods proposedshould also allow for different processchanges to be investigated.
The pilot study began with an investiga-tion step where the researchers learnedabout all parts of the care process. Thisincluded interviews with doctors andadministrative staff, and also analysis ofdata that the department had gatheredover the years. The initial analysisresulted in some important insightsabout the process, e.g. that the patientinflow varied depending on the time ofthe year, and that the process had anumber of discrete steps that negativelyaffect the lead time. In fact, based on theinitial analysis it could be proven thatthe goal lead time of 28 days or less wasimpossible to live up to for manypatients, given the current process andmethods. Patients arriving on certainweek-days were out of sync with the dis-crete process-steps, which resulted inlong lead-times.
The discrete steps are often a conse-quence of doctors having certain daysallocated to certain tasks, or operatingrooms only being available on certaindays. This is because operating roomsare shared among departments, and set-up times prevent doctors from per-forming all tasks every day. For example,the doctors do not have time to hold mul-tidisciplinary conferences every day. Thefocus on high resource efficiency nega-tively affected the patient flow.
Based on the understanding acquired inthe investigation step we constructed a
discrete event simulation. The arrivalprocess was modelled as an inhomoge-neous Poisson process based on the his-toric data, and the basic rules of the sim-ulation model were reviewed by theinterviewed staff. The purpose of thesimulation was to investigate whetherthere was potential for shorter leadtimes, and if so, where to invest inresources. First of all the lead timesfrom the simulated standard process and
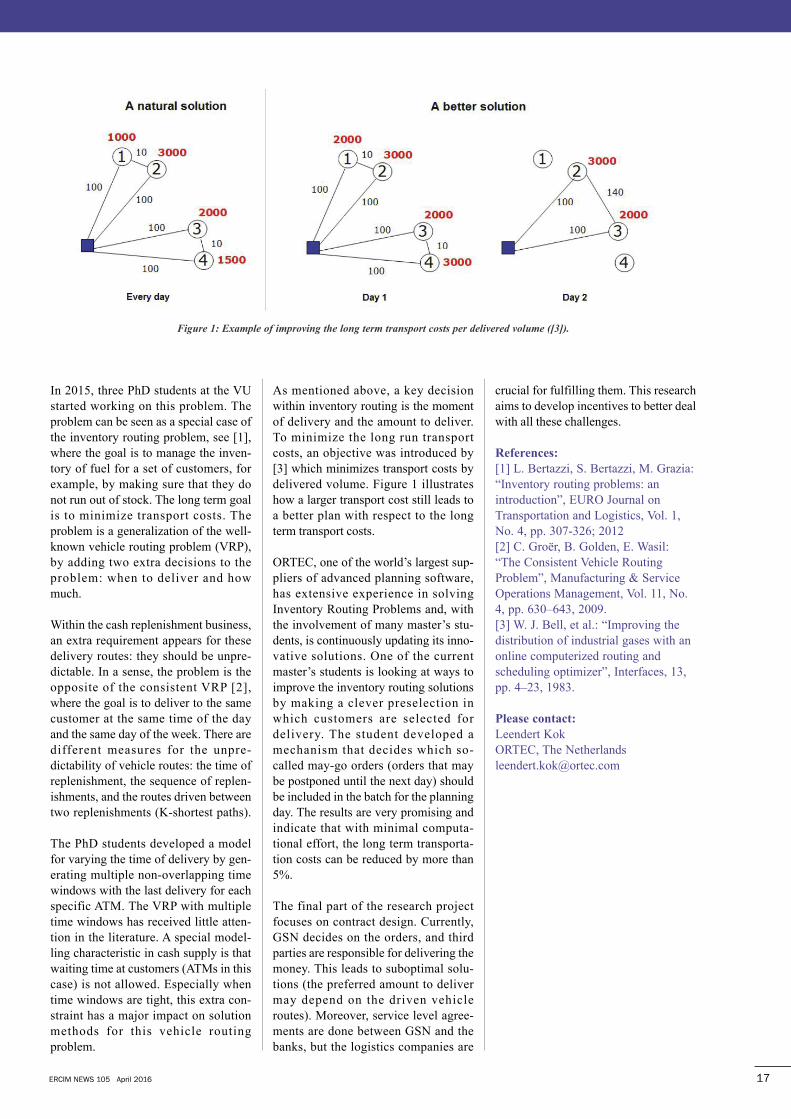
the historic data were compared, and thediscrepancies were discussed with thehospital staff. Then different proposedprocess changes were tested in the sim-ulation to provide insights that wereotherwise difficult to gain. For instance,the simulation could detect whenincreasing resources in a particularprocess step did not result in time gainsbecause the patient still had to wait forother parts of the process. The simula-tion model was also used to estimatehow congested the different processsteps were. Being able to explore theprocess, and predict and quantify inadvance how changes affect the leadtime and the load curve, stimulatedgreat interest among the hospital staff.
In addition, the hospital identified a fewdepartments with resources that werelikely to benefit from optimizing plan-ning support systems. Operating rooms,as well as other shared resources such aspathology analysis competence, areinteresting subjects for optimization andplanning as they deal with demands frommany patient streams and categories.
Shorter lead times are closely linked tothe question of good planning. Ofcourse you always have to be particu-larly considerate when working withpeople. Perhaps the patient needs a fewextra days, for instance, to take in thenews that she has cancer before she isready to go into surgery. Nevertheless,SICS believes that a more industrialapproach to the planning process wouldbenefit everybody involved. Apart from
using simulation there are other opera-tional research techniques that are aptfor healthcare systems, such as opti-mization of schedules [1].
The SICS researchers involved with theproject consider healthcare a perfectcandidate for their planning methods.They think better decision support toolswould enable a care that is moreadapted and coordinated, both for thepatient and for the health professionals.
Link:
http://www.sics.se/projects/flecs-flow-efficiency-in-cancer-treatment
Reference:
[1] M. Persson: “On the Improvementof Healthcare Management UsingSimulation and Optimisation”Blekinge Institute of Technology,Karlskrona, doctoral thesis, 2010.
Please contact:
Sara Gestrelius, Martin AronssonSICS Swedish [email protected], [email protected]
ERCIM NEWS 105 April 201618
Special Theme: Logistics and Planning
An Industrial Take on Breast Cancer Treatment
by Sara Gestrelius and Martin Aronsson, SICS Swedish ICT
When a woman is diagnosed with breast cancer she is drawn into a network of examinations, tests
and treatments with interdependencies in several steps. Because the prognosis for recovery is tied
to how quickly she gets help, it is important to reduce the time from the first doctor’s appointment
to the start of treatment.
Figure�1:�Example�of�a�simulation�of�a�care�process.�The�small�circles�are�patients,�and�the
colour�represents�time�since�their�first�doctor’s�appointment.�The�large�circles�are�process-steps
that�are�open�(green),�open�but�working�at�full�capacity�(yellow)�or�closed�(red).
ERCIM NEWS 105 April 2016 19
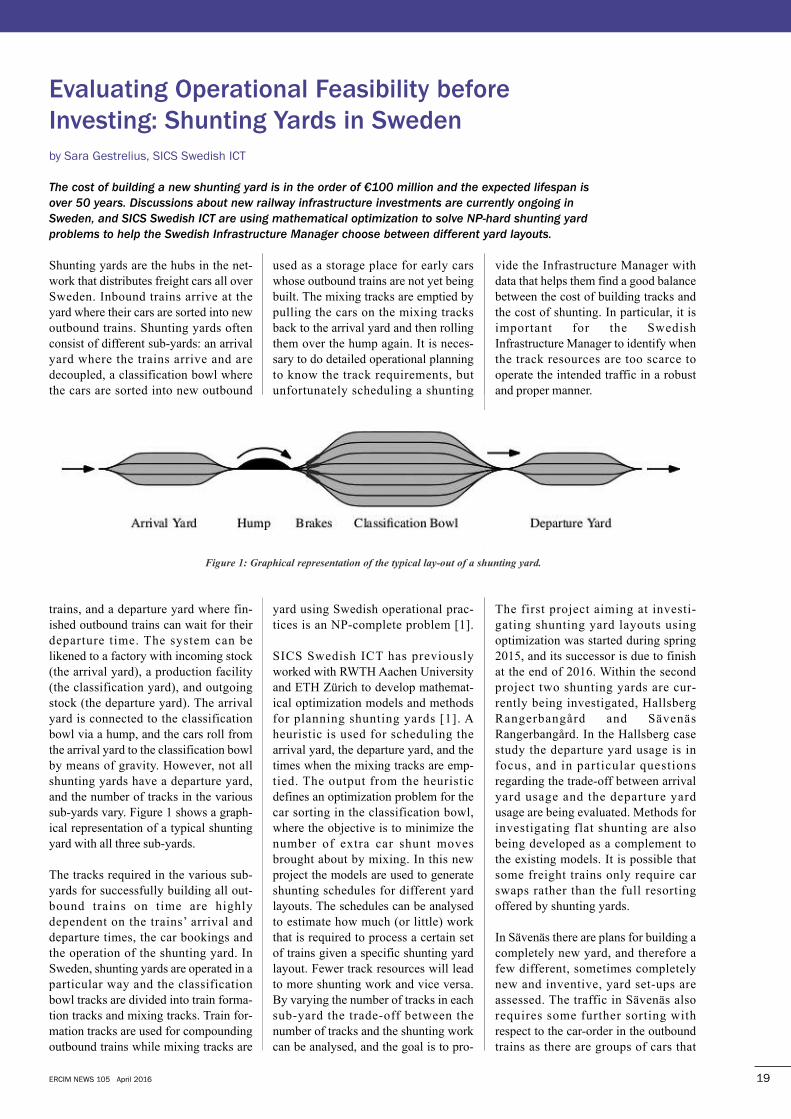
Shunting yards are the hubs in the net-work that distributes freight cars all overSweden. Inbound trains arrive at theyard where their cars are sorted into newoutbound trains. Shunting yards oftenconsist of different sub-yards: an arrivalyard where the trains arrive and aredecoupled, a classification bowl wherethe cars are sorted into new outbound
trains, and a departure yard where fin-ished outbound trains can wait for theirdeparture time. The system can belikened to a factory with incoming stock(the arrival yard), a production facility(the classification yard), and outgoingstock (the departure yard). The arrivalyard is connected to the classificationbowl via a hump, and the cars roll fromthe arrival yard to the classification bowlby means of gravity. However, not allshunting yards have a departure yard,and the number of tracks in the varioussub-yards vary. Figure 1 shows a graph-ical representation of a typical shuntingyard with all three sub-yards.
The tracks required in the various sub-yards for successfully building all out-bound trains on time are highlydependent on the trains’ arrival anddeparture times, the car bookings andthe operation of the shunting yard. InSweden, shunting yards are operated in aparticular way and the classificationbowl tracks are divided into train forma-tion tracks and mixing tracks. Train for-mation tracks are used for compoundingoutbound trains while mixing tracks are
used as a storage place for early carswhose outbound trains are not yet beingbuilt. The mixing tracks are emptied bypulling the cars on the mixing tracksback to the arrival yard and then rollingthem over the hump again. It is neces-sary to do detailed operational planningto know the track requirements, butunfortunately scheduling a shunting
yard using Swedish operational prac-tices is an NP-complete problem [1].
SICS Swedish ICT has previouslyworked with RWTH Aachen Universityand ETH Zürich to develop mathemat-ical optimization models and methodsfor planning shunting yards [1]. Aheuristic is used for scheduling thearrival yard, the departure yard, and thetimes when the mixing tracks are emp-tied. The output from the heuristicdefines an optimization problem for thecar sorting in the classification bowl,where the objective is to minimize thenumber of extra car shunt movesbrought about by mixing. In this newproject the models are used to generateshunting schedules for different yardlayouts. The schedules can be analysedto estimate how much (or little) workthat is required to process a certain setof trains given a specific shunting yardlayout. Fewer track resources will leadto more shunting work and vice versa.By varying the number of tracks in eachsub-yard the trade-off between thenumber of tracks and the shunting workcan be analysed, and the goal is to pro-
vide the Infrastructure Manager withdata that helps them find a good balancebetween the cost of building tracks andthe cost of shunting. In particular, it isimportant for the SwedishInfrastructure Manager to identify whenthe track resources are too scarce tooperate the intended traffic in a robustand proper manner.
The first project aiming at investi-gating shunting yard layouts usingoptimization was started during spring2015, and its successor is due to finishat the end of 2016. Within the secondproject two shunting yards are cur-rently being investigated, HallsbergRangerbangård and SävenäsRangerbangård. In the Hallsberg casestudy the departure yard usage is infocus, and in particular questionsregarding the trade-off between arrivalyard usage and the departure yardusage are being evaluated. Methods forinvestigating flat shunting are alsobeing developed as a complement tothe existing models. It is possible thatsome freight trains only require carswaps rather than the full resortingoffered by shunting yards.
In Sävenäs there are plans for building acompletely new yard, and therefore afew different, sometimes completelynew and inventive, yard set-ups areassessed. The traffic in Sävenäs alsorequires some further sorting withrespect to the car-order in the outboundtrains as there are groups of cars that
Evaluating operational feasibility before
Investing: Shunting yards in Sweden
by Sara Gestrelius, SICS Swedish ICT
The cost of building a new shunting yard is in the order of €100 million and the expected lifespan is
over 50 years. Discussions about new railway infrastructure investments are currently ongoing in
Sweden, and SICS Swedish ICT are using mathematical optimization to solve NP-hard shunting yard
problems to help the Swedish Infrastructure Manager choose between different yard layouts.
Figure�1:�Graphical�representation�of�the�typical�lay-out�of�a�shunting�yard.
should be dropped off along the train’sjourney. Methods for this extra sortingare being developed.
Another pertinent question regardingfreight trains is the routing of cars andmodels for optimizing the routing arecurrently being developed.Experimenting with different routingscan be useful for improving the overallefficiency of the shunting system, andalso for investigating the effect ofclosing one shunting yard partially orcompletely. The latter is relevant whendiscussing re-investment in shuntingyards as it may require existing
shunting yards to be closed down,which makes the economic cost of thedisturbed traffic an important factorwhen deciding between different invest-ment alternatives.
As stated above, heuristics are part ofthe current schedule generation. As partof future work the project will thereforealso look into the possibility of con-structing an optimization model that canhandle all three sub-yards.
Link:
https://www.sics.se/projects/pragge
Reference:
[1] M. Bohlin, S. Gestrelius, F. Dahms,M. Mihalák and H. Flier,“Optimization Methods for MultistageFreight Train Formation”,Transportation Science, Articles inAdvance, 2015.
Please contact:
Martin Aronsson, Zohreh Ranjbar,Martin Joborn, Sara Gestrelius,Markus Bohlin, SICS Swedish [email protected], [email protected],[email protected], [email protected], [email protected]
ERCIM NEWS 105 April 201620
Special Theme: Logistics and Planning
The Dutch capital Amsterdam was thefirst city in the Netherlands with a pro-fessional fire service, which was estab-lished in 1874. With 144 personnel andnine fire stations covering 30 squarekilometres, it ensured fire protection forapproximately 285,000 inhabitants.Today, it is the regionally organized firedepartment Amsterdam-Amstellandthat, with 1,150 personnel and 19 firestations covering 354 square kilometres,is responsible for over 1,000,000 inhabi-tants. Obviously, over time the questionsof how many fire stations were neededfor a given coverage and where to locatethem had to be answered numeroustimes as new needs and means for fireprotection emerged.
In this study, we introduce a model to (1)determine optimal locations for the firestations, and (2) to find an optimal distri-bution of the vehicles over the selectedlocations.
We divide the region into a set ofdemand points from which calls canarise, and define a subset of locations
that can be used as a potential base loca-tion. We consider different types ofvehicles that are used for a differenttype of call. Each type can have dif-ferent response time targets. We limitthe number of vehicles that we may useof each type. For each demand pointand for each vehicle type, we have aweight that indicates the importance ofcovering a certain demand point by avehicle of a specific type. The expectednumber of calls is commonly used forthe weights, but other risk measurescould be included as well. To determinethe coverage, we introduce a subset ofthe base locations that contains all loca-tions that are sufficiently close to coverour demand point by the specificvehicle. Whether a base location isclose enough depends on three vari-ables: the travel time from the base to alocation, the pre-trip delay, and theresponse time target. We assume thatthe travel times are the same for eachvehicle type and that the pre-trip delay,which is the time elapsed before thevehicle starts driving to the scene, isfixed. This pre-trip delay also consists
of two parts: (1) triage and dispatch, and(2) chute time. The triage and dispatchtime is the time spent in the call centreto assess the importance of the call andassign a vehicle. The chute time is theamount of time that elapses between theassignment of a call and the crew’sdeparture from the base. The responsetime target can differ for each vehicletype and for each demand point. For ourmodel, the goal is to maximize thenumber of calls that are covered by theappropriate vehicle type, while mini-mizing the number of base locationsused [3].
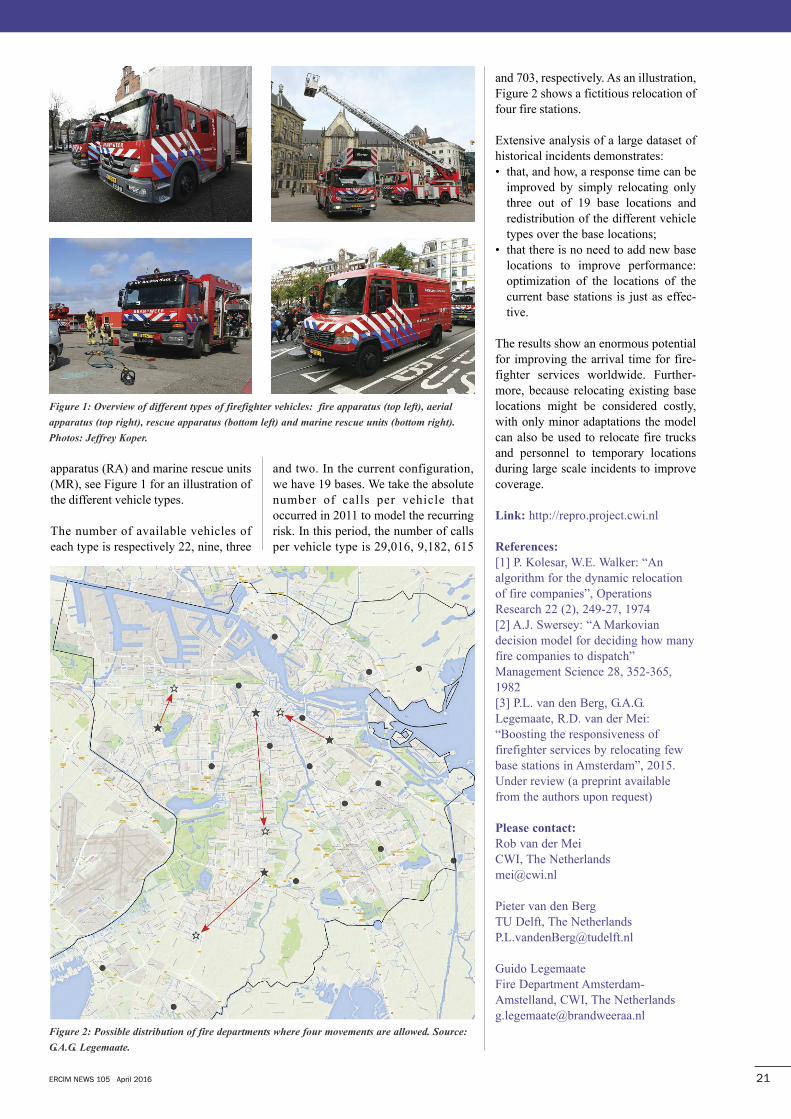
To apply the model to the region ofAmsterdam, we defined a set of 2,643demand points and 2,223 potential baselocations. Travel times between poten-tial base locations and demand pointsare provided by the fire department andare based on estimated travel times onthe road network between each loca-tion. In our analysis, we include the fourmost common types of vehicles used atDutch fire departments: fire apparatus(FA), aerial apparatus (AA), rescue
Boosting the Responsiveness of firefighter
Services with Mathematical Programming
by Pieter van den Berg, TU Delft, Guido Legemaate, Amsterdam Fire Department, and Rob van der Mei, CWI
In life-threatening situations where every second counts, the timely arrival of firefighter services can
make the difference between survival and death. Motivated by this, the Stochastics Department at CWI
in collaboration with the TU Delft and the Fire Department Amsterdam-Amstelland in the Netherlands
have developed a mathematical programming model for determining the optimal locations of the vehicle
base stations, and for optimally distributing the different firefighter vehicle types over the base stations.
Extensive analysis of a large data set for the Amsterdam area demonstrates that, and how, response
time can be improved by relocating only few base locations and redistributing different vehicle types over
the base locations.
ERCIM NEWS 105 April 2016 21
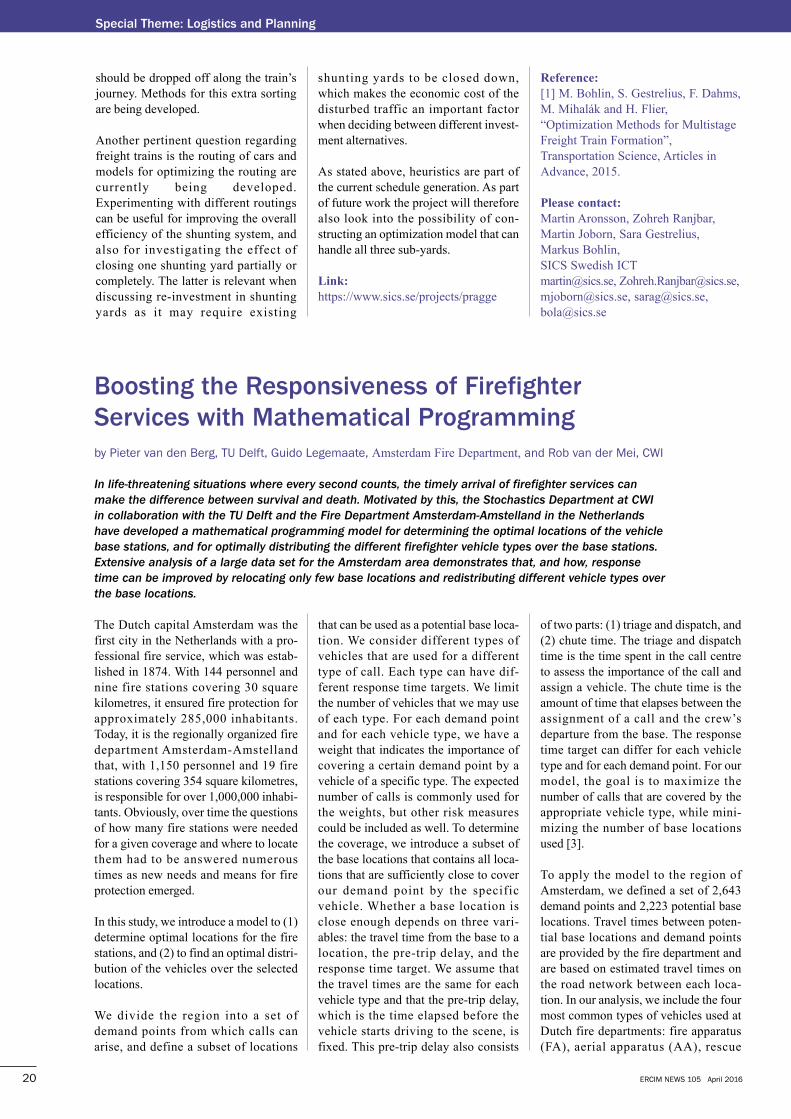
apparatus (RA) and marine rescue units(MR), see Figure 1 for an illustration ofthe different vehicle types.
The number of available vehicles ofeach type is respectively 22, nine, three
and two. In the current configuration,we have 19 bases. We take the absolutenumber of calls per vehicle thatoccurred in 2011 to model the recurringrisk. In this period, the number of callsper vehicle type is 29,016, 9,182, 615
and 703, respectively. As an illustration,Figure 2 shows a fictitious relocation offour fire stations.
Extensive analysis of a large dataset ofhistorical incidents demonstrates: • that, and how, a response time can be
improved by simply relocating onlythree out of 19 base locations andredistribution of the different vehicletypes over the base locations;
• that there is no need to add new baselocations to improve performance:optimization of the locations of thecurrent base stations is just as effec-tive.
The results show an enormous potentialfor improving the arrival time for fire-fighter services worldwide. Further-more, because relocating existing baselocations might be considered costly,with only minor adaptations the modelcan also be used to relocate fire trucksand personnel to temporary locationsduring large scale incidents to improvecoverage.
Link: http://repro.project.cwi.nl
References:
[1] P. Kolesar, W.E. Walker: “Analgorithm for the dynamic relocationof fire companies”, OperationsResearch 22 (2), 249-27, 1974[2] A.J. Swersey: “A Markoviandecision model for deciding how manyfire companies to dispatch”Management Science 28, 352-365,1982[3] P.L. van den Berg, G.A.G.Legemaate, R.D. van der Mei:“Boosting the responsiveness offirefighter services by relocating fewbase stations in Amsterdam”, 2015.Under review (a preprint availablefrom the authors upon request)
Please contact:
Rob van der Mei CWI, The [email protected]
Pieter van den BergTU Delft, The [email protected]
Guido LegemaateFire Department Amsterdam-Amstelland, CWI, The [email protected]
Figure�1:�Overview�of�different�types�of�firefighter�vehicles:��fire�apparatus�(top�left),�aerial
apparatus�(top�right),�rescue�apparatus�(bottom�left)�and�marine�rescue�units�(bottom�right).
Photos:�Jeffrey�Koper.
Figure�2:�Possible�distribution�of�fire�departments�where�four�movements�are�allowed.�Source:
G.A.G.�Legemaate.�
ERCIM NEWS 105 April 201622
Special Theme: Logistics and Planning
Predicting the demand for Charging Stations
for Electric Vehicles
by Merel Steenbrink, Elenna Dugundji and Rob van der Mei, CWI
At the Stochastics research group at CWI we use socio-economic features of neighbourhoods to
predict the demand for charging stations for electric vehicles. Based on a large set of behavioural
data, a discrete choice model is estimated, and the utility of charging stations in every
neighbourhood is calculated. In this way the demand can be predicted and the municipality of
Amsterdam can proceed proactively.
The municipality of Amsterdam wouldlike to stimulate the use of electric vehi-cles in the city. To this end, a substantialnumber of charging stations [L1] havebeen constructed in the city. Over 1,000stations are already in operation, but thecity wants to further increase thisnumber to 4,000 by 2018 [L2, L3, L4].The policy is quite encouraging: if youbuy an electric vehicle, and there’s nocharging station within a 200 metreradius of your residence, you can applyfor one in front of your door. However,the process of investigating suitableplaces is a time-consuming task. If itwere possible to predict where thedemand for charging stations will be, thescaling-up process could take placemore effectively.
In this research a Discrete Choice Modelwas estimated to predict the demand forcharging stations. Every chargingactivity can be seen as a choice for a cer-tain station over other stations. In thisway the utility of every station can bedetermined as a function of characteris-tics of the stations. When this function isestimated, the utility of future stationscan be determined, based on their char-acteristics. In this way the municipalitycan focus on potential neighbourhoods,where the utility is high, and alreadyinvestigate the appropriateness of theselocations even before any requests havebeen made.
To estimate the model, behavioural datafrom 2012, 2013 and 2014 were used.The data describe the charging activityat every station, which reveals howoften, how much and how long a pollhas been used. To be able to use differentcharacteristics, and to decrease the sizeof the choice set, the choices have beenaggregated to the area of neighbour-hoods. Every choice for a charging sta-tion is a choice for a neighbourhood.Socio-economic data from the CentralBureau for Statistics (CBS) have been
incorporated into the model. The modeltakes into account: average number ofcars per household, percentage“Western” inhabitants (persons withnationality from Europe, NorthAmerica, Indonesia or Japan), the per-centage of apartments. Furthermore itconsiders the mean percentage of timeper day that the stations in each neigh-bourhood were used. Because the datawere aggregated there was a compen-sating term with the number of stationsper neighbourhood.
We estimated a Discrete Choice Modelwhich calculates the probability of anelectric car driver choosing a chargingstation in a certain neighbourhood[1],[2],[3]. We calculated this proba-bility for every neighbourhood and inthis way obtained a ranked list of neigh-bourhoods with high and low probabili-ties. We thereby are able to advise themunicipality in which neighbourhoodsto focus their expansion activities.
Until now we have incorporated into ourmodel socio-economic characteristicsfor which data were readily availablefrom the CBS. Further work couplingwith other sources of data is likely toidentify other relevant variables - forinstance, proximity to malls or largeoffice buildings may turn out to beimportant. These factors will be added tothe model as we develop it. The modelalso does not currently differentiatebetween day and night time chargingsessions. This consideration couldreveal additional variation in the usagepatterns of the charging stations in eachneighbourhood.
Some neighbourhoods with low popula-tion density have no aggregate socio-economic statistics reported by CBS toprotect the privacy of these residents.These neighborhoods have been cur-rently excluded from this investigationdue to lack of descriptive data. However,
many of these neighbourhoods – largelyindustrial areas or sporting facilities –may require charging stations.Additional data on land use and the builtenvironment may allow us to includethese neighbourhoods.
Finally, when we have ascertainedwhich neighbourhoods need chargingstations, the next step is to determine theexact locations of these charging sta-tions in each neighbourhood.
Links:
[L1] https://chargemap.com/city/amsterdam[L2] http://kwz.me/U3[L3] http://kwz.me/U5[L3] http://kwz.me/U6
Refernces:
[1] F. Goetzke, R. Gerike, A. Páez,E.R. Dugundji: “Social Interactions inTransportation: Analyzing Groups andSpatial Networks”, Transportation, 42(5), 2015, 723-731.http://dx.doi.org/10.1007/s11116-015-9643-9 [2] M. Maness, C. Cirillo and E.R.Dugundji: “Generalized BehavioralFramework for Choice Models ofSocial Influence: Behavioral and DataConcerns in Travel Behavior”, Journalof Transport Geography, 46, 2015,137–150.http://dx.doi.org/10.1016/j.jtrangeo.2015.06.005[3] E.R. Dugundji, J.L. Walker:“Discrete Choice with Social andSpatial Network Interdependencies: AnEmpirical example using MixedGeneralized Extreme Value Modelswith Field and Panel Effects”,Transportation Research Record, No.1921, 2005, 70-78.http://dx.doi.org/10.3141/1921-09
Please contact:
Elenna DugundjiCWI, The [email protected]
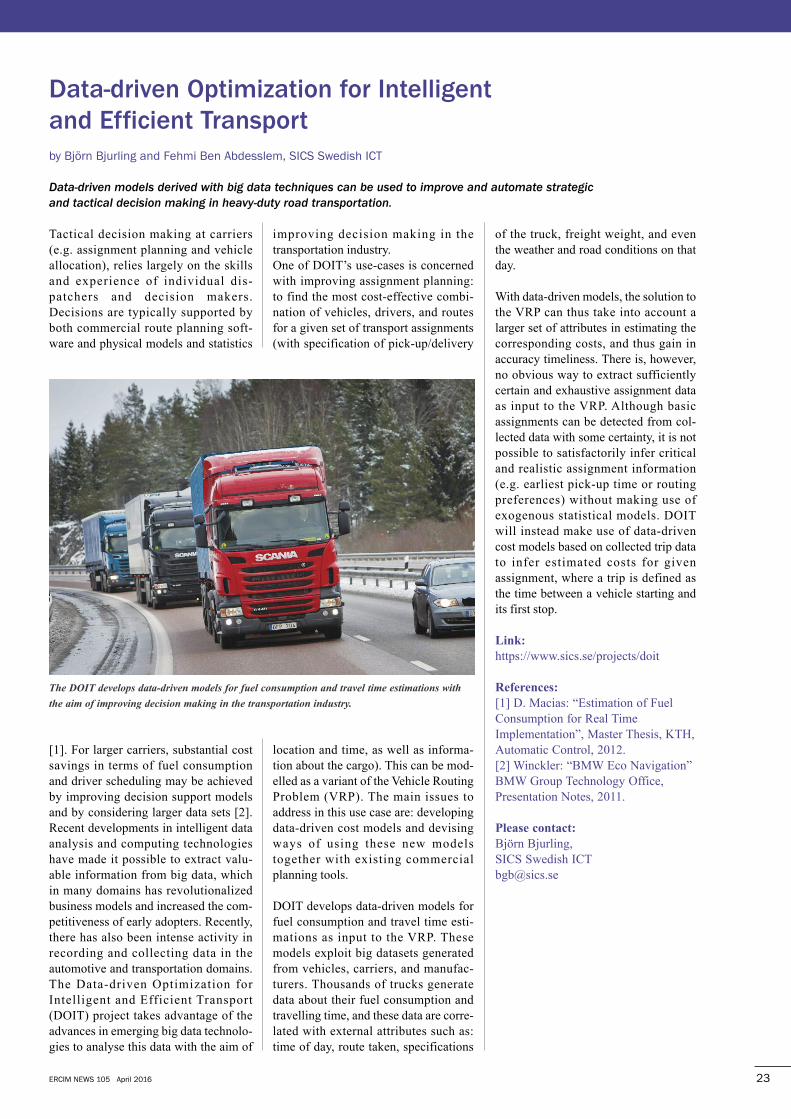
ERCIM NEWS 105 April 2016 23
Tactical decision making at carriers(e.g. assignment planning and vehicleallocation), relies largely on the skillsand experience of individual dis-patchers and decision makers.Decisions are typically supported byboth commercial route planning soft-ware and physical models and statistics
[1]. For larger carriers, substantial costsavings in terms of fuel consumptionand driver scheduling may be achievedby improving decision support modelsand by considering larger data sets [2].Recent developments in intelligent dataanalysis and computing technologieshave made it possible to extract valu-able information from big data, whichin many domains has revolutionalizedbusiness models and increased the com-petitiveness of early adopters. Recently,there has also been intense activity inrecording and collecting data in theautomotive and transportation domains.The Data-driven Optimization forIntelligent and Efficient Transport(DOIT) project takes advantage of theadvances in emerging big data technolo-gies to analyse this data with the aim of
improving decision making in thetransportation industry.One of DOIT’s use-cases is concernedwith improving assignment planning:to find the most cost-effective combi-nation of vehicles, drivers, and routesfor a given set of transport assignments(with specification of pick-up/delivery
location and time, as well as informa-tion about the cargo). This can be mod-elled as a variant of the Vehicle RoutingProblem (VRP). The main issues toaddress in this use case are: developingdata-driven cost models and devisingways of using these new modelstogether with existing commercialplanning tools.
DOIT develops data-driven models forfuel consumption and travel time esti-mations as input to the VRP. Thesemodels exploit big datasets generatedfrom vehicles, carriers, and manufac-turers. Thousands of trucks generatedata about their fuel consumption andtravelling time, and these data are corre-lated with external attributes such as:time of day, route taken, specifications
of the truck, freight weight, and eventhe weather and road conditions on thatday.
With data-driven models, the solution tothe VRP can thus take into account alarger set of attributes in estimating thecorresponding costs, and thus gain inaccuracy timeliness. There is, however,no obvious way to extract sufficientlycertain and exhaustive assignment dataas input to the VRP. Although basicassignments can be detected from col-lected data with some certainty, it is notpossible to satisfactorily infer criticaland realistic assignment information(e.g. earliest pick-up time or routingpreferences) without making use ofexogenous statistical models. DOITwill instead make use of data-drivencost models based on collected trip datato infer estimated costs for givenassignment, where a trip is defined asthe time between a vehicle starting andits first stop.
Link:
https://www.sics.se/projects/doit
References:
[1] D. Macias: “Estimation of FuelConsumption for Real TimeImplementation”, Master Thesis, KTH,Automatic Control, 2012.[2] Winckler: “BMW Eco Navigation”BMW Group Technology Office,Presentation Notes, 2011.
Please contact:
Björn Bjurling, SICS Swedish [email protected]
data-driven optimization for Intelligent
and Efficient Transport
by Björn Bjurling and Fehmi Ben Abdesslem, SICS Swedish ICT
Data-driven models derived with big data techniques can be used to improve and automate strategic
and tactical decision making in heavy-duty road transportation.
The�DOIT�develops�data-driven�models�for�fuel�consumption�and�travel�time�estimations�with
the�aim�of�improving�decision�making�in�the�transportation�industry.
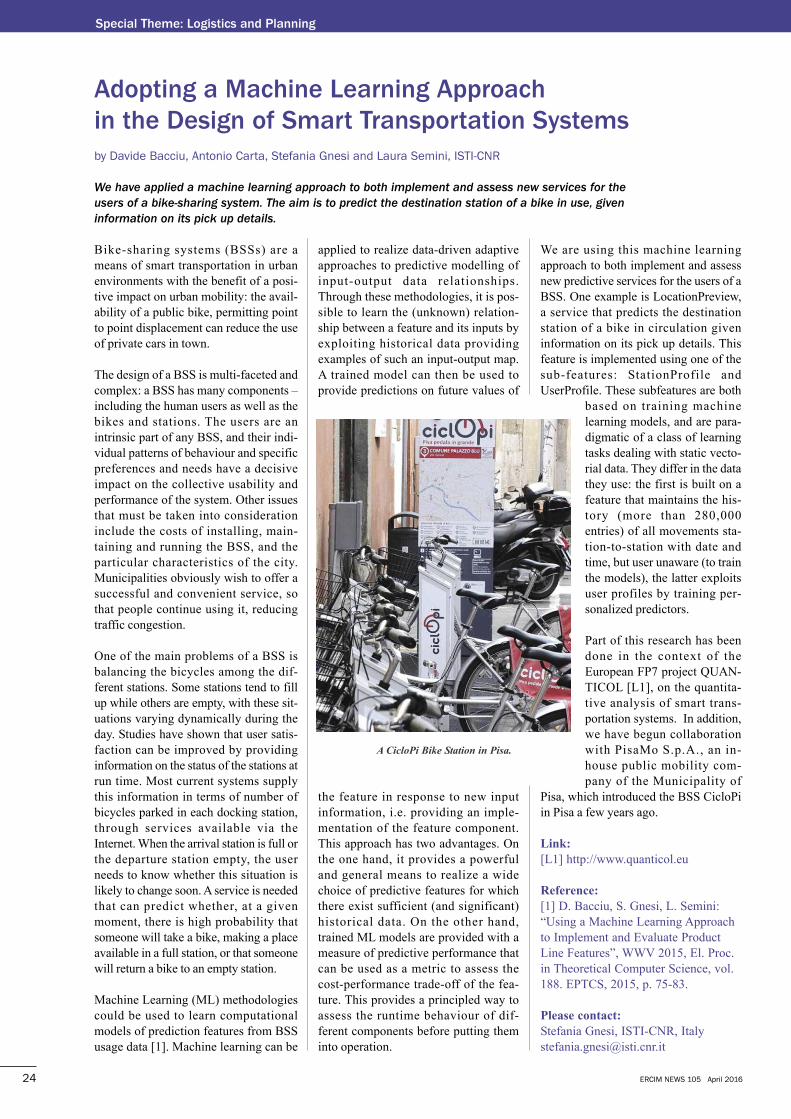
ERCIM NEWS 105 April 201624
Special Theme: Logistics and Planning
Bike-sharing systems (BSSs) are ameans of smart transportation in urbanenvironments with the benefit of a posi-tive impact on urban mobility: the avail-ability of a public bike, permitting pointto point displacement can reduce the useof private cars in town.
The design of a BSS is multi-faceted andcomplex: a BSS has many components –including the human users as well as thebikes and stations. The users are anintrinsic part of any BSS, and their indi-vidual patterns of behaviour and specificpreferences and needs have a decisiveimpact on the collective usability andperformance of the system. Other issuesthat must be taken into considerationinclude the costs of installing, main-taining and running the BSS, and theparticular characteristics of the city.Municipalities obviously wish to offer asuccessful and convenient service, sothat people continue using it, reducingtraffic congestion.
One of the main problems of a BSS isbalancing the bicycles among the dif-ferent stations. Some stations tend to fillup while others are empty, with these sit-uations varying dynamically during theday. Studies have shown that user satis-faction can be improved by providinginformation on the status of the stations atrun time. Most current systems supplythis information in terms of number ofbicycles parked in each docking station,through services available via theInternet. When the arrival station is full orthe departure station empty, the userneeds to know whether this situation islikely to change soon. A service is neededthat can predict whether, at a givenmoment, there is high probability thatsomeone will take a bike, making a placeavailable in a full station, or that someonewill return a bike to an empty station.
Machine Learning (ML) methodologiescould be used to learn computationalmodels of prediction features from BSSusage data [1]. Machine learning can be
applied to realize data-driven adaptiveapproaches to predictive modelling ofinput-output data relationships.Through these methodologies, it is pos-sible to learn the (unknown) relation-ship between a feature and its inputs byexploiting historical data providingexamples of such an input-output map.A trained model can then be used toprovide predictions on future values of
the feature in response to new inputinformation, i.e. providing an imple-mentation of the feature component.This approach has two advantages. Onthe one hand, it provides a powerfuland general means to realize a widechoice of predictive features for whichthere exist sufficient (and significant)historical data. On the other hand,trained ML models are provided with ameasure of predictive performance thatcan be used as a metric to assess thecost-performance trade-off of the fea-ture. This provides a principled way toassess the runtime behaviour of dif-ferent components before putting theminto operation.
We are using this machine learningapproach to both implement and assessnew predictive services for the users of aBSS. One example is LocationPreview,a service that predicts the destinationstation of a bike in circulation giveninformation on its pick up details. Thisfeature is implemented using one of thesub-features: StationProfile andUserProfile. These subfeatures are both
based on training machinelearning models, and are para-digmatic of a class of learningtasks dealing with static vecto-rial data. They differ in the datathey use: the first is built on afeature that maintains the his-tory (more than 280,000entries) of all movements sta-tion-to-station with date andtime, but user unaware (to trainthe models), the latter exploitsuser profiles by training per-sonalized predictors.
Part of this research has beendone in the context of theEuropean FP7 project QUAN-TICOL [L1], on the quantita-tive analysis of smart trans-portation systems. In addition,we have begun collaborationwith PisaMo S.p.A., an in-house public mobility com-pany of the Municipality of
Pisa, which introduced the BSS CicloPiin Pisa a few years ago.
Link:
[L1] http://www.quanticol.eu
Reference:
[1] D. Bacciu, S. Gnesi, L. Semini:“Using a Machine Learning Approachto Implement and Evaluate ProductLine Features”, WWV 2015, El. Proc.in Theoretical Computer Science, vol.188. EPTCS, 2015, p. 75-83.
Please contact:
Stefania Gnesi, ISTI-CNR, [email protected]
Adopting a Machine Learning Approach
in the design of Smart Transportation Systems
by Davide Bacciu, Antonio Carta, Stefania Gnesi and Laura Semini, ISTI-CNR
We have applied a machine learning approach to both implement and assess new services for the
users of a bike-sharing system. The aim is to predict the destination station of a bike in use, given
information on its pick up details.
A�CicloPi�Bike�Station�in�Pisa.
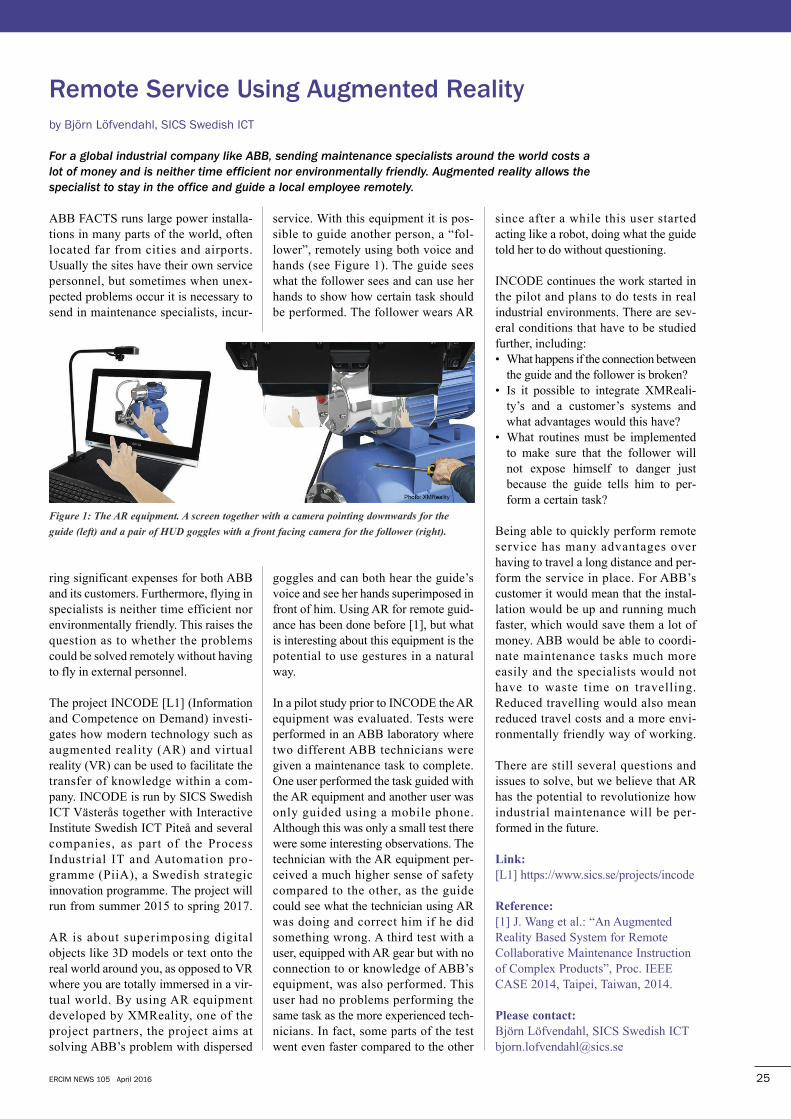
ERCIM NEWS 105 April 2016 25
ABB FACTS runs large power installa-tions in many parts of the world, oftenlocated far from cities and airports.Usually the sites have their own servicepersonnel, but sometimes when unex-pected problems occur it is necessary tosend in maintenance specialists, incur-
ring significant expenses for both ABBand its customers. Furthermore, flying inspecialists is neither time efficient norenvironmentally friendly. This raises thequestion as to whether the problemscould be solved remotely without havingto fly in external personnel.
The project INCODE [L1] (Informationand Competence on Demand) investi-gates how modern technology such asaugmented reality (AR) and virtualreality (VR) can be used to facilitate thetransfer of knowledge within a com-pany. INCODE is run by SICS SwedishICT Västerås together with InteractiveInstitute Swedish ICT Piteå and severalcompanies, as part of the ProcessIndustrial IT and Automation pro-gramme (PiiA), a Swedish strategicinnovation programme. The project willrun from summer 2015 to spring 2017.
AR is about superimposing digitalobjects like 3D models or text onto thereal world around you, as opposed to VRwhere you are totally immersed in a vir-tual world. By using AR equipmentdeveloped by XMReality, one of theproject partners, the project aims atsolving ABB’s problem with dispersed
service. With this equipment it is pos-sible to guide another person, a “fol-lower”, remotely using both voice andhands (see Figure 1). The guide seeswhat the follower sees and can use herhands to show how certain task shouldbe performed. The follower wears AR
goggles and can both hear the guide’svoice and see her hands superimposed infront of him. Using AR for remote guid-ance has been done before [1], but whatis interesting about this equipment is thepotential to use gestures in a naturalway.
In a pilot study prior to INCODE the ARequipment was evaluated. Tests wereperformed in an ABB laboratory wheretwo different ABB technicians weregiven a maintenance task to complete.One user performed the task guided withthe AR equipment and another user wasonly guided using a mobile phone.Although this was only a small test therewere some interesting observations. Thetechnician with the AR equipment per-ceived a much higher sense of safetycompared to the other, as the guidecould see what the technician using ARwas doing and correct him if he didsomething wrong. A third test with auser, equipped with AR gear but with noconnection to or knowledge of ABB’sequipment, was also performed. Thisuser had no problems performing thesame task as the more experienced tech-nicians. In fact, some parts of the testwent even faster compared to the other
since after a while this user startedacting like a robot, doing what the guidetold her to do without questioning.
INCODE continues the work started inthe pilot and plans to do tests in realindustrial environments. There are sev-eral conditions that have to be studiedfurther, including: • What happens if the connection between
the guide and the follower is broken?• Is it possible to integrate XMReali-
ty’s and a customer’s systems andwhat advantages would this have?
• What routines must be implementedto make sure that the follower willnot expose himself to danger justbecause the guide tells him to per-form a certain task?
Being able to quickly perform remoteservice has many advantages overhaving to travel a long distance and per-form the service in place. For ABB’scustomer it would mean that the instal-lation would be up and running muchfaster, which would save them a lot ofmoney. ABB would be able to coordi-nate maintenance tasks much moreeasily and the specialists would nothave to waste time on travelling.Reduced travelling would also meanreduced travel costs and a more envi-ronmentally friendly way of working.
There are still several questions andissues to solve, but we believe that ARhas the potential to revolutionize howindustrial maintenance will be per-formed in the future.
Link:
[L1] https://www.sics.se/projects/incode
Reference:
[1] J. Wang et al.: “An AugmentedReality Based System for RemoteCollaborative Maintenance Instructionof Complex Products”, Proc. IEEECASE 2014, Taipei, Taiwan, 2014.
Please contact:
Björn Löfvendahl, SICS Swedish ICT [email protected]
Remote Service Using Augmented Reality
by Björn Löfvendahl, SICS Swedish ICT
For a global industrial company like ABB, sending maintenance specialists around the world costs a
lot of money and is neither time efficient nor environmentally friendly. Augmented reality allows the
specialist to stay in the office and guide a local employee remotely.
Figure�1:�The�AR�equipment.�A�screen�together�with�a�camera�pointing�downwards�for�the
guide�(left)�and�a�pair�of�HUD�goggles�with�a�front�facing�camera�for�the�follower�(right).
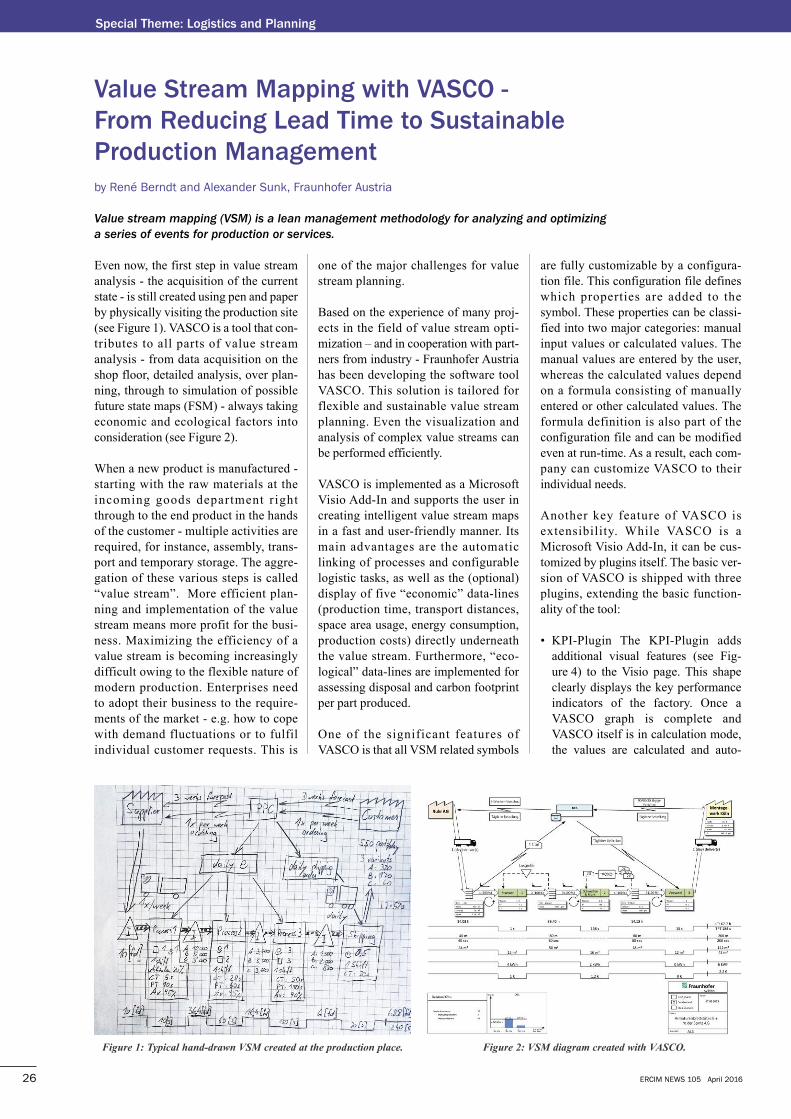
ERCIM NEWS 105 April 201626
Special Theme: Logistics and Planning
Even now, the first step in value streamanalysis - the acquisition of the currentstate - is still created using pen and paperby physically visiting the production site(see Figure 1). VASCO is a tool that con-tributes to all parts of value streamanalysis - from data acquisition on theshop floor, detailed analysis, over plan-ning, through to simulation of possiblefuture state maps (FSM) - always takingeconomic and ecological factors intoconsideration (see Figure 2).
When a new product is manufactured -starting with the raw materials at theincoming goods department rightthrough to the end product in the handsof the customer - multiple activities arerequired, for instance, assembly, trans-port and temporary storage. The aggre-gation of these various steps is called“value stream”. More efficient plan-ning and implementation of the valuestream means more profit for the busi-ness. Maximizing the efficiency of avalue stream is becoming increasinglydifficult owing to the flexible nature ofmodern production. Enterprises needto adopt their business to the require-ments of the market - e.g. how to copewith demand fluctuations or to fulfilindividual customer requests. This is
one of the major challenges for valuestream planning.
Based on the experience of many proj-ects in the field of value stream opti-mization – and in cooperation with part-ners from industry - Fraunhofer Austriahas been developing the software toolVASCO. This solution is tailored forflexible and sustainable value streamplanning. Even the visualization andanalysis of complex value streams canbe performed efficiently.
VASCO is implemented as a MicrosoftVisio Add-In and supports the user increating intelligent value stream mapsin a fast and user-friendly manner. Itsmain advantages are the automaticlinking of processes and configurablelogistic tasks, as well as the (optional)display of five “economic” data-lines(production time, transport distances,space area usage, energy consumption,production costs) directly underneaththe value stream. Furthermore, “eco-logical” data-lines are implemented forassessing disposal and carbon footprintper part produced.
One of the significant features ofVASCO is that all VSM related symbols
are fully customizable by a configura-tion file. This configuration file defineswhich properties are added to thesymbol. These properties can be classi-fied into two major categories: manualinput values or calculated values. Themanual values are entered by the user,whereas the calculated values dependon a formula consisting of manuallyentered or other calculated values. Theformula definition is also part of theconfiguration file and can be modifiedeven at run-time. As a result, each com-pany can customize VASCO to theirindividual needs.
Another key feature of VASCO isextensibility. While VASCO is aMicrosoft Visio Add-In, it can be cus-tomized by plugins itself. The basic ver-sion of VASCO is shipped with threeplugins, extending the basic function-ality of the tool:
• KPI-Plugin The KPI-Plugin addsadditional visual features (see Fig-ure 4) to the Visio page. This shapeclearly displays the key performanceindicators of the factory. Once aVASCO graph is complete andVASCO itself is in calculation mode,the values are calculated and auto-
Value Stream Mapping with VASCo -
from Reducing Lead Time to Sustainable
Production Management
by René Berndt and Alexander Sunk, Fraunhofer Austria
Value stream mapping (VSM) is a lean management methodology for analyzing and optimizing
a series of events for production or services.
Figure�1:�Typical�hand-drawn�VSM�created�at�the�production�place. Figure�2:�VSM�diagram�created�with�VASCO.
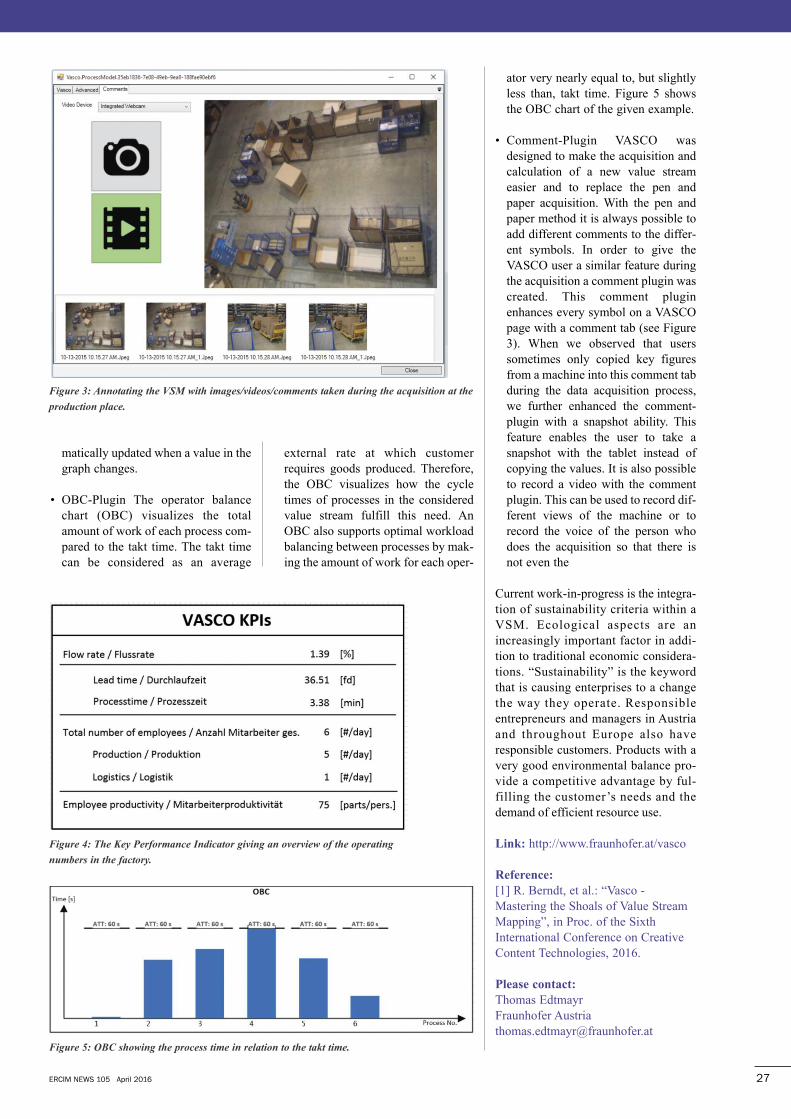
matically updated when a value in thegraph changes.
• OBC-Plugin The operator balancechart (OBC) visualizes the totalamount of work of each process com-pared to the takt time. The takt timecan be considered as an average
external rate at which customerrequires goods produced. Therefore,the OBC visualizes how the cycletimes of processes in the consideredvalue stream fulfill this need. AnOBC also supports optimal workloadbalancing between processes by mak-ing the amount of work for each oper-
ator very nearly equal to, but slightlyless than, takt time. Figure 5 showsthe OBC chart of the given example.
• Comment-Plugin VASCO wasdesigned to make the acquisition andcalculation of a new value streameasier and to replace the pen andpaper acquisition. With the pen andpaper method it is always possible toadd different comments to the differ-ent symbols. In order to give theVASCO user a similar feature duringthe acquisition a comment plugin wascreated. This comment pluginenhances every symbol on a VASCOpage with a comment tab (see Figure3). When we observed that userssometimes only copied key figuresfrom a machine into this comment tabduring the data acquisition process,we further enhanced the comment-plugin with a snapshot ability. Thisfeature enables the user to take asnapshot with the tablet instead ofcopying the values. It is also possibleto record a video with the commentplugin. This can be used to record dif-ferent views of the machine or torecord the voice of the person whodoes the acquisition so that there isnot even the
Current work-in-progress is the integra-tion of sustainability criteria within aVSM. Ecological aspects are anincreasingly important factor in addi-tion to traditional economic considera-tions. “Sustainability” is the keywordthat is causing enterprises to a changethe way they operate. Responsibleentrepreneurs and managers in Austriaand throughout Europe also haveresponsible customers. Products with avery good environmental balance pro-vide a competitive advantage by ful-filling the customer’s needs and thedemand of efficient resource use.
Link: http://www.fraunhofer.at/vasco
Reference:
[1] R. Berndt, et al.: “Vasco -Mastering the Shoals of Value StreamMapping”, in Proc. of the SixthInternational Conference on CreativeContent Technologies, 2016.
Please contact:
Thomas EdtmayrFraunhofer Austria [email protected]
ERCIM NEWS 105 April 2016 27
Figure�3:�Annotating�the�VSM�with�images/videos/comments�taken�during�the�acquisition�at�the
production�place.
Figure�4:�The�Key�Performance�Indicator�giving�an�overview�of�the�operating
numbers�in�the�factory.
Figure�5:�OBC�showing�the�process�time�in�relation�to�the�takt�time.
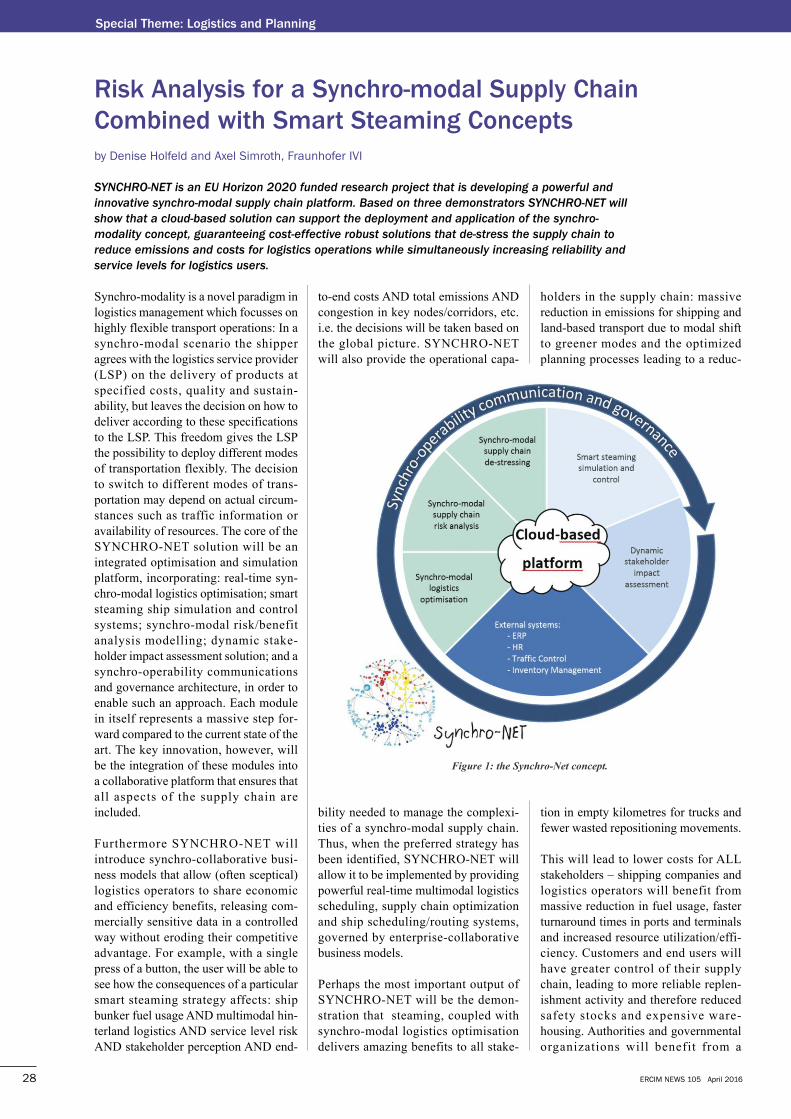
ERCIM NEWS 105 April 201628
Special Theme: Logistics and Planning
Synchro-modality is a novel paradigm inlogistics management which focusses onhighly flexible transport operations: In asynchro-modal scenario the shipperagrees with the logistics service provider(LSP) on the delivery of products atspecified costs, quality and sustain-ability, but leaves the decision on how todeliver according to these specificationsto the LSP. This freedom gives the LSPthe possibility to deploy different modesof transportation flexibly. The decisionto switch to different modes of trans-portation may depend on actual circum-stances such as traffic information oravailability of resources. The core of theSYNCHRO-NET solution will be anintegrated optimisation and simulationplatform, incorporating: real-time syn-chro-modal logistics optimisation; smartsteaming ship simulation and controlsystems; synchro-modal risk/benefitanalysis modelling; dynamic stake-holder impact assessment solution; and asynchro-operability communicationsand governance architecture, in order toenable such an approach. Each modulein itself represents a massive step for-ward compared to the current state of theart. The key innovation, however, willbe the integration of these modules intoa collaborative platform that ensures thatall aspects of the supply chain areincluded.
Furthermore SYNCHRO-NET willintroduce synchro-collaborative busi-ness models that allow (often sceptical)logistics operators to share economicand efficiency benefits, releasing com-mercially sensitive data in a controlledway without eroding their competitiveadvantage. For example, with a singlepress of a button, the user will be able tosee how the consequences of a particularsmart steaming strategy affects: shipbunker fuel usage AND multimodal hin-terland logistics AND service level riskAND stakeholder perception AND end-
to-end costs AND total emissions ANDcongestion in key nodes/corridors, etc.i.e. the decisions will be taken based onthe global picture. SYNCHRO-NETwill also provide the operational capa-
bility needed to manage the complexi-ties of a synchro-modal supply chain.Thus, when the preferred strategy hasbeen identified, SYNCHRO-NET willallow it to be implemented by providingpowerful real-time multimodal logisticsscheduling, supply chain optimizationand ship scheduling/routing systems,governed by enterprise-collaborativebusiness models.
Perhaps the most important output ofSYNCHRO-NET will be the demon-stration that steaming, coupled withsynchro-modal logistics optimisationdelivers amazing benefits to all stake-
holders in the supply chain: massivereduction in emissions for shipping andland-based transport due to modal shiftto greener modes and the optimizedplanning processes leading to a reduc-
tion in empty kilometres for trucks andfewer wasted repositioning movements.
This will lead to lower costs for ALLstakeholders – shipping companies andlogistics operators will benefit frommassive reduction in fuel usage, fasterturnaround times in ports and terminalsand increased resource utilization/effi-ciency. Customers and end users willhave greater control of their supplychain, leading to more reliable replen-ishment activity and therefore reducedsafety stocks and expensive ware-housing. Authorities and governmentalorganizations will benefit from a
Risk Analysis for a Synchro-modal Supply Chain
Combined with Smart Steaming Concepts
by Denise Holfeld and Axel Simroth, Fraunhofer IVI
SYNCHRO-NET is an EU Horizon 2020 funded research project that is developing a powerful and
innovative synchro-modal supply chain platform. Based on three demonstrators SYNCHRO-NET will
show that a cloud-based solution can support the deployment and application of the synchro-
modality concept, guaranteeing cost-effective robust solutions that de-stress the supply chain to
reduce emissions and costs for logistics operations while simultaneously increasing reliability and
service levels for logistics users.
Figure�1:�the�Synchro-Net�concept.
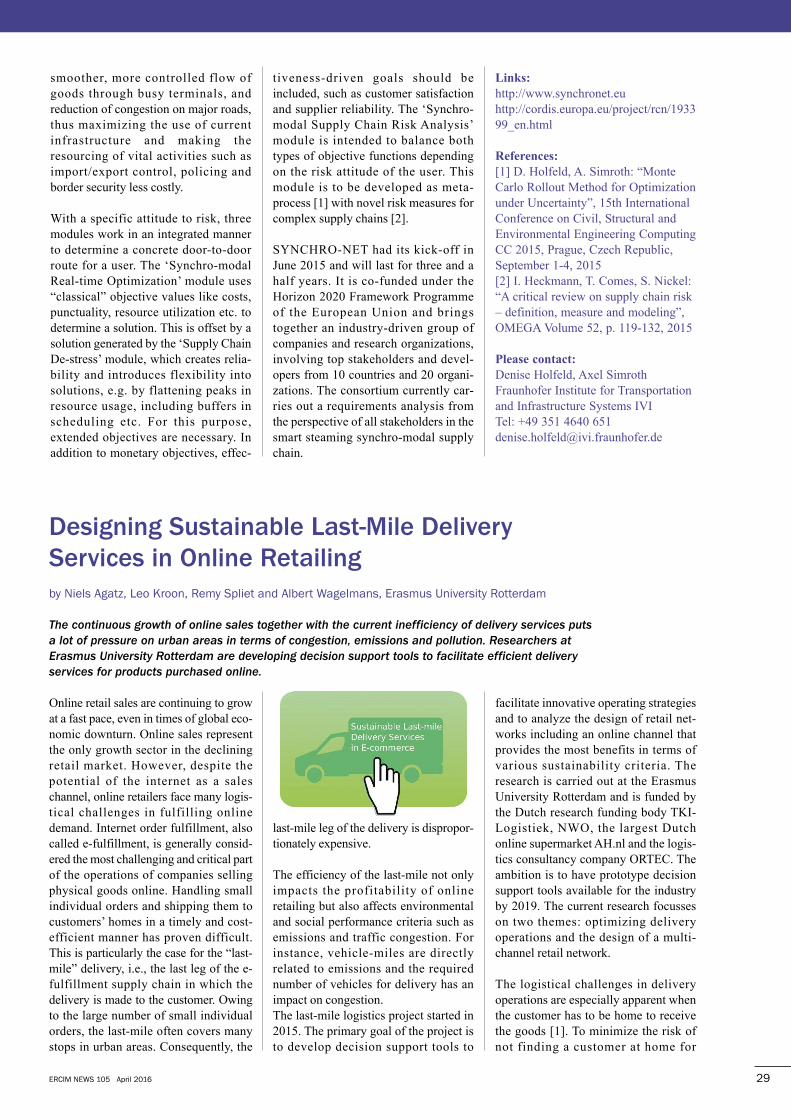
smoother, more controlled flow ofgoods through busy terminals, andreduction of congestion on major roads,thus maximizing the use of currentinfrastructure and making theresourcing of vital activities such asimport/export control, policing andborder security less costly.
With a specific attitude to risk, threemodules work in an integrated mannerto determine a concrete door-to-doorroute for a user. The ‘Synchro-modalReal-time Optimization’ module uses“classical” objective values like costs,punctuality, resource utilization etc. todetermine a solution. This is offset by asolution generated by the ‘Supply ChainDe-stress’ module, which creates relia-bility and introduces flexibility intosolutions, e.g. by flattening peaks inresource usage, including buffers inscheduling etc. For this purpose,extended objectives are necessary. Inaddition to monetary objectives, effec-
tiveness-driven goals should beincluded, such as customer satisfactionand supplier reliability. The ‘Synchro-modal Supply Chain Risk Analysis’module is intended to balance bothtypes of objective functions dependingon the risk attitude of the user. Thismodule is to be developed as meta-process [1] with novel risk measures forcomplex supply chains [2].
SYNCHRO-NET had its kick-off inJune 2015 and will last for three and ahalf years. It is co-funded under theHorizon 2020 Framework Programmeof the European Union and bringstogether an industry-driven group ofcompanies and research organizations,involving top stakeholders and devel-opers from 10 countries and 20 organi-zations. The consortium currently car-ries out a requirements analysis fromthe perspective of all stakeholders in thesmart steaming synchro-modal supplychain.
Links:
http://www.synchronet.euhttp://cordis.europa.eu/project/rcn/193399_en.html
References:
[1] D. Holfeld, A. Simroth: “MonteCarlo Rollout Method for Optimizationunder Uncertainty”, 15th InternationalConference on Civil, Structural andEnvironmental Engineering ComputingCC 2015, Prague, Czech Republic,September 1-4, 2015[2] I. Heckmann, T. Comes, S. Nickel:“A critical review on supply chain risk– definition, measure and modeling”,OMEGA Volume 52, p. 119-132, 2015
Please contact:
Denise Holfeld, Axel SimrothFraunhofer Institute for Transportationand Infrastructure Systems IVITel: +49 351 4640 [email protected]
ERCIM NEWS 105 April 2016 29
Online retail sales are continuing to growat a fast pace, even in times of global eco-nomic downturn. Online sales representthe only growth sector in the decliningretail market. However, despite thepotential of the internet as a saleschannel, online retailers face many logis-tical challenges in fulfilling onlinedemand. Internet order fulfillment, alsocalled e-fulfillment, is generally consid-ered the most challenging and critical partof the operations of companies sellingphysical goods online. Handling smallindividual orders and shipping them tocustomers’ homes in a timely and cost-efficient manner has proven difficult.This is particularly the case for the “last-mile” delivery, i.e., the last leg of the e-fulfillment supply chain in which thedelivery is made to the customer. Owingto the large number of small individualorders, the last-mile often covers manystops in urban areas. Consequently, the
last-mile leg of the delivery is dispropor-tionately expensive.
The efficiency of the last-mile not onlyimpacts the profitability of onlineretailing but also affects environmentaland social performance criteria such asemissions and traffic congestion. Forinstance, vehicle-miles are directlyrelated to emissions and the requirednumber of vehicles for delivery has animpact on congestion.The last-mile logistics project started in2015. The primary goal of the project isto develop decision support tools to
facilitate innovative operating strategiesand to analyze the design of retail net-works including an online channel thatprovides the most benefits in terms ofvarious sustainability criteria. Theresearch is carried out at the ErasmusUniversity Rotterdam and is funded bythe Dutch research funding body TKI-Logistiek, NWO, the largest Dutchonline supermarket AH.nl and the logis-tics consultancy company ORTEC. Theambition is to have prototype decisionsupport tools available for the industryby 2019. The current research focusseson two themes: optimizing deliveryoperations and the design of a multi-channel retail network.
The logistical challenges in deliveryoperations are especially apparent whenthe customer has to be home to receivethe goods [1]. To minimize the risk ofnot finding a customer at home for
designing Sustainable Last-Mile delivery
Services in online Retailing
by Niels Agatz, Leo Kroon, Remy Spliet and Albert Wagelmans, Erasmus University Rotterdam
The continuous growth of online sales together with the current inefficiency of delivery services puts
a lot of pressure on urban areas in terms of congestion, emissions and pollution. Researchers at
Erasmus University Rotterdam are developing decision support tools to facilitate efficient delivery
services for products purchased online.
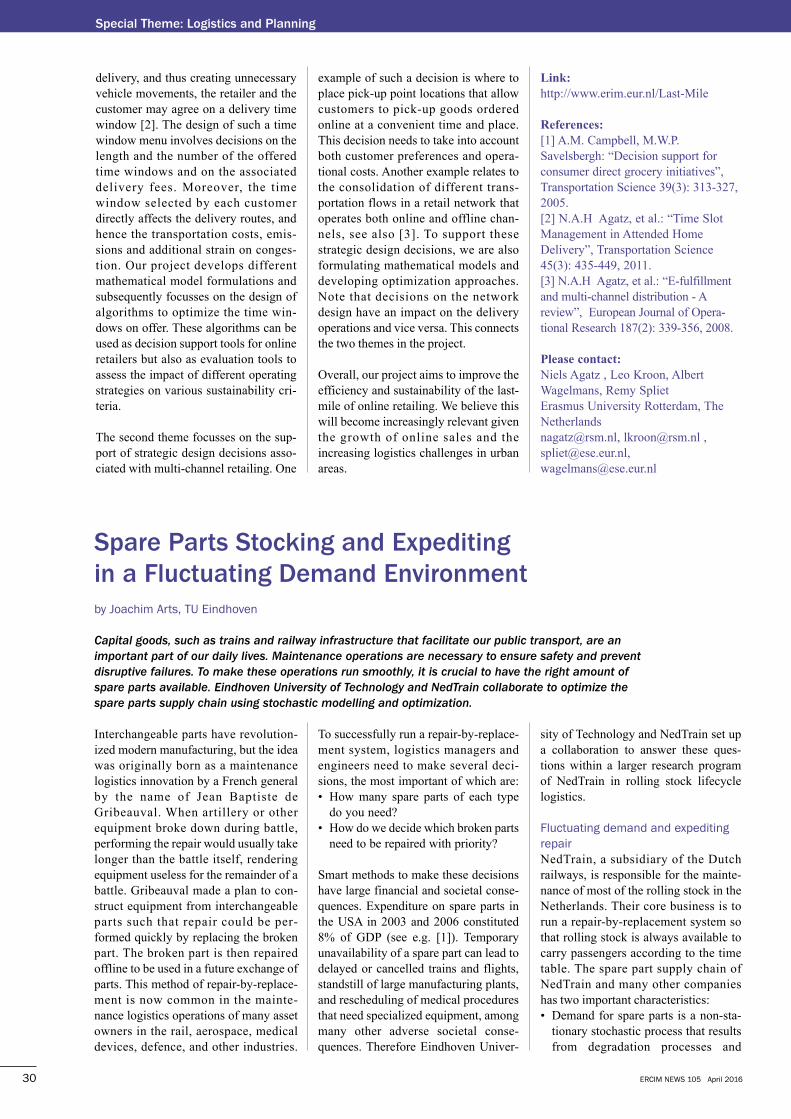
ERCIM NEWS 105 April 201630
Special Theme: Logistics and Planning
delivery, and thus creating unnecessaryvehicle movements, the retailer and thecustomer may agree on a delivery timewindow [2]. The design of such a timewindow menu involves decisions on thelength and the number of the offeredtime windows and on the associateddelivery fees. Moreover, the timewindow selected by each customerdirectly affects the delivery routes, andhence the transportation costs, emis-sions and additional strain on conges-tion. Our project develops differentmathematical model formulations andsubsequently focusses on the design ofalgorithms to optimize the time win-dows on offer. These algorithms can beused as decision support tools for onlineretailers but also as evaluation tools toassess the impact of different operatingstrategies on various sustainability cri-teria.
The second theme focusses on the sup-port of strategic design decisions asso-ciated with multi-channel retailing. One
example of such a decision is where toplace pick-up point locations that allowcustomers to pick-up goods orderedonline at a convenient time and place.This decision needs to take into accountboth customer preferences and opera-tional costs. Another example relates tothe consolidation of different trans-portation flows in a retail network thatoperates both online and offline chan-nels, see also [3]. To support thesestrategic design decisions, we are alsoformulating mathematical models anddeveloping optimization approaches.Note that decisions on the networkdesign have an impact on the deliveryoperations and vice versa. This connectsthe two themes in the project.
Overall, our project aims to improve theefficiency and sustainability of the last-mile of online retailing. We believe thiswill become increasingly relevant giventhe growth of online sales and theincreasing logistics challenges in urbanareas.
Link:
http://www.erim.eur.nl/Last-Mile
References:
[1] A.M. Campbell, M.W.P.Savelsbergh: “Decision support forconsumer direct grocery initiatives”,Transportation Science 39(3): 313-327,2005.[2] N.A.H Agatz, et al.: “Time SlotManagement in Attended HomeDelivery”, Transportation Science45(3): 435-449, 2011.[3] N.A.H Agatz, et al.: “E-fulfillmentand multi-channel distribution - Areview”, European Journal of Opera-tional Research 187(2): 339-356, 2008.
Please contact:
Niels Agatz , Leo Kroon, AlbertWagelmans, Remy SplietErasmus University Rotterdam, [email protected], [email protected] ,[email protected],[email protected]
Interchangeable parts have revolution-ized modern manufacturing, but the ideawas originally born as a maintenancelogistics innovation by a French generalby the name of Jean Baptiste deGribeauval. When artillery or otherequipment broke down during battle,performing the repair would usually takelonger than the battle itself, renderingequipment useless for the remainder of abattle. Gribeauval made a plan to con-struct equipment from interchangeableparts such that repair could be per-formed quickly by replacing the brokenpart. The broken part is then repairedoffline to be used in a future exchange ofparts. This method of repair-by-replace-ment is now common in the mainte-nance logistics operations of many assetowners in the rail, aerospace, medicaldevices, defence, and other industries.
To successfully run a repair-by-replace-ment system, logistics managers andengineers need to make several deci-sions, the most important of which are:• How many spare parts of each type
do you need?• How do we decide which broken parts
need to be repaired with priority?
Smart methods to make these decisionshave large financial and societal conse-quences. Expenditure on spare parts inthe USA in 2003 and 2006 constituted8% of GDP (see e.g. [1]). Temporaryunavailability of a spare part can lead todelayed or cancelled trains and flights,standstill of large manufacturing plants,and rescheduling of medical proceduresthat need specialized equipment, amongmany other adverse societal conse-quences. Therefore Eindhoven Univer-
sity of Technology and NedTrain set upa collaboration to answer these ques-tions within a larger research programof NedTrain in rolling stock lifecyclelogistics.
Fluctuating demand and expeditingrepairNedTrain, a subsidiary of the Dutchrailways, is responsible for the mainte-nance of most of the rolling stock in theNetherlands. Their core business is torun a repair-by-replacement system sothat rolling stock is always available tocarry passengers according to the timetable. The spare part supply chain ofNedTrain and many other companieshas two important characteristics:• Demand for spare parts is a non-sta-
tionary stochastic process that resultsfrom degradation processes and
Spare Parts Stocking and Expediting
in a fluctuating demand Environment
by Joachim Arts, TU Eindhoven
Capital goods, such as trains and railway infrastructure that facilitate our public transport, are an
important part of our daily lives. Maintenance operations are necessary to ensure safety and prevent
disruptive failures. To make these operations run smoothly, it is crucial to have the right amount of
spare parts available. Eindhoven University of Technology and NedTrain collaborate to optimize the
spare parts supply chain using stochastic modelling and optimization.
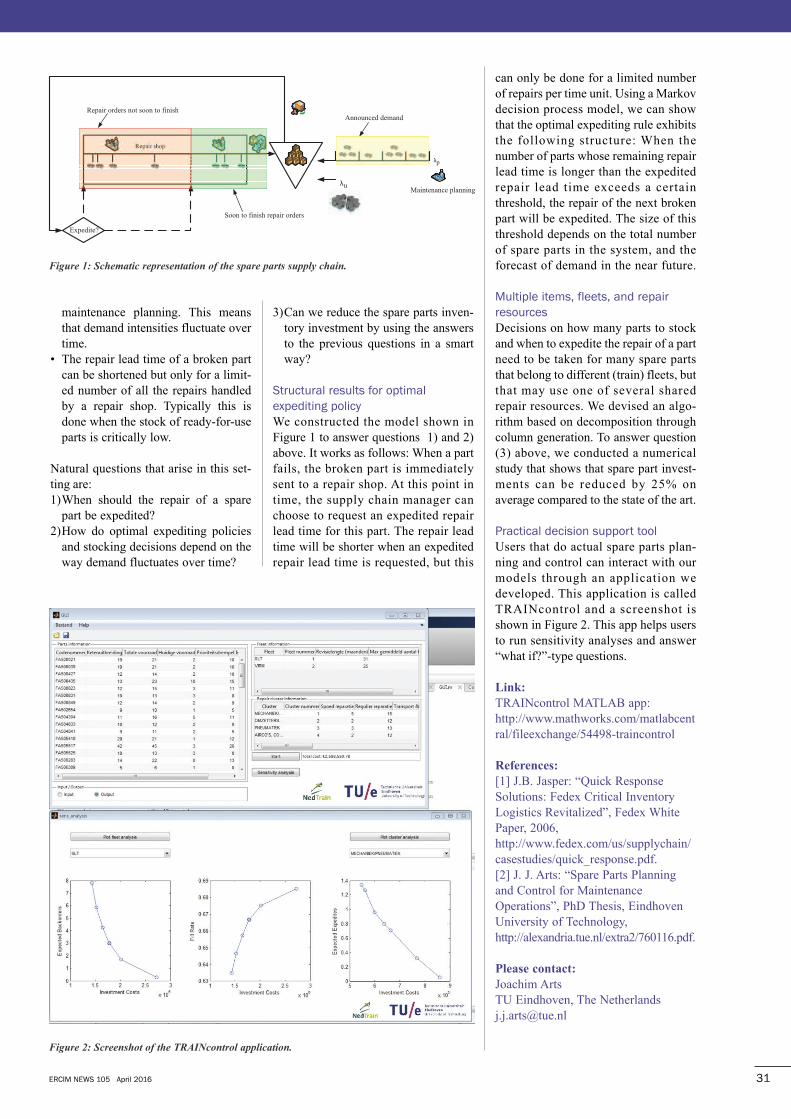
maintenance planning. This meansthat demand intensities fluctuate overtime.
• The repair lead time of a broken partcan be shortened but only for a limit-ed number of all the repairs handledby a repair shop. Typically this isdone when the stock of ready-for-useparts is critically low.
Natural questions that arise in this set-ting are:1)When should the repair of a spare
part be expedited? 2)How do optimal expediting policies
and stocking decisions depend on theway demand fluctuates over time?
3)Can we reduce the spare parts inven-tory investment by using the answersto the previous questions in a smartway?
Structural results for optimalexpediting policyWe constructed the model shown inFigure 1 to answer questions 1) and 2)above. It works as follows: When a partfails, the broken part is immediatelysent to a repair shop. At this point intime, the supply chain manager canchoose to request an expedited repairlead time for this part. The repair leadtime will be shorter when an expeditedrepair lead time is requested, but this
can only be done for a limited numberof repairs per time unit. Using a Markovdecision process model, we can showthat the optimal expediting rule exhibitsthe following structure: When thenumber of parts whose remaining repairlead time is longer than the expeditedrepair lead time exceeds a certainthreshold, the repair of the next brokenpart will be expedited. The size of thisthreshold depends on the total numberof spare parts in the system, and theforecast of demand in the near future.
Multiple items, fleets, and repairresourcesDecisions on how many parts to stockand when to expedite the repair of a partneed to be taken for many spare partsthat belong to different (train) fleets, butthat may use one of several sharedrepair resources. We devised an algo-rithm based on decomposition throughcolumn generation. To answer question(3) above, we conducted a numericalstudy that shows that spare part invest-ments can be reduced by 25% onaverage compared to the state of the art.
Practical decision support toolUsers that do actual spare parts plan-ning and control can interact with ourmodels through an application wedeveloped. This application is calledTRAINcontrol and a screenshot isshown in Figure 2. This app helps usersto run sensitivity analyses and answer“what if?”-type questions.
Link:
TRAINcontrol MATLAB app:http://www.mathworks.com/matlabcentral/fileexchange/54498-traincontrol
References:
[1] J.B. Jasper: “Quick ResponseSolutions: Fedex Critical InventoryLogistics Revitalized”, Fedex WhitePaper, 2006,http://www.fedex.com/us/supplychain/casestudies/quick_response.pdf. [2] J. J. Arts: “Spare Parts Planningand Control for MaintenanceOperations”, PhD Thesis, EindhovenUniversity of Technology,http://alexandria.tue.nl/extra2/760116.pdf.
Please contact:
Joachim ArtsTU Eindhoven, The [email protected]
ERCIM NEWS 105 April 2016 31
Figure�1:�Schematic�representation�of�the�spare�parts�supply�chain.
Figure�2:�Screenshot�of�the�TRAINcontrol�application.
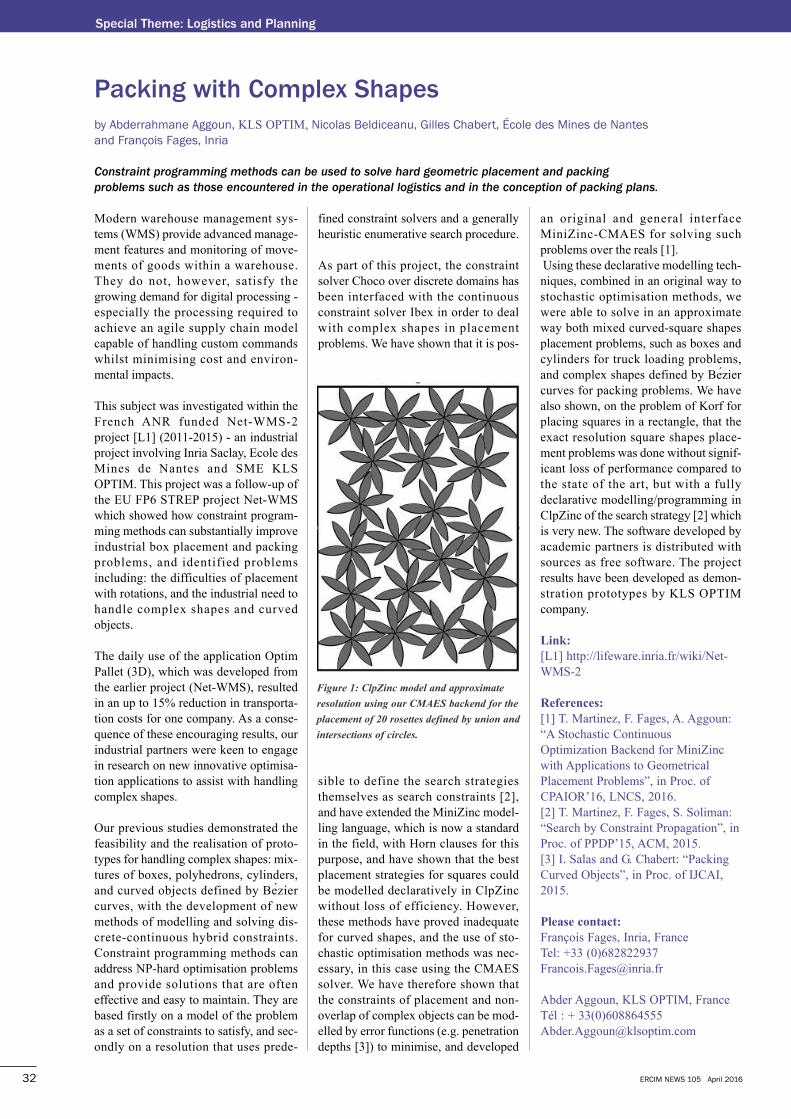
ERCIM NEWS 105 April 201632
Special Theme: Logistics and Planning
Modern warehouse management sys-tems (WMS) provide advanced manage-ment features and monitoring of move-ments of goods within a warehouse.They do not, however, satisfy thegrowing demand for digital processing -especially the processing required toachieve an agile supply chain modelcapable of handling custom commandswhilst minimising cost and environ-mental impacts.
This subject was investigated within theFrench ANR funded Net-WMS-2project [L1] (2011-2015) - an industrialproject involving Inria Saclay, Ecole desMines de Nantes and SME KLSOPTIM. This project was a follow-up ofthe EU FP6 STREP project Net-WMSwhich showed how constraint program-ming methods can substantially improveindustrial box placement and packingproblems, and identified problemsincluding: the difficulties of placementwith rotations, and the industrial need tohandle complex shapes and curvedobjects.
The daily use of the application OptimPallet (3D), which was developed fromthe earlier project (Net-WMS), resultedin an up to 15% reduction in transporta-tion costs for one company. As a conse-quence of these encouraging results, ourindustrial partners were keen to engagein research on new innovative optimisa-tion applications to assist with handlingcomplex shapes.
Our previous studies demonstrated thefeasibility and the realisation of proto-types for handling complex shapes: mix-tures of boxes, polyhedrons, cylinders,and curved objects defined by Beziercurves, with the development of newmethods of modelling and solving dis-crete-continuous hybrid constraints.Constraint programming methods canaddress NP-hard optimisation problemsand provide solutions that are ofteneffective and easy to maintain. They arebased firstly on a model of the problemas a set of constraints to satisfy, and sec-ondly on a resolution that uses prede-
fined constraint solvers and a generallyheuristic enumerative search procedure.
As part of this project, the constraintsolver Choco over discrete domains hasbeen interfaced with the continuousconstraint solver Ibex in order to dealwith complex shapes in placementproblems. We have shown that it is pos-
sible to define the search strategiesthemselves as search constraints [2],and have extended the MiniZinc model-ling language, which is now a standardin the field, with Horn clauses for thispurpose, and have shown that the bestplacement strategies for squares couldbe modelled declaratively in ClpZincwithout loss of efficiency. However,these methods have proved inadequatefor curved shapes, and the use of sto-chastic optimisation methods was nec-essary, in this case using the CMAESsolver. We have therefore shown thatthe constraints of placement and non-overlap of complex objects can be mod-elled by error functions (e.g. penetrationdepths [3]) to minimise, and developed
an original and general interfaceMiniZinc-CMAES for solving suchproblems over the reals [1].Using these declarative modelling tech-niques, combined in an original way tostochastic optimisation methods, wewere able to solve in an approximateway both mixed curved-square shapesplacement problems, such as boxes andcylinders for truck loading problems,and complex shapes defined by Beziercurves for packing problems. We havealso shown, on the problem of Korf forplacing squares in a rectangle, that theexact resolution square shapes place-ment problems was done without signif-icant loss of performance compared tothe state of the art, but with a fullydeclarative modelling/programming inClpZinc of the search strategy [2] whichis very new. The software developed byacademic partners is distributed withsources as free software. The projectresults have been developed as demon-stration prototypes by KLS OPTIMcompany.
Link:
[L1] http://lifeware.inria.fr/wiki/Net-WMS-2
References:
[1] T. Martinez, F. Fages, A. Aggoun:“A Stochastic ContinuousOptimization Backend for MiniZincwith Applications to GeometricalPlacement Problems”, in Proc. ofCPAIOR’16, LNCS, 2016.[2] T. Martinez, F. Fages, S. Soliman:“Search by Constraint Propagation”, inProc. of PPDP’15, ACM, 2015.[3] I. Salas and G. Chabert: “PackingCurved Objects”, in Proc. of IJCAI,2015.
Please contact:
François Fages, Inria, FranceTel: +33 (0)[email protected]
Abder Aggoun, KLS OPTIM, FranceTél : + 33(0)[email protected]
Packing with Complex Shapes
by Abderrahmane Aggoun, KLS OPTIM, Nicolas Beldiceanu, Gilles Chabert, École des Mines de Nantesand François Fages, Inria
Constraint programming methods can be used to solve hard geometric placement and packing
problems such as those encountered in the operational logistics and in the conception of packing plans.
Figure�1:�ClpZinc�model�and�approximate
resolution�using�our�CMAES�backend�for�the
placement�of�20�rosettes�defined�by�union�and
intersections�of�circles.
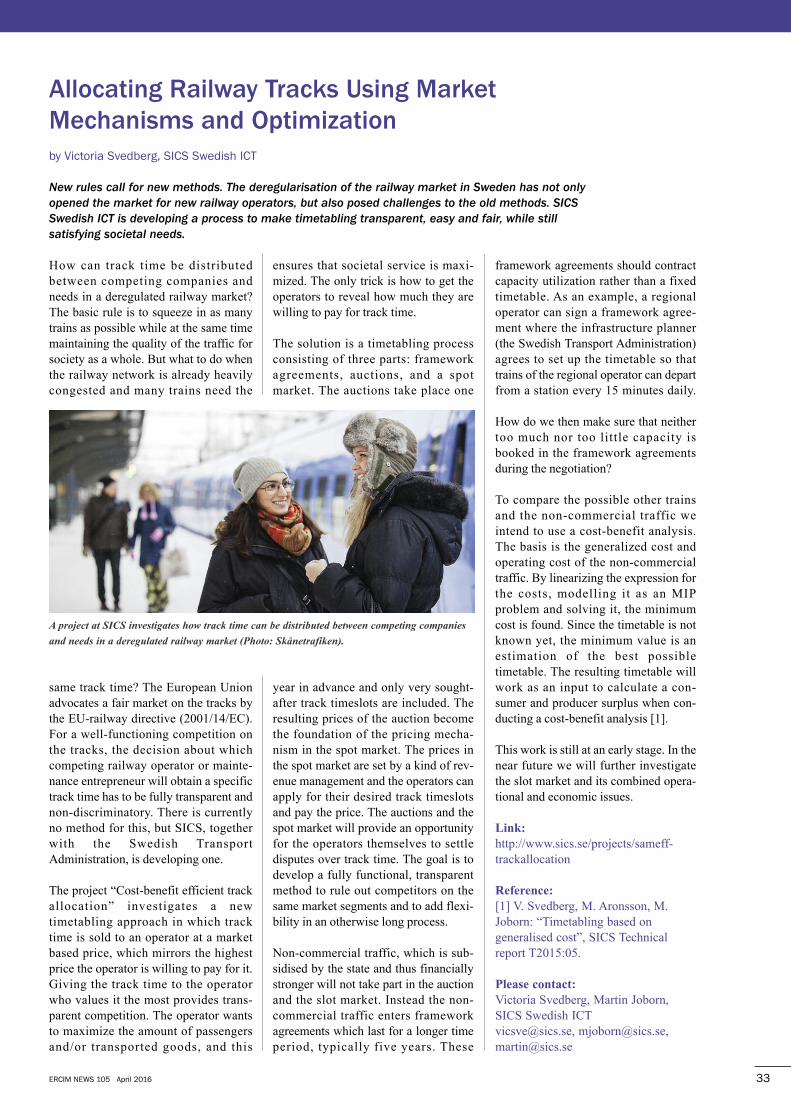
ERCIM NEWS 105 April 2016 33
How can track time be distributedbetween competing companies andneeds in a deregulated railway market?The basic rule is to squeeze in as manytrains as possible while at the same timemaintaining the quality of the traffic forsociety as a whole. But what to do whenthe railway network is already heavilycongested and many trains need the
same track time? The European Unionadvocates a fair market on the tracks bythe EU-railway directive (2001/14/EC).For a well-functioning competition onthe tracks, the decision about whichcompeting railway operator or mainte-nance entrepreneur will obtain a specifictrack time has to be fully transparent andnon-discriminatory. There is currentlyno method for this, but SICS, togetherwith the Swedish TransportAdministration, is developing one.
The project “Cost-benefit efficient trackallocation” investigates a newtimetabling approach in which tracktime is sold to an operator at a marketbased price, which mirrors the highestprice the operator is willing to pay for it.Giving the track time to the operatorwho values it the most provides trans-parent competition. The operator wantsto maximize the amount of passengersand/or transported goods, and this
ensures that societal service is maxi-mized. The only trick is how to get theoperators to reveal how much they arewilling to pay for track time.
The solution is a timetabling processconsisting of three parts: frameworkagreements, auctions, and a spotmarket. The auctions take place one
year in advance and only very sought-after track timeslots are included. Theresulting prices of the auction becomethe foundation of the pricing mecha-nism in the spot market. The prices inthe spot market are set by a kind of rev-enue management and the operators canapply for their desired track timeslotsand pay the price. The auctions and thespot market will provide an opportunityfor the operators themselves to settledisputes over track time. The goal is todevelop a fully functional, transparentmethod to rule out competitors on thesame market segments and to add flexi-bility in an otherwise long process.
Non-commercial traffic, which is sub-sidised by the state and thus financiallystronger will not take part in the auctionand the slot market. Instead the non-commercial traffic enters frameworkagreements which last for a longer timeperiod, typically five years. These
framework agreements should contractcapacity utilization rather than a fixedtimetable. As an example, a regionaloperator can sign a framework agree-ment where the infrastructure planner(the Swedish Transport Administration)agrees to set up the timetable so thattrains of the regional operator can departfrom a station every 15 minutes daily.
How do we then make sure that neithertoo much nor too little capacity isbooked in the framework agreementsduring the negotiation?
To compare the possible other trainsand the non-commercial traffic weintend to use a cost-benefit analysis.The basis is the generalized cost andoperating cost of the non-commercialtraffic. By linearizing the expression forthe costs, modelling it as an MIPproblem and solving it, the minimumcost is found. Since the timetable is notknown yet, the minimum value is anestimation of the best possibletimetable. The resulting timetable willwork as an input to calculate a con-sumer and producer surplus when con-ducting a cost-benefit analysis [1].
This work is still at an early stage. In thenear future we will further investigatethe slot market and its combined opera-tional and economic issues.
Link:
http://www.sics.se/projects/sameff-trackallocation
Reference:
[1] V. Svedberg, M. Aronsson, M.Joborn: “Timetabling based ongeneralised cost”, SICS Technicalreport T2015:05.
Please contact:
Victoria Svedberg, Martin Joborn, SICS Swedish [email protected], [email protected],[email protected]
Allocating Railway Tracks Using Market
Mechanisms and optimization
by Victoria Svedberg, SICS Swedish ICT
New rules call for new methods. The deregularisation of the railway market in Sweden has not only
opened the market for new railway operators, but also posed challenges to the old methods. SICS
Swedish ICT is developing a process to make timetabling transparent, easy and fair, while still
satisfying societal needs.
A�project�at�SICS�investigates�how�track�time�can�be�distributed�between�competing�companies
and�needs�in�a�deregulated�railway�market�(Photo:�Skånetrafiken).�
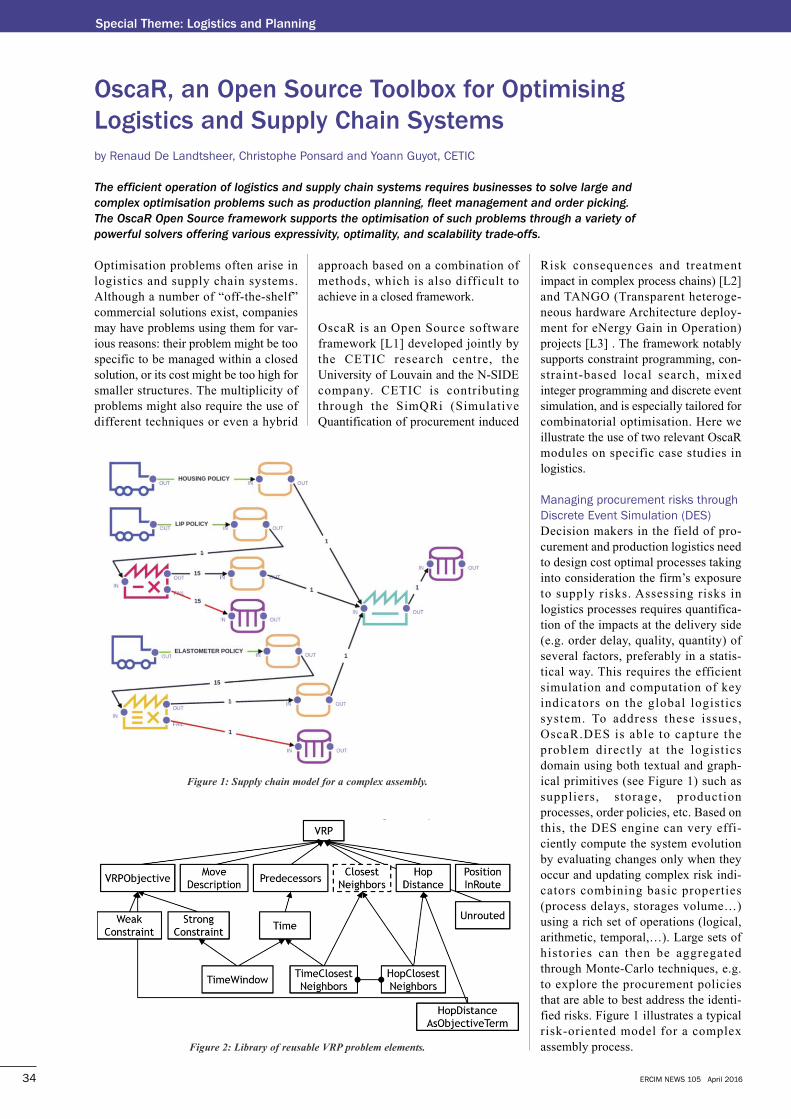
ERCIM NEWS 105 April 201634
Special Theme: Logistics and Planning
Optimisation problems often arise inlogistics and supply chain systems.Although a number of “off-the-shelf”commercial solutions exist, companiesmay have problems using them for var-ious reasons: their problem might be toospecific to be managed within a closedsolution, or its cost might be too high forsmaller structures. The multiplicity ofproblems might also require the use ofdifferent techniques or even a hybrid
approach based on a combination ofmethods, which is also difficult toachieve in a closed framework.
OscaR is an Open Source softwareframework [L1] developed jointly bythe CETIC research centre, theUniversity of Louvain and the N-SIDEcompany. CETIC is contributingthrough the SimQRi (SimulativeQuantification of procurement induced
Risk consequences and treatmentimpact in complex process chains) [L2]and TANGO (Transparent heteroge-neous hardware Architecture deploy-ment for eNergy Gain in Operation)projects [L3] . The framework notablysupports constraint programming, con-straint-based local search, mixedinteger programming and discrete eventsimulation, and is especially tailored forcombinatorial optimisation. Here weillustrate the use of two relevant OscaRmodules on specific case studies inlogistics.
Managing procurement risks throughDiscrete Event Simulation (DES)Decision makers in the field of pro-curement and production logistics needto design cost optimal processes takinginto consideration the firm’s exposureto supply risks. Assessing risks inlogistics processes requires quantifica-tion of the impacts at the delivery side(e.g. order delay, quality, quantity) ofseveral factors, preferably in a statis-tical way. This requires the efficientsimulation and computation of keyindicators on the global logisticssystem. To address these issues,OscaR.DES is able to capture theproblem directly at the logisticsdomain using both textual and graph-ical primitives (see Figure 1) such assuppliers, storage, productionprocesses, order policies, etc. Based onthis, the DES engine can very effi-ciently compute the system evolutionby evaluating changes only when theyoccur and updating complex risk indi-cators combining basic properties(process delays, storages volume…)using a rich set of operations (logical,arithmetic, temporal,…). Large sets ofhistories can then be aggregatedthrough Monte-Carlo techniques, e.g.to explore the procurement policiesthat are able to best address the identi-fied risks. Figure 1 illustrates a typicalrisk-oriented model for a complexassembly process.
oscaR, an open Source Toolbox for optimising
Logistics and Supply Chain Systems
by Renaud De Landtsheer, Christophe Ponsard and Yoann Guyot, CETIC
The efficient operation of logistics and supply chain systems requires businesses to solve large and
complex optimisation problems such as production planning, fleet management and order picking.
The OscaR Open Source framework supports the optimisation of such problems through a variety of
powerful solvers offering various expressivity, optimality, and scalability trade-offs.
Figure�2:�Library�of�reusable�VRP�problem�elements.
Figure�1:�Supply�chain�model�for�a�complex�assembly.
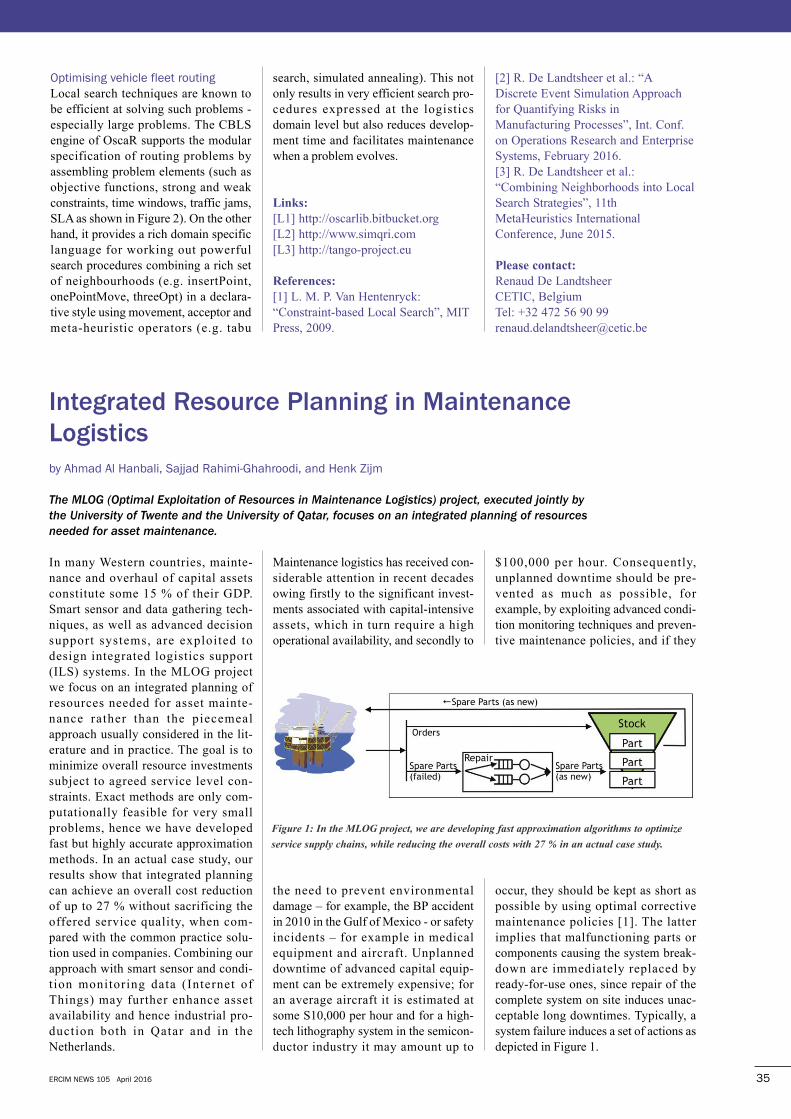
Optimising vehicle fleet routingLocal search techniques are known tobe efficient at solving such problems -especially large problems. The CBLSengine of OscaR supports the modularspecification of routing problems byassembling problem elements (such asobjective functions, strong and weakconstraints, time windows, traffic jams,SLA as shown in Figure 2). On the otherhand, it provides a rich domain specificlanguage for working out powerfulsearch procedures combining a rich setof neighbourhoods (e.g. insertPoint,onePointMove, threeOpt) in a declara-tive style using movement, acceptor andmeta-heuristic operators (e.g. tabu
search, simulated annealing). This notonly results in very efficient search pro-cedures expressed at the logisticsdomain level but also reduces develop-ment time and facilitates maintenancewhen a problem evolves.
Links:
[L1] http://oscarlib.bitbucket.org[L2] http://www.simqri.com [L3] http://tango-project.eu
References:
[1] L. M. P. Van Hentenryck:“Constraint-based Local Search”, MITPress, 2009.
[2] R. De Landtsheer et al.: “ADiscrete Event Simulation Approachfor Quantifying Risks inManufacturing Processes”, Int. Conf.on Operations Research and EnterpriseSystems, February 2016.[3] R. De Landtsheer et al.:“Combining Neighborhoods into LocalSearch Strategies”, 11thMetaHeuristics InternationalConference, June 2015.
Please contact:
Renaud De LandtsheerCETIC, BelgiumTel: +32 472 56 90 [email protected]
ERCIM NEWS 105 April 2016 35
In many Western countries, mainte-nance and overhaul of capital assetsconstitute some 15 % of their GDP.Smart sensor and data gathering tech-niques, as well as advanced decisionsupport systems, are exploited todesign integrated logistics support(ILS) systems. In the MLOG projectwe focus on an integrated planning ofresources needed for asset mainte-nance rather than the piecemealapproach usually considered in the lit-erature and in practice. The goal is tominimize overall resource investmentssubject to agreed service level con-straints. Exact methods are only com-putationally feasible for very smallproblems, hence we have developedfast but highly accurate approximationmethods. In an actual case study, ourresults show that integrated planningcan achieve an overall cost reductionof up to 27 % without sacrificing theoffered service quality, when com-pared with the common practice solu-tion used in companies. Combining ourapproach with smart sensor and condi-t ion monitoring data (Internet ofThings) may further enhance assetavailability and hence industrial pro-duction both in Qatar and in theNetherlands.
Maintenance logistics has received con-siderable attention in recent decadesowing firstly to the significant invest-ments associated with capital-intensiveassets, which in turn require a highoperational availability, and secondly to
the need to prevent environmentaldamage – for example, the BP accidentin 2010 in the Gulf of Mexico - or safetyincidents – for example in medicalequipment and aircraft. Unplanneddowntime of advanced capital equip-ment can be extremely expensive; foran average aircraft it is estimated atsome S10,000 per hour and for a high-tech lithography system in the semicon-ductor industry it may amount up to
$100,000 per hour. Consequently,unplanned downtime should be pre-vented as much as possible, forexample, by exploiting advanced condi-tion monitoring techniques and preven-tive maintenance policies, and if they
occur, they should be kept as short aspossible by using optimal correctivemaintenance policies [1]. The latterimplies that malfunctioning parts orcomponents causing the system break-down are immediately replaced byready-for-use ones, since repair of thecomplete system on site induces unac-ceptable long downtimes. Typically, asystem failure induces a set of actions asdepicted in Figure 1.
Integrated Resource Planning in Maintenance
Logistics
by Ahmad Al Hanbali, Sajjad Rahimi-Ghahroodi, and Henk Zijm
The MLOG (Optimal Exploitation of Resources in Maintenance Logistics) project, executed jointly by
the University of Twente and the University of Qatar, focuses on an integrated planning of resources
needed for asset maintenance.
Figure�1:�In�the�MLOG�project,�we�are�developing�fast�approximation�algorithms�to�optimize
service�supply�chains,�while�reducing�the�overall�costs�with�27�%�in�an�actual�case�study.�
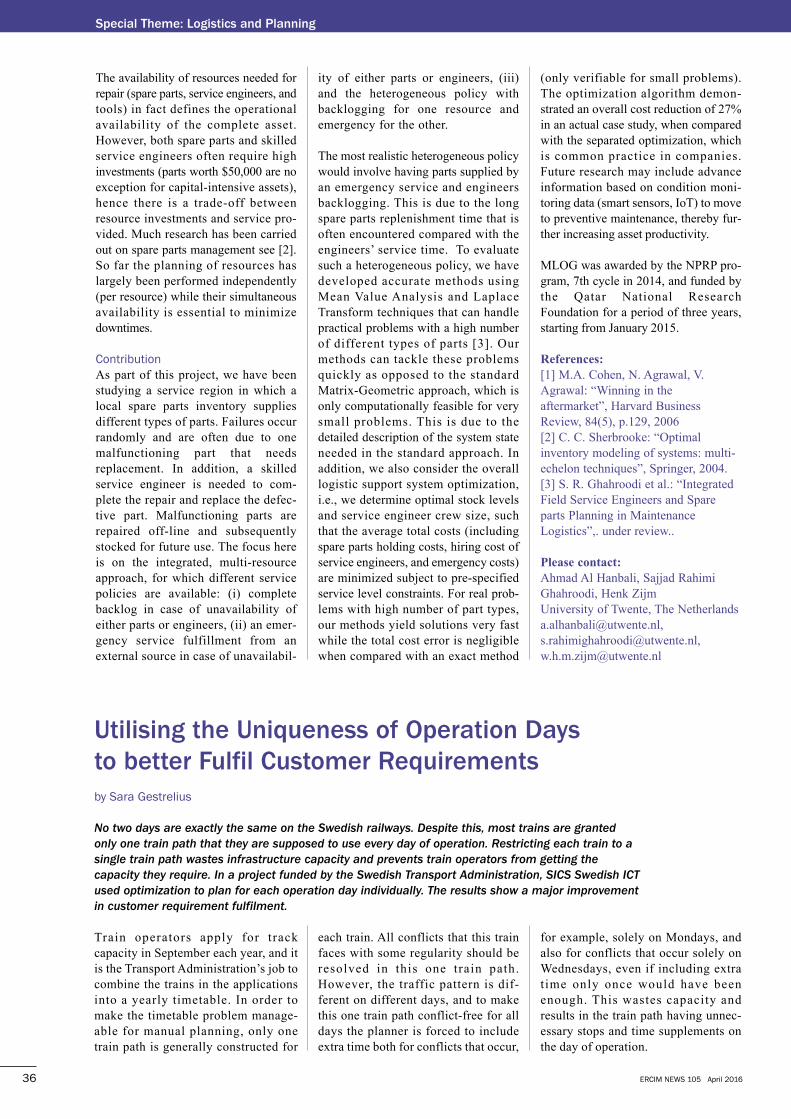
ERCIM NEWS 105 April 201636
Special Theme: Logistics and Planning
The availability of resources needed forrepair (spare parts, service engineers, andtools) in fact defines the operationalavailability of the complete asset.However, both spare parts and skilledservice engineers often require highinvestments (parts worth $50,000 are noexception for capital-intensive assets),hence there is a trade-off betweenresource investments and service pro-vided. Much research has been carriedout on spare parts management see [2].So far the planning of resources haslargely been performed independently(per resource) while their simultaneousavailability is essential to minimizedowntimes.
ContributionAs part of this project, we have beenstudying a service region in which alocal spare parts inventory suppliesdifferent types of parts. Failures occurrandomly and are often due to onemalfunctioning part that needsreplacement. In addition, a skilledservice engineer is needed to com-plete the repair and replace the defec-tive part. Malfunctioning parts arerepaired off-line and subsequentlystocked for future use. The focus hereis on the integrated, multi-resourceapproach, for which different servicepolicies are available: (i) completebacklog in case of unavailability ofeither parts or engineers, (ii) an emer-gency service fulfillment from anexternal source in case of unavailabil-
ity of either parts or engineers, (iii)and the heterogeneous policy withbacklogging for one resource andemergency for the other.
The most realistic heterogeneous policywould involve having parts supplied byan emergency service and engineersbacklogging. This is due to the longspare parts replenishment time that isoften encountered compared with theengineers’ service time. To evaluatesuch a heterogeneous policy, we havedeveloped accurate methods usingMean Value Analysis and LaplaceTransform techniques that can handlepractical problems with a high numberof different types of parts [3]. Ourmethods can tackle these problemsquickly as opposed to the standardMatrix-Geometric approach, which isonly computationally feasible for verysmall problems. This is due to thedetailed description of the system stateneeded in the standard approach. Inaddition, we also consider the overalllogistic support system optimization,i.e., we determine optimal stock levelsand service engineer crew size, suchthat the average total costs (includingspare parts holding costs, hiring cost ofservice engineers, and emergency costs)are minimized subject to pre-specifiedservice level constraints. For real prob-lems with high number of part types,our methods yield solutions very fastwhile the total cost error is negligiblewhen compared with an exact method
(only verifiable for small problems).The optimization algorithm demon-strated an overall cost reduction of 27%in an actual case study, when comparedwith the separated optimization, whichis common practice in companies.Future research may include advanceinformation based on condition moni-toring data (smart sensors, IoT) to moveto preventive maintenance, thereby fur-ther increasing asset productivity.
MLOG was awarded by the NPRP pro-gram, 7th cycle in 2014, and funded bythe Qatar National ResearchFoundation for a period of three years,starting from January 2015.
References:
[1] M.A. Cohen, N. Agrawal, V.Agrawal: “Winning in theaftermarket”, Harvard BusinessReview, 84(5), p.129, 2006[2] C. C. Sherbrooke: “Optimalinventory modeling of systems: multi-echelon techniques”, Springer, 2004.[3] S. R. Ghahroodi et al.: “IntegratedField Service Engineers and Spareparts Planning in MaintenanceLogistics”,. under review..
Please contact:
Ahmad Al Hanbali, Sajjad RahimiGhahroodi, Henk ZijmUniversity of Twente, The [email protected],[email protected],[email protected]
Train operators apply for trackcapacity in September each year, and itis the Transport Administration’s job tocombine the trains in the applicationsinto a yearly timetable. In order tomake the timetable problem manage-able for manual planning, only onetrain path is generally constructed for
each train. All conflicts that this trainfaces with some regularity should beresolved in this one train path.However, the traffic pattern is dif-ferent on different days, and to makethis one train path conflict-free for alldays the planner is forced to includeextra time both for conflicts that occur,
for example, solely on Mondays, andalso for conflicts that occur solely onWednesdays, even if including extratime only once would have beenenough. This wastes capacity andresults in the train path having unnec-essary stops and time supplements onthe day of operation.
Utilising the Uniqueness of operation days
to better fulfil Customer Requirements
by Sara Gestrelius
No two days are exactly the same on the Swedish railways. Despite this, most trains are granted
only one train path that they are supposed to use every day of operation. Restricting each train to a
single train path wastes infrastructure capacity and prevents train operators from getting the
capacity they require. In a project funded by the Swedish Transport Administration, SICS Swedish ICT
used optimization to plan for each operation day individually. The results show a major improvement
in customer requirement fulfilment.
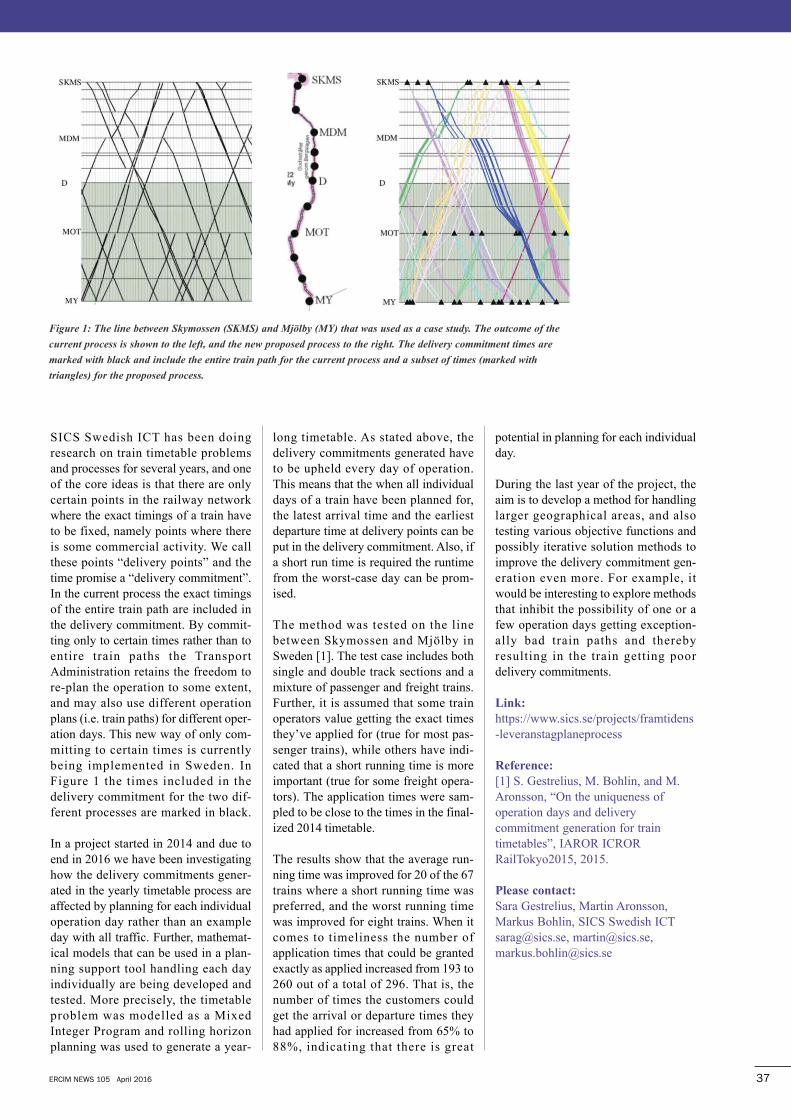
SICS Swedish ICT has been doingresearch on train timetable problemsand processes for several years, and oneof the core ideas is that there are onlycertain points in the railway networkwhere the exact timings of a train haveto be fixed, namely points where thereis some commercial activity. We callthese points “delivery points” and thetime promise a “delivery commitment”.In the current process the exact timingsof the entire train path are included inthe delivery commitment. By commit-ting only to certain times rather than toentire train paths the TransportAdministration retains the freedom tore-plan the operation to some extent,and may also use different operationplans (i.e. train paths) for different oper-ation days. This new way of only com-mitting to certain times is currentlybeing implemented in Sweden. InFigure 1 the times included in thedelivery commitment for the two dif-ferent processes are marked in black.
In a project started in 2014 and due toend in 2016 we have been investigatinghow the delivery commitments gener-ated in the yearly timetable process areaffected by planning for each individualoperation day rather than an exampleday with all traffic. Further, mathemat-ical models that can be used in a plan-ning support tool handling each dayindividually are being developed andtested. More precisely, the timetableproblem was modelled as a MixedInteger Program and rolling horizonplanning was used to generate a year-
long timetable. As stated above, thedelivery commitments generated haveto be upheld every day of operation.This means that the when all individualdays of a train have been planned for,the latest arrival time and the earliestdeparture time at delivery points can beput in the delivery commitment. Also, ifa short run time is required the runtimefrom the worst-case day can be prom-ised.
The method was tested on the linebetween Skymossen and Mjölby inSweden [1]. The test case includes bothsingle and double track sections and amixture of passenger and freight trains.Further, it is assumed that some trainoperators value getting the exact timesthey’ve applied for (true for most pas-senger trains), while others have indi-cated that a short running time is moreimportant (true for some freight opera-tors). The application times were sam-pled to be close to the times in the final-ized 2014 timetable.
The results show that the average run-ning time was improved for 20 of the 67trains where a short running time waspreferred, and the worst running timewas improved for eight trains. When itcomes to timeliness the number ofapplication times that could be grantedexactly as applied increased from 193 to260 out of a total of 296. That is, thenumber of times the customers couldget the arrival or departure times theyhad applied for increased from 65% to88%, indicating that there is great
potential in planning for each individualday.
During the last year of the project, theaim is to develop a method for handlinglarger geographical areas, and alsotesting various objective functions andpossibly iterative solution methods toimprove the delivery commitment gen-eration even more. For example, itwould be interesting to explore methodsthat inhibit the possibility of one or afew operation days getting exception-ally bad train paths and therebyresulting in the train getting poordelivery commitments.
Link:
https://www.sics.se/projects/framtidens-leveranstagplaneprocess
Reference:
[1] S. Gestrelius, M. Bohlin, and M.Aronsson, “On the uniqueness ofoperation days and deliverycommitment generation for traintimetables”, IAROR ICRORRailTokyo2015, 2015.
Please contact:
Sara Gestrelius, Martin Aronsson,Markus Bohlin, SICS Swedish [email protected], [email protected],[email protected]
ERCIM NEWS 105 April 2016 37
Figure�1:�The�line�between�Skymossen�(SKMS)�and�Mjölby�(MY)�that�was�used�as�a�case�study.�The�outcome�of�the
current�process�is�shown�to�the�left,�and�the�new�proposed�process�to�the�right.�The�delivery�commitment�times�are
marked�with�black�and�include�the�entire�train�path�for�the�current�process�and�a�subset�of�times�(marked�with
triangles)�for�the�proposed�process.
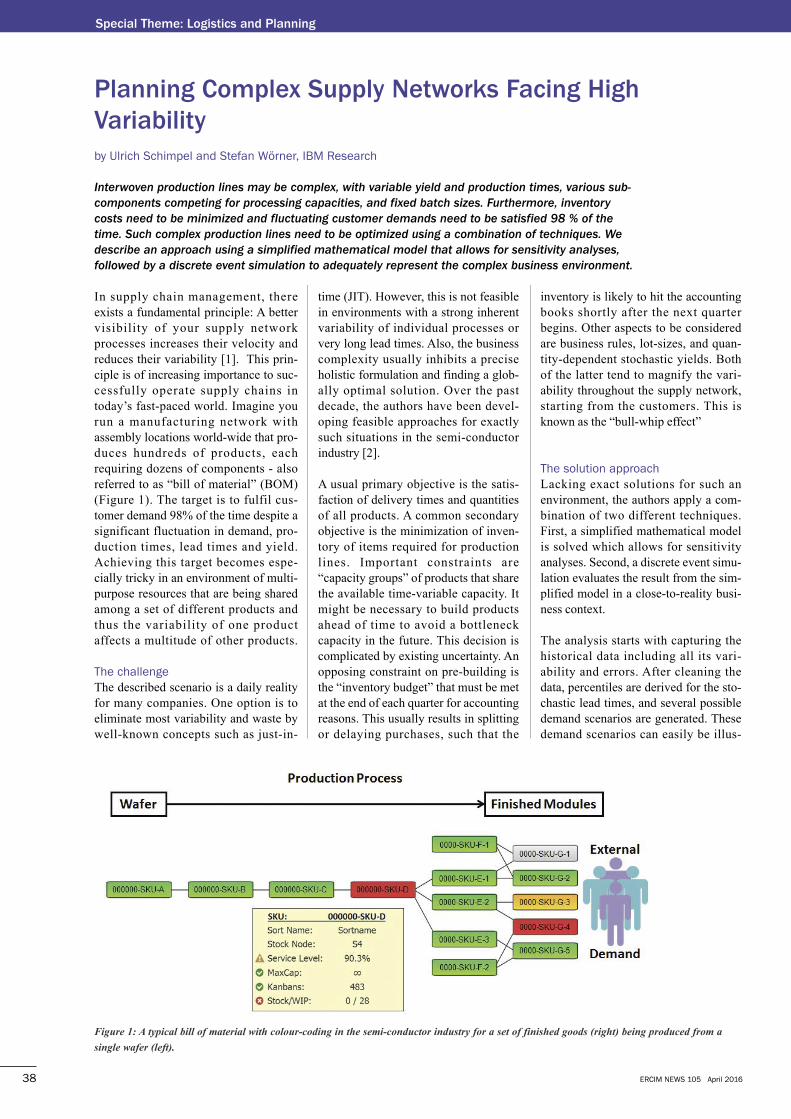
ERCIM NEWS 105 April 201638
Special Theme: Logistics and Planning
In supply chain management, thereexists a fundamental principle: A bettervisibility of your supply networkprocesses increases their velocity andreduces their variability [1]. This prin-ciple is of increasing importance to suc-cessfully operate supply chains intoday’s fast-paced world. Imagine yourun a manufacturing network withassembly locations world-wide that pro-duces hundreds of products, eachrequiring dozens of components - alsoreferred to as “bill of material” (BOM)(Figure 1). The target is to fulfil cus-tomer demand 98% of the time despite asignificant fluctuation in demand, pro-duction times, lead times and yield.Achieving this target becomes espe-cially tricky in an environment of multi-purpose resources that are being sharedamong a set of different products andthus the variability of one productaffects a multitude of other products.
The challengeThe described scenario is a daily realityfor many companies. One option is toeliminate most variability and waste bywell-known concepts such as just-in-
time (JIT). However, this is not feasiblein environments with a strong inherentvariability of individual processes orvery long lead times. Also, the businesscomplexity usually inhibits a preciseholistic formulation and finding a glob-ally optimal solution. Over the pastdecade, the authors have been devel-oping feasible approaches for exactlysuch situations in the semi-conductorindustry [2].
A usual primary objective is the satis-faction of delivery times and quantitiesof all products. A common secondaryobjective is the minimization of inven-tory of items required for productionlines. Important constraints are“capacity groups” of products that sharethe available time-variable capacity. Itmight be necessary to build productsahead of time to avoid a bottleneckcapacity in the future. This decision iscomplicated by existing uncertainty. Anopposing constraint on pre-building isthe “inventory budget” that must be metat the end of each quarter for accountingreasons. This usually results in splittingor delaying purchases, such that the
inventory is likely to hit the accountingbooks shortly after the next quarterbegins. Other aspects to be consideredare business rules, lot-sizes, and quan-tity-dependent stochastic yields. Bothof the latter tend to magnify the vari-ability throughout the supply network,starting from the customers. This isknown as the “bull-whip effect”
The solution approachLacking exact solutions for such anenvironment, the authors apply a com-bination of two different techniques.First, a simplified mathematical modelis solved which allows for sensitivityanalyses. Second, a discrete event simu-lation evaluates the result from the sim-plified model in a close-to-reality busi-ness context.
The analysis starts with capturing thehistorical data including all its vari-ability and errors. After cleaning thedata, percentiles are derived for the sto-chastic lead times, and several possibledemand scenarios are generated. Thesedemand scenarios can easily be illus-
Planning Complex Supply Networks facing High
Variability
by Ulrich Schimpel and Stefan Wörner, IBM Research
Interwoven production lines may be complex, with variable yield and production times, various sub-
components competing for processing capacities, and fixed batch sizes. Furthermore, inventory
costs need to be minimized and fluctuating customer demands need to be satisfied 98 % of the
time. Such complex production lines need to be optimized using a combination of techniques. We
describe an approach using a simplified mathematical model that allows for sensitivity analyses,
followed by a discrete event simulation to adequately represent the complex business environment.
Figure�1:�A�typical�bill�of�material�with�colour-coding�in�the�semi-conductor�industry�for�a�set�of�finished�goods�(right)�being�produced�from�a
single�wafer�(left).
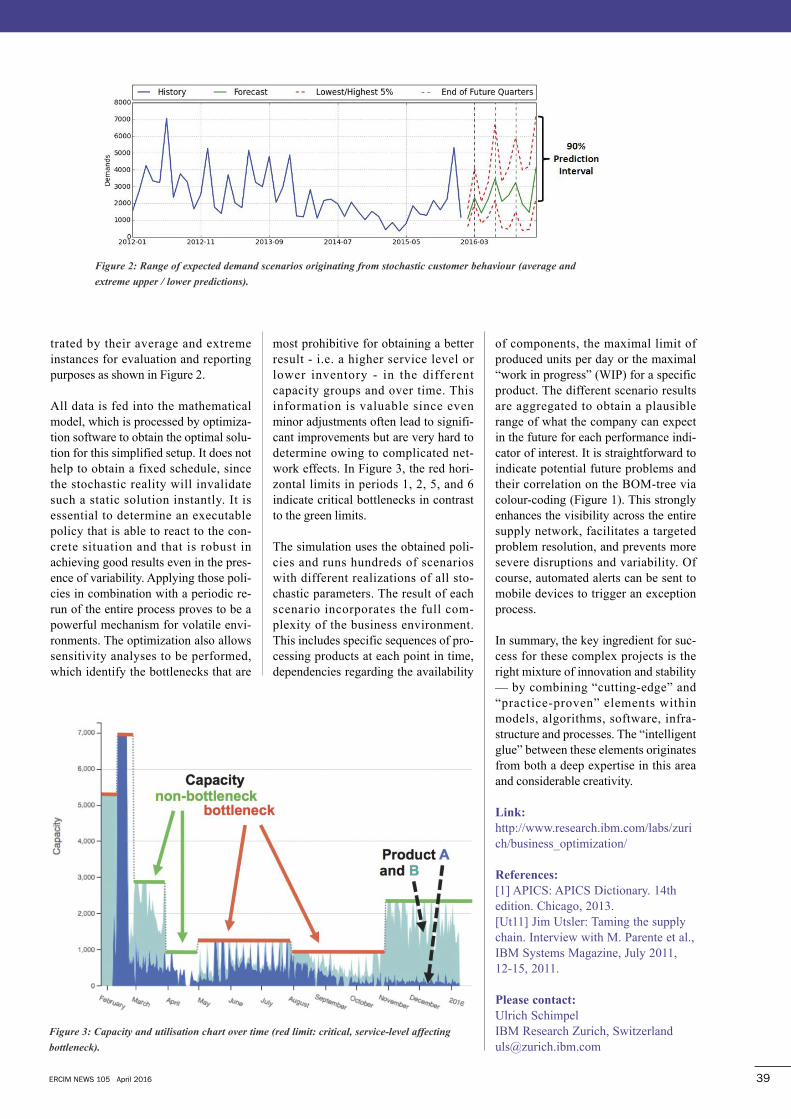
ERCIM NEWS 105 April 2016 39
trated by their average and extremeinstances for evaluation and reportingpurposes as shown in Figure 2.
All data is fed into the mathematicalmodel, which is processed by optimiza-tion software to obtain the optimal solu-tion for this simplified setup. It does nothelp to obtain a fixed schedule, sincethe stochastic reality will invalidatesuch a static solution instantly. It isessential to determine an executablepolicy that is able to react to the con-crete situation and that is robust inachieving good results even in the pres-ence of variability. Applying those poli-cies in combination with a periodic re-run of the entire process proves to be apowerful mechanism for volatile envi-ronments. The optimization also allowssensitivity analyses to be performed,which identify the bottlenecks that are
most prohibitive for obtaining a betterresult - i.e. a higher service level orlower inventory - in the differentcapacity groups and over time. Thisinformation is valuable since evenminor adjustments often lead to signifi-cant improvements but are very hard todetermine owing to complicated net-work effects. In Figure 3, the red hori-zontal limits in periods 1, 2, 5, and 6indicate critical bottlenecks in contrastto the green limits.
The simulation uses the obtained poli-cies and runs hundreds of scenarioswith different realizations of all sto-chastic parameters. The result of eachscenario incorporates the full com-plexity of the business environment.This includes specific sequences of pro-cessing products at each point in time,dependencies regarding the availability
of components, the maximal limit ofproduced units per day or the maximal“work in progress” (WIP) for a specificproduct. The different scenario resultsare aggregated to obtain a plausiblerange of what the company can expectin the future for each performance indi-cator of interest. It is straightforward toindicate potential future problems andtheir correlation on the BOM-tree viacolour-coding (Figure 1). This stronglyenhances the visibility across the entiresupply network, facilitates a targetedproblem resolution, and prevents moresevere disruptions and variability. Ofcourse, automated alerts can be sent tomobile devices to trigger an exceptionprocess.
In summary, the key ingredient for suc-cess for these complex projects is theright mixture of innovation and stability— by combining “cutting-edge” and“practice-proven” elements withinmodels, algorithms, software, infra-structure and processes. The “intelligentglue” between these elements originatesfrom both a deep expertise in this areaand considerable creativity.
Link:
http://www.research.ibm.com/labs/zurich/business_optimization/
References:
[1] APICS: APICS Dictionary. 14thedition. Chicago, 2013.[Ut11] Jim Utsler: Taming the supplychain. Interview with M. Parente et al.,IBM Systems Magazine, July 2011,12-15, 2011.
Please contact:
Ulrich SchimpelIBM Research Zurich, [email protected]
Figure�2:�Range�of�expected�demand�scenarios�originating�from�stochastic�customer�behaviour�(average�and
extreme�upper�/�lower�predictions).
Figure�3:�Capacity�and�utilisation�chart�over�time�(red�limit:�critical,�service-level�affecting
bottleneck).
ERCIM NEWS 105 April 2016
Business Process
Execution Analysis
through Coverage-based
Monitoring
by Antonello Calabrò, Francesca Lonetti, Eda Marchetti,ISTI-CNR
Nowadays, Business Process Model and Notation
(BPMN) represents the de facto standard language for
creating a description of processes and then developing
executable frameworks for the overall planning and
management of these processes. We describe a
methodology for the development of execution
adequacy criteria able to identify the main entities of
the business process that are covered during execution,
and to issue a warning if some entities are not covered.
The monitoring of business process execution is crucial notonly for business process management and validation but alsofor performance analysis and optimization. When assessingthe thoroughness of a business process execution it is impor-tant to identify entities that have not been observed for sometime and to be able to check whether something is goingwrong. Existing work in this field focuses on monitoring andanalyzing the factors that influence the performance of busi-ness processes. Key performance indicators (KPIs), includingtime-based and cost-based parameters, are defined togetherwith their target values based on the business goals.
The aim of our approach is to use monitoring facilities inorder to measure the adequacy of the business process execu-tion, identifying the entities that should be covered (activi-ties, connection objects, swimlanes, etc.), assessing whatpercentage has been covered, and issuing a warning if someentities are not covered. These coverage-based businessprocess execution adequacy measures make it possible, onthe one hand, to detect unexpected behavior or securityflaws in the business process execution and, on the other, toimprove business process planning and performance opti-mization. This idea has been inspired by coverage-based testadequacy, which has been extensively studied in softwaretesting, e.g. referring to the coverage of entities in the pro-gram control-flow or data-flow, and nowadays constitutes afundamental instrument for test suite evaluation.
The main components of the monitoring framework thatmeasures the business process execution adequacy are:
• BPMN Path Explorer: This component explores and savesall the possible entities (Activity Entity, Sequence FlowEntity, Path Entity) reachable on a BPMN.
• Complex Event Processor (CEP): This is the rule enginethat analyzes the events generated by the business processexecution and correlates them to detect patterns in order tomonitor the business process execution adequacy.
European
Research
and
Innovation
Research and Innovation
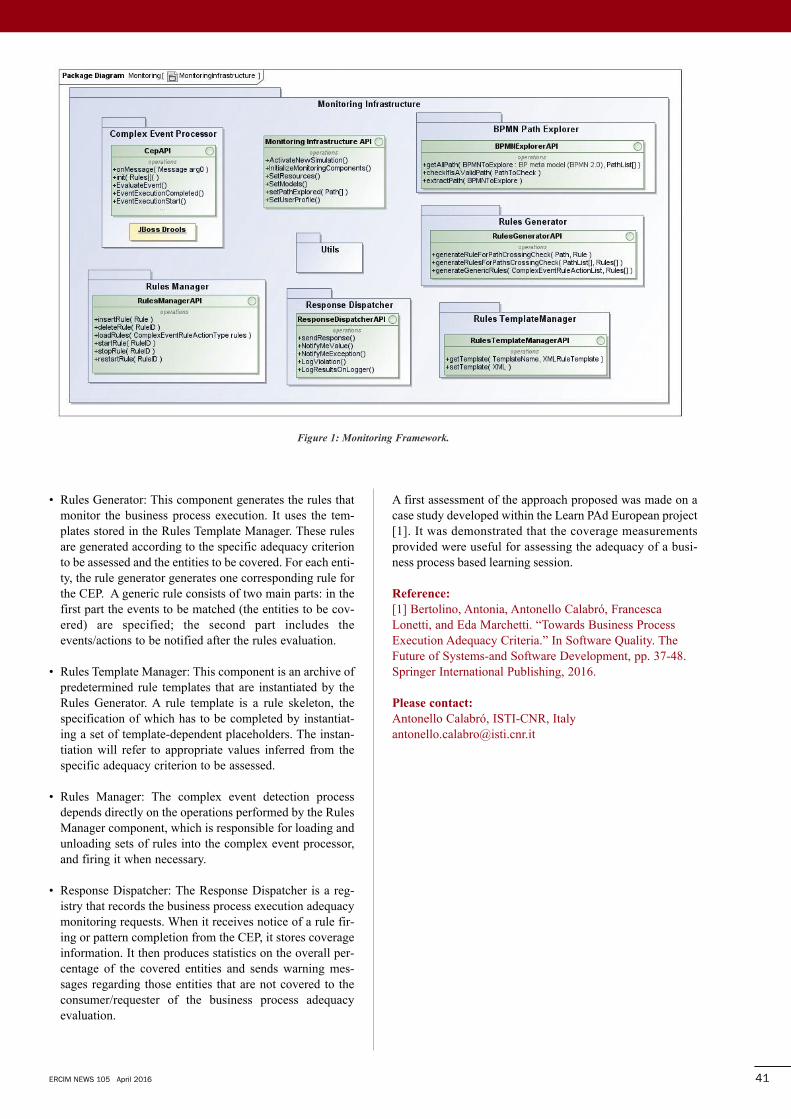
41
A first assessment of the approach proposed was made on acase study developed within the Learn PAd European project[1]. It was demonstrated that the coverage measurementsprovided were useful for assessing the adequacy of a busi-ness process based learning session.
Reference:
[1] Bertolino, Antonia, Antonello Calabró, FrancescaLonetti, and Eda Marchetti. “Towards Business ProcessExecution Adequacy Criteria.” In Software Quality. TheFuture of Systems-and Software Development, pp. 37-48.Springer International Publishing, 2016.
Please contact:
Antonello Calabró, ISTI-CNR, [email protected]
• Rules Generator: This component generates the rules thatmonitor the business process execution. It uses the tem-plates stored in the Rules Template Manager. These rulesare generated according to the specific adequacy criterionto be assessed and the entities to be covered. For each enti-ty, the rule generator generates one corresponding rule forthe CEP. A generic rule consists of two main parts: in thefirst part the events to be matched (the entities to be cov-ered) are specified; the second part includes theevents/actions to be notified after the rules evaluation.
• Rules Template Manager: This component is an archive ofpredetermined rule templates that are instantiated by theRules Generator. A rule template is a rule skeleton, thespecification of which has to be completed by instantiat-ing a set of template-dependent placeholders. The instan-tiation will refer to appropriate values inferred from thespecific adequacy criterion to be assessed.
• Rules Manager: The complex event detection processdepends directly on the operations performed by the RulesManager component, which is responsible for loading andunloading sets of rules into the complex event processor,and firing it when necessary.
• Response Dispatcher: The Response Dispatcher is a reg-istry that records the business process execution adequacymonitoring requests. When it receives notice of a rule fir-ing or pattern completion from the CEP, it stores coverageinformation. It then produces statistics on the overall per-centage of the covered entities and sends warning mes-sages regarding those entities that are not covered to theconsumer/requester of the business process adequacyevaluation.
ERCIM NEWS 105 April 2016
Figure�1:�Monitoring�Framework.
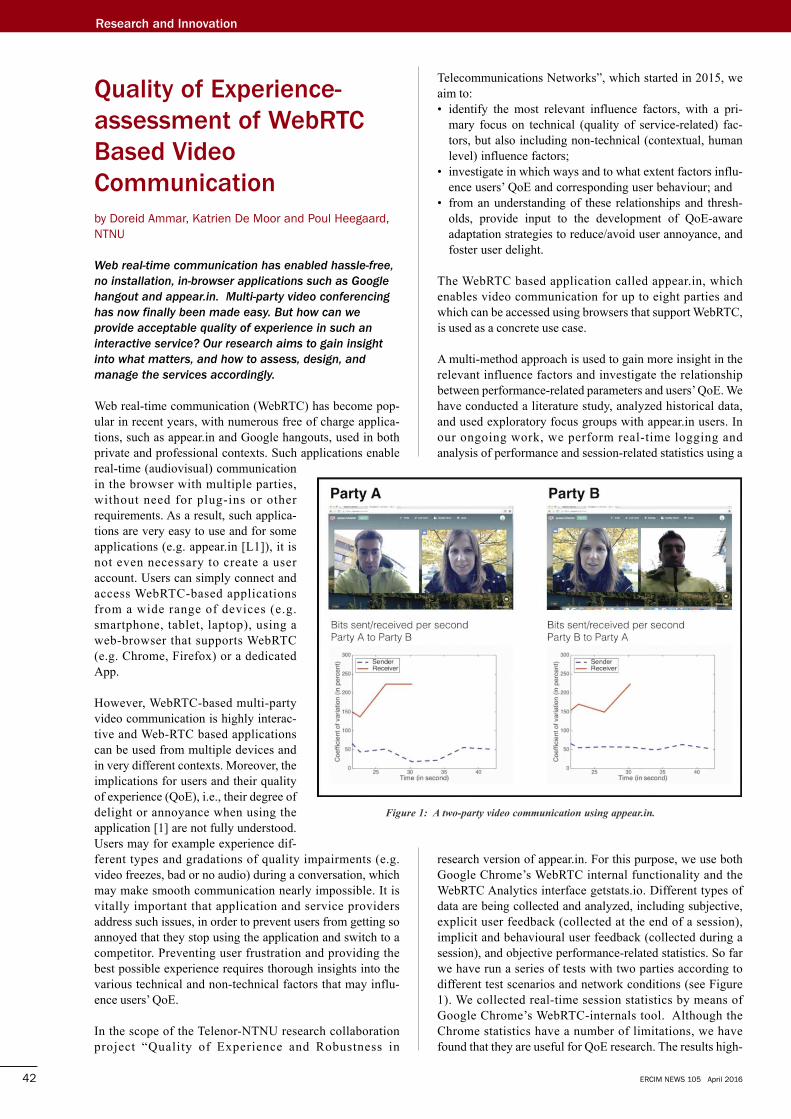
Research and Innovation
Quality of Experience-
assessment of WebRTC
Based Video
Communication
by Doreid Ammar, Katrien De Moor and Poul Heegaard,NTNU
Web real-time communication has enabled hassle-free,
no installation, in-browser applications such as Google
hangout and appear.in. Multi-party video conferencing
has now finally been made easy. But how can we
provide acceptable quality of experience in such an
interactive service? Our research aims to gain insight
into what matters, and how to assess, design, and
manage the services accordingly.
Web real-time communication (WebRTC) has become pop-ular in recent years, with numerous free of charge applica-tions, such as appear.in and Google hangouts, used in bothprivate and professional contexts. Such applications enablereal-time (audiovisual) communicationin the browser with multiple parties,without need for plug-ins or otherrequirements. As a result, such applica-tions are very easy to use and for someapplications (e.g. appear.in [L1]), it isnot even necessary to create a useraccount. Users can simply connect andaccess WebRTC-based applicationsfrom a wide range of devices (e.g.smartphone, tablet, laptop), using aweb-browser that supports WebRTC(e.g. Chrome, Firefox) or a dedicatedApp.
However, WebRTC-based multi-partyvideo communication is highly interac-tive and Web-RTC based applicationscan be used from multiple devices andin very different contexts. Moreover, theimplications for users and their qualityof experience (QoE), i.e., their degree ofdelight or annoyance when using theapplication [1] are not fully understood.Users may for example experience dif-ferent types and gradations of quality impairments (e.g.video freezes, bad or no audio) during a conversation, whichmay make smooth communication nearly impossible. It isvitally important that application and service providersaddress such issues, in order to prevent users from getting soannoyed that they stop using the application and switch to acompetitor. Preventing user frustration and providing thebest possible experience requires thorough insights into thevarious technical and non-technical factors that may influ-ence users’ QoE.
In the scope of the Telenor-NTNU research collaborationproject “Quality of Experience and Robustness in
Telecommunications Networks”, which started in 2015, weaim to:• identify the most relevant influence factors, with a pri-
mary focus on technical (quality of service-related) fac-tors, but also including non-technical (contextual, humanlevel) influence factors;
• investigate in which ways and to what extent factors influ-ence users’ QoE and corresponding user behaviour; and
• from an understanding of these relationships and thresh-olds, provide input to the development of QoE-awareadaptation strategies to reduce/avoid user annoyance, andfoster user delight.
The WebRTC based application called appear.in, whichenables video communication for up to eight parties andwhich can be accessed using browsers that support WebRTC,is used as a concrete use case.
A multi-method approach is used to gain more insight in therelevant influence factors and investigate the relationshipbetween performance-related parameters and users’ QoE. Wehave conducted a literature study, analyzed historical data,and used exploratory focus groups with appear.in users. Inour ongoing work, we perform real-time logging andanalysis of performance and session-related statistics using a
research version of appear.in. For this purpose, we use bothGoogle Chrome’s WebRTC internal functionality and theWebRTC Analytics interface getstats.io. Different types ofdata are being collected and analyzed, including subjective,explicit user feedback (collected at the end of a session),implicit and behavioural user feedback (collected during asession), and objective performance-related statistics. So farwe have run a series of tests with two parties according todifferent test scenarios and network conditions (see Figure1). We collected real-time session statistics by means ofGoogle Chrome’s WebRTC-internals tool. Although theChrome statistics have a number of limitations, we havefound that they are useful for QoE research. The results high-
ERCIM NEWS 105 April 201642
Figure�1:��A�two-party�video�communication�using�appear.in.
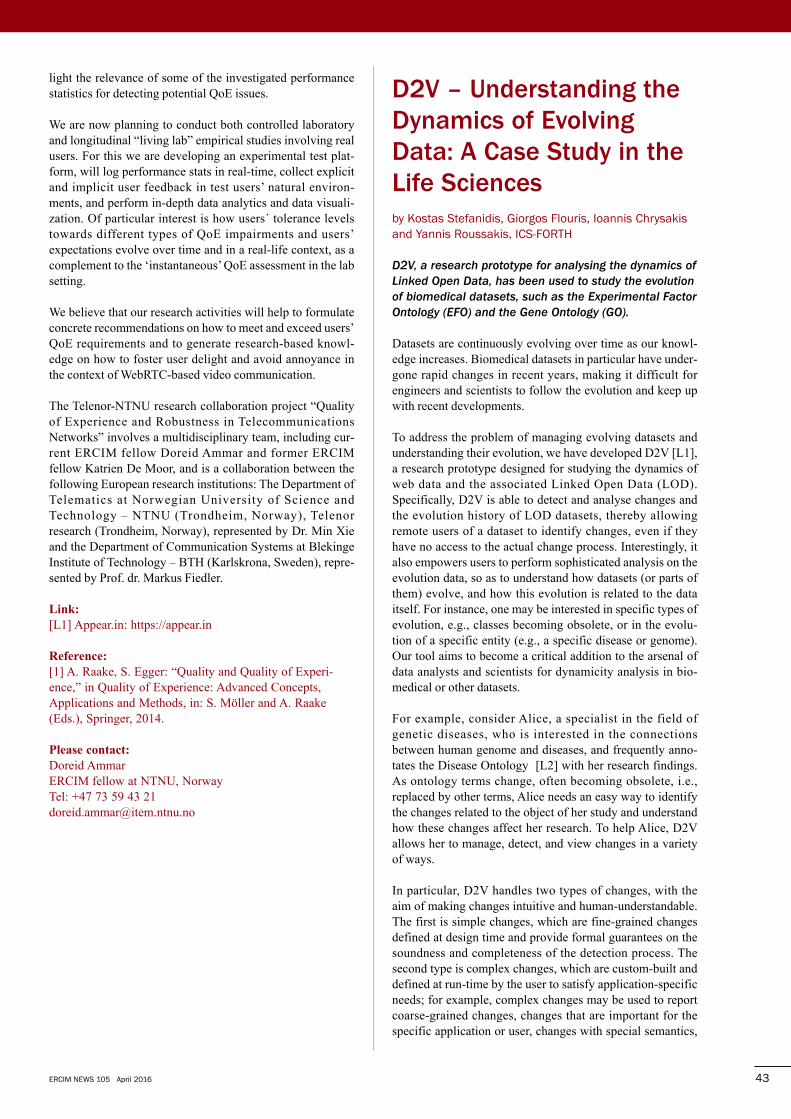
ERCIM NEWS 105 April 2016
light the relevance of some of the investigated performancestatistics for detecting potential QoE issues.
We are now planning to conduct both controlled laboratoryand longitudinal “living lab” empirical studies involving realusers. For this we are developing an experimental test plat-form, will log performance stats in real-time, collect explicitand implicit user feedback in test users’ natural environ-ments, and perform in-depth data analytics and data visuali-zation. Of particular interest is how users´ tolerance levelstowards different types of QoE impairments and users’expectations evolve over time and in a real-life context, as acomplement to the ‘instantaneous’ QoE assessment in the labsetting.
We believe that our research activities will help to formulateconcrete recommendations on how to meet and exceed users’QoE requirements and to generate research-based knowl-edge on how to foster user delight and avoid annoyance inthe context of WebRTC-based video communication.
The Telenor-NTNU research collaboration project “Qualityof Experience and Robustness in TelecommunicationsNetworks” involves a multidisciplinary team, including cur-rent ERCIM fellow Doreid Ammar and former ERCIMfellow Katrien De Moor, and is a collaboration between thefollowing European research institutions: The Department ofTelematics at Norwegian University of Science andTechnology – NTNU (Trondheim, Norway), Telenorresearch (Trondheim, Norway), represented by Dr. Min Xieand the Department of Communication Systems at BlekingeInstitute of Technology – BTH (Karlskrona, Sweden), repre-sented by Prof. dr. Markus Fiedler.
Link:
[L1] Appear.in: https://appear.in
Reference:
[1] A. Raake, S. Egger: “Quality and Quality of Experi-ence,” in Quality of Experience: Advanced Concepts,Applications and Methods, in: S. Möller and A. Raake(Eds.), Springer, 2014.
Please contact:
Doreid AmmarERCIM fellow at NTNU, NorwayTel: +47 73 59 43 [email protected]
43
d2V – Understanding the
dynamics of Evolving
data: A Case Study in the
Life Sciences
by Kostas Stefanidis, Giorgos Flouris, Ioannis Chrysakisand Yannis Roussakis, ICS-FORTH
D2V, a research prototype for analysing the dynamics of
Linked Open Data, has been used to study the evolution
of biomedical datasets, such as the Experimental Factor
Ontology (EFO) and the Gene Ontology (GO).
Datasets are continuously evolving over time as our knowl-edge increases. Biomedical datasets in particular have under-gone rapid changes in recent years, making it difficult forengineers and scientists to follow the evolution and keep upwith recent developments.
To address the problem of managing evolving datasets andunderstanding their evolution, we have developed D2V [L1],a research prototype designed for studying the dynamics ofweb data and the associated Linked Open Data (LOD).Specifically, D2V is able to detect and analyse changes andthe evolution history of LOD datasets, thereby allowingremote users of a dataset to identify changes, even if theyhave no access to the actual change process. Interestingly, italso empowers users to perform sophisticated analysis on theevolution data, so as to understand how datasets (or parts ofthem) evolve, and how this evolution is related to the dataitself. For instance, one may be interested in specific types ofevolution, e.g., classes becoming obsolete, or in the evolu-tion of a specific entity (e.g., a specific disease or genome).Our tool aims to become a critical addition to the arsenal ofdata analysts and scientists for dynamicity analysis in bio-medical or other datasets.
For example, consider Alice, a specialist in the field ofgenetic diseases, who is interested in the connectionsbetween human genome and diseases, and frequently anno-tates the Disease Ontology [L2] with her research findings.As ontology terms change, often becoming obsolete, i.e.,replaced by other terms, Alice needs an easy way to identifythe changes related to the object of her study and understandhow these changes affect her research. To help Alice, D2Vallows her to manage, detect, and view changes in a varietyof ways.
In particular, D2V handles two types of changes, with theaim of making changes intuitive and human-understandable.The first is simple changes, which are fine-grained changesdefined at design time and provide formal guarantees on thesoundness and completeness of the detection process. Thesecond type is complex changes, which are custom-built anddefined at run-time by the user to satisfy application-specificneeds; for example, complex changes may be used to reportcoarse-grained changes, changes that are important for thespecific application or user, changes with special semantics,
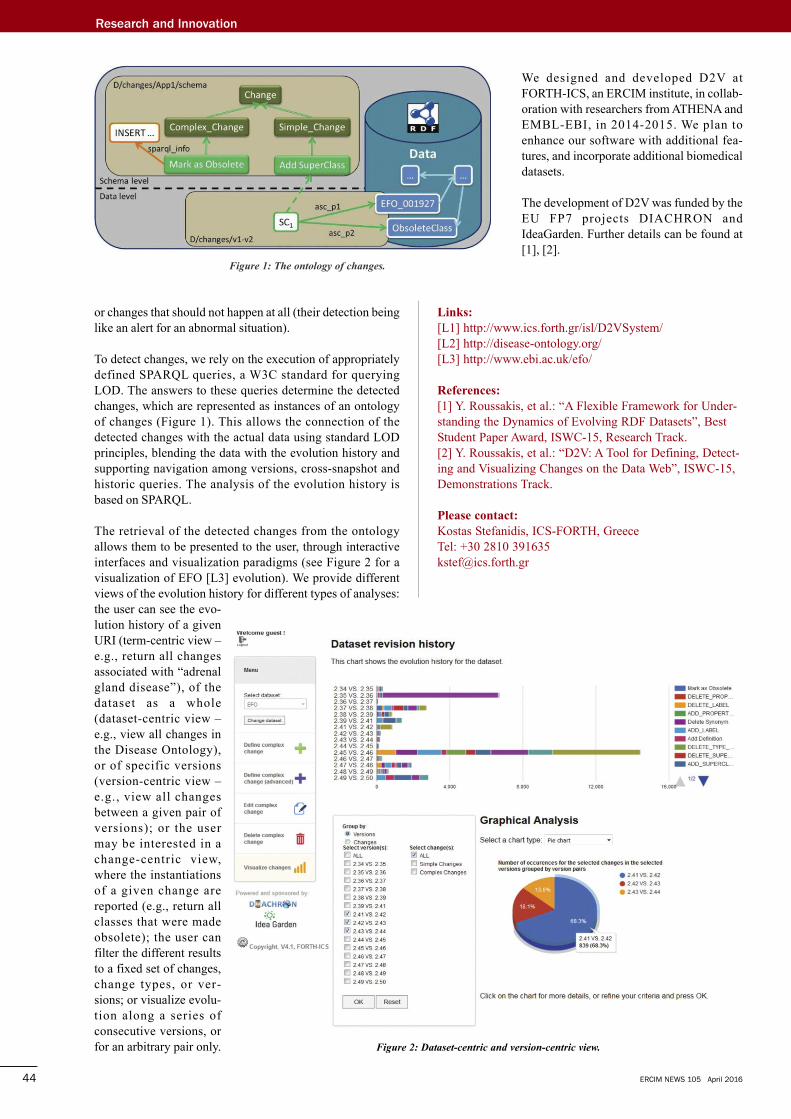
or changes that should not happen at all (their detection beinglike an alert for an abnormal situation).
To detect changes, we rely on the execution of appropriatelydefined SPARQL queries, a W3C standard for queryingLOD. The answers to these queries determine the detectedchanges, which are represented as instances of an ontologyof changes (Figure 1). This allows the connection of thedetected changes with the actual data using standard LODprinciples, blending the data with the evolution history andsupporting navigation among versions, cross-snapshot andhistoric queries. The analysis of the evolution history isbased on SPARQL.
The retrieval of the detected changes from the ontologyallows them to be presented to the user, through interactiveinterfaces and visualization paradigms (see Figure 2 for avisualization of EFO [L3] evolution). We provide differentviews of the evolution history for different types of analyses:the user can see the evo-lution history of a givenURI (term-centric view –e.g., return all changesassociated with “adrenalgland disease”), of thedataset as a whole(dataset-centric view –e.g., view all changes inthe Disease Ontology),or of specific versions(version-centric view –e.g., view all changesbetween a given pair ofversions); or the usermay be interested in achange-centric view,where the instantiationsof a given change arereported (e.g., return allclasses that were madeobsolete); the user canfilter the different resultsto a fixed set of changes,change types, or ver-sions; or visualize evolu-tion along a series ofconsecutive versions, orfor an arbitrary pair only.
We designed and developed D2V atFORTH-ICS, an ERCIM institute, in collab-oration with researchers from ATHENA andEMBL-EBI, in 2014-2015. We plan toenhance our software with additional fea-tures, and incorporate additional biomedicaldatasets.
The development of D2V was funded by theEU FP7 projects DIACHRON andIdeaGarden. Further details can be found at[1], [2].
Links:
[L1] http://www.ics.forth.gr/isl/D2VSystem/[L2] http://disease-ontology.org/[L3] http://www.ebi.ac.uk/efo/
References:
[1] Y. Roussakis, et al.: “A Flexible Framework for Under-standing the Dynamics of Evolving RDF Datasets”, BestStudent Paper Award, ISWC-15, Research Track. [2] Y. Roussakis, et al.: “D2V: A Tool for Defining, Detect-ing and Visualizing Changes on the Data Web”, ISWC-15,Demonstrations Track.
Please contact:
Kostas Stefanidis, ICS-FORTH, GreeceTel: +30 2810 [email protected]
Research and Innovation
ERCIM NEWS 105 April 201644
Figure�2:�Dataset-centric�and�version-centric�view.�
Figure�1:�The�ontology�of�changes.
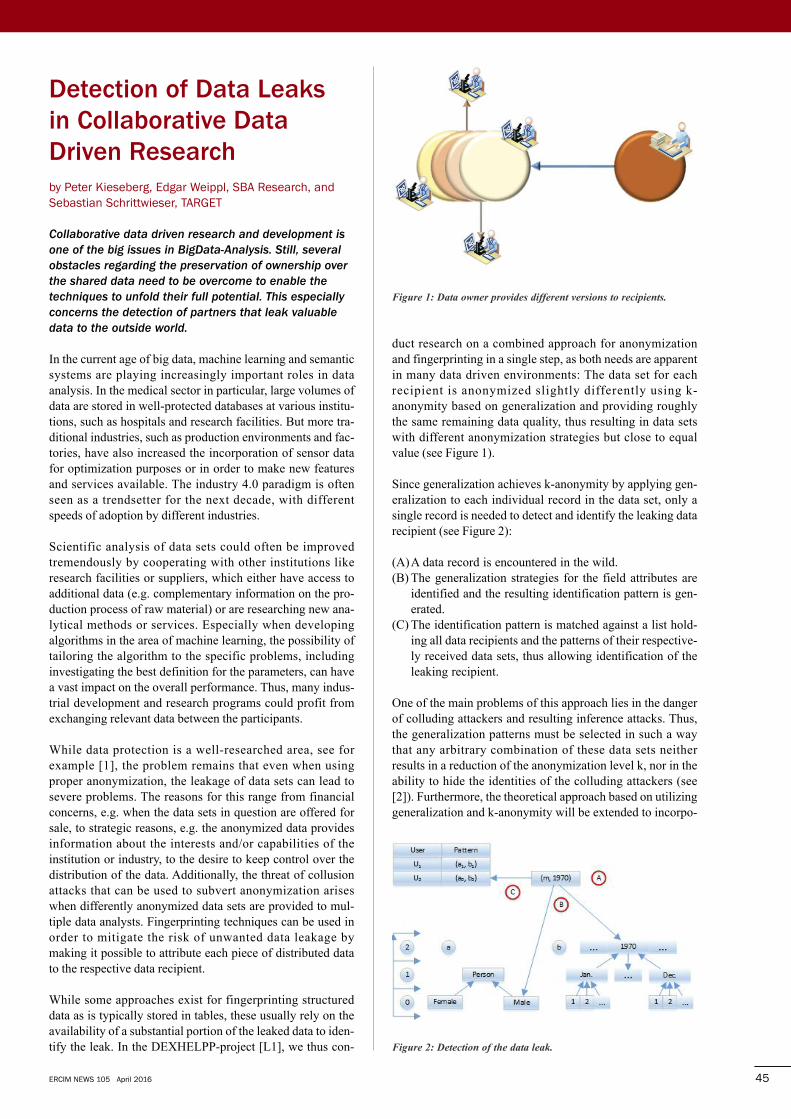
ERCIM NEWS 105 April 2016 45
detection of data Leaks
in Collaborative data
driven Research
by Peter Kieseberg, Edgar Weippl, SBA Research, andSebastian Schrittwieser, TARGET
Collaborative data driven research and development is
one of the big issues in BigData-Analysis. Still, several
obstacles regarding the preservation of ownership over
the shared data need to be overcome to enable the
techniques to unfold their full potential. This especially
concerns the detection of partners that leak valuable
data to the outside world.
In the current age of big data, machine learning and semanticsystems are playing increasingly important roles in dataanalysis. In the medical sector in particular, large volumes ofdata are stored in well-protected databases at various institu-tions, such as hospitals and research facilities. But more tra-ditional industries, such as production environments and fac-tories, have also increased the incorporation of sensor datafor optimization purposes or in order to make new featuresand services available. The industry 4.0 paradigm is oftenseen as a trendsetter for the next decade, with differentspeeds of adoption by different industries.
Scientific analysis of data sets could often be improvedtremendously by cooperating with other institutions likeresearch facilities or suppliers, which either have access toadditional data (e.g. complementary information on the pro-duction process of raw material) or are researching new ana-lytical methods or services. Especially when developingalgorithms in the area of machine learning, the possibility oftailoring the algorithm to the specific problems, includinginvestigating the best definition for the parameters, can havea vast impact on the overall performance. Thus, many indus-trial development and research programs could profit fromexchanging relevant data between the participants.
While data protection is a well-researched area, see forexample [1], the problem remains that even when usingproper anonymization, the leakage of data sets can lead tosevere problems. The reasons for this range from financialconcerns, e.g. when the data sets in question are offered forsale, to strategic reasons, e.g. the anonymized data providesinformation about the interests and/or capabilities of theinstitution or industry, to the desire to keep control over thedistribution of the data. Additionally, the threat of collusionattacks that can be used to subvert anonymization ariseswhen differently anonymized data sets are provided to mul-tiple data analysts. Fingerprinting techniques can be used inorder to mitigate the risk of unwanted data leakage bymaking it possible to attribute each piece of distributed datato the respective data recipient.
While some approaches exist for fingerprinting structureddata as is typically stored in tables, these usually rely on theavailability of a substantial portion of the leaked data to iden-tify the leak. In the DEXHELPP-project [L1], we thus con-
duct research on a combined approach for anonymizationand fingerprinting in a single step, as both needs are apparentin many data driven environments: The data set for eachrecipient is anonymized slightly differently using k-anonymity based on generalization and providing roughlythe same remaining data quality, thus resulting in data setswith different anonymization strategies but close to equalvalue (see Figure 1).
Since generalization achieves k-anonymity by applying gen-eralization to each individual record in the data set, only asingle record is needed to detect and identify the leaking datarecipient (see Figure 2):
(A)A data record is encountered in the wild.(B) The generalization strategies for the field attributes are
identified and the resulting identification pattern is gen-erated.
(C) The identification pattern is matched against a list hold-ing all data recipients and the patterns of their respective-ly received data sets, thus allowing identification of theleaking recipient.
One of the main problems of this approach lies in the dangerof colluding attackers and resulting inference attacks. Thus,the generalization patterns must be selected in such a waythat any arbitrary combination of these data sets neitherresults in a reduction of the anonymization level k, nor in theability to hide the identities of the colluding attackers (see[2]). Furthermore, the theoretical approach based on utilizinggeneralization and k-anonymity will be extended to incorpo-
Figure�1:�Data�owner�provides�different�versions�to�recipients.
Figure�2:�Detection�of�the�data�leak.
rate more advanced concepts for anonymization, as well asmore diverse mechanisms for achieving anonymity. Themain reason for this research step lies in the various otherprerequisites for data anonymization, especially in the med-ical sector, that are not fulfilled by basic k-anonymity, e.g.considering dependencies between data records or statisticalattacks.
During the DEXHELPP-project, the devised algorithms willnot only be tested with synthetic data, but also with real med-ical records. This is especially important, as the actual per-formance of this fingerprinting approach largely depends onthe ability to cluster the data into equivalency classes thatform a partition of the whole data set. This again relies verymuch on the actual distribution of the data inside the data set,especially when refraining from removing outliers. Principalperformance identifiers are not only related to KPIs that aretypically identified with performance, but mainly with attrib-utes like the number of possible fingerprints in a given dataset, the distance between two fingerprinted sets, as well asthe achievable remaining quality.
In conclusion, our work on fingerprinting data sets in theDEXHELPP project will result in practical fingerprints forcollaborative data driven research and development environ-ments. The resulting best fingerprinting strategy will beimplemented inside the DEXHELPP test server environ-ment, which was designed to securely perform collaborativemedical research on data provided by the Austrian healthcareproviders whilst preserving privacy.
Link:
[L1] http://dexhelpp.at/?q=en
References:
[1] B. Fung, et al.: “Privacy-preserving data publishing: Asurvey of recent developments”, ACM Computing Surveys(CSUR) 42(4), 14 (2010).[2] P. Kieseberg, et al.: “An algorithm for collusion-resist-ant anonymization and Fingerprinting of sensitive microda-ta”, Electronic Markets - The International Journal on Net-worked Business, 2014.
Please contact:
Peter Kieseberg, SBA Research, Vienna, [email protected]
HoBBIT: Holistic
Benchmarking of Big
Linked data
by AxelCyrille Ngonga Ngomo, InfAI, Alejandra GarcíaRojas, ONTOS, and Irini Fundulaki, ICS-FORTH
The HOBBIT project aims at abolishing the barriers in
the adoption and deployment of Big Linked Data. To this
end, HOBBIT will provide open benchmarking reports
that allow to assess the fitness of existing solutions for
their purposes. These benchmarks will be based on
data that reflects reality and measures industry
relevant Key Performance Indicators (KPIs) with
comparable results using standardized hardware.
Linked Data has grown rapidly over the last ten years [L1].Organizations are increasingly interested in using solutionsbased on Linked Data. However, choosing the right solutionfor their needs remains a difficult task. HOBBIT’s rationaleis to support organizations that aim to use Linked Data tech-nologies at all scales (including Big Data) in the choice ofappropriate solutions. To this end, HOBBIT [L2] will pro-vide benchmarks for all the industry relevant phases of theLinked Data lifecycle [1] according to the approach shown inFigure 1.
In particular, the H2020 Hobbit EU project will create bench-marks for the following stages:1. Generation and Acquisition: Benchmarks pertaining to the
transformation of unstructured, semi-structured and struc-tured data into RDF.
2. Analysis and Processing: Benchmarks pertaining to theuse of Linked Data to perform complex tasks such assupervised machine learning.
3. Storage and Curation: Benchmarks pertaining to the stor-age, versioning and querying of RDF data stored in corre-sponding solutions.
4. Visualisation and Services: Application centric bench-marks pertaining to queries used by software solutionswhich rely on large amounts of Linked Data.
The HOBBIT project will provide innovative benchmarksbased on the following premises:• Realistic benchmarks: Benchmarks are commonly gener-
ated with synthetic data that reflect a single and specificdomain. HOBBIT aims at creating mimicking algorithmsto generate synthetic data from different domains.
• Universal benchmarking platform: We will develop ageneric platform that will be able to execute large scalebenchmarks across the Linked Data lifecycle. The plat-form will provide reference implementations of the KPIsas well as dereferenceable results and automatic feedbackto tools developers..
• Industry relevant Key Performance Indicators (KPIs): Inaddition to the classical KPIs developed over the lastdecades, HOBBIT will collect relevant KPIs from indus-try to make the assessment of technologies based on theindustrial needs possible.
Research and Innovation
ERCIM NEWS 105 April 201646
ERCIM NEWS 105 April 2016 47
These dereferenceable benchmark results will be provided inan open format [2]. The members of the HOBBIT commu-nity [L3] will be provided with the early results and earlyinsights pertaining to the benchmarks and results of theproject. HOBBIT’s consortium is composed of 10 organiza-tions: InfAI (Germany, coordinator), Fraunhofer IAIS,(Germany), Foundation for Research and Technology Hellas(Greece), National Center for Scientific Research“Demokritos” (Greece), iMinds VZW (Belgium), USUSoftware AG (Germany), Ontos AG (Switzerland),OpenLink Software (UK), AGT Group GmbH (Germany)and TomTom Polska (Poland).
Links:
[L1] http://linkeddatacatalog.dws.informatik.uni-mannheim.de/state/[L2] http://project-hobbit.eu/,https://twitter.com/hobbit_project[L3] http://projecthobbit.eu/getinvolved/
References:
[1] S. Auer, et al.: “Managing the lifecycle of linked datawith the LOD2 stack”, in The Semantic Web–ISWC 2012(pp. 116), Springer. [2] R. Usbeck, et al.: “GERBIL: general entity annotatorbenchmarking framework”, Proc. of the World Wide WebConference 2015.
Please contact:
Axel Cyrille NgongaNgomo,University Leipzig, [email protected]
Alejandra Garcia RojasOntos AG, [email protected]
Irini FundulakiICS-FORTH, [email protected]
Comparability of results: Within its challenges, HOBBITwill provide the possibility of deploying benchmarks onhardware provided by the project but also in the cloud.Therewith, we will ensure that the results achieved by theframeworks benchmarked by HOBBIT are comparable.
Independent HOBBIT institution: HOBBIT will be grow tobecome a biasfree organization that will conduct regularbenchmarks and provide European industry with up-to-dateperformance results. We target to initiate the organization in2017. To achieve the goals of HOBBIT, we aim at bringingtogether three main categories of actors: solution providers,technology users and scientific community. In the first stageof the project we will target all three categories of actors thatwill provide us with (1) supplementary KPIs and (2) datasetsfrom their domain for the mimicking algorithms used tocreate the benchmarks. Once the first version of the differentbenchmarks is available, we will challenge solutionproviders and the scientific community to evaluate theirsolutions.
Figure�1:�HOBBIT�Ecosystem.
ERCIM “Alain Bensoussan”
fellowship Programme
ERCIM offers fellowships for PhD holders from all over the world.Topics cover most disciplines in Computer Science, InformationTechnology, and Applied Mathematics. Fellowships are of 12-monthduration, spent in one ERCIM member institute. Fellowships are pro-posed according to the needs of the member institutes and the avail-able funding.
Application deadlines: 30 April and 30 September.
More information: http://fellowship.ercim.eu/
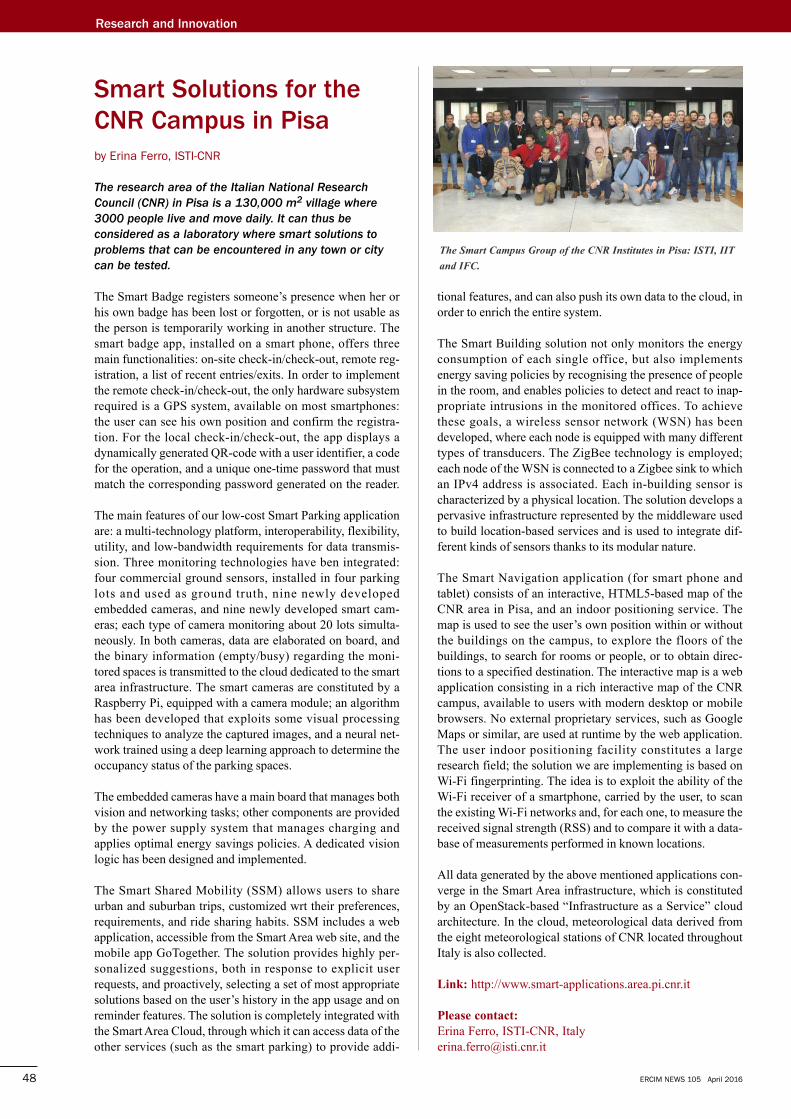
Research and Innovation
ERCIM NEWS 105 April 201648
Smart Solutions for the
CNR Campus in Pisa
by Erina Ferro, ISTI-CNR
The research area of the Italian National Research
Council (CNR) in Pisa is a 130,000 m2 village where
3000 people live and move daily. It can thus be
considered as a laboratory where smart solutions to
problems that can be encountered in any town or city
can be tested.
The Smart Badge registers someone’s presence when her orhis own badge has been lost or forgotten, or is not usable asthe person is temporarily working in another structure. Thesmart badge app, installed on a smart phone, offers threemain functionalities: on-site check-in/check-out, remote reg-istration, a list of recent entries/exits. In order to implementthe remote check-in/check-out, the only hardware subsystemrequired is a GPS system, available on most smartphones:the user can see his own position and confirm the registra-tion. For the local check-in/check-out, the app displays adynamically generated QR-code with a user identifier, a codefor the operation, and a unique one-time password that mustmatch the corresponding password generated on the reader.
The main features of our low-cost Smart Parking applicationare: a multi-technology platform, interoperability, flexibility,utility, and low-bandwidth requirements for data transmis-sion. Three monitoring technologies have ben integrated:four commercial ground sensors, installed in four parkinglots and used as ground truth, nine newly developedembedded cameras, and nine newly developed smart cam-eras; each type of camera monitoring about 20 lots simulta-neously. In both cameras, data are elaborated on board, andthe binary information (empty/busy) regarding the moni-tored spaces is transmitted to the cloud dedicated to the smartarea infrastructure. The smart cameras are constituted by aRaspberry Pi, equipped with a camera module; an algorithmhas been developed that exploits some visual processingtechniques to analyze the captured images, and a neural net-work trained using a deep learning approach to determine theoccupancy status of the parking spaces.
The embedded cameras have a main board that manages bothvision and networking tasks; other components are providedby the power supply system that manages charging andapplies optimal energy savings policies. A dedicated visionlogic has been designed and implemented.
The Smart Shared Mobility (SSM) allows users to shareurban and suburban trips, customized wrt their preferences,requirements, and ride sharing habits. SSM includes a webapplication, accessible from the Smart Area web site, and themobile app GoTogether. The solution provides highly per-sonalized suggestions, both in response to explicit userrequests, and proactively, selecting a set of most appropriatesolutions based on the user’s history in the app usage and onreminder features. The solution is completely integrated withthe Smart Area Cloud, through which it can access data of theother services (such as the smart parking) to provide addi-
tional features, and can also push its own data to the cloud, inorder to enrich the entire system.
The Smart Building solution not only monitors the energyconsumption of each single office, but also implementsenergy saving policies by recognising the presence of peoplein the room, and enables policies to detect and react to inap-propriate intrusions in the monitored offices. To achievethese goals, a wireless sensor network (WSN) has beendeveloped, where each node is equipped with many differenttypes of transducers. The ZigBee technology is employed;each node of the WSN is connected to a Zigbee sink to whichan IPv4 address is associated. Each in-building sensor ischaracterized by a physical location. The solution develops apervasive infrastructure represented by the middleware usedto build location-based services and is used to integrate dif-ferent kinds of sensors thanks to its modular nature.
The Smart Navigation application (for smart phone andtablet) consists of an interactive, HTML5-based map of theCNR area in Pisa, and an indoor positioning service. Themap is used to see the user’s own position within or withoutthe buildings on the campus, to explore the floors of thebuildings, to search for rooms or people, or to obtain direc-tions to a specified destination. The interactive map is a webapplication consisting in a rich interactive map of the CNRcampus, available to users with modern desktop or mobilebrowsers. No external proprietary services, such as GoogleMaps or similar, are used at runtime by the web application.The user indoor positioning facility constitutes a largeresearch field; the solution we are implementing is based onWi-Fi fingerprinting. The idea is to exploit the ability of theWi-Fi receiver of a smartphone, carried by the user, to scanthe existing Wi-Fi networks and, for each one, to measure thereceived signal strength (RSS) and to compare it with a data-base of measurements performed in known locations.
All data generated by the above mentioned applications con-verge in the Smart Area infrastructure, which is constitutedby an OpenStack-based “Infrastructure as a Service” cloudarchitecture. In the cloud, meteorological data derived fromthe eight meteorological stations of CNR located throughoutItaly is also collected.
Link: http://www.smart-applications.area.pi.cnr.it
Please contact:
Erina Ferro, ISTI-CNR, [email protected]
The�Smart�Campus�Group�of�the�CNR�Institutes�in�Pisa:�ISTI,�IIT
and�IFC.
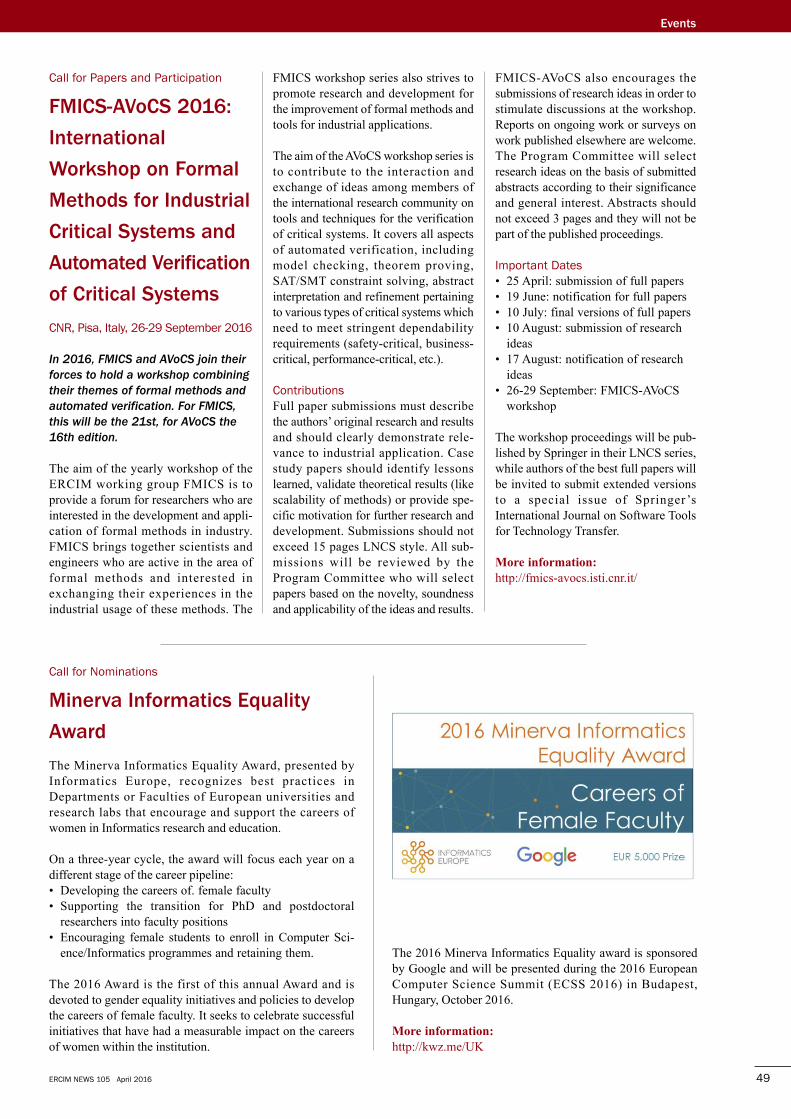
FMICS-AVoCS also encourages thesubmissions of research ideas in order tostimulate discussions at the workshop.Reports on ongoing work or surveys onwork published elsewhere are welcome.The Program Committee will selectresearch ideas on the basis of submittedabstracts according to their significanceand general interest. Abstracts shouldnot exceed 3 pages and they will not bepart of the published proceedings.
Important Dates• 25 April: submission of full papers• 19 June: notification for full papers• 10 July: final versions of full papers• 10 August: submission of research
ideas• 17 August: notification of research
ideas• 26-29 September: FMICS-AVoCS
workshop
The workshop proceedings will be pub-lished by Springer in their LNCS series,while authors of the best full papers willbe invited to submit extended versionsto a special issue of Springer ’sInternational Journal on Software Toolsfor Technology Transfer.
More information:
http://fmics-avocs.isti.cnr.it/
ERCIM NEWS 105 April 2016 49
Call for Papers and Participation
fMICS-AVoCS 2016:
International
Workshop on formal
Methods for Industrial
Critical Systems and
Automated Verification
of Critical Systems
CNR, Pisa, Italy, 26-29 September 2016
In 2016, FMICS and AVoCS join their
forces to hold a workshop combining
their themes of formal methods and
automated verification. For FMICS,
this will be the 21st, for AVoCS the
16th edition.
The aim of the yearly workshop of theERCIM working group FMICS is toprovide a forum for researchers who areinterested in the development and appli-cation of formal methods in industry.FMICS brings together scientists andengineers who are active in the area offormal methods and interested inexchanging their experiences in theindustrial usage of these methods. The
FMICS workshop series also strives topromote research and development forthe improvement of formal methods andtools for industrial applications.
The aim of the AVoCS workshop series isto contribute to the interaction andexchange of ideas among members ofthe international research community ontools and techniques for the verificationof critical systems. It covers all aspectsof automated verification, includingmodel checking, theorem proving,SAT/SMT constraint solving, abstractinterpretation and refinement pertainingto various types of critical systems whichneed to meet stringent dependabilityrequirements (safety-critical, business-critical, performance-critical, etc.).
ContributionsFull paper submissions must describethe authors’ original research and resultsand should clearly demonstrate rele-vance to industrial application. Casestudy papers should identify lessonslearned, validate theoretical results (likescalability of methods) or provide spe-cific motivation for further research anddevelopment. Submissions should notexceed 15 pages LNCS style. All sub-missions will be reviewed by theProgram Committee who will selectpapers based on the novelty, soundnessand applicability of the ideas and results.
Events
Call for Nominations
Minerva Informatics Equality
Award
The Minerva Informatics Equality Award, presented byInformatics Europe, recognizes best practices inDepartments or Faculties of European universities andresearch labs that encourage and support the careers ofwomen in Informatics research and education.
On a three-year cycle, the award will focus each year on adifferent stage of the career pipeline:• Developing the careers of. female faculty• Supporting the transition for PhD and postdoctoral
researchers into faculty positions• Encouraging female students to enroll in Computer Sci-
ence/Informatics programmes and retaining them.
The 2016 Award is the first of this annual Award and isdevoted to gender equality initiatives and policies to developthe careers of female faculty. It seeks to celebrate successfulinitiatives that have had a measurable impact on the careersof women within the institution.
The 2016 Minerva Informatics Equality award is sponsoredby Google and will be presented during the 2016 EuropeanComputer Science Summit (ECSS 2016) in Budapest,Hungary, October 2016.
More information:
http://kwz.me/UK
ERCIM NEWS 105 April 201650
In Brief
ERCIM
Membership
After having successfully grown to becomeone of the most recognized ICT Societies inEurope, ERCIM has opened membership tomultiple member institutes per country. Byjoining ERCIM, your research institution oruniversity can directly participate inERCIM’s activities and contribute to theERCIM members’ common objectives toplay a leading role in Information andCommunication Technology in Europe:• Building a Europe-wide, open network of
centres of excellence in ICT and AppliedMathematics;
• Excelling in research and acting as abridge for ICT applications;
• Being internationally recognised both as amajor representative organisation in itsfield and as a portal giving access to allrelevant ICT research groups in Europe;
• Liaising with other international organisa-tions in its field;
• Promoting cooperation in research, tech-nology transfer, innovation and training.
About ERCIM
ERCIM – the European ResearchConsortium for Informatics and Mathematics– aims to foster collaborative work within theEuropean research community and toincrease cooperation with European industry.Founded in 1998, ERCIM currently includes21 leading research establishments from 18 European countries. Encompassing over10 000 researchers and engineers, ERCIM isable to undertake consultancy, developmentand educational projects on any subjectrelated to its field of activity.
ERCIM members are centres of excellenceacross Europe. ERCIM is internationallyrecognized as a major representative organi-zation in its field. ERCIM provides access toall major Information CommunicationTechnology research groups in Europe andhas established an extensive program in thefields of science, strategy, human capital andoutreach. ERCIM publishes ERCIM News,a quarterly high quality magazine anddelivers annually the Cor Baayen Award tooutstanding young researchers in computerscience or applied mathematics. ERCIMalso hosts the European branch of the WorldWide Web Consortium (W3C).
SHIfT2RAIL - European Railway Research
of 2015-2024
SHIFT2RAIL is a joint technical initiative that will handle all railway researchwithin Horizon 2020. The founding members are Trafikverket, Network Rail,Bombardier, Alstom, Siemens, Ansaldo STS, CAF and Thales, together with theEuropean Commission. The total budget for the program during 2015-2024 isabout 800 million €. Shift2Rail has five main innovation programs that canbriefly be described as development of vehicles, signal systems, infrastructure,information systems and freight traffic. The overall ambitious targets are todouble the capacity of the European rail system, and increase its reliability andservice quality by 50%, all while halving the lifecycle costs.
As a part of the Swedish rail research program “Capacity in the railway trafficsystem” (in Swedish abbreviated “KAJT”), SICS Swedish ICT will be a part ofShift2Rail, acting as a partner to the Swedish infrastructure manager Trafikverket.The first research projects within Shift2Rail are expected to start in autumn of2016. SICS Swedish ICT will mostly be active in areas related to resource opti-mization, like yard- and timetable planning, areas in which SICS has vast pre-vious experience.
“We have noticed a great interest in the upcoming Shift2Rail-projects, both fromresearchers around Europe and from the railway industry. We are looking forwardto developing the close relationship to Trafikverket and other research organiza-tions in this field during the next years and we are proud to be a part of this”, saysMartin Joborn, senior researcher at SICS Swedish ICT and coordinator of theresearch program KAJT.
More information: http://www.shift2rail.org
The ExaNeSt Project - fitting Ten Million
Computers into a Single Supercomputer
The next generation of supercomputers must be capable of a billion billion calcu-lations per second. These are referred to as Exascale computers and with thisability to undertake such volume of calculations, they will transform our under-standing of the world through advanced simulation and problem solving. It willtake ten million processors working together to achieve Exascale; so how can thisbe achieved?
A step towards the Exascale vision is being made by a EU funded ExaNeStproject, which is building its first straw man prototype this year. The ExaNeStconsortium consists of twelve partners, each of which has expertise in a core tech-nology needed for innovation to reach Exascale. ExaNeSt takes the sensible, inte-grated approach of co-designing the hardware and software, enabling the proto-type to run real-life evaluations, facilitating its scalability and maturity into thisdecade and beyond.
Being able to move, process and manage unprecedented volumes of data wouldallow greater insight into many areas of our lives including climate change, cos-mology, drug design, energy safety, national security, material science, medicineand countless other scientific and engineering disciplines. Current technology isfaced with many technical limitations in reaching an Exascale architecture. Keybarriers are energy and cooling demands, compact packaging, permanent storage,interconnection, resilience and not least application behavior. ExaNeSt addressesthese using energy-efficient ARM cores, quiet and power-efficient liquid cooling,non-volatile (e.g. flash) memories integrated into the processor fabric, and thedevelopment of innovative, fast interconnects that avoid congestion.
More information: http://www.exanest.eu

51ERCIM NEWS 105 April 2016
Benefits of Membership
Institutions, as members of ERCIM AISBL, benefit from: • International recognition as a leading centre for ICT
R&D. ERCIM, a European-wide network of centres ofexcellence in ICT, is internationally recognised as a majorrepresentative organisation in its field;
• More influence on European and national governmentR&D strategy in ICT. ERCIM members team up to speakwith a common voice and produce strategic reports toshape the European research agenda;
• Privileged access to standardisation bodies, such as theW3C which is hosted by ERCIM as to other bodies withwhich ERCIM has also established strategic cooperation.These include ETSI, the European Mathematical Societyand Informatics Europe;
• Invitations to join projects of strategic importance;• Establishing personal contacts among executives of lead-
ing European research institutes during the bi-annualERCIM meetings;
• Invitations to join committees and boards developing ICTstrategy nationally and internationally;
• Excellent networking possibilities with more than 10.000high-quality research colleagues across Europe. ERCIM’smobility activities, such as the fellowship programme,leverages scientific cooperation and excellence;
• Professional development of staff including internationalrecognition;
• Publicity through the ERCIM website and ERCIM News,the widely read quarterly magazine.
How to Become a Member
• Prospective members must be outstanding research insti-tutions (including universities) within their country;
• Applicants shall address a request accompanied by shortdescription to the ERCIM Office. The description mustcontain:
• Name and address of the institute;• Short description of the institute’s activities;• Staff (full time equivalent) relevant to ERCIM’s
fields of activity;• Number of European projects currently involved
in;• Name of the representative and the alternate.
• Membership applications will be reviewed by an internalboard and may include an on-site visit;
• The decision on admission of new members is made bythe General Assembly of the Association, in accordancewith the procedure defined in the Bylaws(http://kwz.me/U7), and notified in writing by the Secre-tary to the applicant;
• Admission becomes effective upon payment of the appro-priate membership fee in each year of membership;
• Membership is renewable as long as the criteria for excel-lence in research and an active participation in theERCIM community, cooperating for excellence, are met;
“Through a long history of successful research
collaborations in projects and working groups and
a highly-selective mobility programme, ERCIM has
managed to become the premier network of ICT
research institutions in Europe. ERCIM has a con-
sistent presence in European Community funded
research programmes conducting and promoting
high-end research with European and global
impact. It has a strong position in advising at the
research policy level and contributes significantly
to the shaping of EC framework programmes.
ERCIM provides a unique pool of research
resources within Europe fostering both the career
development of young researchers and the syner-
gies among established groups. Membership is a
privilege.”
Dimitris Plexousakis, ICS-FORTH
Interested in joining ERCIM?
Please contact:
ERCIM Office
2004 route des Lucioles, BP 93
06902 Sophia Antipolis Cedex
Tel: +33 4 92 38 50 10
Email: [email protected]
http://www.ercim.eu

ERCIM is the European Host of the World Wide Web Consortium.
Institut National de Recherche en Informatique et en AutomatiqueB.P. 105, F-78153 Le Chesnay, Francehttp://www.inria.fr/
VTT Technical Research Centre of Finland LtdPO Box 1000FIN-02044 VTT, Finlandhttp://www.vttresearch.com
SBA Research gGmbHFavoritenstraße 16, 1040 Wienhttp://www.sba-research.org/
Norwegian University of Science and Technology Faculty of Information Technology, Mathematics and Electri-cal Engineering, N 7491 Trondheim, Norwayhttp://www.ntnu.no/
Universty of WarsawFaculty of Mathematics, Informatics and MechanicsBanacha 2, 02-097 Warsaw, Polandhttp://www.mimuw.edu.pl/
Consiglio Nazionale delle RicercheArea della Ricerca CNR di PisaVia G. Moruzzi 1, 56124 Pisa, Italyhttp://www.iit.cnr.it/
Centrum Wiskunde & InformaticaScience Park 123, NL-1098 XG Amsterdam, The Netherlandshttp://www.cwi.nl/
Foundation for Research and Technology – HellasInstitute of Computer ScienceP.O. Box 1385, GR-71110 Heraklion, Crete, Greecehttp://www.ics.forth.gr/FORTH
Fonds National de la Recherche6, rue Antoine de Saint-Exupéry, B.P. 1777L-1017 Luxembourg-Kirchberghttp://www.fnr.lu/
FWOEgmontstraat 5B-1000 Brussels, Belgiumhttp://www.fwo.be/
F.R.S.-FNRSrue d’Egmont 5B-1000 Brussels, Belgiumhttp://www.fnrs.be/
Fraunhofer ICT GroupAnna-Louisa-Karsch-Str. 210178 Berlin, Germanyhttp://www.iuk.fraunhofer.de/
SICS Swedish ICTBox 1263, SE-164 29 Kista, Swedenhttp://www.sics.se/
Magyar Tudományos AkadémiaSzámítástechnikai és Automatizálási Kutató IntézetP.O. Box 63, H-1518 Budapest, Hungaryhttp://www.sztaki.hu/
University of CyprusP.O. Box 205371678 Nicosia, Cyprushttp://www.cs.ucy.ac.cy/
Spanish Research Consortium for Informatics and MathematicsD3301, Facultad de Informática, Universidad Politécnica de Madrid28660 Boadilla del Monte, Madrid, Spain,http://www.sparcim.es/
Czech Research Consortium for Informatics and MathematicsFI MU, Botanicka 68a, CZ-602 00 Brno, Czech Republichttp://www.utia.cas.cz/CRCIM/home.html
Subscribe to ERCIM News and order back copies at http://ercim-news.ercim.eu/
ERCIM – the European Research Consortium for Informatics and Mathematics is an organisa-
tion dedicated to the advancement of European research and development, in information
technology and applied mathematics. Its member institutions aim to foster collaborative work
within the European research community and to increase co-operation with European industry.
INESCc/o INESC Porto, Campus da FEUP, Rua Dr. Roberto Frias, nº 378,4200-465 Porto, Portugal
I.S.I. – Industrial Systems InstitutePatras Science Park buildingPlatani, Patras, Greece, GR-26504 http://www.isi.gr/
Universty of WroclawInstitute of Computer ScienceJoliot-Curie 15, 50–383 Wroclaw, Polandhttp://www.ii.uni.wroc.pl/
University of SouthamptonUniversity RoadSouthampton SO17 1BJ, United Kingdomhttp://www.southampton.ac.uk/