EQCHANGE: A World Database on Actual and … and (ii) equilibrium real effective exchange rates and...
143
Highlights EQCHANGE is a global database of annual indicators on effective exchange rates. EQCHANGE includes two sub-databases providing information on: (i) nominal and real effective exchange rates, and (ii) equilibrium real effective exchange rates and corresponding currency misalignments for advanced, emerging and developing countries. The first sub-database provides effective exchange rates for 187 countries computed under three different weighting schemes and two panels of trading partners (186 and top 30) over the 1973-2016 period. The second sub-database provides behavioral equilibrium exchange rate (BEER) estimates and corresponding currency misalignments for 182 economies over the 1973-2016 period. EQCHANGE: A World Database on Actual and Equilibrium Effective Exchange Rates No 2017-14 – July Working Paper Cécile Couharde, Anne-Laure Delatte, Carl Grekou, Valérie Mignon & Florian Morvillier
Transcript of EQCHANGE: A World Database on Actual and … and (ii) equilibrium real effective exchange rates and...

Highlights
EQCHANGE is a global database of annual indicators on effective exchange rates.
EQCHANGE includes two sub-databases providing information on: (i) nominal and real effective exchange rates, and (ii) equilibrium real effective exchange rates and corresponding currency misalignments for advanced, emerging and developing countries.
Thefirstsub-databaseprovideseffectiveexchangeratesfor187countriescomputedunderthreedifferentweightingschemesandtwopanelsoftradingpartners(186andtop30)overthe1973-2016period.
The second sub-database provides behavioral equilibrium exchange rate (BEER) estimates and correspondingcurrencymisalignmentsfor182economiesoverthe1973-2016period.
EQCHANGE: A World Database on Actual and Equilibrium Effective Exchange Rates
No2017-14–July Working Paper
Cécile Couharde, Anne-Laure Delatte, Carl Grekou, Valérie Mignon & Florian Morvillier

CEPII Working Paper EQCHANGE
Abstract The aim of this paper is to present EQCHANGE, the new database developed by the CEPII on effective exchange rates. EQCHANGE includes two sub-databases containing data on (i) nominal and real effective exchange rates, and (ii) equilibrium real effective exchange rates and corresponding currency misalignments for advanced, emerging and developingcountries.Morespecifically,thefirstsub-databasedeliverseffectiveexchangeratesfor187countriesthatarecomputedunderthreedifferentweightingschemesandtwopanelsoftradingpartners(186andtop30)overthe1973-2016period.Thesecondsub-databaseprovidesbehavioralequilibriumexchangerate(BEER)estimatesandcorrespondingcurrencymisalignmentsfor182economiesoverthe1973-2016period.Wedescribetheconstructionof the two datasets and illustrate some possible uses by presenting results concerning the evolution and main characteristicsofcurrencymisalignmentsintheworldfrom2015to2016.Byprovidingpubliclyavailableindicatorsofequilibrium exchange rates, EQCHANGE aims to contribute to key debates in international macroeconomics.
KeywordsExchange Rates, Equilibrium Exchange Rates, Currency Misalignments.
JELF31,C23,C82.
CEPII (Centre d’Etudes Prospectives et d’Informations Internationales) is a French institute dedicated to producing independent, policy-oriented economic research helpful to understand the international economic environment and challenges in the areas of trade policy, competitiveness, macroeconomics, international financeandgrowth.
CEPIIWorkingPaperContributing to research in international economics
©CEPII,PARIS,2017
All rights reserved. Opinions expressed in this publication are those of the author(s) alone.
Editorial Director: SébastienJean
Production: Laure Boivin
NoISSN:1293-2574
CEPII113,ruedeGrenelle75007Paris+33153685500
www.cepii.frPress contact: [email protected]
Working Paper

CEPII Working Paper EQCHANGE
EQCHANGE: A World Database on Actual and Equilibrium E�ective Exchange
Rates1
Cécile Couharde*, Anne-Laure Delatte�, Carl Grekou�, Valérie Mignon� and Florian
Morvillier
1. Introduction
The widening and persistence of current account disequilibria at the international level
�i.e., global imbalances� have refocused real exchange rate distortions at the core
of international debates. What are the exchange rate adjustments needed to correct
excessive imbalances? How to assess whether a currency is fundamentally misaligned,
i.e. under- or over-valued? Due to the key role played by currency misalignments in
economic research and policy analysis, several institutions publish various indicators that
rely on more or less sophisticated measures.
To establish whether a currency is misaligned, and, if so, to which extent, a rough as-
sessment can be obtained from the Big Mac index (BMI) developed since 1986 by The
Economist. When compared to the actual exchange rate, this BMI gives an indication
of the extent to which a currency is over- or undervalued according to the law of one
price.2 This measure is freely downloadable from the website of The Economist;3 but
it only assesses the purchasing power between two countries in terms of a single good.
Therefore, this indicator should not be interpreted systematically as indication of mis-
alignment. This shortcoming is acknowledged by The Economist commenting that �the
1We are grateful to Philip Lane for kindly providing us with data on net foreign asset positions and to
Sébastien Jean for helpful remarks and suggestions.*EconomiX-CNRS, University of Paris Nanterre, France. Email: [email protected].�CEPII, Griswold, CNRS and CEPR. Email: [email protected].�EconomiX-CNRS, University of Paris Nanterre and CEPII, France. Email: [email protected].�EconomiX-CNRS, University of Paris Nanterre and CEPII, France. Corresponding author : Valérie
Mignon, EconomiX-CNRS, University of Paris Nanterre, 200 avenue de la République, 92001 Nanterre
Cedex, France. Phone: 33 1 40 97 58 60. E-mail: [email protected]¶EconomiX-CNRS, University of Paris Nanterre and CEPII, France. Email:
[email protected] simply, if the Big Mac costs x% more in a country i than in a country j , then the currency of country
i will be x% overvalued relative to the currency of country j .3http://www.economist.com/content/big-mac-index
3

CEPII Working Paper EQCHANGE
Big Mac index is merely a tool to make exchange-rate theory more digestible�.
Several institutions have developed more sophisticated measures that di�er from the
BMI framework in various ways. First, these measures do not rely on a bilateral ex-
change rate as the BMI, but on the real e�ective �i.e., multilateral� exchange rate
(REER). Therefore, the misalignment of a currency is not measured against only one
particular currency, but instead against an average index of a whole basket of currencies.
Second, currency misalignments are calculated from the assessment of an equilibrium
value of the REER, i.e. a value of the REER that is consistent with the macroeconomic
balances (both internal and external) over the medium to the long term and given a
set of fundamentals. The major advantage of this methodology over the simple BMI
framework is that it allows the equilibrium value of the exchange rate to vary over time,
re�ecting changes in economic fundamentals.4
However, the lack of consensus on the de�nition of equilibrium exchange rates has made
it very di�cult to establish a unique approach (MacDonald, 2000; Driver and West-
away, 2004). Therefore, several equilibrium exchange rate methodologies exist and they
are usually classi�ed into three complementary groups: (1) the macroeconomic balance
approach; (2) the behavioral equilibrium exchange rate (BEER) approach; and (3) the
external sustainability approach. The macroeconomic balance approach calculates the
di�erence between the current account (CA) projected over the medium term at pre-
vailing exchange rates and an estimated equilibrium current account, or �CA norm�. The
BEER approach directly estimates an equilibrium real exchange rate for each country as
a function of medium- to long-term fundamentals of the REER. The external sustainabil-
ity approach calculates the di�erence between the actual current account balance and
the balance that would stabilize the net foreign asset position of the country at some
benchmark level.
Since the mid-1990s, the practice of the IMF, more precisely of the Consultative Group on
Exchange Rate Issues (CGER), consists in using these three complementary approaches
to provide exchange rate assessments for a number of advanced economies and emerging
market countries (IMF, 2006). According to the IMF, using a broad range of indicators
and other analytical tools provides the best possible estimate of the equilibrium exchange
rate level. But, the information delivered by the IMF is not timely consistent, as it is
4The Economist has however improved the assessment of the BMI by introducing in 2011 an adjusted
Big Mac index which controls for income per capita di�erential between countries.
4

CEPII Working Paper EQCHANGE
produced on an irregular basis, and it only concerns a limited sample of countries.5
Cline and Williamson (2008) have started a semi-annual estimate of fundamental equi-
librium exchange rates (FEERs) for 35 countries, publicly available on the American
Peterson Institute for International Economics (PIIE) website.6
The issue of currency misalignments has also been in the research agenda of the Centre
d'Etudes Prospectives et d'Informations Internationales (CEPII), a French government
funded research center focusing on the world economy. Since 2004, the CEPII has
irregularly produced and published estimates of currency misalignments mainly based on
the BEER approach,7 i.e. the second methodology employed by the IMF's CGER.
In sum, each aforementioned institute computes its own equilibrium real exchange rates
(ERER), but there is no publicly available database providing these ERER and corre-
sponding currency misalignments for a consistent and large sample of countries over a
long period of time. In order to bridge the gap, the CEPII has developed a new database
covering the largest sample of countries, the EQCHANGE database, from which (i)
e�ective exchange rates and (ii) estimates of equilibrium real exchange rates and of
currency misalignments can be freely downloaded.
The �rst sub-database, on e�ective exchange rates, provides indices of nominal and
real e�ective exchange rates for 187 economies over the 1973-2016 period. The ef-
fective exchange rates indices are calculated for two panels of trade partners (186 and
top 30) and using di�erent weighting systems. Therefore, the EQCHANGE database
brings a host of new features that greatly enhance the calculation of e�ective exchange
rates �compared to existing annual databases� in terms of country/time coverage and
methodological options (i.e., number of trade partners and weighting schemes).
5For example, IMF country reports do not necessarily include CGER assessments. Indeed, they can
contain the �ndings of separate analyses, as IMF's working papers, central bank studies, and periodic
reports of investment banks. In addition, the panel of considered countries varies across studies.6While the FEER approach consists in ad hoc determination of current account norms, in the orig-
inal macroeconomic balance approach these targets are obtained from the estimation of an equilib-
rium current account equation (see Williamson, 1994, and Cline, 2008, for details). Note further that
the PIIE started publishing the data for a number of advanced countries and emerging economies in
2008. Access: https://piie.com/publications/policy-briefs/estimates-fundamental-equilibrium-exchange-
rates-november-20167The �rst working paper related to misalignments assessments was published in 2004 (Bénassy-Quéré
et al., 2004). A recent publication reports estimates of currency misalignments within the euro area
(Couharde et al., 2017; see also Coudert et al., 2013). For the sake of completeness, note that some
CEPII studies have also provided misalignments based on the FEER approach, see e.g. Bénassy-Quéré et
al. (2008) and Carton and Hervé (2013).
5

CEPII Working Paper EQCHANGE
The substantial enhancement introduced by EQCHANGE lays in the second sub-database
which includes assessments of equilibrium real e�ective exchange rates and corresponding
currency misalignments. More precisely, we estimate ERER based on the BEER approach
(Clark and MacDonald, 1998). We have chosen this framework as it allows us to provide
several ERER estimates for the vast majority of countries in the world (182 countries) and
over a reasonably long time-span (from 1973 to 2016). Currency misalignments are then
deduced from the di�erence between real e�ective exchange rates and their equilibrium
values; we calculate various misalignments, depending on the de�nition of real e�ective
exchange rates indices (weighting schemes di�er for example), the speci�cation of the
equilibrium exchange rate model and the sample of countries.
By providing publicly available indicators of equilibrium exchange rates, our database
helps documenting key debates such as the role of exchange rates on global and/or
regional imbalances, the use of exchange rate as a mercantilist tool, the impact of
currency misalignments on resources' reallocation between the tradable and the non-
tradable sectors and on economic growth, to name a few.
The primary objective of this paper is to provide a comprehensive account of our method-
ological framework to calculate its set of e�ective exchange rates and of equilibrium real
exchange rates from which currency misalignments are derived. To this end, Section 2
is devoted to the presentation of the main features of the EQCHANGE database. As
an illustration, Section 3 presents the evolution and essential characteristics of currency
misalignments in the world from 2015 to 2016. Section 4 concludes the paper.
2. The EQCHANGE database
The EQCHANGE database developed by the CEPII consists of time series of:
� nominal and real e�ective exchange rates (Section 2.1);
� behavioral equilibrium exchanges rates and resulting currency misalignments (Section
2.2).
2.1. The e�ective exchange rates dataset
Several institutions, such as the World Bank (WB), the International Monetary Fund
(IMF), the Bank of International Settlements (BIS), or think tanks such as Bruegel pub-
lish �more or less regularly� indexes of nominal and real e�ective exchange rates. The
6

CEPII Working Paper EQCHANGE
Figure 1 � E�ective exchange rates dataset: country coverage
EQCHANGE database developed by the CEPII has two distinct characteristics when
compared to those databases. First, the EQCHANGE database has the widest coun-
try/time coverage as we compute annual e�ective exchange rates (both in nominal and
real terms) for 187 countries over the 1973-2016 period (see the list of countries in
Appendix A.1, and Figure 1).
Second, by using a simple export weighting method, the EQCHANGE database includes
e�ective exchange rates indices calculated and available along various dimensions, includ-
ing the weighting scheme and trading partners' coverage. Therefore our database allows
the adoption of alternate options for the selection of data. Firstly, e�ective exchange
rates indices are available for two weighting schemes. The �rst one is time-invariant
and consists in two weight sets respectively representative of foreign trade between (i)
2008-2012, and (i i) 1973-2016. The second weighting system is time-varying and is
essentially based on non-overlapping �ve-year average weights.8 Secondly, e�ective ex-
change rates rely on broad-based and narrow-based indices which are calculated against
two main groups of trading partners, i.e. against 186 trading partners and the top 30
trading partners for each country. Di�erences between our database and other ones are
reported in Table 1.
8The following periods � 1973-1979; 1980-1984; 1985-1989; 1990-1994; 1995-1999; 2000-2004; 2005-
2009; 2010-2016 � have been considered.
7

CEPIIWorkingPaper
EQCHANGE
Table 1 � Comparison of various datasets
DatabaseCoverage Weighting system
Data frequency UpdatesCountries Period Type Period Basket
CEPII 187 1973-2016(i) Fixed
{1973� 2016
2008� 2012 186 and 30 Annual Regularly
(ii) Time-varying 5-year window
IMF 101 1962-2016 Fixed 1991-2001 100Monthly,
Quarterly andAnnual
Regularly
WB 109 1962-2016 Fixed 1998-2003 108 Annual Regularly
Bruegel
(i) 43 1970-2016
Fixed 1998-2003
41 Monthly
Irregularly(ii) 153 1995-2016 138 Monthly(iii) 74 1960-2016 67 Annual(iv) 178 1992-2016 172 Annual
Eurostat 37 1994-2016 Time varying 1-year window 36 Annual Regularly
BIS
(i) 27 1964-2016
Fixed 2011-2013
26 Monthly
Regularly(ii) 61 1994-2016 60 Monthly(iii) 27 1983-2016 26 Annual(iv) 61 1980-2016 60 Annual
Notes: the column "Basket" indicates the number of trade partners used to calculate the weights.
8

CEPII Working Paper EQCHANGE
2.1.1. Methodological features
An e�ective exchange rate measures the rate at which a country's currency exchanges
against a basket of other currencies, in either nominal or real terms.
The nominal e�ective exchange rate of country i in period t (NEERi ;t) measures the
value of the currency of country i against a weighted average of foreign currencies:
NEERi ;t =
N∏j=1
NERwi j;t
i j;t (1)
where NERi j;t is the index of the nominal bilateral exchange rate between the currency
of country i and the currency of its trade partners j in period t,9 N denotes the number
of trading partners and wi j;t is the trade-based weight associated to the partner j .10
The real e�ective exchange rate of country i in period t (REERi ;t) is calculated as the
weighted average of real bilateral exchange rates against each of its N trading partners
j :
REERi ;t =
N∏j=1
RERwi j;t
i j;t (2)
where RERi j;t =NERi j;t � Pi ;t
Pj;tis an index of the real exchange rate of the currency
of the country i vis-à-vis the currency of the trading partner j in period t. Pi ;t and Pj;t
stand respectively for the price index of country i and of country j .
With these de�nitions, a real (nominal) appreciation of the domestic currency is recorded
as an increase in the real (nominal) e�ective exchange rate index.
Constructing an e�ective exchange rate index (both in nominal and real terms) for a
given country then requires determining the trade-weight associated to each of its part-
ners. In many circumstances, the exchange rate plays the role of a relative price of traded
goods; hence, the relevant weights usually involve trade weights. Moreover, in most open
economies, policy-makers are more interested in the total international competitive po-
sition of their country. In this case, appropriate e�ective exchange rate measures should
include both import and export weights. Computing import weights is fairly straight-
9The nominal exchange rate is expressed as the number of foreign currency units per domestic currency.
An increase therefore corresponds to an appreciation of the domestic currency against the foreign currency.10These weights are normalized so that their sum is equal to one, i.e.
∑N
j=1 wi j;t = 1.
9
CEPII Working Paper EQCHANGE
forward: import weights are based on bilateral imports, i.e. on the relative importance
of each of the partner countries, j , in total imports of a country i . Turning to export
weights, various procedures exist including bilateral and double export weighting schemes.
We prefer here to follow the bilateral-based approach for its simplicity and transparency
properties. Indeed, this procedure is based on bilateral exports and therefore takes into
account only competition between the domestic country and its direct trading partners.
In doing this, we have chosen not to consider the possible indirect competition on the
third markets based on the calculation of a double export weight. Speci�cally, interna-
tional institutions such as the IMF, the WB and the BIS construct their real e�ective
exchange rate series attempting to capture third market e�ects. Compared to our simple
weighting procedure, the double export weights method contains additional information
on the competition faced by country i 's exporters in each given foreign market from ex-
porters of the countries included in the group of the N trading partners.11 However, while
delivering a more rigorous assessment of the export competition in foreign markets, this
weighting scheme can lead to a smaller area and time coverage and provides less �exibil-
ity in updating the dataset, because of limitations in data availability. In particular, the
inclusion of the gross value of the domestically produced supply of manufactured goods
in the calculation of the double export weight tends to restrict the number of countries
that can be considered. In addition, if we compare our calculated overall weights (see
paragraph below) to those of the IMF, we do not observe any signi�cant di�erences. We
therefore conclude that our simpler approach is broadly equivalent to that of the IMF
when considering the overall weights. All these reasons justify our choice to not replicate
the double export weighting scheme.
The overall weight of each partner j in the trade of country i at period t (wi j;t) is obtained
as the weighted average of the export and import weights:
Wi j;t =
(Mi ;t
Mi ;t +Xi ;t
)�W Imp
ij;t +
(Xi ;t
Mi ;t +Xi ;t
)�W Exp
ij;t (3)
where W Impij;t and W Exp
ij;t are partner country j 's import and export weights, respectively
and Mi ;t and Xi ;t are total imports and total exports of country i .
11Indeed, under this approach, the export weight for any country is derived as a combination of two com-
ponents: a bilateral export weight, which accounts for direct competition between exporters and domestic
producers in a particular export market; and a third-market export weight, which captures competition
between exporters from two di�erent countries in a third market. The methodology is detailed in Turner
and Van't dack (1993).
10
CEPII Working Paper EQCHANGE
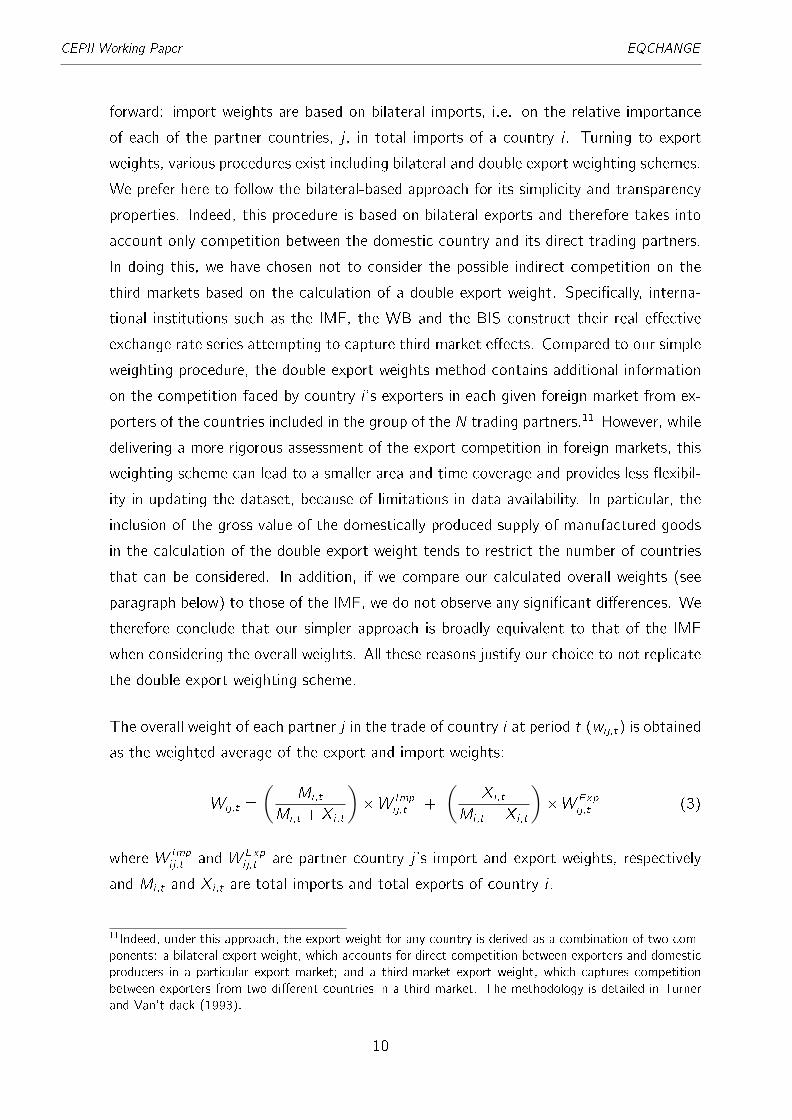
The import and export weights (Equations (4) and (5)) of each partner j are calculated
as its simple share of country i 's imports and exports:
W Impij;t = M j
i ;t=Mi ;t (4)
W Expij;t = X j
i ;t=Xi ;t (5)
where M ji ;t denotes import �ows into the country i from country j during period t, and
X ji ;t denotes export �ows of country i to market j during period t.
2.1.2. Data
E�ective exchange rates are computed from the bilateral exchange rate with the US
dollar of each country. The primary data source for bilateral exchange rates is the World
Bank's World Development Indicators (WDI). Other alternative sources such as national
central bank statistics or the Penn World tables (9.0)12 have also been used in the case
of incomplete data (see Table A.2.1 in Appendix A.2).
The price series used to de�ate the bilateral nominal exchange rates are the most com-
monly used price series, i.e. Consumer Price Index (CPI). Although there are theo-
retical reasons to prefer other types of price indexes when measuring competitiveness
(Rosensweig, 1987), CPIs have the advantage of being timely and available for a wide
array of countries over a long time period (see Table A.2.2 in Appendix A.2).
2.1.3. Empirical comparisons for robustness checks
As e�ective exchange rates can be calculated by using di�erent weighting schemes,
we report the correlations between the nominal (resp. real) e�ective exchange rates
of our database and those provided by other databases in Table A.3.1 (resp. A.3.2)
in Appendix A.3. Table A.3.1 shows that in most cases, there is a strong correlation
between the di�erent databases' nominal e�ective exchange rates (NEERs). In contrast,
the correlations for real e�ective exchange rates (REERs) are weaker but, compared to
the Bruegel's REERs, the CEPII's REERs present higher correlations with those provided
by the IMF and the WB (Table A.3.2). However, the statistical reliability of those
12PWT 9.0 can be downloaded via the University of Groningen webpage at
http://www.rug.nl/ggdc/productivity/pwt/
11

CEPII Working Paper EQCHANGE
correlations is limited, due to the relatively small number of common observations. In
order to get a proper/meaningful comparison of the di�erent series and for illustrative
purposes, we have reported in Figures C.1 and C.2 in Appendix C the evolution of
the NEERs and REERs provided by the di�erent datasets. As shown, we validate our
calculations as the dynamics of our exchange rates indices quite follow those issued from
the di�erent databases.
2.2. The database on equilibrium real exchange rates and currency misalignments
In this section we outline the construction of this second database and also discuss the
underlying methodology and data sources. The dataset computes equilibrium real e�ec-
tive exchange rates and currency misalignments from 1973 to 2016, for 182 economies,
i.e. the largest coverage with available data (Figure 2).13
Figure 2 � The equilibrium real exchange rates dataset: country coverageNote: the di�erent shades of grey indicate the temporal coverage of the series: the darker, the longer is the temporalcoverage.
This database has three distinct characteristics. First, it is the �rst database on equi-
librium real e�ective exchange rates and currency misalignments with a global coverage.
Second, we rely on the BEER approach rather than the purchasing power parity (PPP)
approach. Our measures are then less restrictive than those derived from the PPP only
(as the Big Mac Index for example). Moreover, BEER estimates are a good alternative to
13For few economies such as countries of the former Soviet Union, series of equilibrium exchange rates
start later, due to data availability.
12

CEPII Working Paper EQCHANGE
FEER assessments �such as those provided by the Peterson Institute for International
Economics� as the underpinning methodology (i) does not require assumptions about
the internal and external balances, and (i i) takes into account stock e�ects through the
net foreign asset position. Third, we compute various series of equilibrium exchange
rates and currency misalignments along a large set of assumptions used for the equilib-
rium exchange rate model, for the measure of REER, and for the coverage of partners'
countries.
2.2.1. Equilibrium exchange rates
The BEER approach. We rely on the BEER approach to assess equilibrium real ex-
change rates (see Clark and MacDonald, 1998). Indeed, one of the di�culties when
computing equilibrium exchange rates is to identify the long-run equilibrium path of the
economy. We have opted for the BEER approach which is more pragmatic, as it does
not require to estimate or to make assumptions on the long-run values of the economic
fundamentals (such as current account norms for instance) as in the macroeconomic
balance approach.14 Instead, the BEER approach consists in assessing directly the equi-
librium level of real exchange rates through the estimation of a long-run relationship
between real exchange rates and their fundamentals. This approach is then relatively
simple and easy to implement and requires few data. This point is crucial given the
paucity of reliable data in several developing and emerging economies.
Analyses di�er in the choice of real exchange rates' fundamentals, in part because of
countries' sample considerations. Edwards (1988), Elbadawi (1994), Hinkle and Montiel
(1999) and Elbadawi and Soto (2008) �among others� have provided suitable theo-
retical frameworks that identify potential drivers of real exchange rates in developing and
emerging countries. In particular, the major fundamentals behind long-run movements
of the real exchange rate identi�ed for these countries are usually the terms of trade, the
relative productivity of the tradable sector and the net foreign asset position, as we will
detail below.15 For the advanced economies, Faruqee (1995), followed by Alberola et al.
14We do not postulate that the BEER methodology achieves superior performance against other equilibrium
exchange rate approaches. Indeed, all these approaches, far from being opposed to each other, are rather
complementary insofar as they assess equilibrium exchange rates over di�erent time horizons (Bénassy-
Quéré et al., 2010).15For the sake of completeness and as a robustness check, we have also included in our analysis other
variables considered to be of importance to the exchange rate determination for developing countries
such as government spending, remittances, �nancial development, aid �ows, and openness. However,
employing such variables dramatically reduce the size of the sample (both in terms of temporal and
individual dimensions). Furthermore, the inclusion of these additional variables did not change the results
13
CEPII Working Paper EQCHANGE
(1999) and Alberola (2003), have proposed a stock-�ow model for the exchange rate
determination in the long run, based on the balance-of-payments approach which em-
phasizes the accumulation of external disequilibria and the Balassa-Samuelson hypothesis
which underscores relative productivity trends (Balassa, 1964; Samuelson, 1964).
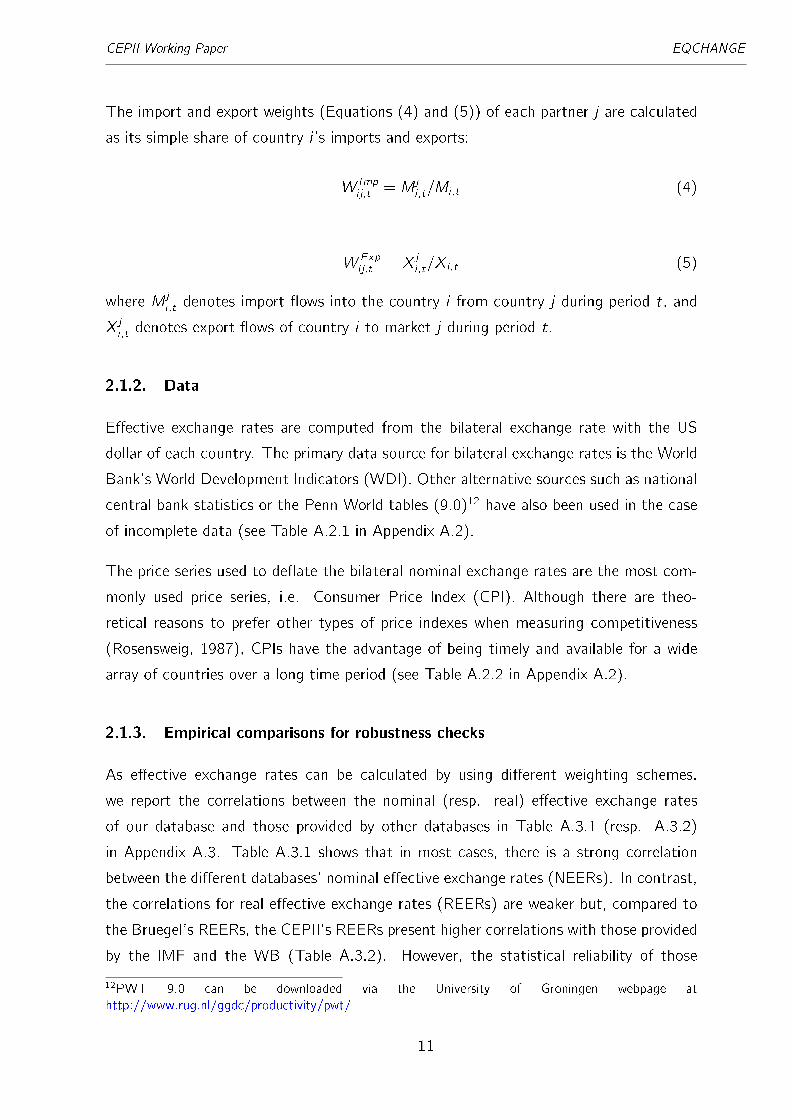
The empirical framework. In line with this literature, the three following variables are
included in our regressions as fundamentals of the real exchange rate: (i) a measure of
sectoral productivity relative to trading partners � to account for the Balassa-Samuelson
e�ect, (ii) the economy's net foreign asset position, and (iii) the economy's terms of
trade.
However, rather than pooling directly together �in the same equation� these three
fundamentals, we adopt a sequential approach by starting with the most parsimonious
regression model including only one variable and then by adding successively the other
fundamentals in the regression model. Then, the �rst model (Model 1) we consider
includes only a measure of relative productivity and is drawn on the �ndings that the
Balassa-Samuelson e�ect (BS, thereafter) is the most important economic force shaping
real exchange rate behavior. Equilibrium exchange rates derived from this �rst model can
be interpreted as PPP-based equilibrium exchange rates adjusted by the BS e�ect. We
also estimate two additional models which augment Model 1 by adding (i) the net foreign
asset position (Model 2), and (i i) the net foreign position and the terms of trade (Model
3):
reeri ;t = �i + � BSi ;t + "i ;t (Model 1)
reeri ;t = �i + �1 BSi ;t + �2 nf ai ;t + "i ;t (Model 2)
reeri ;t = �i + �1 BSi ;t + �2 nf ai ;t + �3 toti ;t + "i ;t (Model 3)
where reeri ;t denotes the real e�ective exchange rate expressed in logarithm; BSi ;t ,
nf ai ;t and toti ;t stand respectively for the BS e�ect proxy (expressed in logarithm), the
net foreign asset position (in percentage of GDP) and the terms of trade (expressed in
logarithm). �i represents country-�xed e�ects and "i ;t is an independent and identically
distributed error term.
in any substantial way. The results are available upon request.
14

CEPII Working Paper EQCHANGE
The improvement of these three fundamentals is expected to appreciate the equilibrium
real exchange rate. First, the Balassa-Samuelson e�ect describes the convergence pro-
cess of an economy which results in an appreciation of its real exchange rate through a
larger productivity growth in the domestic traded goods.16 If the real appreciation is in
line with the stage of development, the currency of the country will then not necessarily
be overvalued.
Second, the connection between real exchange rates and net foreign assets derives from
the intertemporal budget constraint which links external assets, real exchange rate and
trade balance together, documented by Lane and Milesi-Ferretti (2002). When a country
runs a current account de�cit, it is building up liabilities to the rest of the world. Solvency
requires that the country be willing and able to (eventually) generate su�cient current
account surpluses to repay what it has borrowed to �nance the current account de�cits.
Therefore, a country running a current account de�cit (borrowing more) may have an
overvalued currency: indeed, it should register a more depreciated real exchange rate
in order to restore external equilibrium. Conversely, net creditor countries may have an
undervalued currency and experience real exchange rate appreciations: their trade de�cit
will be indeed o�set by investment income on their net foreign asset position.
Finally, the impact of changes in the terms of trade on the equilibrium real exchange
rate is theoretically ambiguous. On the one hand, an improvement of the terms of
trade (an increase in the relative price of exports to imports) leads to a substitution
e�ect. Domestic agents shift their demand towards imported goods and, as a result, the
domestic currency will be overvalued: it will have to depreciate to restore the external
equilibrium. On the other hand, an income e�ect due to the improved current account
may generate higher demand for non-traded goods. Consequently, prices in the non-
traded goods sector tend to rise as well as the general price level, leading in turn to an
appreciation of the equilibrium real exchange rate. Empirically, it has been documented
that the negative substitution e�ect of change in terms of trade is not large enough to
outweigh the income e�ect. This is so because imports and domestic goods are imperfect
substitutes. It follows therefore that the net result of an increase in the relative price
of exports to imports will be an appreciation of the equilibrium real exchange rate (De
16According to the Balassa-Samuelson e�ect, a relatively larger productivity growth in the domestic traded
goods compared to the non-traded goods sector causes wage increases in the tradable goods sector.
Equalization in wages across sectors leads to an increase in wages also in the non-traded goods sector.
Consequently, prices in the non-traded goods sector tend to rise as well as the general price level, leading
therefore to an appreciation of the real exchange rate.
15
CEPII Working Paper EQCHANGE
Gregorio and Wolf, 1994).
We estimate these three equilibrium real exchange rate models in a panel data setting. To
tackle the issue of heterogeneity, these relationships are also estimated for di�erent sub-
samples: sub-samples of countries classi�ed according to their level of development (i.e.
advanced economies, emerging markets, and developing countries), sub-samples based
on geographical considerations and sub-samples of countries belonging to a currency
block (such as the European Monetary Union). We also rely on the Pooled Mean Group
(PMG) estimator (Pesaran et al., 1999) which permits a greater degree of heterogeneity
�compared to the Fully-Modi�ed OLS and Dynamic OLS procedures� by allowing
short-run coe�cients and error variances to di�er across groups.17 Equilibrium real
exchange rates (ERERs) are derived from the �tted value of real e�ective exchange
rates given by the estimated equilibrium relationship.
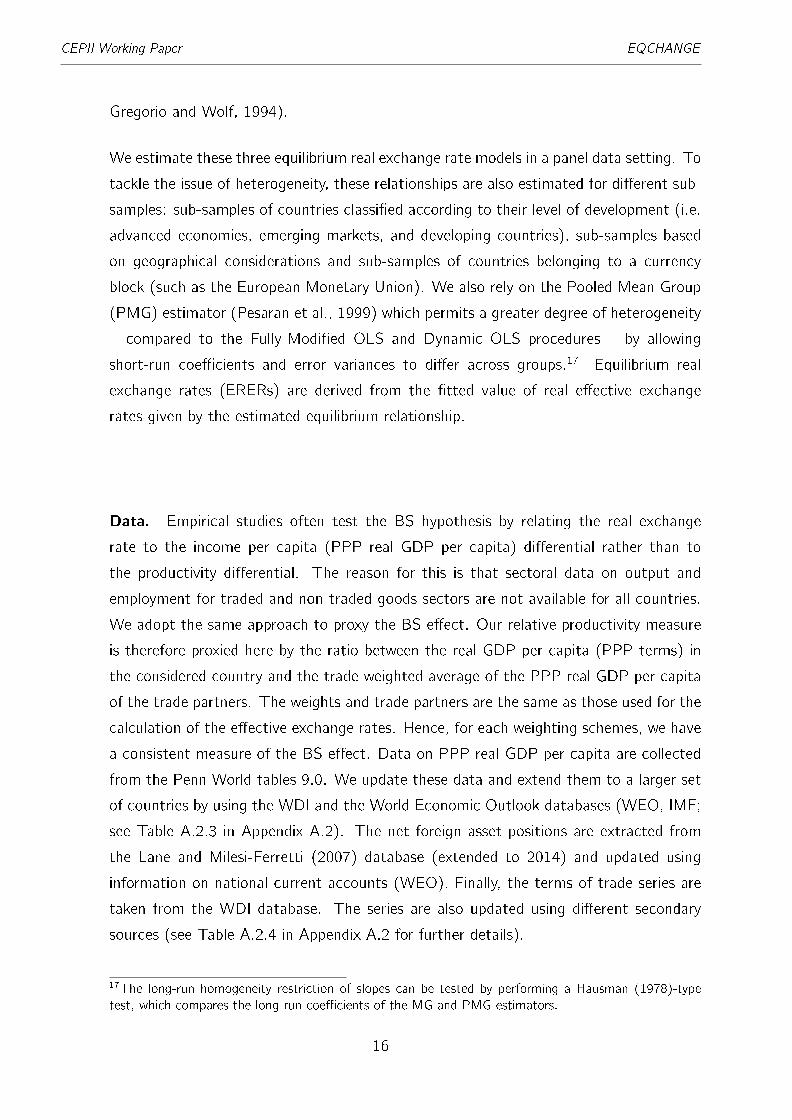
Data. Empirical studies often test the BS hypothesis by relating the real exchange
rate to the income per capita (PPP real GDP per capita) di�erential rather than to
the productivity di�erential. The reason for this is that sectoral data on output and
employment for traded and non-traded goods sectors are not available for all countries.
We adopt the same approach to proxy the BS e�ect. Our relative productivity measure
is therefore proxied here by the ratio between the real GDP per capita (PPP terms) in
the considered country and the trade weighted average of the PPP real GDP per capita
of the trade partners. The weights and trade partners are the same as those used for the
calculation of the e�ective exchange rates. Hence, for each weighting schemes, we have
a consistent measure of the BS e�ect. Data on PPP real GDP per capita are collected
from the Penn World tables 9.0. We update these data and extend them to a larger set
of countries by using the WDI and the World Economic Outlook databases (WEO, IMF;
see Table A.2.3 in Appendix A.2). The net foreign asset positions are extracted from
the Lane and Milesi-Ferretti (2007) database (extended to 2014) and updated using
information on national current accounts (WEO). Finally, the terms of trade series are
taken from the WDI database. The series are also updated using di�erent secondary
sources (see Table A.2.4 in Appendix A.2 for further details).
17The long-run homogeneity restriction of slopes can be tested by performing a Hausman (1978)-type
test, which compares the long-run coe�cients of the MG and PMG estimators.
16

CEPII Working Paper EQCHANGE
Benchmark speci�cation results. As an illustration, we present here some of our
regression results.18 Table 2 reports the estimated coe�cients from our benchmark
speci�cations, based on the whole sample of countries and broad REER indexes. The
estimated coe�cients correspond to the estimates of the � coe�cients in models 1, 2
and 3 for the alternative weighting schemes used to calculate real e�ective exchange
rates.
As discussed above, economic theory predicts positive coe�cients for the three funda-
mentals of the real exchange rate that we have considered. From Table 2 it is clear that
the coe�cients for the GDP per capita, net foreign assets and the terms of trade have
the expected positive sign and are signi�cant for all or at least for the great majority of
model speci�cations.
However as the coe�cients are estimated in a panel setting, they also depend on the
sample of countries over which the model is estimated. To illustrate this we report in
Table 3 the � coe�cients estimated under the same baseline speci�cation as before on
sub-samples of countries according their level of development. The three fundamentals
exhibit a statistically signi�cant relationship with real exchange rates for the developing
countries: the coe�cients are signi�cant and have the expected sign. For emerging and
advanced economies, the coe�cient for GDP per capita is either not signi�cant or has
not the expected positive sign, especially for model 3.19
These �ndings illustrate that the estimates depend on the countries considered in the
sample, the combination of explanatory variables included in the model and the particular
methodological approach being used to assess REER. For this reason, the EQCHANGE
database o�ers several di�erent options in the estimation procedure.20 This allows users
to get a potential range of equilibrium exchange rates' assessments for a particular
country and an idea of margins of uncertainty that are inherent to this type of estimations.
18For the sake of brevity, we do not report all regression estimations. Appendix B shows all the results of
the econometric estimations of models 1, 2 and 3, including narrow REER indexes and other sub-samples
of countries.19As suggested by De Gregorio and Wolf (1994), the fact that the relative income variable becomes
insigni�cant when adding the terms of trade variable means that it may play a proxy role for terms of trade
shocks in models when the latter are ignored. Indeed, the GDP per capita allows for additional demand
side e�ects, arising, for example, from non-homothetic preferences linking demand shares and hence the
real exchange rate to the level of income. Therefore, it can be reasonably expected that the GDP per
capita also captures the income e�ect caused by the terms of trade.20The choice among these options will depend not only on the context but also on the research objective.
17

CEPII Working Paper EQCHANGE
2.2.2. Derivation of currency misalignments time series
The last step consists in combining series of real e�ective exchange rates with series
of equilibrium exchange rates to derive currency misalignments for each country. Basi-
cally, we calculate, for each country i , the di�erence between the observed real e�ective
exchange rate (reeri ;t) and its equilibrium level (ereri ;t) at date t:
Misi ;t = reeri ;t � ereri ;t (6)
Misalignments' values then give the magnitude of the real exchange rate adjustment
that would restore equilibrium. Given the de�nition of the real e�ective exchange rate,
a negative sign of the misalignment (i.e., reeri ;t < ereri ;t) indicates an undervaluation
(the real exchange rate must appreciate to converge towards its long-run equilibrium
value), whereas a positive sign (i.e., reeri ;t > ereri ;t) indicates an overvaluation of the
real e�ective exchange rate (the real exchange rate must depreciate to converge towards
its long-run equilibrium value).
By construction, currency misalignments from the BEER approach imply that each coun-
try has a REER in equilibrium on average over the estimation period. This assumption
can be considered as plausible, given the length of the estimation period. Fundamen-
tals' and REERs' variations then allow the REER deviating from this average value with
alternating periods of undervaluation and overvaluation. Indeed, as shown in Equation
(6), currency misalignments can be explained by a change in REERs and/or a change
in ERERs. By providing these two series, the EQCHANGE database allows users to
identify exactly the roots of currency misalignments in a particular country. Furthermore,
it also allows alternate currency misalignments' indicators depending on the selection of
the speci�c equilibrium relationship estimated (model 1, 2 or 3), of the countries' sample
(whole sample or sub-samples depending on the level of development, geographical or
exchange rate regime considerations) used in the regressions and of the real e�ective
exchange rate index (narrow or broad).21 The availability of di�erent currency misalign-
ments' indicators gives then some idea on the robustness of our estimates, but also
allows any researcher using these estimates to perform robustness checks.
21Due to these di�erent options, 18 possible estimates of ERER are then available for each country (2
REER indexes � 3 ERER models � 3 countries' samples).
18

CEPIIWorkingPaper
EQCHANGE
Table 2 � Equilibrium exchange rate model estimations (all countries, 186 trade partners)Weighting Fixed Time-varying weights
system (1973-2016) (2008-2012) (5-year averages)
Model (1) (2) (3) (1) (2) (3) (1) (2) (3)
BS 0.327*** 0.431*** 0.0771*** 0.276*** 0.249*** -0.0238 0.368*** 0.409*** 0.0740***
(0.0222) (0.0268) (0.0227) (0.0204) (0.0229) (0.0210) (0.0215) (0.0218) (0.0209)
NFA 0.166*** 0.0466*** 0.177*** 0.0431*** 0.163*** 0.0432***
(0.0145) (0.00616) (0.0135) (0.00580) (0.0150) (0.00569)
TOT 0.402*** 0.480*** 0.419***
(0.0309) (0.0308) (0.0307)
Note: Standard errors are in parentheses. *** p<0.01, ** p<0.05, * p<0.1. The reported estimates correspond to the long-run dynamics coe�cients. See Appendix Bfor the complete results.
Table 3 � Equilibrium exchange rate model estimations (sub-samples of countries, 186 trade partners)Weighting Fixed Time-varying weights
system (1973-2016) (2008-2012) (5-year averages)
Model (1) (2) (3) (1) (2) (3) (1) (2) (3)
Advanced economies
BS 0.0911* -0.0490 -0.0639** -0.0127 -0.173*** -0.0801*** 0.605*** -0.299*** 0.0481
(0.0486) (0.0365) (0.0313) (0.0363) (0.0295) (0.0242) (0.115) (0.0553) (0.0526)
NFA 0.0469*** 0.0159* 0.0589*** 0.0266** -0.0211 0.0176*
(0.00739) (0.00944) (0.00916) (0.0110) (0.0137) (0.00978)
TOT 1.028*** 0.833*** 1.018***
(0.0785) (0.0923) (0.0747)
Emerging economies
BS 0.380*** 0.735*** -0.0438 0.278*** 0.630*** -0.0965** 0.336*** 0.478*** -0.0184
(0.0403) (0.0440) (0.0352) (0.0398) (0.0542) (0.0379) (0.0354) (0.0325) (0.0208)
NFA 0.183*** 0.0111 0.150*** 0.0158 0.227*** 0.132***
(0.0383) (0.0283) (0.0339) (0.0264) (0.0358) (0.0236)
TOT 0.232*** 0.336*** 0.208***
(0.0312) (0.0363) (0.0289)
Developing countries
BS 0.390*** 0.258*** 0.727*** 0.327*** 0.154*** 0.244*** 0.406*** 0.102*** 0.226***
(0.0288) (0.0310) (0.0343) (0.0252) (0.0262) (0.0297) (0.0285) (0.0141) (0.0232)
NFA 0.211*** 0.0910*** 0.257*** 0.0456*** 0.191*** 0.116***
(0.0185) (0.0132) (0.0202) (0.00802) (0.0172) (0.00836)
TOT 0.113*** 0.266*** -0.166***
(0.0419) (0.0334) (0.0317)
Note: Standard errors are in parentheses. *** p<0.01, ** p<0.05, * p<0.1. The reported estimates correspond to the long-run dynamics coe�cients. See Appendix Bfor the complete results.
19
CEPIIWorkingPaper
EQCHANGE
EQCHANGE
Weighting system:
"f1", "bar" or "TV"
Number of
trade partners:
186 or 30
Equilibrium real exchange rates
&
Currency misalignments
E�ective exchange rates
� NEER (2010=100)
� REER (2010=100)
Sample
All countries Development level
Others:
Monetary unions or
geographical (sub-)regions
AEs EMEs DCs
Model 1, 2 or 3:
� ERER (in natural logarithm)
� MIS (scale of numbers: 10�2)
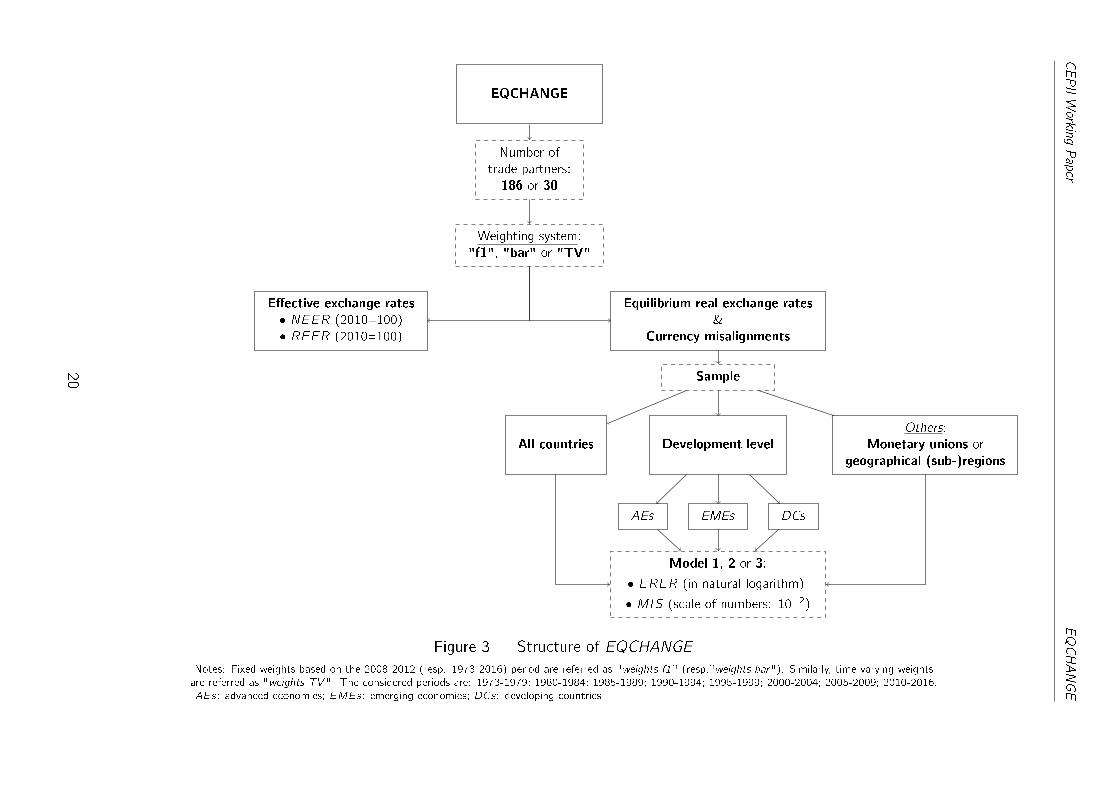
Figure 3 � Structure of EQCHANGE
Notes: Fixed weights based on the 2008-2012 (resp. 1973-2016) period are referred as "weights f1" (resp."weights bar"). Similarly, time-varying weights
are referred as "weights TV". The considered periods are: 1973-1979; 1980-1984; 1985-1989; 1990-1994; 1995-1999; 2000-2004; 2005-2009; 2010-2016.
AEs: advanced economies; EMEs: emerging economies; DCs: developing countries.
20

CEPII Working Paper EQCHANGE
2.3. How to use EQCHANGE
EQCHANGE (http://www.cepii.fr/CEPII/fr/bdd_modele/presentation.asp?id=34) has
the advantage to be an online web resource that provides simple and quick access to time
series of nominal and real e�ective exchange rates (resp. NEER and REER), as well as
equilibrium real exchange rates (ERER; in natural logarithm) and currency misalignments
(MIS ; scale of numbers: 10�2).22 The structure of EQCHANGE is presented in Figure
3.
3. Currency misalignments in 2016: an overview
+/- 100% +/- 70% +/- 35% +/- 10%
Figure 4 � Currency misalignments (in absolute values)Source: Data correspond to the averages of estimates over the di�erent models and weighting systems.
In this section, we provide a few �gures and tables that o�er more speci�c indications
about the kind of analyses that are possible with EQCHANGE. Given margins of uncer-
tainty inherent to ERER estimates, the magnitude of currency misalignments in absolute
terms (for one country and one year) should be viewed with caution.23 It is therefore
preferable to use ERER estimates to carry out analyses in relative terms, including the
pattern of the world distribution of currencies' misalignments as well as the pattern of
their evolutions and the factors underlining these dynamics.
22To express currency misalignments as a percentage, �gures must be multiplied by 100.23This also encourages concentrating on substantial misalignments rather than on small deviations.
21

CEPII Working Paper EQCHANGE
Figure 4 maps currency misalignments (in absolute values) for the year 2016, the most
recent year for which data are available.24 The most striking result is that currency
misalignments in 2016 were weaker in advanced economies than in developing (DC) and
emerging (EME) countries. The picture for EMEs and DCs is however quite diverse,
highlighting important heterogeneity within those groups of countries. Substantial cur-
rency misalignments (greater than 100%) are indeed observed in some countries like
Angola, Mozambique, Myanmar, Nicaragua, Sierra Leone, Venezuela, Zambia and Zim-
babwe. Other economies such as Argentina, Cambodia, South Africa, Iraq, Uganda, and
the United Arab Emirates also displayed high currency misalignments, although of less
magnitude.
Figures 5 and 6 provide further evidence on the con�guration of global currency misalign-
ments in 2016 by distinguishing countries whose currencies were undervalued (Figure 5)
from those whose currencies were, on the contrary, overvalued (Figure 6).
As no model provides a precise answer on the magnitude of the misalignment, Tables
4 and 5 report the averages and standard deviations of estimated misalignments across
the di�erent types of speci�cations and for each country belonging to our sample.25
A signi�cant point shown by Figures 5 and 6 is that undervalued and overvalued curren-
cies were concentrated geographically. Indeed, in 2016 almost all the Asian economies as
well as the Near and Middle East countries had undervalued currencies while in African
economies, overvaluations were more frequent. Among European countries, undervalu-
ations mostly prevailed in Western European countries �except in Portugal� though
in di�erent degrees: undervaluations were relatively sizeable in the core members of the
euro zone, i.e. France, Germany and the Netherlands (around 15 to 10%), while being
more modest in Belgium, Cyprus, Finland, Italy, and Spain (below 5.5%). In contrast,
overvaluations mostly occurred in Eastern European countries.
In order to illustrate trends from 2015 to 2016, Figure 7 plots the distribution of misalign-
ments' changes during this period. As can be seen, the distribution is slightly negatively
skewed indicating a small tendency towards a reduction in currency misalignments from
2015 to 2016. The extent of these changes is also mixed, with about half of them
reaching between -10 and +10 percentage points and with important disparities across
24Aruba, Cayman Islands, Cuba and Syria are excluded �for this particular year� due to data availability
issues.25Indeed, even if the di�erent models point in the same direction with more or less similar results, it is
preferable to know the con�dence interval for the estimates (see also Figures C.3 in Appendix).
22

CEPII Working Paper EQCHANGE
+/- 100% +/- 70% +/- 35% +/- 10%
Figure 5 � Undervalued currenciesSource: Data correspond to the averages of estimates over the di�erent models and weighting systems.
+/- 100% +/- 70% +/- 35% +/- 10%
Figure 6 � Overvalued currenciesSource: Data correspond to the averages of estimates over the di�erent models and weighting systems.
23

CEPII Working Paper EQCHANGE
Table 4 � Countries whose currencies are undervalued
CountryMisalignement
CountryMisalignment
Mean Std. Err. Mean Std. Err.
Nicaragua -6.028 0.30 Ireland -0.148 0.07
Macedonia TFYR -4.106 0.08 Germany -0.148 0.05
Myanmar -2.291 0.13 Equatorial Guinea -0.136 0.16
Malawi -1.759 0.29 Bahrain -0.136 0.02
Mozambique -1.695 0.59 France -0.134 0.09
Zambia -1.404 0.37 Brazil -0.128 0.07
South Africa -0.950 0.10 Netherlands -0.108 0.05
Iraq -0.872 0.98 Canada -0.108 0.02
Lebanon -0.832 0.09 Mexico -0.101 0.02
Uganda -0.776 0.09 Chad -0.100 0.03
Argentina -0.740 0.06 Korea Rep -0.096 0.10
Ghana -0.686 0.11 Belize -0.090 0.12
Uzbekistan -0.676 0.02 Jamaica -0.086 0.12
Cambodia -0.604 0.87 Grenada -0.083 0.20
Iran -0.561 0.08 Saudi Arabia -0.081 0.05
Gabon -0.513 0.10 Afghanistan -0.079 0.08
Tanzania -0.463 0.15 Cameroon -0.077 0.12
Viet Nam -0.391 0.55 Russian Federation -0.073 0.04
Algeria -0.390 0.06 Pakistan -0.070 0.05
Malaysia -0.380 0.07 Dominica -0.065 0.10
Guinea -0.369 0.13 Panama -0.063 0.26
Guyana -0.351 0.06 Luxembourg -0.059 0.02
Lesotho -0.315 0.15 Thailand -0.057 0.08
Colombia -0.308 0.06 Spain -0.055 0.09
Guinea Bissau -0.297 0.18 Finland -0.054 0.07
Indonesia -0.295 0.13 Sweden -0.053 0.04
Chile -0.252 0.07 China -0.048 0.20
Libya -0.250 0.26 Madagascar -0.045 0.07
Dominican Rep -0.227 0.09 Swaziland -0.044 0.45
Oman -0.223 0.13 Belgium -0.043 0.03
Senegal -0.195 0.04 Bhutan -0.040 0.09
India -0.185 0.12 Tunisia -0.035 0.07
Ukraine -0.174 0.05 Kyrgyzstan -0.030 0.07
Congo -0.172 0.11 Belarus -0.027 0.06
Norway -0.168 0.11 Fiji -0.024 0.07
Côte d'Ivoire -0.168 0.11 Italy -0.023 0.09
Azerbaijan -0.168 0.14 Cyprus -0.014 0.10
Namibia -0.167 0.10 Saint Kitts and Nevis -0.010 0.14
Sao Tome and Principe -0.166 0.21 Kiribati -0.010 0.06
Turkmenistan -0.164 0.05 Slovenia -0.003 0.03
Japan -0.161 0.07 Mauritania -0.001 0.09
Rwanda -0.156 0.14
Note: The values in the column "Mean" (resp. "Std. Err.") correspond to the averages (resp. standard errors)of the estimates over all the speci�cations (i.e. models, number of trade partners, and weighting systems). Toexpress currency misalignments as a percentage, �gures in the "Mean" columns must be multiplied by 100.
24

CEPII Working Paper EQCHANGE
Table 5 � Countries whose currencies are overvalued
CountryMisalignement
CountryMisalignment
Mean Std. Err. Mean Std. Err.
Paraguay 0.001 0.04 Philippines 0.169 0.06
Bosnia Herzegovina 0.003 0.09 New Zealand 0.171 0.06
Georgia 0.006 0.07 Bolivia 0.174 0.08
Antigua and Barbuda 0.013 0.15 Portugal 0.179 0.09
Congo DR 0.016 0.03 Maldives 0.181 0.09
Burundi 0.017 0.14 Bangladesh 0.184 0.03
Botswana 0.021 0.06 Iceland 0.185 0.19
Latvia 0.023 0.05 Papua New Guinea 0.197 0.08
Niger 0.036 0.17 Estonia 0.211 0.07
Ethiopia 0.038 0.13 Serbia 0.216 0.06
Togo 0.041 0.11 Armenia 0.220 0.07
Morocco 0.044 0.04 Moldova Rep 0.223 0.03
Saint Lucia 0.049 0.13 Suriname 0.228 0.08
Lithuania 0.049 0.08 Slovakia 0.234 0.04
Brunei Darussalam 0.050 0.16 Albania 0.238 0.10
Tajikistan 0.054 0.11 Honduras 0.243 0.05
Tonga 0.056 0.04 Costa Rica 0.244 0.04
Greece 0.057 0.08 Mongolia 0.250 0.13
Bahamas 0.057 0.03 Peru 0.262 0.06
Seychelles 0.067 0.15 Switzerland 0.265 0.06
Israel 0.069 0.08 Gambia 0.279 0.12
El Salvador 0.078 0.20 Mali 0.292 0.29
Mauritius 0.081 0.19 Czechia 0.297 0.05
Nepal 0.085 0.11 Turkey 0.316 0.12
Australia 0.090 0.13 Uruguay 0.368 0.08
Ecuador 0.093 0.06 Sudan 0.372 0.05
Marshall Islands 0.094 0.02 Barbados 0.389 0.07
Singapore 0.094 0.14 Montenegro 0.401 0.09
Egypt 0.097 0.12 Burkina Faso 0.422 0.32
Benin 0.098 0.07 Guatemala 0.445 0.05
Kuwait 0.104 0.21 Trinidad and Tobago 0.466 0.05
Central African Rep 0.111 0.13 Hungary 0.485 0.26
Sri Lanka 0.115 0.11 Djibouti 0.523 0.05
United Kingdom 0.117 0.04 Haiti 0.559 0.06
Cabo Verde 0.119 0.18 Kazakhstan 0.559 0.21
Samoa 0.120 0.06 Kenya 0.585 0.10
Nigeria 0.121 0.06 Qatar 0.593 0.46
Denmark 0.123 0.06 Malta 0.614 0.29
China Hong Kong SAR 0.123 0.06 Lao PDR 0.655 0.26
Austria 0.124 0.05 Bulgaria 0.660 0.26
Solomon Islands 0.127 0.08 Liberia 0.694 0.41
Romania 0.129 0.12 Yemen 0.706 0.04
USA 0.138 0.05 United Arab Emirates 0.856 0.44
Croatia 0.139 0.02 Sierra Leone 1.027 0.24
Comoros 0.139 0.12 Angola 1.320 1.19
Poland 0.149 0.10 Venezuela 3.343 0.08
Vanuatu 0.155 0.09 Zimbabwe 39.326 0.58
Jordan 0.163 0.10
Note: The values in the column "Mean" (resp. "Std. Err.") correspond to the averages (resp. standard errors)of the estimates over all the speci�cations (i.e. models, number of trade partners, and weighting systems). Toexpress currency misalignments as a percentage, �gures in the "Mean" columns must be multiplied by 100.
25

CEPII Working Paper EQCHANGE
countries and regions.
Figure 7 � Distribution of the changes in currency misalignmentsNote: We excluded 5 outliers (Macedonia, Myanmar, Nicaragua, Venezuela and Zimbabwe).
The black line represents the kernel density.
This disparity across countries primarily re�ects two factors. First, the persistence of
weak oil prices between 2015 and 2016 continued to a�ect in di�erent ways equilibrium
exchange rates of commodity exporters and of non-resource-intensive countries. Second,
many commodity exporters with �exible exchange rate regimes faced sizeable currency
depreciation in response to weakening commodity prices, while countries with pegged
currencies couldn't, by de�nition, bene�t from this coping mechanism. Figure 8 shows
the geographical con�guration of changes in currency misalignments, while Figures 9
illustrate the extent to which these evolutions have been related to variations in real
e�ective exchange rates and/or in equilibrium real exchange rates. The countries can
then be classi�ed in several categories, according to the evolutions of their ERER and
their REER. Policy implications about changes in misalignments can also be drawn on
a number of grounds, including the magnitude of these variations (small or large), the
direction of these changes (improvement or worsening) and �nally the roots of these
evolutions (depending on whether they come from an improvement in fundamentals or
an adjustment in the real e�ective exchange rate).
Regarding the magnitude of changes in currency misalignments, the �rst bisector in
Figures 9 represents all the countries for which evolutions in real e�ective exchange
rates have been in line with those in underlying fundamentals. By de�nition, countries
that are located close to this �rst bisector, or approach it, have registered small variations
26
CEPII Working Paper EQCHANGE
in their currencies' misalignments from 2015 to 2016 (graphs on the left in Figures 9).
For the other countries, currencies' misalignments have evolved markedly (graphs on
the right in Figures 9). These changes have re�ected either a worsened situation (large
increases in misalignments, graph top right) or an improved situation (large reductions
of misalignments, graph below right).
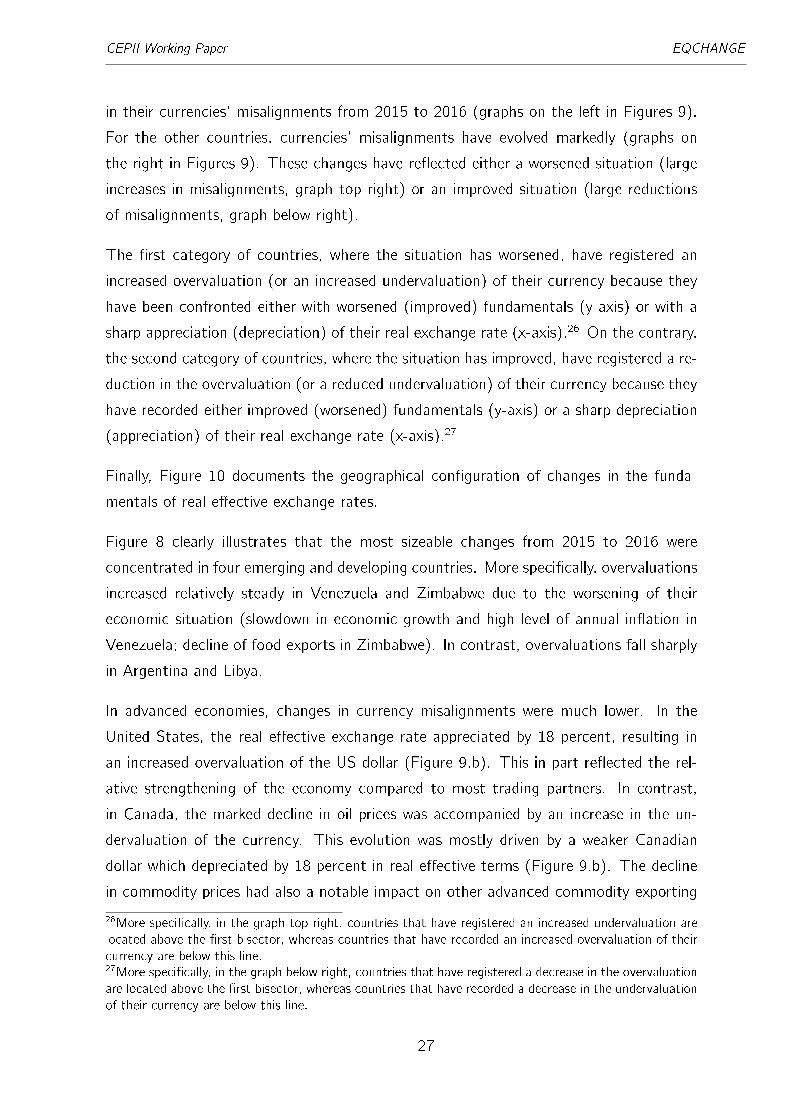
The �rst category of countries, where the situation has worsened, have registered an
increased overvaluation (or an increased undervaluation) of their currency because they
have been confronted either with worsened (improved) fundamentals (y-axis) or with a
sharp appreciation (depreciation) of their real exchange rate (x-axis).26 On the contrary,
the second category of countries, where the situation has improved, have registered a re-
duction in the overvaluation (or a reduced undervaluation) of their currency because they
have recorded either improved (worsened) fundamentals (y-axis) or a sharp depreciation
(appreciation) of their real exchange rate (x-axis).27
Finally, Figure 10 documents the geographical con�guration of changes in the funda-
mentals of real e�ective exchange rates.
Figure 8 clearly illustrates that the most sizeable changes from 2015 to 2016 were
concentrated in four emerging and developing countries. More speci�cally, overvaluations
increased relatively steady in Venezuela and Zimbabwe due to the worsening of their
economic situation (slowdown in economic growth and high level of annual in�ation in
Venezuela; decline of food exports in Zimbabwe). In contrast, overvaluations fall sharply
in Argentina and Libya.
In advanced economies, changes in currency misalignments were much lower. In the
United States, the real e�ective exchange rate appreciated by 18 percent, resulting in
an increased overvaluation of the US dollar (Figure 9.b). This in part re�ected the rel-
ative strengthening of the economy compared to most trading partners. In contrast,
in Canada, the marked decline in oil prices was accompanied by an increase in the un-
dervaluation of the currency. This evolution was mostly driven by a weaker Canadian
dollar which depreciated by 18 percent in real e�ective terms (Figure 9.b). The decline
in commodity prices had also a notable impact on other advanced commodity-exporting
26More speci�cally, in the graph top right, countries that have registered an increased undervaluation are
located above the �rst bisector, whereas countries that have recorded an increased overvaluation of their
currency are below this line.27More speci�cally, in the graph below right, countries that have registered a decrease in the overvaluation
are located above the �rst bisector, whereas countries that have recorded a decrease in the undervaluation
of their currency are below this line.
27

CEPII Working Paper EQCHANGE
Increase of Mis: j�Mis:j � 5 p.p. Reduction of Mis: !
Figure 8 � Changes in currency misalignments between 2015 and 2016Source: Data correspond to changes (in percentage point) in the average misalignments.
countries such as Australia and Norway. The overvaluation of the Australian dollar in-
creased further due to worsened fundamentals (Figure 9.e), while Norway experienced a
decrease in its currency's overvaluation due to the depreciation of its real exchange rate
(Figure 9.d). In the euro area (Figure 9.d), the depreciation of the euro coupled with
some structural reforms and internal devaluations caused a generalized movement of real
depreciations. This general trend led currencies of most peripheral countries being less
overvalued and currencies of the core members (especially in France, Germany and the
Netherlands) more undervalued. As can be seen in Figure 9.d, reduced overvaluations in
the peripheral countries were not driven by stronger fundamentals. Instead they occurred
mostly because of depreciated real exchange rates. Therefore it is quite likely that this
correction will not be sustainable in the long run. In contrast, the livre sterling appreci-
ated by 25 percent from 2015 to 2016, which resulted in the increase of the currency's
overvaluation (Figure 9.d). In 2016 the undervaluation of the Japanese yen increased.
This trend mainly re�ected the e�ects of the depreciation of the real exchange rate,
partly driven by the strong monetary expansion adopted by the government since early
2013 (Figure 9.c).
Trends across emerging markets and developing economies also displayed heterogeneity.
Real exchange rate depreciations occurred in Russia and Ukraine and o�set deteriorating
fundamentals, especially in the Russian case. This resulted in a sharp decrease of the
28
CEPII Working Paper EQCHANGE
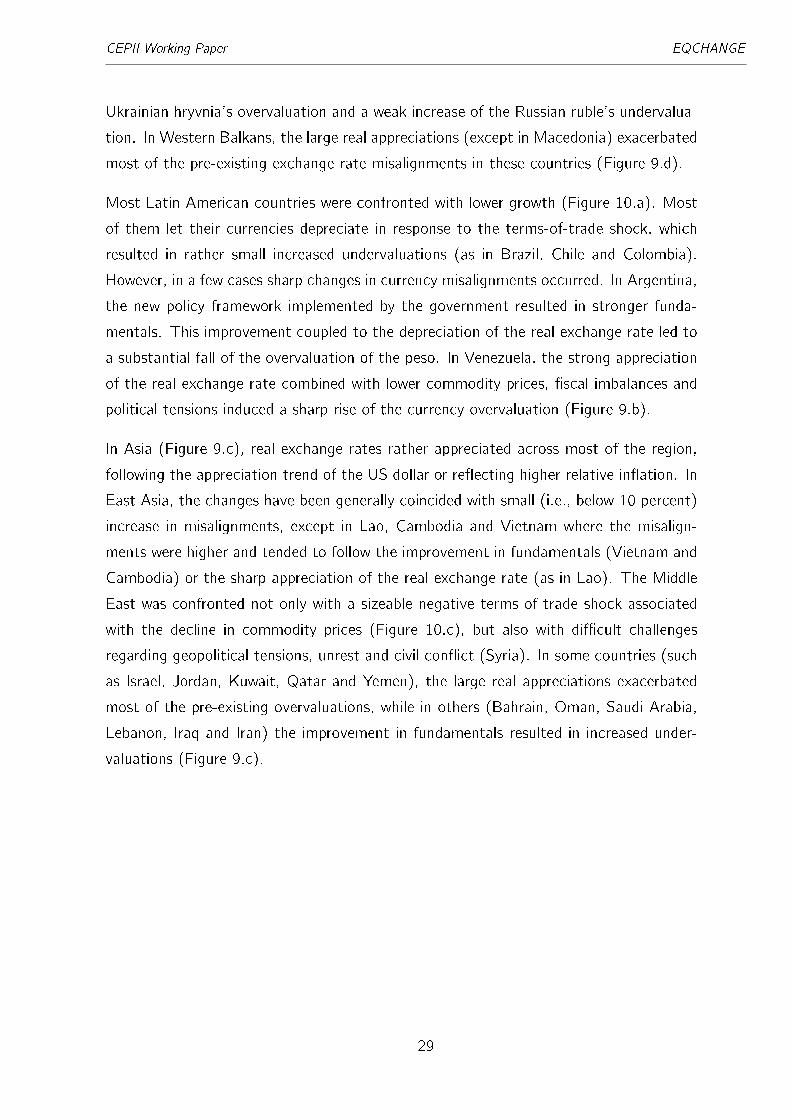
Ukrainian hryvnia's overvaluation and a weak increase of the Russian ruble's undervalua-
tion. In Western Balkans, the large real appreciations (except in Macedonia) exacerbated
most of the pre-existing exchange rate misalignments in these countries (Figure 9.d).
Most Latin American countries were confronted with lower growth (Figure 10.a). Most
of them let their currencies depreciate in response to the terms-of-trade shock, which
resulted in rather small increased undervaluations (as in Brazil, Chile and Colombia).
However, in a few cases sharp changes in currency misalignments occurred. In Argentina,
the new policy framework implemented by the government resulted in stronger funda-
mentals. This improvement coupled to the depreciation of the real exchange rate led to
a substantial fall of the overvaluation of the peso. In Venezuela, the strong appreciation
of the real exchange rate combined with lower commodity prices, �scal imbalances and
political tensions induced a sharp rise of the currency overvaluation (Figure 9.b).
In Asia (Figure 9.c), real exchange rates rather appreciated across most of the region,
following the appreciation trend of the US dollar or re�ecting higher relative in�ation. In
East Asia, the changes have been generally coincided with small (i.e., below 10 percent)
increase in misalignments, except in Lao, Cambodia and Vietnam where the misalign-
ments were higher and tended to follow the improvement in fundamentals (Vietnam and
Cambodia) or the sharp appreciation of the real exchange rate (as in Lao). The Middle
East was confronted not only with a sizeable negative terms-of-trade shock associated
with the decline in commodity prices (Figure 10.c), but also with di�cult challenges
regarding geopolitical tensions, unrest and civil con�ict (Syria). In some countries (such
as Israel, Jordan, Kuwait, Qatar and Yemen), the large real appreciations exacerbated
most of the pre-existing overvaluations, while in others (Bahrain, Oman, Saudi Arabia,
Lebanon, Iraq and Iran) the improvement in fundamentals resulted in increased under-
valuations (Figure 9.c).
29
CEPIIWorkingPaper
EQCHANGE
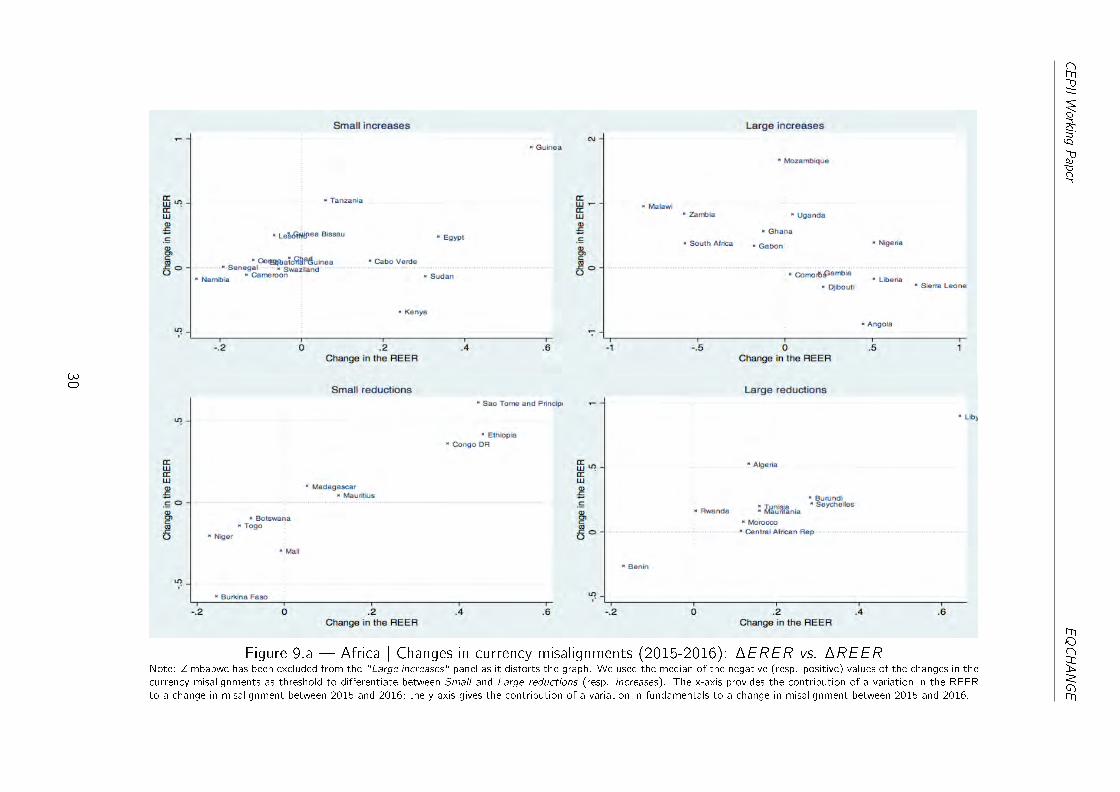
Figure 9.a � Africa | Changes in currency misalignments (2015-2016): �ERER vs. �REERNote: Zimbabwe has been excluded from the "Large increases" panel as it distorts the graph. We used the median of the negative (resp. positive) values of the changes in the
currency misalignments as threshold to di�erentiate between Small and Large reductions (resp. increases). The x-axis provides the contribution of a variation in the REER
to a change in misalignment between 2015 and 2016; the y-axis gives the contribution of a variation in fundamentals to a change in misalignment between 2015 and 2016.
30

CEPIIWorkingPaper
EQCHANGE
Figure 9.b � America | Changes in currency misalignments (2015-2016): �ERER vs. �REERNote: Nicaragua and Venezuela have been excluded from the "Large increases" panel as they distort the graph. We used the median of the negative (resp. positive) values
of the changes in the currency misalignments as threshold to di�erentiate between Small and Large reductions (resp. increases). The x-axis provides the contribution of
a variation in the REER to a change in misalignment between 2015 and 2016; the y-axis gives the contribution of a variation in fundamentals to a change in misalignment
between 2015 and 2016.
31

CEPIIWorkingPaper
EQCHANGE
Figure 9.c � Asia | Changes in currency misalignments (2015-2016): �ERER vs. �REERNote: Kazakhstan and Myanmar have been respectively excluded from the "Small increases" and "Large reductions" panel as they distort the graph. We used the median
of the negative (resp. positive) values of the changes in the currency misalignments as threshold to di�erentiate between Small and Large reductions (resp. increases). The
x-axis provides the contribution of a variation in the REER to a change in misalignment between 2015 and 2016; the y-axis gives the contribution of a variation in fundamentals
to a change in misalignment between 2015 and 2016.
32

CEPIIWorkingPaper
EQCHANGE
Figure 9.d � Europe | Changes in currency misalignments (2015-2016): �ERER vs. �REERNote: Macedonia has been excluded from the "Large increases" panel as it distorts the graph. We used the median of the negative (resp. positive) values of the changes
in the currency misalignments as threshold to di�erentiate between Small and Large reductions (resp. increases). The x-axis provides the contribution of a variation in the
REER to a change in misalignment between 2015 and 2016; the y-axis gives the contribution of a variation in fundamentals to a change in misalignment between 2015 and
2016.
33

CEPIIWorkingPaper
EQCHANGE
Figure 9.e � Oceania | Changes in currency misalignments (2015-2016): �ERER vs. �REERNote: We used the median of the negative (resp. positive) values of the changes in the currency misalignments as threshold to di�erentiate between Small and Large reductions
(resp. increases). The x-axis provides the contribution of a variation in the REER to a change in misalignment between 2015 and 2016; the y-axis gives the contribution of a
variation in fundamentals to a change in misalignment between 2015 and 2016.
34

CEPII Working Paper EQCHANGE
Decrease Increase !
Figure 10.a � Changes in real GDP per capita (in PPP terms) between 2015 and 2016
Finally, Sub-Saharan Africa also faced challenging conditions due not only to economic
factors but also to droughts in Southern Africa (Lesotho, Malawi, Zambia, and Zim-
babwe), pests and security issues. Currency misalignments of several oil and commodity
exporters (such as Angola and Zimbabwe) rose sharply and resulted in increased over-
valuations due to worsened fundamentals. In particular the deterioration of net foreign
asset positions was a main factor behind the worsening of fundamentals in this region
(Figure 10.b). On the contrary, other countries (such as Malawi and Zambia) regis-
tered increased undervaluations due to depreciated real exchange rates and appreciated
equilibrium real exchange rates (Figure 9.a).
35

CEPII Working Paper EQCHANGE
Deterioration Improvement !
Figure 10.b � Changes in the net foreign asset positions between 2015 and 2016
Deterioration Improvement !
Figure 10.c � Changes in the terms of trade between 2015 and 2016
36

CEPII Working Paper EQCHANGE
4. Conclusion
In order to create regular and public resources which consistently document currency
misalignments across countries and over a reasonably long time-span, the CEPII has de-
veloped EQCHANGE, a world database on e�ective exchange rates. This paper describes
the design and implementation of this database.
EQCHANGE relies on the creation of two datasets �one on e�ective exchange rates,
the other one on equilibrium real e�ective exchange rates and corresponding currency mis-
alignments� and innovates in a number of ways. The �rst sub-database on e�ective ex-
change rates is the most complete available database in terms of countries/time coverage
as it provides indices of nominal and real e�ective exchange rates for 187 economies over
the 1973-2016 period. Moreover, those indices are calculated under several assumptions
(related to the weighting scheme and to the panel of trading partners). The second
sub-database on equilibrium exchange rates and corresponding currency misalignments
represents by far the most substantial contribution introduced by EQCHANGE. The dif-
ferent series provided by this dataset are available for 182 economies with data also
ranging from 1973 to 2016. Equilibrium exchange rates are estimated using the BEER
approach. However, to take into account the sensibility of these estimates to the choice
of fundamentals and of the countries' sample, estimations are run under three di�erent
reduced equations of the real e�ective exchange rate and over various sub-samples of
economies. Several currency misalignments can then be deduced depending on the se-
lection of real e�ective exchange rates indices, the equilibrium exchange rate model and
countries' sample.
Therefore, in delivering di�erent series of e�ective exchange rates and of equilibrium
exchange rates, the EQCHANGE database conducted by the CEPII provides di�erent
�consistent� estimates of currency misalignments that facilitate cross-country compar-
isons and also documents, for each country, the various factors a�ecting these currency
misalignments. To illustrate this, the paper also presents the evolution and main traits
of the world con�guration of currency misalignments from 2015 to 2016.
The EQCHANGE database may have several other potential applications. Indeed, it
should be used not only to assess, track, and monitor currency misalignments, but also
to better understand the e�ects of these distortions on many aspects of the functioning
of economies, such as on the e�ciency of resource allocation, economic growth and
global imbalances.
37

CEPII Working Paper EQCHANGE
References
Alberola, E. (2003). Misalignment, liabilities dollarization and exchange rate adjust-
ment in Latin America, Banco de España, Working Paper 0309.
Alberola, E., Cervero, S., López, H., Ubide, A. (1999). Global equilibrium exchange
rates: euro, dollar, ins, outs, and other major currencies in a panel cointegration
framework, IMF Working Paper WP/99/175.
Balassa, B. (1964). The purchasing power parity doctrine: A reappraisal, Journal of
Political Economy 72: 584-596.
Bénassy-Quéré, A., Béreau, S., Mignon, V. (2008). Equilibrium Exchange Rates: a
Guidebook for the Euro-Dollar Rate, CEPII Working Paper, 2008-02.
Bénassy-Quéré, A., Béreau, S., Mignon, V. (2010). On the Complementarity of
Equilibrium Exchange-Rate Approaches, Review of International Economics 18(4):
618-632.
Bénassy-Quéré, A., Duran-Vigneron, P., Mignon, V., Lahrèche-Révil, A., (2004).
Burden Sharing and Exchange Rate Misalignments within the Group of Twenty, CEPII
Working Paper, 2004-13.
Carton, B., Hervé, K. (2013). Is There any Rebalancing in the Euro Area?, CEPII
Working Paper, 2013-32.
Clark, P., MacDonald, R. (1998). Exchange rates and economic fundamentals: a
methodological comparison of BEERs and FEERs, IMF working paper 98/00.
Cline, W.R. (2008). Estimating Consistent Fundamental Equilibrium Exchange Rates,
Working Paper 08-6 (July), Washington: Peterson Institute for International Eco-
nomics.
Cline, W.R., Williamson, J. (2008). New Estimates of Fundamental Equilibrium
Exchange Rates, Policy Brief, Peterson Institute for International Economics.
Coudert, V., Couharde, C., Mignon, V. (2013). Do real exchange rates still matter
within the euro area?, Review of International Economics 21(1): 35-48.
Couharde, C., Delatte, A-L., Grekou, C., Mignon, V., Morvillier, F. (2017). Sur- et
sous-évaluations de change en zone euro: vers une correction soutenable des déséquili-
bres?, La Lettre du CEPII, N°375, March 2017.
De Gregorio, J., Wolf, H. (1994). Terms of Trade, Productivity and the Real Ex-
change Rate, NBER Working Paper No. 4807, National Bureau of Economic Re-
search, Cambridge, MA.
Driver, R., Westaway, P.F. (2004). Concepts of equilibrium exchange rates, Bank of
England Working Paper n° 248.
Edwards, S. (1988). Real and monetary determinants of real exchange rate behavior:
38

CEPII Working Paper EQCHANGE
Theory and evidence from developing countries, Journal of Development Economics
29(3): 311- 341.
Elbadawi, I. (1994). Estimating Long-Run Equilibrium Real Exchange Rates, in J.
Williamson (ed.), Estimating Equilibrium Exchange Rates, Washington, D.C.: Insti-
tute for International Economics.
Elbadawi, I., Soto, R. (2008). Theory and empirics of real exchange rates in de-
veloping countries, Documentos de trabajo 324, Instituto de Economica, Ponti�cia
Universidad Católica de Chile.
Faruqee, H. (1995). Long-run determinants of the real exchange rate: A stock�ow
perspective, IMF Sta� Papers, 42(1): 80�107.
Hausman, J.A. (1978). Speci�cation Tests in Econometrics, Econometrica 46(6):
1251-1271.
Hinkle, L., Montiel, P. (1999). Exchange Rate Misalignment: Concepts and Mea-
surement for Developing Countries, Oxford: Oxford University Press.
IMF (2006). Methodology for CGER Exchange Rate Assessments, International Mon-
etary Fund, Washington DC.
https://www.imf.org/external/np/pp/eng/2006/110806.pdf
Lane, P.R., Milesi-Ferretti, G.M., (2002). External wealth, the trade balance, and
the real exchange rate, European Economic Review 46(6): 1049-1071.
Lane, P.R., Milesi-Ferretti, G.M., (2007). The external wealth of nations mark II:
Revised and extended estimates of foreign assets and liabilities, 1970�2004, Journal
of International Economics 73: 223-250.
MacDonald, R. (2000). Concepts to Calculate Equilibrium Exchange Rates: An
Overview, Discussion paper 3/00, Economic Research Group of the Deutsche Bun-
desbank.
Pesaran, M.H., Shin, Y., Smith, R.P.. Pooled Mean Group Estimation of Dynamic
Heterogeneous Panels, Journal of the American Statistical Association 94(446): 621-
634.
Samuelson, P. (1964). Theoretical notes on trade problems, Review of Economics
and Statistics 46: 145-154.
Rosensweig, J.A. (1987). Exchange Rate Index Construction: With a US Dollar
Application, Journal of Foreign Exchange and International Finance 1(3): 293-301.
Turner, P., Van't dack, J. (1993). Measuring international price and cost compet-
itiveness, BIS Economic Papers No 39, Bank for International Settlements, Basel,
Swizterland.
Williamson, J. (1994). Estimates of FEERs, in Estimating Equilibrium Exchange
Rates, ed. by John Williamson, Washington: Institute for International Economics.
39

CEPIIWorkingPaper
EQCHANGE
Appendices
A. Data
A.1 SamplesTable A.1 � List of the countries
Advanced Emerging Developing
Australia Albania Latvia Afghanistan Equatorial Guinea Mauritius Swaziland
Austria Algeria Lebanon Angola Eritrea Moldova Syrian Arab Rep.
Belgium Argentina Lithuania Antigua & Barbuda Ethiopia Mongolia Tajikistan
Canada Armenia Macedonia Azerbaijan Fiji Montenegro Tanzania
Cyprus Belarus Malaysia Bahamas Gabon Mozambique Togo
Denmark Bermuda* Mexico Bahrain Gambia Myanmar Tonga
Finland Bosnia & Herzegovina Morocco Bangladesh Ghana Namibia Trinidad & Tobago
France Brazil Pakistan Barbados Grenada Nepal Turkmenistan
Germany Bulgaria Panama Belize Guinea Nicaragua Uganda
Greece Chile Peru Benin Guinea-Bissau Niger United Arab Emirates
Hong Kong China Philippines Bhutan Guyana Nigeria Uzbekistan
Iceland Colombia Poland Bolivia Haiti Oman Vanuatu
Ireland Costa Rica Romania Botswana Honduras Palau* Yemen
Israel Croatia Russia Brunei Darussalam Iran Papua New Guinea Zambia
Italy Czech Rep. Sebia Rep. Burkina Faso Iraq Paraguay Zimbabwe
Japan Dominican Rep. Slovak Rep. Burundi Kenya Qatar
Luxembourg Ecuador South Africa Cambodia Kiribati Rwanda
Malta Egypt Sri Lanka Cameroon Kuwait Sao Tomé & Principe
Netherlands El Salvador Thailand Cape Verde Kyrgyz Rep. Samoa
New Zealand Estonia Tunisia Cayman Islands Laos Saudi Arabia
Norway Georgia Turkey Central African Rep. Lesotho Senegal
Portugal Guatemala Ukraine Chad Liberia Seychelles
Singapore Hungary Uruguay Comoros Libya Sierra Leone
Slovenia India Venezuela Congo, Dem. Rep Madagascar Solomon Islands
Spain Indonesia Vietnam Congo Rep. Malawi Somalia*
Sweden Jamaica Cote d'Ivoire Maldives St. Kitts & Nevis
Switzerland Jordan Cuba Mali St. Lucia
United Kingdom Kazakhstan Djibouti Marshall Islands Sudan
United States Korea Dominica Mauritania Suriname
Note: `'* `' indicates the countries that are excluded in the equilibrium real exchange rates database. For France we have also computed �separately� both nominal and real e�ectiveexchange rates for the mainland, New Caledonia and French Polynesia. These latter two territories are excluded from the database on equilibrium real exchange rates.
40

CEPII Working Paper EQCHANGE
A.1.1. Geographical groupings: regions and sub-regions 28
Africa
Eastern Africa
Burundi, Comoros, Djibouti, Ethiopia, Kenya, Madagascar, Malawi, Mauritius, Mozam-
bique, Rwanda, Somalia, Uganda, Tanzania, Zambia, Zimbabwe.
Middle Africa
Angola, Cameroon, Central African Republic, Chad, Congo D.R., Congo Rep., Equato-
rial Guinea, Gabon, Sao Tome and Principe.
Northern Africa
Algeria, Egypt, Libya, Morocco, Sudan, Tunisia.
Southern Africa
Botswana, Lesotho, Namibia, South Africa, Swaziland.
Western Africa
Benin, Burkina Faso, Cabo Verde, Cote d'Ivoire, Gambia, Ghana, Guinea, Guinea-Bissau,
Liberia, Mali, Mauritania, Niger, Nigeria, Senegal, Sierra Leone, Togo.
America
Caribbean
Anguilla, Antigua and Barbuda, Aruba, Bahamas, Barbados, Cayman Islands, Cuba, Do-
minica, Dominican Rep., Grenada, Haiti, Jamaica, Saint Kitts and Nevis, Saint Lucia,
Trinidad and Tobago.
Central America
Belize, Costa Rica, El Salvador, Guatemala, Honduras, Mexico, Nicaragua, Panama.
South America
Argentina, Bolivia, Brazil, Chile, Colombia, Ecuador, Paraguay, Peru, Suriname, Uruguay,
Venezuela.
Northern America
Bermuda, Canada, United States of America.
Asia
Central Asia
Kazakhstan, Kyrgyzstan, Tajikistan, Turkmenistan, Uzbekistan.
Eastern Asia
28We used the online version of the United Nations publication "Standard Country or Area Codes for
Statistical Use" originally published as Series M, No. 49 and now commonly referred to as the M49
standard. https://unstats.un.org/unsd/methods/m49/m49regin.htm (last access: 04/04/2017).
41

CEPII Working Paper EQCHANGE
China, China Hong Kong SAR, China, Japan, Korea Rep., Mongolia.
Southern Asia
Afghanistan, Bangladesh, Bhutan, India, Iran, Nepal, Pakistan, Sri Lanka.
South-Eastern Asia
Brunei Darussalam, Cambodia, Indonesia, Lao People's Dem. Rep., Malaysia, Myanmar,
Philippines, Singapore, Thailand, Viet Nam.
Western Asia
Armenia, Azerbaijan, Bahrain, Cyprus, Georgia, Iraq, Israel, Jordan, Kuwait, Lebanon,
Oman, Qatar, Saudi Arabia, Syria, Turkey, United Arab Emirates, Yemen.
Europe
Eastern Europe
Belarus, Bulgaria, Czechia, Hungary, Poland, Moldova Rep., Romania, Russian Federa-
tion, Slovakia, Ukraine.
Northern Europe
Denmark, Estonia, Finland, Ireland, Latvia, Lithuania, Norway, Sweden, United King-
dom.
Southern Europe
Albania, Bosnia and Herzegovina, Croatia, Greece, Italy, Malta, Montenegro, Portugal,
Serbia, Slovenia, Spain, Macedonia (TFYR).
Western Europe
Austria, Belgium, France, Germany, Luxembourg, Netherlands, Switzerland.
Oceania
Australia, Fiji, New Zealand, Papua New Guinea, Solomon Islands, Vanuatu, Marshall
Islands, Samoa, Tonga.
A.1.2. Monetary unions
Common monetary area (CMA)
Lesotho, Namibia, South Africa, Swaziland.
CFA zone
Central African Economic and Monetary Community (CAEMC)
Cameroon, Central African Republic, Chad, Republic of the Congo, Equatorial Guinea,
Gabon.
West African Economic and Monetary Union (WAEMU)
42
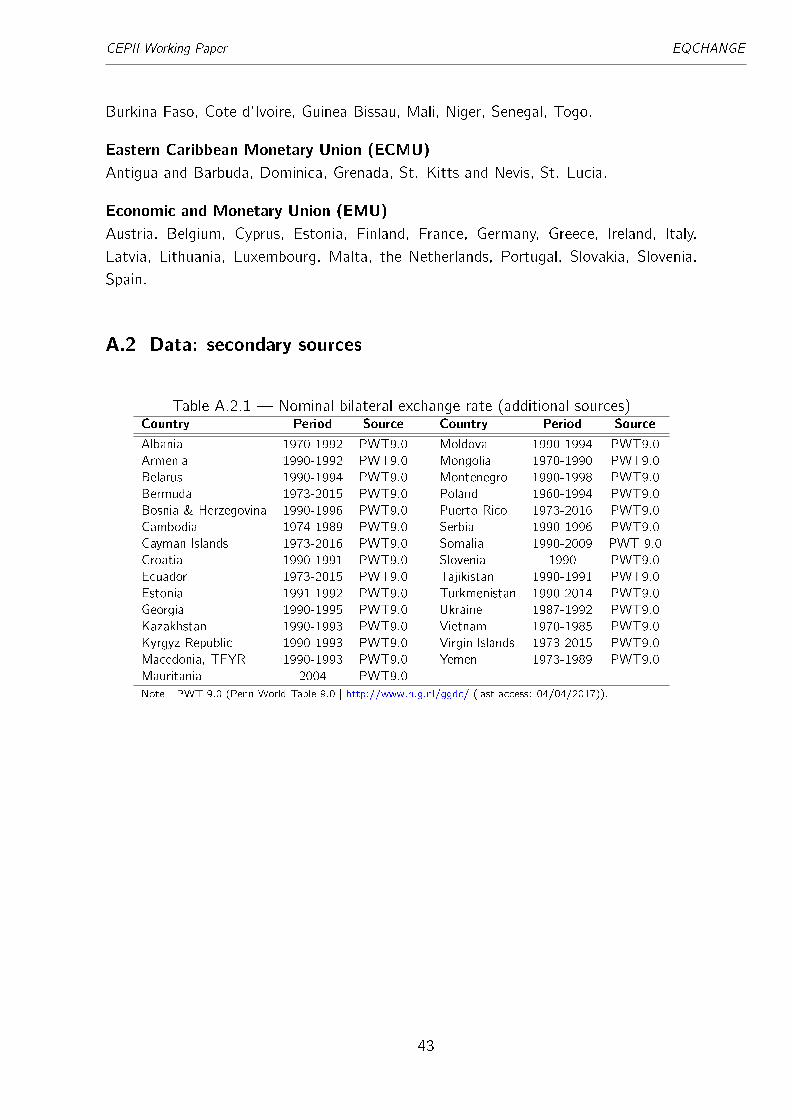
CEPII Working Paper EQCHANGE
Burkina Faso, Cote d'Ivoire, Guinea-Bissau, Mali, Niger, Senegal, Togo.
Eastern Caribbean Monetary Union (ECMU)
Antigua and Barbuda, Dominica, Grenada, St. Kitts and Nevis, St. Lucia.
Economic and Monetary Union (EMU)
Austria, Belgium, Cyprus, Estonia, Finland, France, Germany, Greece, Ireland, Italy,
Latvia, Lithuania, Luxembourg, Malta, the Netherlands, Portugal, Slovakia, Slovenia,
Spain.
A.2 Data: secondary sources
Table A.2.1 � Nominal bilateral exchange rate (additional sources)Country Period Source Country Period Source
Albania 1970-1992 PWT9.0 Moldova 1990-1994 PWT9.0
Armenia 1990-1992 PWT9.0 Mongolia 1970-1990 PWT9.0
Belarus 1990-1994 PWT9.0 Montenegro 1990-1998 PWT9.0
Bermuda 1973-2015 PWT9.0 Poland 1960-1994 PWT9.0
Bosnia & Herzegovina 1990-1996 PWT9.0 Puerto Rico 1973-2016 PWT9.0
Cambodia 1974-1989 PWT9.0 Serbia 1990-1996 PWT9.0
Cayman Islands 1973-2016 PWT9.0 Somalia 1990-2009 PWT 9.0
Croatia 1990-1991 PWT9.0 Slovenia 1990 PWT9.0
Ecuador 1973-2015 PWT9.0 Tajikistan 1990-1991 PWT9.0
Estonia 1991-1992 PWT9.0 Turkmenistan 1990-2014 PWT9.0
Georgia 1990-1995 PWT9.0 Ukraine 1987-1992 PWT9.0
Kazakhstan 1990-1993 PWT9.0 Vietnam 1970-1985 PWT9.0
Kyrgyz Republic 1990-1993 PWT9.0 Virgin Islands 1973-2015 PWT9.0
Macedonia, TFYR 1990-1993 PWT9.0 Yemen 1973-1989 PWT9.0
Mauritania 2004 PWT9.0
Note : PWT 9.0 (Penn World Table 9.0 | http://www.rug.nl/ggdc/ (last access: 04/04/2017)).
43
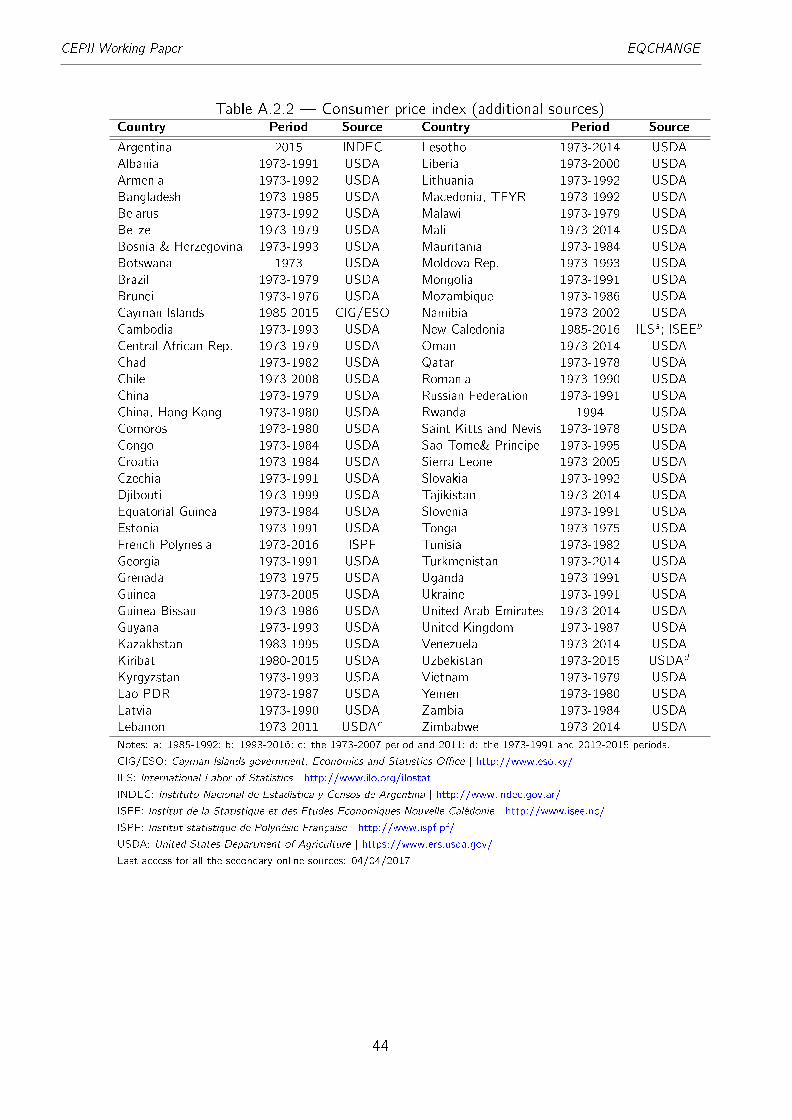
CEPII Working Paper EQCHANGE
Table A.2.2 � Consumer price index (additional sources)Country Period Source Country Period Source
Argentina 2015 INDEC Lesotho 1973-2014 USDA
Albania 1973-1991 USDA Liberia 1973-2000 USDA
Armenia 1973-1992 USDA Lithuania 1973-1992 USDA
Bangladesh 1973-1985 USDA Macedonia, TFYR 1973-1992 USDA
Belarus 1973-1992 USDA Malawi 1973-1979 USDA
Belize 1973-1979 USDA Mali 1973-2014 USDA
Bosnia & Herzegovina 1973-1993 USDA Mauritania 1973-1984 USDA
Botswana 1973 USDA Moldova Rep. 1973-1993 USDA
Brazil 1973-1979 USDA Mongolia 1973-1991 USDA
Brunei 1973-1976 USDA Mozambique 1973-1986 USDA
Cayman Islands 1985-2015 CIG/ESO Namibia 1973-2002 USDA
Cambodia 1973-1993 USDA New Caledonia 1985-2016 ILSa; ISEEb
Central African Rep. 1973-1979 USDA Oman 1973-2014 USDA
Chad 1973-1982 USDA Qatar 1973-1978 USDA
Chile 1973-2008 USDA Romania 1973-1990 USDA
China 1973-1979 USDA Russian Federation 1973-1991 USDA
China, Hong Kong 1973-1980 USDA Rwanda 1994 USDA
Comoros 1973-1980 USDA Saint Kitts and Nevis 1973-1978 USDA
Congo 1973-1984 USDA Sao Tome& Principe 1973-1995 USDA
Croatia 1973-1984 USDA Sierra Leone 1973-2005 USDA
Czechia 1973-1991 USDA Slovakia 1973-1992 USDA
Djibouti 1973-1999 USDA Tajikistan 1973-2014 USDA
Equatorial Guinea 1973-1984 USDA Slovenia 1973-1991 USDA
Estonia 1973-1991 USDA Tonga 1973-1975 USDA
French Polynesia 1973-2016 ISPF Tunisia 1973-1982 USDA
Georgia 1973-1991 USDA Turkmenistan 1973-2014 USDA
Grenada 1973-1975 USDA Uganda 1973-1991 USDA
Guinea 1973-2005 USDA Ukraine 1973-1991 USDA
Guinea Bissau 1973-1986 USDA United Arab Emirates 1973-2014 USDA
Guyana 1973-1993 USDA United Kingdom 1973-1987 USDA
Kazakhstan 1983-1995 USDA Venezuela 1973-2014 USDA
Kiribati 1980-2015 USDA Uzbekistan 1973-2015 USDAd
Kyrgyzstan 1973-1993 USDA Vietnam 1973-1979 USDA
Lao PDR 1973-1987 USDA Yemen 1973-1980 USDA
Latvia 1973-1990 USDA Zambia 1973-1984 USDA
Lebanon 1973-2011 USDAc Zimbabwe 1973-2014 USDA
Notes: a: 1985-1992; b: 1993-2016; c: the 1973-2007 period and 2011; d: the 1973-1991 and 2012-2015 periods.
CIG/ESO: Cayman Islands government, Economics and Statistics O�ce | http://www.eso.ky/
ILS: International Labor of Statistics | http://www.ilo.org/ilostat
INDEC: Instituto Nacional de Estadística y Censos de Argentina | http://www.indec.gov.ar/
ISEE: Institut de la Statistique et des Etudes Economiques Nouvelle-Calédonie | http://www.isee.nc/
ISPF: Institut statistique de Polynésie Française | http://www.ispf.pf/
USDA: United States Department of Agriculture | https://www.ers.usda.gov/
Last access for all the secondary online sources: 04/04/2017.
44

CEPII Working Paper EQCHANGE
Table A.2.3 � Real GDP per capita in PPP terms (additional sources)Country Period Source Country Period Source
Afghanistan 1980-2001 WEO, WDI Papua New-Guinea 1980-2016 WEO
Aruba 2011 WDI Palau 1991-2015 WDI
Bermuda 1990-2013 WDI Russian Federation 1990-1991 WDI
Cayman Islands 2013 WDI Samoa 1980-2016 WEO, WDI
Cuba 1990-2013 WDI Serbia 1995-2015 WDI
Guyana 1980-2016 WEO Slovakia 1992 WDI
Iraq 1990-2015 WDI Solomon Islands 1980-2016 WEO
Kiribati 1980-2016 WEO Tonga 1980-2016 WEO
Liberia 1998-1999 WDI Uzbekistan 1990-1992 WDI
Marshall Islands 1990-2016 WEO, WDI Vanuatu 1980-2016 WEO
Myanmar 1990-1997 WDI Zimbabwe 1990-1997 WDI
Nicaragua 1990-1993 WDI
Note: WDI: World Development indicators (World Bank); WEO: World Economic Outlook (InternationalMonetary Fund).
Table A.2.4 � Terms of trade (additional sources)Country Period Source Country Period Source
Australia 1973-2015/16 OECD/EIKON Lithuania 2016 EIKON
Austria 1973-2015/16 OECD/EIKON Luxembourg 1973-2015/16 OECD/EIKON
Brazil 2016 EIKON Mexico 1973-2015/16 OECD/EIKON
Belgium 1973-2015/16 OECD/EIKON Netherlands 1973-2015/16 OECD/EIKON
Canada 1973-2015/16 OECD/EIKON New Zealand 1973-2015/16 OECD/EIKON
China 2016 EIKON Norway 1973-2015/16 OECD/EIKON
Colombia 1973-1979 EIKON Pakistan 2016 EIKON
Denmark 1973-2015/16 OECD/EIKON Peru 2016 EIKON
Ecuador 2016 EIKON Poland 1990-2015/16 OECD/EIKON
El Salvador 2016 EIKON Portugal 1973-2015/16 OECD/EIKON
Estonia 1993-2015/16 OECD/EIKON Russia 1995-2015 OECD
Finland 1973-2015/16 OECD/EIKON Serbia 2016 EIKON
France 1973-2015/16 OECD/EIKON Singapore 2016 EIKON
Germany 1973-2015/16 OECD/EIKON Slovenia 1990-2015 OECD
Greece 1973-2015/16 OECD/EIKON Slovakia 1992-2015/16 OECD/EIKON
Hong Kong 2016 EIKON South Africa 1973-2015/16 OECD/EIKON
Hungary 1991-2015/16 OECD/EIKON Spain 1973-2015/16 OECD/EIKON
Indonesia 2016 EIKON Sri Lanka 2016 EIKON
Ireland 1973-2015/16 OECD/EIKON Sweden 1973-2015 OECD
Island 1973-2015 OECD Switzerland 1973-2015/16 OECD/EIKON
Israel 2016 EIKON Thailand 2016 EIKON
Italy 1973-2015/16 EIKON Turkey 1973-2015/16 OECD/EIKON
Japan 1973-2015/16 OECD/EIKON United Kingdom 1973-2015/16 EIKON
Jordan 2016 EIKON Ukraine 2016 EIKON
Korea 1973-2015/16 OECD/EIKON United States 1973-2015/16 EIKON
Latvia 1995-2015/16 OECD/EIKON
Notes: OECD: Organisation for Economic Co-operation and Development; EIKON: EIKON Thomson Reuters.
A.3 The data: comparisons of the e�ective exchange rates
45

CEPIIWorkingPaper
EQCHANGE
Table A.3.1 � Correlation matrix (NEERs)CEPII
IMF BruegelFixed Fixed Time-varying
(1973-2016) (2008-2012) (5-years)
Nb. 100 67 172 30 186 30 186 30 186
IMF 100 1.0000
Bruegel67 0.9995 1.0000
172 0.9994 1.0000 1.0000
Fixed 30 0.9992 1.0000 1.0000 1.0000
(1973-2016) 186 0.9992 1.0000 1.0000 1.0000 1.0000
CEPIIFixed 30 0.9992 1.0000 1.0000 1.0000 1.0000 1.0000
(2008-2012) 186 0.9992 1.0000 1.0000 1.0000 1.0000 1.0000 1.0000
Time-varying 30 0.9992 1.0000 1.0000 1.0000 1.0000 1.0000 1.0000 1.0000
(5-years) 186 0.9992 1.0000 1.0000 1.0000 1.0000 1.0000 1.0000 1.0000 1.0000
Note: correlations based on 2402 observations. Nb. (in both lines and columns) indicates the number of considered trade partners.
Table A.3.2 � Correlation matrix (REERs)CEPII
IMF WB BruegelFixed Fixed Time-varying
(1973-2016) (2008-2012) (5-years)
Nb. 100 108 67 172 30 186 30 186 30 186
IMF 100 1.0000
WB 108 0.9970 1.0000
Bruegel67 0.5144 0.5172 1.0000
172 0.4503 0.4517 0.9896 1.0000
Fixed 30 0.4858 0.4858 0.6944 0.6925 1.0000
(1973-2016) 186 0.5050 0.5052 0.7363 0.7354 0.9969 1.0000
CEPIIFixed 30 0.5670 0.5666 0.8115 0.8108 0.9544 0.9670 1.0000
(2008-2012) 186 0.5739 0.5739 0.8373 0.8376 0.9428 0.9605 0.9974 1.0000
Time-varying 30 0.4276 0.4276 0.6130 0.6112 0.9703 0.9598 0.9009 0.8844 1.0000
(5-years) 186 0.4596 0.4598 0.6633 0.6617 0.9785 0.9742 0.9252 0.9136 0.9963 1.0000
Note: correlations based on 2402 observations. Nb. (in both lines and columns) indicates the number of considered trade partners.
46

CEPIIWorkingPaper
EQCHANGE
B. The estimations
B.1. Estimations (186 trade partners)
Table B.1 � Equilibrium exchange rate model estimations (all countries)Weighting Fixed Time-varying weights
system (1973-2016) (2008-2012) (5-year averages)
Model (1) (2) (3) (1) (2) (3) (1) (2) (3)
Long-run dynamics
BS 0.327*** 0.431*** 0.0771*** 0.276*** 0.249*** -0.0238 0.368*** 0.409*** 0.0740***
(0.0222) (0.0268) (0.0227) (0.0204) (0.0229) (0.0210) (0.0215) (0.0218) (0.0209)
NFA 0.166*** 0.0466*** 0.177*** 0.0431*** 0.163*** 0.0432***
(0.0145) (0.00616) (0.0135) (0.00580) (0.0150) (0.00569)
TOT 0.402*** 0.480*** 0.419***
(0.0309) (0.0308) (0.0307)
Short-run dynamics
e:c: -0.182*** -0.146*** -0.179*** -0.184*** -0.155*** -0.181*** -0.182*** -0.148*** -0.185***
(0.0173) (0.0142) (0.0150) (0.0166) (0.0141) (0.0167) (0.0183) (0.0146) (0.0165)
D:BS 0.199 0.130 0.151 0.212* 0.159 0.175 0.222** 0.176 0.189
(0.123) (0.125) (0.151) (0.114) (0.121) (0.140) (0.103) (0.115) (0.123)
D:NFA 0.0124 0.0573*** -0.00408 0.0521** 0.00643 0.0553**
(0.0412) (0.0211) (0.0506) (0.0205) (0.0413) (0.0237)
D:TOT 0.0871 0.0906 0.121
(0.111) (0.116) (0.185)
Constant 0.908*** 0.770*** 0.514*** 0.908*** 0.784*** 0.437*** 0.914*** 0.775*** 0.518***
(0.0834) (0.0719) (0.0429) (0.0790) (0.0689) (0.0399) (0.0890) (0.0738) (0.0459)
Note: Standard errors are in parentheses. *** p<0.01, ** p<0.05, * p<0.1. "e.c." denotes the error-correction term.
47

CEPIIWorkingPaper
EQCHANGE
B.1.1. Development levels
Table B.1.1.1 � Equilibrium exchange rate model estimations (advanced economies)Weighting Fixed Time-varying weights
system (1973-2016) (2008-2012) (5-year averages)
Model (1) (2) (3) (1) (2) (3) (1) (2) (3)
Long-run dynamics
BS 0.0911* -0.0490 -0.0639** -0.0127 -0.173*** -0.0801*** 0.605*** -0.299*** 0.0481
(0.0486) (0.0365) (0.0313) (0.0363) (0.0295) (0.0242) (0.115) (0.0553) (0.0526)
NFA 0.0469*** 0.0159* 0.0589*** 0.0266** -0.0211 0.0176*
(0.00739) (0.00944) (0.00916) (0.0110) (0.0137) (0.00978)
TOT 1.028*** 0.833*** 1.018***
(0.0785) (0.0923) (0.0747)
Short-run dynamics
e:c: -0.160*** -0.164*** -0.204*** -0.147*** -0.166*** -0.190*** -0.153*** -0.153*** -0.189***
(0.0352) (0.0300) (0.0335) (0.0255) (0.0293) (0.0306) (0.0455) (0.0334) (0.0347)
D:BS -0.0414 -0.0353 -0.122** 0.0264 -0.0117 -0.0817** -0.0536 0.0511 -0.0705*
(0.0638) (0.0691) (0.0591) (0.0652) (0.0447) (0.0395) (0.0540) (0.0486) (0.0392)
D:NFA -0.0371 -0.0719 -0.0399 -0.0798* -0.0260 -0.0671
(0.0524) (0.0451) (0.0502) (0.0461) (0.0548) (0.0460)
D:TOT 0.347*** 0.378*** 0.334***
(0.0960) (0.0910) (0.0904)
Constant 0.732*** 0.764*** -0.020*** 0.677*** 0.783*** 0.155*** 0.681*** 0.716*** -0.0134***
(0.161) (0.142) (0.00554) (0.117) (0.138) (0.0239) (0.209) (0.156) (0.00414)
Note: Standard errors are in parentheses. *** p<0.01, ** p<0.05, * p<0.1. "e.c." denotes the error-correction term.
48

CEPIIWorkingPaper
EQCHANGE
Table B.1.1.2 � Equilibrium exchange rate model estimations (emerging economies)Weighting Fixed Time-varying weights
system (1973-2016) (2008-2012) (5-year averages)
Model (1) (2) (3) (1) (2) (3) (1) (2) (3)
Long-run dynamics
BS 0.380*** 0.735*** -0.0438 0.278*** 0.630*** -0.0965** 0.336*** 0.478*** -0.0184
(0.0403) (0.0440) (0.0352) (0.0398) (0.0542) (0.0379) (0.0354) (0.0325) (0.0208)
NFA 0.183*** 0.0111 0.150*** 0.0158 0.227*** 0.132***
(0.0383) (0.0283) (0.0339) (0.0264) (0.0358) (0.0236)
TOT 0.232*** 0.336*** 0.208***
(0.0312) (0.0363) (0.0289)
Short-run dynamics
e:c: -0.210*** -0.190*** -0.194*** -0.221*** -0.197*** -0.200*** -0.207*** -0.189*** -0.211***
(0.0390) (0.0367) (0.0333) (0.0377) (0.0364) (0.0358) (0.0404) (0.0371) (0.0380)
D:BS 0.511** 0.324 0.223*** 0.453* 0.332 0.162** 0.478** 0.327* 0.236***
(0.259) (0.210) (0.0753) (0.241) (0.240) (0.0758) (0.195) (0.171) (0.0618)
D:NFA -0.0248 0.133*** -0.0517 0.134*** -0.0397 0.0913**
(0.115) (0.0380) (0.156) (0.0375) (0.110) (0.0396)
D:TOT -0.0717 -0.104 -0.131
(0.0588) (0.0665) (0.0804)
Constant 1.012*** 0.994*** 0.675*** 1.046*** 1.003*** 0.597*** 0.990*** 0.960*** 0.773***
(0.185) (0.187) (0.118) (0.176) (0.180) (0.109) (0.192) (0.184) (0.143)
Note: Standard errors are in parentheses. *** p<0.01, ** p<0.05, * p<0.1. "e.c." denotes the error-correction term.
49

CEPIIWorkingPaper
EQCHANGE
Table B.1.1.3 � Equilibrium exchange rate model estimations (developing countries)Weighting Fixed Time-varying weights
system (1973-2016) (2008-2012) (5-year averages)
Model (1) (2) (3) (1) (2) (3) (1) (2) (3)
Long-run dynamics
BS 0.390*** 0.258*** 0.727*** 0.327*** 0.154*** 0.244*** 0.406*** 0.102*** 0.226***
(0.0288) (0.0310) (0.0343) (0.0252) (0.0262) (0.0297) (0.0285) (0.0141) (0.0232)
NFA 0.211*** 0.0910*** 0.257*** 0.0456*** 0.191*** 0.116***
(0.0185) (0.0132) (0.0202) (0.00802) (0.0172) (0.00836)
TOT 0.113*** 0.266*** -0.166***
(0.0419) (0.0334) (0.0317)
Short-run dynamics
e:c: -0.179*** -0.140*** -0.150*** -0.185*** -0.147*** -0.192*** -0.172*** -0.149*** -0.172***
(0.0216) (0.0153) (0.0194) (0.0210) (0.0155) (0.0230) (0.0225) (0.0166) (0.0176)
D:BS 0.0988 0.0700 0.141 0.138 0.115 0.237 0.159 0.159 0.222
(0.175) (0.198) (0.277) (0.163) (0.181) (0.257) (0.155) (0.190) (0.225)
D:NFA 0.0332 0.0736** 0.0186 0.0531** 0.0338 0.0490
(0.0426) (0.0294) (0.0417) (0.0265) (0.0453) (0.0336)
D:TOT 0.126 0.128 0.272
(0.203) (0.211) (0.340)
Constant 0.949*** 0.753*** 0.789*** 0.963*** 0.764*** 0.725*** 0.924*** 0.762*** 1.005***
(0.108) (0.0799) (0.102) (0.104) (0.0783) (0.0852) (0.114) (0.0834) (0.0994)
Note: Standard errors are in parentheses. *** p<0.01, ** p<0.05, * p<0.1. "e.c." denotes the error-correction term.
50

CEPIIWorkingPaper
EQCHANGE
B.1.2. Monetary unions
Table B.1.2.1 � Equilibrium exchange rate model estimations (CAEMC)Weighting Fixed Time-varying weights
system (1973-2016) (2008-2012) (5-year averages)
Model (1) (2) (3) (1) (2) (3) (1) (2) (3)
Long-run dynamics
BS 0.220** 0.0736* 0.172* 0.0473 0.0551 0.255** 0.123**
(0.0887) (0.0401) (0.0908) (0.0615) (0.0400) (0.123) (0.0606)
NFA 0.143*** 0.167* 0.163** 0.177***
(0.0447) (0.0939) (0.0743) (0.0431)
TOT -0.0347 -0.0292 -0.158**
(0.0498) (0.0729) (0.0745)
Short-run dynamics
e:c: -0.171*** -0.322*** -0.170*** -0.193*** -0.264*** -0.153*** -0.278***
(0.0425) (0.0719) (0.0461) (0.0455) (0.0705) (0.0325) (0.0687)
D:BS -0.166* -0.201 -0.231* -0.275** -0.290 -0.0795* -0.0586
(0.0890) (0.154) (0.127) (0.130) (0.226) (0.0475) (0.0516)
D:NFA -0.00136 0.0929 0.0109 0.00540
(0.0469) (0.0599) (0.0515) (0.0579)
D:TOT 0.0556 0.0332 0.0819
(0.123) (0.106) (0.122)
Constant 0.864*** 1.613*** 0.830*** 0.914*** 1.297*** 0.792*** 1.580***
(0.215) (0.365) (0.224) (0.211) (0.340) (0.171) (0.401)
Note: Standard errors are in parentheses. *** p<0.01, ** p<0.05, * p<0.1. "e.c." denotes the error-correction term.
51

CEPIIWorkingPaper
EQCHANGE
Table B.1.2.2 � Equilibrium exchange rate model estimations (CFA)Weighting Fixed Time-varying weights
system (1973-2016) (2008-2012) (5-year averages)
Model (1) (2) (3) (1) (2) (3) (1) (2) (3)
Long-run dynamics
BS 0.176*** 0.0726** 0.180*** 0.161*** 0.156*** 0.175** -2.103* 0.0616
(0.0662) (0.0370) (0.0594) (0.0562) (0.0465) (0.0823) (1.095) (0.0408)
NFA 0.136*** 0.192*** 0.168*** -0.282 0.191***
(0.0365) (0.0705) (0.0588) (0.380) (0.0398)
TOT -0.0135 0.109* -0.0897*
(0.0462) (0.0595) (0.0506)
Short-run dynamics
e:c: -0.173*** -0.251*** -0.189*** -0.185*** -0.221*** -0.174*** -0.0138 -0.242***
(0.0282) (0.0394) (0.0269) (0.0258) (0.0395) (0.0264) (0.0136) (0.0372)
D:BS -0.436* -0.494 -0.297*** -0.321*** -0.360** -0.149* -0.0928 -0.179
(0.249) (0.313) (0.0969) (0.0974) (0.149) (0.0847) (0.0714) (0.164)
D:NFA 0.202** 0.203*** 0.189** 0.223*** 0.135**
(0.0958) (0.0625) (0.0804) (0.0549) (0.0613)
D:TOT -0.0274 -0.0481 -0.0768
(0.107) (0.0758) (0.189)
Constant 0.848*** 1.227*** 0.923*** 0.922*** 0.995*** 0.852*** -0.0185** 1.269***
(0.140) (0.195) (0.133) (0.130) (0.178) (0.131) (0.00873) (0.199)
Note: Standard errors are in parentheses. *** p<0.01, ** p<0.05, * p<0.1. "e.c." denotes the error-correction term.
52

CEPIIWorkingPaper
EQCHANGE
Table B.1.2.3 � Equilibrium exchange rate model estimations (CMA)Weighting Fixed Time-varying weights
system (1973-2016) (2008-2012) (5-year averages)
Model (1) (2) (3) (1) (2) (3) (1) (2) (3)
Long-run dynamics
BS -1.807* 0.667*** 0.796*** -1.551** 1.585*** -0.613 -1.312** -0.184 -0.160
(0.946) (0.157) (0.196) (0.748) (0.352) (0.458) (0.540) (0.211) (0.274)
NFA 0.172*** 0.228** 0.253*** 0.104 0.106 0.184**
(0.0666) (0.0910) (0.0781) (0.0783) (0.0738) (0.0723)
TOT 0.129 0.708*** 0.544*
(0.556) (0.270) (0.326)
Short-run dynamics
e:c: -0.0432 -0.242* -0.276* -0.0507 -0.214 -0.251* -0.0641* -0.218* -0.267*
(0.0309) (0.130) (0.151) (0.0335) (0.132) (0.151) (0.0378) (0.124) (0.152)
D:BS 0.198** -0.0964 -0.0933 0.249* -0.176 0.271 0.219** 0.213 0.223**
(0.0874) (0.198) (0.153) (0.133) (0.201) (0.254) (0.101) (0.159) (0.111)
D:NFA 0.114* 0.0594 0.0527 0.108 0.167** 0.133*
(0.0591) (0.0859) (0.0697) (0.0659) (0.0658) (0.0781)
D:TOT -0.317 0.0411 -0.512
(0.347) (0.223) (0.500)
Constant 0.0709 1.318* 1.393* 0.124 1.372 0.126 0.165 0.936* 0.496*
(0.0795) (0.768) (0.837) (0.101) (0.989) (0.103) (0.107) (0.544) (0.293)
Note: Standard errors are in parentheses. *** p<0.01, ** p<0.05, * p<0.1. "e.c." denotes the error-correction term.
53

CEPIIWorkingPaper
EQCHANGE
Table B.1.2.4 � Equilibrium exchange rate model estimations (ECMU)Weighting Fixed Time-varying weights
system (1973-2016) (2008-2012) (5-year averages)
Model (1) (2) (3) (1) (2) (3) (1) (2) (3)
Long-run dynamics
BS 0.0305 0.00392 0.251 -0.108 -0.00312 -0.819
(0.0602) (0.0789) (0.165) (0.150) (0.0947) (1.362)
NFA 0.228*** 0.0886*** 0.423*** 0.191*** -0.778
(0.0327) (0.0263) (0.0934) (0.0324) (1.421)
TOT 0.0684 6.354
(0.143) (9.566)
Short-run dynamics
e:c: -0.160*** -0.0990* -0.165*** -0.0575* -0.101** 0.00455
(0.0576) (0.0533) (0.0320) (0.0320) (0.0484) (0.0103)
D:BS -0.0503*** -0.0468*** -0.0421*** -0.0565*** -0.0235*** -0.0154*
(0.0164) (0.0146) (0.0118) (0.0191) (0.00790) (0.00822)
D:NFA -0.0349** -0.0386* -0.0199 -0.0314* -0.0362
(0.0165) (0.0204) (0.0121) (0.0189) (0.0365)
D:TOT 0.000961 0.0379
(0.0588) (0.0684)
Constant 0.744*** 0.487* 0.769*** 0.287* 0.490** 0.116
(0.265) (0.262) (0.152) (0.158) (0.235) (0.273)
Note: Standard errors are in parentheses. *** p<0.01, ** p<0.05, * p<0.1. "e.c." denotes the error-correction term.
54

CEPIIWorkingPaper
EQCHANGE
Table B.1.2.5 � Equilibrium exchange rate model estimations (EMU)Weighting Fixed Time-varying weights
system (1973-2016) (2008-2012) (5-year averages)
Model (1) (2) (3) (1) (2) (3) (1) (2) (3)
Long-run dynamics
BS 0.866*** -0.051 0.914*** 0.318*** -0.053* 0.721*** 0.448*** 0.072
(0.0705) (0.0394) (0.0702) (0.0772) (0.0293) (0.0555) (0.0706) (0.0728)
NFA -0.036** -0.110*** 0.025 0.081*** 0.018
(0.0174) (0.0280) (0.0163) (0.0365) (0.0199)
TOT 0.554*** 0.733*** 0.639***
(0.102) (0.109) (0.108)
Short-run dynamics
e:c: -0.214** -0.241*** -0.193** -0.168*** -0.216*** -0.242*** -0.190*** -0.175***
(0.0833) (0.0417) (0.0749) (0.0545) (0.0418) (0.0930) (0.0508) (0.0356)
D:BS -0.282*** -0.164** -0.132 -0.145** -0.112** -0.237*** -0.121*** -0.159***
(0.0830) (0.0717) (0.109) (0.0596) (0.0565) (0.0746) (0.0439) (0.0466)
D:NFA -0.0335 -0.0382 -0.0549 -0.0546 -0.0562
(0.0468) (0.0456) (0.0499) (0.0536) (0.0400)
D:TOT 0.236*** 0.205** 0.179**
(0.0911) (0.103) (0.0739)
Constant 1.009** 0.487*** 0.898** 0.764*** 0.264*** 1.126** 0.863*** 0.287***
(0.400) (0.0845) (0.359) (0.251) (0.0507) (0.439) (0.233) (0.0587)
Note: Standard errors are in parentheses. *** p<0.01, ** p<0.05, * p<0.1. "e.c." denotes the error-correction term.
55

CEPIIWorkingPaper
EQCHANGE
Table B.1.2.6 � Equilibrium exchange rate model estimations (WAEMU)Weighting Fixed Time-varying weights
system (1973-2016) (2008-2012) (5-year averages)
Model (1) (2) (3) (1) (2) (3) (1) (2) (3)
Long-run dynamics
BS -0.0212 -5.084*** 0.0146 0.187** 0.194*** 0.146 0.0420 -2.913 -0.357**
(0.0841) (1.028) (0.171) (0.0780) (0.0724) (0.0952) (0.0957) (1.884) (0.174)
NFA -2.278*** 0.119 0.202** 0.220** -1.314 0.0104
(0.725) (0.0994) (0.0957) (0.102) (1.230) (0.0468)
TOT 0.376** 0.263** 0.564***
(0.185) (0.120) (0.164)
Short-run dynamics
e:c: -0.197*** -0.0377 -0.188*** -0.202*** -0.192*** -0.230*** -0.204*** -0.0161 -0.184***
(0.0384) (0.0403) (0.0438) (0.0345) (0.0352) (0.0476) (0.0425) (0.0197) (0.0468)
D:BS -0.610 -0.497* -0.743 -0.347** -0.356** -0.401** -0.189 -0.125 -0.238
(0.429) (0.282) (0.529) (0.146) (0.143) (0.204) (0.144) (0.116) (0.283)
D:NFA 0.370*** 0.365*** 0.286*** 0.311*** 0.309*** 0.275***
(0.109) (0.141) (0.0936) (0.116) (0.0846) (0.0758)
D:TOT -0.131 -0.117 -0.280
(0.167) (0.110) (0.327)
Constant 0.884*** -0.258 0.558*** 0.991*** 0.968*** 0.878*** 0.937*** -0.0410 0.245***
(0.177) (0.273) (0.130) (0.175) (0.183) (0.185) (0.202) (0.0406) (0.0716)
Note: Standard errors are in parentheses. *** p<0.01, ** p<0.05, * p<0.1. "e.c." denotes the error-correction term.
56

CEPIIWorkingPaper
EQCHANGE
B.1.3. Geographical regions
Table B.1.3.1 � Equilibrium exchange rate model estimations (Africa)Weighting Fixed Time-varying weights
system (1973-2016) (2008-2012) (5-year averages)
Model (1) (2) (3) (1) (2) (3) (1) (2) (3)
Long-run dynamics
BS 0.0273 0.271*** 0.187*** -0.288*** 0.197*** 0.0791*** -0.00428 0.134*** 0.148***
(0.0430) (0.0443) (0.0349) (0.0557) (0.0387) (0.0260) (0.0368) (0.0318) (0.0365)
NFA 0.194*** 0.147*** 0.169*** 0.128*** 0.228*** 0.145***
(0.0271) (0.0210) (0.0256) (0.0176) (0.0319) (0.0226)
TOT 0.0408 -0.00741 -0.0753
(0.0449) (0.0399) (0.0463)
Short-run dynamics
e:c: -0.152*** -0.154*** -0.191*** -0.190*** -0.172*** -0.216*** -0.148*** -0.142*** -0.179***
(0.0257) (0.0246) (0.0248) (0.0458) (0.0262) (0.0299) (0.0263) (0.0253) (0.0247)
D:BS 0.173 0.0945 0.0363 -0.211* 0.108 0.121 0.275 0.253 0.208
(0.324) (0.364) (0.327) (0.120) (0.333) (0.290) (0.284) (0.351) (0.323)
D:NFA 0.132*** 0.125*** 0.122*** 0.113*** 0.138*** 0.132**
(0.0358) (0.0400) (0.0350) (0.0375) (0.0440) (0.0519)
D:TOT 0.293 0.351 0.519
(0.374) (0.390) (0.632)
Constant 0.756*** 0.869*** 0.957*** 0.735*** 0.939*** 1.073*** 0.739*** 0.788*** 0.992***
(0.125) (0.141) (0.136) (0.150) (0.143) (0.156) (0.128) (0.140) (0.144)
Note: Standard errors are in parentheses. *** p<0.01, ** p<0.05, * p<0.1. "e.c." denotes the error-correction term.
57

CEPIIWorkingPaper
EQCHANGE
Table B.1.3.2 � Equilibrium exchange rate model estimations (America)Weighting Fixed Time-varying weights
system (1973-2016) (2008-2012) (5-year averages)
Model (1) (2) (3) (1) (2) (3) (1) (2) (3)
Long-run dynamics
BS -0.00914 0.00558 0.355*** 0.0184 0.329*** -0.0254 -0.0535 0.325***
(0.0265) (0.0646) (0.0477) (0.0284) (0.0337) (0.0277) (0.0678) (0.115)
NFA 0.235*** -0.397*** -0.357*** 0.224*** 1.396***
(0.0284) (0.0367) (0.0275) (0.0293) (0.184)
TOT 0.111* -0.0116 0.196*
(0.0569) (0.0429) (0.109)
Short-run dynamics
e:c: -0.131*** -0.0909*** -0.0811** -0.133*** -0.0837** -0.129*** -0.0906*** -0.0753***
(0.0260) (0.0245) (0.0318) (0.0264) (0.0352) (0.0253) (0.0235) (0.0185)
D:BS 0.371** 0.340** 0.830 0.324** 0.795 0.342** 0.321** 0.487
(0.169) (0.138) (0.624) (0.162) (0.601) (0.157) (0.131) (0.347)
D:NFA -0.0234 0.148*** 0.164*** -0.0310 0.0188
(0.114) (0.0463) (0.0456) (0.114) (0.0507)
D:TOT -0.00103 -0.0227 -0.00254
(0.0629) (0.0584) (0.0612)
Constant 0.608*** 0.444*** 0.339** 0.622*** 0.396** 0.599*** 0.435*** 0.328***
(0.115) (0.107) (0.137) (0.117) (0.169) (0.112) (0.101) (0.0799)
Note: Standard errors are in parentheses. *** p<0.01, ** p<0.05, * p<0.1. "e.c." denotes the error-correction term.
58

CEPIIWorkingPaper
EQCHANGE
Table B.1.3.3 � Equilibrium exchange rate model estimations (Asia)Weighting Fixed Time-varying weights
system (1973-2016) (2008-2012) (5-year averages)
Model (1) (2) (3) (1) (2) (3) (1) (2) (3)
Long-run dynamics
BS 0.375*** 0.602*** 0.0643* 0.368*** 0.0255*** -0.0471 0.356*** 0.0647*** -0.00773
(0.0349) (0.0474) (0.0336) (0.0326) (0.00847) (0.0396) (0.0341) (0.0134) (0.0191)
NFA 0.312*** 0.0256** 0.0623*** 0.0303*** 0.0462*** 0.0469***
(0.0396) (0.0113) (0.00938) (0.00938) (0.00888) (0.00646)
TOT 0.174*** 0.299*** -0.00589
(0.0310) (0.0340) (0.0175)
Short-run dynamics
e:c: -0.210*** -0.156*** -0.240*** -0.211*** -0.238*** -0.230*** -0.217*** -0.222*** -0.243***
(0.0386) (0.0293) (0.0449) (0.0384) (0.0441) (0.0480) (0.0401) (0.0417) (0.0491)
D:BS 0.353 0.203 0.0123 0.303 0.254 0.00896 0.316 0.222 0.0604
(0.296) (0.248) (0.0687) (0.273) (0.275) (0.0626) (0.223) (0.201) (0.0507)
D:NFA -0.0424 0.0458 -0.0920 0.0448 -0.0428 0.0273
(0.129) (0.0488) (0.169) (0.0487) (0.120) (0.0486)
D:TOT 0.0284 0.0506 0.0756
(0.0657) (0.0695) (0.0667)
Constant 1.039*** 0.831*** 0.920*** 1.042*** 1.087*** 0.738*** 1.072*** 1.023*** 1.117***
(0.193) (0.158) (0.172) (0.193) (0.202) (0.152) (0.201) (0.193) (0.225)
Note: Standard errors are in parentheses. *** p<0.01, ** p<0.05, * p<0.1. "e.c." denotes the error-correction term.
59

CEPIIWorkingPaper
EQCHANGE
Table B.1.3.4 � Equilibrium exchange rate model estimations (Europe)Weighting Fixed Time-varying weights
system (1973-2016) (2008-2012) (5-year averages)
Model (1) (2) (3) (1) (2) (3) (1) (2) (3)
Long-run dynamics
BS 0.431*** 0.482*** 0.000893 0.382*** 0.542*** -0.0430* 0.526*** 0.327*** 0.0737**
(0.0458) (0.0637) (0.0323) (0.0480) (0.0621) (0.0235) (0.0402) (0.0494) (0.0345)
NFA -0.141*** 0.0142 -0.0644*** -0.0622*** -0.0842*** -0.0595***
(0.0271) (0.00887) (0.0138) (0.0174) (0.0182) (0.0143)
TOT 0.787*** 0.776*** 1.122***
(0.0729) (0.0749) (0.0909)
Short-run dynamics
e:c: -0.293*** -0.197*** -0.0374 -0.273*** -0.224*** -0.0261 -0.305*** -0.222*** -0.136
(0.0536) (0.0426) (0.216) (0.0505) (0.0504) (0.203) (0.0584) (0.0414) (0.0928)
D:BS 0.0379 -0.147 0.716 0.0598 -0.125 0.770 0.126 0.0976 0.172
(0.241) (0.0946) (0.823) (0.210) (0.0956) (0.831) (0.272) (0.145) (0.229)
D:NFA -0.0384 -0.206 -0.0375 -0.213 -0.0588 -0.103
(0.0397) (0.168) (0.0347) (0.174) (0.0415) (0.0681)
D:TOT -1.133 -1.203 -0.672
(1.279) (1.314) (0.655)
Constant 1.386*** 0.918*** 0.00216 1.282*** 1.057*** -0.00353 1.453*** 1.022*** -0.0984***
(0.258) (0.201) (0.252) (0.240) (0.240) (0.232) (0.282) (0.193) (0.0345)
Note: Standard errors are in parentheses. *** p<0.01, ** p<0.05, * p<0.1. "e.c." denotes the error-correction term.
60

CEPIIWorkingPaper
EQCHANGE
Table B.1.3.5 � Equilibrium exchange rate model estimations (Oceania)Weighting Fixed Time-varying weights
system (1973-2016) (2008-2012) (5-year averages)
Model (1) (2) (3) (1) (2) (3) (1) (2) (3)
Long-run dynamics
BS 0.892*** 0.919*** 0.520*** 1.334*** -0.274*** 0.415*** 0.509*** 0.521*** 0.387**
(0.109) (0.0907) (0.149) (0.223) (0.0825) (0.133) (0.0578) (0.0514) (0.163)
NFA -0.0979** 0.0602 -0.0740*** -0.0644 -0.114*** 0.0574
(0.0427) (0.0791) (0.0125) (0.0795) (0.0383) (0.0608)
TOT 1.704*** 1.765*** 0.928***
(0.204) (0.224) (0.131)
Short-run dynamics
e:c: -0.117** -0.138*** -0.0653 -0.0627* -0.240*** -0.0733 -0.172*** -0.192*** -0.141**
(0.0479) (0.0491) (0.0527) (0.0368) (0.0811) (0.0554) (0.0463) (0.0481) (0.0558)
D:BS -0.110 -0.163 -0.0972 -0.0963 -0.105 -0.0622 -0.0275 -0.0544 -0.109
(0.104) (0.105) (0.192) (0.101) (0.0976) (0.226) (0.0711) (0.0758) (0.0672)
D:NFA 0.102 0.0574 0.107 0.0577 0.0861 0.0474
(0.114) (0.0768) (0.0975) (0.0710) (0.106) (0.0834)
D:TOT -0.0316 -0.0643 -0.0683
(0.0928) (0.0941) (0.0962)
Constant 0.753** 0.893*** -0.187 0.448* 0.984*** -0.246 0.914*** 1.046*** 0.130**
(0.313) (0.317) (0.150) (0.267) (0.319) (0.186) (0.254) (0.266) (0.0510)
Note: Standard errors are in parentheses. *** p<0.01, ** p<0.05, * p<0.1. "e.c." denotes the error-correction term.
61

CEPIIWorkingPaper
EQCHANGE
B.1.4. Geographical sub-regions
Table B.1.4.1 � Equilibrium exchange rate model estimations (Caribbean)Weighting Fixed Time-varying weights
system (1973-2016) (2008-2012) (5-year averages)
Model (1) (2) (3) (1) (2) (3) (1) (2) (3)
Long-run dynamics
BS -0.00674 0.221* 0.0309 -0.0643 1.190** -0.0199 0.141
(0.0274) (0.132) (0.0313) (0.111) (0.515) (0.0285) (0.0924)
NFA -0.280*** 0.413*** 0.213*** -0.180***
(0.0915) (0.0723) (0.0680) (0.0571)
TOT 0.793*** 0.685*** 0.612***
(0.245) (0.264) (0.201)
Short-run dynamics
e:c: -0.153*** -0.117*** -0.143*** -0.105*** -0.0700** -0.149*** -0.158***
(0.0258) (0.0341) (0.0272) (0.0342) (0.0334) (0.0231) (0.0541)
D:BS -0.101 -0.0537 -0.103 -0.0295 -0.0729 -0.0682 0.0307
(0.0956) (0.161) (0.0836) (0.0347) (0.142) (0.0907) (0.105)
D:NFA 0.0920 0.0436 0.0916 0.102
(0.0816) (0.0379) (0.0872) (0.0892)
D:TOT -0.0574 -0.111 -0.0880
(0.0978) (0.114) (0.0932)
Constant 0.705*** 0.0995*** 0.664*** 0.508*** 0.174** 0.687*** 0.269***
(0.117) (0.0327) (0.125) (0.164) (0.0846) (0.105) (0.0968)
Note: Standard errors are in parentheses. *** p<0.01, ** p<0.05, * p<0.1. "e.c." denotes the error-correction term.
62

CEPIIWorkingPaper
EQCHANGE
Table B.1.4.2 � Equilibrium exchange rate model estimations (central America)Weighting Fixed Time-varying weights
system (1973-2016) (2008-2012) (5-year averages)
Model (1) (2) (3) (1) (2) (3) (1) (2) (3)
Long-run dynamics
BS -0.257* 0.122 -0.266** -2.070 -0.00710 -0.206 8.058** 0.0733
(0.148) (0.143) (0.135) (2.421) (0.106) (0.125) (3.341) (0.110)
NFA -0.484* -6.618 -0.701*** 1.784** -0.493**
(0.270) (5.969) (0.158) (0.716) (0.252)
TOT 0.0185 0.281 0.213
(0.338) (0.194) (0.310)
Short-run dynamics
e:c: -0.139** -0.0343 -0.146*** 0.000950 -0.0446 -0.145*** -0.0178* -0.0384
(0.0567) (0.0294) (0.0533) (0.00525) (0.0344) (0.0557) (0.0100) (0.0298)
D:BS 1.061 2.802 1.048* 0.623 2.722 0.951 0.406 2.014
(0.657) (2.539) (0.632) (0.470) (2.428) (0.621) (0.356) (1.778)
D:NFA 0.276** 0.272** 0.296** 0.224* 0.282**
(0.121) (0.109) (0.120) (0.125) (0.112)
D:TOT 0.0165 -0.00810 0.0447
(0.111) (0.0922) (0.137)
Constant 0.575** 0.156 0.620*** -0.00515 0.140 0.615** 0.301* 0.114
(0.252) (0.126) (0.235) (0.0132) (0.0948) (0.250) (0.178) (0.106)
Note: Standard errors are in parentheses. *** p<0.01, ** p<0.05, * p<0.1. "e.c." denotes the error-correction term.
63
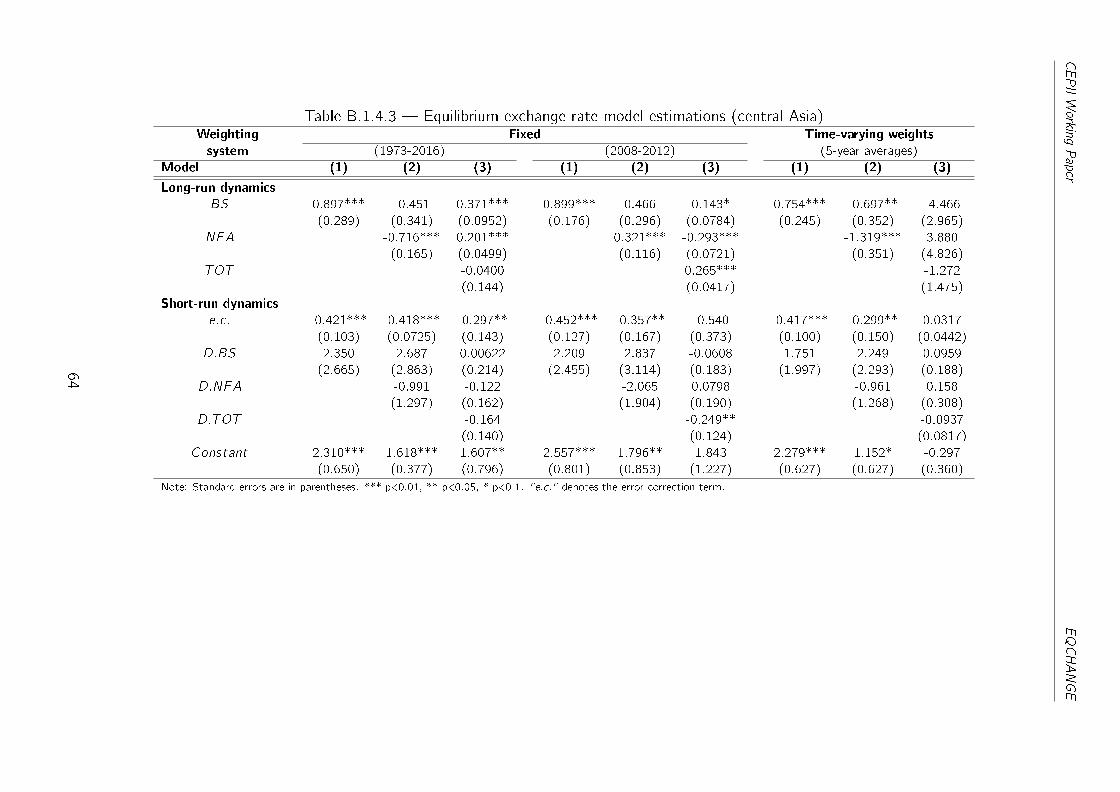
CEPIIWorkingPaper
EQCHANGE
Table B.1.4.3 � Equilibrium exchange rate model estimations (central Asia)Weighting Fixed Time-varying weights
system (1973-2016) (2008-2012) (5-year averages)
Model (1) (2) (3) (1) (2) (3) (1) (2) (3)
Long-run dynamics
BS 0.897*** -0.451 0.371*** 0.899*** 0.466 0.143* 0.754*** -0.697** -4.466
(0.289) (0.341) (0.0952) (0.176) (0.296) (0.0784) (0.245) (0.352) (2.965)
NFA -0.716*** 0.201*** 0.321*** -0.293*** -1.319*** 3.880
(0.165) (0.0499) (0.116) (0.0721) (0.351) (4.826)
TOT -0.0400 0.265*** -1.272
(0.144) (0.0417) (1.475)
Short-run dynamics
e:c: -0.421*** -0.418*** -0.297** -0.452*** -0.357** -0.540 -0.417*** -0.299** 0.0317
(0.103) (0.0725) (0.143) (0.127) (0.167) (0.373) (0.100) (0.150) (0.0442)
D:BS 2.350 2.687 0.00622 2.209 2.837 -0.0608 1.751 2.249 0.0959
(2.665) (2.863) (0.214) (2.455) (3.114) (0.183) (1.997) (2.293) (0.188)
D:NFA -0.991 -0.122 -2.065 0.0798 -0.961 0.158
(1.297) (0.162) (1.904) (0.190) (1.268) (0.308)
D:TOT -0.164 -0.249** -0.0937
(0.140) (0.124) (0.0817)
Constant 2.310*** 1.618*** 1.607** 2.557*** 1.796** 1.843 2.279*** 1.152* -0.297
(0.650) (0.377) (0.796) (0.801) (0.853) (1.227) (0.627) (0.627) (0.360)
Note: Standard errors are in parentheses. *** p<0.01, ** p<0.05, * p<0.1. "e.c." denotes the error-correction term.
64

CEPIIWorkingPaper
EQCHANGE
Table B.1.4.4 � Equilibrium exchange rate model estimations (eastern Africa)Weighting Fixed Time-varying weights
system (1973-2016) (2008-2012) (5-year averages)
Model (1) (2) (3) (1) (2) (3) (1) (2) (3)
Long-run dynamics
BS 1.042*** 0.351*** -1.602*** 0.0863 0.266*** -0.139* 3.263* 0.0137
(0.0950) (0.0558) (0.251) (0.0614) (0.0603) (0.0779) (1.714) (0.110)
NFA 0.605*** 0.185*** 0.439*** 0.140*** 0.657***
(0.0901) (0.0695) (0.0756) (0.0278) (0.208)
TOT 0.779*** -0.258*** 1.062***
(0.127) (0.0488) (0.178)
Short-run dynamics
e:c: -0.0656* -0.101*** -0.0985** -0.147*** -0.144*** -0.184** -0.00683 -0.0596*
(0.0357) (0.0339) (0.0393) (0.0419) (0.0385) (0.0780) (0.0106) (0.0317)
D:BS 0.978 1.042 1.132 0.887 0.849 1.000 0.996 1.056
(1.052) (1.197) (1.057) (0.999) (1.124) (0.949) (0.953) (1.070)
D:NFA 0.154** 0.168** 0.141** 0.159* 0.273*
(0.0665) (0.0735) (0.0623) (0.0816) (0.149)
D:TOT 1.200 1.354 2.102
(1.211) (1.311) (2.130)
Constant 0.667** 0.775*** -0.219*** 0.878*** 0.994*** 1.038** 0.302 0.0984
(0.301) (0.233) (0.0701) (0.213) (0.231) (0.436) (0.186) (0.0694)
Note: Standard errors are in parentheses. *** p<0.01, ** p<0.05, * p<0.1. "e.c." denotes the error-correction term.
65
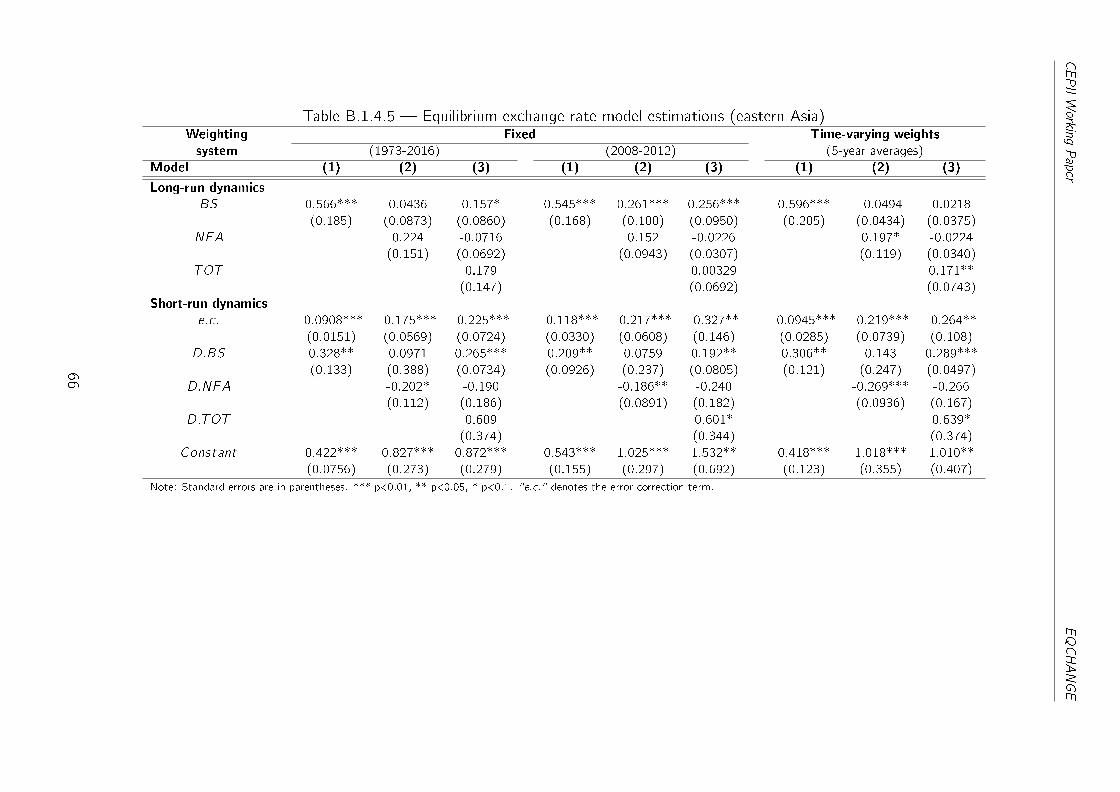
CEPIIWorkingPaper
EQCHANGE
Table B.1.4.5 � Equilibrium exchange rate model estimations (eastern Asia)Weighting Fixed Time-varying weights
system (1973-2016) (2008-2012) (5-year averages)
Model (1) (2) (3) (1) (2) (3) (1) (2) (3)
Long-run dynamics
BS 0.566*** 0.0436 0.157* 0.545*** 0.261*** 0.256*** 0.596*** -0.0494 0.0218
(0.185) (0.0873) (0.0860) (0.168) (0.100) (0.0950) (0.205) (0.0434) (0.0375)
NFA 0.224 -0.0716 0.152 -0.0226 0.197* -0.0224
(0.151) (0.0692) (0.0943) (0.0307) (0.119) (0.0340)
TOT 0.179 0.00329 0.171**
(0.147) (0.0692) (0.0743)
Short-run dynamics
e:c: -0.0908*** -0.175*** -0.225*** -0.118*** -0.217*** -0.327** -0.0945*** -0.219*** -0.264**
(0.0151) (0.0569) (0.0724) (0.0330) (0.0608) (0.146) (0.0285) (0.0739) (0.108)
D:BS 0.328** 0.0971 0.265*** 0.209** 0.0759 0.192** 0.306** 0.143 0.289***
(0.133) (0.388) (0.0734) (0.0926) (0.237) (0.0805) (0.121) (0.247) (0.0497)
D:NFA -0.202* -0.190 -0.186** -0.240 -0.269*** -0.266
(0.112) (0.186) (0.0891) (0.182) (0.0936) (0.167)
D:TOT 0.609 0.601* 0.639*
(0.374) (0.344) (0.374)
Constant 0.422*** 0.827*** 0.872*** 0.543*** 1.025*** 1.532** 0.418*** 1.018*** 1.010**
(0.0756) (0.273) (0.279) (0.155) (0.297) (0.692) (0.123) (0.355) (0.407)
Note: Standard errors are in parentheses. *** p<0.01, ** p<0.05, * p<0.1. "e.c." denotes the error-correction term.
66

CEPIIWorkingPaper
EQCHANGE
Table B.1.4.6 � Equilibrium exchange rate model estimations (eastern Europe)Weighting Fixed Time-varying weights
system (1973-2016) (2008-2012) (5-year averages)
Model (1) (2) (3) (1) (2) (3) (1) (2) (3)
Long-run dynamics
BS -0.476*** 0.209 -0.631*** 0.785*** -0.201 -0.326*** -0.185*** 0.0823
(0.0558) (0.147) (0.0552) (0.122) (0.188) (0.0488) (0.0495) (0.129)
NFA -0.146** 0.121 -0.192** -0.882*** -0.0816
(0.0606) (0.141) (0.0843) (0.0709) (0.0946)
TOT 0.651*** 1.023*** 0.761***
(0.156) (0.207) (0.159)
Short-run dynamics
e:c: -0.274*** -0.203** -0.242*** -0.215*** -0.226*** -0.274*** -0.255*** -0.276***
(0.0896) (0.0817) (0.0782) (0.0726) (0.0639) (0.0854) (0.0903) (0.0778)
D:BS 0.203 -0.0883 0.154 0.230 0.00772 0.276 0.289** 0.0508
(0.403) (0.253) (0.417) (0.225) (0.258) (0.389) (0.141) (0.185)
D:NFA -0.0296 -0.0626 -0.0895 0.0617 -0.109
(0.0776) (0.0738) (0.0648) (0.0771) (0.0695)
D:TOT -0.0278 -0.289 -0.482
(0.124) (0.260) (0.321)
Constant 1.196*** 0.331*** 1.045*** 1.082*** -0.0636*** 1.216*** -0.255*** 0.292***
(0.392) (0.128) (0.349) (0.350) (0.0171) (0.387) (0.0903) (0.0867)
Note: Standard errors are in parentheses. *** p<0.01, ** p<0.05, * p<0.1. "e.c." denotes the error-correction term.
67

CEPIIWorkingPaper
EQCHANGE
Table B.1.4.7 � Equilibrium exchange rate model estimations (middle Africa)Weighting Fixed Time-varying weights
system (1973-2016) (2008-2012) (5-year averages)
Model (1) (2) (3) (1) (2) (3) (1) (2) (3)
Long-run dynamics
BS 0.218** -0.318 0.201*** 0.166* 0.126 0.396*** 0.271** -0.0192 0.276***
(0.0878) (0.557) (0.0490) (0.0895) (0.0799) (0.0666) (0.123) (0.692) (0.0476)
NFA -1.331 0.129*** 0.169*** 0.0913*** -1.416 0.155***
(0.999) (0.0261) (0.0365) (0.0261) (1.180) (0.0294)
TOT -0.0550 0.264*** -0.304***
(0.0495) (0.0909) (0.0584)
Short-run dynamics
e:c: -0.263** -0.116 -0.365*** -0.264** -0.294*** -0.270** -0.249** -0.120 -0.328***
(0.106) (0.121) (0.0928) (0.106) (0.102) (0.111) (0.106) (0.121) (0.101)
D:BS -0.0527 -0.0912 -0.313** -0.0287 -0.393** -0.420** -0.0222 0.00829 -0.136
(0.244) (0.0836) (0.147) (0.290) (0.158) (0.182) (0.226) (0.0882) (0.126)
D:NFA 0.136** -0.0268 0.0256 0.0212 0.133** -0.0280
(0.0633) (0.0422) (0.0537) (0.0614) (0.0640) (0.0491)
D:TOT 0.0904 0.0137 0.133
(0.124) (0.106) (0.124)
Constant 1.390** 0.371 2.076*** 1.358** 1.515*** 1.281** 1.357** 0.487 2.291***
(0.590) (0.382) (0.603) (0.577) (0.553) (0.606) (0.607) (0.484) (0.778)
Note: Standard errors are in parentheses. *** p<0.01, ** p<0.05, * p<0.1. "e.c." denotes the error-correction term.
68

CEPIIWorkingPaper
EQCHANGE
Table B.1.4.8 � Equilibrium exchange rate model estimations (northern Africa)Weighting Fixed Time-varying weights
system (1973-2016) (2008-2012) (5-year averages)
Model (1) (2) (3) (1) (2) (3) (1) (2) (3)
Long-run dynamics
BS 1.309*** 1.262*** 0.903*** 1.196*** 1.158*** 1.052*** 1.510*** 1.223*** 0.853***
(0.135) (0.116) (0.132) (0.115) (0.0974) (0.126) (0.247) (0.179) (0.136)
NFA -0.0378 -0.0918*** -0.0434 -0.0965*** -0.0413 -0.0899***
(0.0372) (0.0171) (0.0325) (0.0174) (0.0346) (0.0172)
TOT 0.394*** 0.363*** 0.405***
(0.0959) (0.0978) (0.0957)
Short-run dynamics
e:c: -0.159** -0.182** -0.270* -0.186* -0.180* -0.257 -0.130** -0.163* -0.262
(0.0665) (0.0847) (0.162) (0.0986) (0.0953) (0.169) (0.0632) (0.0915) (0.162)
D:BS -0.0261 -0.0755 -0.168 -0.0938 -0.0729 -0.214 -0.00748 -0.0672 -0.148
(0.140) (0.201) (0.282) (0.199) (0.208) (0.281) (0.143) (0.190) (0.292)
D:NFA 0.118 0.0632 0.134 0.0963 0.111 0.0697
(0.149) (0.0936) (0.160) (0.107) (0.136) (0.0951)
D:TOT -0.304** -0.292* -0.317**
(0.154) (0.156) (0.153)
Constant 1.023** 1.155** 1.108 0.996* 1.145* 1.143 0.875* 1.036* 1.048
(0.459) (0.571) (0.713) (0.513) (0.640) (0.807) (0.468) (0.618) (0.694)
Note: Standard errors are in parentheses. *** p<0.01, ** p<0.05, * p<0.1. "e.c." denotes the error-correction term.
69

CEPIIWorkingPaper
EQCHANGE
Table B.1.4.9 � Equilibrium exchange rate model estimations (northern Europe)Weighting Fixed Time-varying weights
system (1973-2016) (2008-2012) (5-year averages)
Model (1) (2) (3) (1) (2) (3) (1) (2) (3)
Long-run dynamics
BS 0.845*** -0.0911* 0.910*** 0.788*** -0.127*** 0.691*** 0.396*** -0.00158
(0.0710) (0.0492) (0.0715) (0.113) (0.0491) (0.0552) (0.0627) (0.0718)
NFA 0.0203* 0.0161 0.0289* -0.112*** 0.0140
(0.0118) (0.0549) (0.0154) (0.0284) (0.0125)
TOT 1.107*** 1.049*** 1.203***
(0.159) (0.217) (0.128)
Short-run dynamics
e:c: -0.311** -0.268*** -0.289** -0.213** -0.230*** -0.362*** -0.268*** -0.277***
(0.134) (0.0521) (0.136) (0.0912) (0.0434) (0.126) (0.0865) (0.0595)
D:BS -0.290** -0.111* -0.310** -0.228* -0.116 -0.156*** -0.0757 -0.124**
(0.119) (0.0635) (0.128) (0.129) (0.0897) (0.0541) (0.0605) (0.0528)
D:NFA -0.00626 0.0213 -0.00353 0.00705 -0.0288
(0.0384) (0.0587) (0.0414) (0.0521) (0.0238)
D:TOT 0.202 0.210 0.125*
(0.123) (0.145) (0.0661)
Constant 1.493** -0.114*** 1.383** 1.017** -0.0348*** 1.714*** 1.233*** -0.242***
(0.654) (0.0216) (0.659) (0.444) (0.0105) (0.607) (0.402) (0.0522)
Note: Standard errors are in parentheses. *** p<0.01, ** p<0.05, * p<0.1. "e.c." denotes the error-correction term.
70

CEPIIWorkingPaper
EQCHANGE
Table B.1.4.10 � Equilibrium exchange rate model estimations (south America)Weighting Fixed Time-varying weights
system (1973-2016) (2008-2012) (5-year averages)
Model (1) (2) (3) (1) (2) (3) (1) (2) (3)
Long-run dynamics
BS 0.669*** 0.459** -0.776** 0.558*** 0.437*** 0.000432 0.176 0.0625 -0.0479
(0.153) (0.183) (0.379) (0.124) (0.139) (0.0888) (0.146) (0.272) (0.0361)
NFA 0.254** 3.756*** 0.166** 1.564*** 2.445*** 0.0605***
(0.108) (0.972) (0.0832) (0.232) (0.505) (0.0176)
TOT 0.830*** 0.554*** 0.199***
(0.193) (0.109) (0.0561)
Short-run dynamics
e:c: -0.122* -0.0963* -0.0353 -0.143** -0.114** -0.100** -0.0900 -0.0909*** -0.238***
(0.0625) (0.0585) (0.0218) (0.0613) (0.0571) (0.0413) (0.0649) (0.0247) (0.0843)
D:BS 0.382*** 0.371*** 0.377*** 0.306** 0.304*** 0.289** 0.378*** 0.290** 0.403***
(0.145) (0.125) (0.114) (0.127) (0.113) (0.128) (0.139) (0.119) (0.127)
D:NFA -0.262 -0.0605 -0.247 -0.0926 -0.448 0.00447
(0.288) (0.123) (0.285) (0.120) (0.341) (0.0774)
D:TOT -0.137* -0.142** -0.148**
(0.0739) (0.0722) (0.0639)
Constant 0.685** 0.535** 0.0468** 0.763*** 0.611** 0.245** 0.465 0.458*** 0.856***
(0.311) (0.270) (0.0227) (0.290) (0.257) (0.0967) (0.290) (0.118) (0.310)
Note: Standard errors are in parentheses. *** p<0.01, ** p<0.05, * p<0.1. "e.c." denotes the error-correction term.
71

CEPIIWorkingPaper
EQCHANGE
Table B.1.4.11 � Equilibrium exchange rate model estimations (south eastern Asia)Weighting Fixed Time-varying weights
system (1973-2016) (2008-2012) (5-year averages)
Model (1) (2) (3) (1) (2) (3) (1) (2) (3)
Long-run dynamics
BS -4.751*** -3.770 0.0823 -0.167*** -2.566 -0.147 -4.246*** -3.285 0.420***
(1.534) (5.133) (0.163) (0.0425) (2.673) (0.165) (1.333) (2.203) (0.0717)
NFA -6.272 -0.160*** -4.762 -0.165** -2.401 -0.163*
(8.009) (0.0594) (4.229) (0.0756) (1.526) (0.0853)
TOT -0.948*** -1.148*** 0.0931
(0.224) (0.320) (0.132)
Short-run dynamics
e:c: -0.0536** -0.000169 -0.0747* -0.135*** 0.000118 -0.0550* -0.0506** -0.00656 -0.0922
(0.0249) (0.00584) (0.0408) (0.0333) (0.00819) (0.0327) (0.0256) (0.0134) (0.0698)
D:BS 0.689*** 0.0949 0.0409 0.221 0.0406 -0.0314 0.732*** 0.213** 0.00979
(0.207) (0.223) (0.230) (0.210) (0.195) (0.222) (0.222) (0.103) (0.157)
D:NFA 0.0904 0.120 0.0783 0.121 0.0786 0.0993
(0.0977) (0.0738) (0.101) (0.0758) (0.104) (0.0832)
D:TOT 0.0306 0.0110 0.0123
(0.0975) (0.0937) (0.122)
Constant -0.0536** -0.0410 0.666* 0.580*** -0.0420 0.520* -0.284* -0.103 0.442
(0.0249) (0.0585) (0.367) (0.163) (0.0511) (0.314) (0.167) (0.0988) (0.342)
Note: Standard errors are in parentheses. *** p<0.01, ** p<0.05, * p<0.1. "e.c." denotes the error-correction term.
72

CEPIIWorkingPaper
EQCHANGE
Table B.1.4.12 � Equilibrium exchange rate model estimations (southern Africa)Weighting Fixed Time-varying weights
system (1973-2016) (2008-2012) (5-year averages)
Model (1) (2) (3) (1) (2) (3) (1) (2) (3)
Long-run dynamics
BS 0.508*** 0.374*** -0.0198 -1.499** -0.183 0.411*** -0.00187
(0.108) (0.115) (0.253) (0.722) (0.201) (0.142) (0.203)
NFA 0.115* 0.173*** 0.106* 0.199***
(0.0645) (0.0614) (0.0603) (0.0657)
TOT 0.520* 0.544** 0.572*
(0.295) (0.260) (0.307)
Short-run dynamics
e:c: -0.138** 0.374*** -0.272** -0.0423 -0.273** -0.0877 -0.271**
(0.0643) (0.115) (0.116) (0.0280) (0.119) (0.0552) (0.120)
D:BS -0.0938 0.115* -0.0792 0.127 0.0486 0.0264 0.0474
(0.187) (0.0645) (0.164) (0.159) (0.237) (0.165) (0.165)
D:NFA 0.374*** 0.0561 0.0487 0.0546
(0.115) (0.0829) (0.0834) (0.0961)
D:TOT -0.373 -0.0406 -0.568
(0.282) (0.194) (0.392)
Constant 0.645** 1.196** 0.573** 0.111 0.499** 0.400 0.519**
(0.305) (0.511) (0.260) (0.0829) (0.228) (0.262) (0.250)
Note: Standard errors are in parentheses. *** p<0.01, ** p<0.05, * p<0.1. "e.c." denotes the error-correction term.
73

CEPIIWorkingPaper
EQCHANGE
Table B.1.4.13 � Equilibrium exchange rate model estimations (southern Asia)Weighting Fixed Time-varying weights
system (1973-2016) (2008-2012) (5-year averages)
Model (1) (2) (3) (1) (2) (3) (1) (2) (3)
Long-run dynamics
BS 0.243** 0.128 0.210 0.179* 0.0940 0.188 0.368*** 0.442*** 0.259
(0.101) (0.114) (0.165) (0.0951) (0.0727) (0.165) (0.112) (0.131) (0.203)
NFA 0.0335** -0.0825* 0.364*** -0.0484 0.654*** 0.0310
(0.0171) (0.0485) (0.0767) (0.0383) (0.219) (0.0260)
TOT 1.088*** 1.023*** -0.183
(0.288) (0.255) (0.255)
Short-run dynamics
e:c: -0.294*** -0.330** -0.164* -0.284*** -0.229** -0.194* -0.296*** -0.186** -0.263**
(0.110) (0.146) (0.0851) (0.103) (0.0953) (0.103) (0.112) (0.0798) (0.116)
D:BS -0.00950 -0.0483 0.0746 -0.00238 0.0379 0.162 -0.0141 0.00356 0.0112
(0.117) (0.129) (0.0925) (0.116) (0.156) (0.139) (0.0936) (0.113) (0.120)
D:NFA 0.304*** 0.183 0.243*** 0.203 0.179** 0.155
(0.0649) (0.149) (0.0715) (0.147) (0.0841) (0.142)
D:TOT 0.00678 0.0169 0.121
(0.0993) (0.101) (0.109)
Constant 1.444*** 1.571** -0.0320* 1.368*** 1.100** 0.0161 1.499*** 0.991** 1.508**
(0.535) (0.694) (0.0171) (0.492) (0.458) (0.0201) (0.559) (0.419) (0.672)
Note: Standard errors are in parentheses. *** p<0.01, ** p<0.05, * p<0.1. "e.c." denotes the error-correction term.
74
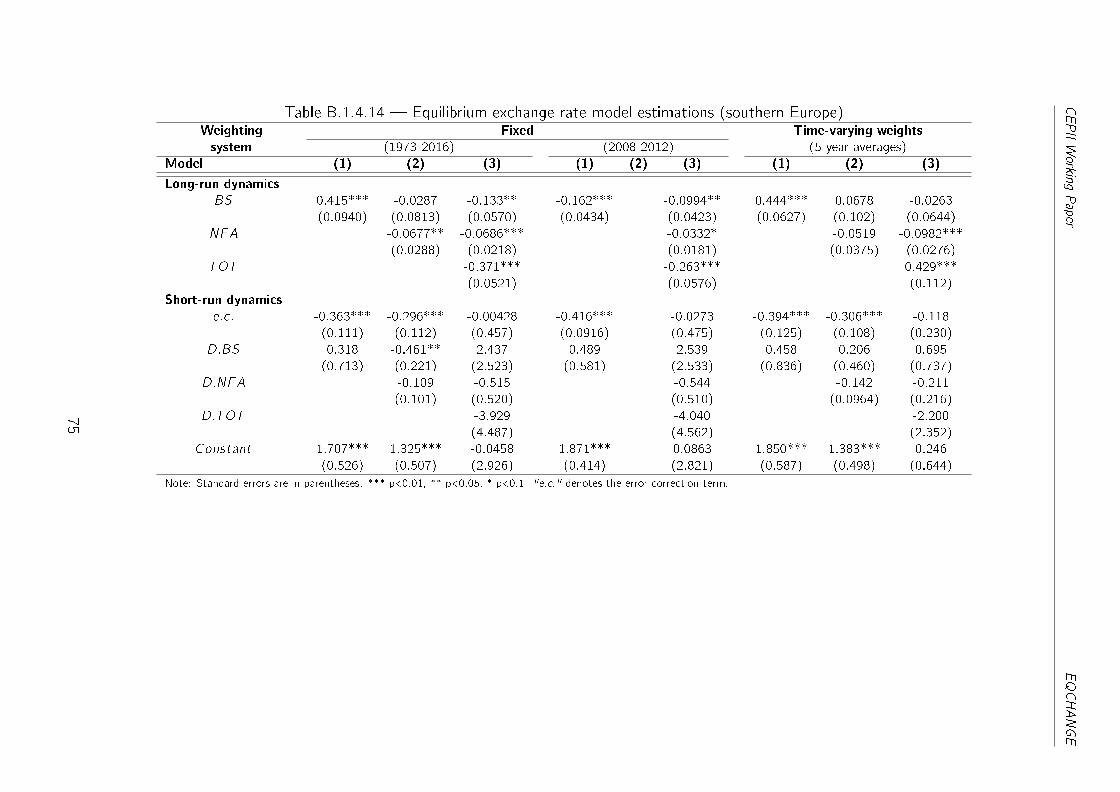
CEPIIWorkingPaper
EQCHANGE
Table B.1.4.14 � Equilibrium exchange rate model estimations (southern Europe)Weighting Fixed Time-varying weights
system (1973-2016) (2008-2012) (5-year averages)
Model (1) (2) (3) (1) (2) (3) (1) (2) (3)
Long-run dynamics
BS 0.415*** -0.0287 -0.133** -0.162*** -0.0994** 0.444*** 0.0678 -0.0263
(0.0940) (0.0813) (0.0570) (0.0434) (0.0423) (0.0627) (0.102) (0.0644)
NFA -0.0677** -0.0686*** -0.0332* -0.0519 -0.0982***
(0.0288) (0.0218) (0.0181) (0.0375) (0.0276)
TOT -0.371*** -0.263*** 0.429***
(0.0521) (0.0576) (0.112)
Short-run dynamics
e:c: -0.363*** -0.296*** -0.00428 -0.416*** -0.0273 -0.394*** -0.306*** -0.118
(0.111) (0.112) (0.457) (0.0916) (0.475) (0.125) (0.108) (0.230)
D:BS 0.318 -0.461** 2.437 0.489 2.539 0.458 0.206 0.695
(0.713) (0.221) (2.523) (0.581) (2.533) (0.836) (0.460) (0.737)
D:NFA -0.109 -0.515 -0.544 -0.142 -0.211
(0.101) (0.520) (0.510) (0.0964) (0.216)
D:TOT -3.929 -4.040 -2.200
(4.487) (4.562) (2.352)
Constant 1.707*** 1.325*** -0.0458 1.871*** 0.0863 1.850*** 1.383*** 0.246
(0.526) (0.507) (2.926) (0.414) (2.821) (0.587) (0.498) (0.644)
Note: Standard errors are in parentheses. *** p<0.01, ** p<0.05, * p<0.1. "e.c." denotes the error-correction term.
75
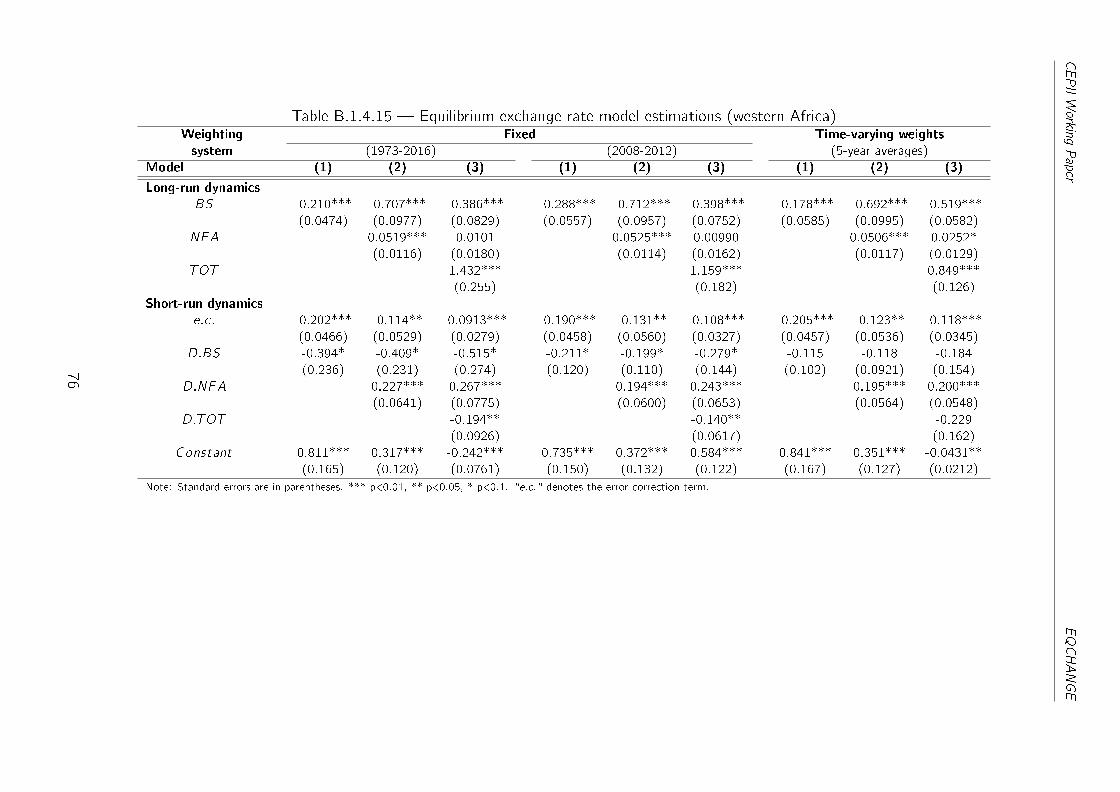
CEPIIWorkingPaper
EQCHANGE
Table B.1.4.15 � Equilibrium exchange rate model estimations (western Africa)Weighting Fixed Time-varying weights
system (1973-2016) (2008-2012) (5-year averages)
Model (1) (2) (3) (1) (2) (3) (1) (2) (3)
Long-run dynamics
BS -0.210*** -0.707*** -0.386*** -0.288*** -0.712*** -0.398*** -0.178*** -0.692*** -0.519***
(0.0474) (0.0977) (0.0829) (0.0557) (0.0957) (0.0752) (0.0585) (0.0995) (0.0582)
NFA 0.0519*** 0.0101 0.0525*** 0.00990 0.0506*** 0.0252*
(0.0116) (0.0180) (0.0114) (0.0162) (0.0117) (0.0129)
TOT 1.432*** 1.159*** 0.849***
(0.255) (0.182) (0.126)
Short-run dynamics
e:c: -0.202*** -0.114** -0.0913*** -0.190*** -0.131** -0.108*** -0.205*** -0.123** -0.118***
(0.0466) (0.0529) (0.0279) (0.0458) (0.0560) (0.0327) (0.0457) (0.0536) (0.0345)
D:BS -0.394* -0.409* -0.515* -0.211* -0.199* -0.279* -0.115 -0.118 -0.184
(0.236) (0.231) (0.274) (0.120) (0.110) (0.144) (0.102) (0.0921) (0.154)
D:NFA 0.227*** 0.267*** 0.194*** 0.243*** 0.195*** 0.200***
(0.0641) (0.0775) (0.0600) (0.0653) (0.0564) (0.0548)
D:TOT -0.194** -0.140** -0.229
(0.0926) (0.0617) (0.162)
Constant 0.811*** 0.317*** -0.242*** 0.735*** 0.372*** 0.584*** 0.841*** 0.351*** -0.0431**
(0.165) (0.120) (0.0761) (0.150) (0.132) (0.122) (0.167) (0.127) (0.0212)
Note: Standard errors are in parentheses. *** p<0.01, ** p<0.05, * p<0.1. "e.c." denotes the error-correction term.
76
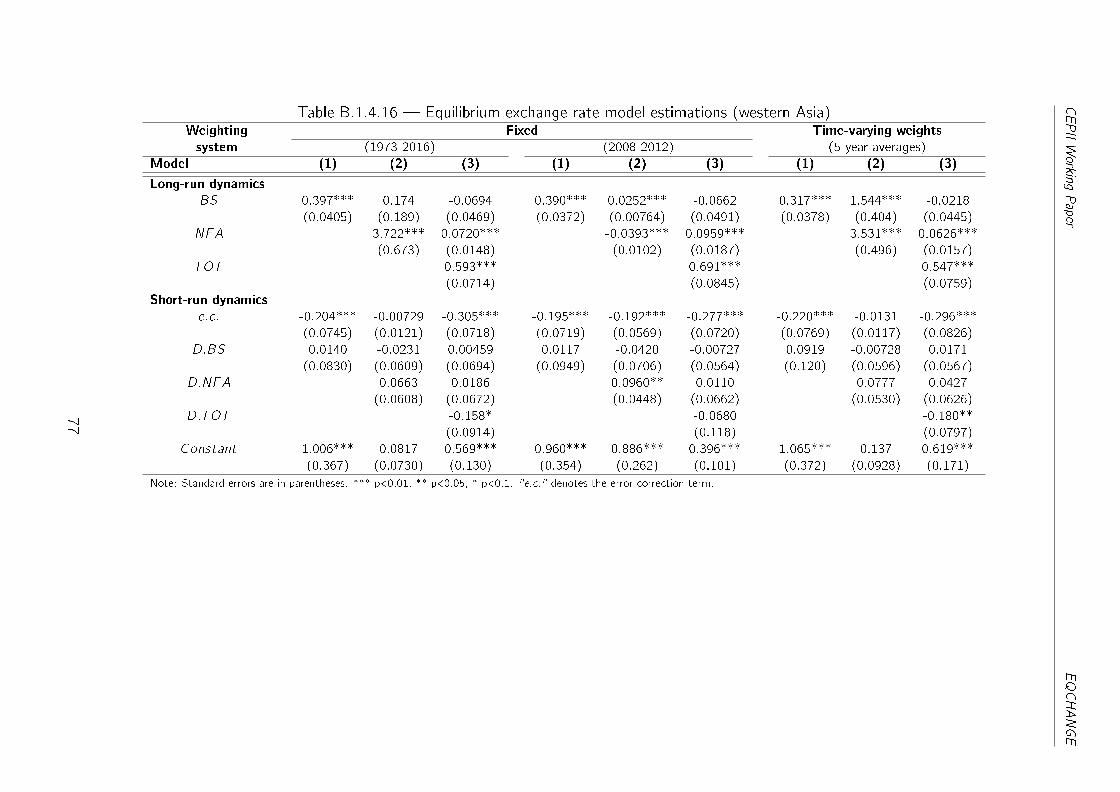
CEPIIWorkingPaper
EQCHANGE
Table B.1.4.16 � Equilibrium exchange rate model estimations (western Asia)Weighting Fixed Time-varying weights
system (1973-2016) (2008-2012) (5-year averages)
Model (1) (2) (3) (1) (2) (3) (1) (2) (3)
Long-run dynamics
BS 0.397*** 0.174 -0.0694 0.390*** 0.0252*** -0.0662 0.317*** 1.544*** -0.0218
(0.0405) (0.189) (0.0469) (0.0372) (0.00764) (0.0491) (0.0378) (0.404) (0.0445)
NFA 3.722*** 0.0720*** -0.0393*** 0.0959*** 3.531*** 0.0626***
(0.673) (0.0148) (0.0102) (0.0187) (0.496) (0.0157)
TOT 0.593*** 0.691*** 0.547***
(0.0714) (0.0845) (0.0759)
Short-run dynamics
e:c: -0.204*** -0.00729 -0.305*** -0.195*** -0.192*** -0.277*** -0.220*** -0.0131 -0.296***
(0.0745) (0.0121) (0.0718) (0.0719) (0.0569) (0.0720) (0.0769) (0.0117) (0.0826)
D:BS 0.0140 -0.0231 0.00459 0.0117 -0.0420 -0.00727 0.0919 -0.00728 0.0171
(0.0830) (0.0609) (0.0694) (0.0949) (0.0706) (0.0564) (0.120) (0.0596) (0.0567)
D:NFA 0.0663 0.0186 0.0960** 0.0110 0.0777 0.0427
(0.0608) (0.0672) (0.0448) (0.0662) (0.0530) (0.0626)
D:TOT -0.158* -0.0680 -0.180**
(0.0914) (0.118) (0.0797)
Constant 1.006*** 0.0817 0.569*** 0.960*** 0.886*** 0.396*** 1.065*** 0.137 0.619***
(0.367) (0.0730) (0.130) (0.354) (0.262) (0.101) (0.372) (0.0928) (0.171)
Note: Standard errors are in parentheses. *** p<0.01, ** p<0.05, * p<0.1. "e.c." denotes the error-correction term.
77

CEPIIWorkingPaper
EQCHANGE
Table B.1.4.17 � Equilibrium exchange rate model estimations (western Europe)Weighting Fixed Time-varying weights
system (1973-2016) (2008-2012) (5-year averages)
Model (1) (2) (3) (1) (2) (3) (1) (2) (3)
Long-run dynamics
BS -0.476*** -0.565*** -0.168*** -0.165*** -0.540*** -0.727***
(0.0483) (0.0661) (0.0491) (0.0409) (0.0616) (0.156)
NFA -0.301*** -0.188*** -0.310***
(0.108) (0.0664) (0.0961)
TOT 1.380** 0.867** 2.783***
(0.629) (0.377) (0.995)
Short-run dynamics
e:c: -0.119*** -0.0809 -0.166*** -0.138** -0.138*** -0.0780*
(0.0354) (0.0493) (0.0308) (0.0568) (0.0327) (0.0419)
D:BS -0.0741 -0.0655 -0.0593** -0.0520*** -0.0468 -0.0408
(0.0494) (0.0481) (0.0240) (0.0200) (0.0599) (0.0604)
D:NFA -0.0705 -0.0842 -0.0425
(0.0571) (0.0679) (0.0581)
D:TOT 0.371 0.404* 0.303
(0.257) (0.234) (0.242)
Constant 0.568*** -0.132* 0.774*** 0.0988** 0.658*** -0.626*
(0.168) (0.0786) (0.143) (0.0407) (0.155) (0.334)
Note: Standard errors are in parentheses. *** p<0.01, ** p<0.05, * p<0.1. "e.c." denotes the error-correction term.
78

CEPIIWorkingPaper
EQCHANGE
B.2. Estimations (top 30 trade partners)
Table B.2 � Equilibrium exchange rate model estimations (all countries)Weighting Fixed Time-varying weights
system (1973-2016) (2008-2012) (5-year averages)
Model (1) (2) (3) (1) (2) (3) (1) (2) (3)
Long-run dynamics
BS 0.336*** 0.534*** 0.130*** 0.282*** 0.274*** 0.0720*** 0.360*** 0.424*** 0.131***
(0.0226) (0.0291) (0.0217) (0.0208) (0.0236) (0.0216) (0.0211) (0.0235) (0.0218)
NFA 0.159*** 0.0427*** 0.172*** 0.0422*** 0.140*** 0.0394***
(0.0152) (0.00613) (0.0131) (0.00613) (0.0139) (0.00561)
TOT 0.360*** 0.410*** 0.381***
(0.0307) (0.0318) (0.0318)
Short-run dynamics
e:c: -0.183*** -0.145*** -0.187*** -0.183*** -0.157*** -0.188*** -0.184*** -0.150*** -0.191***
(0.0173) (0.0146) (0.0151) (0.0166) (0.0146) (0.0164) (0.0183) (0.0148) (0.0166)
D:BS 0.208* 0.134 0.165 0.218* 0.164 0.178 0.233** 0.192 0.202
(0.122) (0.123) (0.153) (0.115) (0.121) (0.141) (0.104) (0.120) (0.125)
D:NFA 0.0165 0.0556*** -0.00115 0.0551*** 0.0101 0.0572**
(0.0402) (0.0212) (0.0510) (0.0207) (0.0417) (0.0242)
D:TOT 0.0810 0.0904 0.112
(0.112) (0.118) (0.181)
Constant 0.913*** 0.778*** 0.580*** 0.905*** 0.796*** 0.530*** 0.922*** 0.786*** 0.577***
(0.0839) (0.0751) (0.0470) (0.0794) (0.0713) (0.0460) (0.0888) (0.0747) (0.0499)
Note: Standard errors are in parentheses. *** p<0.01, ** p<0.05, * p<0.1. "e.c." denotes the error-correction term.
79

CEPIIWorkingPaper
EQCHANGE
B.2.1. Development levels
Table B.2.1.1 � Equilibrium exchange rate model estimations (advanced economies)Weighting Fixed Time-varying weights
system (1973-2016) (2008-2012) (5-year averages)
Model (1) (2) (3) (1) (2) (3) (1) (2) (3)
Long-run dynamics
BS -0.493*** 0.0441 0.0349 0.0805** 0.0249 0.0168 0.213*** 0.197*** 0.133***
(0.0451) (0.0349) (0.0352) (0.0387) (0.0324) (0.0272) (0.0528) (0.0476) (0.0506)
NFA 0.0386*** 0.00700 0.0338*** 0.0233** -0.0560*** 0.0164*
(0.00765) (0.0103) (0.0118) (0.0116) (0.0167) (0.00990)
TOT 1.052*** 0.702*** 0.969***
(0.0781) (0.0913) (0.0732)
Short-run dynamics
e:c: -0.107*** -0.175*** -0.202*** -0.152*** -0.165*** -0.192*** -0.189*** -0.167*** -0.198***
(0.0308) (0.0298) (0.0343) (0.0218) (0.0260) (0.0292) (0.0372) (0.0270) (0.0350)
D:BS 0.0404 -0.0316 -0.0929** 0.0229 -0.0539 -0.0877** -1.29e-05 0.0197 -0.0369
(0.0744) (0.0609) (0.0473) (0.0910) (0.0501) (0.0402) (0.0407) (0.0389) (0.0359)
D:NFA -0.0322 -0.0694 -0.0203 -0.0698 -0.0666
(0.0496) (0.0427) (0.0464) (0.0439) (0.0456)
D:TOT 0.287*** 0.354*** 0.275***
(0.0891) (0.0849) (0.0866)
Constant 0.498*** 0.811*** -0.0458*** 0.695*** 0.761*** 0.266*** 0.858*** 0.758*** 0.0276***
(0.137) (0.141) (0.00866) (0.100) (0.120) (0.0401) (0.171) (0.123) (0.00652)
Note: Standard errors are in parentheses. *** p<0.01, ** p<0.05, * p<0.1. "e.c." denotes the error-correction term.
80

CEPIIWorkingPaper
EQCHANGE
Table B.2.1.2 � Equilibrium exchange rate model estimations (emerging economies)Weighting Fixed Time-varying weights
system (1973-2016) (2008-2012) (5-year averages)
Model (1) (2) (3) (1) (2) (3) (1) (2) (3)
Long-run dynamics
BS 0.397*** 0.769*** -0.0247 0.245*** 0.678*** -0.0733* 0.339*** 0.513*** -0.00846
(0.0388) (0.0486) (0.0347) (0.0394) (0.0554) (0.0395) (0.0342) (0.0385) (0.0234)
NFA 0.187*** -0.0255 0.155*** 0.00188 0.211*** -0.0228
(0.0396) (0.0263) (0.0349) (0.0270) (0.0370) (0.0263)
TOT 0.234*** 0.322*** 0.267***
(0.0300) (0.0375) (0.0248)
Short-run dynamics
e:c: -0.208*** -0.188*** -0.197*** -0.220*** -0.195*** -0.205*** -0.207*** -0.188*** -0.211***
(0.0397) (0.0374) (0.0343) (0.0381) (0.0374) (0.0361) (0.0410) (0.0377) (0.0387)
D:BS 0.514** 0.329 0.250*** 0.467* 0.344 0.187** 0.477** 0.337* 0.263***
(0.256) (0.206) (0.0780) (0.241) (0.241) (0.0790) (0.192) (0.174) (0.0606)
D:NFA -0.0186 0.134*** -0.0530 0.133*** -0.0375 0.115***
(0.110) (0.0397) (0.157) (0.0386) (0.111) (0.0410)
D:TOT -0.0757 -0.109* -0.148*
(0.0585) (0.0660) (0.0798)
Constant 1.009*** 0.996*** 0.685*** 1.041*** 1.005*** 0.627*** 0.992*** 0.961*** 0.698***
(0.190) (0.192) (0.121) (0.178) (0.188) (0.112) (0.195) (0.188) (0.131)
Note: Standard errors are in parentheses. *** p<0.01, ** p<0.05, * p<0.1. "e.c." denotes the error-correction term.
81

CEPIIWorkingPaper
EQCHANGE
Table B.2.1.3 � Equilibrium exchange rate model estimations (developing countries)Weighting Fixed Time-varying weights
system (1973-2016) (2008-2012) (5-year averages)
Model (1) (2) (3) (1) (2) (3) (1) (2) (3)
Long-run dynamics
BS 0.388*** 0.239*** 0.453*** 0.370*** 0.140*** 0.246*** 0.399*** 0.106*** 0.167***
(0.0305) (0.0318) (0.0378) (0.0289) (0.0267) (0.0334) (0.0290) (0.0134) (0.0337)
NFA 0.227*** 0.102*** 0.269*** 0.0456*** 0.200*** 0.0352***
(0.0197) (0.0110) (0.0209) (0.00818) (0.0180) (0.00817)
TOT 0.315*** 0.265*** 0.285***
(0.0344) (0.0362) (0.0386)
Short-run dynamics
e:c: -0.177*** -0.138*** -0.150*** -0.178*** -0.145*** -0.191*** -0.172*** -0.147*** -0.190***
(0.0217) (0.0152) (0.0173) (0.0212) (0.0155) (0.0230) (0.0225) (0.0166) (0.0227)
D:BS 0.108 0.0825 0.181 0.142 0.127 0.245 0.174 0.179 0.246
(0.174) (0.197) (0.280) (0.163) (0.181) (0.259) (0.159) (0.200) (0.230)
D:NFA 0.0303 0.0625** 0.0191 0.0551** 0.0374 0.0677*
(0.0426) (0.0285) (0.0424) (0.0271) (0.0461) (0.0352)
D:TOT 0.108 0.133 0.204
(0.205) (0.215) (0.333)
Constant 0.941*** 0.737*** 0.589*** 0.941*** 0.753*** 0.720*** 0.918*** 0.751*** 0.682***
(0.109) (0.0793) (0.0667) (0.106) (0.0780) (0.0850) (0.114) (0.0831) (0.0790)
Note: Standard errors are in parentheses. *** p<0.01, ** p<0.05, * p<0.1. "e.c." denotes the error-correction term.
82
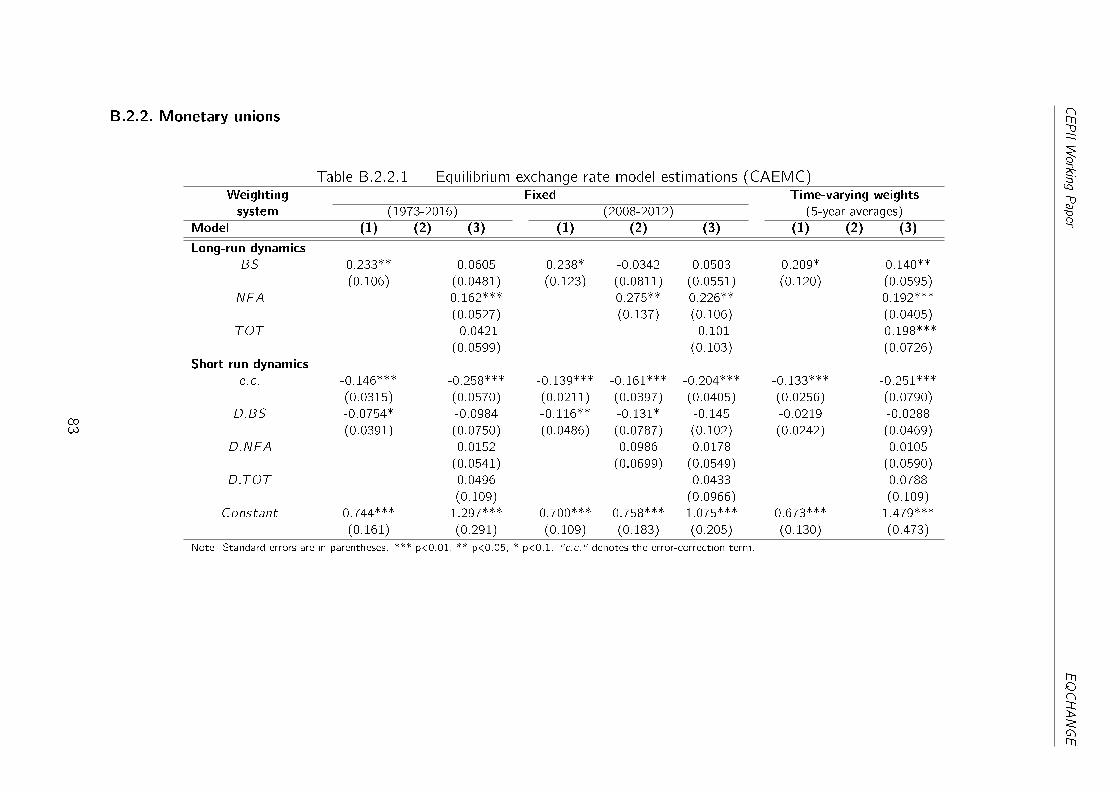
CEPIIWorkingPaper
EQCHANGE
B.2.2. Monetary unions
Table B.2.2.1 � Equilibrium exchange rate model estimations (CAEMC)Weighting Fixed Time-varying weights
system (1973-2016) (2008-2012) (5-year averages)
Model (1) (2) (3) (1) (2) (3) (1) (2) (3)
Long-run dynamics
BS 0.233** 0.0605 0.238* -0.0342 0.0503 0.209* 0.140**
(0.106) (0.0481) (0.123) (0.0811) (0.0551) (0.120) (0.0595)
NFA 0.162*** 0.275** 0.226** 0.192***
(0.0527) (0.137) (0.106) (0.0405)
TOT -0.0421 -0.101 -0.198***
(0.0599) (0.103) (0.0726)
Short-run dynamics
e:c: -0.146*** -0.258*** -0.139*** -0.161*** -0.204*** -0.133*** -0.251***
(0.0315) (0.0570) (0.0211) (0.0397) (0.0405) (0.0256) (0.0790)
D:BS -0.0754* -0.0984 -0.116** -0.131* -0.145 -0.0219 -0.0288
(0.0391) (0.0750) (0.0486) (0.0787) (0.102) (0.0242) (0.0469)
D:NFA 0.0152 0.0986 0.0178 0.0105
(0.0541) (0.0699) (0.0549) (0.0590)
D:TOT 0.0496 0.0433 0.0788
(0.109) (0.0966) (0.109)
Constant 0.744*** 1.297*** 0.700*** 0.758*** 1.075*** 0.673*** 1.479***
(0.161) (0.291) (0.109) (0.183) (0.205) (0.130) (0.473)
Note: Standard errors are in parentheses. *** p<0.01, ** p<0.05, * p<0.1. "e.c." denotes the error-correction term.
83

CEPIIWorkingPaper
EQCHANGE
Table B.2.2.2 � Equilibrium exchange rate model estimations (CFA)Weighting Fixed Time-varying weights
system (1973-2016) (2008-2012) (5-year averages)
Model (1) (2) (3) (1) (2) (3) (1) (2) (3)
Long-run dynamics
BS 0.193** -5.985*** 0.0606 0.202*** 0.164** 0.259*** 0.185** -2.258* 0.0679
(0.0775) (1.297) (0.0457) (0.0690) (0.0663) (0.0665) (0.0876) (1.194) (0.0448)
NFA -2.834*** 0.145*** 0.201** 0.261*** -0.305 0.210***
(0.823) (0.0434) (0.0818) (0.0811) (0.375) (0.0418)
TOT -0.00386 0.168** -0.119**
(0.0582) (0.0777) (0.0569)
Short-run dynamics
e:c: -0.158*** -0.0196 -0.216*** -0.170*** -0.167*** -0.171*** -0.160*** -0.0126 -0.220***
(0.0243) (0.0219) (0.0302) (0.0218) (0.0217) (0.0397) (0.0238) (0.0131) (0.0357)
D:BS -0.349 -0.249 -0.396 -0.226** -0.247*** -0.293** -0.0827 -0.0215 -0.111
(0.265) (0.176) (0.331) (0.0933) (0.0934) (0.140) (0.0724) (0.0550) (0.132)
D:NFA 0.271*** 0.204** 0.208*** 0.198** 0.234*** 0.141**
(0.0795) (0.0922) (0.0630) (0.0815) (0.0607) (0.0608)
D:TOT -0.0253 -0.0618 -0.0572
(0.110) (0.0717) (0.175)
Constant 0.778*** -0.182 1.043*** 0.841*** 0.835*** 0.767*** 0.786*** -0.0195*** 1.183***
(0.122) (0.192) (0.148) (0.111) (0.111) (0.181) (0.119) (0.00745) (0.196)
Note: Standard errors are in parentheses. *** p<0.01, ** p<0.05, * p<0.1. "e.c." denotes the error-correction term.
84

CEPIIWorkingPaper
EQCHANGE
Table B.2.2.3 � Equilibrium exchange rate model estimations (CMA)Weighting Fixed Time-varying weights
system (1973-2016) (2008-2012) (5-year averages)
Model (1) (2) (3) (1) (2) (3) (1) (2) (3)
Long-run dynamics
BS -1.748* 0.675*** 0.806*** -1.508** -0.271 -0.632 -1.250** -0.158
(0.907) (0.158) (0.198) (0.719) (0.594) (0.461) (0.534) (0.281)
NFA 0.174*** 0.230** 0.0526 0.104 0.186***
(0.0665) (0.0918) (0.0995) (0.0779) (0.0716)
TOT 0.136 0.719*** 0.555*
(0.564) (0.269) (0.324)
Short-run dynamics
e:c: -0.0443 -0.235* -0.272* -0.0530 -0.182 -0.252* -0.0600 -0.262*
(0.0331) (0.135) (0.154) (0.0369) (0.121) (0.150) (0.0415) (0.155)
D:BS 0.244** -0.0612 -0.0172 0.289** 0.184 0.372* 0.243* 0.263
(0.122) (0.227) (0.205) (0.125) (0.152) (0.208) (0.130) (0.165)
D:NFA 0.116* 0.0609 0.109** 0.102* 0.143*
(0.0600) (0.0873) (0.0543) (0.0617) (0.0854)
D:TOT -0.409 -0.110 -0.591
(0.298) (0.0834) (0.479)
Constant 0.0761 1.282 1.368 0.131 0.748 0.109 0.152 0.471
(0.0889) (0.797) (0.853) (0.117) (0.514) (0.0922) (0.129) (0.296)
Note: Standard errors are in parentheses. *** p<0.01, ** p<0.05, * p<0.1. "e.c." denotes the error-correction term.
85

CEPIIWorkingPaper
EQCHANGE
Table B.2.2.4 � Equilibrium exchange rate model estimations (ECMU)Weighting Fixed Time-varying weights
system (1973-2016) (2008-2012) (5-year averages)
Model (1) (2) (3) (1) (2) (3) (1) (2) (3)
Long-run dynamics
BS 0.0303 -0.00387 0.354** -0.113 -0.209*** -0.0328 -1.547
(0.0596) (0.0800) (0.168) (0.159) (0.0735) (0.0951) (3.741)
NFA 0.229*** -0.0237 0.446*** 0.192*** -1.176
(0.0337) (0.0331) (0.104) (0.0329) (3.121)
TOT 0.288 9.200
(0.221) (21.56)
Short-run dynamics
e:c: -0.159*** -0.0970* -0.179* -0.0531* -0.173*** -0.100** 0.00322
(0.0583) (0.0525) (0.103) (0.0302) (0.0574) (0.0485) (0.00678)
D:BS -0.0488*** -0.0459*** -0.0439*** -0.0562*** -0.00994 -0.0245*** -0.0175**
(0.0160) (0.0145) (0.0141) (0.0195) (0.00899) (0.00855) (0.00708)
D:NFA -0.0351** -0.0286 -0.0200* -0.0324* -0.0359
(0.0157) (0.0218) (0.0113) (0.0183) (0.0342)
D:TOT -0.0401 0.0269
(0.0690) (0.0631)
Constant 0.737*** 0.476* 0.626* 0.265* 0.757*** 0.484** 0.128
(0.268) (0.257) (0.359) (0.150) (0.249) (0.234) (0.278)
Note: Standard errors are in parentheses. *** p<0.01, ** p<0.05, * p<0.1. "e.c." denotes the error-correction term.
86

CEPIIWorkingPaper
EQCHANGE
Table B.2.2.5 � Equilibrium exchange rate model estimations (EMU)Weighting Fixed Time-varying weights
system (1973-2016) (2008-2012) (5-year averages)
Model (1) (2) (3) (1) (2) (3) (1) (2) (3)
Long-run dynamics
BS 0.853*** 0.0874** 0.0515 0.893*** 0.0652* 0.0331 0.721*** 0.171*** 0.137**
(0.0694) (0.0422) (0.0389) (0.0685) (0.0365) (0.0306) (0.0576) (0.0491) (0.0538)
NFA -0.0648*** -0.0805*** -0.0775*** -0.0668*** -0.0807*** -0.110***
(0.0243) (0.0213) (0.0269) (0.0189) (0.0215) (0.0209)
TOT 0.374*** -0.198*** 0.329***
(0.102) (0.0558) (0.116)
Short-run dynamics
e:c: -0.219*** -0.244*** -0.233*** -0.193*** -0.241*** -0.256*** -0.255*** -0.247*** -0.192***
(0.0814) (0.0462) (0.0409) (0.0722) (0.0509) (0.0688) (0.0907) (0.0476) (0.0428)
D:BS -0.214*** -0.194*** -0.126*** -0.0912 -0.0740 -0.0932* -0.221*** -0.0987* -0.135***
(0.0800) (0.0737) (0.0474) (0.142) (0.0684) (0.0535) (0.0745) (0.0566) (0.0384)
D:NFA -0.0250 -0.0233 -0.0409 -0.0298 -0.0763 -0.0366
(0.0402) (0.0425) (0.0387) (0.0467) (0.0653) (0.0400)
D:TOT 0.225*** 0.330*** 0.206***
(0.0790) (0.0936) (0.0619)
Constant 1.038*** 1.421*** 0.663*** 0.906*** 1.269*** 1.404*** 1.193*** 1.436*** 0.584***
(0.395) (0.268) (0.116) (0.350) (0.268) (0.379) (0.432) (0.274) (0.131)
Note: Standard errors are in parentheses. *** p<0.01, ** p<0.05, * p<0.1. "e.c." denotes the error-correction term.
87

CEPIIWorkingPaper
EQCHANGE
Table B.2.2.6 � Equilibrium exchange rate model estimations (WAEMU)Weighting Fixed Time-varying weights
system (1973-2016) (2008-2012) (5-year averages)
Model (1) (2) (3) (1) (2) (3) (1) (2) (3)
Long-run dynamics
BS 0.104 -6.037*** 0.0211 0.184** 0.189** 0.169* 0.120 -1.094*** -0.398**
(0.108) (1.299) (0.188) (0.0836) (0.0785) (0.0966) (0.121) (0.246) (0.187)
NFA -2.761*** 0.138 0.199** 0.245** 1.297*** 0.0209
(0.832) (0.106) (0.101) (0.103) (0.265) (0.0483)
TOT 0.445** 0.243** 0.678***
(0.198) (0.119) (0.188)
Short-run dynamics
e:c: -0.175*** -0.0362 -0.182*** -0.196*** -0.186*** -0.230*** -0.185*** -0.0800* -0.172***
(0.0354) (0.0388) (0.0407) (0.0328) (0.0337) (0.0465) (0.0361) (0.0416) (0.0401)
D:BS -0.546 -0.390 -0.665 -0.309** -0.317** -0.379* -0.122 -0.0119 -0.145
(0.462) (0.298) (0.570) (0.157) (0.153) (0.228) (0.125) (0.108) (0.227)
D:NFA 0.373*** 0.351** 0.288*** 0.307*** 0.235*** 0.280***
(0.115) (0.137) (0.0927) (0.117) (0.0513) (0.0766)
D:TOT -0.126 -0.121 -0.249
(0.179) (0.114) (0.307)
Constant 0.825*** -0.320 0.487*** 0.957*** 0.938*** 0.916*** 0.877*** 0.232** 0.125***
(0.172) (0.345) (0.108) (0.166) (0.175) (0.188) (0.177) (0.114) (0.0373)
Note: Standard errors are in parentheses. *** p<0.01, ** p<0.05, * p<0.1. "e.c." denotes the error-correction term.
88
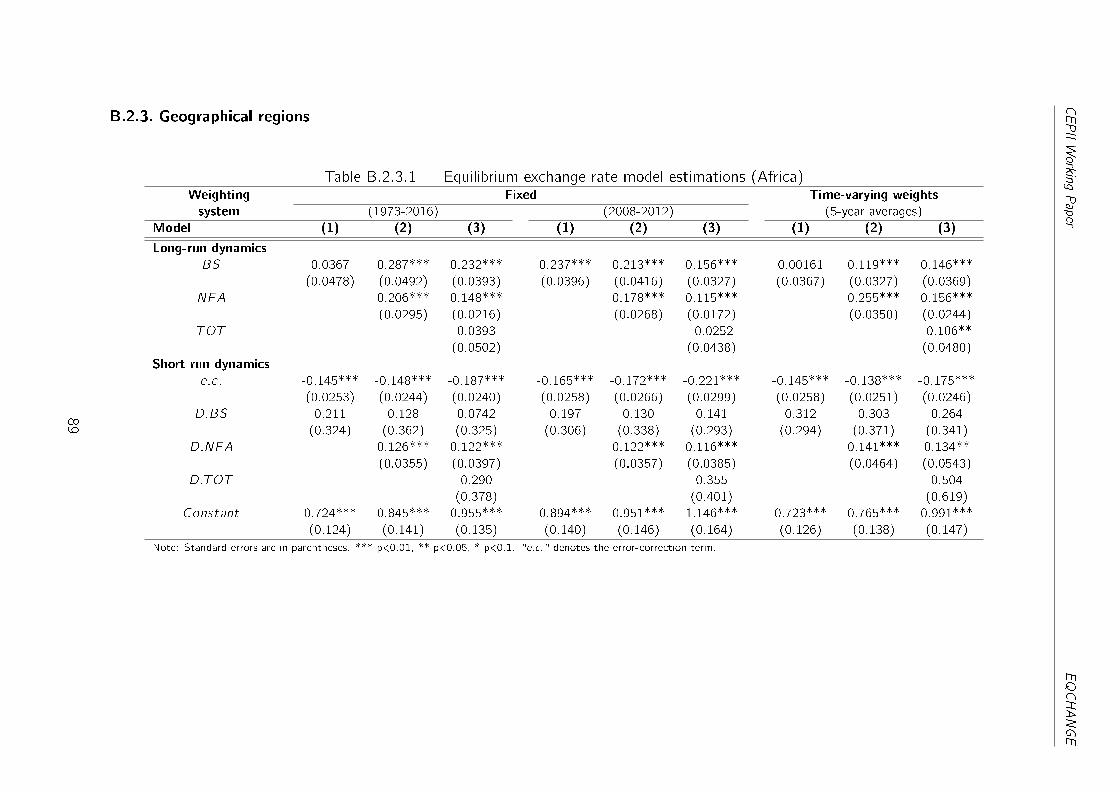
CEPIIWorkingPaper
EQCHANGE
B.2.3. Geographical regions
Table B.2.3.1 � Equilibrium exchange rate model estimations (Africa)Weighting Fixed Time-varying weights
system (1973-2016) (2008-2012) (5-year averages)
Model (1) (2) (3) (1) (2) (3) (1) (2) (3)
Long-run dynamics
BS 0.0367 0.287*** 0.232*** 0.237*** 0.213*** 0.156*** 0.00161 0.119*** 0.146***
(0.0478) (0.0492) (0.0393) (0.0396) (0.0416) (0.0327) (0.0367) (0.0327) (0.0369)
NFA 0.206*** 0.148*** 0.178*** 0.115*** 0.255*** 0.156***
(0.0295) (0.0216) (0.0268) (0.0172) (0.0350) (0.0244)
TOT 0.0393 -0.0252 -0.106**
(0.0502) (0.0438) (0.0480)
Short-run dynamics
e:c: -0.145*** -0.148*** -0.187*** -0.165*** -0.172*** -0.221*** -0.145*** -0.138*** -0.175***
(0.0253) (0.0244) (0.0240) (0.0258) (0.0266) (0.0299) (0.0258) (0.0251) (0.0246)
D:BS 0.211 0.128 0.0742 0.197 0.130 0.141 0.312 0.303 0.264
(0.324) (0.362) (0.325) (0.306) (0.338) (0.293) (0.294) (0.371) (0.341)
D:NFA 0.126*** 0.122*** 0.122*** 0.116*** 0.141*** 0.134**
(0.0355) (0.0397) (0.0357) (0.0385) (0.0464) (0.0543)
D:TOT 0.290 0.355 0.504
(0.378) (0.401) (0.619)
Constant 0.724*** 0.845*** 0.955*** 0.894*** 0.951*** 1.146*** 0.723*** 0.765*** 0.991***
(0.124) (0.141) (0.135) (0.140) (0.146) (0.164) (0.126) (0.138) (0.147)
Note: Standard errors are in parentheses. *** p<0.01, ** p<0.05, * p<0.1. "e.c." denotes the error-correction term.
89

CEPIIWorkingPaper
EQCHANGE
Table B.2.3.2 � Equilibrium exchange rate model estimations (America)Weighting Fixed Time-varying weights
system (1973-2016) (2008-2012) (5-year averages)
Model (1) (2) (3) (1) (2) (3) (1) (2) (3)
Long-run dynamics
BS -0.0113 -0.0118 0.0415 0.0203 0.0239 -0.0269 -0.0856 0.355***
(0.0267) (0.0659) (0.120) (0.0283) (0.0823) (0.0281) (0.0658) (0.0705)
NFA 0.239*** 1.135*** 1.134*** 0.218*** 0.138***
(0.0289) (0.148) (0.139) (0.0288) (0.0209)
TOT 0.0825 0.317*** 0.164**
(0.115) (0.0954) (0.0697)
Short-run dynamics
e:c: -0.127*** -0.0872*** -0.0853*** -0.129*** -0.0894*** -0.127*** -0.0900*** -0.144***
(0.0261) (0.0242) (0.0191) (0.0262) (0.0220) (0.0254) (0.0231) (0.0275)
D:BS 0.354** 0.326** 0.691 0.303* 0.639 0.336** 0.320** 0.582
(0.169) (0.142) (0.558) (0.165) (0.521) (0.152) (0.129) (0.393)
D:NFA -0.0259 0.00632 0.0164 -0.0372 0.0801
(0.114) (0.0417) (0.0479) (0.115) (0.0514)
D:TOT -0.0304 -0.0610 -0.0652
(0.0493) (0.0465) (0.0467)
Constant 0.591*** 0.425*** 0.389*** 0.605*** 0.315*** 0.588*** 0.428*** -0.144***
(0.115) (0.105) (0.0862) (0.116) (0.0752) (0.112) (0.0985) (0.0275)
Note: Standard errors are in parentheses. *** p<0.01, ** p<0.05, * p<0.1. "e.c." denotes the error-correction term.
90
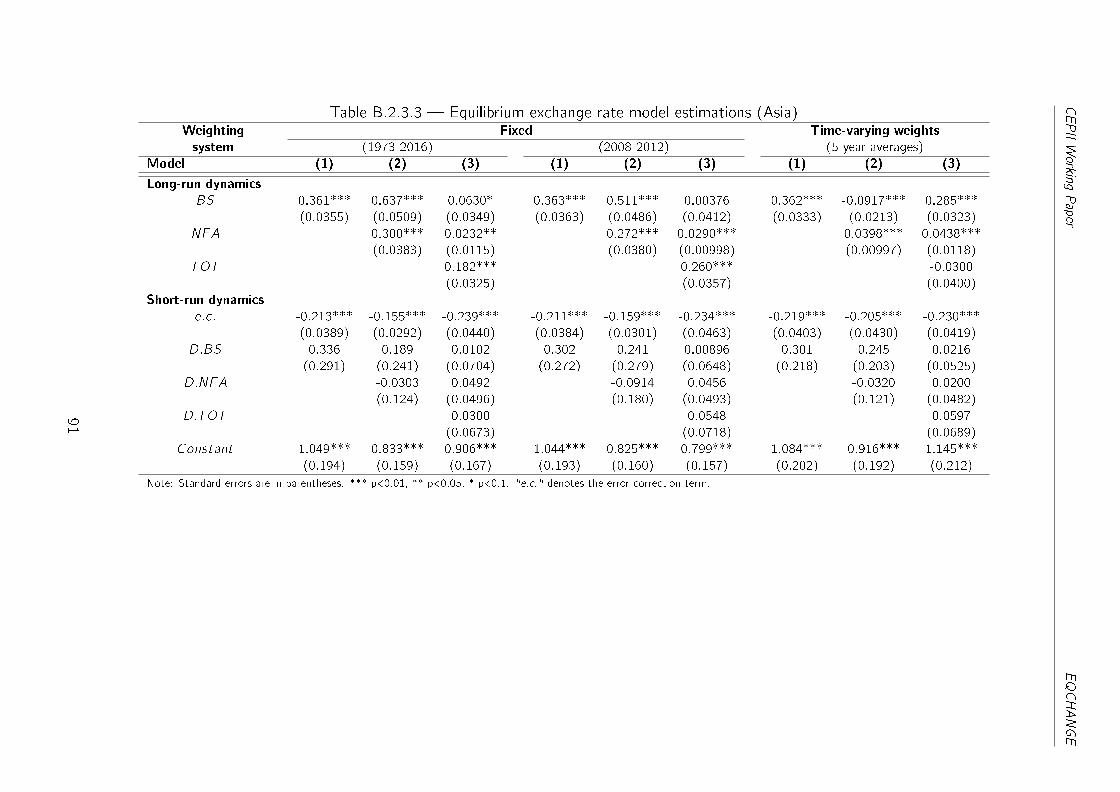
CEPIIWorkingPaper
EQCHANGE
Table B.2.3.3 � Equilibrium exchange rate model estimations (Asia)Weighting Fixed Time-varying weights
system (1973-2016) (2008-2012) (5-year averages)
Model (1) (2) (3) (1) (2) (3) (1) (2) (3)
Long-run dynamics
BS 0.361*** 0.637*** 0.0630* 0.363*** 0.511*** 0.00376 0.362*** -0.0917*** 0.285***
(0.0355) (0.0509) (0.0349) (0.0363) (0.0486) (0.0412) (0.0333) (0.0213) (0.0323)
NFA 0.300*** 0.0232** 0.272*** 0.0290*** 0.0398*** 0.0438***
(0.0383) (0.0115) (0.0380) (0.00998) (0.00997) (0.0118)
TOT 0.182*** 0.260*** -0.0300
(0.0325) (0.0357) (0.0400)
Short-run dynamics
e:c: -0.213*** -0.155*** -0.239*** -0.211*** -0.159*** -0.234*** -0.219*** -0.205*** -0.230***
(0.0389) (0.0292) (0.0440) (0.0384) (0.0301) (0.0463) (0.0403) (0.0430) (0.0419)
D:BS 0.336 0.189 0.0102 0.302 0.241 0.00896 0.301 0.245 0.0216
(0.291) (0.241) (0.0704) (0.272) (0.279) (0.0648) (0.218) (0.203) (0.0525)
D:NFA -0.0303 0.0492 -0.0914 0.0456 -0.0320 0.0200
(0.124) (0.0496) (0.180) (0.0493) (0.121) (0.0482)
D:TOT 0.0300 0.0548 0.0597
(0.0673) (0.0718) (0.0689)
Constant 1.049*** 0.833*** 0.906*** 1.044*** 0.825*** 0.799*** 1.084*** 0.916*** 1.145***
(0.194) (0.159) (0.167) (0.193) (0.160) (0.157) (0.202) (0.192) (0.212)
Note: Standard errors are in parentheses. *** p<0.01, ** p<0.05, * p<0.1. "e.c." denotes the error-correction term.
91

CEPIIWorkingPaper
EQCHANGE
Table B.2.3.4 � Equilibrium exchange rate model estimations (Europe)Weighting Fixed Time-varying weights
system (1973-2016) (2008-2012) (5-year averages)
Model (1) (2) (3) (1) (2) (3) (1) (2) (3)
Long-run dynamics
BS 0.445*** 0.495*** 0.179*** 0.233*** 0.358*** 0.0348 0.505*** 0.339*** 0.172***
(0.0447) (0.0576) (0.0398) (0.0424) (0.0580) (0.0283) (0.0421) (0.0459) (0.0311)
NFA -0.135*** -0.168*** -0.103*** -0.0535*** -0.0997*** 0.0160*
(0.0236) (0.0211) (0.0236) (0.0153) (0.0175) (0.00884)
TOT 0.604*** -0.129** 0.701***
(0.0717) (0.0534) (0.0747)
Short-run dynamics
e:c: -0.299*** -0.212*** -0.0567 -0.292*** -0.218*** -0.137 -0.313*** -0.227*** -0.212***
(0.0523) (0.0432) (0.157) (0.0460) (0.0436) (0.138) (0.0566) (0.0411) (0.0791)
D:BS 0.102 -0.106 0.699 0.115 -0.0881 0.732 0.187 0.149 0.184
(0.258) (0.0873) (0.793) (0.226) (0.0948) (0.763) (0.308) (0.178) (0.257)
D:NFA -0.0352 -0.149 -0.0241 -0.182 -0.0530 -0.105*
(0.0350) (0.153) (0.0312) (0.146) (0.0416) (0.0595)
D:TOT -1.006 -1.030 -0.629
(1.188) (1.290) (0.671)
Constant 1.423*** 0.994*** 0.0638 1.363*** 1.011*** 0.685 1.492*** 1.049*** 0.284**
(0.253) (0.205) (0.326) (0.217) (0.205) (0.742) (0.274) (0.193) (0.135)
Note: Standard errors are in parentheses. *** p<0.01, ** p<0.05, * p<0.1. "e.c." denotes the error-correction term.
92

CEPIIWorkingPaper
EQCHANGE
Table B.2.3.5 � Equilibrium exchange rate model estimations (Oceania)Weighting Fixed Time-varying weights
system (1973-2016) (2008-2012) (5-year averages)
Model (1) (2) (3) (1) (2) (3) (1) (2) (3)
Long-run dynamics
BS 0.883*** 0.344*** 0.572*** 1.335*** 1.422*** 0.461*** 0.521*** 0.416***
(0.108) (0.115) (0.156) (0.225) (0.193) (0.134) (0.0532) (0.156)
NFA 0.348*** 0.0820 -0.180*** -0.0418 -0.108*** 0.101
(0.0688) (0.0777) (0.0652) (0.0728) (0.0400) (0.0726)
TOT 1.664*** 1.688*** 0.892***
(0.192) (0.212) (0.132)
Short-run dynamics
e:c: -0.119** -0.115** -0.0677 -0.0634* -0.0805** -0.0799 -0.189*** -0.136**
(0.0478) (0.0477) (0.0536) (0.0366) (0.0399) (0.0588) (0.0472) (0.0548)
D:BS -0.107 -0.154 -0.101 -0.0903 -0.157 -0.0644 -0.0410 -0.108*
(0.105) (0.111) (0.191) (0.102) (0.109) (0.224) (0.0722) (0.0622)
D:NFA 0.0757 0.0562 0.102 0.0528 0.0841 0.0466
(0.116) (0.0778) (0.101) (0.0699) (0.106) (0.0842)
D:TOT -0.0315 -0.0655 -0.0722
(0.0926) (0.0940) (0.0942)
Constant 0.760** 0.634** -0.174 0.452* 0.590** -0.232 1.034*** 0.160***
(0.312) (0.277) (0.138) (0.266) (0.290) (0.173) (0.261) (0.0614)
Note: Standard errors are in parentheses. *** p<0.01, ** p<0.05, * p<0.1. "e.c." denotes the error-correction term.
93

CEPIIWorkingPaper
EQCHANGE
B.2.4. Geographical sub-regions
Table B.2.4.1 � Equilibrium exchange rate model estimations (Caribbean)Weighting Fixed Time-varying weights
system (1973-2016) (2008-2012) (5-year averages)
Model (1) (2) (3) (1) (2) (3) (1) (2) (3)
Long-run dynamics
BS -0.00813 0.232* 0.0306 -0.0215 0.165*
(0.0276) (0.129) (0.0308) (0.0290) (0.0964)
NFA -0.274*** -0.189***
(0.0867) (0.0584)
TOT 0.879*** 0.666***
(0.253) (0.204)
Short-run dynamics
e:c: -0.150*** -0.116*** -0.138*** -0.147*** -0.155***
(0.0263) (0.0336) (0.0268) (0.0237) (0.0549)
D:BS -0.100 -0.0572 -0.100 -0.0697 0.0368
(0.0950) (0.159) (0.0827) (0.0926) (0.0999)
D:NFA 0.0930 0.102
(0.0825) (0.0894)
D:TOT -0.0601 -0.0968
(0.0950) (0.0923)
Constant 0.694*** 0.0548*** 0.642*** 0.678*** 0.228***
(0.119) (0.0200) (0.123) (0.107) (0.0865)
Note: Standard errors are in parentheses. *** p<0.01, ** p<0.05, * p<0.1. "e.c." denotes the error-correction term.
94

CEPIIWorkingPaper
EQCHANGE
Table B.2.4.2 � Equilibrium exchange rate model estimations (central America)Weighting Fixed Time-varying weights
system (1973-2016) (2008-2012) (5-year averages)
Model (1) (2) (3) (1) (2) (3) (1) (2) (3)
Long-run dynamics
BS -0.222 0.0974 -0.232* -0.000536 -0.183 8.521** 0.0897
(0.150) (0.156) (0.135) (0.102) (0.126) (3.574) (0.114)
NFA -0.588* -0.679*** 1.842** -0.537*
(0.355) (0.160) (0.742) (0.283)
TOT 0.220 0.235 0.270
(0.378) (0.192) (0.331)
Short-run dynamics
e:c: -0.138** -0.0262 -0.144*** -0.0439 -0.145*** -0.0169* -0.0344
(0.0563) (0.0285) (0.0530) (0.0347) (0.0551) (0.00941) (0.0290)
D:BS 0.967 2.790 0.963 2.672 0.897 0.395 1.933
(0.654) (2.618) (0.642) (2.456) (0.594) (0.372) (1.731)
D:NFA 0.283** 0.301** 0.225* 0.287**
(0.121) (0.120) (0.124) (0.112)
D:TOT 0.0114 -0.00777 0.0367
(0.106) (0.0910) (0.128)
Constant 0.574** 0.0927 0.615*** 0.146 0.618** 0.303* 0.0869
(0.251) (0.0932) (0.235) (0.103) (0.249) (0.178) (0.0979)
Note: Standard errors are in parentheses. *** p<0.01, ** p<0.05, * p<0.1. "e.c." denotes the error-correction term.
95
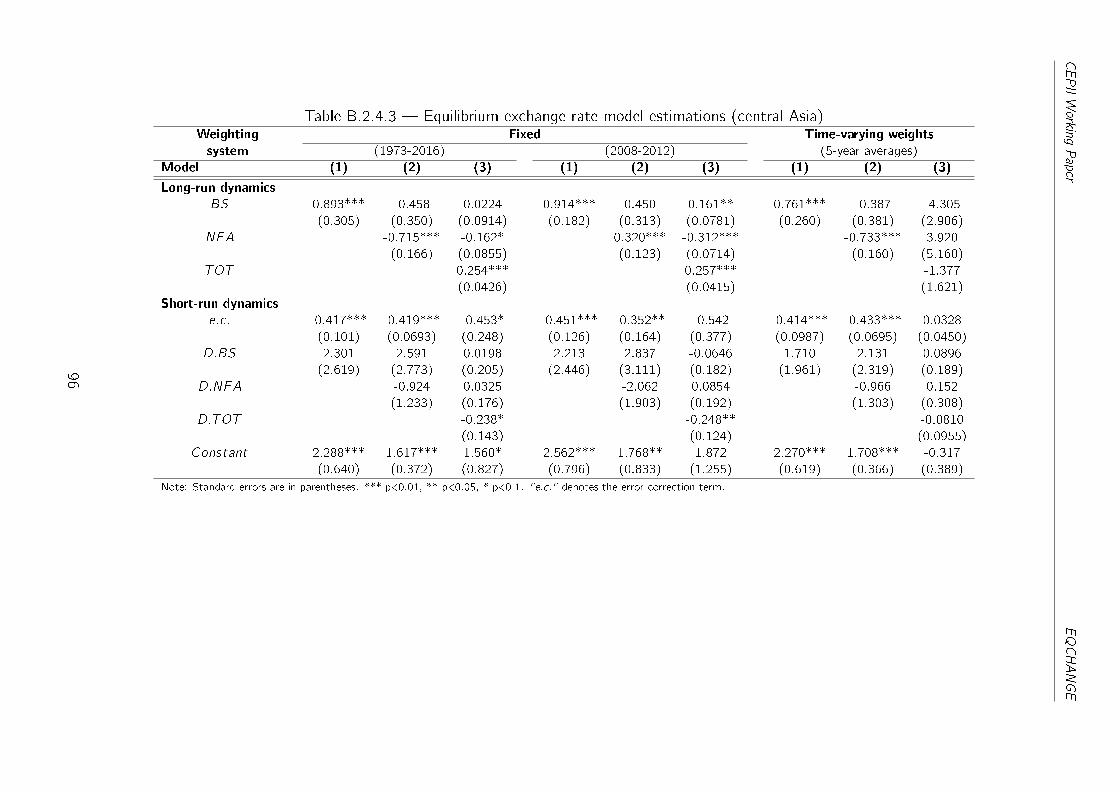
CEPIIWorkingPaper
EQCHANGE
Table B.2.4.3 � Equilibrium exchange rate model estimations (central Asia)Weighting Fixed Time-varying weights
system (1973-2016) (2008-2012) (5-year averages)
Model (1) (2) (3) (1) (2) (3) (1) (2) (3)
Long-run dynamics
BS 0.893*** -0.458 0.0224 0.914*** 0.450 0.161** 0.761*** -0.387 -4.305
(0.305) (0.350) (0.0914) (0.182) (0.313) (0.0781) (0.260) (0.381) (2.906)
NFA -0.715*** -0.162* 0.320*** -0.312*** -0.733*** 3.920
(0.166) (0.0855) (0.123) (0.0714) (0.160) (5.160)
TOT 0.254*** 0.257*** -1.377
(0.0426) (0.0415) (1.621)
Short-run dynamics
e:c: -0.417*** -0.419*** -0.453* -0.451*** -0.352** -0.542 -0.414*** -0.433*** 0.0328
(0.101) (0.0693) (0.248) (0.126) (0.164) (0.377) (0.0987) (0.0695) (0.0450)
D:BS 2.301 2.591 0.0198 2.213 2.837 -0.0646 1.710 2.131 0.0896
(2.619) (2.773) (0.205) (2.446) (3.111) (0.182) (1.961) (2.319) (0.189)
D:NFA -0.924 0.0325 -2.062 0.0854 -0.966 0.152
(1.233) (0.176) (1.903) (0.192) (1.303) (0.308)
D:TOT -0.238* -0.248** -0.0810
(0.143) (0.124) (0.0955)
Constant 2.288*** 1.617*** 1.560* 2.562*** 1.768** 1.872 2.270*** 1.708*** -0.317
(0.640) (0.372) (0.827) (0.796) (0.833) (1.255) (0.619) (0.366) (0.389)
Note: Standard errors are in parentheses. *** p<0.01, ** p<0.05, * p<0.1. "e.c." denotes the error-correction term.
96

CEPIIWorkingPaper
EQCHANGE
Table B.2.4.4 � Equilibrium exchange rate model estimations (eastern Africa)Weighting Fixed Time-varying weights
system (1973-2016) (2008-2012) (5-year averages)
Model (1) (2) (3) (1) (2) (3) (1) (2) (3)
Long-run dynamics
BS 1.164*** 0.329*** -1.368*** 0.0663 0.285*** -0.148* 3.415* -3.372***
(0.120) (0.0640) (0.236) (0.0752) (0.0645) (0.0798) (1.865) (0.901)
NFA 0.625*** 0.190*** 0.459*** 0.140*** 0.0763
(0.102) (0.0735) (0.0787) (0.0284) (0.0902)
TOT 0.710*** -0.262*** 2.327***
(0.119) (0.0468) (0.687)
Short-run dynamics
e:c: -0.0573* -0.0935*** -0.101** -0.140*** -0.143*** -0.186** -0.00412 -0.0268*
(0.0341) (0.0321) (0.0410) (0.0405) (0.0381) (0.0798) (0.0103) (0.0140)
D:BS 0.973 1.027 1.093 0.862 0.808 0.980 1.035 1.222
(1.052) (1.189) (1.046) (0.996) (1.119) (0.940) (0.990) (1.131)
D:NFA 0.156** 0.172** 0.145** 0.162** 0.309**
(0.0660) (0.0744) (0.0627) (0.0823) (0.153)
D:TOT 1.215 1.366 2.059
(1.232) (1.320) (2.065)
Constant 0.627** 0.726*** -0.144*** 0.839*** 0.998*** 1.052** 0.263 -0.349*
(0.302) (0.221) (0.0489) (0.209) (0.231) (0.446) (0.185) (0.198)
Note: Standard errors are in parentheses. *** p<0.01, ** p<0.05, * p<0.1. "e.c." denotes the error-correction term.
97

CEPIIWorkingPaper
EQCHANGE
Table B.2.4.5 � Equilibrium exchange rate model estimations (eastern Asia)Weighting Fixed Time-varying weights
system (1973-2016) (2008-2012) (5-year averages)
Model (1) (2) (3) (1) (2) (3) (1) (2) (3)
Long-run dynamics
BS 0.580*** 0.0298 0.133 0.640*** 0.207** 0.203** 0.611*** -0.0514 0.0196
(0.191) (0.0836) (0.0814) (0.219) (0.102) (0.0930) (0.207) (0.0436) (0.0392)
NFA 0.226 -0.0822 0.124 -0.0309 0.185 -0.0214
(0.154) (0.0658) (0.0918) (0.0292) (0.115) (0.0333)
TOT 0.158 0.0220 0.171**
(0.141) (0.0660) (0.0739)
Short-run dynamics
e:c: -0.0907*** -0.175*** -0.229*** -0.0981*** -0.213*** -0.334** -0.0984*** -0.220*** -0.262**
(0.0159) (0.0572) (0.0786) (0.0211) (0.0594) (0.156) (0.0311) (0.0737) (0.108)
D:BS 0.332*** 0.108 0.284*** 0.251** 0.139 0.241** 0.293*** 0.135 0.296***
(0.123) (0.389) (0.0909) (0.0991) (0.249) (0.102) (0.108) (0.230) (0.0489)
D:NFA -0.180* -0.178 -0.163* -0.222 -0.253*** -0.258
(0.108) (0.192) (0.0902) (0.188) (0.0939) (0.169)
D:TOT 0.624* 0.605* 0.636*
(0.367) (0.341) (0.368)
Constant 0.422*** 0.824*** 0.909*** 0.449*** 1.005*** 1.529** 0.436*** 1.020*** 1.002**
(0.0773) (0.275) (0.308) (0.106) (0.290) (0.716) (0.133) (0.353) (0.410)
Note: Standard errors are in parentheses. *** p<0.01, ** p<0.05, * p<0.1. "e.c." denotes the error-correction term.
98

CEPIIWorkingPaper
EQCHANGE
Table B.2.4.6 � Equilibrium exchange rate model estimations (eastern Europe)Weighting Fixed Time-varying weights
system (1973-2016) (2008-2012) (5-year averages)
Model (1) (2) (3) (1) (2) (3) (1) (2) (3)
Long-run dynamics
BS -0.485*** 0.287** -0.648*** -0.459*** -0.161 -0.327*** -0.182*** 0.232*
(0.0570) (0.130) (0.0564) (0.0496) (0.172) (0.0505) (0.0504) (0.121)
NFA -0.199*** -0.777*** -0.196** -0.886*** 0.112
(0.0669) (0.0908) (0.0869) (0.0738) (0.130)
TOT 0.573*** 1.003*** 0.601***
(0.144) (0.207) (0.146)
Short-run dynamics
e:c: -0.271*** -0.189* -0.239*** -0.244*** -0.257*** -0.272*** -0.252*** -0.293***
(0.0895) (0.103) (0.0774) (0.0785) (0.0650) (0.0844) (0.0883) (0.0862)
D:BS 0.242 -0.0889 0.161 0.375 -0.00884 0.302 0.291* 0.0134
(0.392) (0.261) (0.404) (0.261) (0.243) (0.380) (0.150) (0.160)
D:NFA -0.00794 0.117*** -0.0864 0.0557 -0.146*
(0.0870) (0.0381) (0.0713) (0.0861) (0.0757)
D:TOT -0.0527 -0.322 -0.500
(0.123) (0.275) (0.362)
Constant 1.180*** 0.384* 1.027*** 0.972*** -0.0472*** 1.205*** 1.022*** 0.577***
(0.391) (0.202) (0.346) (0.301) (0.0133) (0.383) (0.352) (0.171)
Note: Standard errors are in parentheses. *** p<0.01, ** p<0.05, * p<0.1. "e.c." denotes the error-correction term.
99
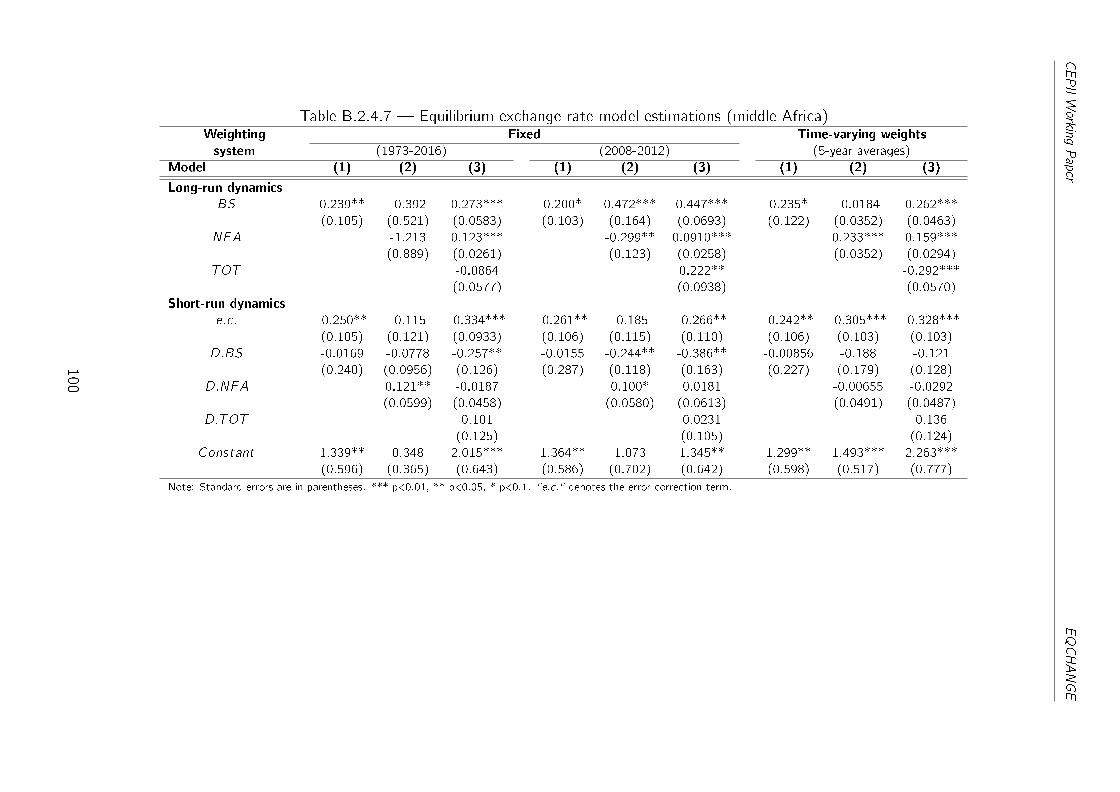
CEPIIWorkingPaper
EQCHANGE
Table B.2.4.7 � Equilibrium exchange rate model estimations (middle Africa)Weighting Fixed Time-varying weights
system (1973-2016) (2008-2012) (5-year averages)
Model (1) (2) (3) (1) (2) (3) (1) (2) (3)
Long-run dynamics
BS 0.239** -0.392 0.273*** 0.200* 0.472*** 0.447*** 0.235* -0.0184 0.262***
(0.105) (0.521) (0.0583) (0.103) (0.164) (0.0693) (0.122) (0.0352) (0.0463)
NFA -1.213 0.123*** -0.299** 0.0910*** 0.233*** 0.159***
(0.889) (0.0261) (0.123) (0.0258) (0.0352) (0.0294)
TOT -0.0864 0.222** -0.292***
(0.0577) (0.0938) (0.0570)
Short-run dynamics
e:c: -0.250** -0.115 -0.334*** -0.261** -0.185 -0.266** -0.242** -0.305*** -0.328***
(0.105) (0.121) (0.0933) (0.106) (0.115) (0.110) (0.106) (0.103) (0.103)
D:BS -0.0169 -0.0778 -0.257** -0.0155 -0.244** -0.386** -0.00856 -0.188 -0.121
(0.240) (0.0956) (0.126) (0.287) (0.118) (0.163) (0.227) (0.179) (0.128)
D:NFA 0.121** -0.0187 0.100* 0.0181 -0.00655 -0.0292
(0.0599) (0.0458) (0.0580) (0.0613) (0.0491) (0.0487)
D:TOT 0.101 0.0231 0.136
(0.125) (0.105) (0.124)
Constant 1.339** 0.348 2.015*** 1.364** 1.073 1.345** 1.299** 1.493*** 2.263***
(0.596) (0.365) (0.643) (0.586) (0.702) (0.642) (0.598) (0.517) (0.777)
Note: Standard errors are in parentheses. *** p<0.01, ** p<0.05, * p<0.1. "e.c." denotes the error-correction term.
100

CEPIIWorkingPaper
EQCHANGE
Table B.2.4.8 � Equilibrium exchange rate model estimations (northern Africa)Weighting Fixed Time-varying weights
system (1973-2016) (2008-2012) (5-year averages)
Model (1) (2) (3) (1) (2) (3) (1) (2) (3)
Long-run dynamics
BS 1.450*** 1.379*** 0.963*** 1.408*** 1.346*** 1.112*** 1.560*** 1.204*** 0.942***
(0.166) (0.141) (0.136) (0.148) (0.123) (0.132) (0.289) (0.188) (0.139)
NFA -0.0362 -0.0944*** -0.0465 -0.0998*** -0.0447 -0.0933***
(0.0386) (0.0167) (0.0338) (0.0167) (0.0315) (0.0167)
TOT 0.380*** 0.345*** 0.376***
(0.0936) (0.0946) (0.0939)
Short-run dynamics
e:c: -0.151** -0.174** -0.277* -0.152** -0.180* -0.263 -0.129** -0.168* -0.268
(0.0659) (0.0829) (0.163) (0.0745) (0.0953) (0.171) (0.0659) (0.0981) (0.164)
D:BS -0.00625 -0.0535 -0.117 -0.0255 -0.0729 -0.152 0.00883 -0.0505 -0.120
(0.162) (0.217) (0.301) (0.154) (0.208) (0.301) (0.158) (0.201) (0.306)
D:NFA 0.0925 0.0412 0.134 0.0937 0.0846 0.0421
(0.141) (0.0924) (0.160) (0.109) (0.128) (0.0935)
D:TOT -0.333** -0.295* -0.340**
(0.162) (0.152) (0.161)
Constant 1.012** 1.143* 1.187 1.000* 1.165* 1.219 0.896* 1.071 1.146
(0.478) (0.585) (0.749) (0.528) (0.661) (0.857) (0.501) (0.663) (0.753)
Note: Standard errors are in parentheses. *** p<0.01, ** p<0.05, * p<0.1. "e.c." denotes the error-correction term.
101

CEPIIWorkingPaper
EQCHANGE
Table B.2.4.9 � Equilibrium exchange rate model estimations (northern Europe)Weighting Fixed Time-varying weights
system (1973-2016) (2008-2012) (5-year averages)
Model (1) (2) (3) (1) (2) (3) (1) (2) (3)
Long-run dynamics
BS 0.827*** 0.0230 0.880*** 0.241*** 0.721*** 0.404*** 0.0791
(0.0688) (0.0538) (0.0698) (0.0910) (0.0580) (0.0615) (0.0725)
NFA 0.0161 0.150** -0.109*** 0.0128
(0.0130) (0.0722) (0.0256) (0.0125)
TOT 1.072*** 1.184*** 1.136***
(0.141) (0.229) (0.124)
Short-run dynamics
e:c: -0.333** -0.283*** -0.299** -0.178*** -0.369*** -0.271*** -0.285***
(0.131) (0.0502) (0.135) (0.0515) (0.127) (0.0879) (0.0579)
D:BS -0.272** -0.122* -0.288** -0.152 -0.153** -0.0824 -0.131**
(0.122) (0.0658) (0.133) (0.108) (0.0680) (0.0703) (0.0543)
D:NFA -0.0104 -0.0137 0.0166 -0.0318
(0.0373) (0.0362) (0.0532) (0.0214)
D:TOT 0.191* 0.234* 0.131**
(0.116) (0.139) (0.0575)
Constant 1.608** -0.0771*** 1.442** -0.128*** 1.770*** 1.258*** -0.162***
(0.644) (0.0147) (0.656) (0.0337) (0.616) (0.410) (0.0339)
Note: Standard errors are in parentheses. *** p<0.01, ** p<0.05, * p<0.1. "e.c." denotes the error-correction term.
102

CEPIIWorkingPaper
EQCHANGE
Table B.2.4.10 � Equilibrium exchange rate model estimations (south America)Weighting Fixed Time-varying weights
system (1973-2016) (2008-2012) (5-year averages)
Model (1) (2) (3) (1) (2) (3) (1) (2) (3)
Long-run dynamics
BS 0.783*** 0.539** -0.598*** 0.668*** -0.0319 0.0466 0.160 0.151 0.561***
(0.167) (0.211) (0.221) (0.135) (0.154) (0.0921) (0.145) (0.279) (0.197)
NFA 0.226** 0.0840 2.064*** 1.548*** 2.565*** 0.178
(0.110) (0.0840) (0.399) (0.222) (0.533) (0.111)
TOT 0.662*** 0.598*** 0.0802
(0.154) (0.101) (0.147)
Short-run dynamics
e:c: -0.120** -0.0919 -0.117*** -0.141** -0.102*** -0.101** -0.0875 -0.0864*** -0.176***
(0.0604) (0.0567) (0.0334) (0.0590) (0.0301) (0.0430) (0.0644) (0.0238) (0.0537)
D:BS 0.430*** 0.433*** 0.554*** 0.335** 0.333** 0.320** 0.420*** 0.325*** 0.367***
(0.154) (0.135) (0.146) (0.139) (0.147) (0.153) (0.141) (0.123) (0.135)
D:NFA -0.270 -0.0129 -0.405 -0.107 -0.454 0.0221
(0.287) (0.0765) (0.325) (0.123) (0.341) (0.0693)
D:TOT -0.185** -0.149** -0.135**
(0.0743) (0.0724) (0.0611)
Constant 0.694** 0.521* 0.109*** 0.769*** 0.504*** 0.228** 0.452 0.443*** 0.826***
(0.311) (0.267) (0.0402) (0.286) (0.146) (0.0932) (0.287) (0.116) (0.255)
Note: Standard errors are in parentheses. *** p<0.01, ** p<0.05, * p<0.1. "e.c." denotes the error-correction term.
103

CEPIIWorkingPaper
EQCHANGE
Table B.2.4.11 � Equilibrium exchange rate model estimations (south eastern Asia)Weighting Fixed Time-varying weights
system (1973-2016) (2008-2012) (5-year averages)
Model (1) (2) (3) (1) (2) (3) (1) (2) (3)
Long-run dynamics
BS -4.680*** -4.134 0.835*** -0.167*** -2.585 -4.288*** -3.957* 0.407***
(1.515) (5.987) (0.117) (0.0425) (2.484) (1.357) (2.257) (0.0593)
NFA -6.775 0.734*** -4.286 -0.144**
(9.440) (0.181) (3.483) (0.0718)
TOT 0.0995 0.0608
(0.126) (0.109)
Short-run dynamics
e:c: -0.0530** 0.000135 -0.162*** -0.136*** -0.000718 -0.0498* -0.00799 -0.107
(0.0252) (0.00537) (0.0612) (0.0339) (0.00898) (0.0255) (0.0147) (0.0736)
D:BS 0.667*** 0.101 -0.157 0.192 0.0869 0.721*** 0.249** 0.00339
(0.203) (0.223) (0.251) (0.220) (0.191) (0.218) (0.104) (0.153)
D:NFA 0.0900 0.0226 0.0801 0.0928
(0.0974) (0.0840) (0.0992) (0.0827)
D:TOT -0.0657 0.0137
(0.116) (0.124)
Constant -0.336* -0.0390 0.993*** 0.581*** -0.0458 -0.290* -0.130 0.527
(0.183) (0.0599) (0.374) (0.166) (0.0543) (0.170) (0.126) (0.371)
Note: Standard errors are in parentheses. *** p<0.01, ** p<0.05, * p<0.1. "e.c." denotes the error-correction term.
104

CEPIIWorkingPaper
EQCHANGE
Table B.2.4.12 � Equilibrium exchange rate model estimations (southern Africa)Weighting Fixed Time-varying weights
system (1973-2016) (2008-2012) (5-year averages)
Model (1) (2) (3) (1) (2) (3) (1) (2) (3)
Long-run dynamics
BS 0.573*** 0.446*** 0.653*** -1.557** 0.261*** -0.141 0.470*** 0.333** 0.0820
(0.110) (0.113) (0.191) (0.744) (0.0864) (0.196) (0.137) (0.132) (0.203)
NFA 0.131** 0.143* 0.0359 0.110* 0.146** 0.207***
(0.0636) (0.0732) (0.0664) (0.0606) (0.0701) (0.0668)
TOT -0.193 0.534** 0.580*
(0.433) (0.267) (0.327)
Short-run dynamics
e:c: -0.137** -0.248** -0.273** -0.0401 -0.233** -0.277** -0.0808 -0.201* -0.262**
(0.0688) (0.101) (0.109) (0.0288) (0.107) (0.118) (0.0595) (0.109) (0.124)
D:BS -0.0184 -0.0978 -0.0551 0.175 -0.0285 0.121 0.104 0.0381 0.105
(0.170) (0.183) (0.152) (0.151) (0.174) (0.224) (0.155) (0.210) (0.179)
D:NFA 0.0533 0.0348 0.0443 0.0444 0.0847 0.0667
(0.0945) (0.0758) (0.0838) (0.0790) (0.105) (0.0970)
D:TOT -0.412* -0.174* -0.660*
(0.227) (0.101) (0.378)
Constant 0.641* 1.231** 1.656** 0.0975 1.100** 0.532** 0.362 0.978* 0.513*
(0.331) (0.549) (0.717) (0.0862) (0.525) (0.238) (0.288) (0.572) (0.274)
Note: Standard errors are in parentheses. *** p<0.01, ** p<0.05, * p<0.1. "e.c." denotes the error-correction term.
105

CEPIIWorkingPaper
EQCHANGE
Table B.2.4.13 � Equilibrium exchange rate model estimations (southern Asia)Weighting Fixed Time-varying weights
system (1973-2016) (2008-2012) (5-year averages)
Model (1) (2) (3) (1) (2) (3) (1) (2) (3)
Long-run dynamics
BS 0.264** 0.140 0.215 0.229** 0.0290 0.216 0.390*** 0.462*** 0.241
(0.103) (0.117) (0.160) (0.100) (0.0838) (0.174) (0.111) (0.128) (0.215)
NFA 0.0326* -0.0851* 0.0525*** -0.0540 0.649*** 0.0383
(0.0175) (0.0466) (0.0136) (0.0391) (0.229) (0.0271)
TOT 1.121*** 1.040*** -0.313
(0.260) (0.244) (0.320)
Short-run dynamics
e:c: -0.292*** -0.325** -0.158* -0.284*** -0.363** -0.190* -0.291*** -0.180** -0.256**
(0.111) (0.145) (0.0838) (0.107) (0.154) (0.0994) (0.111) (0.0797) (0.119)
D:BS -0.0403 -0.0705 0.0284 0.00498 -0.0358 0.184 -0.0341 -0.0149 -0.0196
(0.124) (0.138) (0.119) (0.119) (0.141) (0.154) (0.0990) (0.119) (0.152)
D:NFA 0.311*** 0.182 0.317*** 0.214 0.184** 0.163
(0.0681) (0.153) (0.0717) (0.148) (0.0859) (0.146)
D:TOT 0.00937 0.0213 0.137
(0.0976) (0.104) (0.109)
Constant 1.442*** 1.554** -0.0532** 1.384*** 1.681** 0.00530 1.486*** 0.969** 1.609**
(0.539) (0.690) (0.0268) (0.515) (0.710) (0.0186) (0.560) (0.420) (0.757)
Note: Standard errors are in parentheses. *** p<0.01, ** p<0.05, * p<0.1. "e.c." denotes the error-correction term.
106

CEPIIWorkingPaper
EQCHANGE
Table B.2.4.14 � Equilibrium exchange rate model estimations (southern Europe)Weighting Fixed Time-varying weights
system (1973-2016) (2008-2012) (5-year averages)
Model (1) (2) (3) (1) (2) (3) (1) (2) (3)
Long-run dynamics
BS 0.405*** 0.0627 -0.371*** -0.0251 0.409*** 0.105 0.0189
(0.0965) (0.0863) (0.0648) (0.0416) (0.0672) (0.103) (0.0617)
NFA -0.112*** -0.0357** -0.0770** -0.103***
(0.0302) (0.0171) (0.0310) (0.0238)
TOT -0.214*** 0.301***
(0.0563) (0.108)
Short-run dynamics
e:c: -0.363*** -0.308*** -0.374*** -0.0566 -0.397*** -0.330*** -0.167
(0.105) (0.107) (0.0997) (0.482) (0.118) (0.104) (0.226)
D:BS 0.515 -0.301* 0.620 2.602 0.644 0.392 0.852
(0.774) (0.182) (0.654) (2.617) (0.959) (0.567) (0.846)
D:NFA -0.106 -0.542 -0.140 -0.217
(0.0923) (0.503) (0.0958) (0.205)
D:TOT -3.946 -2.129
(4.519) (2.354)
Constant 1.710*** 1.388*** 1.640*** 0.229 1.863*** 1.496*** 0.472
(0.502) (0.492) (0.433) (2.777) (0.556) (0.483) (0.770)
Note: Standard errors are in parentheses. *** p<0.01, ** p<0.05, * p<0.1. "e.c." denotes the error-correction term.
107

CEPIIWorkingPaper
EQCHANGE
Table B.2.4.15 � Equilibrium exchange rate model estimations (western Africa)Weighting Fixed Time-varying weights
system (1973-2016) (2008-2012) (5-year averages)
Model (1) (2) (3) (1) (2) (3) (1) (2) (3)
Long-run dynamics
BS -0.245*** -0.662*** -0.358*** 0.235*** 0.234*** 0.0323 -0.174*** -0.672*** -0.514***
(0.0593) (0.0961) (0.0896) (0.0731) (0.0770) (0.0694) (0.0626) (0.0974) (0.0604)
NFA 0.0477*** 0.00761 0.350*** 0.00909 0.0488*** 0.0259*
(0.0115) (0.0193) (0.104) (0.0289) (0.0115) (0.0137)
TOT 1.559*** 0.404*** 0.929***
(0.285) (0.108) (0.136)
Short-run dynamics
e:c: -0.188*** -0.122** -0.0886*** -0.159*** -0.132*** -0.204*** -0.196*** -0.126** -0.111***
(0.0445) (0.0530) (0.0268) (0.0226) (0.0245) (0.0432) (0.0436) (0.0544) (0.0339)
D:BS -0.311 -0.330 -0.454 -0.239* -0.239* -0.322** -0.0628 -0.0637 -0.131
(0.250) (0.246) (0.293) (0.140) (0.138) (0.163) (0.0920) (0.0819) (0.127)
D:NFA 0.222*** 0.264*** 0.178*** 0.249*** 0.205*** 0.207***
(0.0651) (0.0768) (0.0672) (0.0707) (0.0586) (0.0546)
D:TOT -0.180* -0.110 -0.205
(0.0983) (0.0688) (0.152)
Constant 0.735*** 0.355*** -0.279*** 0.805*** 0.706*** 0.584*** 0.804*** 0.365*** -0.0817***
(0.149) (0.126) (0.0864) (0.115) (0.129) (0.122) (0.157) (0.133) (0.0282)
Note: Standard errors are in parentheses. *** p<0.01, ** p<0.05, * p<0.1. "e.c." denotes the error-correction term.
108

CEPIIWorkingPaper
EQCHANGE
Table B.2.4.16 � Equilibrium exchange rate model estimations (Western Asia)Weighting Fixed Time-varying weights
system (1973-2016) (2008-2012) (5-year averages)
Model (1) (2) (3) (1) (2) (3) (1) (2) (3)
Long-run dynamics
BS 0.361*** 0.0420*** -0.0873* 0.386*** 0.0279*** -0.0305 0.324*** -0.121*** -0.106**
(0.0413) (0.0101) (0.0509) (0.0420) (0.00856) (0.0551) (0.0369) (0.0173) (0.0425)
NFA 0.0749** 0.0763*** 0.0690*** 0.0961*** -0.0591*** 0.0907***
(0.0333) (0.0157) (0.0255) (0.0218) (0.0104) (0.0164)
TOT 0.632*** 0.668*** 0.752***
(0.0772) (0.0943) (0.0778)
Short-run dynamics
e:c: -0.215*** -0.201*** -0.308*** -0.199*** -0.220*** -0.273*** -0.227*** -0.153*** -0.290***
(0.0756) (0.0694) (0.0711) (0.0723) (0.0677) (0.0670) (0.0782) (0.0558) (0.0834)
D:BS 0.0132 -0.0251 0.000961 0.00281 -0.0491 -0.0220 0.0845 0.0236 0.0359
(0.0765) (0.0669) (0.0706) (0.0891) (0.0701) (0.0569) (0.115) (0.0689) (0.0632)
D:NFA 0.0902 0.0183 0.0856* 0.0147 0.0898* 0.0486
(0.0579) (0.0709) (0.0453) (0.0688) (0.0484) (0.0687)
D:TOT -0.156 -0.0544 -0.215**
(0.101) (0.128) (0.0983)
Constant 1.051*** 0.929*** 0.515*** 0.981*** 1.012*** 0.420*** 1.101*** 0.699*** 0.328***
(0.370) (0.318) (0.114) (0.358) (0.311) (0.101) (0.380) (0.257) (0.0930)
Note: Standard errors are in parentheses. *** p<0.01, ** p<0.05, * p<0.1. "e.c." denotes the error-correction term.
109

CEPIIWorkingPaper
EQCHANGE
Table B.2.4.17 � Equilibrium exchange rate model estimations (western Europe)Weighting Fixed Time-varying weights
system (1973-2016) (2008-2012) (5-year averages)
Model (1) (2) (3) (1) (2) (3) (1) (2) (3)
Long-run dynamics
BS -0.534*** 0.0339 -0.461*** -0.0200 0.118 -0.590***
(0.0395) (0.0591) (0.0390) (0.0464) (0.103) (0.197)
NFA -0.154*** -0.126** -0.250***
(0.0559) (0.0580) (0.0951)
TOT 0.744*** 0.977*** 3.200***
(0.249) (0.334) (1.131)
Short-run dynamics
e:c: -0.0798* -0.140** -0.0703* -0.140*** -0.158*** -0.0616
(0.0408) (0.0563) (0.0422) (0.0499) (0.0342) (0.0400)
D:BS -0.127** -0.111*** -0.0842** -0.0661*** -0.106*** -0.0714
(0.0593) (0.0376) (0.0366) (0.0120) (0.0399) (0.0573)
D:NFA -0.0424 -0.0710 -0.0343
(0.0456) (0.0525) (0.0414)
D:TOT 0.327* 0.353* 0.291
(0.197) (0.210) (0.239)
Constant 0.376* 0.166** 0.336* 0.0200*** 0.720*** -0.619
(0.192) (0.0663) (0.202) (0.00700) (0.155) (0.399)
Note: Standard errors are in parentheses. *** p<0.01, ** p<0.05, * p<0.1. "e.c." denotes the error-correction term.
110

CEPII Working Paper EQCHANGE
C. Figures
Figure C.1 � Nominal e�ective exchange rates (2010=100)
Note: an increase corresponds to an appreciation. "f1": �xed weights 2008-2012; "bar": �xed weights 1973-2016;
"TV": time-varying weights (5 years averages)
111

CEPII Working Paper EQCHANGE
Figure C.1 � (Continued from previous page)
Note: an increase corresponds to an appreciation. "f1": �xed weights 2008-2012; "bar": �xed weights 1973-2016;
"TV": time-varying weights (5 years averages)
112

CEPII Working Paper EQCHANGE
Figure C.1 � (Continued from previous page)
Note: an increase corresponds to an appreciation. "f1": �xed weights 2008-2012; "bar": �xed weights 1973-2016;
"TV": time-varying weights (5 years averages)
113

CEPII Working Paper EQCHANGE
Figure C.1 � (Continued from previous page)
Note: an increase corresponds to an appreciation. "f1": �xed weights 2008-2012; "bar": �xed weights 1973-2016;
"TV": time-varying weights (5 years averages)
114

CEPII Working Paper EQCHANGE
Figure C.1 � (Continued from previous page)
Note: an increase corresponds to an appreciation. "f1": �xed weights 2008-2012; "bar": �xed weights 1973-2016;
"TV": time-varying weights (5 years averages)
115

CEPII Working Paper EQCHANGE
Figure C.1 � (Continued from previous page)
Note: an increase corresponds to an appreciation. "f1": �xed weights 2008-2012; "bar": �xed weights 1973-2016;
"TV": time-varying weights (5 years averages)
116
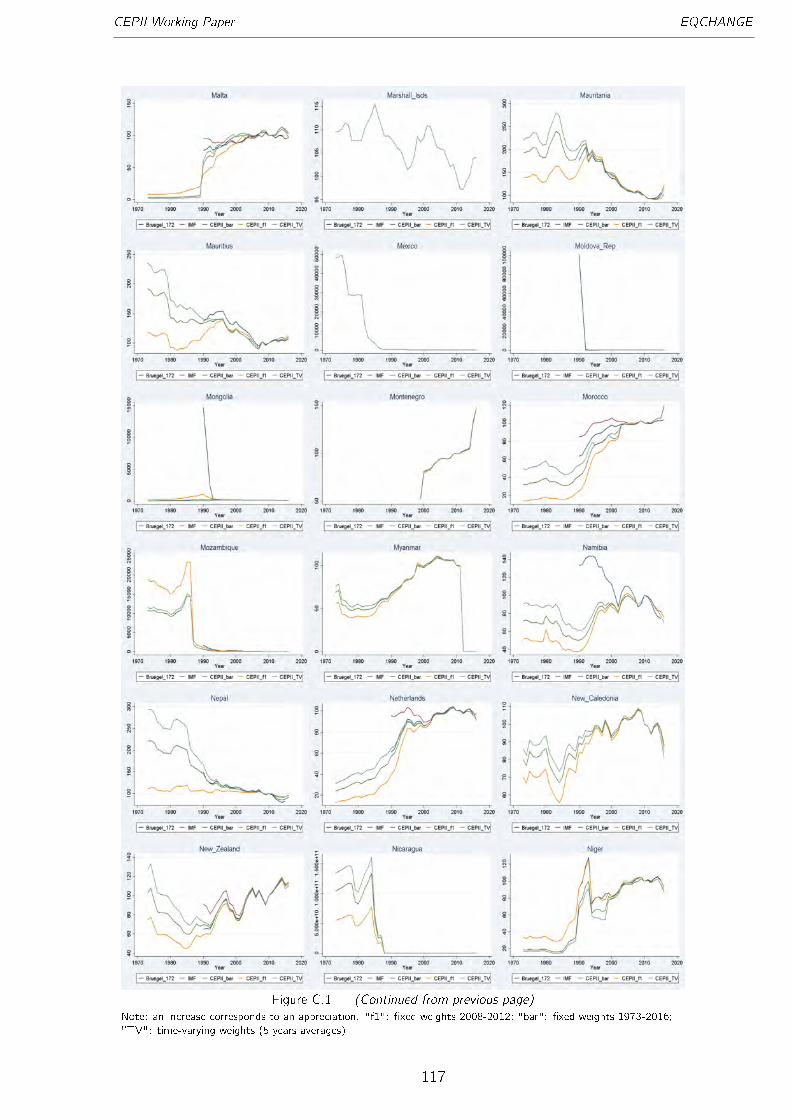
CEPII Working Paper EQCHANGE
Figure C.1 � (Continued from previous page)
Note: an increase corresponds to an appreciation. "f1": �xed weights 2008-2012; "bar": �xed weights 1973-2016;
"TV": time-varying weights (5 years averages)
117

CEPII Working Paper EQCHANGE
Figure C.1 � (Continued from previous page)
Note: an increase corresponds to an appreciation. "f1": �xed weights 2008-2012; "bar": �xed weights 1973-2016;
"TV": time-varying weights (5 years averages)
118

CEPII Working Paper EQCHANGE
Figure C.1 � (Continued from previous page)
Note: an increase corresponds to an appreciation. "f1": �xed weights 2008-2012; "bar": �xed weights 1973-2016;
"TV": time-varying weights (5 years averages)
119
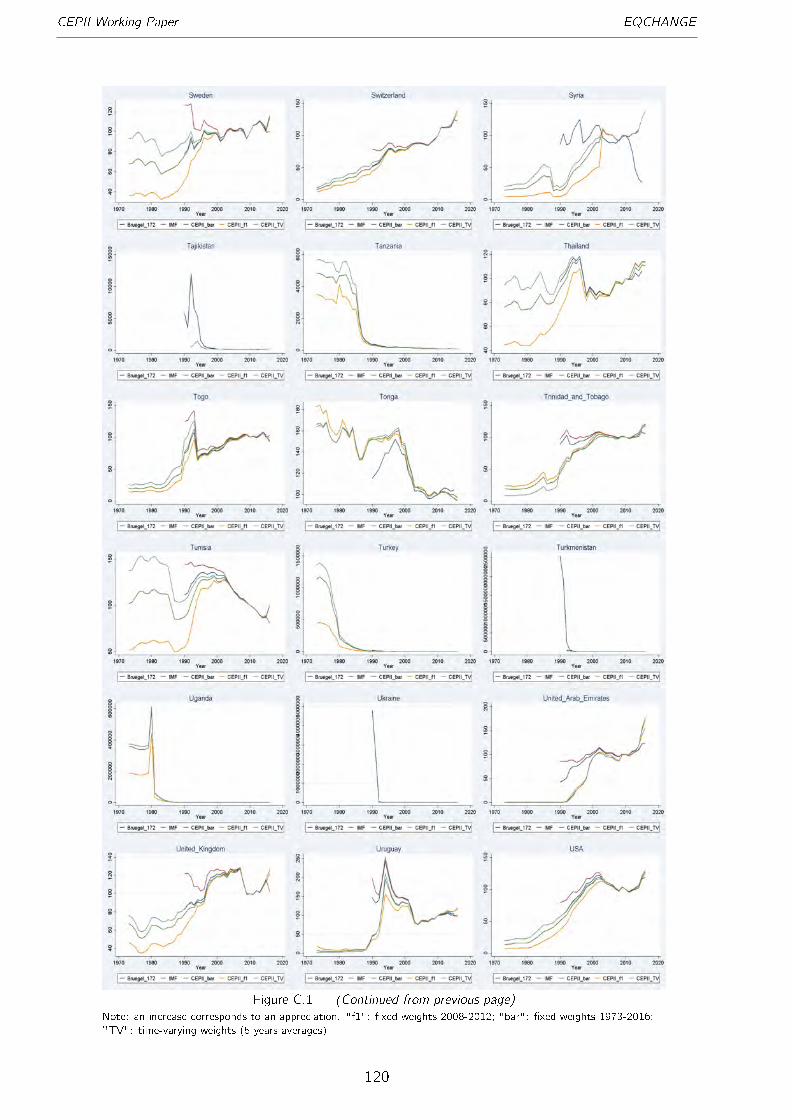
CEPII Working Paper EQCHANGE
Figure C.1 � (Continued from previous page)
Note: an increase corresponds to an appreciation. "f1": �xed weights 2008-2012; "bar": �xed weights 1973-2016;
"TV": time-varying weights (5 years averages)
120

CEPII Working Paper EQCHANGE
Figure C.1 � (Continued from previous page)
Note: an increase corresponds to an appreciation. "f1": �xed weights 2008-2012; "bar": �xed weights 1973-2016;
"TV": time-varying weights (5 years averages)
121

CEPII Working Paper EQCHANGE
Figure C.2 � Real e�ective exchange rates (2010=100)
Note: an increase corresponds to an appreciation. "f1": �xed weights 2008-2012; "bar": �xed weights 1973-2016;
"TV": time-varying weights (5 years averages)
122

CEPII Working Paper EQCHANGE
Figure C.2 � (Continued from previous page)
Note: an increase corresponds to an appreciation. "f1": �xed weights 2008-2012; "bar": �xed weights 1973-2016;
"TV": time-varying weights (5 years averages)
123
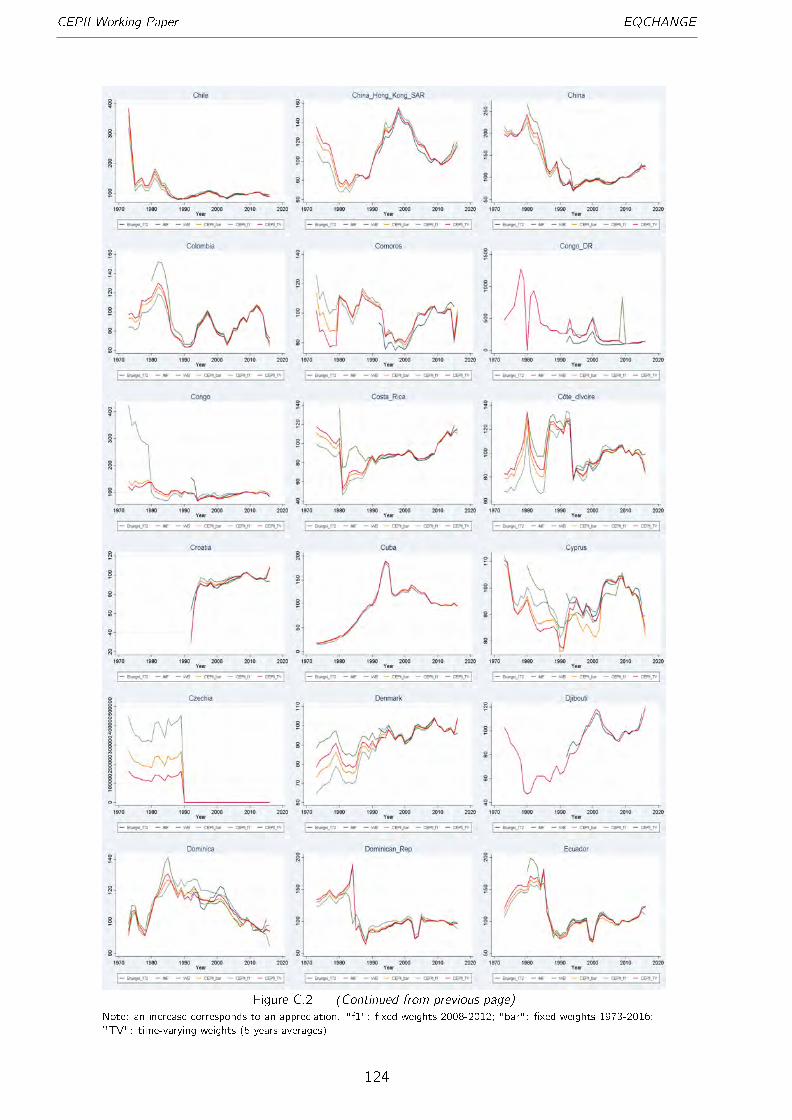
CEPII Working Paper EQCHANGE
Figure C.2 � (Continued from previous page)
Note: an increase corresponds to an appreciation. "f1": �xed weights 2008-2012; "bar": �xed weights 1973-2016;
"TV": time-varying weights (5 years averages)
124
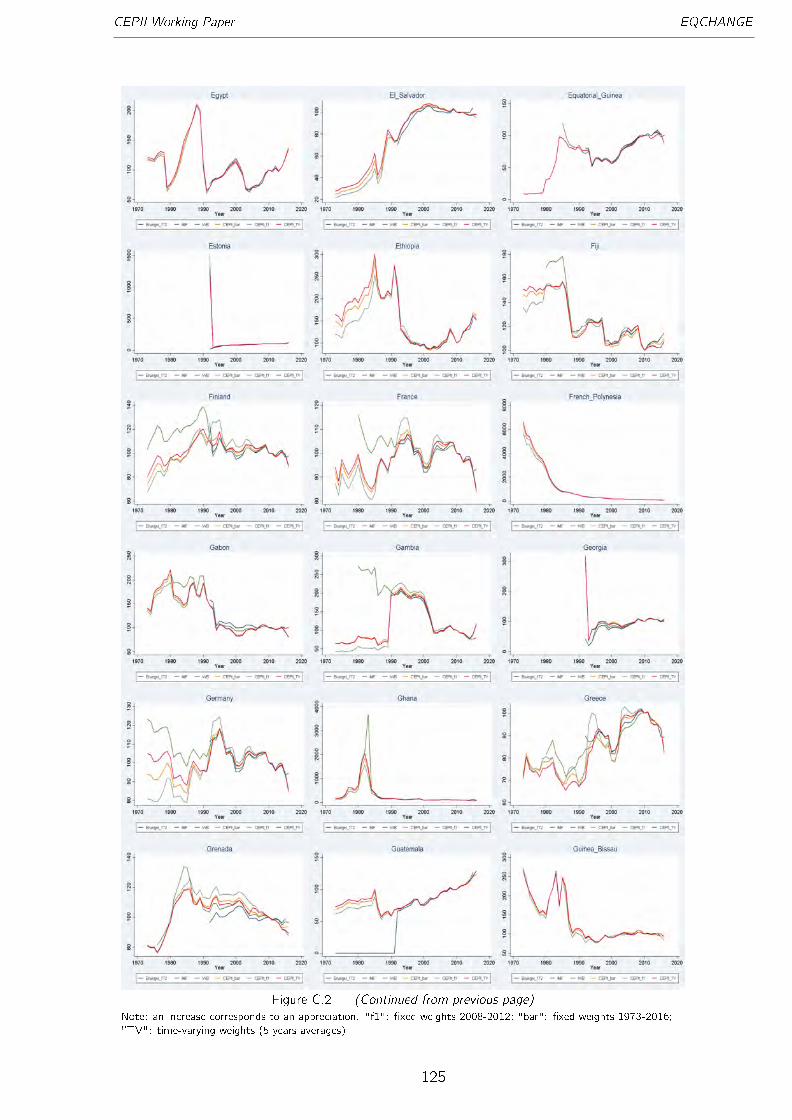
CEPII Working Paper EQCHANGE
Figure C.2 � (Continued from previous page)
Note: an increase corresponds to an appreciation. "f1": �xed weights 2008-2012; "bar": �xed weights 1973-2016;
"TV": time-varying weights (5 years averages)
125

CEPII Working Paper EQCHANGE
Figure C.2 � (Continued from previous page)
Note: an increase corresponds to an appreciation. "f1": �xed weights 2008-2012; "bar": �xed weights 1973-2016;
"TV": time-varying weights (5 years averages)
126
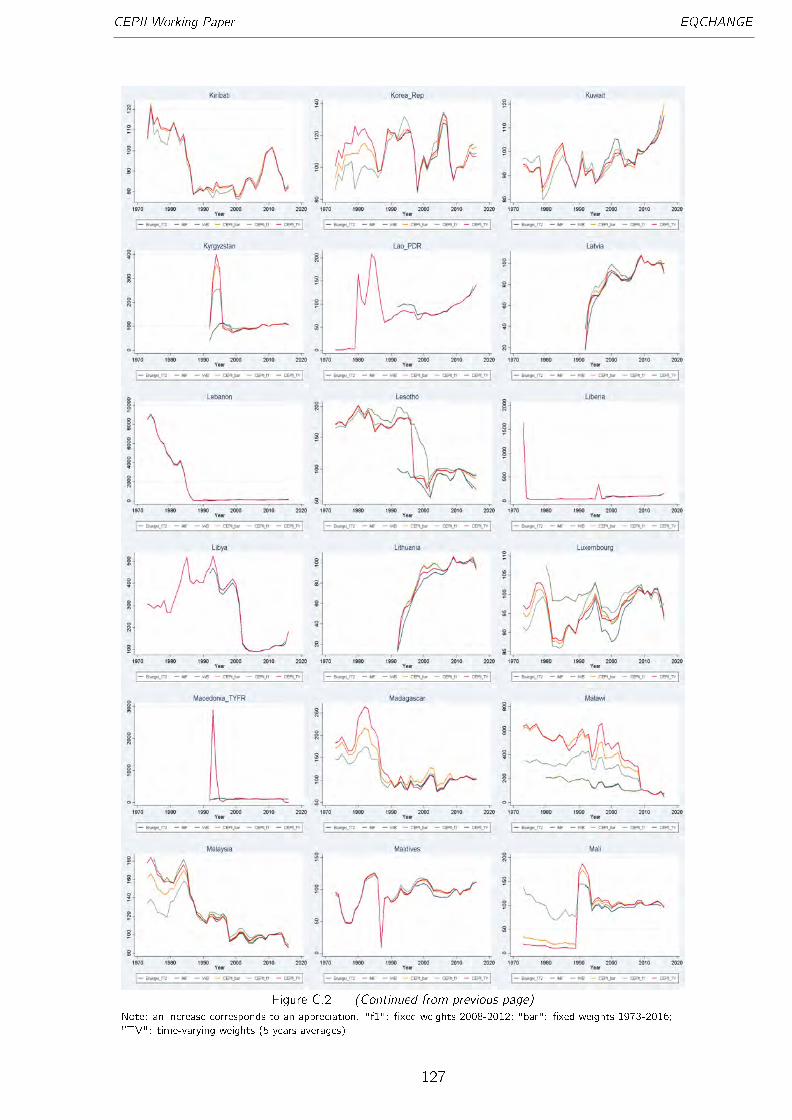
CEPII Working Paper EQCHANGE
Figure C.2 � (Continued from previous page)
Note: an increase corresponds to an appreciation. "f1": �xed weights 2008-2012; "bar": �xed weights 1973-2016;
"TV": time-varying weights (5 years averages)
127

CEPII Working Paper EQCHANGE
Figure C.2 � (Continued from previous page)
Note: an increase corresponds to an appreciation. "f1": �xed weights 2008-2012; "bar": �xed weights 1973-2016;
"TV": time-varying weights (5 years averages)
128

CEPII Working Paper EQCHANGE
Figure C.2 � (Continued from previous page)
Note: an increase corresponds to an appreciation. "f1": �xed weights 2008-2012; "bar": �xed weights 1973-2016;
"TV": time-varying weights (5 years averages)
129

CEPII Working Paper EQCHANGE
Figure C.2 � (Continued from previous page)
Note: an increase corresponds to an appreciation. "f1": �xed weights 2008-2012; "bar": �xed weights 1973-2016;
"TV": time-varying weights (5 years averages)
130
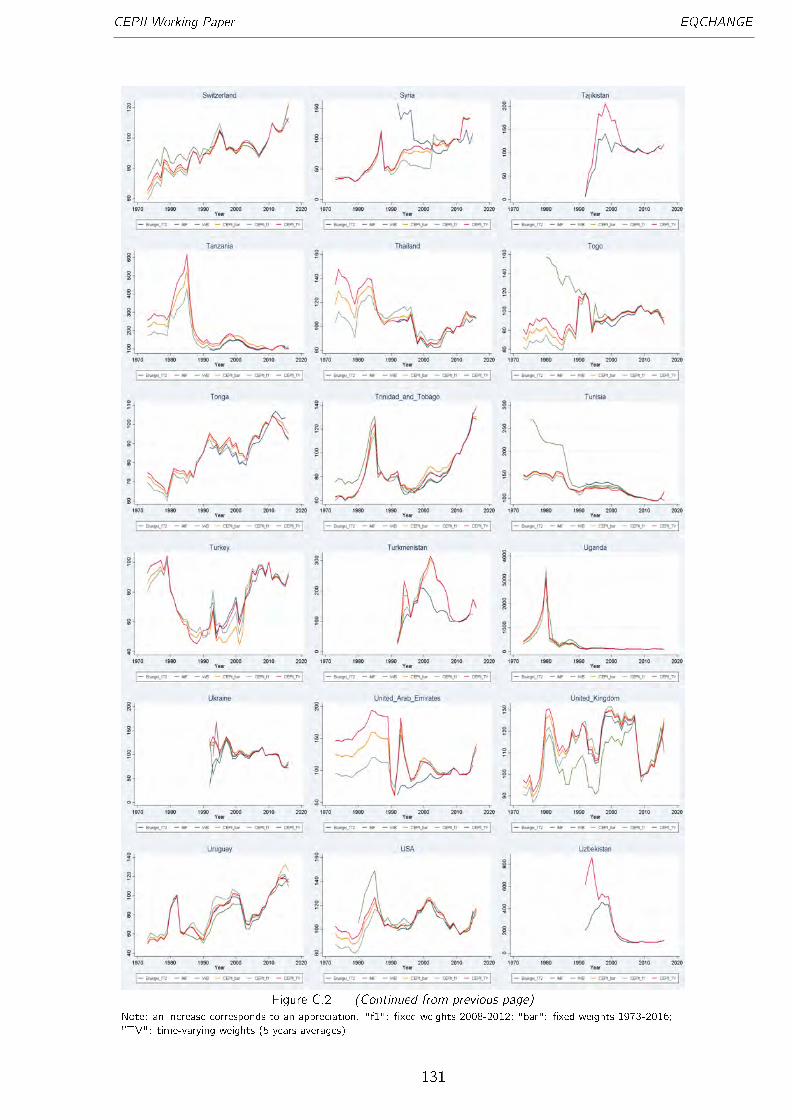
CEPII Working Paper EQCHANGE
Figure C.2 � (Continued from previous page)
Note: an increase corresponds to an appreciation. "f1": �xed weights 2008-2012; "bar": �xed weights 1973-2016;
"TV": time-varying weights (5 years averages)
131

CEPII Working Paper EQCHANGE
Figure C.2 � (Continued from previous page)
Note: an increase corresponds to an appreciation. "f1": �xed weights 2008-2012; "bar": �xed weights 1973-2016;
"TV": time-varying weights (5 years averages)
132

CEPII Working Paper EQCHANGE
Figure C.3 � Exchange rate misalignments (%)Note: a positive (resp. negative) currency misalignment corresponds to an overvaluation (resp. undervaluation).
Each of the series represents the average over all the di�erent estimated models by weighting systems ("f1" and
"bar" are �xed weights based on the 2008-2012 and 1973-2016 periods, respectively; "TV" indicates time-varying
weights (5-years window). The dashed lines indicate the 95% con�dence interval of the average currency misalign-
ment, regardless of the weighting scheme.
133

CEPII Working Paper EQCHANGE
Figure C.3 � (Continued from previous page)Note: a positive (resp. negative) currency misalignment corresponds to an overvaluation (resp. undervaluation).
Each of the series represents the average over all the di�erent estimated models by weighting systems ("f1" and
"bar" are �xed weights based on the 2008-2012 and 1973-2016 periods, respectively; "TV" indicates time-varying
weights (5-years window). The dashed lines indicate the 95% con�dence interval of the average currency misalign-
ment, regardless of the weighting scheme.
134

CEPII Working Paper EQCHANGE
Figure C.3 � (Continued from previous page)Note: a positive (resp. negative) currency misalignment corresponds to an overvaluation (resp. undervaluation).
Each of the series represents the average over all the di�erent estimated models by weighting systems ("f1" and
"bar" are �xed weights based on the 2008-2012 and 1973-2016 periods, respectively; "TV" indicates time-varying
weights (5-years window). The dashed lines indicate the 95% con�dence interval of the average currency misalign-
ment, regardless of the weighting scheme.
135

CEPII Working Paper EQCHANGE
Figure C.3 � (Continued from previous page)Note: a positive (resp. negative) currency misalignment corresponds to an overvaluation (resp. undervaluation).
Each of the series represents the average over all the di�erent estimated models by weighting systems ("f1" and
"bar" are �xed weights based on the 2008-2012 and 1973-2016 periods, respectively; "TV" indicates time-varying
weights (5-years window). The dashed lines indicate the 95% con�dence interval of the average currency misalign-
ment, regardless of the weighting scheme.
136

CEPII Working Paper EQCHANGE
Figure C.3 � (Continued from previous page)Note: a positive (resp. negative) currency misalignment corresponds to an overvaluation (resp. undervaluation).
Each of the series represents the average over all the di�erent estimated models by weighting systems ("f1" and
"bar" are �xed weights based on the 2008-2012 and 1973-2016 periods, respectively; "TV" indicates time-varying
weights (5-years window). The dashed lines indicate the 95% con�dence interval of the average currency misalign-
ment, regardless of the weighting scheme.
137
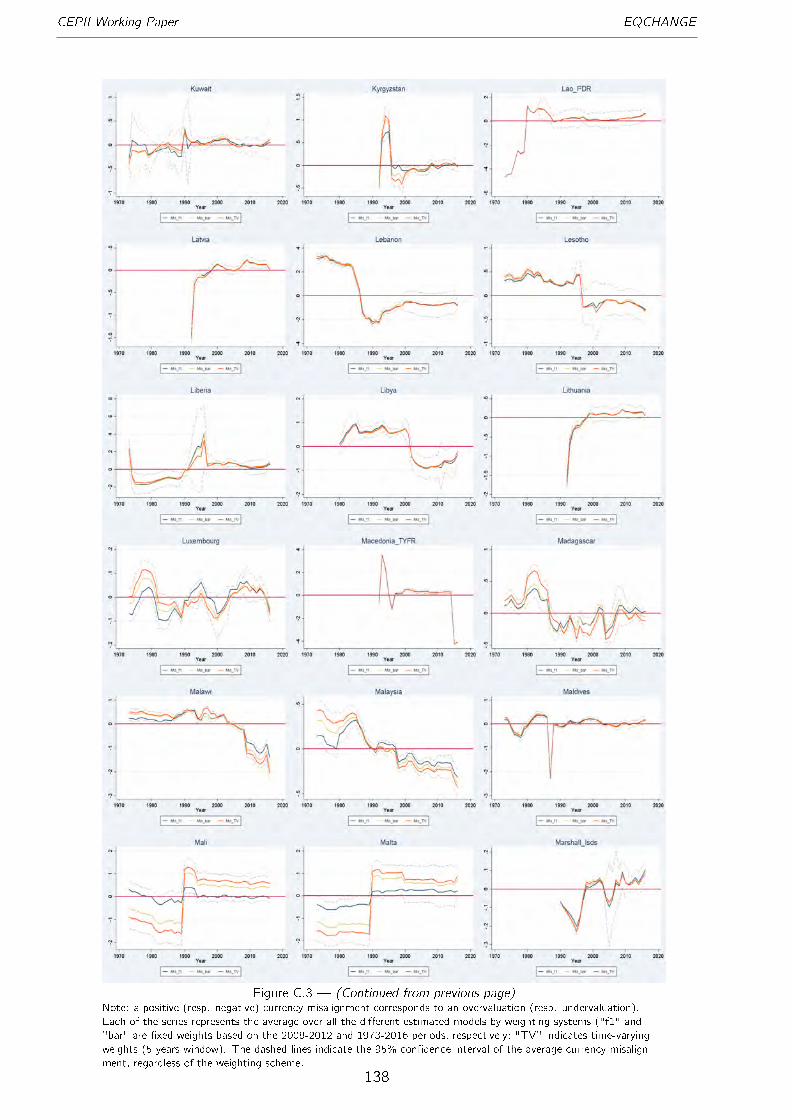
CEPII Working Paper EQCHANGE
Figure C.3 � (Continued from previous page)Note: a positive (resp. negative) currency misalignment corresponds to an overvaluation (resp. undervaluation).
Each of the series represents the average over all the di�erent estimated models by weighting systems ("f1" and
"bar" are �xed weights based on the 2008-2012 and 1973-2016 periods, respectively; "TV" indicates time-varying
weights (5-years window). The dashed lines indicate the 95% con�dence interval of the average currency misalign-
ment, regardless of the weighting scheme.
138

CEPII Working Paper EQCHANGE
Figure C.3 � (Continued from previous page)Note: a positive (resp. negative) currency misalignment corresponds to an overvaluation (resp. undervaluation).
Each of the series represents the average over all the di�erent estimated models by weighting systems ("f1" and
"bar" are �xed weights based on the 2008-2012 and 1973-2016 periods, respectively; "TV" indicates time-varying
weights (5-years window). The dashed lines indicate the 95% con�dence interval of the average currency misalign-
ment, regardless of the weighting scheme.
139

CEPII Working Paper EQCHANGE
Figure C.3 � (Continued from previous page)Note: a positive (resp. negative) currency misalignment corresponds to an overvaluation (resp. undervaluation).
Each of the series represents the average over all the di�erent estimated models by weighting systems ("f1" and
"bar" are �xed weights based on the 2008-2012 and 1973-2016 periods, respectively; "TV" indicates time-varying
weights (5-years window). The dashed lines indicate the 95% con�dence interval of the average currency misalign-
ment, regardless of the weighting scheme.
140

CEPII Working Paper EQCHANGE
Figure C.3 � (Continued from previous page)Note: a positive (resp. negative) currency misalignment corresponds to an overvaluation (resp. undervaluation).
Each of the series represents the average over all the di�erent estimated models by weighting systems ("f1" and
"bar" are �xed weights based on the 2008-2012 and 1973-2016 periods, respectively; "TV" indicates time-varying
weights (5-years window). The dashed lines indicate the 95% con�dence interval of the average currency misalign-
ment, regardless of the weighting scheme.
141
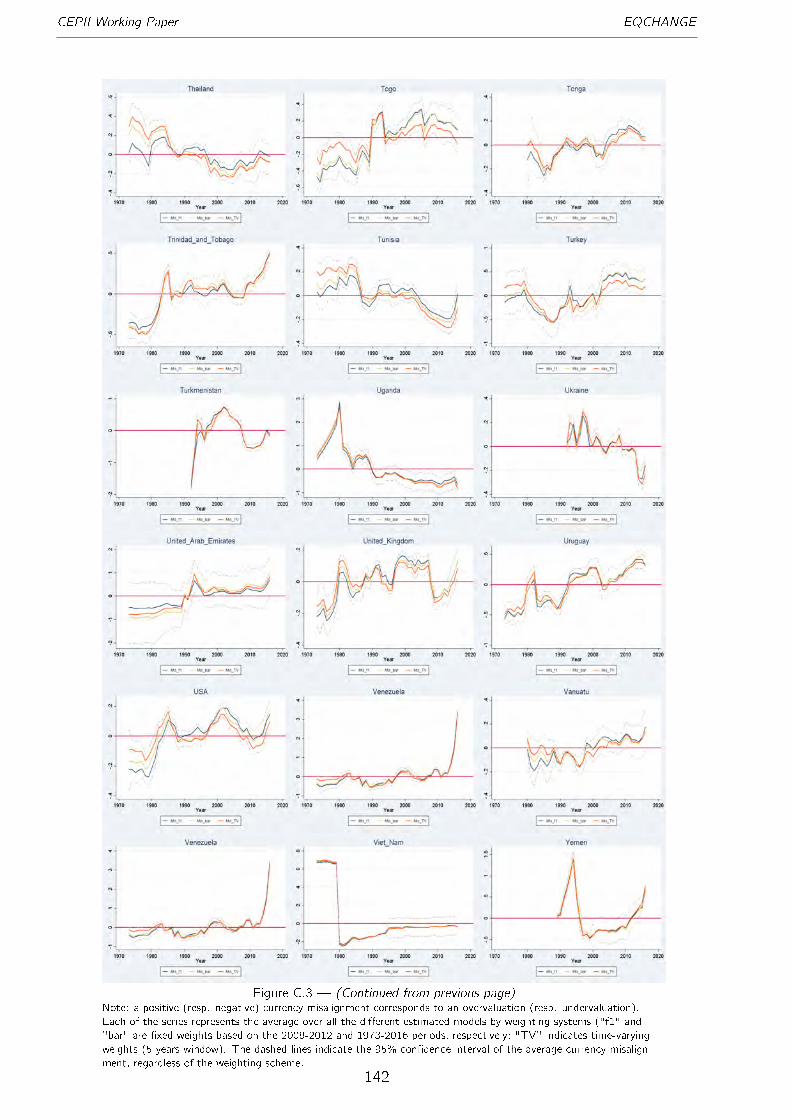
CEPII Working Paper EQCHANGE
Figure C.3 � (Continued from previous page)Note: a positive (resp. negative) currency misalignment corresponds to an overvaluation (resp. undervaluation).
Each of the series represents the average over all the di�erent estimated models by weighting systems ("f1" and
"bar" are �xed weights based on the 2008-2012 and 1973-2016 periods, respectively; "TV" indicates time-varying
weights (5-years window). The dashed lines indicate the 95% con�dence interval of the average currency misalign-
ment, regardless of the weighting scheme.
142
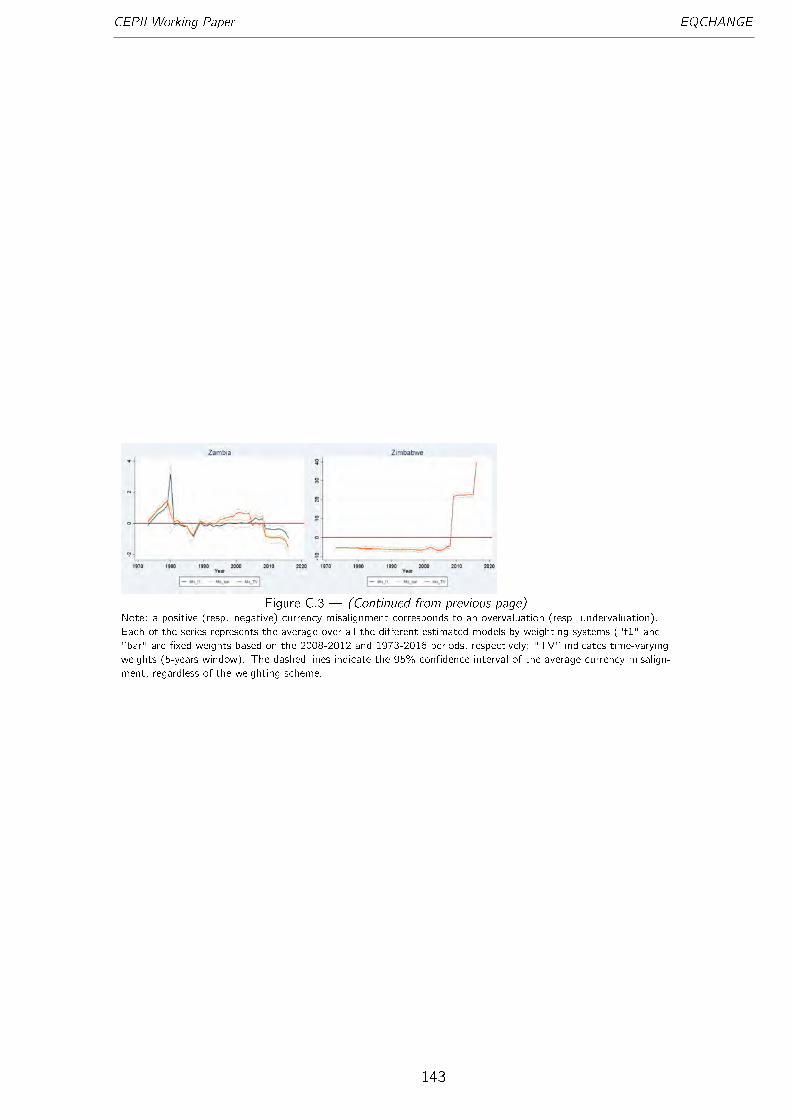
CEPII Working Paper EQCHANGE
Figure C.3 � (Continued from previous page)Note: a positive (resp. negative) currency misalignment corresponds to an overvaluation (resp. undervaluation).
Each of the series represents the average over all the di�erent estimated models by weighting systems ("f1" and
"bar" are �xed weights based on the 2008-2012 and 1973-2016 periods, respectively; "TV" indicates time-varying
weights (5-years window). The dashed lines indicate the 95% con�dence interval of the average currency misalign-
ment, regardless of the weighting scheme.
143