epa 5
28
A-3 The DRI/EAF Integrated steel-making route requires less energy and produces lower emissions than traditional Integrated iron and steelmaking (i.e., coke battery, blast furnace, BOF). A DOE (2008) report claims the following reduction in emissions relative to traditional steelmaking: Pollutant Percent Reduction CO 96 Volatile organic compounds 87 Sulfur dioxide 78 NO x 65 Mercury 58 CO 2 41 Nucor’s DRI Iron and Steel Production Facility Nucor Corporation began construction of an iron and steel complex in St. James Parish, LA in early 2011. The Nucor facility will include a pig iron operation utilizing a DRI furnace. The entire complex will consist of the DRI furnace along with a pellet operation, blast furnace, coke ovens, and a steel mill. The entire complex represents a $3.4 billion investment, according to Nucor. (BNA, 2011) Upon start-up, this facility will be the first DRI facility in the U.S. Many DRI furnaces exist in various parts of the world, but especially the middle east, because of the abundant supply of natural gas that can be used to operate this type of process. A DRI is particularly suitable for developing countries where the amount of coking coal is limited. The PSD permit for this facility was the first to go through the BACT review process for GHG in the U.S. (in 1 st quarter 2011). EAF Steelmaking at an Integrated Plant A facility owned by Wheeling-Pittsburgh Steel installed a state-of-the art EAF in December 2004 to replace its BOF for steelmaking. This was the first application of an EAF at an Integrated steel mill to convert molten iron from the blast furnace into steel. The EAF is continuously charged with molten iron and scrap (BOF and most EAF are batch processes), can use up to 100 percent scrap, recovers heat from the EAF exhaust to preheat the scrap, and produces 330 tons/hr (300 tonnes/hr) of steel. After the EAF was installed, one of the two blast furnaces was shut down. The company claimed there were significant cost and environmental benefits from the conversion. (Tenova, 2010) The facility is now owned by RG Steel, Inc. Other Innovative Technologies Endless Strip Production. This process is a new development in thin slab casting and direct rolling. Installation of this technology was started in 2008 at a plant in Cremona, Italy. The specific energy consumption should be 40 percent lower than that needed for a traditional rolling mill. For thin gauges, the suppression of the cold rolling and annealing cycle will allow energy savings of 60 percent with regard to the traditional cycle. Processing costs are characterized by lower energy consumption, lower costs for consumables (e.g., mould, rolling cylinders) and improved liquid steel yield (up to 98 percent). (Worrell, 1999) Carbon-free fuel. Traditionally, carbon from fossil fuels is used in the steel industry to provide the chemical function of reducing oxide ores. This function could also be performed hydrogen or carbon-free electricity, since hydrogen reduction of iron ore has steam as a gas product instead of CO 2, or wood. Limitations of this approach are not technical, since the technologies in the area of pre-reduction are very mature; but are related to
-
Upload
janfarsa9623 -
Category
Documents
-
view
10 -
download
3
description
energy information
Transcript of epa 5

A-3
The DRI/EAF Integrated steel-making route requires less energy and produces lower emissions than traditional Integrated iron and steelmaking (i.e., coke battery, blast furnace, BOF). A DOE (2008) report claims the following reduction in emissions relative to traditional steelmaking:
Pollutant Percent Reduction CO 96 Volatile organic compounds 87 Sulfur dioxide 78 NOx 65 Mercury 58 CO2 41
Nucor’s DRI Iron and Steel Production Facility
Nucor Corporation began construction of an iron and steel complex in St. James Parish, LA in early 2011. The Nucor facility will include a pig iron operation utilizing a DRI furnace. The entire complex will consist of the DRI furnace along with a pellet operation, blast furnace, coke ovens, and a steel mill. The entire complex represents a $3.4 billion investment, according to Nucor. (BNA, 2011) Upon start-up, this facility will be the first DRI facility in the U.S. Many DRI furnaces exist in various parts of the world, but especially the middle east, because of the abundant supply of natural gas that can be used to operate this type of process. A DRI is particularly suitable for developing countries where the amount of coking coal is limited. The PSD permit for this facility was the first to go through the BACT review process for GHG in the U.S. (in 1st quarter 2011).
EAF Steelmaking at an Integrated Plant
A facility owned by Wheeling-Pittsburgh Steel installed a state-of-the art EAF in December 2004 to replace its BOF for steelmaking. This was the first application of an EAF at an Integrated steel mill to convert molten iron from the blast furnace into steel. The EAF is continuously charged with molten iron and scrap (BOF and most EAF are batch processes), can use up to 100 percent scrap, recovers heat from the EAF exhaust to preheat the scrap, and produces 330 tons/hr (300 tonnes/hr) of steel. After the EAF was installed, one of the two blast furnaces was shut down. The company claimed there were significant cost and environmental benefits from the conversion. (Tenova, 2010) The facility is now owned by RG Steel, Inc.
Other Innovative Technologies
Endless Strip Production. This process is a new development in thin slab casting and direct rolling. Installation of this technology was started in 2008 at a plant in Cremona, Italy. The specific energy consumption should be 40 percent lower than that needed for a traditional rolling mill. For thin gauges, the suppression of the cold rolling and annealing cycle will allow energy savings of 60 percent with regard to the traditional cycle. Processing costs are characterized by lower energy consumption, lower costs for consumables (e.g., mould, rolling cylinders) and improved liquid steel yield (up to 98 percent). (Worrell, 1999) Carbon-free fuel. Traditionally, carbon from fossil fuels is used in the steel industry to provide the chemical function of reducing oxide ores. This function could also be performed hydrogen or carbon-free electricity, since hydrogen reduction of iron ore has steam as a gas product instead of CO2, or wood. Limitations of this approach are not technical, since the technologies in the area of pre-reduction are very mature; but are related to
A-4
the political issue of resource depletion in the longer term. Research projects are underway, some in other countries along with U.S.
• Use of hydrogen-bearing materials in blast furnaces such as steam, natural gas and waste plastics to substitute coke and coal.
• Hydrogen produced from natural gas or by electrolysis of seawater.
• Use of wood to make iron in a charcoal blast furnace (used in Brazil).
• Hydrogen Flash Smelting (currently being investigated in U.S. by AISI, DOE, and University of Utah)
A.3 Energy Improvement Technologies from U.S. Department of Energy (DOE) and DOE Partnerships The following are research and development projects performed by DOE. The first set of projects are currently underway to improve the energy efficiency, environmental performance, and productivity of the steel industry and include emerging technologies which are defined as technologies that are likely to be commercially available in the next 2 years. (DOE, 2009a) Also in this section are DOE energy efficiency success stories and also a description of completed DOE energy projects. Emerging Technology - Advanced Process Development
� Minimization of Blast Furnace Fuel Rate by Optimizing Burden and Gas Distributions
– Partners: Purdue University Calumet, AISI, Mittal Steel, Dofasco, and Severstal.
– Summary: A computational fluid dynamics (CFD) model will help to optimize and burden distributions that can minimize fuel rate, thereby maximizing blast furnace energy efficiency and minimizing emissions.
– Benefits: Increase pulverized coal injection rate and fuel efficiency, reduces carbon emissions, and optimizes blast furnace efficiency.
– Status (August 2007): The project team has conducted an initial market study and developed a marketing plan. There are 28 blast furnaces currently operating in the U.S., of which, 13 are operated by this project’s industrial partners. The newly developed CFD technology will be implemented in each industrial partner’s blast furnace during the project period. Within 5 years of successful project completion, the remaining blast furnaces in the U.S. will be targeted for implementation. A final marketing and technology transfer plan will be developed as part of the final deliverables of this project.
� Research, Development, and Field Testing of Thermochemical Recuperation for High-
Temperature Furnaces – Status: The contract ($4.5 million) was awarded in September 2008. AISI is leading a team with
the Gas Technology Institute, Thermal Transfer Corporation, U.S. Steel, ArcelorMittal, Republic Engineered Products, the Steel Manufacturing Association, and the Ohio Department of Development to develop and test thermochemical recuperation for steel reheating furnaces to increase waste heat recovery that reduces energy consumption and costs. A thermochemical recuperator uses the partial-oxidation-of-fuel principle to recover energy from flue gases of heating processes.
A-5
Emerging Technology - Cokeless Ironmaking
� Next Generation Metallic Iron Nodule Technology in Electric Furnace Steelmaking – Partners: University of Minnesota-Duluth and Nu-Iron Technologies, LLC. – Benefits: Metallic iron nodule technology produces a high -quality scrap substitute, reduces
production costs, increases steel quality produced by EAF, and enables more effective use of sub-bituminous coal. Successful development of this new ironmaking process will produce potentially lower cost steel scrap substitutes. In addition, greater availability of high-quality iron nodules will increase the quality of steel and the competitiveness of mini-mills and other steel producers.
– Status (September 2007): Phase 1 is complete. The testing phase will involve quantifying overall energy use characteristics, types of material that can be processed, fuels needed for successful operation, and the overall economics predicted for full-scale implementation. Upon successful demonstration, the project team will begin plans to transition the technology for industrial use. Iron nodule technology could potentially use up to 30 percent less energy than utilizing rotary hearth furnace technology.
� Paired Straight Hearth Furnace
- Status: The Phase 1 report (feasibility study) was completed in February 2006. The Bricmont, Inc., report and the McMaster University analysis concluded that it is feasible with current technology and construction practices to design, build, and operate a demonstration plant of the PSH furnace with a capacity of 46,000 ton per year (42,000 tonne per year) of DRI for an estimated cost of $16,729,000. A DOE contract ($1.5 million) was awarded in September 2008. AISI, in partnership with McMaster University, U.S. Steel, Bricmont, and Harper International, will work to optimize the PSH furnace technology and establish its scalability potential from the bench-scale stage. The PSH furnace is an alternative to the energy and carbon-intensive blast furnace commonly used to make steel. The technology has a lower coal rate in comparison with other alternative ironmaking processes because of thermodynamic and kinetic advantages.
Emerging Technology - Next Generation Steelmaking
� Development of Next Generation Heating System for Scale-Free Steel Reheating, Phase 2 – Partners: E3M, Inc.; ACL-NWO, Inc.; Bloom Engineering Corp.; Steel Dynamics, Inc.; Air
Products & Chemical; the Steel Manufacturers Association; and the Forging Industry Association.
– Benefits: Scale-free reheating improves productivity by reducing downtime and labor to collect and remove scale. Scale-free reheating increases energy and cost efficiency of steel reheating, and reduces the amount of energy needed to replenish steel lost as oxides. By reducing the amount of steel lost to scale formation, this system improves the surface quality of the steel.
– Status (September 2007): Completed Phase 1, which included three activities: (1) conducting a literature search and analyzed the options needed to create a process atmosphere required for scale-free reheating, (2) defining furnace operating parameters required to generate scale-free heating process atmosphere, and (3) conducting economic and technical analyses. Phase 2 will include conducting pilot-scale furnace heating tests on scale-free heating, defining heating system conditions, designing and validating a scale-free heating system for typical applications, and conducting energy, economic, and environmental analyses and modeling. During the commercialization phase, the scale-free heating burner will be tested for functionality in furnaces used for both conventional heating and scale-free heating.
A-6
DOE Success Stories (DOE, 2009d)
Collaborative R&D projects under the auspices of the Steel Industry of the Future have produced energy, environmental, and economical benefits for the industry and the nation. The following list contains examples of projects that have been commercially successful and demonstrated full-scale or completed industrial trials:
� Enhanced Spheroidized Annealing � Mesabi Nugget Ironmaking Technology for the Future: High Quality Iron Nuggets Using a Rotary
Hearth Furnace � Dilute Oxygen Combustion � Hot-Blast Stove Process Model � Microstructure Engineering in Hot Strip Mills � Nickel Aluminide Transfer Rolls � NOx Emission Reduction by Oscillating Combustion
Development of a Process to Continuously Melt, Refine, and Cast High-Quality Steel.
Completed DOE Research and Development Projects (DOE, 2009c)
The following projects were recently completed. In some cases, the R&D produced a new technology that is now emerging in the marketplace. In other cases, the R&D results will help to guide future development of energy-efficient technologies and processes for the steel industry.
� Advanced Control in Blast Furnace � Aluminum Bronze Alloys to Improve the System Life of Basic Oxygen and EAF Hoods, Roofs, and
Side Vents � Appropriate Resistance Spot Welding Practice for Advanced High-Strength Steels � Automated Steel Cleanliness Analysis Tool � CFD Modeling for High-Rate Pulverized Coal Injection in the Blast Furnace � Characterization of Fatigue and Crash Performance of a New Generation of High Strength Steel � Clean Steels: Advancing the State of the Art � Cold Work Embrittlement of Interstitial-Free Steels � Constitutive Behavior of High-Strength Multiphase Sheet Steels Under High-Strain Rate Deformation
Conditions � Controlled Thermal-Mechanical Processing of Tubes and Pipes � Dephosphorization When Using DRI or Hot Briquetted Iron � Development and Application of Steel Foam and Structures � Development of a Process to Continuously Melt, Refine, and Cast High-Quality Steel � Development of Next Generation Heating System for Scale-Free Steel Reheating, Phase 1 � Development of Oxygen-Enriched Furnace � Elimination or Minimization of Oscillation Marks—A Path to Improved Cast Surface Quality � Enhanced Inclusion Removal from Steel in the Tundish � Enrichment of By-Product Materials from Steel Pickling Acid Regeneration Plants � Feasibility Study for Recycling Use Automotive Oil Filters in a Blast Furnace (Final Report) � Formability Characterization of a New Generation of High-Strength Steels � Future Steelmaking Processes (December 2003) � Geological Sequestration of Carbon Dioxide (CO2) by Hydrous Carbonate Formation with Reclaimed
Slag
A-7
� Hydrogen and Nitrogen Control in Ladle and Casting Operations � Improved Criteria for Acceptable Yield Point Elongation of Surface Critical Steels � Inclusion Optimization for Next-Generation Steel Products � In Situ, Real-Time Measurement of Melt Constituents � Integrating Steel Production with Mineral Sequestration � Intelligent Inductive Processing � Large-Scale Evaluation of Nickel Aluminide Rolls in a Heat-Treat Furnace � Laser Contouring System � Life Improvement of Pot Hardware � Magnetic Gate System for Molten Metal Flow Control � The Mesabi Nugget Research Project New Ironmaking Technology of the Future: High-Quality Iron
Nuggets Using a Rotary Hearth Furnace � Minimizing NOx Emissions from By-Product Fuels in Steelmaking � New Process for Hot-Metal Production at Low Fuel Rate—Phase 1 Feasibility Study � New Ultra-Low–Carbon Steels with Improved Bake Hard Oak Ridge National Laboratory � Novel Low-NOx Burners for Boilers in the Steel Industry � Optical Sensor for Post-Combustion Control in EAF Steelmaking � Optimization of Post-combustion � Plant Line Trial Evaluation of Viable Non-Chromium Passivation Systems for Electrolytic Tinplate � Properties of Galvanized and Galvannealed Advanced High-Strength Hot-Rolled Steels � Pulverized Coal Injection � Quantifying the Thermal Behavior of Slags � Real-Time Melt Temperature Measurement in a Vacuum Degasser Using Optical Optometry � Recycling of Waste Oxides � Removal of Residual Elements in the Steel Ladle � Standard Methodology for the Quantitative Measurement of Steel Phase Transformation Kinetics � Strip Casting: Anticipating New Routes to Steel Sheet � Study of Deformation Behavior of Lightweight Steel Structures � Submerged Entry Nozzles that Resist Clogging � Suspension Hydrogen Reduction of Iron Oxide Concentrate � Sustainable Steelmaking Using Biomass and Waste Oxides � Technical Feasibility Study of Steelmaking by Molten Oxide Electrolysis � Temperature Measurement of Galvanneal Steel � Validation of the Hot Strip Mill Model � Verification of Steelmaking Slag Iron Content
B- 1
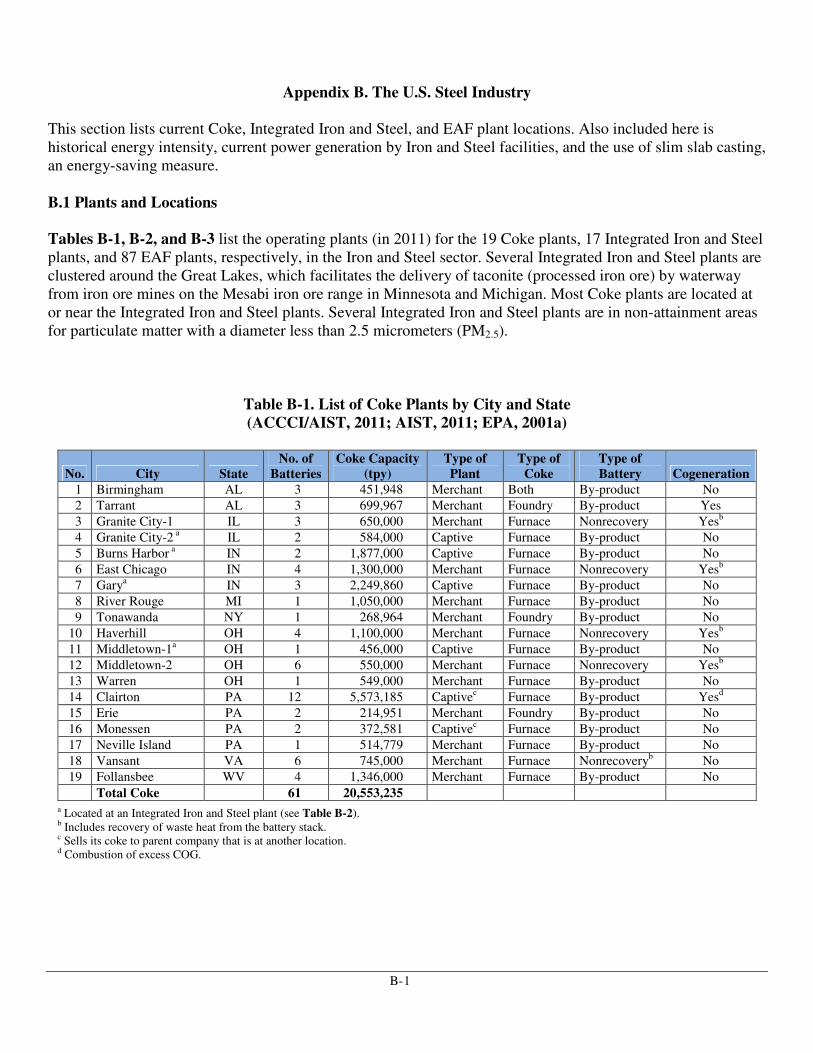
Appendix B. The U.S. Steel Industry This section lists current Coke, Integrated Iron and Steel, and EAF plant locations. Also included here is historical energy intensity, current power generation by Iron and Steel facilities, and the use of slim slab casting, an energy-saving measure. B.1 Plants and Locations Tables B-1, B-2, and B-3 list the operating plants (in 2011) for the 19 Coke plants, 17 Integrated Iron and Steel plants, and 87 EAF plants, respectively, in the Iron and Steel sector. Several Integrated Iron and Steel plants are clustered around the Great Lakes, which facilitates the delivery of taconite (processed iron ore) by waterway from iron ore mines on the Mesabi iron ore range in Minnesota and Michigan. Most Coke plants are located at or near the Integrated Iron and Steel plants. Several Integrated Iron and Steel plants are in non-attainment areas for particulate matter with a diameter less than 2.5 micrometers (PM2.5).
Table B-1. List of Coke Plants by City and State (ACCCI/AIST, 2011; AIST, 2011; EPA, 2001a)
No. City State No. of
Batteries Coke Capacity
(tpy) Type of Plant
Type of Coke
Type of Battery Cogeneration
1 Birmingham AL 3 451,948 Merchant Both By-product No
2 Tarrant AL 3 699,967 Merchant Foundry By-product Yes
3 Granite City-1 IL 3 650,000 Merchant Furnace Nonrecovery Yesb
4 Granite City-2 a IL 2 584,000 Captive Furnace By-product No
5 Burns Harbor a IN 2 1,877,000 Captive Furnace By-product No
6 East Chicago IN 4 1,300,000 Merchant Furnace Nonrecovery Yesb
7 Garya IN 3 2,249,860 Captive Furnace By-product No
8 River Rouge MI 1 1,050,000 Merchant Furnace By-product No
9 Tonawanda NY 1 268,964 Merchant Foundry By-product No
10 Haverhill OH 4 1,100,000 Merchant Furnace Nonrecovery Yesb
11 Middletown-1a OH 1 456,000 Captive Furnace By-product No
12 Middletown-2 OH 6 550,000 Merchant Furnace Nonrecovery Yesb
13 Warren OH 1 549,000 Merchant Furnace By-product No
14 Clairton PA 12 5,573,185 Captivec Furnace By-product Yesd
15 Erie PA 2 214,951 Merchant Foundry By-product No
16 Monessen PA 2 372,581 Captivec Furnace By-product No
17 Neville Island PA 1 514,779 Merchant Furnace By-product No
18 Vansant VA 6 745,000 Merchant Furnace Nonrecoveryb No
19 Follansbee WV 4 1,346,000 Merchant Furnace By-product No
Total Coke 61 20,553,235 a Located at an Integrated Iron and Steel plant (see Table B-2). b Includes recovery of waste heat from the battery stack. c Sells its coke to parent company that is at another location. d Combustion of excess COG.
B- 2
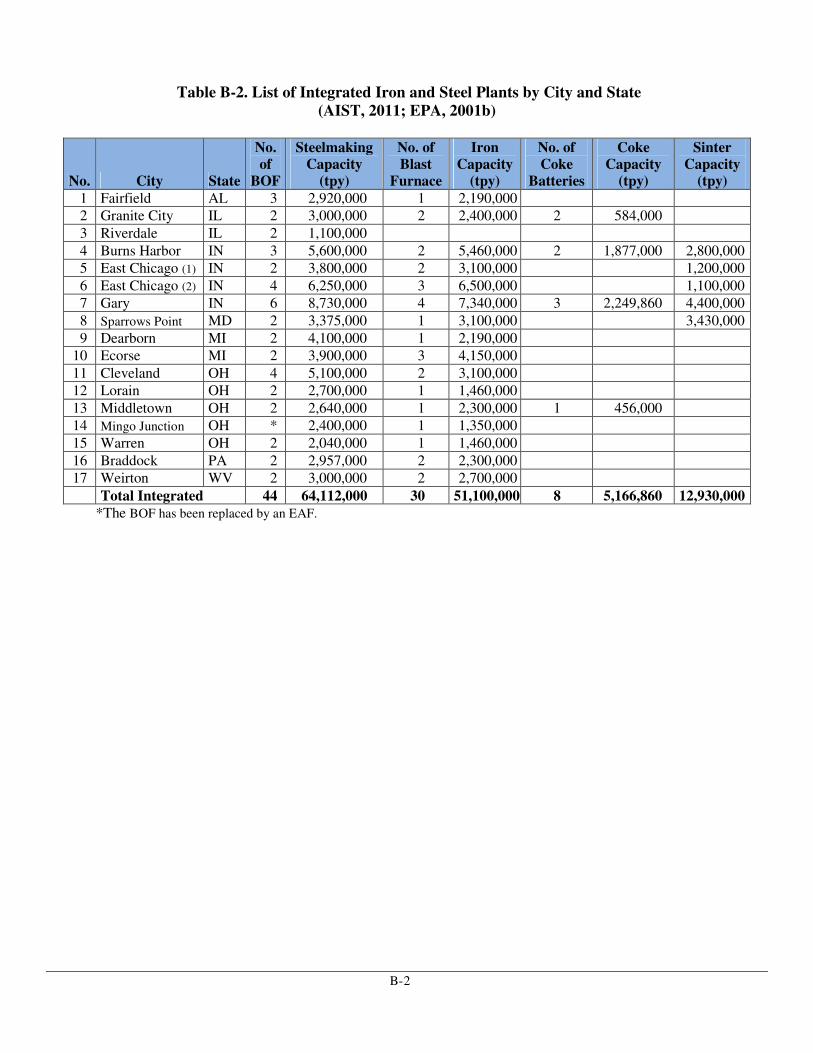
Table B-2. List of Integrated Iron and Steel Plants by City and State (AIST, 2011; EPA, 2001b)
No. City State
No. of
BOF
Steelmaking Capacity
(tpy)
No. of Blast
Furnace
Iron Capacity
(tpy)
No. of Coke
Batteries
Coke Capacity
(tpy)
Sinter Capacity
(tpy) 1 Fairfield AL 3 2,920,000 1 2,190,000
2 Granite City IL 2 3,000,000 2 2,400,000 2 584,000
3 Riverdale IL 2 1,100,000
4 Burns Harbor IN 3 5,600,000 2 5,460,000 2 1,877,000 2,800,000
5 East Chicago (1) IN 2 3,800,000 2 3,100,000 1,200,000
6 East Chicago (2) IN 4 6,250,000 3 6,500,000 1,100,000
7 Gary IN 6 8,730,000 4 7,340,000 3 2,249,860 4,400,000
8 Sparrows Point MD 2 3,375,000 1 3,100,000 3,430,000
9 Dearborn MI 2 4,100,000 1 2,190,000
10 Ecorse MI 2 3,900,000 3 4,150,000
11 Cleveland OH 4 5,100,000 2 3,100,000
12 Lorain OH 2 2,700,000 1 1,460,000
13 Middletown OH 2 2,640,000 1 2,300,000 1 456,000
14 Mingo Junction OH * 2,400,000 1 1,350,000
15 Warren OH 2 2,040,000 1 1,460,000
16 Braddock PA 2 2,957,000 2 2,300,000
17 Weirton WV 2 3,000,000 2 2,700,000
Total Integrated 44 64,112,000 30 51,100,000 8 5,166,860 12,930,000 *The BOF has been replaced by an EAF.

B- 3
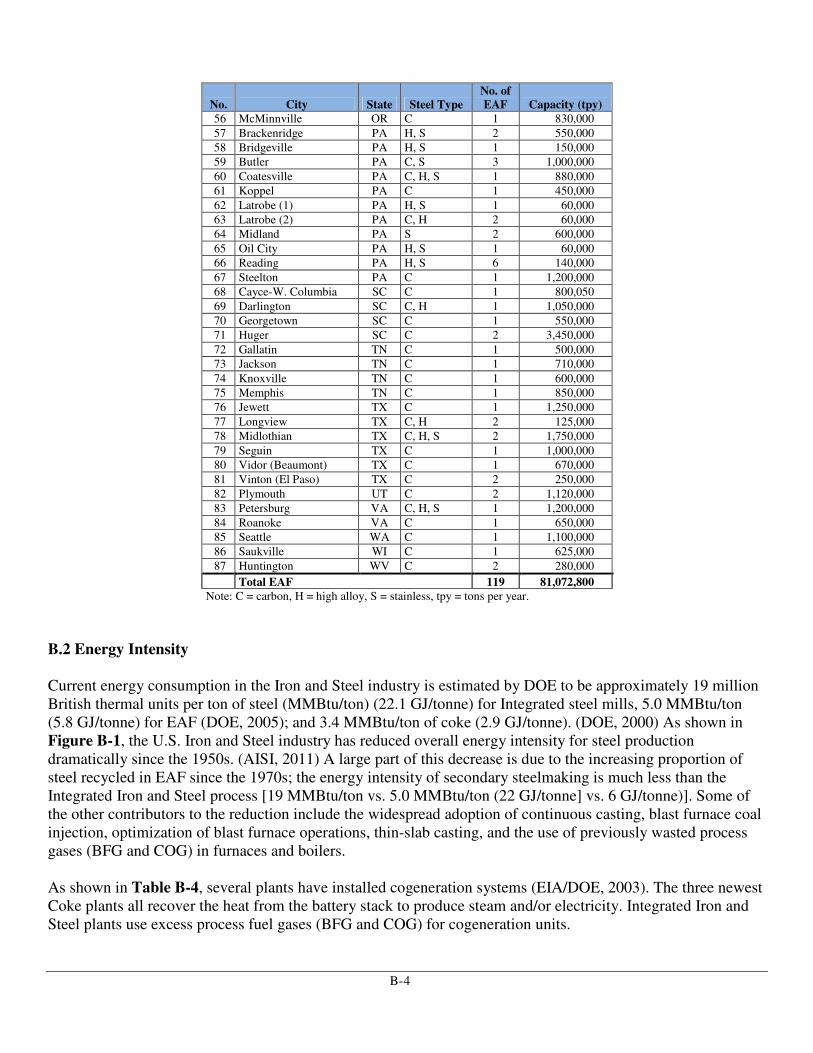
Table B-3. List of EAF Steel Plants by City and State (AIST, 2009)
No. City State Steel Type No. of EAF Capacity (tpy)
1 Axis AL C 1 1,250,000
2 Birmingham (1) AL C, S 1 800,000
3 Birmingham (2) AL C 1 600,000
4 Trinity AL C 2 2,400,000
5 Tuscaloosa AL C 1 1,300,000
6 Blytheville (1) AR C 2 3,000,000
7 Blytheville (2) AR C, H, S 2 2,750,000
8 Fort Smith AR C 2 500,000
9 Magnolia (Newport) AR C 1 300,000
10 Newport AR C 1 130,000
11 Mesa AZ C 1 280,000
12 Rancho Cucamonga CA C 1 750,000
13 Pueblo CO C 1 1,200,000
14 Claymont DE C 1 490,000
15 Baldwin FL C 1 1,100,000
16 Cartersville GA C 1 850,000
17 Muscatine IA C, H 1 1,250,000
18 Wilton IA C 1 450,000
19 Alton IL C 1 700,000
20 Bourbonnais IL C 1 850,000
21 Chicago IL C 2 90,000
22 Peoria IL C 1 999,800
23 Sterling IL C 1 1,100,000
24 Butler IN C 2 3,000,000
25 Columbia City IN C, H 2 2,000,000
26 Crawfordsville IN C, H 2 2,400,000
27 East Chicago IN C 1 500,000
28 Pittsboro IN C, H 1 720,000
29 Portage IN C 1 749,600
30 Ashland KY C 2 340,000
31 Ghent KY S 2 1,600,000
32 Warsaw KY C 2 1,600,000
33 LaPlace LA C 2 800,000
34 Jackson MI C 2 290,000
35 Monroe MI C 1 500,000
36 St. Paul MN C, H 1 600,000
37 Columbus MS C 1 1,700,000
38 Flowood MS C 1 550,000
39 Charlotte NC C 1 450,000
40 Cofield NC C 1 1,400,000
41 Norfolk NE C 1 1,100,000
42 Sayreville NJ C 1 750,000
43 Auburn NY C 1 630,000
44 Solvay NY H, S 1 50,000
45 Canton (1) OH C 1 1,650,000
46 Canton (2) OH H 1 889,600
47 Canton (3) OH H 2 1,000,000
48 Cleveland (Cuyahoga) OH C 1 700,000
49 Delta OH C 1 1,800,000
50 Mansfield OH S 2 952,650
51 Marion OH C 1 450,000
52 Steubenville (Mingo) OH C 1 2,400,000
53 Warren OH C 1 400,000
54 Youngstown OH C, H 1 650,300
55 Sand Springs OK C 2 600,000
(continued)
B- 4
No. City State Steel Type No. of EAF Capacity (tpy)
56 McMinnville OR C 1 830,000
57 Brackenridge PA H, S 2 550,000
58 Bridgeville PA H, S 1 150,000
59 Butler PA C, S 3 1,000,000
60 Coatesville PA C, H, S 1 880,000
61 Koppel PA C 1 450,000
62 Latrobe (1) PA H, S 1 60,000
63 Latrobe (2) PA C, H 2 60,000
64 Midland PA S 2 600,000
65 Oil City PA H, S 1 60,000
66 Reading PA H, S 6 140,000
67 Steelton PA C 1 1,200,000
68 Cayce-W. Columbia SC C 1 800,050
69 Darlington SC C, H 1 1,050,000
70 Georgetown SC C 1 550,000
71 Huger SC C 2 3,450,000
72 Gallatin TN C 1 500,000
73 Jackson TN C 1 710,000
74 Knoxville TN C 1 600,000
75 Memphis TN C 1 850,000
76 Jewett TX C 1 1,250,000
77 Longview TX C, H 2 125,000
78 Midlothian TX C, H, S 2 1,750,000
79 Seguin TX C 1 1,000,000
80 Vidor (Beaumont) TX C 1 670,000
81 Vinton (El Paso) TX C 2 250,000
82 Plymouth UT C 2 1,120,000
83 Petersburg VA C, H, S 1 1,200,000
84 Roanoke VA C 1 650,000
85 Seattle WA C 1 1,100,000
86 Saukville WI C 1 625,000
87 Huntington WV C 2 280,000
Total EAF 119 81,072,800 Note: C = carbon, H = high alloy, S = stainless, tpy = tons per year.
B.2 Energy Intensity
Current energy consumption in the Iron and Steel industry is estimated by DOE to be approximately 19 million British thermal units per ton of steel (MMBtu/ton) (22.1 GJ/tonne) for Integrated steel mills, 5.0 MMBtu/ton (5.8 GJ/tonne) for EAF (DOE, 2005); and 3.4 MMBtu/ton of coke (2.9 GJ/tonne). (DOE, 2000) As shown in Figure B-1, the U.S. Iron and Steel industry has reduced overall energy intensity for steel production dramatically since the 1950s. (AISI, 2011) A large part of this decrease is due to the increasing proportion of steel recycled in EAF since the 1970s; the energy intensity of secondary steelmaking is much less than the Integrated Iron and Steel process [19 MMBtu/ton vs. 5.0 MMBtu/ton (22 GJ/tonne] vs. 6 GJ/tonne)]. Some of the other contributors to the reduction include the widespread adoption of continuous casting, blast furnace coal injection, optimization of blast furnace operations, thin-slab casting, and the use of previously wasted process gases (BFG and COG) in furnaces and boilers.
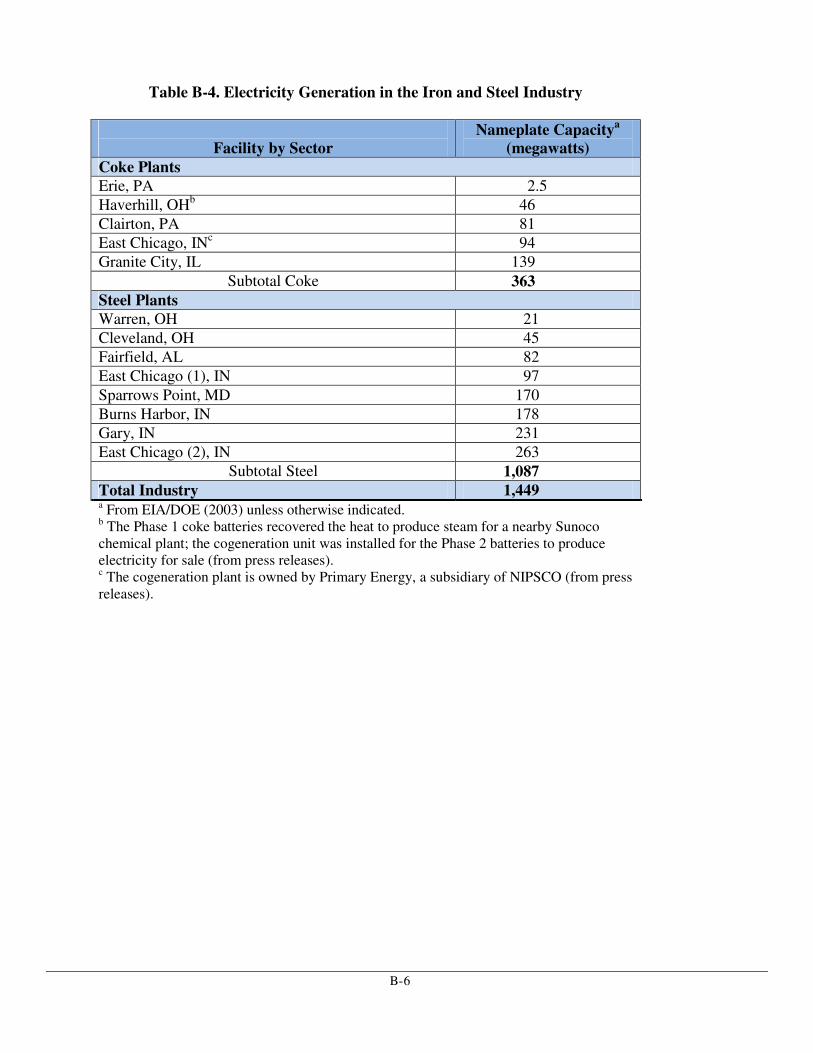
As shown in Table B-4, several plants have installed cogeneration systems (EIA/DOE, 2003). The three newest Coke plants all recover the heat from the battery stack to produce steam and/or electricity. Integrated Iron and Steel plants use excess process fuel gases (BFG and COG) for cogeneration units.

B- 5
Many plants have implemented thin-slab casting (see Table B-5), where thin slabs are slabs that are 2- to 4-in (5- to 10-cm) thick. This technology may be a future opportunity for a few more plants that produce thin slabs of steel. Thin-slab casting integrates casting and hot rolling into one process, which is estimated to reduce energy consumption by 4.2 MMBtu/ton (4.9 GJ/tonne) of crude steel. Between1994 and 2000, nine out of 16 slab castings units built were thin slab.
Source: American Iron and Steel Institute
Figure B-1. Historical energy consumption in the Iron and Steel industry.
0
10
20
30
40
50
60
1950 1955 1960 1965 1970 1975 1980 1985 1990 1995 2000 2005 2006
Mil
lio
n B
tu p
er t
on
of
stee
l
Year
B- 6
Table B-4. Electricity Generation in the Iron and Steel Industry
Facility by Sector
Nameplate Capacitya (megawatts)
Coke Plants Erie, PA 2.5
Haverhill, OHb 46
Clairton, PA 81
East Chicago, INc 94
Granite City, IL 139
Subtotal Coke 363 Steel Plants Warren, OH 21
Cleveland, OH 45
Fairfield, AL 82
East Chicago (1), IN 97
Sparrows Point, MD 170
Burns Harbor, IN 178
Gary, IN 231
East Chicago (2), IN 263
Subtotal Steel 1,087 Total Industry 1,449 a From EIA/DOE (2003) unless otherwise indicated. b The Phase 1 coke batteries recovered the heat to produce steam for a nearby Sunoco chemical plant; the cogeneration unit was installed for the Phase 2 batteries to produce electricity for sale (from press releases). c The cogeneration plant is owned by Primary Energy, a subsidiary of NIPSCO (from press releases).

B- 7
Table B-5. U.S. Slab Casting Units Installed 1994–2000a
City State
No. of
Units Year of Startup
Annual Capacity
(1,000 tpy)
Median Product
Thickness (in)
Thin Slab?
Hickmanb AR 1 1994 1,000 2.0 Yes Crawfordsvilleb IN 1 1994 1,000 2.0 Yes Provoc UT 1 1994 2,500 8.6 No
Ghentb KY 1 1995 1,450 2.4 Yes Mansfieldb OH 1 1995 750 4.0 Yes Tuscaloosa AL 1 1996 880 5.1 No
Butler-1b IN 1 1996 2,400 2.2 Yes Dearbornc MI 1 1996 1,300 8.0 No
Delta OH 1 1996 1,560 6.5 No
Muscatine IA 1 1997 1,250 5.5 No
Portageb IN 1 1997 700 3.5 Yes Berkeley Cnty-1b SC 1 1997 2,700 2.2 Yes Butler-2b IN 1 1998 2,400 2.2 Yes East Chicagoc IN 1 2000 3,000 9.3 No
Sparrows Ptc MD 1 2000 2,200 11 No
Berkeley Cnty-2b SC 1 2000 2,700 2.2 Yes a From 2003 Continuous Caster Roundup. (AIST, 2003) b Uses thin-slab casting. c Integrated iron and steel facility. The remaining facilities are EAF.
C-1
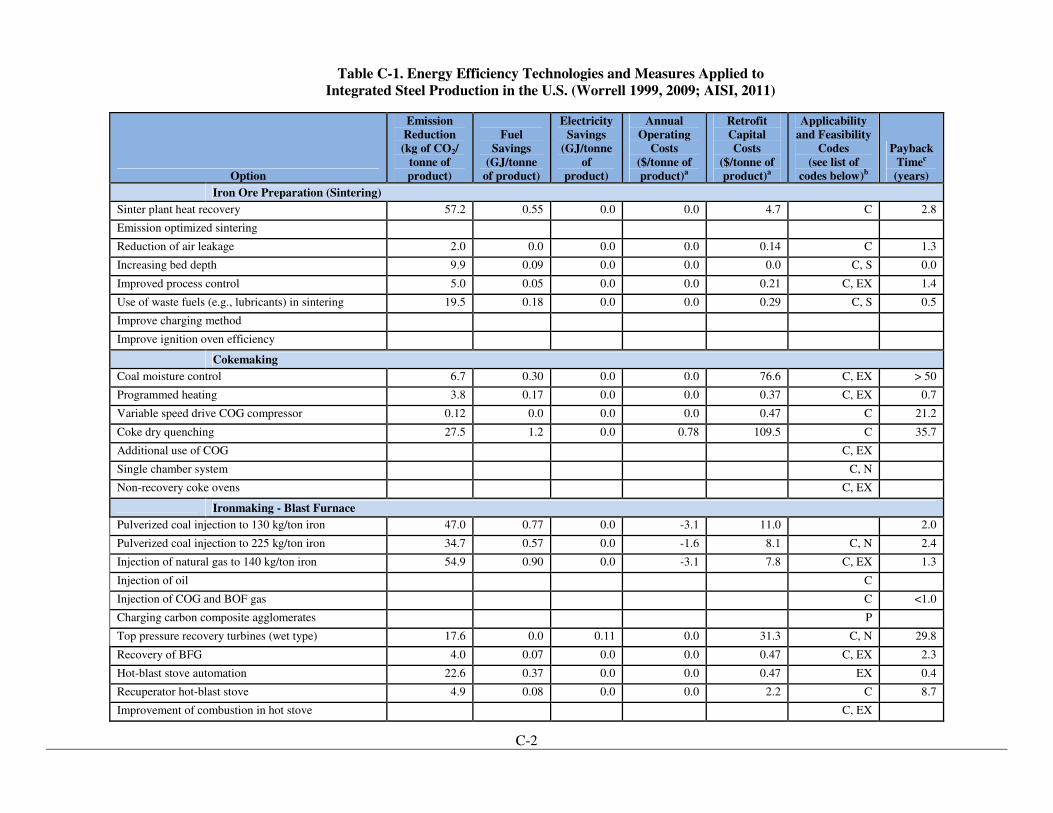
Appendix C - Detailed Estimates of Energy Costs and Savings This appendix presents the results of research performed to investigate the costs of energy-saving measures used at facilities producing steel. Reductions in fuel consumption result in reductions of direct emissions of GHGs at the steel plant, and reductions in electricity usage result in reductions of indirect emissions (i.e., emissions from the power plant supplying the electricity). The costs in Tables C-1 and C-2 were taken from Worrell (1999, 2009). The Worrell costs were adjusted from 1994 to 2008 dollars using the Chemical Engineering Plant Cost Index.8 In addition, costs and energy savings are presented as “per tonne”9 of product from the process (e.g., where “product” is steel from steelmaking furnaces, coke from Coke plants, and sinter from sinter plants). The annual operating costs in these tables do not include the energy savings from fuel or electricity. The value of the energy savings for fuel and electricity are very site-specific and depend upon many factors, such as the region of the country, special contract rates (e.g., based on quantity used, and for electricity, whether it is consumed during periods of peak demand), and changes in market price over time (e.g., fluctuations in the price of natural gas). An industry trade association (AISI, 2011) provided comments on the technical feasibility and cost-effectiveness of each of the various energy options in Tables C-1 and C-2. The industry comments indicate one or more of the following conditions for each option: (1) site-specific variables that might affect costs and/or practicality of using the option at all facilities; (2) could improve energy efficiency and potentially lower GHG emissions but may increase other pollutants; (3) already widely implemented at most existing facilities; (4) only feasible for new units; (5) immature technology and/or practice, because it is still being researched and/or is in the pilot stage, at least as applied to the Iron and Steel sector; and (6) specialized process only technically appropriate for some equipment configurations or types. It was noted that payback times of more than three years are not likely to be considered economically feasible by a facility. (AISI, 2011) There are several important caveats associated with the information in the tables here that require caution in extrapolating to every Iron and Steel sector plant. Because many of the measures were based on the experience of a single plant or an individual application of the measure, or in some cases best estimates based on the available information, the actual feasibility could be quite different when applied to other plants because of the numerous site-specific differences among plants. In addition, many measures may not be applicable to certain plants because of process configurations, product type or quality constraints, or the fact that the measure or a similar one has already been applied. Some equipment modifications may incur significant retrofit costs that affect their ability to be implemented. The choice of which measures might be the most appropriate to implement at a given facility should be based on a detailed analysis to assess site-specific costs, savings, and potential GHG emission reductions.
The costs in the tables that follow, adjusted by the cost index, do not reflect changes in actual conditions such as the installation of new and possibly better equipment that may have reduced the need for additional energy-saving technology while producing similar reductions in GHG emissions. Although the options in the tables are good examples of the types of operational changes possible to reduce energy consumption, site-specific operations can vary significantly from plant to plant, so that in some cases the estimated cost savings may not be realized. Consequently, implementation of the technologies cited here may not actually achieve in reality as high a reduction in GHG emissions as cited in the case studies. (AISI, 2011)
8 The Chemical Engineering Plant Cost Index accounts for the changes in costs over time and is used to provide costs on a common
year basis for comparisons. In this case, costs in 1994 dollars are multiplied by 1.56 to estimate the costs in 2008 dollars. The multiplier of 1.56 is the 2008 cost index (575.4) divided by the 1994 cost index (368.1). 9 A metric tonne is a unit of mass equal to 1,000 kg (2,205 lb); conversely, 1 ton (2,000 lb) is equal to 0.907 metric tonnes, and used
mostly in the U.S. The U.S. ton is sometimes called a “short” ton
C-2
Table C-1. Energy Efficiency Technologies and Measures Applied to Integrated Steel Production in the U.S. (Worrell 1999, 2009; AISI, 2011)
Option
Emission Reduction (kg of CO2/
tonne of product)
Fuel Savings
(GJ/tonne of product)
Electricity Savings
(GJ/tonne of
product)
Annual Operating
Costs ($/tonne of product)a
Retrofit Capital Costs
($/tonne of product)a
Applicability and Feasibility
Codes (see list of
codes below)b
Payback Timec (years)
Iron Ore Preparation (Sintering)
Sinter plant heat recovery 57.2 0.55 0.0 0.0 4.7 C 2.8
Emission optimized sintering
Reduction of air leakage 2.0 0.0 0.0 0.0 0.14 C 1.3
Increasing bed depth 9.9 0.09 0.0 0.0 0.0 C, S 0.0
Improved process control 5.0 0.05 0.0 0.0 0.21 C, EX 1.4
Use of waste fuels (e.g., lubricants) in sintering 19.5 0.18 0.0 0.0 0.29 C, S 0.5
Improve charging method
Improve ignition oven efficiency
Cokemaking
Coal moisture control 6.7 0.30 0.0 0.0 76.6 C, EX > 50
Programmed heating 3.8 0.17 0.0 0.0 0.37 C, EX 0.7
Variable speed drive COG compressor 0.12 0.0 0.0 0.0 0.47 C 21.2
Coke dry quenching 27.5 1.2 0.0 0.78 109.5 C 35.7
Additional use of COG C, EX
Single chamber system C, N
Non-recovery coke ovens C, EX
Ironmaking - Blast Furnace
Pulverized coal injection to 130 kg/ton iron 47.0 0.77 0.0 -3.1 11.0 2.0
Pulverized coal injection to 225 kg/ton iron 34.7 0.57 0.0 -1.6 8.1 C, N 2.4
Injection of natural gas to 140 kg/ton iron 54.9 0.90 0.0 -3.1 7.8 C, EX 1.3
Injection of oil C
Injection of COG and BOF gas C <1.0
Charging carbon composite agglomerates P
Top pressure recovery turbines (wet type) 17.6 0.0 0.11 0.0 31.3 C, N 29.8
Recovery of BFG 4.0 0.07 0.0 0.0 0.47 C, EX 2.3
Hot-blast stove automation 22.6 0.37 0.0 0.0 0.47 EX 0.4
Recuperator hot-blast stove 4.9 0.08 0.0 0.0 2.2 C 8.7
Improvement of combustion in hot stove C, EX

C-3
Option
Emission Reduction (kg of CO2/
tonne of product)
Fuel Savings
(GJ/tonne of product)
Electricity Savings
(GJ/tonne of
product)
Annual Operating
Costs ($/tonne of product)a
Retrofit Capital Costs
($/tonne of product)a
Applicability and Feasibility
Codes (see list of
codes below)b
Payback Timec (years)
Improved blast furnace control systems 24.4 0.40 0.0 0.0 0.56 EX 0.4
Blast furnace gas recycling P
Slag heat recovery P
Steelmaking - Basic Oxygen Furnace (BOF)
BOF gas plus sensible heat recovery 46.0 0.92 0.0 0.0 34.4 C 11.9
Variable speed drive on ventilation fans 0.51 0.0 0.003 0.0 0.31 C, EX 9.9
Improvement of process monitoring/control EX
Programmed and efficient ladle heating C, EX
Casting
Efficient caster ladle/tundish heating 1.1 0.02 0.0 0.0 0.09 C, EX 1.3
Near net shape casting - thin slab 728.8 3.5 0.64 -54.8 234.9 N, S 3.3
Near net shape casting – strip 25% less N, S
General Measures for Rolling Mills
Energy efficient drives 1.6 0.0 0.01 0.0 0.30 EX 3.2
Gate communicated turn-off inverters
Install lubrication system 0.016 EX
Hot Rolling
Proper reheating temperature
Avoiding overload of reheat furnaces EX
Hot charging 30.2 0.60 0.0 -2.1 23.5 EX, N, S 5.9
Process control in hot strip mill 15.1 0.30 0.0 0.0 1.1 EX 1.2
Recuperative and regenerative burners 35.2 0.70 0.0 0.0 3.9 C, EX 1.8
Flameless burners 60% 60% C
Insulation of furnaces 8.0 0.16 0.0 0.0 15.6 C, EX 31.0
Walking beam furnace 25% C, EX, N
Controlling oxygen levels and/or speed on combustion air fans
16.6 0.33 0.0 0.0 0.79 C 0.8
Heat recovery to the product 50% 32% C. N
Waste heat recovery (cooling water) 1.9 0.03 0.0 0.11 1.3 C, P > 50
Cold Rolling and Finishing
Heat recovery on the annealing line 17.5 0.30 0.02 0.0 4.2 C, EX 4.0
Reduced steam use (pickling line) 9.9 0.19 0.0 0.0 4.4 C, EX 7.3
Automated monitoring and targeting system 35.3 0.0 0.21 0.0 1.7 C, EX 0.8

C-4
Option
Emission Reduction (kg of CO2/
tonne of product)
Fuel Savings
(GJ/tonne of product)
Electricity Savings
(GJ/tonne of
product)
Annual Operating
Costs ($/tonne of product)a
Retrofit Capital Costs
($/tonne of product)a
Applicability and Feasibility
Codes (see list of
codes below)b
Payback Timec (years)
Inter-electrode insulation in electrolytic pickling line P
Continuous annealing N
General
Preventive maintenance 35.7 0.43 0.02 0.03 0.02 EX
Energy monitoring and management system 9.5 0.11 0.01 0.0 0.23 EX 0.5
Combined heat and power/cogeneration 82.1 0.03 0.35 0.0 22.7 EE, EX, N 6.1
High-efficiency motors
Variable speed drives: flue gas control, pumps, and fans
1.5 0.0 0.02 0.0 2.0 C, EX 10.7
a These costs are those that were reported; actual costs will vary according to specific circumstances at a plant. b Applicability codes (AISI, 2011):
C = Site-specific variables may affect costs and/or practicality of use at all facilities. EE = Options that could improve energy efficiency and potentially GHG emissions but, may increase other criteria pollutant emissions if implemented. EX = Process already widely implemented at many existing facilities. N = Only feasible for new units.. P = Immature process that is still in research and/or pilot stage as applied to the Iron and Steel sector. S = Specialized process only technically appropriate for some equipment configurations or types.
c Options with payback times of more than three years are not likely to be considered economically feasible by a facility. (AISI, 2011)

C-5
Table C-2. Energy Efficiency Technologies and Measures Applied to EAF Steel Production in the U.S. (Worrell 1999, 2009; AISI, 2011)
Option
Emissions Reduction
(kg CO2/tonne of
product)
Fuel Savings
(GJ/tonne of product)
Electricity Savings
(GJ/tonne of product)
Annual Operating
Costs ($/tonne of product)a
Retrofit Capital Costs
($/tonne of product)a
Applicability and
Feasibility Codes
(see list of codes below)b
Payback Time
(years)c
Steelmaking - Electric Arc Furnace
Improved process control (neural network) 17.6 0.0 0.11 -1.6 1.5 EX 0.5
Adjustable speed drives 0.05 2.0 EX 2–3
Transformer efficiency—ultra-high power transformers 10.0 0.0 0.06 0.0 4.3 C, EX 5.2
Bottom stirring/stirring gas injection 11.7 0.0 0.07 -3.1 0.94 C, EE, N 0.2
Foamy slag practice 10.6 0.0 0.07 -2.8 15.6 C, EX 4.2
Oxy-fuel burners 23.5 0.0 0.14 -6.2 7.5 C, EX 0.9
Post-combustion of the flue gases C, EX,
DC arc furnace 52.9 0.0 0.32 -3.9 6.1 C, N
Scrap preheating—tunnel furnace (Consteel) 35.2 0.0 0.22 -3.0 7.8 C, EE, S
Scrap preheating, post-combustion—shaft furnace (Fuchs) 35.3 -0.70 0.43 -6.2 9.4 C, EE, N, S
Engineered refractories 0.036
Airtight operation 0.36 P
Contiarc furnace 0.72 C, N, S
Flue gas monitoring and control 8.8 0.0 0.05 0.0 3.1 C, EX 4.3
Eccentric bottom tapping on existing furnace 8.8 0.0 0.05 0.0 5.0 C, N, S 6.8
DC twin-shell with scrap preheating 11.1 0.0 0.07 -1.7 9.4 C, EE, N 3.5
Casting
Efficient caster ladle/tundish heating 1.1 0.02 0.0 0.0 0.09 EX 1.3
Near net shape casting - thin slab 265.3 3.2 0.64 -54.8 234.8 C, EX 3.3
Near net shape casting - strip 25% less C
Hot Rolling
Proper reheating temperature EX
Avoiding overload of reheat furnaces EX
Energy efficient drives in the rolling mill 1.6 0.0 0.01 0.0 0.30 EX 5.9
Process control in hot strip mill 15.1 0.30 0.0 0.0 1.1 EX 1.2
Recuperative and regenerative burners 35.2 0.70 0.0 0.0 3.9 C, EX 1.8
Flameless burners 60% 60% C, EX
Insulation of furnaces 8.1 0.16 0.0 0.0 15.7 C, EX 31.0

C-6
Option
Emissions Reduction
(kg CO2/tonne of
product)
Fuel Savings
(GJ/tonne of product)
Electricity Savings
(GJ/tonne of product)
Annual Operating
Costs ($/tonne of product)a
Retrofit Capital Costs
($/tonne of product)a
Applicability and
Feasibility Codes
(see list of codes below)b
Payback Time
(years)c
Walking beam furnace 25% C, N
Controlling oxygen levels and/or variable speed drives on combustion air fans
16.6 0.33 0.0 0.0 0.79 C, P
Heat recovery to the product 50% 32% C
Waste heat recovery (cooling water) 1.9 0.03 0.0 0.11 1.3 C, P > 50
General
Preventive maintenance 15.0 0.09 0.05 0.03 0.02 EX
Energy monitoring and management systems 3.7 0.02 0.01 0.0 0.23 EX 0.9 a These costs are those that were reported; actual costs will vary according to specific circumstances at a plant. See Table C- 1 for energy efficiency measures applicable to rolling and
finishing operations b Applicability codes (AISI, 2011):
C = Site-specific variables may affect costs and/or practicality of use of the option at all facilities. EE = Options that could improve energy efficiency and potentially lower GHG emissions but may increase other pollutants. EX = Process already widely implemented at many existing facilities. N = Only feasible for new units. P = Immature process that is still in research and/or pilot stage as applied to the Iron and Steel sector. S = Specialized process only technically appropriate for some equipment configurations or types. c Options with payback times of more than three years are not likely to be considered economically feasible by a facility. (AISI, 2011)

Appendix D. Processes and Emissions in the Iron and Steel Industry
D.1 Overview of Processes in the Iron and Steel Industry (EPA, 2001b; 2008b)
The Iron and Steel industry in the U.S. is the third largest in the world (after China and Japan), accounting for approximately 8 percent of the world’s raw iron and steel production and supplying several industrial sectors, such as construction (building and bridge skeletons and supports), vehicle bodies, appliances, tools, and heavy equipment. The Iron and Steel industry actually includes three industries that have been traditionally treated as three different source categories: Coke Ovens, Integrated Iron and Steel, and EAF steel (secondary steelmaking that primarily recycles steel scrap).
D.1.1 Sinter Production Sintering is a process that recovers the raw material value of many waste materials generated at Integrated Iron and Steel plants that would otherwise be landfilled or stockpiled. An important function of the sinter plant is to return waste iron-bearing materials to the blast furnace to produce iron. Another function is to provide part or all of the flux material (e.g., limestone, dolomite) for the ironmaking process. There are currently five facilities with sintering operations, and all of the sinter plants are part of Integrated Iron and Steel plants.
Sintering is a continuous process. Feed material to the sintering process includes ore fines, coke, reverts (including blast furnace dust, mill scale, and other by-products of steelmaking), recycled hot and cold fines from the sintering process, and trim materials (e.g., calcite fines, and other supplemental materials needed to produce a sinter product with prescribed chemistry and tonnage). The materials are proportioned and mixed to prepare a chemically uniform feed to the sinter strand, so that the sinter will have the qualities desired for satisfactory operation of the blast furnace. The chemical quality of the sinter is often assessed in terms of its basicity, which is the percent total basic oxides divided by the percent total acid oxides {[CaO + MgO (calcium oxide plus magnesium oxide)])/[(SiO2 + Al2O3) (silicon dioxide plus aluminum oxide)]}; sinter basicity is generally 1.0 to 3.0. The relative amounts of each material are determined based on the desired basicity, the rate of consumption of material at the sinter strand, the amount of sinter fines that must be recycled, and the total carbon content needed for proper ignition of the feed material.
The sintering machine accepts feed material and conveys it down the length of the moving strand. Near the feed end of the grate, the bed is ignited on the surface by gas burners and, as the mixture moves along on the traveling grate, air is pulled down through the mixture to burn the fuel by downdraft combustion; either COG or natural gas may be used for fuel to ignite the undersized coke or coal in the feed.
On the underside of the sinter strand is a series of windboxes that draw combusted air down through the material bed into a common duct, leading to a gas-cleaning device. The fused sinter is discharged at the end of the sinter strand, where it is crushed and screened. The sinter product is cooled in open air or in a circular cooler with water sprays or mechanical fans. The cooled sinter is crushed and screened a final time, and then is sent to be added or “charged” to the blast furnaces.
D-2
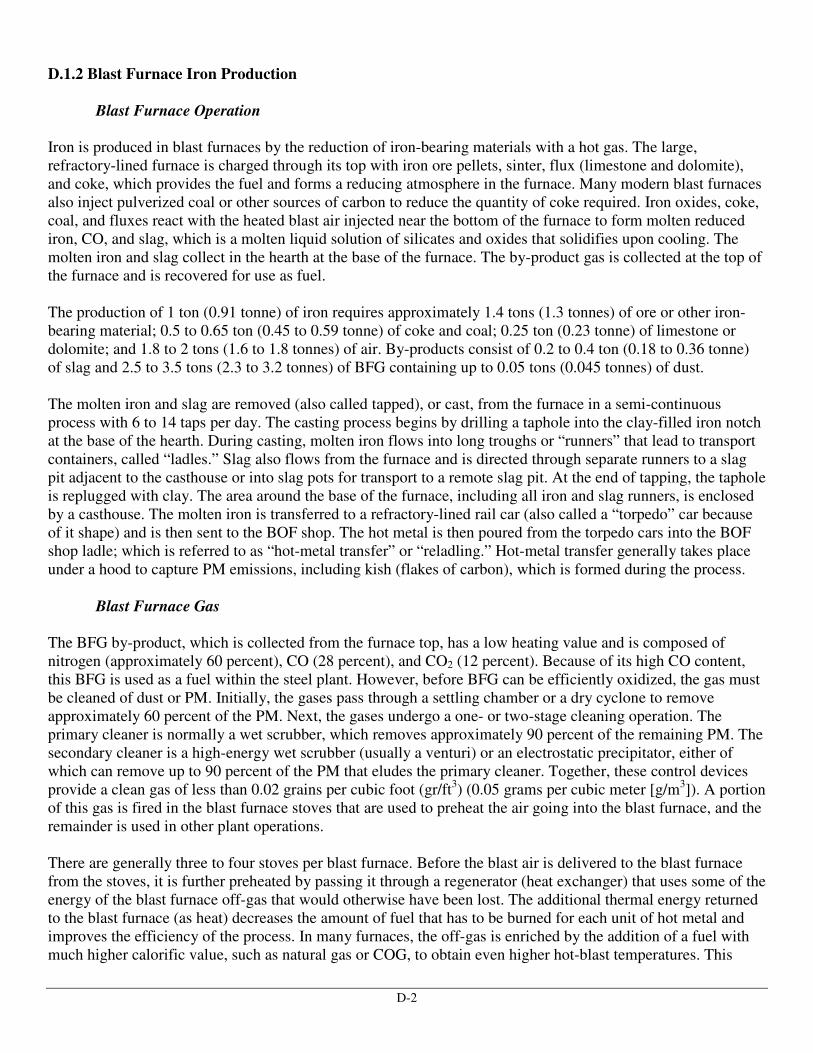
D.1.2 Blast Furnace Iron Production
Blast Furnace Operation
Iron is produced in blast furnaces by the reduction of iron-bearing materials with a hot gas. The large, refractory-lined furnace is charged through its top with iron ore pellets, sinter, flux (limestone and dolomite), and coke, which provides the fuel and forms a reducing atmosphere in the furnace. Many modern blast furnaces also inject pulverized coal or other sources of carbon to reduce the quantity of coke required. Iron oxides, coke, coal, and fluxes react with the heated blast air injected near the bottom of the furnace to form molten reduced iron, CO, and slag, which is a molten liquid solution of silicates and oxides that solidifies upon cooling. The molten iron and slag collect in the hearth at the base of the furnace. The by-product gas is collected at the top of the furnace and is recovered for use as fuel.
The production of 1 ton (0.91 tonne) of iron requires approximately 1.4 tons (1.3 tonnes) of ore or other iron-bearing material; 0.5 to 0.65 ton (0.45 to 0.59 tonne) of coke and coal; 0.25 ton (0.23 tonne) of limestone or dolomite; and 1.8 to 2 tons (1.6 to 1.8 tonnes) of air. By-products consist of 0.2 to 0.4 ton (0.18 to 0.36 tonne) of slag and 2.5 to 3.5 tons (2.3 to 3.2 tonnes) of BFG containing up to 0.05 tons (0.045 tonnes) of dust.
The molten iron and slag are removed (also called tapped), or cast, from the furnace in a semi-continuous process with 6 to 14 taps per day. The casting process begins by drilling a taphole into the clay-filled iron notch at the base of the hearth. During casting, molten iron flows into long troughs or “runners” that lead to transport containers, called “ladles.” Slag also flows from the furnace and is directed through separate runners to a slag pit adjacent to the casthouse or into slag pots for transport to a remote slag pit. At the end of tapping, the taphole is replugged with clay. The area around the base of the furnace, including all iron and slag runners, is enclosed by a casthouse. The molten iron is transferred to a refractory-lined rail car (also called a “torpedo” car because of it shape) and is then sent to the BOF shop. The hot metal is then poured from the torpedo cars into the BOF shop ladle; which is referred to as “hot-metal transfer” or “reladling.” Hot-metal transfer generally takes place under a hood to capture PM emissions, including kish (flakes of carbon), which is formed during the process.
Blast Furnace Gas
The BFG by-product, which is collected from the furnace top, has a low heating value and is composed of nitrogen (approximately 60 percent), CO (28 percent), and CO2 (12 percent). Because of its high CO content, this BFG is used as a fuel within the steel plant. However, before BFG can be efficiently oxidized, the gas must be cleaned of dust or PM. Initially, the gases pass through a settling chamber or a dry cyclone to remove approximately 60 percent of the PM. Next, the gases undergo a one- or two-stage cleaning operation. The primary cleaner is normally a wet scrubber, which removes approximately 90 percent of the remaining PM. The secondary cleaner is a high-energy wet scrubber (usually a venturi) or an electrostatic precipitator, either of which can remove up to 90 percent of the PM that eludes the primary cleaner. Together, these control devices provide a clean gas of less than 0.02 grains per cubic foot (gr/ft3) (0.05 grams per cubic meter [g/m3]). A portion of this gas is fired in the blast furnace stoves that are used to preheat the air going into the blast furnace, and the remainder is used in other plant operations.
There are generally three to four stoves per blast furnace. Before the blast air is delivered to the blast furnace from the stoves, it is further preheated by passing it through a regenerator (heat exchanger) that uses some of the energy of the blast furnace off-gas that would otherwise have been lost. The additional thermal energy returned to the blast furnace (as heat) decreases the amount of fuel that has to be burned for each unit of hot metal and improves the efficiency of the process. In many furnaces, the off-gas is enriched by the addition of a fuel with much higher calorific value, such as natural gas or COG, to obtain even higher hot-blast temperatures. This
D-3
decreases the fuel requirements and increases the hot-metal–production rate to a greater extent than is possible when burning BFG alone to heat the stoves. Iron Preparation Hot-Metal Desulfurization
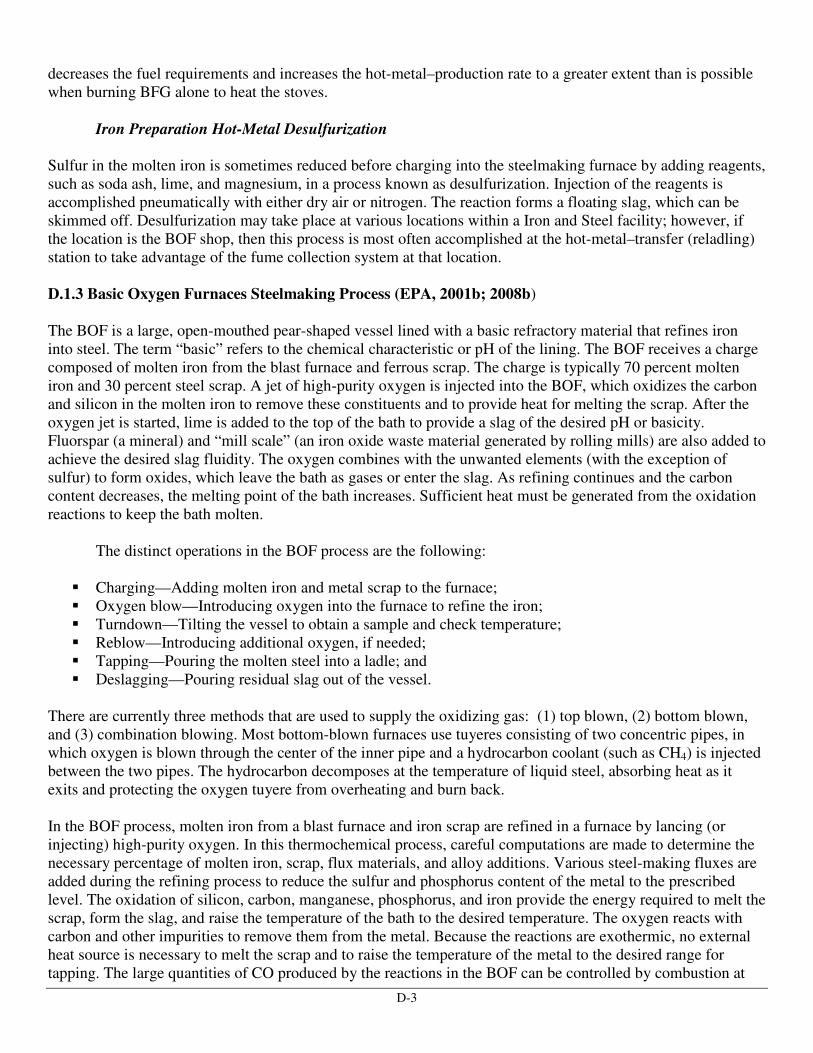
Sulfur in the molten iron is sometimes reduced before charging into the steelmaking furnace by adding reagents, such as soda ash, lime, and magnesium, in a process known as desulfurization. Injection of the reagents is accomplished pneumatically with either dry air or nitrogen. The reaction forms a floating slag, which can be skimmed off. Desulfurization may take place at various locations within a Iron and Steel facility; however, if the location is the BOF shop, then this process is most often accomplished at the hot-metal–transfer (reladling) station to take advantage of the fume collection system at that location. D.1.3 Basic Oxygen Furnaces Steelmaking Process (EPA, 2001b; 2008b) The BOF is a large, open-mouthed pear-shaped vessel lined with a basic refractory material that refines iron into steel. The term “basic” refers to the chemical characteristic or pH of the lining. The BOF receives a charge composed of molten iron from the blast furnace and ferrous scrap. The charge is typically 70 percent molten iron and 30 percent steel scrap. A jet of high-purity oxygen is injected into the BOF, which oxidizes the carbon and silicon in the molten iron to remove these constituents and to provide heat for melting the scrap. After the oxygen jet is started, lime is added to the top of the bath to provide a slag of the desired pH or basicity. Fluorspar (a mineral) and “mill scale” (an iron oxide waste material generated by rolling mills) are also added to achieve the desired slag fluidity. The oxygen combines with the unwanted elements (with the exception of sulfur) to form oxides, which leave the bath as gases or enter the slag. As refining continues and the carbon content decreases, the melting point of the bath increases. Sufficient heat must be generated from the oxidation reactions to keep the bath molten.
The distinct operations in the BOF process are the following:
� Charging—Adding molten iron and metal scrap to the furnace; � Oxygen blow—Introducing oxygen into the furnace to refine the iron; � Turndown—Tilting the vessel to obtain a sample and check temperature; � Reblow—Introducing additional oxygen, if needed; � Tapping—Pouring the molten steel into a ladle; and � Deslagging—Pouring residual slag out of the vessel.
There are currently three methods that are used to supply the oxidizing gas: (1) top blown, (2) bottom blown, and (3) combination blowing. Most bottom-blown furnaces use tuyeres consisting of two concentric pipes, in which oxygen is blown through the center of the inner pipe and a hydrocarbon coolant (such as CH4) is injected between the two pipes. The hydrocarbon decomposes at the temperature of liquid steel, absorbing heat as it exits and protecting the oxygen tuyere from overheating and burn back.
In the BOF process, molten iron from a blast furnace and iron scrap are refined in a furnace by lancing (or injecting) high-purity oxygen. In this thermochemical process, careful computations are made to determine the necessary percentage of molten iron, scrap, flux materials, and alloy additions. Various steel-making fluxes are added during the refining process to reduce the sulfur and phosphorus content of the metal to the prescribed level. The oxidation of silicon, carbon, manganese, phosphorus, and iron provide the energy required to melt the scrap, form the slag, and raise the temperature of the bath to the desired temperature. The oxygen reacts with carbon and other impurities to remove them from the metal. Because the reactions are exothermic, no external heat source is necessary to melt the scrap and to raise the temperature of the metal to the desired range for tapping. The large quantities of CO produced by the reactions in the BOF can be controlled by combustion at

D-4
the mouth of the furnace and then vented to gas-cleaning devices, as with open hoods, or combustion can be suppressed at the furnace mouth, as with closed hoods. The full furnace cycle typically takes 25 to 45 minutes. D.1.4 Electric Arc Furnace Steelmaking Electric arc furnaces are used to produce carbon and alloy steels. These steel-making furnaces are operated as a batch process that includes charging scrap and other raw materials, melting, removing slag (“slagging”), and tapping. The length of the operating cycle is referred to as the tap-to-tap time, and each batch of steel produced is known as a “heat.” Tap-to-tap times range from 35 minutes to more than 200 minutes, with generally higher tap-to-tap times for stainless and specialty steel. Newer EAF are designed to achieve a tap-to-tap time of less than 60 minutes.
The input material to an EAF is typically scrap and iron units such as pig iron, DRI, and HBI. Cylindrical refractory-lined EAF are equipped with carbon electrodes to be raised or lowered through the furnace roof. With electrodes retracted, the furnace roof can be rotated aside to permit the charge of scrap steel by overhead crane. After ferrous scrap and other materials are charged to the EAF, the melting phase begins when electrical energy is supplied to the carbon electrodes. Electric current of the opposite polarity electrodes generates heat between the electrodes and through the scrap. Oxy-fuel burners and oxygen lances may also be used to supply chemical energy. Oxy-fuel burners, which burn natural gas and oxygen, use convection and flame radiation to transfer heat to the scrap metal. Oxygen lances are used to inject oxygen directly into the molten steel; exothermic reactions with the iron and other components provide additional energy to assist in melting the scrap and removing excess carbon. Alloying agents and fluxing materials usually are added through the doors on the side of the furnace to achieve the desired composition. The process of charging the EAF and repeating the melting phase may occur several times per “heat” depending on the particular EAF and the raw materials that it is recycling.
Refining of the molten steel can occur simultaneously with melting, especially in EAF operations where oxygen is introduced throughout the batch. During the refining process, substances that are incompatible with iron and steel are separated out by forming a layer of slag on top of the molten metal. After completion of the melting and refining steps, the slag door is opened, and the furnace is tipped backward so the slag pours out (“slagging”). The furnace is righted, and the tap hole is opened. The furnace is then tipped forward, and the steel is poured (“tapped”) into a ladle (a refractory-lined vessel designed to hold the molten steel) for transfer to the ladle metallurgy station. Bulk alloy additions are made during or after tapping based on the desired steel grade.
Some EAF plants, primarily the small specialty and stainless steel producers, use AOD to further refine the molten steel from the EAF to produce low-carbon steel. In the AOD vessel, argon and oxygen are blown into the bottom of the vessel, and the carbon and oxygen react to form CO2 and CO, which are removed from the vessel. D.1.5 Casting and Finishing
Casting The steel produced by both BOF and EAF follow similar routes after the molten steel is poured from the furnace. The molten steel is transferred from ladle metallurgy to the continuous caster, which casts the steel into semi-finished shapes (e.g., slabs, blooms, billets, rounds, other special sections). Continuous casting is a relatively recent development, which has essentially replaced the ingot casting method because it increases the process yield from 80 percent to more than 95 percent and offers significant product quality benefits. Continuous casting has also decreased GHG emissions due to the increased yield and from a decrease in energy

D-5
use as compared to energy-intensive ingot casting. Continuous casting is used to produce approximately 99 percent of the steel today. Both continuous and ingot casting are not estimated to be significant sources of GHGs.
Ingot casting was the common casting route prior to continuous casting, and only a small amount of steel is now processed using this route. In this process, molten steel is poured from the ladle into an ingot mold, where it cools and begins to solidify. The molds are stripped away, and the ingots are transported to a soaking pit or to a reheat furnace where they are heated to a uniform temperature. The ingots are shaped by rolling them into semi-finished products, usually slabs, blooms, or billets, or by forging. Ingot casting is typically used for small specialty batches and certain applications for producing steel plates.
Whichever production technique is used, the slabs, blooms, or billets undergo a surface preparation step, called “scarfing,” which removes surface defects before shaping or rolling. Scarfing can be performed by a machine applying jets of oxygen to the surface of hot semi-finished steel or by hand (with torches) on cold or slightly heated semi-finished steel.
Rolling Mills
Steel from the continuous caster is processed in rolling mills to produce steel shapes that are classified according to general appearance, overall size, dimensional proportions, and intended use. Slabs are always oblong, usually 2- to 9-in thick and 24- to 60-in wide (5- to 23- centimeter [cm] thick and 61- to 152-cm wide). Blooms are square or slightly oblong and are mostly in the range of 6-by-6 in to 12-by-12 in (15-by-15 cm to 30-by-30 cm). Billets are mostly square and range from 2-by-2 in to 5-by-5 in (5-by-5 cm to 13-by-13 cm). Rolling mills are used to produce the final steel shapes that are sold by the steel mill. These shapes include coiled strips, rails, and other structural shapes, as well as sheets and bars. Because rolling mills consume electricity, they consequently contribute to indirect emissions of GHGs.
D.1.6 Other Steel Finishing Processes and Combustion Sources
The semi-finished products may be further processed by using many different steps, such as annealing, hot forming, cold rolling, pickling, galvanizing, coating, or painting. Some of these steps require additional heating or reheating. The additional heating or reheating is accomplished using furnaces usually fired with natural gas. The furnaces are custom designed for the type of steel, the dimensions of the semi-finished steel pieces, and the desired temperature.
There are many different types of combustion processes at both Integrated Iron and Steel and EAF steel facilities that are not directly related to the major production processes previously discussed. However, the EAF facilities burn natural gas almost exclusively, whereas Integrated steel facilities burn a combination of fuels, including natural gas, COG, and BFG. The combustion units at both types of facilities include boilers, process heaters, flares, dryout heaters, and several types of furnaces. For example, soaking pits and reheat furnaces are used to raise the temperature of the steel until it is sufficiently hot to be plastic enough for economical reduction by rolling or forging. Annealing furnaces are used to heat the steel to relieve cooling stresses induced by cold or hot working and to soften the steel to improve machinability and formability. Ladle reheating uses natural gas to keep the ladle hot while waiting for molten steel. Natural gas is the most commonly used fuel, in general, at both types of steel-making facilities, but COG and BFG (depending on availability) are also used in some of the combustion processes at Integrated steel plants. The CO2 emissions from combustion sources in 2007 were estimated at approximately 21 million tons (19 million tonnes) for EAF steel plants and 19 million tons (17 million tonnes) for Integrated Iron and Steel plants.
D-6
D.1.7 Coke Production
Most coke is produced in by-product recovery coke oven batteries. However, of the 19 U.S. Coke plants shown in Table B-1, there are four non-recovery coke oven batteries, including the three newest Coke plants. All three of the newest non-recovery plants use waste heat from combustion to generate electricity. The recovery of waste heat to generate electricity reduces the amount of purchased electricity or reduces the need to purchase additional fuel to generate electricity onsite. Recovered heat that is supplied to the grid also reduces the amount of electricity that must be produced; if this power is generated from fossil-fuel combustion, then the recovered heat lowers the amount of CO2 emissions generated from combustion.
By-product Recovery Coke Oven Batteries
Thermal distillation is used to remove volatile non-carbon elements from coal to produce coke in ovens grouped together in “batteries.” A by-product coke oven battery consists of 20 to 100 adjacent ovens with common side walls made of high-quality silica and other types of refractory brick. The wall separating adjacent ovens and each end wall consists of a series of heating flues. At any one time, half of the flues in a given wall will be burning gas in combustion flues, and the other half of the flues will be conveying waste heat from the combustion flues to a heat exchanger and then to the combustion stack. Every 20 to 30 minutes, the battery “reverses,” the former waste heat flues become combustion flues, and the former combustion flues become waste heat flues. Because the flame temperature is above the melting point of the brick, this reversal avoids melting the battery brickwork and provides more uniform heating of the coal mass. Process heat is obtained from the combustion of COG in the combustion flues, which is sometimes supplemented with BFG. The BFG is introduced from piping in the basement of the battery where the gas flow to each flue is metered and controlled. Waste gases from combustion, including GHGs, exit through the battery stack.
Each oven holds between 15 and 25 tons (14 and 23 tonnes) of coal. Offtake flues remove gases evolved from the destructive distillation process. The operation of each oven in the battery is cyclic, but the batteries usually contain a sufficiently large number of ovens so that the yield of by-products is essentially continuous. Coking continues for 15 to 18 hrs to produce blast furnace coke and 25 to 30 hrs to produce foundry coke. The coking time is determined by the coal mixture, the moisture content, the rate of underfiring, and the desired properties of the coke. Coking temperatures generally range from 1,700°F to 2,000°F (900°C to 1,100°C) and are kept on the higher side of the range to produce blast furnace coke.
The coke oven process begins with pulverized coal that is mixed and blended, with water and oil sometimes added to control the bulk density of the mixture. The prepared coal mixture is then transported to the coal storage bunkers on the coke oven battery. A specific volume of coal is discharged from the bunker into a larry car, which is a vehicle that moves along the top of the battery. When the larry car is positioned over an empty, hot oven, the lids on the charging ports are removed, and the coal is discharged from the hoppers of the larry car into the oven. To minimize the escape of gases from the oven during charging, steam aspiration is used to draw gases from the space above the charged coal into a collecting main duct. After charging, the aspiration is turned off, and the gases are directed through an offtake system into the gas-collecting main duct.
The maximum temperature attained at the center of the coke mass usually ranges from 2,000°F to 2,800°F (1,100ºC to 1,500ºC). At this temperature, almost all volatile matter from the coal mass volatilizes and leaves a high-quality metallurgical coke. Ambient air is prevented from leaking into the ovens by maintaining a slight positive back pressure of approximately 10 mm of water. The positive pressure causes some COG to leak out of the ovens. The gases and hydrocarbons, including GHGs, that evolve during thermal distillation in the coke oven are removed through the offtake gas system and are sent to the by-product plant for recovery.
D-7
Near the end of the coking cycle, each oven is disconnected, or “dampered off,” from the main collection duct. Once an oven is dampered off, a standpipe in the oven that is capped during the cycle is opened to relieve pressure. Volatile gases exit through the open standpipe and are ignited if they fail to self-ignite. These gases are allowed to burn until the oven has been emptied of coke, or “pushed.” At the end of the coking cycle, doors at both ends of the oven are removed, and the hot coke is pushed out of the coke side of the oven by a ram that is extended from a pusher machine. The coke is then pushed through a guide trough into a special rail car (called a quench car), which traverses the coke side of the battery. The quench car carries the coke to a quench tower where the hot coke is deluged with water. The quenched coke is discharged onto an inclined “coke wharf” to allow excess water to drain and cool the coke to a lower temperature. Gates along the lower edge of the wharf control the rate that the coke falls onto a conveyor belt that carries it to a crushing and screening system.
Gases that evolve during coking leave the coke oven through standpipes, pass into goosenecks (curved piping that connects each oven’s standpipe to the main collecting duct), and travel through a damper valve to the gas collection main duct that directs the gases to the by-product plant. These gases account for 20 to 35 percent by weight of the initial coal charge and are composed of water vapor, tar, light oils, heavy hydrocarbons, and other chemical compounds.
At the by-product recovery plant, tar and tar derivatives, ammonia, and light oil are extracted from the raw COG. At most Coke plants, after tar, ammonia, and light oil are removed, the gas undergoes a final desulfurization process to remove hydrogen sulfide before being used as fuel. Approximately 35 to 40 percent of cleaned COG (after the removal of economically valuable by-products) is used to heat the coke ovens, and the remainder is used in other operations related to steel production, in boilers, or is flared. COG is composed of approximately 47 percent hydrogen, 32 percent CH4, 6 percent CO, and 2 percent CO2.
Non-recovery Coke Oven Batteries (with Heat Recovery)
As the name implies, the non-recovery cokemaking process does not recover the numerous chemical by-products which were discussed above under by-product recovery. All of the COG is burned, and instead of recovering the chemicals, this process is usually accompanied by heat recovery, and in many cases also the cogeneration of electricity. Nonrecovery ovens are of a horizontal design (as opposed to the vertical slot oven used in the by-product process) with a typical range of 30 to 60 ovens per battery. The oven is generally between 30- and 45-feet (ft.) (9 and 14-meters [m]) long and 6- to 12-ft. (1.8- to 3.7-m) wide. The internal oven chamber is usually semi-cylindrical, with the apex of the arch 5 to 12 ft. (1.5 to 3.7 m) above the oven floor. Each oven is equipped with two doors, one on each side of the horizontal oven, but there are no lids or offtakes as found on by-product ovens. The oven is charged through the oven doorway with a coal conveyor rather than from the top through charging ports as in a recovery plant.
After a non-recovery oven is charged with coal, carbonization begins as a result of the heat radiated from the oven bricks used with the previous charge. Combustion products and volatiles that evolve from the coal mass are burned in the chamber above the coal, in the gas pathway through the walls, and beneath the oven in combustion flues (“sole” flues). Each oven chamber has two to six “downcomers” ducts in each oven wall; the sole flue may be subdivided into separate flues that are supplied by these downcomers. The sole flue is designed to heat the bottom of the coal charge by conduction, and radiant and convective heat flow is produced above the coal charge.
Primary combustion air is introduced into the oven chamber above the coal (the “crown”) through one of several dampered ports in the door. The dampers are adjusted to maintain the proper temperature in the oven crown. Outside air may also be introduced into the sole flues; however, additional air is usually required in the sole flue only for the first hour or two after charging. All of the non-recovery ovens are maintained under a

D-8
negative pressure and do not leak under normal operating conditions, unlike the by-product ovens, which are maintained under a positive pressure. The combustion gases are removed from the ovens and directed to the stack through a waste heat tunnel located on top of the battery centerline and extends the length of the battery.
D.2 Greenhouse Gas Emissions from Steelmaking Processes D.2.1 GHG Emissions from Sinter Plants The primary GHG emissions point of interest for the sinter plant is the stack that discharges the windbox exhaust gases after gas cleaning. The CO2 is formed from the fuel combustion (COG or natural gas) and from carbon in the feed materials, including coke fines and other carbonaceous materials. The GHG emissions from sinter plants may vary widely over time as a consequence of variations in the fuel inputs and other feedstock, especially in the types and quantities of iron-bearing materials that are recycled. Because both natural gas and COG contain methane (CH4), when these gases are burned, a small amount of the unburned CH4 is emitted with the exhaust gases. Consequently, sinter plants (and any other process that burns fuels that contain CH4) also emit a small amount of CH4.
Based on the Intergovernmental Panel on Climate Change (IPCC) emissions factor of 0.2 ton of CO2/ton of sinter (0.2 tonne of CO2/tonne of sinter) and the production of 14.7 million tons (13.3 million tonnes) of sinter in 2007, CO2 emissions are estimated at 3.0 million tons (2.7 million tonnes) of CO2/year. (IPCC, 2007) D.2.2 GHG Emissions from Blast Furnaces The vast majority of GHGs (CO2) is emitted from the blast furnaces’ stove stacks where the combustion gases from the stoves are discharged. A small amount of emissions may also occur from flares, leaks in the ductwork for conveying the gas, and from blast furnace emergency venting. Emissions of CO2 are also generated from the combustion of natural gas using flame suppression to reduce emissions of PM. In flame suppression, a flame is maintained over the surface of the molten metal, for example, during tapping, to consume oxygen and inhibit the formation of metal oxides that become airborne. Emissions also occur from the combustion of BFG in flares (flaring).
The IPCC Guidelines provide an emissions factor of 260 tonnes of CO2 per terajoule for the combustion of BFG. Based on the production of 39.8 million tons (36.1 million tonnes) of pig iron in 2007, CO2 emissions from blast furnace stoves would be approximately 26 million tons (24 million tonnes) of CO2/yr. (IPCC, 2007)
D.2.3 GHG Emissions from Basic Oxygen Furnaces
The major emission point for CO2 from the BOF is the furnace exhaust gas that is discharged through a stack after gas cleaning. The carbon is removed as CO and CO2 during the oxygen blow. Carbon may also be introduced to a much smaller extent from fluxing materials and other process additives that are charged to the furnace.
Using the default values in the IPCC Guidelines for iron (0.04) and steel (0.01) for the fraction of carbon gives an emission factor of 0.11 ton of CO2/ton of steel (0.11 tonne of CO2/tonne of steel) for carbon removed from the iron as CO2. Applying the emission factor to the production of 44 million tons (40 million tonnes) of steel in BOF in 2007 yields an estimate of 4.9 million tons (4.4 million tonnes) of CO2/yr. (IPCC, 2007)

D-9
D.2.4 GHG Emissions from Electric Arc Furnace
The CO2 emissions are generated during the melting and refining process when carbon is removed from the charge material and carbon electrodes as CO and CO2. These emissions are captured and sent to a baghouse for removal of PM before discharge into the atmosphere. The AOD vessels are small contributors to CO2 emissions.
The CO2 emissions estimate of 5.1 million tons (4.6 million tonnes) of CO2 for EAF is based on the IPCC Guidelines emission factor of 0.08 ton of CO2/ton of steel (0.08 tonne of CO2/tonne of steel) and the production of 64 million tons (58 million tonnes) of steel in 2007. (IPCC, 2007) D.2.5 GHG Emissions from Coke Plants (EPA, 2008a) The primary emissions point of gases at Coke plants is the battery’s combustion stack. Test data were obtained for 53 emissions tests (generally three runs per tests) for CO2 emissions from the combustion stacks at by-product recovery Coke plants for development of an emissions factor for 2008 revision to EPA’s Compilation of Emission Factors in AP-42. (EPA, 2008a) These tests averaged 0.21 ton of CO2/ton of coke (0.21 tonne of CO2/tonne of coke).
Test results for a non-recovery battery were also obtained and analyzed. The average of three runs at one Coke plant resulted in an emissions factor of 1.23 ton of CO2/ton of coke (1.23 tonne of CO2/tonne of coke), approximately six times higher than the factor for the combustion stack at by-product recovery batteries. The emissions factor for non-recovery combustion stacks is much higher because all of the COG and all of the by-products are burned. In comparison, organic liquids (e.g., tar, light oil) are recovered at by-product recovery Coke plants, and only approximately one-third of the gas is consumed in underfiring the ovens.
Emissions from coke combustion stacks based on the 2007 production rate are estimated at 3.3 million tons (3 million tonnes) of CO2 from non-recovery battery stacks at three Coke plants and 3.1 million tons (2.8 million tonnes) of CO2 from by-product recovery battery stacks at 15 Coke plants. Emissions from the combustion of COG in units other than the coke battery underfiring system are estimated at 0.35 ton of CO2/ton of coke (0.35 tonne of CO2/tonne of coke). For the production of 8.7 million tons (7.6 million tonnes) of coke in stand-alone by-product Coke plants (i.e., 9 by-product Coke plants not located at Integrated Iron and Steel facilities), emissions from other combustion units would be 3.0 million tons (2.7 million tonnes) of CO2/yr. A small amount of CO2 is emitted from the pushing operation when the incandescent coke is pushed from the oven and transported to the quench tower where it is quenched with water. The AP-42 emission factors provide an emissions factor of 0.008 ton of CO2/ton of coal (0.008 tonne of CO2/tonne of coal), which is equivalent to 0.01 ton of CO2/ton of coke (0.01 tonne of CO2/tonne of coke) (EPA, 2008a). Using the 2007 production rate for coke 17.4 million tons (15.8 million tonnes), the emissions from pushing are estimated at 0.174 million tons (0.158 million tonnes) of CO2/yr.
Fugitive emissions occur during the coking process from leaks of raw COG that contains CH4. The leaks occur from doors, lids, offtakes, and collecting mains and are almost impossible to quantify because they change in location, frequency, and duration during the coking cycle, and they are not captured in a conveyance. However, the number, size, and frequency of these leaks have decreased significantly over the past 20 years as a result of stringent regulations, including national standards, consent decrees, and state regulations. Many by-product recovery Coke plants also have other combustion sources, primarily boilers and flares. These units use excess COG that is not used for underfiring the battery or shipped offsite for use as fuel in other processes. The IPCC Guidelines provide an emissions factor of 0.56 ton of CO2/ton of coke (0.56 tonne of CO2/tonne of coke), assuming all of the COG is burned. (IPCC, 2007)

D-10
Table D-4. Estimates of GHG Emissions in 2010 for Iron and Steel Sector Using Emission Factors (EPA 2008a; IPCC, 2007)
Type of Facility or Unit
Number of
Facilities
2010 Estimated Emissions a (million tons of CO2/year) b
Process Units
Miscellaneous Combustion
Units
Indirect Emissions
(Electricity) Industry
Total Average per Plant
Coke
By-product coke (standalone) 10 3.4 3.3 6.7 0.7
By-product coke (co-located)c 4 0.9 0.9 0.2
Nonrecovery coke 5 5.3 5.3 1.1
All Coke 19 9.7 3.3 13.0 0.5
EAF
All EAF 87 5.0 19 24 48 0.6
Integrated Iron and Steel
By-product coke (co-located)c 4 0.9 0.9 0.2
Blast furnace 16 25 25 1.5
BOF 16 4.4 4.4 0.3
Sinter plant 5 3.0 3.0 0.6
All Integrated Iron and Steel 17 33 17.5 6.8 57 3.4
Total Iron and Steel Sector
All Iron and Steel Sectorb 120 93 40 31 117 1.0
a On October 30, 2009, EPA published a final rule for the mandatory reporting of GHG emissions (74 FR 56260- 56519). This rule required reporting of GHG emissions from all sectors of the economy starting in 2010 for facilities with GHG emissions over 25,000 tons per year CO2 equivalents. The final rule applied to direct GHG emitters, such as facilities in the Iron and Steel sector, among other types of sources of GHG. The rule did not require control of GHG, rather it only required that sources above the threshold levels monitor and report GHG emissions. See http://www.epa.gov/climatechange/emissions/ghgrulemaking.html for more information on this rule. (EPA/OAR, 2008b) Because the information obtained by EPA as a result of this rule is likely to be more accurate than the above GHG emissions obtained from the use of generalized emission factors for the Iron and Steel industry, the information shown above should only be taken as an estimate in the interim. Facility-specific emission data are also a better source of data. b
To determine values in tonnes, multiply the values in tons by 0.907. c
Note that “By-product Coke (co-located)” at Integrated Iron and Steel plants are listed twice in the table but only included once in the All Iron and Steel Sector total.


![B 2 EPA B 3 EPA B 3,3 EPA B 5 EPA B 9 EPA B 15 EPA B 22 EPA2].pdf · Voltage V/Hz 230 / 50 230 / 50 230 / 50 400 / 50 400 / 50 400 / 50 400 / 50 Air ... placach budowy.Urządzenie](https://static.fdocuments.us/doc/165x107/5c4378c293f3c34c5f7e7f30/b-2-epa-b-3-epa-b-33-epa-b-5-epa-b-9-epa-b-15-epa-b-22-epa-2pdf-voltage-vhz.jpg)