5 Raymond OhioHABsPresentation.ppt | US EPA ARCHIVE …
39
Transcript of 5 Raymond OhioHABsPresentation.ppt | US EPA ARCHIVE …


Ohio EPA HAB Response and Lessons Learned
April 26, 2017
Heather RaymondOhio EPA ‐ Division of Drinking and Ground Waters
For assistance in accessing this document please send an email to [email protected]

2010: Ohio EPA began sampling for cyanotoxins at public water systems (PWSs)‐ Finished water detection at inland PWS.
2011: Ohio EPA/ODNR/ODH created Ohio HAB Response Strategy (updated annually)2013: Finished water microcystins threshold exceedance at small PWS
‐ Drinking Water Advisory Issued.2014: Finished water microcystins threshold exceedance at large PWS
‐ Drinking Water Advisory Issued.2015: Revised Response Strategy to include U.S. EPA health advisories for microcystins and cylindrospermopsin Finished water microcystins detections at 5 PWSs
‐ No Drinking Water Advisories Issued.
Ohio Senate Bill 1 passed2016: HAB Monitoring and Reporting Rules Effective June 1, 2016 Updated response strategies, new treatment optimization
and general plan guidance for PWSs
Summary of Ohio HAB Response

Ohio HAB Rules Overview
• PWS requirements ‐ new rules in OAC Chapter 3745‐90 – Microcystins action levels in drinking water – Monitoring requirements: Microcystins and Cyanobacteria Screening– Treatment technique requirements– Public notification and Consumer Confidence
Report (CCR) requirements – Recordkeeping requirements
• Laboratory Certification requirements –New OAC rule 3745‐90‐04 and amended rules
……in Chapter 3745‐89– Laboratory certification– Analytical techniques– Reporting deadlines
HAB Rules: epa.ohio.gov/ddagw/rules.aspx
epa.ohio.gov/Portals/28/documents/labcert/TotalMicrocystins.pdf

Ohio Monitoring Requirements• Total Microcystins
May – October– Weekly raw and finished water
• Eligible for monitoring reductions starting May 2017
– Raw water detections >5 ug/L and any finished water detections trigger additional sampling
November – April– Raw water only every other week– Detections trigger additional monitoring
• Cyanobacteria Screening (qPCR)All year– Biweekly raw water– Triggers follow up sampling by Ohio EPA
for other cyanotoxins

Cyanobacteria Screening: Molecular Methods (Multiplex qPCR)
• Quantitative polymerase chain reaction (qPCR) –identifies and quantifies the presence of genes unique to:
• Cyanobacteria (16S rDNA)• Microcystin and Nodularin production (mcyE gene)• Cylindrospermopsin production (cyrA gene)• Saxitoxin production (sxtA gene)
– Test completed within 2‐3 hours– Scalable – Cost‐effective– Utilizes certified reference material – Specific
• Ohio EPA method and certification in 2017 • Ohio EPA uses the data to trigger saxitoxins and
cylindrospermopsin sampling and in 2017 will be used as trigger for microcystins monitoring.
• www.phytoxigene.com/products/

Rule Implementation & Monitoring Results• 100% compliance with rules!• Microcystins detected in raw water at 41 PWSs (33% of surface water systems)
• No finished water microcystins detections• Saxitoxin genes (sxtA) detected in 33 PWSs (27%)• Saxitoxins detected in raw water at 15 PWSs (12%); 6 finished water saxitoxins detections (none above threshold)
• Cylindrospermopsin genes detected at 1 PWS, no cylindropspermopsin detections.
• qPCR is an effective screening tool for microcystins and saxitoxins.

Lessons Learned –HABs are Not Always Visually Apparent
– Many cyanobacteria do not produce surface scums– Some cyanobacteria occur at depth in the water column or
attach to a substrate (benthic)– Some cyanobacteria move up and down in the water column
Complicates Monitoring

Lake Erie BeachMicrocystis bloomAugust 31, 2011
Microcystins >100 ug/L

Celina Intake on Grand Lake Saint Mary, September 2015, Planktothrix bloom
Microcystins 185 ug/L

Chippewa Lake, November 2016Aphanizomenon and Planktothrix bloom
Average Microcystins at Beaches 48-58 ug/L

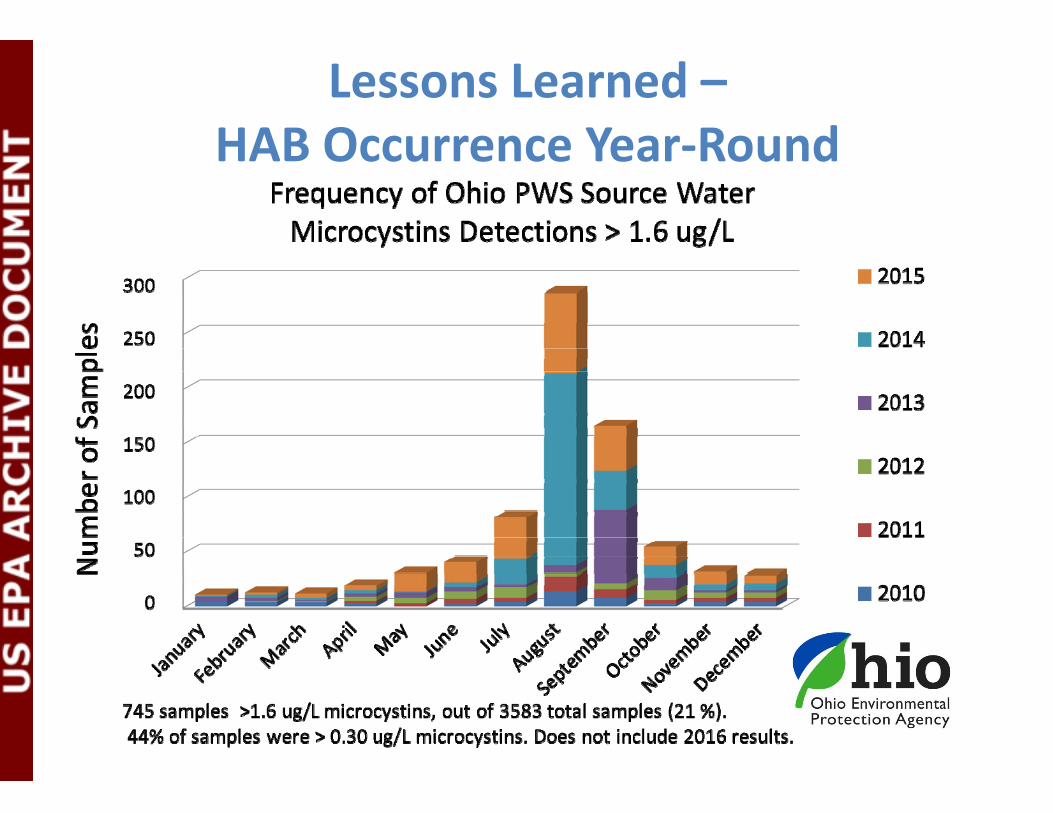
Lessons Learned –HAB Occurrence Year‐Round

through 9/24

William’s Reservoir November, 2012
Microcystin Concentration: 1400 ug/L

No Samples Collected
Raw Water Microcystins at an Inland PWS –Microcystins Do Not Always Peak in Summer
11/24
5/27

Late Fall‐Winter Microcystins and qPCR Trends
ND ND
Microcystins, m
cyE
Total Cyanobacteria, 16S

Microcystins Detections June –Dec. 2016Microcystins Detections 2010‐2015PWS Intakes
Widespread Microcystins Occurrence in Ohio
Data Available for 119 Public Water System
Source Waters
(includes ~2000 compliance samples collected in 2016)
Source Water MicrocystinsDetections at Ohio PWSs

Widespread Occurrence: Lake Erie, Inland Lakes, Upground Reservoirs, Quarries, and Rivers


(ND)
ND= Not Detected (Concentration <0.3) Source: Oregon
Microcystins Concentrations Can Increase Rapidly

2.50
1.70 1.60 1.50
0.32 0.35 0.33 0.30
0.97
0.46 0.37 0.40 0.36
0.00
0.50
1.00
1.50
2.00
2.50
3.00 8/1/14
1:30p
m
8/1/14
5:30p
m
8/1/14
11:10
pm
8/2/14
10:00
am
8/3/14
4:00am
8/3/14
7:00p
m
8/4/14
3:10am
8/4/14
3:00p
m
8/4/14
9:00p
m
8/5/14
8:30am
8/5/14
1:45p
m
8/5/14
9:00p
m
8/6/14
9:00am
8/7/14
9:00am
8/7/14
9:00p
m
8/8/14
9:00am
8/8/14
9:00p
m
8/9/14
9:00am
8/9/14
9:00p
m
8/10
/14 9:00
am
8/10
/14 9:00
pm
8/11
/14 9:00
am
8/11
/14 9:00
pm
8/12
/14 9:00
am
8/12
/14 9:00
pm
8/13
/14 9:00
am
8/13
/14 9:00
pm
8/14
/14 9:00
am
8/14
/14 9:00
pm
8/15
/14 9:00
am
8/15
/14 9:00
pm
8/16
/14 9:00
am
8/16
/14 4:00
pm
8/16
/14 8:00
pm
8/17
/14 9:00
am
8/17
/14 10
:30am
8/17
/14 9:00
pm
8/18
/14 9:00
am
8/18
/14 9:00
pm
8/19
/14 9:00
am
8/19
/14 9:00
pm
8/20
/14 9:00
am
8/20
/14 9:00
pm
Microcysns
(ug/L)
2014 Microcys ns Concentra ons in Toledo's Finished Drinking Water
(ND)
ND= Not Detected (Concentration <0.30) Data Source: Toledo PWS
Raw = 14 ug/L
Raw > 50 ug/L
Microcystin Source Concentration and Treatment Capacity(Finished Water Concentrations Lake Erie PWS)

HAB Severity Can Vary Year to Year


>100.00
0
20
40
60
80
100
120
140
160
180
200
1‐Jan
15‐Jan
29‐Jan
12‐Feb
26‐Feb
12‐M
ar
26‐M
ar
9‐Ap
r
23‐Apr
7‐May
21‐M
ay
4‐Jun
18‐Jun
2‐Jul
16‐Jul
30‐Jul
13‐Aug
27‐Aug
10‐Sep
24‐Sep
8‐Oct
22‐O
ct
5‐Nov
19‐N
ov
3‐De
c
17‐Dec
Microcys
ns (ug
/L)
Date
Grand Lake St. Marys Microcys n Concentra ons at City of Celina Intake (Raw Water)
Series1
Series2
Series3
Series4
Series5
Series6
103 >100.0 >100.0
142
185
43.4
14.7
2010 2011 2012 2013 2014 2015
Data Source: Celina PWS

Saxitoxins Detections 2016Saxitoxins 2010‐2015PWS Intakes
Saxitoxins are an Emerging Issue
2016 Finished Water Saxitoxins Detections (below threshold)
Benthic cyanobacteria may be a source of freshwater saxitoxins.

Multiplex Assay Works: Microcystin (mcyE) genes and microcystins also detected; Cylindrospermopsin (cyrA) genes also detected (cylindrospermopsin was not detected)

Use of Multi‐Parameter Datasondes for Continuous Monitoring
0 5 10 15 20Phycocyanin, 7-day average, in RFU
10-1
100
101
102
Mic
rocy
stin
, in
µg/L
Spearman’s correlation to microcystin concentrations rho p
Phycocyanin, 7‐day average 0.98 <0.0001
Dissolved oxygen, 14‐day average 0.88 <0.0001
pH, 7‐day average 0.83 <0.0001
Temperature, instantaneous 10 a.m. 0.73 0.0031
Chlorophyll, 24‐hour average 0.53 0.0358
Specific conductance, 3‐day average ‐0.20 0.4473Data Courtesy Donna Francy, USGS

Microcystin Concentration and Phycocyanin Fluorescence at Toledo’s Intake
-Graph provided to Ohio EPA by Ed Verhamme, Limnotech.
Ohio EPA provided funding to 36 PWSs for purchase of phycocyanin sondes or readers

Phycocyanin Data Interpretation• Phycocyanin Concentrations vary based on type of cyanobacteria present, turbidity of the water and other factors.
• Relative/Raw Fluorescence Units (RFUs) better than Cell Counts.– Can calibrate to cell counts in source water, but this can change if cyanobacteria genera shift or turbidity changes.
• Evaluate trends, not absolute values.

Lessons Learned – Analytical Methods Matter
- Over 140 Microcystin Variants - Standards Not Available for Majority
No “Perfect” Analytical Method for Detecting TOTAL Microcystins

Analytical Method Comparison & Microcystin Variant Evaluation
• 11 Sites: 4 up‐ground reservoirs, 2 in‐stream reservoirs, 2 Lake Erie locations, 2 canal‐feeder lakes, and 1 river source
• 22 samples from 2014 selected to help evaluate spatial and temporal variability within source waters
• Variety of cyanobacteria genera represented• Each sample analyzed using 5 separate analytical methods ELISA‐MC‐ADDA, LC‐UV/PDA, LC‐MS/MS –individual variant (12), LC‐MS/MS‐MMPB, LC‐MS scan

* LC-UV data presented do not include false-positives that were eliminated from total (Based on lack of confirmation with LC-MS methods). Sample #14 was non-detect for MCs using LC-UV.
Results of Method Comparison

Results of LC‐MS/MS MMPB and Individual Variant Analysis Compared to ELISA

Microcystins Methods ‐ Key Findings• 16 different MC‐variants detected • MC‐LR was only detected at 5 of 11 sites (45%)• Most commonly detected variants were: MC‐YR, [Dha7] MC‐LR
and [DAsp3] MC‐RR• LC‐PDA methods prone to interference, potential for false
positives and false negatives• LC‐MS/MS MMPB method confirmed ELISA results (raw water)• 91%‐100% of samples had MC‐variants not detectable by U.S. EPA
Method 544 (including dominant MC‐variant in some samples)• LC‐MS/MS individual variant analysis under‐reported total
microcystins, based on MMPB, LC‐UV/MS scans, and ELISA data• No perfect method for TOTAL Microcystins

Analytical Methods Utilized by Ohio EPA
Microcystins(μg/L)
Cylindro‐spermopsin
(μg/L)
Saxitoxins(μg/L)
Anatoxin‐a(μg/L)
Surveillance samplingELISA
(MC‐ADDA)ELISA ELISA LC‐MS/MS
Repeat sampling in response to a finished water detection
ELISA(MC‐ADDA)
LC‐MS/MS LC‐MS/MS LC‐MS/MS
ELISA: Enzyme‐Linked Immunosorbent Assay
LC‐MS/MS: Liquid Chromatography followed by tandem Mass Spectrometry

Ohio HAB Initiatives & ResourcesPWS Funding: $1.5 million in grants for analytical kits, microscopes, and raw water quality sensors and $100 million in zero-interest loans for drinking water infrastructure improvements including additional treatment, alternative sources and storage.
Technical Assistance: Site visits with all susceptible surface water systems on treatment optimization and contingency planning. Numerous presentations, webinars and workshops have been held with PWSs, stakeholders, and partners.
Guidance: Developed Cyanotoxin Treatment White Paper, Cyanotoxin Treatment Optimization Protocol, Cyanotoxin General Plan, Algaecide Application Fact Sheet, Distribution Cyanotoxin Monitoring; ELISA SOPs, Response Strategies; Website.
Emergency Response: Established PWS-specific HAB incident action plans and coordinated with partner agencies during multiple table top exercises and drills.
Clean Water Act Integration: Established cyanotoxin indictors of impairment for determining public drinking water supply beneficial use attainment
Research: Partnered with university and government researchers to address data gaps.
www.epa.ohio.gov/ddagw/HAB.aspx

Summary• HABs are Not Always Visually Apparent• HABs Can Occur Year‐Round, in a Variety of Source Waters, and can be Different (or similar) Every Year
• Early Warning Monitoring Helps• Methods Matter• Saxitoxins are an Emerging Issue • Plan Ahead!