ENVIRONMENTAL MONITORING, SAMPLING AND …nromoef.gov.in/SMPR/new26052014/42.pdf · Project:...
16
Project: “Imperial Estate “. M/s SPR Buildtech Limited, Sector-82 , Faridabad (Haryana) , Environmental Monitoring Report for the Month of June-2013. Page 1 of 16 ECOTECH SERVICES INC... Faridabad-121004 Page 1 of 16 ENVIRONMENTAL MONITORING, SAMPLING AND ANALYSIS OF AMBIENT AIR QUALITY, SOIL QUALITY,WATER QUALITY AND AMBIENT AIR NOISE LEVEL MONITORING FOR “IMPERIAL ESTATE” PROJECT IN SECTOR-82 FARIDABAD (HARYANA) ,M/S SPR BUILDTECH LIMITED Submitted to: M/s Environmental Technologies Services Organization. B - 96, 2nd Floor, Nehru Ground Faridabad, Haryana - 121 001, Haryana (India) JUNE, 2013 Submitted by: ECOTECH SERVICES INC… (Environmental consultancy / Analytical Laboratory / Projects) #3297, Sector-03, Faridabad-121004 Haryana (India) Telefax: +91-129-2213418, 2213006 Email: [email protected] ,Web: www.ecotechservices.in ECOTECH SERVICES INC...
Transcript of ENVIRONMENTAL MONITORING, SAMPLING AND …nromoef.gov.in/SMPR/new26052014/42.pdf · Project:...

Project: “Imperial Estate “. M/s SPR Buildtech Limited, Sector-82 , Faridabad (Haryana) , Environmental Monitoring Report for the Month of June-2013. Page 1 of 16
ECOTECH SERVICES INC... Faridabad-121004 Page 1 of 16
ENVIRONMENTAL MONITORING, SAMPLING AND ANALYSIS OF AMBIENT AIR QUALITY, SOIL QUALITY,WATER QUALITY AND
AMBIENT AIR NOISE LEVEL MONITORING
FOR
“IMPERIAL ESTATE” PROJECT IN SECTOR-82 FARIDABAD (HARYANA) ,M/S SPR BUILDTECH LIMITED
Submitted to: M/s Environmental Technologies Services Organization.
B - 96, 2nd Floor, Nehru Ground Faridabad, Haryana - 121 001,
Haryana (India)
JUNE, 2013
Submitted by:
ECOTECH SERVICES INC… (Environmental consultancy / Analytical Laboratory / Projects)
#3297, Sector-03, Faridabad-121004 Haryana (India) Telefax: +91-129-2213418, 2213006
Email: [email protected] ,Web: www.ecotechservices.in
ECOTECH SERVICES INC...

Project: “Imperial Estate “. M/s SPR Buildtech Limited, Sector-82 , Faridabad (Haryana) , Environmental Monitoring Report for the Month of June-2013. Page 2 of 16
ECOTECH SERVICES INC... Faridabad-121004 Page 2 of 16
“Environmental Consultancy / Analytical Laboratory / Projects” Ecotech Services Inc. Faridabad is an Environmental Consultancy and Laboratory Services provided
firm. ECOTECH also listed in NABET accreditation under Quality Council of India (QCI). The Company has
been successfully serving its clients since last 05 years in India. The Company provides specialty services
in the field of Environmental Consultancy and Environmental Monitoring, Testing, Environment
Management, Safety Engineering and the Loss Prevention. It works for large industrial, infrastructure,
and institutional organizations in the public, government and the private sectors and is regarded as
leader for working in Co-Generation Power Project, State and National High way Projects, Power Plant,
Sugar Ind., Metal finishing, Textiles, pharmaceuticals, Oil refinery, Auto Industries, petrochemical,
fertilizer and construction development projects etc.
Ecotech Services Inc... We have awarded a work for Environmental Monitoring at “IMPERIAL ESTATE”,
M/s SPR Buildtech Limited, Sector – 82, Faridabad (Haryana) from M/s Environmental
Technologies Services Organization. B – 96, 2nd Floor, Nehru Ground Faridabad, Haryana – 121001,
(India). P.O. No. ENTSORGA/SPR/E.M/02-2013 dated 19/06/2013.
Our Environmental Pollution Monitoring work includes:
A. Sampling and Analysis of Ambient Air Quality.
B. Sampling and Analysis of Ground Water Quality.
C. Ambient Noise Monitoring.
D. Sampling and Analysis of soil Quality.
The trust and confidence entrusted in us by our clients is undoubtedly well earned and deserved. We at
ECOTECH are strongly committed to attaining “Excellence through Experience” in our Endeavors.

Project: “Imperial Estate “. M/s SPR Buildtech Limited, Sector-82 , Faridabad (Haryana) , Environmental Monitoring Report for the Month of June-2013. Page 3 of 16
ECOTECH SERVICES INC... Faridabad-121004 Page 3 of 16
Project Team
The report has been prepared by Ecotech Services Inc.., # 3297, Sector-03 Faridabad-121004 (HR.)
The date of Environmental monitoring and sampling was from 28/06/2013 to 29/06/2013, and the
members of the team involved in this Environment Monitoring work were:
SR.NO. MEMBERS SPECIALIZATION
1. MR. RAVINDER CHAUHAN Project In charge. 2. MR. GAURAV KUMAR Team In charge. 3. MR. SUSIL KUMAR Technical Executive... 4. MS. PRIYA Sr. Chemist 5. MR. JAIBEER SINGH Field Executive.
(Ravinder Chauhan ) Chief Consultant (Environment) Date - 02/07/2013 Place - Faridabad

Project: “Imperial Estate “. M/s SPR Buildtech Limited, Sector-82 , Faridabad (Haryana) , Environmental Monitoring Report for the Month of June-2013. Page 4 of 16
ECOTECH SERVICES INC... Faridabad-121004 Page 4 of 16
Scope of Work Ecotech Services INC... Faridabad was awarded the work (P.O. No. ENTSORGA/SPR/E.M/02-2013 dated 19/06/2013) of Environmental monitoring ,Sampling and analysis of Ambient Air Quality, Soil Quality, Water Quality and Ambient Noise Level Monitoring , at “Imperial Estate”,Sector-82 , Faridabad (Haryana) M/s SPR Buildtech Limited , Faridabad.
SCOPE OF WORK S.
No. Type of Sample Analysis Required No. of
Samples/site 1 Soil Texture (Sand, Clay and Silt%), Classification, Bulk density
Water holding capacity, pH, Conductivity, Organic Matter, Nitrogen, Phosphate, Sodium, Calcium, Potassium, Magnesium. (IS:2720 & SMCA)
1
2 Ground Water pH, TDS, TSS, Hardness, Iron, Chlorides, Fluorides, Calcium, Magnesium, Sulphate, Nitrate, Arsenic, Zinc, BOD, COD, Total Alkalinity, Total Coliforms.(IS:10500)
1
3 Ambient Air 24 hrs samples for analysis of PM10,PM 2.5, SOx, NOx, CO 1
4 Ambient noise On hourly basis L10, L50, L90, Leq, Lnight, Ldn, Lday Lmax, Lmin.
1

Project: “Imperial Estate “. M/s SPR Buildtech Limited, Sector-82 , Faridabad (Haryana) , Environmental Monitoring Report for the Month of June-2013. Page 5 of 16
ECOTECH SERVICES INC... Faridabad-121004 Page 5 of 16
ENVIRONMENTAL MONITORING REPORT
CONTENTS 1.0 SOIL MONITORING 1.1 Soil Monitoring Locations 1.2 Methodology of Soil Monitoring 1.3 Soil Monitoring Results 1.4 Discussion on Soil Characteristics in the Study Area 2.0 GROUNDWATER QUALITY MONITORING 2.1 Groundwater Quality Monitoring Locations 2.2 Methodology of Groundwater Quality Monitoring 2.3 Groundwater Quality Monitoring Results 2.4 Discussion on Groundwater Quality in the Study Area 3.0 AMBIENT AIR QUALITY MONITORING 3.1 Ambient Air Quality Monitoring Stations 3.2 Ambient Air Quality Monitoring Methodology 3.3 Ambient Air Quality Monitoring Results 3.4 Discussion on Ambient Air Quality in the Study Area 3.4.1 Particulate Matter (PM 10) 3.4.2 Particulate Matter (PM 2.5) 3.4.3 Sulphur Dioxide (SO2) 3.4.4 Oxides of Nitrogen (NOx) 3.4.5 Carbon monoxide (CO) 4.0 AMBIENT NOISE MONITORING 4.1 Ambient Noise Monitoring Locations 4.2 Methodology of Noise Monitoring 4.3 Ambient Noise Monitoring Results 4.4 Discussion on Ambient Noise Levels in the Study Area
Project: “Imperial Estate “. M/s SPR Buildtech Limited, Sector-82 , Faridabad (Haryana) , Environmental Monitoring Report for the Month of June-2013. Page 6 of 16
ECOTECH SERVICES INC... Faridabad-121004 Page 6 of 16
List of Tables Table 1.1 Details of Soil Quality Monitoring Location Table 1.2 Physico-Chemical Characteristics of Soil in the Study Area Table 2.1 Details of Water Quality Monitoring Stations Table 2.2 Groundwater Quality Monitoring Results Table 3.1 Details of Ambient Air Quality Monitoring Stations Table 3.2 Methodology for Ambient Air Quality Monitoring Table 3.3 Detailed Ambient Air Quality Monitoring Results (24-hourly Average) Table 3.4 Summary of PM 10 Levels Monitored in the Study Area Table 3.5 Summary of PM 2.5 Levels Monitored in the Study Area Table 3.6 Summary of SO2 Levels Monitored in the Study Area Table 3.7 Summary of NOx Levels Monitored in the Study Area Table 3.8 Summary of CO Levels Monitored in the Study Area Table 4.1 Details of Ambient Noise Monitoring Stations Table 4.2 Ambient Noise Monitoring Results at project site (Hourly Leq) Table 4.3 Discussion on Ambient Noise Levels in the Study Area
Project: “Imperial Estate “. M/s SPR Buildtech Limited, Sector-82 , Faridabad (Haryana) , Environmental Monitoring Report for the Month of June-2013. Page 7 of 16
ECOTECH SERVICES INC... Faridabad-121004 Page 7 of 16
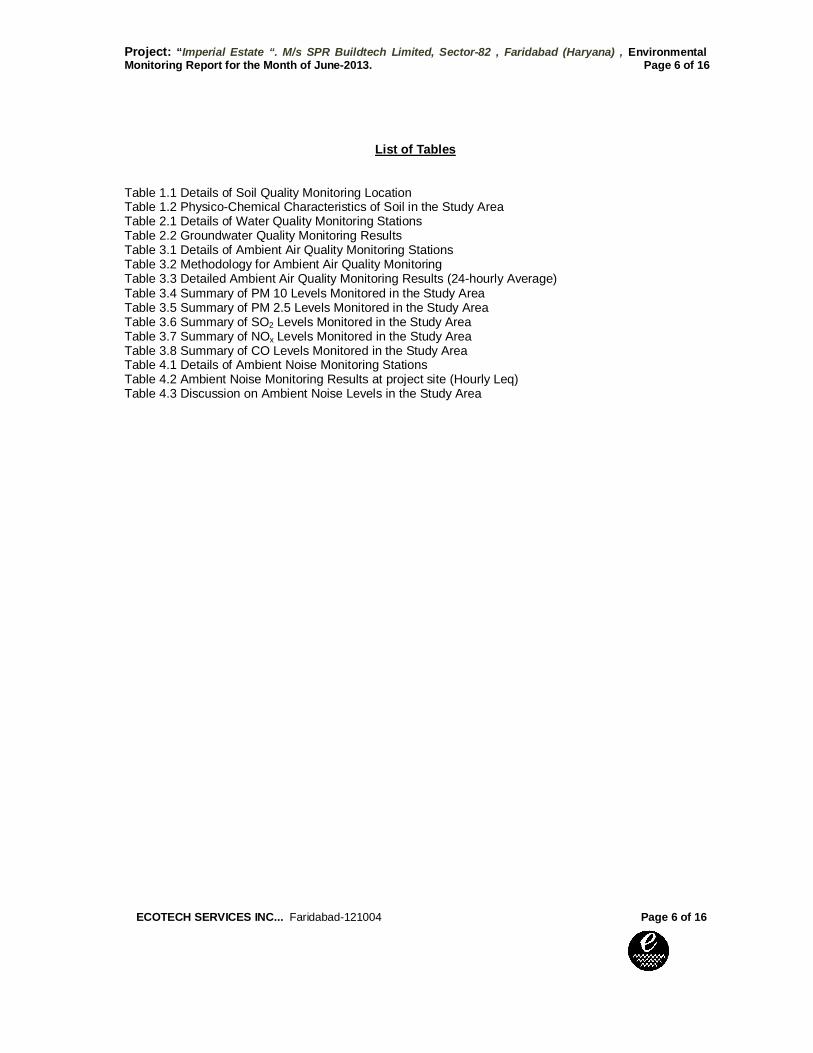
1.0 SOIL MONITORING
1.1 Soil Monitoring Locations To assess the soil in the area, the physico -chemical characteristics of soils within the study area were examined by obtaining soil samples from selected points and analysis of the same. One soil sample was collected from the project site for studying soil characteristics in the study area, the location of which is listed in Table 1.1.
Table 1.1 Details of Soil Quality Monitoring Location
S. No. Locn. Code Location Name/ Description 1. S1 Project Site
1.2 Methodology of Soil Monitoring It is most essential to obtain a representative sample of soil from an area in any study. A composite sample of an area is normally preferred. The soil sample was collected from the selected site in the month of June-28, 2013 and transported to the laboratory and was spread for air drying. After proper drying of the soil, large stones and other similar objects were removed and the soil was grounded to break up aggregates and crumbs, and tested as per IS 2720 and SMCA.The results are given in Table 1.2.
1.3 Soil Monitoring Results The physico-chemical characteristics of the soil in the study area, as obtained from the analysis of the soil samples, are presented in Table 1.2.
Table 1.2 Physico-Chemical Characteristics of Soil in the Study Area
S. No. Parameter Unit Concentration 1 Texture (a) Sand % 74 (b) Clay % 10 (c) Silt % 12 2 Class of Soil - Loamy Sand 3 Bulk Density gm/cc 0.96 4 Water Holding Capacity % w/w 36 5 pH - 8.10 6 Conductivity µS/cm 136 7 Organic Matter % w/w 0.04 8 Nitrogen % w/w 0.02 9 Phosphate % 0.06 10 Sodium as Na meq/100gm 3.8 11 Calcium as Ca meq/100gm 27.6 12 Potassium as K meq/100gm 0.19 13 Magnesium as Mg meq/100gm 4.4

Project: “Imperial Estate “. M/s SPR Buildtech Limited, Sector-82 , Faridabad (Haryana) , Environmental Monitoring Report for the Month of June-2013. Page 8 of 16
ECOTECH SERVICES INC... Faridabad-121004 Page 8 of 16
1.4 Discussion on Soil Characteristics in the Study Area
The soil texture of project site is loamy sand and alkaline in nature with pH 8.12. The electrical conductivity of the soil is 134 µS/cm.
2.0 GROUNDWATER QUALITY MONITORING
2.1 Groundwater Quality Monitoring Locations
Groundwater has been found as an important source for catering to the local needs of water consumption for various purposes, mainly domestic. Keeping in view the importance of groundwater to the local population, one sample of ground water was collected from the study area for the monitoring and assessment of groundwater quality. The location is mentioned in Table 2.1
Table 2.1 Details of Water Quality Monitoring Station
S. No. Location Code Location Name/ Description 6. GW1 Project Site ( Borewell Water)
2.2 Methodology of Groundwater Quality Monitoring
The water sample was collected in the month of June 28, 2013. The sample was collected and analyzed as per IS-3025. Grab sample of water was collected. Sample for chemical analysis was collected in polyethylene car buoys. Sample for DO analysis was collected in the glass bottle of capacity 300ml and the DO were fixed on site using KI and MnSO4. Sample for bacteriological analysis was collected in the sterilized bottle. Specified physico-chemical and bacteriological parameters have been analyzed for projecting the existing water quality status in the study area.
2.3 Groundwater Quality Monitoring Results
The detailed groundwater quality monitoring results are presented in Table 2.2.
Table 2.2 Groundwater Quality Monitoring Results S.
No. Parameter Unit Result Limits as per IS :10500 Test Methods
Desirable Permissible 1 pH - 7.40 6.5-8.5 No Relaxation IS: 3025(P- 11) 2 TDS mg/L 681 500 2000 IS: 3025(P- 16) 3 TSS mg/L <5 Not Specified Not Specified IS : 3025 (P-17) 4 T. Hardness as
CaCO3
mg/L 290 300 600 APHA 20th ed.
5 Iron as Fe mg/L 0.1 0.3 1.0 APHA 20th ed. 6 Chloride as Cl mg/L 38 250 1000 IS: 3025(P- 32) 7 Fluoride as F mg/L 0.44 1.0 1.5 IS: 3025(P- 23 ) 8 Calcium as Ca mg/L 61 75 200 IS: 3025(P- 40) 9 Magnesium as Mg mg/L 38 30 - IS: 3025(P- 46)
10 Sulphate as SO4 mg/L 82 200 400 IS: 3025(P- 24) 11 Nitrate as NO3 mg/L 0.8 45 100 IS: 3025(P- 34)

Project: “Imperial Estate “. M/s SPR Buildtech Limited, Sector-82 , Faridabad (Haryana) , Environmental Monitoring Report for the Month of June-2013. Page 9 of 16
ECOTECH SERVICES INC... Faridabad-121004 Page 9 of 16
S. No.
Parameter Unit Result Limits as per IS :10500 Test Methods
12 Arsenic as As mg/L ND 0.05 No Relaxation IS: 3025(P- 37) 13 Zinc as Zn mg/L ND 5 15 IS: 3025(P- 49) 14 BOD (3 days at 27oC) mg/L <5 Not Specified Not Specified IS: 3025 (P-44) 15 COD mg/L 8.0 Not Specified Not Specified APHA 20th ed.
(5220 B) 16 T. Alkalinity mg/L 361 200 600 IS: 3025(P- 29) 17 T. Coli form MPN/
100ml NIL 10 No Relaxation IS : 5401
2.4 Discussion on Groundwater Quality in the Study Area
All physico- chemical parameters of the ground water at project site is well within the permissible limits as per IS: 10500. The pH of groundwater sample is slightly alkaline (7.40) in nature.
3.0 AMBIENT AIR QUALITY MONITORING 3.1 Ambient Air Quality Monitoring Stations
One sampling stations were set up for monitoring of ambient air quality within the study area. The location of the monitoring station was selected so as to accord an overall idea of the ambient air quality scenario in the study area. The location of the monitoring stations was based on preliminary analysis of the meteorological conditions, particularly predominant/frequent wind directions. Logistic considerations such as accessibility, security, and availability of reliable power supply etc. were examined while finalizing the locations of such stations. The locations of the ambient air quality monitoring stations in the study area are given in Table 3.1.
Table 3.1 Details of Ambient Air Quality Monitoring Station.
S. No.
Locn. Code
Location Name/ Description Position w.r.t. Project Site Direction Distance (km)
1. AQ1 Project Site (Centre Point)
- 0
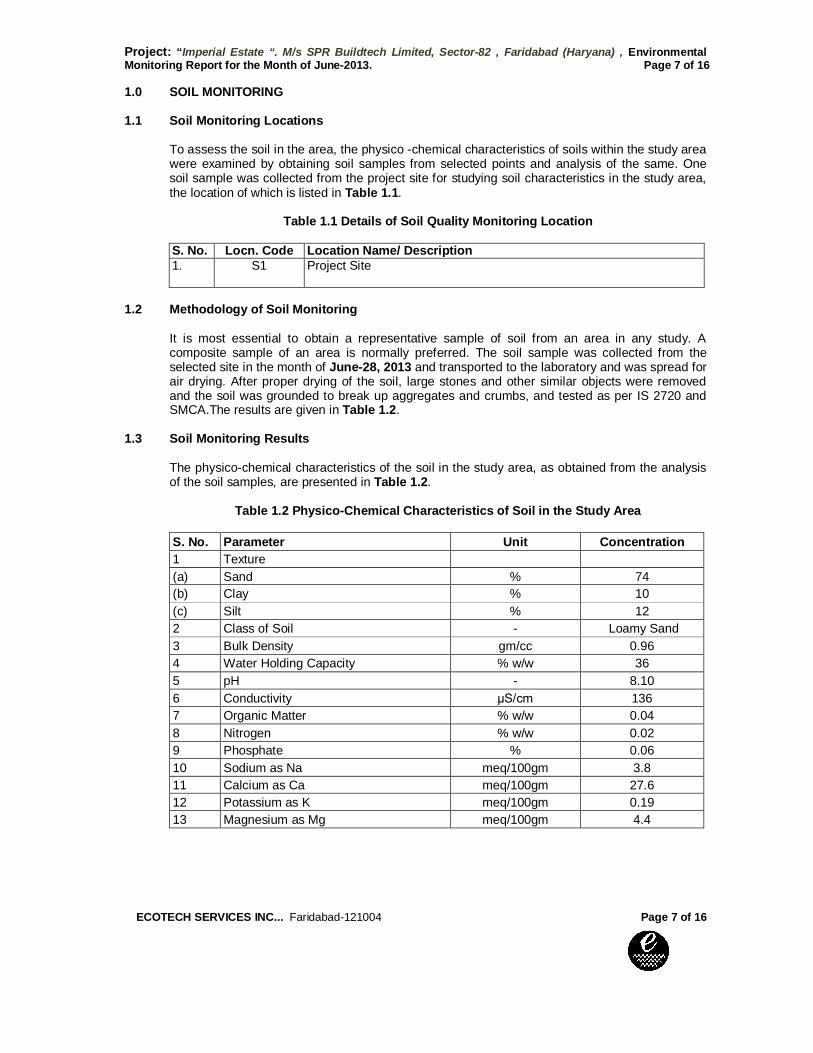
3.2 Ambient Air Quality Monitoring Methodology
Monitoring was conducted in respect of the following parameters: Particulate Matter (PM 10) Particulate Matter (PM 2.5) Sulphur Dioxide (SO2) Oxides of Nitrogen (NOx) Carbon Monoxide (CO) Respirable Dust Samplers and Fine Dust Samplers have been used to collect samples for PM (10) and PM (2.5) in ambient air at a flow rate of 1.2 m3/min. The ambient air was sucked through the cyclone and filter paper by a blower. Samples of gases were drawn at a flow rate of 0.5 liters per minute and were analyzed in the laboratory. Ambient air quality monitoring methodology is given in Table 3.2.
Project: “Imperial Estate “. M/s SPR Buildtech Limited, Sector-82 , Faridabad (Haryana) , Environmental Monitoring Report for the Month of June-2013. Page 10 of 16
ECOTECH SERVICES INC... Faridabad-121004 Page 10 of 16
Table 3.2 Methodology for Ambient Air Quality Monitoring
Parameter Measurement Methods As Per
PM10 Gravimetric IS:5182 Part-IV, 1999 PM 2.5 Gravimetric IS:5182 Part-IV, 1999
SO2 Colorimetric (EPA modified West & Gaeke Method) IS:5182 Part-II, 2001 NOx Colorimetric (Arsenite modified Jacobs & Hochheiser
Method) IS:5182 Part-VI, 2000
CO Non Dispersive Infra Red (NDIR) Spectroscopy Technique - 3.3 Ambient Air Quality Monitoring Results
The detailed on-site 24-hourly monitoring results of PM 10, PM 2.5, SO2 & NOx and 1-hourly CO corresponding to air quality station AQ1 is presented in Table 3.3.
Table 3.3 Detailed Ambient Air Quality Monitoring Results (24-hourly Average)
S. No.
Date DD/MM/YY
Locn. Code
Location PM 10 (g/m3)
PM 2.5 (g/m3)
SO2 (g/m3)
NOx (g/m3)
CO (mg/m
3) 1. 28/06/2013 AQ1 Project Site
84 55 17 24 0.90
3.4 Discussion on Ambient Air Quality in the Study Area
Monitoring station-wise statistical analysis (minimum, maximum, arithmetic mean) for measured levels of PM 10, PM 2.5, SO2, NOx & CO in study area for the monitoring period are shown parameter wise in Tables 3.4 to 3.8.
3.4.1 Particulate Matter (PM 10)
The overall mean of 24-hourly average values of PM 10 over the study area is 84 (g/m3) The PM 10 levels at the monitoring location was below the permissible limit of 100 g/m3 stipulated for residential, rural & other areas.
Table 3.4 Summary of PM 10 Levels Monitored in the Study Area
Locn. Code
Station Location Area Category
24-hourly Average PM 10 (g/m3) Results Limit
AQ1 Proposed Site Residential 84 100 3.4.2 Respirable Particulate Matter (RPM)
The overall mean of 24-hourly average values of PM 2.5 over the study area is 55 (g/m3) The PM 10 levels at the monitoring location was below the permissible limit of 60 g/m3 stipulated for residential, rural & other areas

Project: “Imperial Estate “. M/s SPR Buildtech Limited, Sector-82 , Faridabad (Haryana) , Environmental Monitoring Report for the Month of June-2013. Page 11 of 16
ECOTECH SERVICES INC... Faridabad-121004 Page 11 of 16
Table 3.5 Summary of PM 2.5 Levels Monitored in the Study Area
Locn. Code
Station Location Area Category
24-hourly Average PM 2.5 (g/m3) Results Limit
AQ1 Proposed Site Residential 55 60
3.4.3 Sulphur Dioxide (SO2)
The overall mean of 24-hourly average values of So2 over the study area is 17 (g/m3) The So2 levels at the monitoring location was below the permissible limit of 80 g/m3 stipulated for residential, rural & other areas.
Table 3.4 Summary of So2 Levels Monitored in the Study Area
Locn. Code
Station Location Area Category
24-hourly Average SO2 (g/m3) Results Limit
AQ1 Proposed Site Residential 17 80
3.4.4 Oxides of Nitrogen (NOx)
The overall mean of 24-hourly average values of NOx over the study area is 24 (g/m3) The NOx levels at the monitoring location was below the permissible limit of 80 g/m3 stipulated for residential, rural & other areas.
Table 3.4 Summary of NOx Levels Monitored in the Study Area
Locn. Code
Station Location Area Category
24-hourly Average NOx (g/m3) Results Limit
AQ1 Proposed Site Residential 24 80
3.4.5 Carbon monoxide (CO)
The overall mean of 8-hourly average values of CO over the study area is 0.90 (mg/m3) The CO levels at the monitoring location was below the permissible limit of 02mg/m3 stipulated for residential, rural & other areas.
Table 3.4 Summary of CO Levels Monitored in the Study Area
Locn. Code
Station Location Area Category
08-hourly Average CO (mg/m3) Results Limit
AQ1 Proposed Site Residential 0.90 02

Project: “Imperial Estate “. M/s SPR Buildtech Limited, Sector-82 , Faridabad (Haryana) , Environmental Monitoring Report for the Month of June-2013. Page 12 of 16
ECOTECH SERVICES INC... Faridabad-121004 Page 12 of 16
4.0 AMBIENT NOISE MONITORING 4.1 Ambient Noise Monitoring Locations
To assess the background noise levels in the study area ambient noise monitoring was conducted in the Project area from 28/06/2013 to 29/06/2013. One location within the study area (Near Main Gate of Project site) as indicated in Table 4.1 was selected for measurement of present status of ambient noise levels, covering commercial and residential areas.
Table 4.1 Details of Ambient Noise Monitoring Stations
S. No. Location
Code Location Name/ Description Present Landuse
1. N1 Project Site Commercial & residential mixed
4.2 Methodology of Noise Monitoring
Pulsar Data logger Noise Meter (Model 30) was used to monitor the noise levels. Noise level was monitored continuously for 24 hours with one hour interval. Noise level was measured in the form of Leq, Lday, Lnight, L10, L50, L90, Ldn, Lmax, Lmin.
4.3 Ambient Noise Monitoring Results The detailed location wise ambient noise monitoring results is presented in Table 4.2. The summary of ambient noise monitoring results is presented in Table 4.3.
Table 4.2 Ambient Noise Monitoring Results at Project Site
S.No. Leq (Day Time) Limits (CPCB) Leq (Night Time) Limits (CPCB) 01
52.8
65
42.2
55
4.3 Discussion on Ambient Noise Levels in the Study Area
Table 4.5 Summary of Ambient Noise Levels Monitored in the Study Area Locn.
Code Location Area Day Night
Cat Lmin Lmax Leq Limit Lmin Lmax Leq Limit
N1
Project Site
Res.&
Com 34.6
74.8
52.8
65
32.3
70.6
44.2
55.0
Area category: I-Industrial, C-Commercial, R-Residential, S-Silence zone Day time: 6.00 a.m. to 10.00 p.m. Night time: 10.00 p.m. to 6.00 a.m. Permissible ambient noise standards in dB(A):
Industrial Area : Day time: 75, Night time: 70 Commercial Area : Day time: 65, Night time: 55 Residential Area : Day time: 55, Night time: 45 Silence Zone : Day time: 50, Night time: 40

Project: “Imperial Estate “. M/s SPR Buildtech Limited, Sector-82 , Faridabad (Haryana) , Environmental Monitoring Report for the Month of June-2013. Page 13 of 16
ECOTECH SERVICES INC... Faridabad-121004 Page 13 of 16

Project: “Imperial Estate “. M/s SPR Buildtech Limited, Sector-82 , Faridabad (Haryana) , Environmental Monitoring Report for the Month of June-2013. Page 14 of 16
ECOTECH SERVICES INC... Faridabad-121004 Page 14 of 16

Project: “Imperial Estate “. M/s SPR Buildtech Limited, Sector-82 , Faridabad (Haryana) , Environmental Monitoring Report for the Month of June-2013. Page 15 of 16
ECOTECH SERVICES INC... Faridabad-121004 Page 15 of 16
NDIAN STANDARD DRINKING WATER SPECIFICATION ( BIS 10500 : 1991 )
Sl.No Substance or Characteristic Requirement (Desirable Limit)
Permissible Limit in the absence of Alternate source
Essential characteristics 1. Colour, ( Hazen units, Max ) 5 25 2. Odour Unobjectonable Unobjectionable 3. Taste Agreeable Agreeable
4. Turbidity ( NTU, Max) 5 10 5. pH Value 6.5 to 8.5 No Relaxsation
6. Total Hardness (as CaCo3) mg/lit.,Max 300 600
7. Iron (as Fe) mg/lit,Max 0.3 1.0
8. Chlorides (as Cl) mg/lit,Max. 250 1000 9. Residual,free chlorine,mg/lit,Min 0.2 -- Desirable Characteristics 10. Dissolved solids mg/lit,Max 500 2000 11. Calcium (as Ca) mg/lit,Max 75 200
12. Copper (as Cu) mg/lit,Max 0.05 1.5 13 Manganese (as Mn)mg/lit,Max 0.10 0.3 14 Sulfate(as SO4) mg/lit,Max 200 400
15 Nitrate (as NO3) mg/lit,Max 45 100
16 Fluoride (as F) mg/lit,Max 1.9 1.5
17 Phenolic CompoundsC 6 H5OH)mg/lit, Max.
0.001 0.002
18 Mercury (as Hg)mg/lit,Max 0.001 No relaxation
19 Cadmiun (as Cd)mg/lit,Max 0.01 No relaxation 20 Selenium (as Se)mg/lit,Max 0.01 No relaxation
21 Arsenic (as As) mg/lit,Max 0.05 No relaxation
22 Cyanide (as CN) mg/lit,Max 0.05 No relaxation 23 Lead (as Pb) mg/lit,Max 0.05 No relaxation
24 Zinc (as Zn) mg/lit,Max 5 15 25 Anionic detergents (as MBAS)
mg/lit,Max 0.2 1.0

Project: “Imperial Estate “. M/s SPR Buildtech Limited, Sector-82 , Faridabad (Haryana) , Environmental Monitoring Report for the Month of June-2013. Page 16 of 16
ECOTECH SERVICES INC... Faridabad-121004 Page 16 of 16
26 Chromium (as Cr6+)mg/lit,Max 0.05 No relaxation
27 Polynuclear aromatic hydro carbons (as PAH) g/lit,Max
-- --
28 Mineral Oil mg/lit,Max 0.01 0.03 29 Pesticides mg/l, Max Absent 0.001 30 Radioactive Materials
i. Alpha emitters Bq/l,Max -- 0.1
ii. Beta emitters pci/l,Max -- 1.0
31 Alkalinity mg/lit.Max 200 600 32 Aluminium(as Al) mg/l,Max 0.03 0.2
33 Boron mg/lit,Max 1 5


![CHAPTER 3 ENVIRONMENTAL COMPLIANCE …nromoef.gov.in/SMPR/12012016/2.pdfDEC. 2015 [[SIX MONTHLY COMPLIANCE REPORT OF GROUP HOUSING PROJECT AT SECTOR 77, GURGAON, HARYANA]] M/s JANPRIYA](https://static.fdocuments.us/doc/165x107/5b01e2607f8b9af1148ed7bd/chapter-3-environmental-compliance-2015-six-monthly-compliance-report-of.jpg)