
Energy Paths in Region and Using of Renewable Sources Conference 19 October 2012, Belgrade, Serbia
13
ENTSO-E’s Network Development Plans and Network Codes: How a strong European grid supports security of supply, affordable electricity prices through market integration, and sustainability through integration of renewable energy KONSTANTIN STASCHUS Secretary-General ENTSO-E Energy Paths in Region and Using of Renewable Sources Conference 19 October 2012, Belgrade, Serbia
description
ENTSO-E’s Network Development Plans and Network Codes: How a strong European grid supports security of supply, affordable electricity prices through market integration, and sustainability through integration of renewable energy KONSTANTIN STASCHUS Secretary-General ENTSO-E. - PowerPoint PPT Presentation
Transcript of Energy Paths in Region and Using of Renewable Sources Conference 19 October 2012, Belgrade, Serbia

ENTSO-E’s Network Development Plans
and Network Codes: How a strong European grid supports security of supply,
affordable electricity prices through market integration, and sustainability through integration of renewable energy
KONSTANTIN STASCHUSSecretary-General
ENTSO-E
Energy Paths in Region and Using of Renewable Sources Conference
19 October 2012, Belgrade, Serbia

Key activities set out in Regulation 714/2009 (on cross-border electricity trade, part of the 3rd IEM Package)
•Deliver network codes binding to all network users (through ‘Comitology’)
•Deliver network plans European / regional view of system needs (“TYNDP”)
•Deliver crucial aspects of market integration (“market coupling”)
•R&D Plan
Recent important work products:
• First 2 Network Codes on Requirements for Generators, Capacity Allocation and Congestion Mgt delivered for ACER Opinion – prerequisite for future system with more RES
• TYNDP 2012 incl. major improvements in methods, data
Introduction: TSOs’ and ENTSO-E’s significant role for European energy and climate change objectives
41 TSOs from 34 countries;530 million people; 910 GW gen.; 300 000 km transm.
41 TSOs from 34 countries;530 million people; 910 GW gen.; 300 000 km transm.
Energy paths conference Belgrade 19 Oct. 2012 | Konstantin Staschus | Page 2

Current and future challenges: a fast changing energy mix
Huge flows all over Europe total
PV
wind
2000
total
PV
wind
2010
total
PV
wind
2020
From a few large plantsThousands of small units
Offshore
Onshore
Today
2020: 230 GW
2030: 400 GW
Wind share of demand: 2010 = 5,3% 2020 = 23% 2030 = 36%
TWh
40 GW
150 GW
190 GW 250 GW
Energy paths conference Belgrade 19 Oct. 2012 | Konstantin Staschus | Page 3

More fluctuating RES, more distributed gen., more pan-European markets, planning + operational coordination
eHIGHWAY 2050 study: strong con-
sortium, 3 years
80-95% reduction in greenhouse gases; higher reduction for electricity
2012320 GW RES 538 GW peak load 3300 TWh demand
2020 – TYNDP 2012536 GW RES 567 GW peak load3600 TWh demand
2030 visions
– 2014
TYNDP
Change is at the core of transmission planning
However scale and speed of change in recent years is unprecedented
Share of total RES in net gen. capac. 1/2020, scen. EU2020
>50%
<45%
Energy paths conference Belgrade 19 Oct. 2012 | Konstantin Staschus | Page 4

Context & framework for infrastructure investment: Target model and Network Codes
• ENTSO-E Network Codes are a fundamental tool to achieve a single European market
• Market Network Codes will translate the target model into rules for implementation
• European directives and regulations define key principles and goals of the EU Energy System
• A Target Model for the IEM has been defined and now needs implementation
Energy paths conference Belgrade 19 Oct. 2012 | Konstantin Staschus | Page 5

Context & framework for infrastructure investment: NWE Market Coupling…
Status - Current day ahead market coupling
2013 – NWE Day-ahead market coupling
One common
matching
On-going process…
Further Market Integration will deliver a Single European Market not only for Day-Ahead but also for Intraday, Forwards and Balancing
An integrated NWE market for 2300TWh
Energy paths conference Belgrade 19 Oct. 2012 | Konstantin Staschus | Page 6
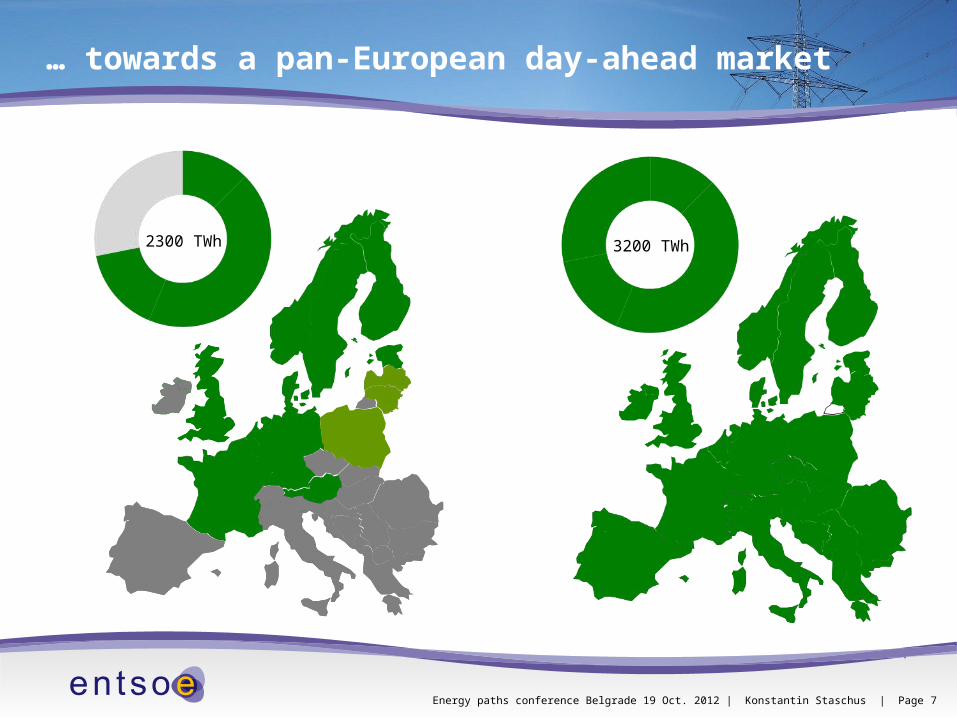
… towards a pan-European day-ahead market
3200 TWh2300 TWh
Energy paths conference Belgrade 19 Oct. 2012 | Konstantin Staschus | Page 7

Security of Supply:
21.900 km
Internal Energy Market:
18.200 km
Renewable Energy Sources
Integration: 44.700 km
TYNDP 2012: A stronger grid to answer major challenges, jointly planned by all TSOs within ENTSO-E
Europe-wide 52 300 km:
Energy paths conference Belgrade 19 Oct. 2012 | Konstantin Staschus | Page 8
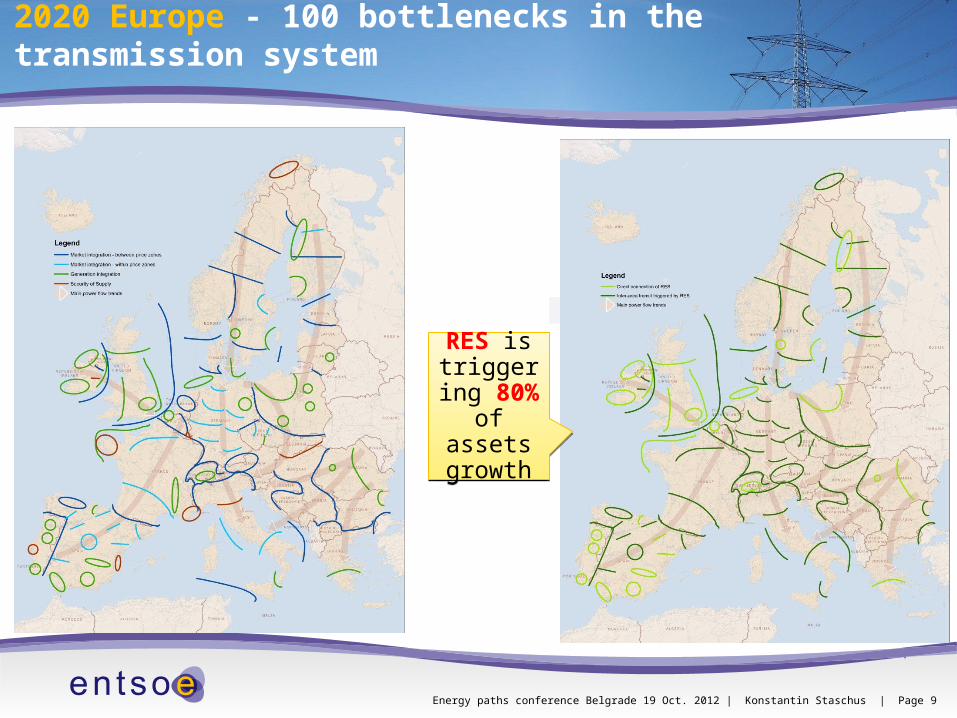
2020 Europe - 100 bottlenecks in the transmission system
RES is triggering 80% of assets growth
RES is triggering 80% of assets growth
Energy paths conference Belgrade 19 Oct. 2012 | Konstantin Staschus | Page 9
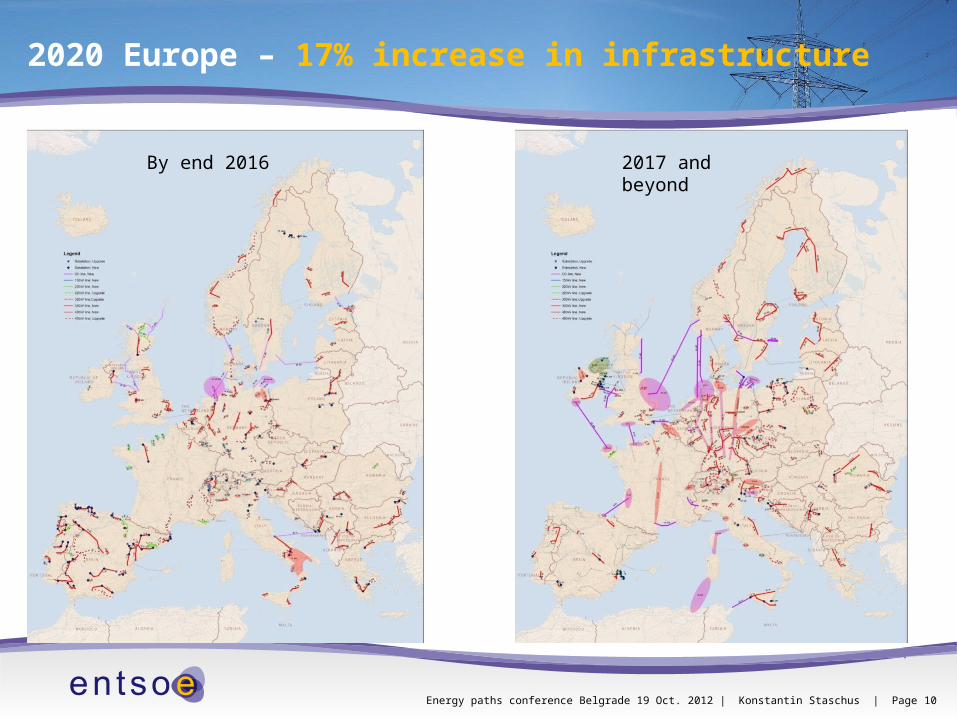
2020 Europe – 17% increase in infrastructure
By end 2016 2017 and beyond
Energy paths conference Belgrade 19 Oct. 2012 | Konstantin Staschus | Page 10

One key driver for joint transmission planning: European market studies
Color Code Exchanges < 1 TWh < 5 TWh < 10 TWh > 10 TWh
Country balancesimporterrather balancedexporter
• 5% of generating costs
saved by new
interconnection
• Direct connection for 125
GW RES
• - 170 Mt/y CO2
emissions savings
• 52.300 km additional
transmission lines
Thousands of possible situations and overall social economic welfare
assessed via market studies
Energy paths conference Belgrade 19 Oct. 2012 | Konstantin Staschus | Page 11

Summary
Summary
Energy paths conference Belgrade 19 Oct. 2012 | Konstantin Staschus | Page 12

Thank you very much for your attention!
www.entsoe.eu general web sitewww.entsoe.net transparency platform