Energy - Norsk Hydro · Energy has a dual mission in Hydro Strong, sustainable value creator and...
25
Energy Arvid Moss Capital Markets Day 2015
-
Upload
nguyentram -
Category
Documents
-
view
214 -
download
0
Transcript of Energy - Norsk Hydro · Energy has a dual mission in Hydro Strong, sustainable value creator and...
EnergyArvid Moss
Capital Markets Day 2015
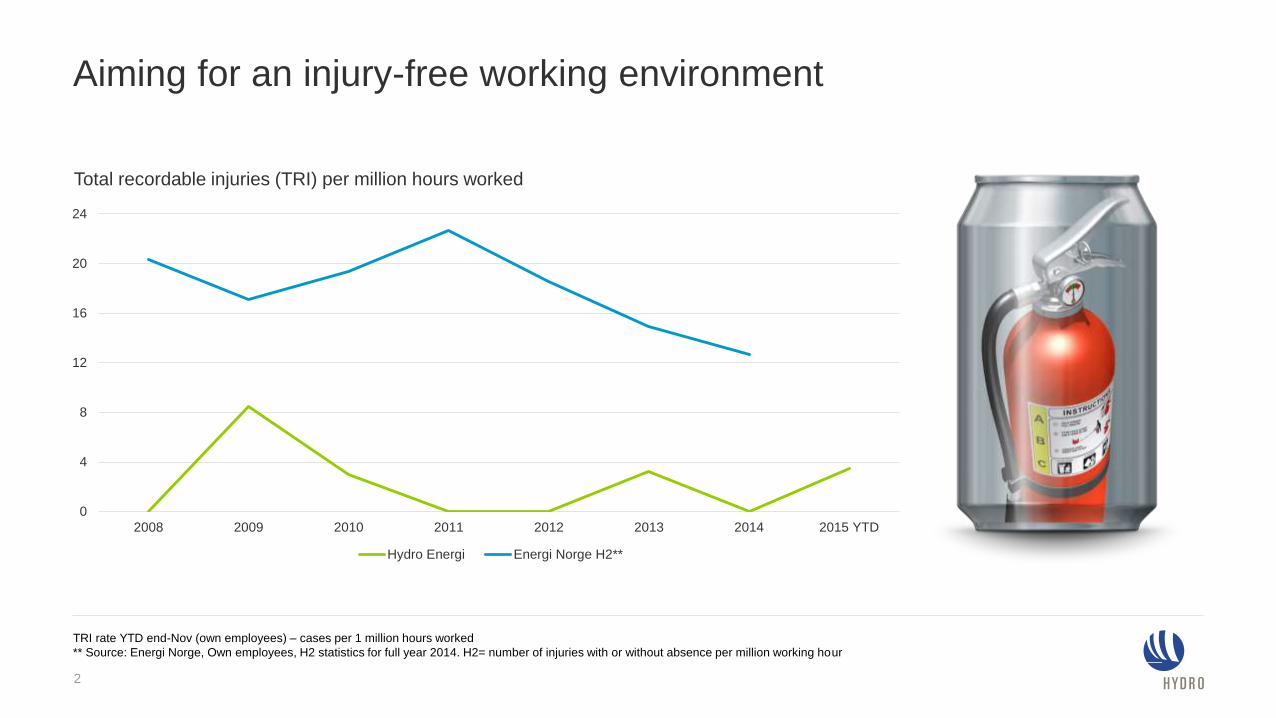
Aiming for an injury-free working environment
2
0
4
8
12
16
20
24
2008 2009 2010 2011 2012 2013 2014 2015 YTD
Hydro Energi Energi Norge H2**
Total recordable injuries (TRI) per million hours worked
TRI rate YTD end-Nov (own employees) – cases per 1 million hours worked
** Source: Energi Norge, Own employees, H2 statistics for full year 2014. H2= number of injuries with or without absence per million working hour
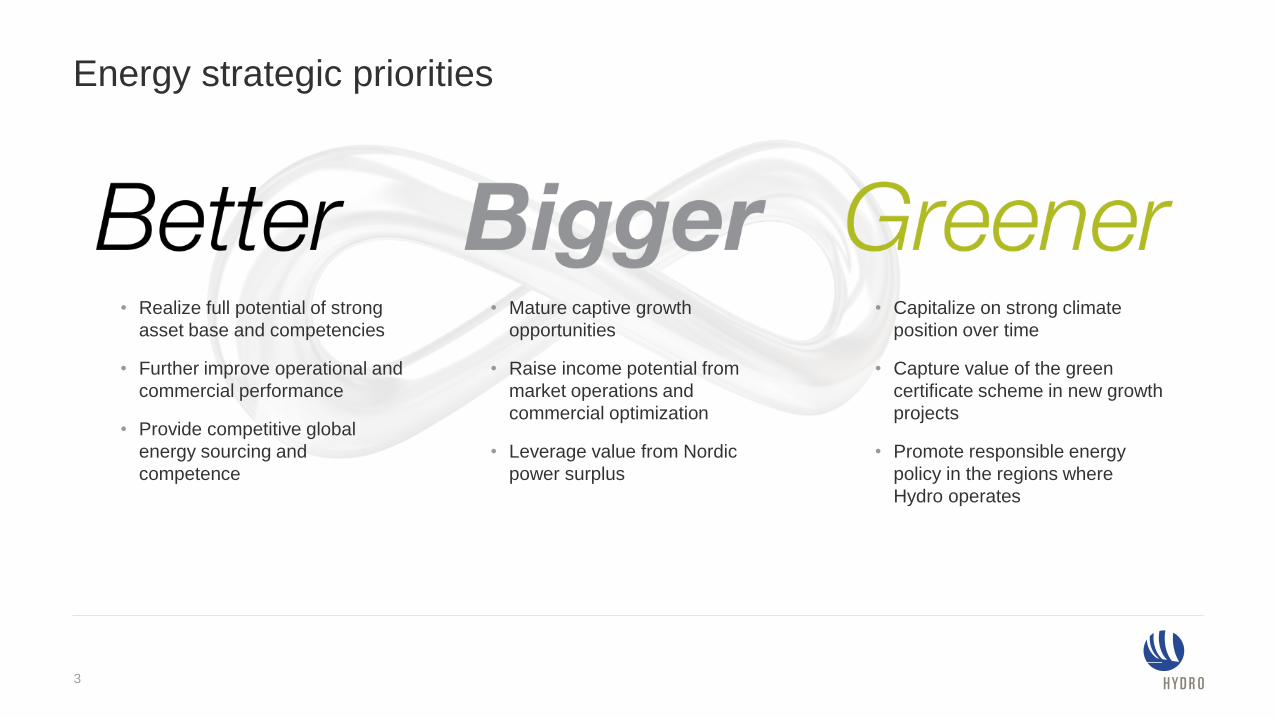
Energy strategic priorities
• Realize full potential of strong
asset base and competencies
• Further improve operational and
commercial performance
• Provide competitive global
energy sourcing and
competence
• Capitalize on strong climate
position over time
• Capture value of the green
certificate scheme in new growth
projects
• Promote responsible energy
policy in the regions where
Hydro operates
• Mature captive growth
opportunities
• Raise income potential from
market operations and
commercial optimization
• Leverage value from Nordic
power surplus
3

Energy has a dual mission in HydroStrong, sustainable value creator and energy provider throughout the value chain
To own, operate and maximize
value of Hydro’s energy assets
To provide competitive power sourcing
and global energy competence
4

CMD
2014
CMD
2015
Energy: Securing power supply, maximizing asset value
Signed a power contract with
Lyse, Norway
JunFeb Sep
Hearing released on industrial
ownership
Signed power contracts
with Eidsiva and BKK,
Norway
Signed a power contract
with Axpo, Norway
Nov
Incorporated Norsk Hydro
Energia Ltda. in Brazil
Signed a power
contract for Neuss
smelter, Germany
Alouette agreed on terms
for new power contract,
Canada
Mar Jul
Signed 2016 power
contracts for B&A
Rjukan upgrade
completed
Build decision on small
hydropower plants
5
Power Markets
016

Nordic power prices decline over the last yearsDownward trend also reflected in forward curve
0
10
20
30
40
50
60
2000 2001 2002 2003 2004 2005 2005 2006 2007 2008 2009 2010 2010 2011 2012 2013 2014 2015 2015 2016 2017 2018 2019 2020 2020 2021 2022 2023
EUR / MWh
Historical systemprice Nordpool Forward Market Nov 2010 Nordpool Forward Market Nov 2014 Nordpool Forward Market Nov 2015
Source: Nordpool Spot
Prices expressed in yearly averages
7
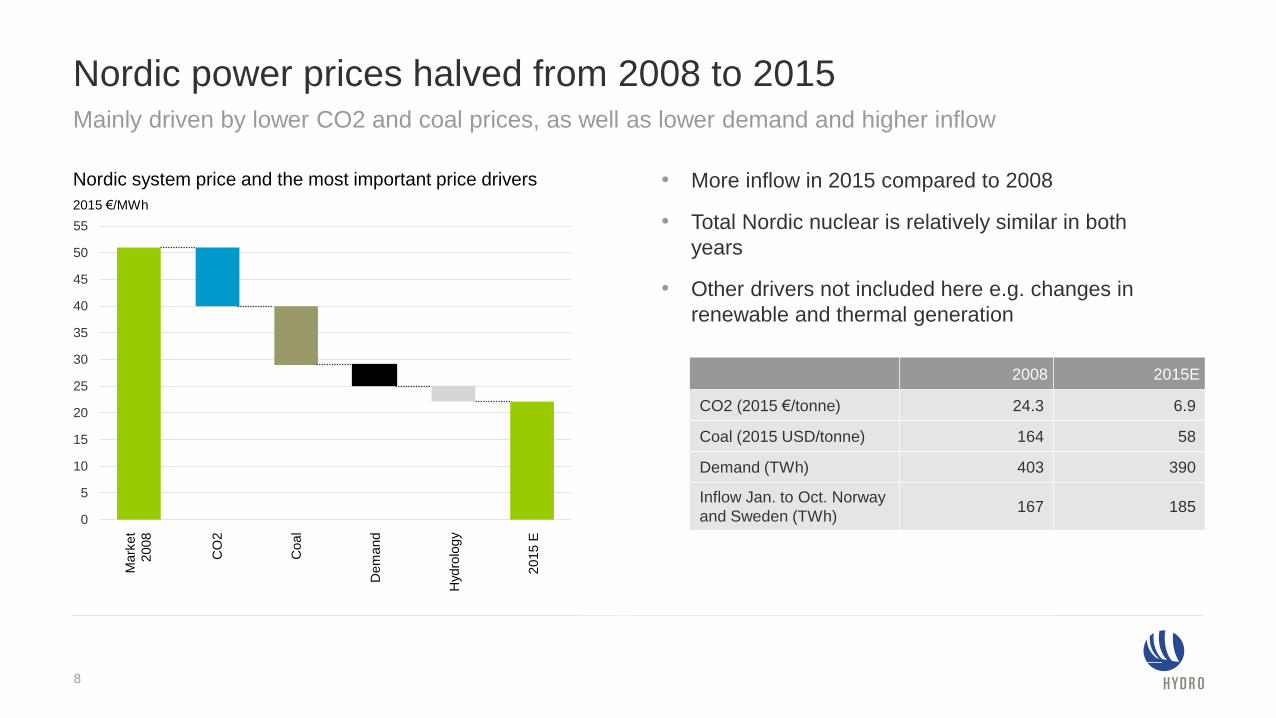
Nordic power prices halved from 2008 to 2015
• More inflow in 2015 compared to 2008
• Total Nordic nuclear is relatively similar in both
years
• Other drivers not included here e.g. changes in
renewable and thermal generation
Mainly driven by lower CO2 and coal prices, as well as lower demand and higher inflow
Nordic system price and the most important price drivers
2008 2015E
CO2 (2015 €/tonne) 24.3 6.9
Coal (2015 USD/tonne) 164 58
Demand (TWh) 403 390
Inflow Jan. to Oct. Norway
and Sweden (TWh)167 185
0
5
10
15
20
25
30
35
40
45
50
55
2015 €/MWh
Mark
et
2008
CO
2
Coal
Dem
and
2015 E
Hydro
log
y
8
0
5
10
15
20
25
30
35
40
45
50
55
60
65
70
75
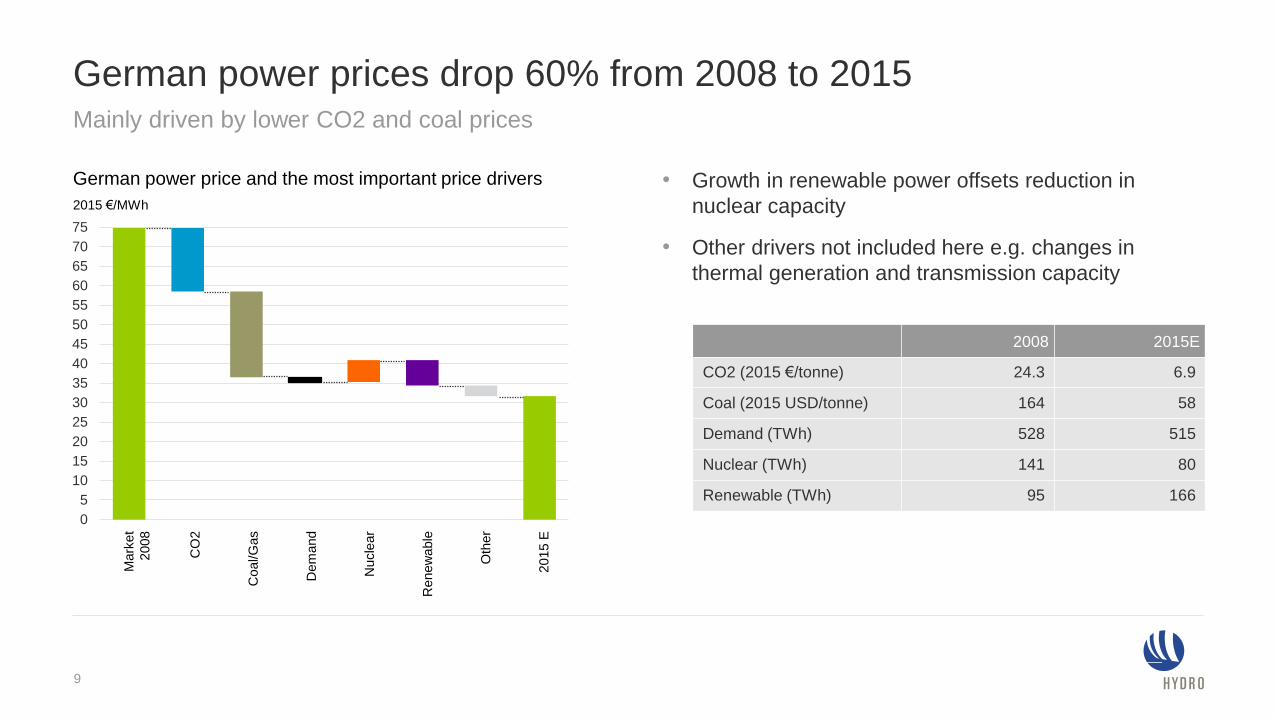
German power prices drop 60% from 2008 to 2015
• Growth in renewable power offsets reduction in
nuclear capacity
• Other drivers not included here e.g. changes in
thermal generation and transmission capacity
Mainly driven by lower CO2 and coal prices
German power price and the most important price drivers
2008 2015E
CO2 (2015 €/tonne) 24.3 6.9
Coal (2015 USD/tonne) 164 58
Demand (TWh) 528 515
Nuclear (TWh) 141 80
Renewable (TWh) 95 166
Dem
and
Coal/G
as
CO
2
Mark
et
2008
Renew
able
Oth
er
2015 E
Nucle
ar
2015 €/MWh
9

0
100
200
300
400
500
600
700
0
100
200
300
400
500
600
Jan/08 Jan/10 Jan/12 Jan/14
Import Wind Nuclear Thermal
Hydro Normal hydro Demand Price (PLD)
Interconnected Brazilian hydropower-based systemThermal power has increased in importance during recent dry years
Brazilian power balance and price developmentTWh BRL/MWh
Interconnected power system, Brazil
10
N
NE
SE
S
Belo Monte
Rio Madeira Teles Pires
*Source: ONS, EPE, ANEEL.

Energy in Hydro
0211

Value creation in Energy dependent on wide array of factors
Power
Price
Expiring
and new
contracts
Sustaining
CAPEX
OPEX &
taxes
CAPEX and
Earnings for
new GWh
Commercial
and operational
competence
Volume
Drivers
12
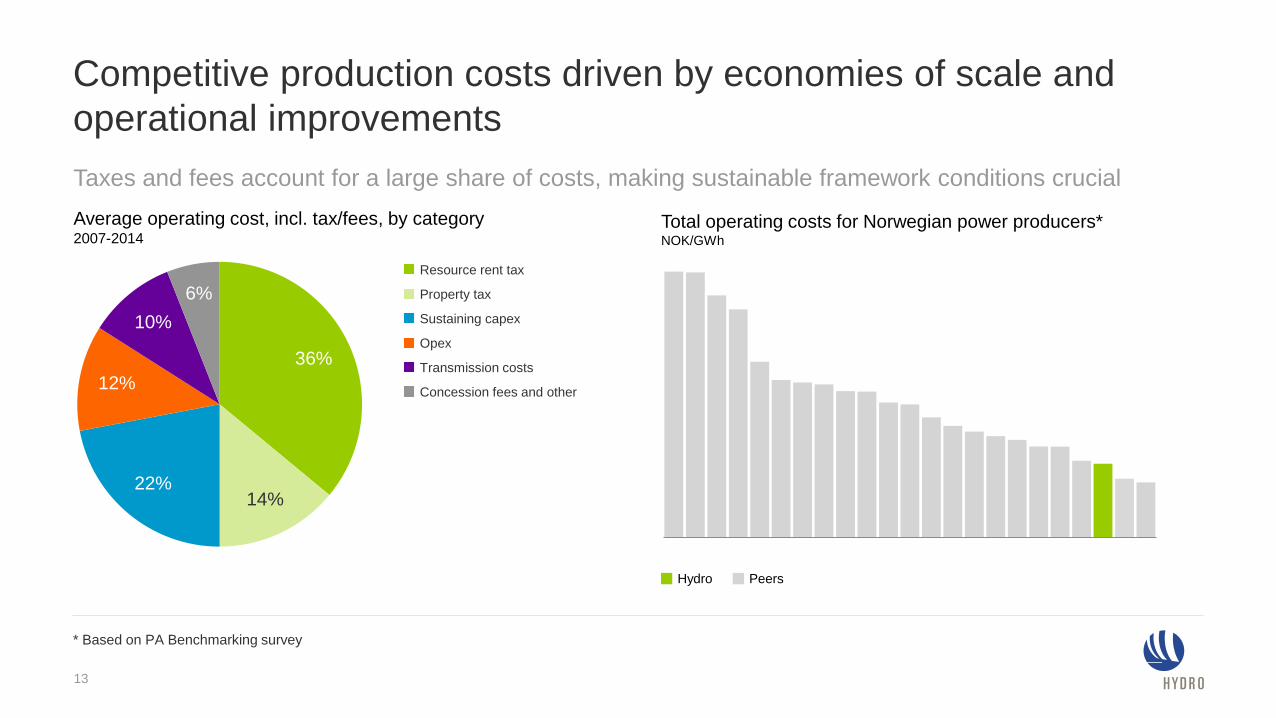
Competitive production costs driven by economies of scale and
operational improvements
Taxes and fees account for a large share of costs, making sustainable framework conditions crucial
Total operating costs for Norwegian power producers*NOK/GWh
Hydro Peers
14%
6%
10%
22%
36%
12%
Property tax
Concession fees and other
Transmission costs
Sustaining capex
Resource rent tax
Opex
Average operating cost, incl. tax/fees, by category2007-2014
13
* Based on PA Benchmarking survey
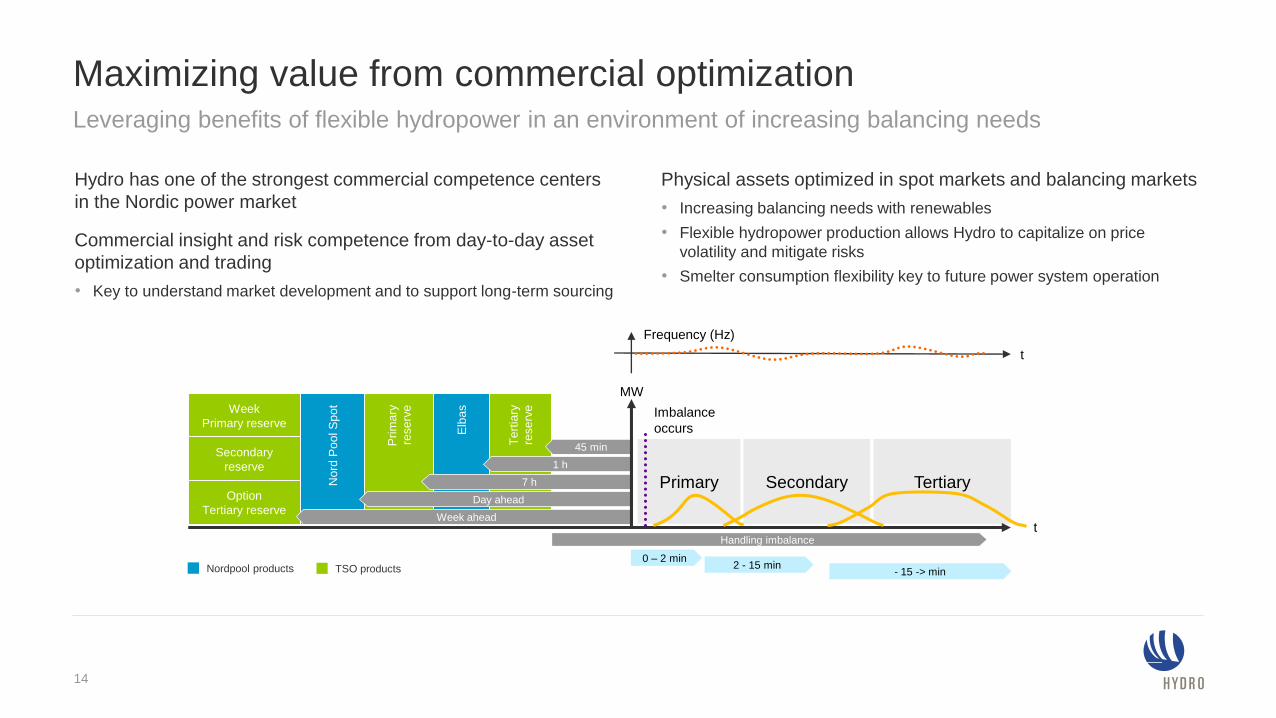
Primary Secondary Tertiary
Maximizing value from commercial optimization
Week
Primary reserve
Secondary
reserve
Option
Tertiary reserve
Nord
Po
ol S
po
t
Elb
as
Pri
ma
ry
rese
rve
Te
rtia
ry
rese
rve
Week ahead
Day ahead
1 h
7 h
45 min
MW
t
Frequency (Hz)
t
0 – 2 min2 - 15 min
- 15 -> min
Handling imbalance
Imbalance
occurs
TSO productsNordpool products
Leveraging benefits of flexible hydropower in an environment of increasing balancing needs
Hydro has one of the strongest commercial competence centers
in the Nordic power market
Commercial insight and risk competence from day-to-day asset
optimization and trading
• Key to understand market development and to support long-term sourcing
Physical assets optimized in spot markets and balancing markets
• Increasing balancing needs with renewables
• Flexible hydropower production allows Hydro to capitalize on price
volatility and mitigate risks
• Smelter consumption flexibility key to future power system operation
14
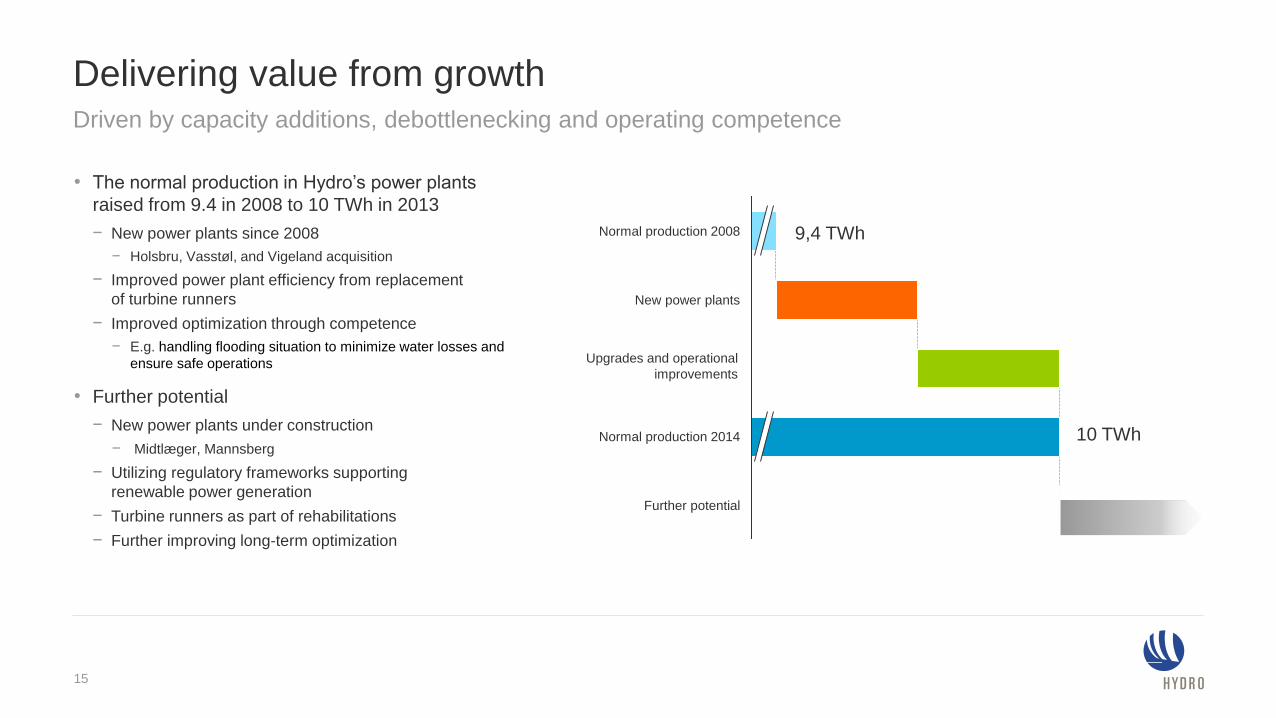
Delivering value from growthDriven by capacity additions, debottlenecking and operating competence
• The normal production in Hydro’s power plants
raised from 9.4 in 2008 to 10 TWh in 2013
− New power plants since 2008
− Holsbru, Vasstøl, and Vigeland acquisition
− Improved power plant efficiency from replacement
of turbine runners
− Improved optimization through competence
− E.g. handling flooding situation to minimize water losses and
ensure safe operations
• Further potential
− New power plants under construction
− Midtlæger, Mannsberg
− Utilizing regulatory frameworks supporting
renewable power generation
− Turbine runners as part of rehabilitations
− Further improving long-term optimization
New power plants
Normal production 2008
Further potential
Normal production 2014
Upgrades and operational
improvements
9,4 TWh
10 TWh
15
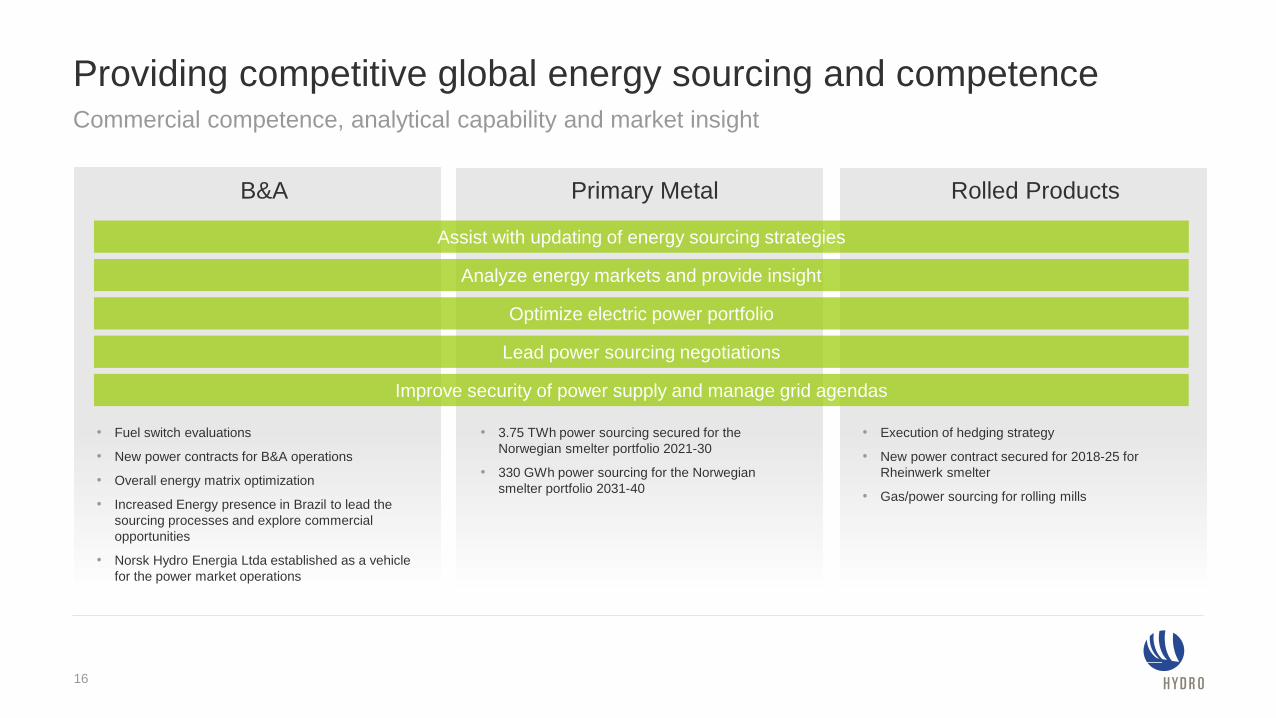
Providing competitive global energy sourcing and competence Commercial competence, analytical capability and market insight
• Execution of hedging strategy
• New power contract secured for 2018-25 for
Rheinwerk smelter
• Gas/power sourcing for rolling mills
• 3.75 TWh power sourcing secured for the
Norwegian smelter portfolio 2021-30
• 330 GWh power sourcing for the Norwegian
smelter portfolio 2031-40
• Fuel switch evaluations
• New power contracts for B&A operations
• Overall energy matrix optimization
• Increased Energy presence in Brazil to lead the
sourcing processes and explore commercial
opportunities
• Norsk Hydro Energia Ltda established as a vehicle
for the power market operations
Lead power sourcing negotiations
Assist with updating of energy sourcing strategies
Analyze energy markets and provide insight
B&A Primary Metal Rolled Products
Optimize electric power portfolio
Improve security of power supply and manage grid agendas
16
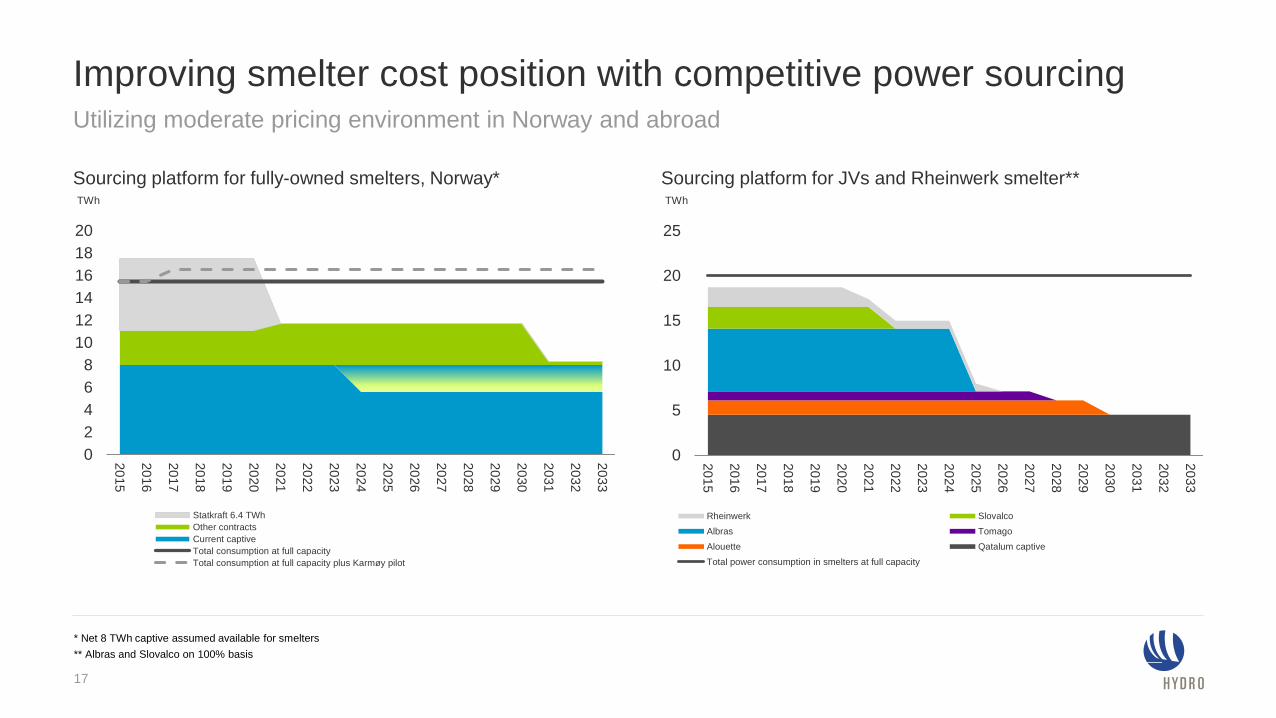
Improving smelter cost position with competitive power sourcing
0
2
4
6
8
10
12
14
16
18
20
20
15
20
16
20
17
20
18
20
19
20
20
20
21
20
22
20
23
20
24
20
25
20
26
20
27
20
28
20
29
20
30
20
31
20
32
20
33
TWh
Statkraft 6.4 TWh
Other contracts
Current captive
Total consumption at full capacity
Total consumption at full capacity plus Karmøy pilot
Utilizing moderate pricing environment in Norway and abroad
* Net 8 TWh captive assumed available for smelters
0
5
10
15
20
25
20
15
20
16
20
17
20
18
20
19
20
20
20
21
20
22
20
23
20
24
20
25
20
26
20
27
20
28
20
29
20
30
20
31
20
32
20
33
TWh
Rheinwerk Slovalco
Albras Tomago
Alouette Qatalum captive
Total power consumption in smelters at full capacity
** Albras and Slovalco on 100% basis
Sourcing platform for fully-owned smelters, Norway* Sourcing platform for JVs and Rheinwerk smelter**
17

Industrial ownership
framework for RSK
assets
0318

Telemark
2044-2049
0.5
3.1
3.2
3.0
0.2
Sogn
2051-2057
Røldal-Suldal
2022*
Vigeland
Bubble size = production in TWh
* Reversion year
Subject to reversion
No reversion
Sunndal
Sogn
Telemark
Røldal-
Suldal
NTE
Trønder
Energi
Tafjord
SFE
BKK
SKL
Lyse
Høyanger
Karmøy
Østfold
Energi
Årdal
Agder
Vigeland
Skagerak
EidsivaE-co
Hafslund
Power production
Smelters
Husnes
19
Norwegian reversion regimePrivate ownership not to exceed 1/3 in Norwegian waterfalls
Hydro’s hydropower assetsRegional hydropower producers in Norway
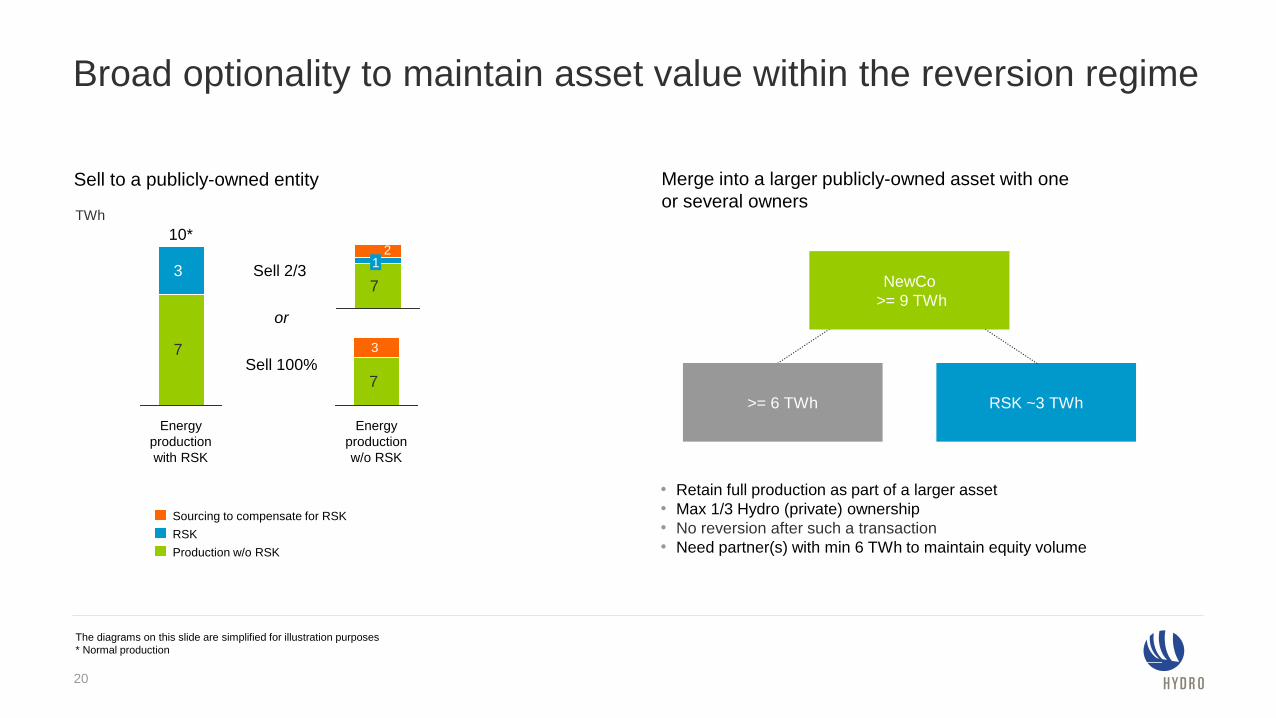
Sell to a publicly-owned entity Merge into a larger publicly-owned asset with one
or several owners
7
3
Energy
production
with RSK
10*
7
21
7
3
Energy
production
w/o RSK
Sell 2/3
Sell 100%
RSK ~3 TWh
NewCo
>= 9 TWh
>= 6 TWh
• Retain full production as part of a larger asset
• Max 1/3 Hydro (private) ownership
• No reversion after such a transaction
• Need partner(s) with min 6 TWh to maintain equity volume
or
Production w/o RSK
Sourcing to compensate for RSK
RSK
The diagrams on this slide are simplified for illustration purposes
* Normal production
TWh
Broad optionality to maintain asset value within the reversion regime
20
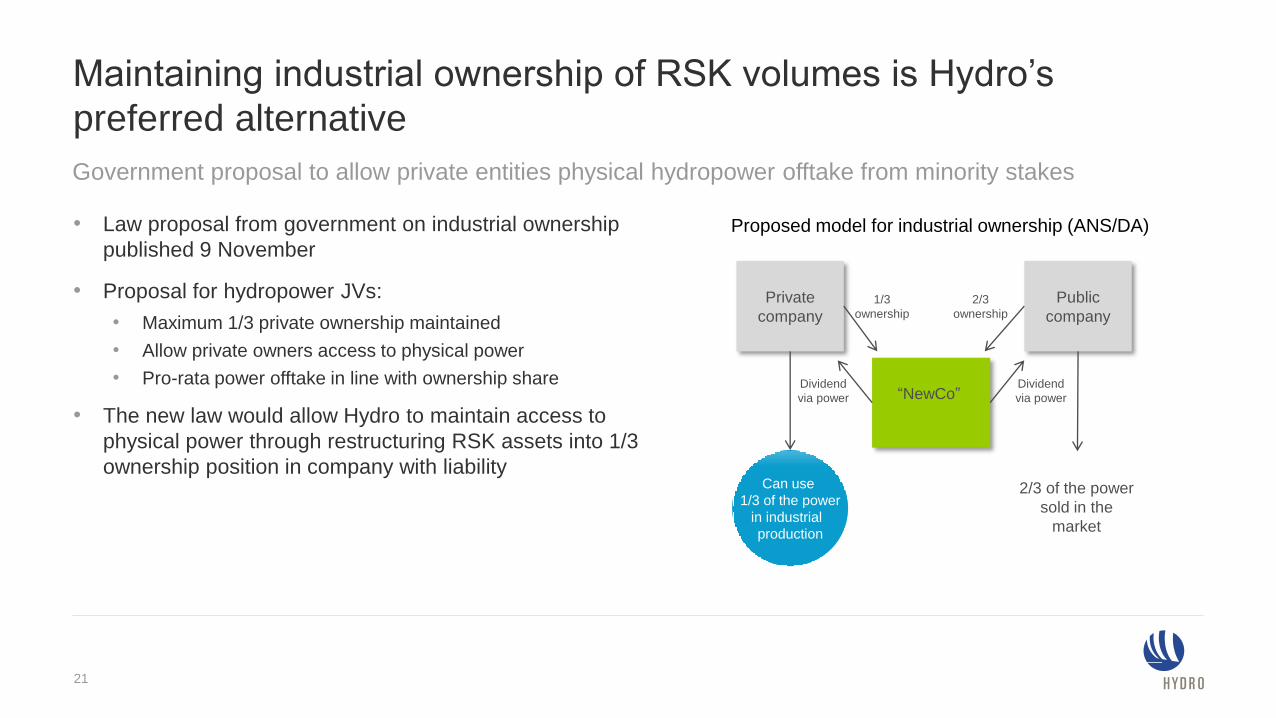
Maintaining industrial ownership of RSK volumes is Hydro’s
preferred alternative
• Law proposal from government on industrial ownership
published 9 November
• Proposal for hydropower JVs:
• Maximum 1/3 private ownership maintained
• Allow private owners access to physical power
• Pro-rata power offtake in line with ownership share
• The new law would allow Hydro to maintain access to
physical power through restructuring RSK assets into 1/3
ownership position in company with liability
Government proposal to allow private entities physical hydropower offtake from minority stakes
“NewCo”
Private
company
Public
company1/3
ownership
2/3
ownership
Dividend
via power
Dividend
via power
Can use
1/3 of the power
in industrial
production
2/3 of the power
sold in the
market
Proposed model for industrial ownership (ANS/DA)
21
Sustainability and
climate agenda
0422
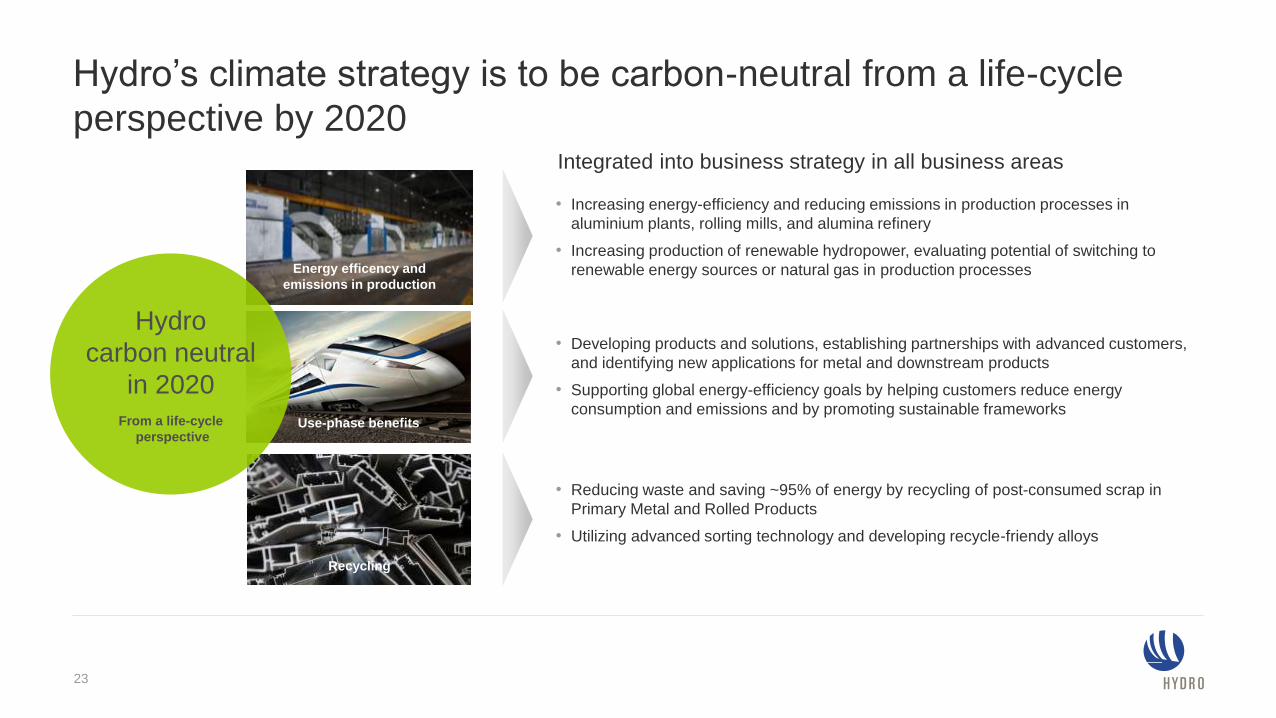
Integrated into business strategy in all business areas
• Increasing energy-efficiency and reducing emissions in production processes in
aluminium plants, rolling mills, and alumina refinery
• Increasing production of renewable hydropower, evaluating potential of switching to
renewable energy sources or natural gas in production processes
• Developing products and solutions, establishing partnerships with advanced customers,
and identifying new applications for metal and downstream products
• Supporting global energy-efficiency goals by helping customers reduce energy
consumption and emissions and by promoting sustainable frameworks
• Reducing waste and saving ~95% of energy by recycling of post-consumed scrap in
Primary Metal and Rolled Products
• Utilizing advanced sorting technology and developing recycle-friendy alloys
Energy efficency and
emissions in production
Use-phase benefits
Hydro’s climate strategy is to be carbon-neutral from a life-cycle
perspective by 2020
23
Recycling
Hydro
carbon neutral
in 2020
From a life-cycle
perspective

Gradual reduction in life-cycle carbon balance towards 2020Use-phase benefits of aluminium products have the largest effect
24
Life-cycle carbon-neutral ambition
On track
Hydro’s carbon balance 2014 - 2020
Million tonnes CO2
-1
-0.5
0
0.5
1
1.5
2
2.5
3
Balance 2014 Emissions
increase
2020
Net emissions/user
benefits. Increased
Norwegian production
Increased
recycling
Increased user
benefits - more
sales to automotive
Timeframe
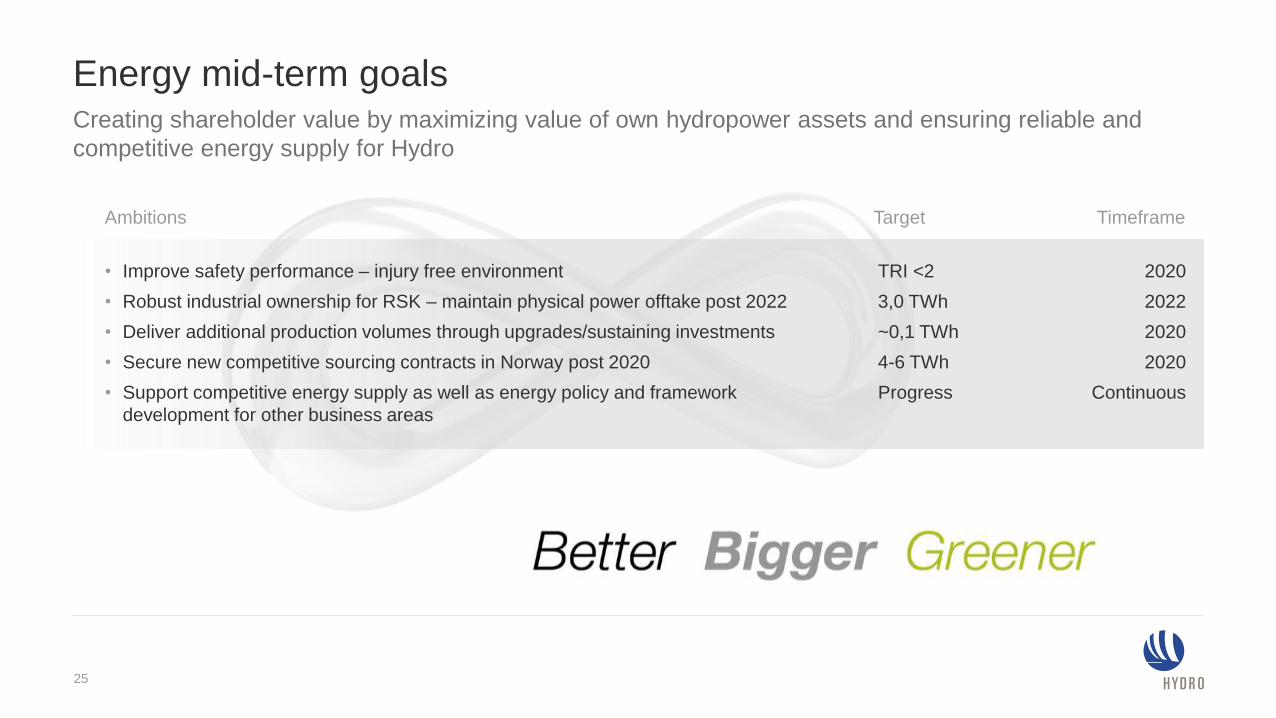
• Improve safety performance – injury free environment
• Robust industrial ownership for RSK – maintain physical power offtake post 2022
• Deliver additional production volumes through upgrades/sustaining investments
• Secure new competitive sourcing contracts in Norway post 2020
• Support competitive energy supply as well as energy policy and framework
development for other business areas
TRI <2
3,0 TWh
~0,1 TWh
4-6 TWh
Progress
2020
2022
2020
2020
Continuous
Ambitions Target
Energy mid-term goalsCreating shareholder value by maximizing value of own hydropower assets and ensuring reliable and
competitive energy supply for Hydro
25