

1 EERE Communications EERE Web Coordinators Meeting 8/20/2015.

DOE OFFICE OF INDIAN ENERGY
EERE Technologies for Alaska Day 1 Bethel, Dillingham & Juneau March 23 to April 1, 2015
EERE TECHNOLOGY SUMMARY
2
Technology Videos
3
DOE’s Energy Efficiency and Renewable Energy (EERE) Technology Videos: EERE video library: http://energy.gov/eere/videos.

4
ENERGY EFFICIENCY FIRST
4

Community-Scale Consumption and Savings Potential • Homes and commercial buildings consume 41%
of U.S. energy • The average Alaskan Native Village spends
$5,500 annually on energy costs, 10 to 20% of which is wasted from air leakage and outdated heating, ventilating, and air-conditioning (HVAC)
• The product of COMFORT in addition to monetary savings makes energy efficiency a valuable product 5
Data source: U.S. Department of Energy

Energy Efficient Technologies
• Deep energy retrofits • Net Zero Energy Ready Homes • Air Source Heat Pump • Water heating
– On demand tankless – Heat pump hot water
• Appliances • Retro-commissioning • Building energy modeling tools • Lighting
6

Deep Energy Retrofits
• Building performance whole-house approach – Residential, Facility and Commercial
• Insulation and air sealing • Heating & cooling upgrades • Natural & Healthy Ventilation • Efficient building controls • Lighting and daylighting upgrades • Savings of 30% or more
7

The Tightest Home • 28 inch thick walls • Almost zero air leakage
– .05 ACH 50 • Heat Recovery Ventilator .
• Only incoming energy is for hot water, air source heat pump, appliances and lighting
• Majority of heat comes from internal byproducts of lighting, appliances, body heat, passive solar gain.
• Other heat comes from a rarely used electric heat pump (35 gallons of heating oil/year)
8

Net Zero Energy Ready Home –Dillingham AK
9
Electricity Heating Fuel Total
Average house in Dillingham
$1,200 or 5,930 kWh
$4,200 or 700 gallons of diesel oil
$5,400
Net Zero Energy Ready
$770 or 3,200kWh
Zero $770

Ductless Mini-split Heat Pump (Air Source Heat Pump)
10

Air Source Heat Pump
See Efficiency Vermont for approved cold climate units: https://www.efficiencyvermont.com/docs/for_my_home/cold_climate_heat_pumps/evt-cchp-distr.pdf
11

Energy Recovery Ventilators (ERVs)
• Exchange stale indoor air with fresh outdoor air, recovering heat and moisture from the exhaust air and transferring it to supply air.
• More popular in cold climates, only recover heat from exhaust air and thus dry out the indoor air.
• ERVs could help improve indoor air quality by adding moisture to the air.
12

Zero Energy Ready Homes
13
• 1,055 square foot home • Six inch structural insulated
panels (SIP) walls • 10 inch SIP roof • Insulated concrete forms (ICF)
foundation walls with R-20 high –density rigid EPS foam under the slab
• Ductless heat pump heats and cools the home
• Passive solar • Triple-pane windows • Exhaust fan provides ventilation
by drawing in tempered outside air through a 100 foot “earth tube” buried two feet underground
• $144 per square foot (L48 price)
Source: DOE: http://www.energy.gov/sites/prod/files/2014/09/f18/DOE_ZEH_TCLegendCedarwood_09-20-14_0.pdf

Appliances
– Clothes washers – ENERGY STAR brands • Use 15 gallons of water per load compared to 23
gallons used by a standard machine. • 20% more efficient than non Energy Star washers,
and only use 270 kWh of electricity annually
– Dishwashers –Older than 1994? Per cycle you
will use an extra $35/year and wastes more than 10 gallons of water per cycle.
14

ENERGY STAR Rated Refrigerators
Refrigerator and freezer replacement are often overlooked as big money savers
– Can save an estimated $150 annually by replacing one 10 years old or older
– ENERGY STAR refrigerators are 9-10% more efficient than non-ENERGY STAR brands
– Newer refrigerators can save $35 to $300 on energy costs over it’s lifetime
– More than 60 million refrigerators are over 10 years old, costing consumers $4.7 billion a year in energy costs
– Use the ENERGY STAR savings calculator to find out exactly how much money you will save by replacing your refrigerator: https://www.energystar.gov/index.cfm?fuseaction=refrig.calculator
15
Source: ENERGYSTAR.GOV

Lighting • Replace T-12 with T-5 electronic ballasts • CFLs save 75% over a traditional
incandescent lightbulb • LED lighting saves 90% over a traditional
incandescent lightbulb, but lasts much longer.
16
All bulbs deliver equivalent brightness
Single bulb wattage Wattage used for whole house
Incandescent bulbs 60 watts 2,820 watts
CFL bulbs 14 watts 658 watts
LED bulbs 9.5 watts 446.5 watts

Lighting using kilowatt price of 12 cents
• Monthly Cost of Using Incandescent Light Bulbs
2.820 X $0.1188 X 150 hours = $50.25 • Monthly Cost of Using CFL Bulbs 0.658 X $0.1188 X 150 hours = $11.73 • Monthly Cost of Using LED Bulbs 0.447 X $0.1188 X 150 hours = $7.97
17

Retro-Commissioning a Building
• Retro-commissioning (RCx) – Identifies and improves less than-optimal energy performance in a large
building’s equipment and control systems. – The intent is for existing systems to work as efficiently as designed. – Evaluation and fine-tuning of heating and lighting systems can be implemented
as a one-time intervention, frequent “re-tuning,” or ongoing “continuous commissioning,” to ensure that the energy savings persist.
• Native Alaskan Tribes can use RCx as a lead component of facilities’
energy efficiency projects
• Retro-commissioning for public buildings is a low-cost way to reduce energy costs by 10% to 20% and can free up funds for other uses.
18

Retro-Commissioning Guidelines
• Retro-commissioning is one part of an effective buildings energy efficiency policy suite, and an organization-wide energy management program.
• Retro-commissioning should be accompanied by benchmarking, rating, and disclosure policies so that building owners are more motivated to undertake RCx and so buildings can clearly demonstrate improved energy performance to the market.
• Retro-commissioning should not be a one-time effort, it should be followed-up with regular performance feedback, continuous improvement efforts, support for in-depth technical analysis of major equipment investment opportunities, technical assistance, and financial incentives.

Financing Retro-Commissioning
• Energy Service Company (ESCO) • Loans • Utility Incentives • Small Business Initiatives Programs • Train facility managers how to benchmark their
buildings to determine RCxing opportunity • Average Cost - $0.03 To $3.86 per square foot • Average investment = $33,696

Scope of a Retro-commissioned Project
•Number and complexity of systems • Size of the facility • Equipment age and condition • Commissioning service provider rates • Level of on-site staff knowledge interfacing with the project • Presence of an extensive operations & maintenance (O&M) program

Non-energy Benefits to RCxing
• Improved environmental performance of building stock
• Increased thermal comfort and air quality in workspaces
• Increased employee productivity • Increased O&M staff knowledge of their
building and occupants • Begin budgeting for future energy upgrades

Retro-Commissioning Key Points
• Retro-commissioning is a process for “tuning up” a building’s equipment to make it work as efficiently as possible without major capital investment.
• Retro-commissioning for public buildings is a low-cost way to reduce energy costs by 10% to 20% and can free up public funds for other uses.
• Successful retro-commissioning policies go beyond a one-time effort, encouraging building owners to follow-up with regular feedback to ensure continued performance.
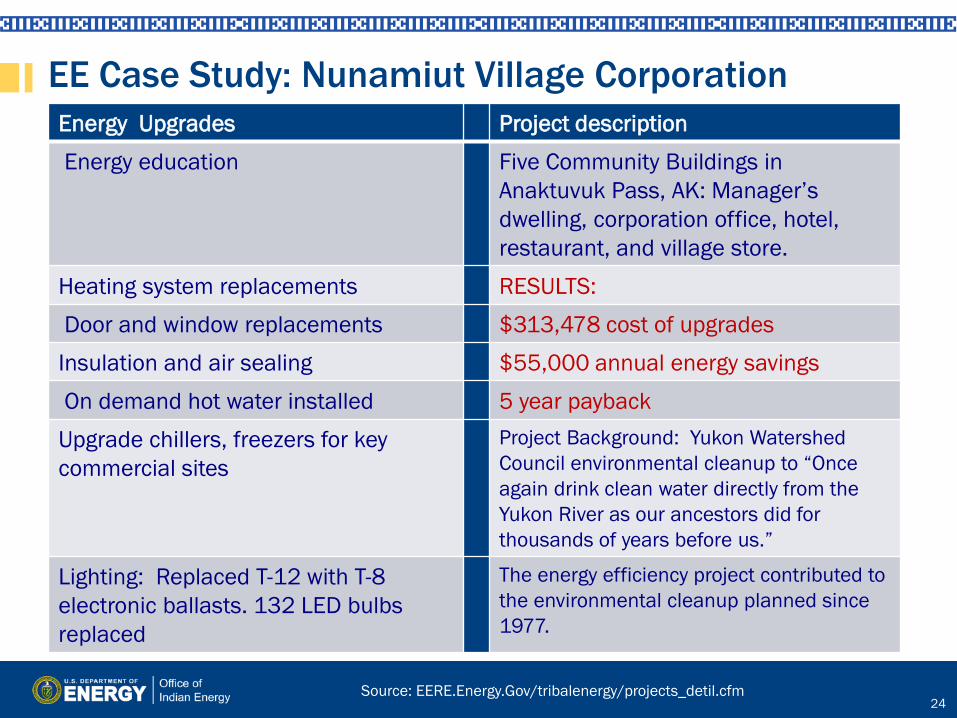
EE Case Study: Nunamiut Village Corporation Energy Upgrades Project description Energy education Five Community Buildings in
Anaktuvuk Pass, AK: Manager’s dwelling, corporation office, hotel, restaurant, and village store.
Heating system replacements RESULTS: Door and window replacements $313,478 cost of upgrades Insulation and air sealing $55,000 annual energy savings On demand hot water installed 5 year payback Upgrade chillers, freezers for key commercial sites
Project Background: Yukon Watershed Council environmental cleanup to “Once again drink clean water directly from the Yukon River as our ancestors did for thousands of years before us.”
Lighting: Replaced T-12 with T-8 electronic ballasts. 132 LED bulbs replaced
The energy efficiency project contributed to the environmental cleanup planned since 1977.
24 Source: EERE.Energy.Gov/tribalenergy/projects_detil.cfm

BUILDING HEAT AND HOT WATER
25

• A preheating air system
• Sunlight strikes south facing vertical box wall.
• South-facing wall surface is best – 45° of south gives
80%
26
NREL/PIX 09173
NREL/PIX 09355
Solar Vent Preheat (SVP)

System Components
• Transpired solar collector – Perforated sheet of
corrugated metal • Air distribution
– Ductwork, fan, and bypass damper
• Controls – Temperature and time clock,
or Energy Management Control System (EMCS)
27
Source: femp.energy.gov/training

Solar Vent Preheat Principle
• Sun warms the collector surface
• Heat conducts from collector surface to thermal boundary layer of air (1 millimeter [mm] thick)
• Boundary layer is drawn into perforation by fan pressure before heat can escape by convection
4 - 6 in.
South wall Solar wall
Boundary layer
Source: femp.energy.gov/training
28
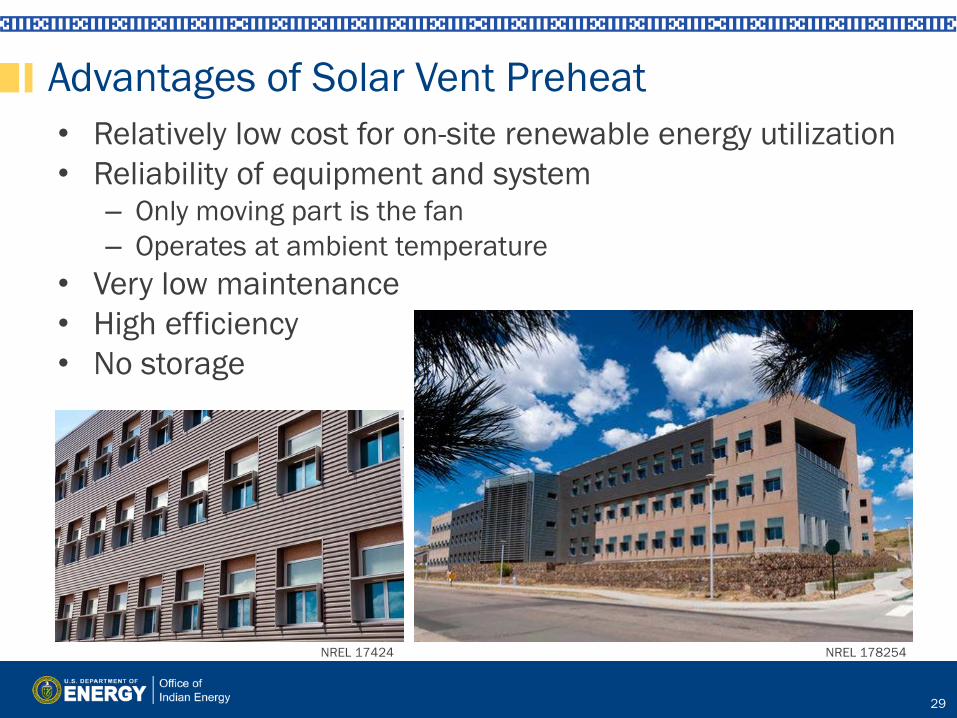
Advantages of Solar Vent Preheat • Relatively low cost for on-site renewable energy utilization • Reliability of equipment and system
– Only moving part is the fan – Operates at ambient temperature
• Very low maintenance • High efficiency • No storage
NREL 178254 NREL 17424
29

Generic LCOE -Cost Example
30
NREL 00957
Photo from Rapid City, South Dakota, Recreation Center
Solar Vent Preheat
Useful Life of Solar Vent Pre-heat is 30 to 40 years. Source: NREL Energy Analysis Website: Distributed Generations of Renewable Energy Estimate of Costs 2012, http://www.nrel.gov/analysis/tech_cost_dg.html
Building Occupancy Daytime/7 days/week
Collector Area 30 feet (ft) x 60 ft
Energy Savings 150 kilowatt British thermal unit (kBtu)/square feet (ft2) x 1800 ft2 = 270 one million British thermal units (MMBtu)
Collector Cost $19,800
State Tax Credit $6,534 (33%)
Federal Tax Credit 10% = $1,980
Accelerated Depreciation Varies 10% up to $2,000
Net Cost $10,000
Simple Payback 4 years
Heating Efficiency 70%

Tankless Hot Water Heat • On demand (tank less or
instantaneous) water heaters provide hot water only as needed
• Eliminate standby energy losses associated with hot water storage tanks
• On demand DHW characteristics:
– Typical hot water flow rate of 2 – 9 gallon/minute
– Can serve 1 to 3 bathrooms – Equipment lifetime ≥ 20
years
• Typical annual energy savings range from 8% to 25%
31

Heat Pump Hot Water Heat
32
• Average energy savings over electric resistance heater is 40% to 60% – Depending on
hours/year electric resistance back up heating element has to be used
• Typical payback periods are less than 3 years
41
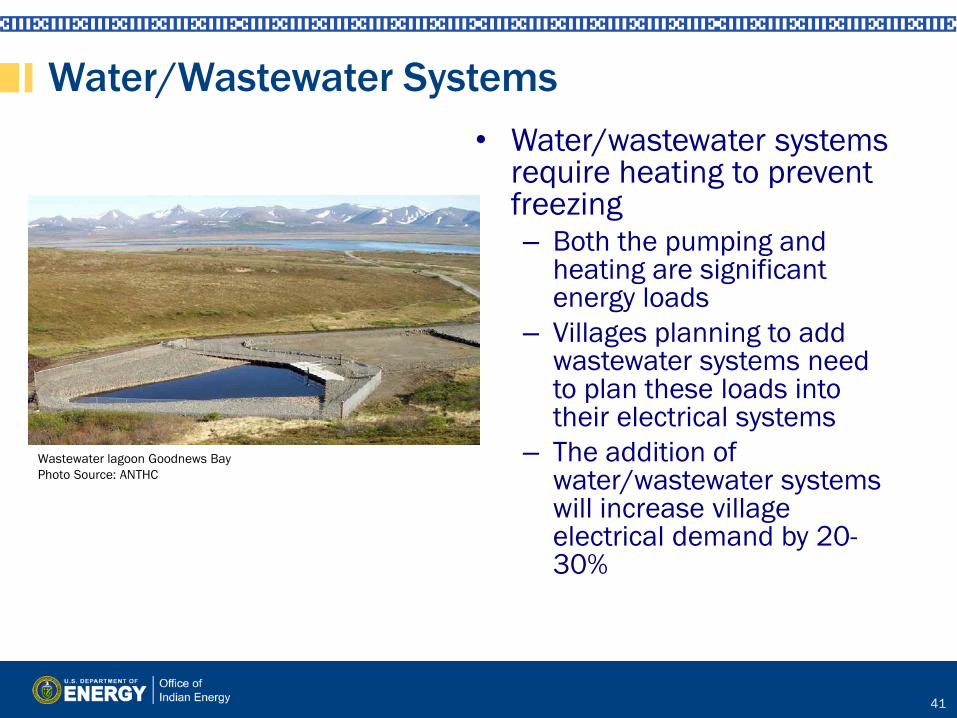
Water/Wastewater Systems • Water/wastewater systems
require heating to prevent freezing – Both the pumping and
heating are significant energy loads
– Villages planning to add wastewater systems need to plan these loads into their electrical systems
– The addition of water/wastewater systems will increase village electrical demand by 20-30%
Wastewater lagoon Goodnews Bay Photo Source: ANTHC

42
Water/Wastewater Systems Continued
• With appropriate storage, water/wastewater treatment systems can be ramped up and down to correspond to peak output from RE systems – These systems can act as a sort of demand-
response system on isolated grids to balance loads
43
Wastewater Treatment
• Wastewater heating – Open (evaporation) lagoons often freeze in the winter and can have
sub-optimal temperatures even in the summer – Additional heating of the lagoon (beyond the natural metabolic heat
produced by microorganisms) can quicken the degradation process rendering the waste safer in a shorter amount of time • RE systems can be used as energy source for heating needs
• Anaerobic Digestion – Takes advantage of the same processes found in the open lagoons
but concentrates the waste and microorganisms – With a large enough feedstock, AD can produce methane gas in
recoverable quantities – In Alaska, systems need to be insulated and/or placed in heated
buildings to maintain appropriate heat levels – Thermally efficient systems can reach temperatures high enough
(125-135 degrees F) to kill 99.99% of pathogens

44
Water Treatment • UV Water Treatment
– Can be used to disinfect water without chlorine
– Slightly more energy intensive than chlorine treatment • Can be paired with
renewable energy sources (wind, solar)
– Treatment systems can be ramped up and down to correspond with peak RE output
– No need to ship and store chlorine
UV Reactors - After membrane filtration, the water is further disinfected using high intensity ultraviolet (UV) light. Each UV reactor contains seven high intensity UV bulbs which "shine" on the water as it passes through the reactor. Photo Source: City of Thornton, CO

45
Water and Renewables • Renewable energy sources such
as solar and wind are intermittent and require either energy storage or backup generators to supply constant power.
• Common energy storage includes batteries or ceramic thermal storage
• Hot water loops can also be used to store power in the form of thermal energy
• RE produced hot water can be used to heat water/wastewater systems and other large thermal loads (e.g. schools, clinics, etc.)
Photo Source: Ian Baring-Gould / NREL

SOLAR PHOTOVOLTAICS (PV)
46

Photovoltaics System (Grid Connected)
Illustration by Jim Leyshon, NREL
47

Alaska has a significant solar potential
49
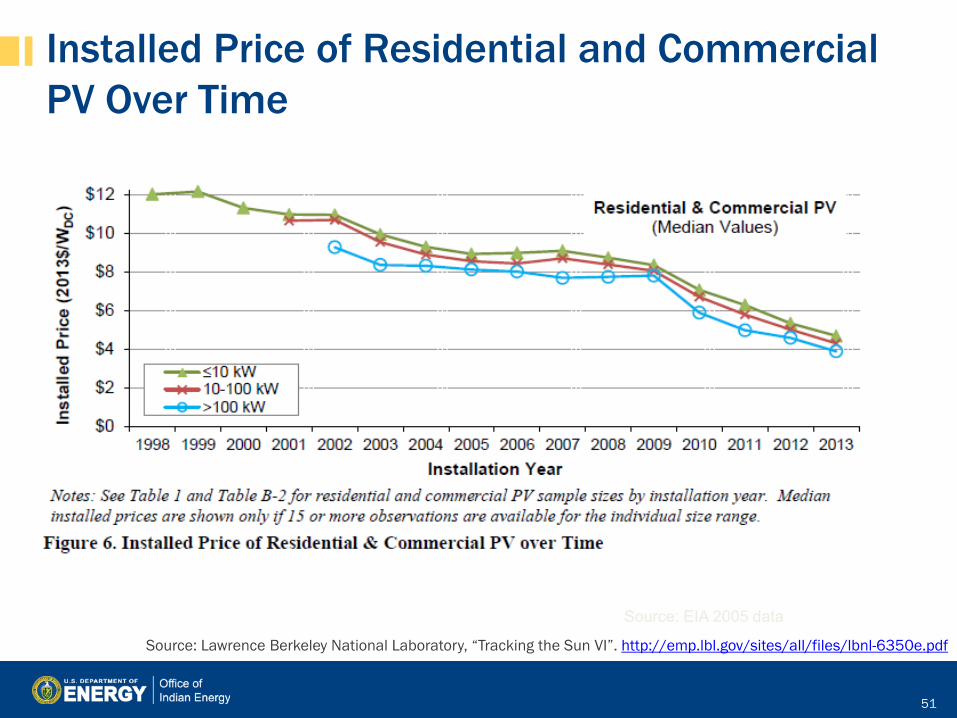
Installed Price of Residential and Commercial PV Over Time
$0.6
Source: EIA 2005 data
Source: Lawrence Berkeley National Laboratory, “Tracking the Sun VI”. http://emp.lbl.gov/sites/all/files/lbnl-6350e.pdf
51

Solar PV in Nome, Alaska • Bering Straits Native Corporation
(BSNC) installed a 16.8 kW solar PV system on the headquarters office building in 2008
• The PV array produces approximately 16,000 kWh of electricity per year, offsetting approximately 1,000 gallons of diesel fuel annually
• BSNC also installed solar hot water heaters on two corporation-owned apartment buildings.
Learn more: http://alaskarenewableenergy.org/why-renewable-energy-is-important/alaskas-renewable-energy-projects/#sthash.EaCjhnh9.dpuf
52
Photo courtesy of The Bering Straits Native Corporation

Kaltag Produces Small Scale Solar PV on the Yukon River
53
• Projects were carefully developed, designed, constructed and operated
• As pilot projects, they demonstrate that solar energy can be successfully harnessed to save fossil fuel in Alaska
• The first year of operation produced approximately 8,200 kWh, which yields a fuel cost savings of $1,797 for the Alaska Village Electric Cooperative (AVEC)’s FY13 reported efficiency of 13 kWh/gallon
• With an estimated savings of $2,000, this was essentially accurately predicted performance.

Northwest Artic Borough Solar PV to Power Water and Sewer Plants • All 11 villages will receive the
solar systems by 2014 • Ambler Village exceeded
expectations in March of 2013, sometimes running entirely on solar
• Peak performance in Spring due to increased day light
• Solar reflection provides up to 30% in output due to solar reflection off the snow
• Savings for each plant is between $6,000 and $8,000/year.
55
Photo courtesy of Northwest Arctic Borough

Useful Solar Resources for PV
56
• For General Project Development & Finance: http://www.nrel.gov/applying_technologies/financing.html
• Tribal Business Structure Handbook (Nilles, Kathleen, NAFOA): www.nafoa.org
• Renewable Energy Handbook in Indian Country: (Douglas C. MacCourt and Ater Wynn, Indian Law Practice (http://www.nrel.gov/docs/fy10osti/48078.pdf
PROJECT DEVELOPMENT &
FINANCE “GENERAL”
• NREL Learning About Renewables:
http://www.nrel.gov/learning/re_photovoltaics.html • Renewable Energy Atlas: http://maps.nrel.gov/re_atlas • PVWatts: http://www.nrel.gov/rredc/pvwatts/ • RETScreen: http://www.retscreen.net/ang/home.php
PROJECT DEVELOPMENT “RESOURCES”
• Power Purchase Agreement Checklist: http://www.nrel.gov/docs/fy10osti/46668.pdf
• Renewable Portfolio Standards: http://apps1.eere.energy.gov/states/maps/renewable_portfolio_states.cfm
PROJECT DEVELOPMENT
“OFF-TAKE”

WIND POWER
57
WIND ENERGY RESOURCE WIND OVERVIEW ALASKA WIND ENERGY POTENTIAL WIND PROSPECTOR CASE STUDIES WIND ENERGY TAKEAWAYS
58

Alaska Wind Resource Map
59
Source: http://apps2.eere.energy.gov/wind/windexchange/wind_resource_maps.asp

Wind Resources and Opportunity on Tribal Lands
60

Small (≤100 kW) Homes Farms Remote applications (e.g., water pumping, telecom sites, ice making)
Mid-scale (100–1,000 kW) Village power Hybrid systems Distributed power
Large, land-based (1–3 MW) Utility-scale wind farms Large distributed power
Sizes and Applications
Large, offshore (3–7 MW) Utility-scale wind farms, shallow coastal waters No U.S. installations
Photo from HC Sorensen, NREL 17855
Photo from Native Energy Inc., NREL 7593
Photo from Tjaden Farms, NREL 13764 Photo from Bergey Windpower Co. Inc., NREL 02102
61

Turbine – Sized to Economic Project Goals
62
Bergey Excel 10kW ~ 1 home
Vestas V47 600kW ~ 200 homes
GE 1.5sle 1.5MW ~ 500 homes
Vestas V-90 3MW ~ 1,000 homes

LCOE for Alaska Wind Energy
63
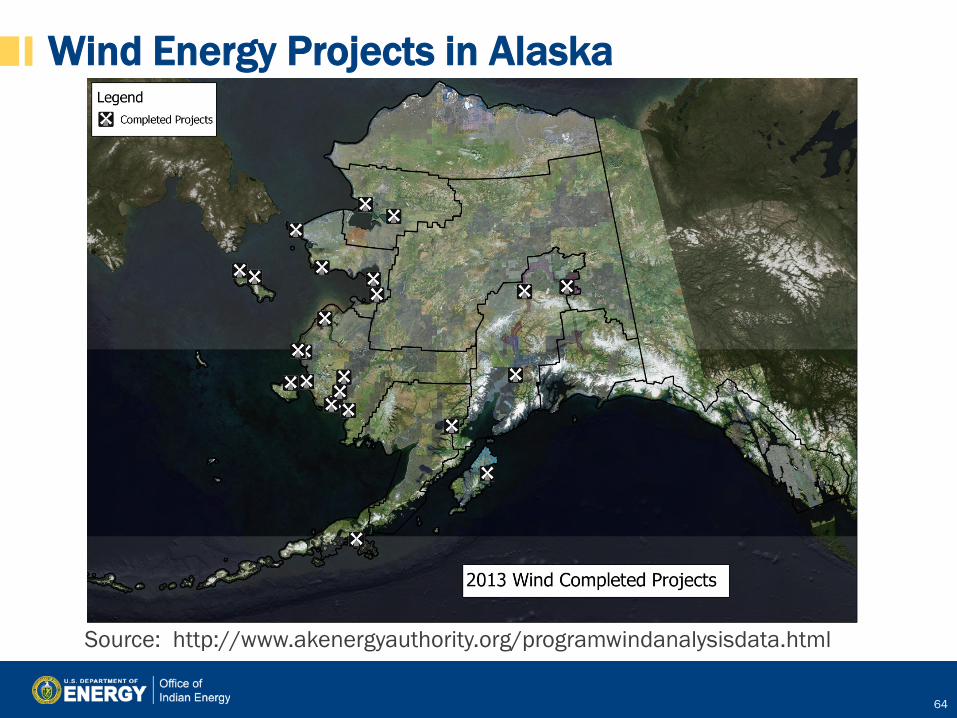
Wind Energy Projects in Alaska
64
Source: http://www.akenergyauthority.org/programwindanalysisdata.html
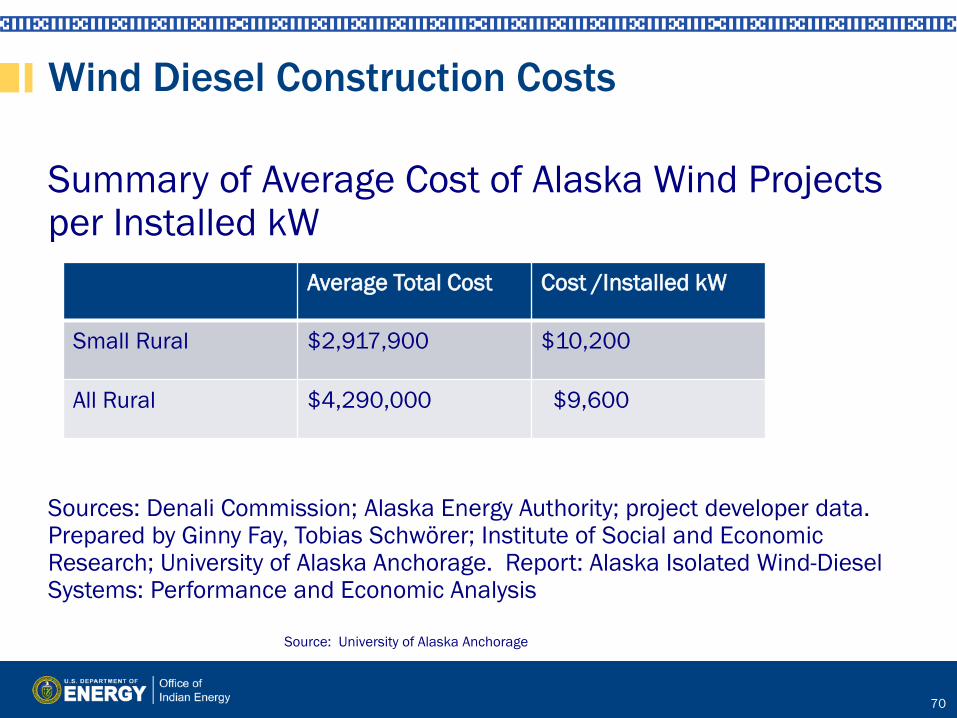
Wind Diesel Construction Costs
Summary of Average Cost of Alaska Wind Projects per Installed kW
Sources: Denali Commission; Alaska Energy Authority; project developer data. Prepared by Ginny Fay, Tobias Schwörer; Institute of Social and Economic Research; University of Alaska Anchorage. Report: Alaska Isolated Wind-Diesel Systems: Performance and Economic Analysis
70
Average Total Cost Cost /Installed kW
Small Rural $2,917,900 $10,200
All Rural $4,290,000 $9,600
Source: University of Alaska Anchorage

Toksook Bay, Alaska Power system that supplies the ~800 people of the communities of Toksook Bay and Nightmute in coastal Southwest Alaska • Power system operated by the Alaska Village Electric Cooperative • Average load just under 370 kW (both Toksook and Nightmute) • 3 NW100-kW turbines and resistive community heating loads • Installed in the fall and winter of 2006 • 24.2% average wind contribution with much higher instantaneous contribution • Almost 700 MWh generated by wind last year, saving almost 46,000 gal
(174,239 l) of fuel • First year turbine availability of 92.4% - currently under warrantee • Average net capacity factor of 26.0% from Aug ‘07 to July ‘08
Phot
o Cr
edit:
Nor
ther
n Po
wer
Sys
tem
s
Phot
o Cr
edit:
Nor
ther
n Po
wer
Sys
tem
s

Kodiak, Alaska • Endeavor to produce 95% of energy sales with cost effective
renewable power solutions by the year 2020. KEA Board Feb 2007
• Isolated island electric grid – About 12,000 people – Peak Load – 25 MW, Minimum Load – 11 MW
• Power Generation – 2 x 10 MW Hydroelectric Units – 6 x GE 1.5 MW Wind Turbines – 7 MW Diesel Fired Combined Cycle Plant – 7 Diesels totaling 25 MW’s
• Wind Project (first 3 turbines inst. 2008) – Cost ~ $21.4 million – Annual Production of 12.2 million kWh – Annual fuel savings of 800,000 gallons – Some limited integration issues – Operating above expectations
• 3 more turbine installed in 2013 with a balancing battery bank

Key Takeaways
• Wind energy is a mature, yet evolving technology
• Wind energy comes in many sizes, including community scale
• Wind turbine project development (from 5 kW to 200 MW) has clear impacts to neighbors/neighboring communities that are both positive and negative and therefore requires active stakeholder engagement
76
In the Village of Tuntutuliak the use of wind and smart‐grid technology has fundamentally changed the energy landscape of rural Alaska. Photo curtesy of: Center for American Progress

Wind Resources
• http://apps2.eere.energy.gov/wind/windexchange/ • Guide to Tribal Clean Energy Development • http://www.akenergyauthority.org/ • Guide to Tribal Clean Energy Development
RESOURCE
• http://www.nrel.gov/wind/ • http://www.smallwindcertification.org/
TECHNOLOGY
• www.dsireusa.org POLICY
77

78
DIESEL EFFICIENCY -JED DROLET OF AEA
78

Alaska Energy Authority: Diesel Efficiency
• Importance of Training • Diesel Genset Efficiency • Powerhouse efficiency • Distribution efficiency • Fuel considerations • Takeaways
79

Importance of Training
Training can help avoid these scenarios: • Fluid leaks that result in damage to equipment
and operator risk • Running a genset that is too large, which wastes
fuel • Delayed maintenance which causes engines to
wear prematurely and waste fuel • Inefficiency and accelerated wear due to too hot
or too cold engine operating temperatures AEA provides Power Plant and Advanced Power Plant Operator Training. See our website (akenergyauthority.org)
80
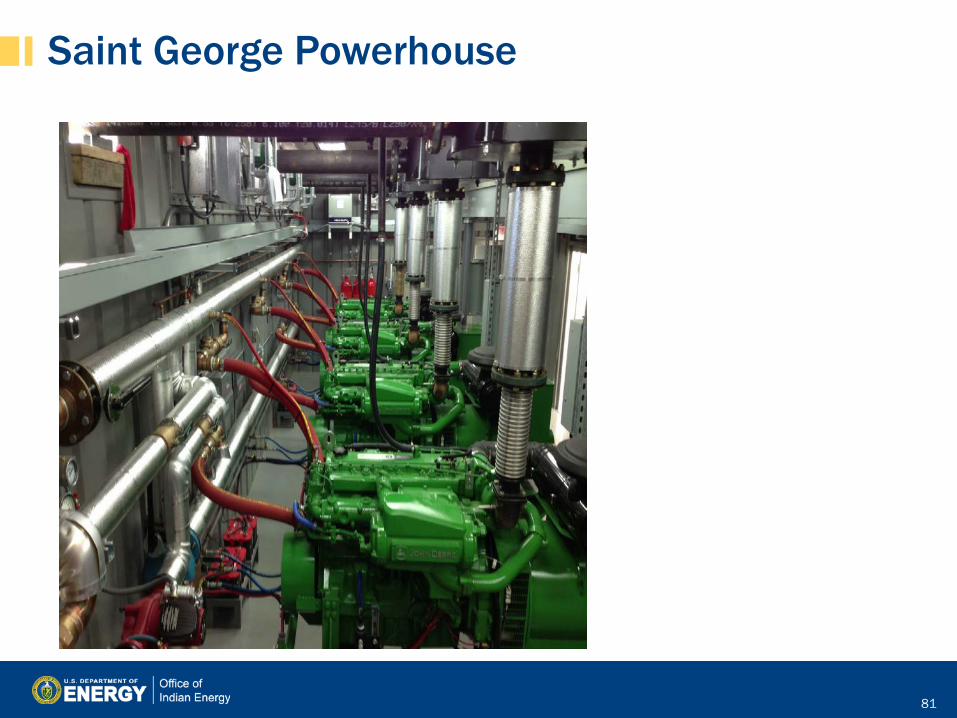
Saint George Powerhouse
81
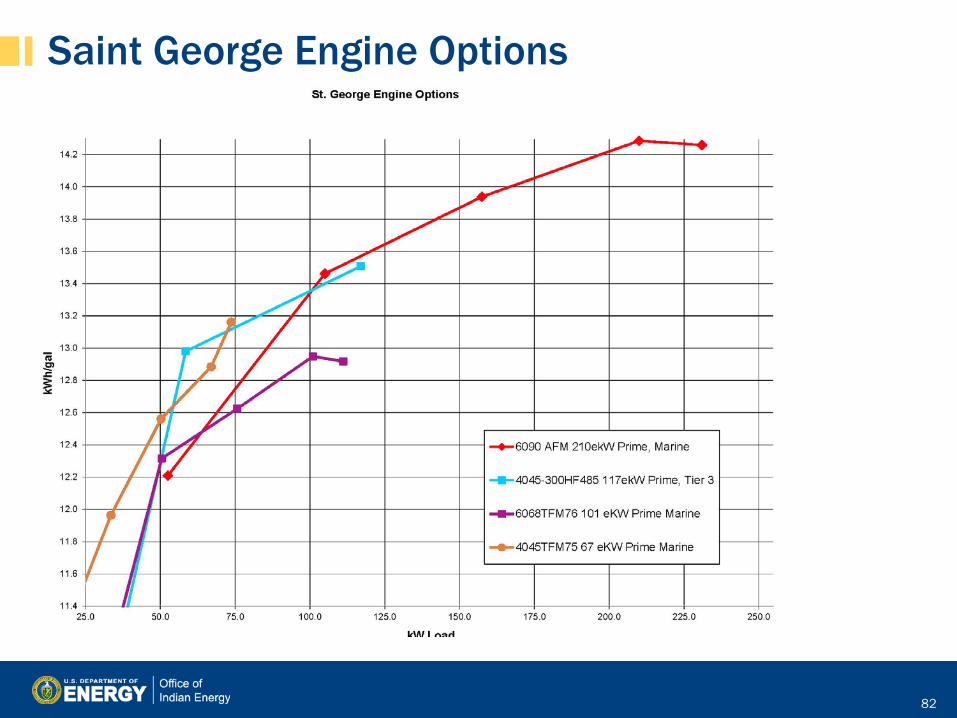
Saint George Engine Options
82

Heat Recovery
86
Power Plant Heat Exchanger Boiler Room Heat Exchanger
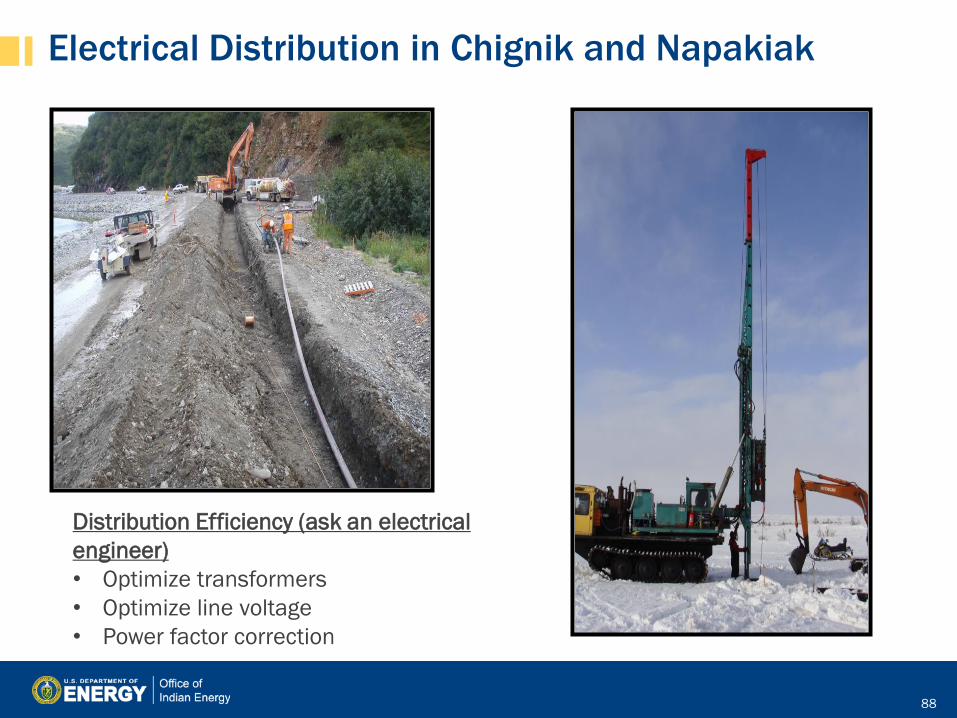
Electrical Distribution in Chignik and Napakiak
88
Distribution Efficiency (ask an electrical engineer) • Optimize transformers • Optimize line voltage • Power factor correction
AEA Takeaways
• Train your operators • Check with the Alaska Energy Authority
before replacing gensets, particularly regarding EPA regulatory compliance
89

Typical Alaska Village Energy Consumption
Because of high heat demand in Alaska villages, it is important to capture “rejected” or waste heat from diesel gensets. This substantially increases energy efficiency on the supply side.
25%
55%
20%
Energy Use Electricity - 25%
Heat - 55%
Transportation -20%
Data Source: energy Policy Recommendations by the Institute of Social and Economic Research; University of Alaska; Steve Colt, Ginny Fay, Matt Berman and Sohrab Pathan; in collaboration with Mark A. Foster & Associates. http://alaskarenewableenergy.org/wp-content/uploads/2013/07/Energy-Policy-Recommendations-to-Alaska-Legislative.pdf

Diesel Generation of Power Production in Alaska • Generated diesel accounts for 94% of power
production in the 181 rural communities that receive power cost equalization (PCE) assistance from the Alaska Energy Authority (AEA).
• Diesel efficiency can almost immediately reduce the energy cost burden on rural, grid-isolated, Alaskan communities while renewable and alternative energy resources are developed.
91
Source: Alaska Rural Energy Plan and the 2009 AEA Guide for Alaskan Communities to Utilize Local Energy Resources
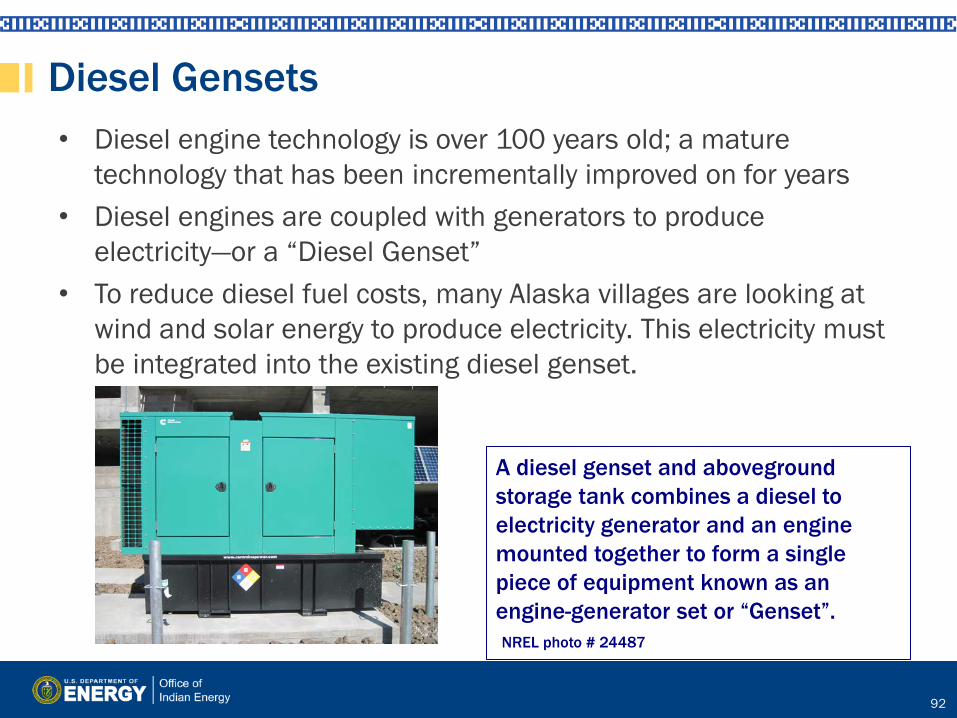
Diesel Gensets • Diesel engine technology is over 100 years old; a mature
technology that has been incrementally improved on for years • Diesel engines are coupled with generators to produce
electricity—or a “Diesel Genset” • To reduce diesel fuel costs, many Alaska villages are looking at
wind and solar energy to produce electricity. This electricity must be integrated into the existing diesel genset.
92
A diesel genset and aboveground storage tank combines a diesel to electricity generator and an engine mounted together to form a single piece of equipment known as an engine-generator set or “Genset”. NREL photo # 24487

Diesel Engine Power Generation
• Recent advances have improved diesel efficiency by more than 50%: – Engine efficiency – Automated generator controls – Waste Heat recovery – Continuous operations and maintenance techniques
• Deployment of modern diesel technology in rural community diesel powerhouses has been documented to increase the usable electrical energy generated from a gallon of diesel fuel by 20% - 30%
• Installation of monitored heat recovery systems from both traditional water jacket systems and new exhaust stack waste heat recovery systems can increase the fuel conversion efficiency of diesel powerhouses by another 20% - 35%.
93

Combined Heat and Power
• Water Jacket Heat Recovery – Waste heat recovery for space heating is a common, proven design. Modern
high-efficiency heat exchangers, super-insulated heat piping, high efficiency electric pumps, modern electronic BTU meters, and variable speed radiator fan motor controllers maximize the utilization of heat available from diesel engines. The associated design and maintenance procedures are well understood in the Alaskan power industry. For this reason, water jacket heat recovery for space heating is considered a mature technology in Alaska.
• Exhaust Stack Heat Recovery. – Heat recovery from diesel engine exhaust stack is a proven and cost-
effective technology. Recent technological improvements have made exhaust stack heat recovery from diesel engines feasible and economical in midsize engines, which are used in rural Alaska. These advances in exhaust stack heat recovery have boosted recovered heat.
94

Savings from ANTHC Heat Recovery Projects
12
Community Energy Savings (Annual Gallons of Fuel)
Annual Cost Savings (DCCED Fuel Price Report, 2012)
Present Value of Lifetime Savings (20 Years, 3.5% Real Cost Increase of Fuel)
Minto 11,000 $ 55,550 $ 1,698,000 Allakaket 7,300 $ 45,041 $ 1,370,000 Kwigillingok 4,500 $ 29,025 $ 858,200 Goodnews Bay 5,000 $ 26,500 $ 1,732,900 McGrath 6,000 $ 44,820 $ 1,319,200 Savoonga 9,000 $ 50,490 $ 1,477,200 Selawik 11,875 $ 73,268 $ 2,157,000 Shungnak 10,400 $ 64,168 $ 1,889,400 Ambler 10,300 $ 63,551 $ 1,871,200 Sleetmute 2,068 $ 15,199 $ 450,000 Russian Mission 2,200 $ 12,650 $ 375,500 Totals 81,843 Gallons $ 491,058 $ 15,198,700

Case Study: Quinhagak Heat Recovery System
Quinhagak’s Heat Recovery System is planned for construction in summer 2015
This project will capture waste heat from the existing AVEC power plant and send it to the washeteria and combined utility building. Heat is transferred from the power plant to the two community facilities through circulating glycol lines. Recovered heat, measured and metered in BTUs, is sold by the power utility to the community at 30% of the cost of fuel oil. Once the system is fully operational, Quinhagak is expected to reduce their annual heating fuel usage by 14,200 gallons, for a fuel savings of almost $64,000 per year. Net savings after recovered heat sales cost is expected to be $45,000 per year. Design and construction costs are estimated at $820,000.
13

Source: NREL, Ian Baring-Gould

Case Study: Inside Passage Electric Cooperative in Hoonah (Juneau Region) • Constructed a heat recovery project in 2011 to recover available
marine jacket water heat from IPEC-Hoonah diesel generator that is currently being rejected to the atmosphere via radiators. Provides heating for: – Local school – Pool – Gymnasium – Police station – Fire hall
• Will reduce diesel heating fuel consumption of nearby
community buildings by over 55,000-gallons/year. Learn more: http://alaskarenewableenergy.org/why-renewable-energy-is-important/alaskas-renewable-energy-projects/
104

Integrating Renewable Energy & Diesel • Diesel gensets operate all the time (24/7) • Wind and solar are “intermittent” renewable energy
resources; they are only available when the wind blows or the sun shines
106
HYBRID SYSTEMS When wind or solar energy is connected into a village electric grid, the diesel gensets must increase or decrease production in response to the wind or solar output at any (and every) moment in time. NREL Photo #07406

Hybrid Power Systems are Widespread
107
Test Ban Treaty Monitoring, Antarctica Black Island, Antarctica
NREL Photos top left clockwise: #04567 Carol Spring; # 16097 Alaska Wind-Diesel Hybrid power system; #08954 McMurdo Station; #08958 Test Ban Treaty Monitoring.
Alaska Village Electric Cooperative Three 100 kW Wind turbines with bulk diesel storage tanks. Kasigluk Power System.

Wind and Diesel Penetration Levels
108
Low: • Maximum 30% Wind • Grid Connected
Medium: • Maximum 80% Wind • Secondary Load Control
High: • 100% Wind • Diesel Off • Load Control • Short Term Storage
Typical System
NREL photo #16068
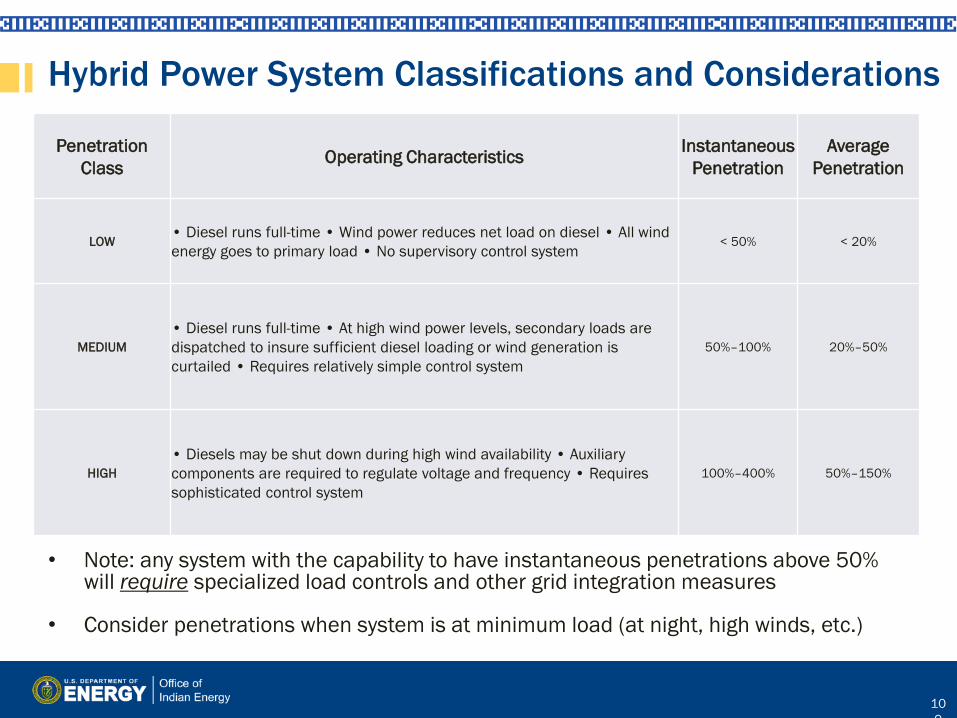
Hybrid Power System Classifications and Considerations
109
Penetration Class Operating Characteristics Instantaneous
Penetration Average
Penetration
LOW • Diesel runs full-time • Wind power reduces net load on diesel • All wind energy goes to primary load • No supervisory control system < 50% < 20%
MEDIUM • Diesel runs full-time • At high wind power levels, secondary loads are dispatched to insure sufficient diesel loading or wind generation is curtailed • Requires relatively simple control system
50%–100% 20%–50%
HIGH • Diesels may be shut down during high wind availability • Auxiliary components are required to regulate voltage and frequency • Requires sophisticated control system
100%–400% 50%–150%
• Note: any system with the capability to have instantaneous penetrations above 50% will require specialized load controls and other grid integration measures
• Consider penetrations when system is at minimum load (at night, high winds, etc.)

Key Takeaways for Diesel Efficiency and Renewables • Diesel engines are coupled with generators to produce
electricity, or “Diesel Genset” • Diesel gensets remain as the backbone of energy
systems for conversion and backup and must be integrated into renewables for rural villages
• Diesel has a 30% to 35% conversion efficiency from diesel to electricity
• A 10% to 25% improvement of the original 30% to 35% for electricity
• CHP heat recovery systems (combined heat and power) have a 30% to 40% conversion of the original diesel fuel into useful waste heat energy.
• Continuous maintenance and operations contributes to diesel efficiency at 20% to 30%.
110

BIOMASS
111

JUNEAU: UAF Cooperative Extension Service Biomass Resource
www.AlaskaWoodHeating.com
• Offers FREE pre feasibility studies for biomass –easy application.
• Biomass cost calculator • Additional resources
– Stove examples – Health and safety guidelines
113

Biomass Siting Factors
Project feasibility depends on: • Availability and cost of each
type of biomass (chips, pellets, or logs)
• Competing fuel cost (e.g., fuel oil, natural gas, etc.)
• Peak and annual thermal load • Building size and type • Space availability • Operation and maintenance
staff availability and experience
• Local emissions regulations
114
Photo source: NREL stock photo
NREL Photo #07713
Dried paper mill sludge is fed into the hopper at a biorefinery plant.

Biomass Waste to Heat CHP
• Small scale units can heat if several homes share a battery bank.
• Manufacturers Video of CHP waste to heat: – https://www.youtube.com/watch?feature=player
_embedded&v=pmTJtJbCoB4 – Owned by an Alaskan Tribal Regional
Corporation.
116

Types of Biomass Heating Equipment
• Residential stoves or boilers use chips, pellets, or logs
• Commercial or institutional heating boilers
• Industrial
117
NREL 06656 NREL 19255
Wood Pellet Stoves
• New York State’s Energy Research & Development Authority (NYSERDA) has one of the most extensive list of tested wood pellet stoves and appliances http://www.nyserda.ny.gov/All-Programs/Programs/Residential-Wood-Pellet-Stove
• http://www.nyserda.ny.gov/All-Programs/Programs/Residential-Wood-Pellet-Stove/Residential-Pellet-Stove-Program-FAQ
• Make sure a lengthy pellet supply exists before investment.
118

Biomass Energy Projects
Model Neighborhood Project Subsidizing the cost to transition from oil heating systems to advanced wood pellet boilers for homeowners in Berlin, New Hampshire, and Farmington and Wilton, Maine http://www.northernforest.org/model_neighborhood_project.html The Wood to Energy Project Two primary objectives: 1. Provide a complete literature review on the state of the science 2. Develop database of wood-to-energy related industries in the
United States and Canada Learn more: http://www.wood2energy.org/
120

Helpful Links U.S. Forest Service Woody Biomass Utilization Site The Woody Biomass Utilization Team is an interdisciplinary team that promotes and facilitates the planning and delivery of an integrated, interdisciplinary approach to the recovery and utilization of woody biomass from ecological restoration and hazardous fuels reduction work. http://www.fs.fed.us/woodybiomass/ Biomass Energy Resource Center (BERC) BERC assists communities, colleges and universities, state and local governments, businesses, utilities, schools, and others in making the most of their local biomass energy resources. http://www.biomasscenter.org/ Biomass Thermal Energy Council (BTEC) BTEC is an association of biomass fuel producers, appliance manufacturers and distributors, supply chain companies and non-profit organizations that view biomass thermal energy as a renewable, responsible, clean and energy-efficient pathway to meeting America’s energy needs. BTEC engages in research, education, and public advocacy for the fast growing biomass thermal energy industry. http://www.biomassthermal.org/ Pellet Fuels Institute The Pellet Fuels Institute is a non-profit association that serves the pellet industry. http://pelletheat.org ALASKA – Free feasibility study, cost calculator, equipment resources www.AlaskaWoodHeating.com
123

HYDRO ELECTRICITY
124

Scale of Hydroelectric Power Plants Macro Hydropower • Although definitions vary, DOE
defines large hydropower as facilities that have a capacity of more than 30 MW.
Small Hydropower • Although definitions vary, DOE
defines small hydropower as facilities that have a capacity of 100 kW to 30 MW.
Micro Hydropower • A micro hydropower plant has a
capacity of up to 100 kW. A small or micro-hydroelectric power system can produce enough electricity for a home, farm, ranch, or village. Source: http://www1.eere.energy.gov/water/hydro_plant_types.html
125

Community-Scale Hydroelectric Components
Hydropower plants are composed of three basic components: 1. A water diversion or
intake system, 2. A pipeline or penstock
to move the water, and 3. A powerhouse..
Source: NREL
126

Alaska Hydroelectricity
127
Hydro damn in Akutan produces 775 MWh/year and displaces approximately 39,000 gallons of diesel annually.
Haida Corporation’s Reynolds Creek 2008 5-megawatt hydro project. Photo from NREL 25048
Alaska currently generates about 21% of electricity from hydropower, much of it from projects in Southeast Alaska. Power generation numbers listed assume a 50% capacity factor.

Technology Overview and Siting – Diversion Hydro
• Typically no storage opportunities as with impoundment, lower capital costs due to lack of dam
• Fewer concerns with fish and less land area impact than with impoundment Image Sources: Encyclopedia of Alternative Energy
• A diversion, sometimes called run-of-river, facility channels a portion of a river through a canal or penstock
• It may not require the use of a dam
Intake
Outlet
128

Alaska Community-Scale Tidal Hydroelectricity Cook Inlet- Ocean Renewable Power Company • An array of four 150 kW TidGen Power Systems • Rated capacity of 600 kW near (within 3 kilometers)
of East Foreland, Alaska • The devices will be installed in water depths of 60-
190 feet • Models have predicted peak velocities nearing 5
meters per second (~9 knots) • Learn more: http://alaskarenewableenergy.org/why-
renewable-energy-is-important/alaskas-renewable-energy-projects/#sthash.0uAGykc2.I4IZWNu3.dpuf
129

Wapato Hydropower Project: Successful Example
Drop Site 2 Powerhouse
Source: Yakama Power
130

Useful Resources
• Guide to Tribal Clean Energy Development RESOURCE
• Virtual Hydropower Prospector: http://hydropower.inl.gov/prospector/index.shtml
TECHNOLOGY
• www.dsireusa.org POLICY
131

More Resources & Maps
• NREL Geothermal: http://www.nrel.gov/gis/geothermal.html
• Guide to Tribal Clean Energy Development: http://www1.eere.energy.gov/tribalenergy/guide/index. html
• DOE Geothermal Technologies Program: http://www1.eere.energy.gov/geothermal/faqs.html
• Alaska Renewable Energy Maps http://map.akenergyinventory.org/
• Colorado Geo Energy & Heat Pump Association:
http://www.gogeonow.org/
142
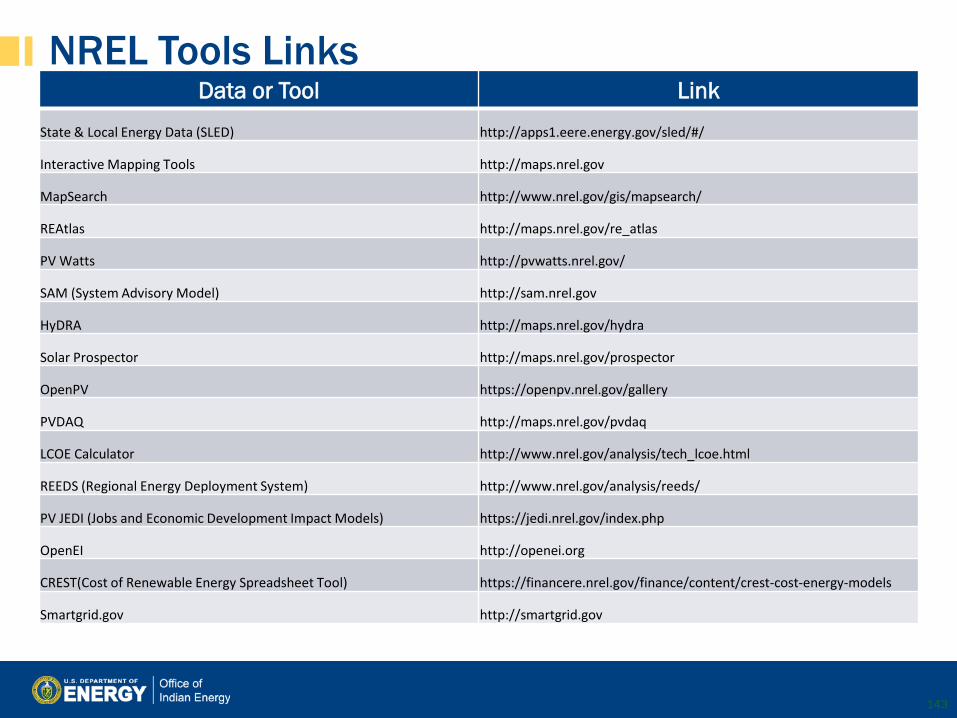
NREL Tools Links
143
Data or Tool Link
State & Local Energy Data (SLED) http://apps1.eere.energy.gov/sled/#/
Interactive Mapping Tools http://maps.nrel.gov
MapSearch http://www.nrel.gov/gis/mapsearch/
REAtlas http://maps.nrel.gov/re_atlas
PV Watts http://pvwatts.nrel.gov/
SAM (System Advisory Model) http://sam.nrel.gov
HyDRA http://maps.nrel.gov/hydra
Solar Prospector http://maps.nrel.gov/prospector
OpenPV https://openpv.nrel.gov/gallery
PVDAQ http://maps.nrel.gov/pvdaq
LCOE Calculator http://www.nrel.gov/analysis/tech_lcoe.html
REEDS (Regional Energy Deployment System) http://www.nrel.gov/analysis/reeds/
PV JEDI (Jobs and Economic Development Impact Models) https://jedi.nrel.gov/index.php
OpenEI http://openei.org
CREST(Cost of Renewable Energy Spreadsheet Tool) https://financere.nrel.gov/finance/content/crest-cost-energy-models
Smartgrid.gov http://smartgrid.gov

Resources for Technologies
• Federal Energy Management Program Environmental Siting Guide: http://www1.eere.energy.gov/femp/technologies/derchp_envsiting.html
• Guide to Tribal Energy Development: http://www1.eere.energy.gov/tribalenergy/guide/permitting_licensing.html http://www1.eere.energy.gov/tribalenergy/guide/regulatory_agencies.html
PROEJCT DEVELOPMENT “PERMITTNG”
• Tribal Energy and Environmental Information Clearing House: http://teeic.anl.gov/er/index.cfm
• Renewable Energy Resource Assessment: http://www1.eere.energy.gov/tribalenergy/guide/assessing_energy_resources. html.
PROJECT DEVELOPMENT “TECHNOLOGY”
• General Project Development & Finance: http://www.nrel.gov/applying_technologies/financing.html
PROJECT DEVELOPMENT
“CAPITAL”
144


![Rick Dillingham Collection - New Mexico Museum of Artnmartmuseum.org/assets/files/Finding Aids/Rick Dillingh… · · 2018-01-11Rick Dillingham [hereinafter RD], ... He was best](https://static.fdocuments.us/doc/165x107/5afe52467f8b9a256b8ce246/rick-dillingham-collection-new-mexico-museum-of-aidsrick-dillingh2018-01-11rick.jpg)


