emc cover pages 2017 final - Power · PDF fileThis report also pays tribute to our people ......
130
EMC LIMITED ANNUAL REPORT 2016-17 Spreading WINGS
-
Upload
nguyendiep -
Category
Documents
-
view
215 -
download
1
Transcript of emc cover pages 2017 final - Power · PDF fileThis report also pays tribute to our people ......

EMC LIMITEDANNUAL REPORT 2016-17
SpreadingWINGS


ON THE COVER:
Spreading wingsThe EMC Annual Report 2016-17 shows its endeavor to better its performance on a day-to-day basis, take its businesses to newer verticals & geographies and attain market leadership.
BOARD OF DIRECTORSMr. Manoj ToshniwalManaging DirectorMr. Ramesh Chandra BardiaJoint Managing DirectorMr. Biplab Shankar BoseWhole-time DirectorMs. Arundhuti DharIndependent DirectorMr. Bijan RoyIndependent Director
CHIEF FINANCIAL OFFICERMr. Arun Kumar Kedia
COMPANY SECRETARYMr. Sumit Kumar Surana
STATUTORY AUDITORSSRB & AssociatesChartered Accountants
COST AUDITORSN. Radhakrishnan & Co.Cost Accountants
SECRETARIAL AUDITORSB. Nair & Co.Company Secretaries
BANKERSState Bank of IndiaAllahabad BankPunjab National BankUCO BankUnited Bank of IndiaOriental Bank of CommerceSyndicate BankCorporation BankCentral Bank of IndiaThe Karur Vysya Bank LimitedThe South Indian Bank LimitedLakshmi Vilas Bank LimitedVijaya BankCanara BankBank of IndiaDena BankIDBI BankBank of BarodaUnion Bank of IndiaBank of Maharashtra
SOLICITORSKhaitan & Co.
REGISTERED OFFICE"Constantia Office Complex"(South Block), 8th Floor11, Dr. U. N. Brahmachari Street, Kolkata - 700 017Phone : (033) 2289 3122-4, Fax : (033) 2289 3121E-mail : [email protected] : www.emcpower.com
REGISTRAR & TRANSFER AGENTSMaheshwari Datamatics Pvt. Ltd.23, R. N. Mukherjee Road, 5th Floor, Kolkata - 700 001Phone : (033) 2243 5809/5029, Fax : (033) 2248 4787E-mail : [email protected]
Corporate Information
This Annual Report is available online at www.emcpower.com
Corporate Overview 1-18
Board & Management Reports 19-39
Standalone Financial Statements 40-84
Consolidated Financial Statements 85-124
Spreading andnavigating wings to
At EMC Limited we believe that the power to change and the courage to evolve are what will drive our continuing success.
Today we're consolidating on present strengths even as we continue to progress on many fronts besides revenue generation. Long term strategies activated by the management insight and the global opportunities saw EMC Limited become one of few-first multinationals in the industry, present across the high value and premium segments of Transmission Line business, Green energy generation and a dependable vendor-partner-supplier at the Indian Railways, generating healthy revenue from multiple business segments.
This report also pays tribute to our people - the EMC Team whose passion, commitment and innovative ideas will continue to keep your Company ahead as we spread our wings and soar, taking courses towards the new horizons we will conquer in the years that lie ahead.

Major countries in the world are keen to remove their power sector bottlenecks and re-energise their infrastructure
Electricity is vital for the socio-economic development of any country. The global power transmission line and distribution infrastructure business is likely to be benefitted by factors such as enhanced distribution infrastructure, expanding power transmission infrastructure, growing initiatives by the governments across the globe in order to upgrade power transmission units, growing demand for power globally, and rising focus on power generation via renewable sources of energy.
Growing measures towards the renovation and upgradation of existing grid infrastructure will stimulate the power transmission lines market share by 2024. Increasing adoption of renewable energy technologies over the existing fossil fuel will further augment the power transmission towers market size from 2016 to 2024.
329.3 GW India's power generation installed capacity as on 31st March, 2017
7,22,949 MVA India's sub-station transmission capacity as on 31st March, 2017
3,66,634 ckmIndia's transmission line network as on 31st March, 2017
64,000 MWIndia's inter-regional power transfer capacity as on 31st March, 2017
6,450 MWAlternate Transfer Capacity to South India as on 31st March, 2017
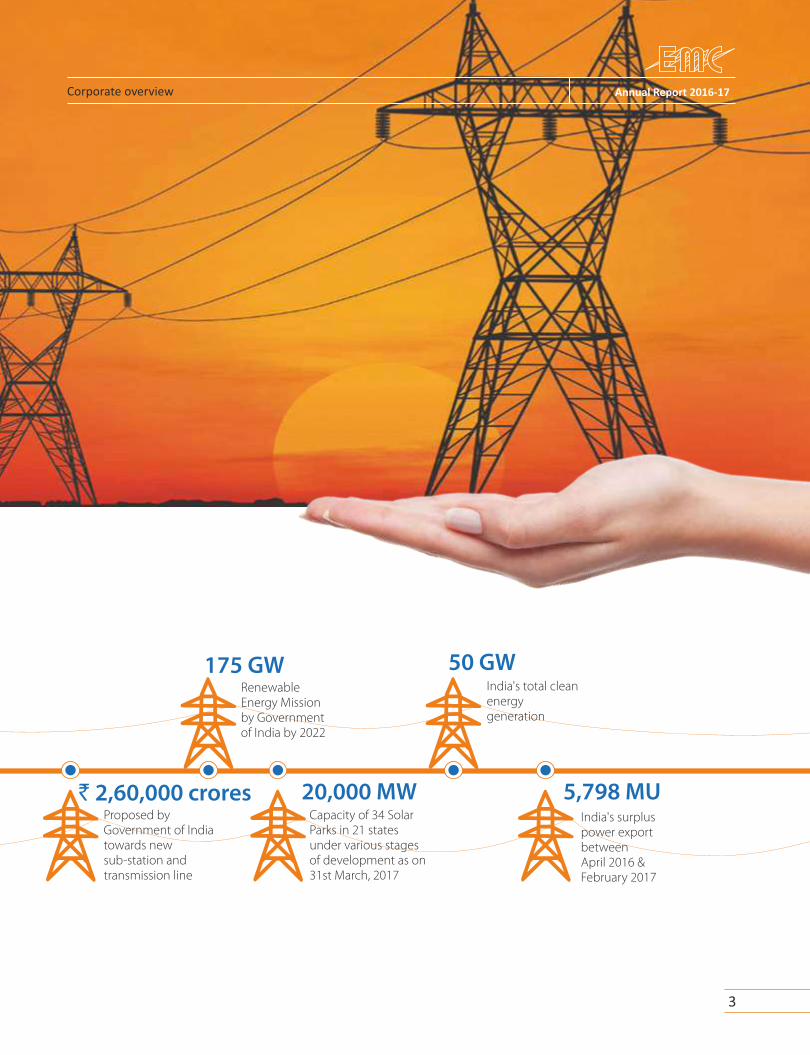
` 2,60,000 croresProposed by Government of India towards new sub-station and transmission line
175 GWRenewable Energy Mission by Government of India by 2022
20,000 MWCapacity of 34 Solar Parks in 21 states under various stages of development as on 31st March, 2017
50 GWIndia's total clean energy generation
5,798 MUIndia's surplus power export between April 2016 &February 2017
2 3
Corporate overview Corporate overview Annual Report 2016-17Annual Report 2016-17
Major countries in the world are keen to remove their power sector bottlenecks and re-energise their infrastructure
Electricity is vital for the socio-economic development of any country. The global power transmission line and distribution infrastructure business is likely to be benefitted by factors such as enhanced distribution infrastructure, expanding power transmission infrastructure, growing initiatives by the governments across the globe in order to upgrade power transmission units, growing demand for power globally, and rising focus on power generation via renewable sources of energy.
Growing measures towards the renovation and upgradation of existing grid infrastructure will stimulate the power transmission lines market share by 2024. Increasing adoption of renewable energy technologies over the existing fossil fuel will further augment the power transmission towers market size from 2016 to 2024.
329.3 GW India's power generation installed capacity as on 31st March, 2017
7,22,949 MVA India's sub-station transmission capacity as on 31st March, 2017
3,66,634 ckmIndia's transmission line network as on 31st March, 2017
64,000 MWIndia's inter-regional power transfer capacity as on 31st March, 2017
6,450 MWAlternate Transfer Capacity to South India as on 31st March, 2017
` 2,60,000 croresProposed by Government of India towards new sub-station and transmission line
175 GWRenewable Energy Mission by Government of India by 2022
20,000 MWCapacity of 34 Solar Parks in 21 states under various stages of development as on 31st March, 2017
50 GWIndia's total clean energy generation
5,798 MUIndia's surplus power export between April 2016 &February 2017
2 3
Corporate overview Corporate overview Annual Report 2016-17Annual Report 2016-17

At EMC, a dedicated pursuit represents the cornerstone of our business model and our focus towards spreading the wings & �y higher. The result being, today whenever there is an exigent project involving complex terrain knowledge, trained manpower, right mix of technology & equipment and a sound balance sheet, customers always turn to EMC.
Our focus and foresightedness has enabled us to adopt appropriate growth strategies for becoming a dedicated and dependable EPC player in the domestic as well as in the international T&D space thereby contributing to the nation building and indicating better prospects ahead for our Company.
VisionWe strive to set-up the highest standards of excellence in modern power systems globally.
MissionWe aim to be a global provider of outstanding, end-to-end integrated solutions in transmission lines, sub-stations, industrial power distribution and illumination projects and railway infrastructure projects through best-in-class technology, supported by experienced professionals, thereby enhancing scalability, providing clean energy, expanding business and empowering lives.
ValuesExcellence: Strive relentlessly and constantly improve ourselves in our offerings.
Integrity: Conduct our business fairly with “total” honesty and transparency.
Responsible: For our words and actions.
Respect: For our stakeholders, environment and community.
FACTS YOU NEED TO KNOW ABOUT EMC
With 6+ decades of legacy, the company was established during 19531
63 4 5
2
7
Registered office at Kolkata and Branch offices situated at New Delhi, Hyderabad, Chennai and Mumbai. Overseas presence at USA, Singapore, Italy, UAE, Hongkong, Tanzania, Kenya, Bangladesh, Saudi Arabia, Sweden, Finland, Peru and Chile
A pure-play EPC Company with established credentials in the Power T&D space and Railway infrastructure
Executed more than 16,000 kms of transmission line network of upto 765 kV in last six-and-a-half-decades through a support of more than 1500 employees
Turnover of ` 4,63,161.93 Lakhs
One of the few companies in the T&D sector to execute 765kV transmission line projects & upto 765kV sub-stations including GIS sub-stations and industrial power systems. Qualified to execute EHV Transmission Lines up to 500kV in leading European and African Countries
An ISO-9001 & ISO-14001 certified organisation; Also accredited for OHSAS-18001 occupational health and safety management system
4 5
Corporate overview Corporate overview Annual Report 2016-17Annual Report 2016-17

Supply ContractsTransmission line towers including Bolts & Nuts and Tower Accessories, Line Hardware, Insulators and Earth-wire.Construction ActivitiesSurvey, detailed soil investigation, civil construction of foundations, erection of towers, stringing of conductors and testing & commissioning of line.
Gas Insulated Substation (GIS) upto EHV 765 kV has been commissioned, one of it being the largest substation in South India.
EHV Substation projects up to 400 and 765kV; supply contracts for major equipments & auxiliary systems of substations; and construction activities including erection, testing & commissioning.
EHV Sub-Stations
Industrial PowerDistribution & Illumination
Load Distribution Centre (LDC); underground tunneling, electrical cabling & Cable Bridge; PLCC & SCADA installation, ventilation & A/C systems; and plant illumination, electrification & street lighting.
Manufacturing of hardware fittings, and accessories suitable for overhead power transmission lines and manufacturing of bare conductors and conductor accessories suitable for overhead power transmission lines.
Tower, Structures, Hardwares& Conductors
Spreading wings through our product offerings
Transmission Line Projects
EHV Gas Insulated Substation (GIS)
Signaling Systems; Security & Surveillance Systems; selective telephone systems; intrusion detection and access control; and anti collision device systems.
Manufacturing quality non-ferrous alloys, extrusions & forging and special aluminum alloy / copper components.
Overhead Electrification (OHE); Traction substation (TSS) & Associated SCADA systems; and general electrical work (station, depot, yard and workshop lighting, etc).
Design, engineering, supply, installation, testing, commissioning, maintenance, trading, innovation and development of technologies in the areas of signaling, telecommunication, safety and security systems; Interlocking works, outdoor & indoor supply and installation works; and maintenance of signal and telecommunication networks along new & existing railway lines.
Signaling & Safety Products Railways Electrification
Signaling, Telecommunication,Safety & Security System
Supply, test, transport, construction, erection, testing and commissioning of overhead lines; installation of distribution transformers, turnkey execution of rural electricity infrastructure and household electrification under different schemes of Govt. of India like APDRP, RGGVY and for direct work of SEB'S.
Our 5MW photo-voltaic (PV) Solar Power Plant located at Naini, Allahabad, commissioned in March, 2012 and successfully producing and supplying power to Central Grid.
Rural Electrification Solar Power Plant
Alloy Forging & Machine Products
6 7
Corporate overview Corporate overview Annual Report 2016-17Annual Report 2016-17

Spreading wings by pursuing consistent growthAt EMC, we believe that the junction to consistent growth is to deliver projects with technological and engineering excellence within the budgeted time and cost & acquire newer projects of strategic interests.
Our vision of transforming India’s transmission network gains strength from the technology, experienced management and project diversity which have enhanced our credibility as a dependable EPC player in the domestic and as well in the international T&D space.
How electricity does contribute to nation building?Power is one of the most critical components of infrastructure crucial for the economic growth and welfare of nations. India’s power sector is one of the most diversified in the world. Sources of power generation range from conventional to viable non-conventional sources as well. Electricity demand in the country has increased rapidly and is expected to rise further in the years to come. In order to meet the increasing demand for electricity in the country, massive addition to the installed generating capacity is required which will have to be balanced with a corresponding increase in power transmission sector investments. While generation has grown more than 11% since March 2011, transmission capacity has grown less than 7% since then. To address all of the above, a huge strengthening of the transmission infrastructure is required, not only in terms of its resilience, but also in terms of geographical spread. Recognizing this fact, the Draft National Electricity Plan of December 2016 states that the All-India transmission capacity addition during the 13th Five Year Plan (for a period of 2017-2022) would require a capital investment of ` 2.6 Lakh crores.
How EMC contributed to the change and achieved growth?EMC is one of the leading EPC infrastructure companies in India involved in the complex T&D business with an experience of around 23,000 days (since inception). The Company’s management’s reputation and experience has been built on a track record of successful execution of several projects of repute. At EMC, we follow an integrated approach towards the implementation of projects with an objective of achieving quality. Although India’s power sector is grasping with shrinking realisations, dwindling margins thereby threatening the projects viability, but our Company’s integrated presence across the value chain and strong in-house capabilities makes us uniquely positioned to capitalise on emerging opportunities and flexibility to enter new ones. The Government’s growing emphasis on the “765 kV single line transmission projects and sub-stations” makes the future of ours more viable as we are only one of the few companies domestically as well as internationally with an expertise to execute such projects. Besides keeping our presence in the lucrative 400kV – 765 kV segment, we are also planning to enter and bid for the 1200 kV segment.
Esteemed Clientele
Power Grid Corporation of India Ltd.
Transmission Corporation of Andhra Pradesh
West Bengal State Electricity Transmission Company Ltd.
Maharashtra State ElectricityTransmission Co. Ltd.
Jammu & KashmirPower Development Department
Central Organisation forRailway Electrification
Maharashtra State Electricity Distribution Co. Ltd. West Bengal State Electricity
Distribution Company Ltd.
Ameren Corporation, USAFingrid Oyj, Finland Svenska Kraftnat, Sweden
Terna S.p.A, Italy
Power Grid Company of Bangladesh Ltd., Bangladesh
JSC Georgian State Electrosystem, Georgia
Tanzania Electric SupplyCo. Ltd.
8 9
Corporate overview Corporate overview Annual Report 2016-17Annual Report 2016-17

Spreading wings and de-risking from singular sector dependence
Hope is always good but solely relying on hope, isn’t. In our experience of more than six decades we are well aware that every downturn leads to an upturn and vice versa. However, the critical factor is preparation. Being prepared is the only reason why some walk and the others soar in wake of an opportunity.
At EMC, we choose to be prepared. Thus we forayed into green power generation and railway infrastructure business thereby insulating us from sectoral downtrend and reporting steady performance during economic slowdown.
Foray into the exciting railway infrastructure business
Indian Railways have a total 66,000 route Kms which was operating on Diesel engines, in view of cost of Diesel & Pollution issues the Government of India decided to go for overhead electrification of all its railways network operating on Diesel engines. Railway Ministry ‘s plan for electrification has been in progress and 28,000 route Kms have already been electrified. In the last three years electrification of railways has gathered momentum to 5,000 route Kms per year, up from 1,800 route Kms. Recently, the Railway Ministry has announced to electrify balance 38,000 route Kms in next four years. Once the objective of Railway Electrification is achieved, cost of operation as well as carbon emission will be drastically reduced.
Railway Ministry has also accessed that railways are consuming electricity of 18.25 billion units out of which 85% is traction energy for operation of Railways across the country. In order to reduce the consumption of conventional electrical energy the Railway Ministry has already started installation of photo-voltaic solar panels on roof of railway coaches and wagons. The Government has set up an ambitious objective to have entire network of railways to be run on Green Energy (Solar Power) by 2040.
In view of above, the Company expects to improve its footprints in Railway network by tapping huge potential in Railway Electrification projects. During the last five years, the Company has already achieved a reputable milestone in Railway sector by obtaining 10 projects for electrification including the single largest order worth ` 300 crores from one of its esteemed client Central Organisation for Railway Electrification (CORE) for Ahmedabad (Excl.) Rajkot (Incl.) and Mehsana (Excl.) Viramgam-Samkhiyali (Incl.) Section of Ahmedabad & Rajkot Division of Western Railway under RE Project Ahmedabad (Total 525 RKM / 1066.31 TKM).
Besides above, the Company has successfully commissioned Turnkey projects of Signaling & Telecommunication (S & I) and Train Protection Warning System (TPWS) in India as well as Overseas in Railway Sector.
Graduating from conventional to non-conventional
Globally renewable power generation reported capacity recorded its largest annual increase in 2016 with an estimated of total 161 GW of total capacity addition. Solar energy accounted for 47% of the world’s total share. The Government of India is committed to increased use of clean sources of energy. The Ministry of New and Renewable Energy (MNRE) has set an ambitious target to set up 100 GW of solar energy capacity by 2022.
EMC moved up from addressing conventional energy requirements to renewable energy generation. This extension was inspired by the conviction that sustainable growth could only be achieved from a progressive reduction in the dependence on conventional sources of energy. During 2012, the Company had entered into solar power generation through its subsidiary “EMC Solar Limited” and commissioned a 5 MW solar power plant (under Jawaharlal Nehru National Solar Mission) at Naini in Allahabad, India. We at EMC believe that this ‘green energy’ requirement and its further linking with national grid will need specialist service providers who understand the complexities of conventional & renewable energy and can manage to combine both with scale and technology. Truly, EMC is at the right place and at the right time.
10 11
Corporate overview Corporate overview Annual Report 2016-17Annual Report 2016-17
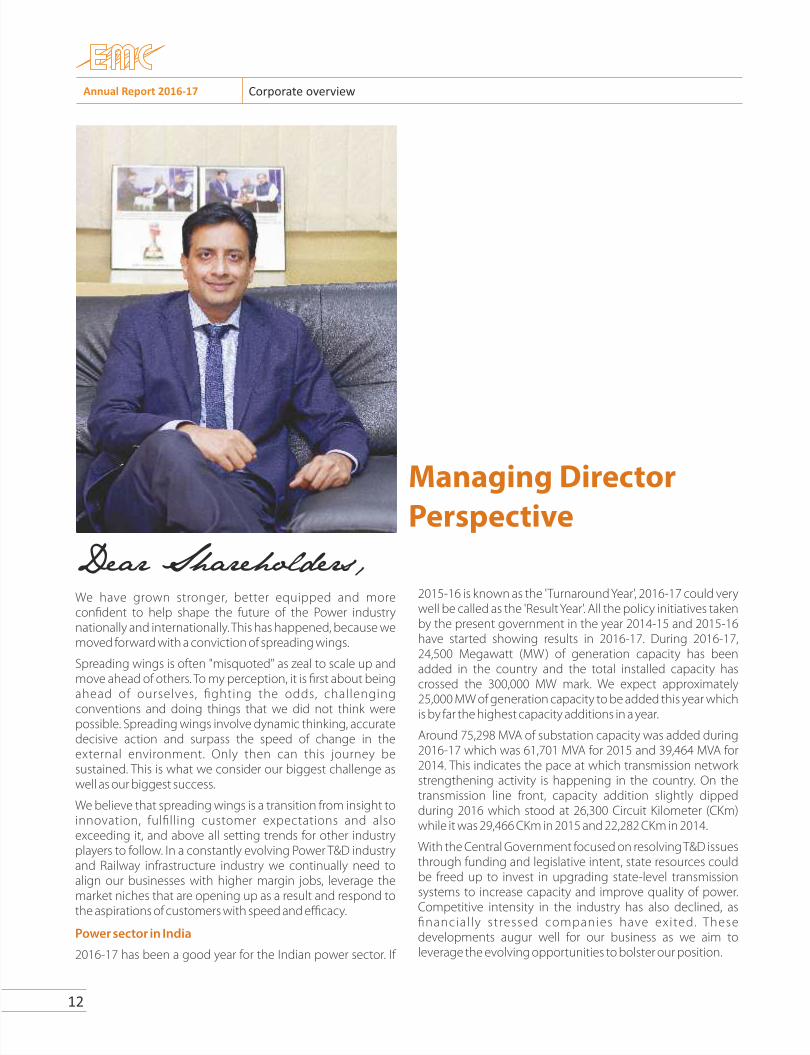
Managing DirectorPerspective
We have grown stronger, better equipped and more confident to help shape the future of the Power industry nationally and internationally. This has happened, because we moved forward with a conviction of spreading wings.
Spreading wings is often "misquoted" as zeal to scale up and move ahead of others. To my perception, it is first about being ahead of ourselves, fighting the odds, challenging conventions and doing things that we did not think were possible. Spreading wings involve dynamic thinking, accurate decisive action and surpass the speed of change in the external environment. Only then can this journey be sustained. This is what we consider our biggest challenge as well as our biggest success.
We believe that spreading wings is a transition from insight to innovation, fulfilling customer expectations and also exceeding it, and above all setting trends for other industry players to follow. In a constantly evolving Power T&D industry and Railway infrastructure industry we continually need to align our businesses with higher margin jobs, leverage the market niches that are opening up as a result and respond to the aspirations of customers with speed and efficacy.
Power sector in India
2016-17 has been a good year for the Indian power sector. If
Dear Shareholders,2015-16 is known as the 'Turnaround Year', 2016-17 could very well be called as the 'Result Year'. All the policy initiatives taken by the present government in the year 2014-15 and 2015-16 have started showing results in 2016-17. During 2016-17, 24,500 Megawatt (MW) of generation capacity has been added in the country and the total installed capacity has crossed the 300,000 MW mark. We expect approximately 25,000 MW of generation capacity to be added this year which is by far the highest capacity additions in a year.
Around 75,298 MVA of substation capacity was added during 2016-17 which was 61,701 MVA for 2015 and 39,464 MVA for 2014. This indicates the pace at which transmission network strengthening activity is happening in the country. On the transmission line front, capacity addition slightly dipped during 2016 which stood at 26,300 Circuit Kilometer (CKm) while it was 29,466 CKm in 2015 and 22,282 CKm in 2014.
With the Central Government focused on resolving T&D issues through funding and legislative intent, state resources could be freed up to invest in upgrading state-level transmission systems to increase capacity and improve quality of power. Competitive intensity in the industry has also declined, as financial ly stressed companies have exited. These developments augur well for our business as we aim to leverage the evolving opportunities to bolster our position.
Renewable energy push
The Ministry of New and Renewable Energy (MNRE) has taken several steps to fructify our countries dream of clean energy. The largest renewable capacity expansion program in the world is being taken up by India. The government is aiming to increase share of clean energy through massive thrust in renewable. Core drivers for development and deployment of new and renewable energy in India have been Energy security, Electricity shortages, Energy Access, Climate change etc.
A capacity addition of 14.30 GW of renewable energy has been reported during the last two and half years under Grid Connected Renewable Power, which include 5.8 GW from Solar Power, 7.04 GW from Wind Power, 0.53 from Small Hydro Power and 0.93 from Bio-power. The total installed capacity of renewable energy during the end of FY 16-17 stood at 57,260 MW. Confident by the growth rate in clean energy sector, the Government of India in its submission to the United Nations Frame Work Convention on Climate Change on Intended Nationally Determined Contribution (INDC) has stated that India will achieve 40% cumulative Electric power capacity from non-fossil fuel based energy resources by 2030 with the help of transfer of technology and low cost International Finance including from Green Climate Fund. The very nature of non-firm (renewable) energy will need diverse transmission competencies. Besides, the management of large quantities of this energy in a sophisticated manner poses to be a wholly different ball game. This sophistication will demand the reconciliation of efficient systemic design with cutting-edge electronic solutions and dynamic load management capabilities.
Global electricity demand is expected to increase to 34,460 TWh by 2040 at an average increase of 2.6% p.a. This is primarily driven by electrification and economic growth in emerging nations. The anticipated increase in demand is expected to give a boost to the global installed capacity at a pace of 71.5% from 6,500 GW in 2016-17 to 10,570 GW by 2040, with the generation mix increasingly shifting towards clean source of energy. Additional transmissions lines will be required to facilitate the evacuation as utilities and governments across the world develop new generation projects. While Transmission & Distribution (T&D) investment will be significant in all major geographies, the largest will be expected from China and India, since they are expected to foresee a rising electricity demand while modernizing their grids. Out of the total T&D investments from 2014 to 2040, 70%
is expected to be contributed from non-OECD countries. As per World Energy Outlook, a total of USD 20 trillion is expected to flow in the power sector between 2015 and 2040. The global electric power transmission network is set to expand from 6 million CKm of high-voltage lines in 2016 to 6.8 million CKm by 2020, representing a CAGR of 3%.
Railway business
Railways offer vast array of opportunities to the service providers in this sector. Indian Railways aims to be the engine for India's economic growth and development by being safe, financially viable, environment-friendly and caring for its customers. Indian Railways is putting thrust on to increase throughput on existing network, build terminal infrastructure, accelerate infrastructure build out and deliver a safer & high speed network.
Rising income levels and increasing urbanisation is going to drive sustained growth in the passenger segment. Growing industrialisation increased freight traffic is expected to increase even more following economic growth on the one hand and growing private sector investments on the other. Over the next 10-12 years, the Railways are looking at investing US$500 billion to increase capacity and upgrade existing infrastructure. The government is also envisaging metro rail projects across many cities over the next ten years. With increasing participation expected from private players, both domestic and foreign, due to favourable policy measures, both passenger and freight traffic is expected to grow rapidly over the medium to long term.
At EMC, our capabilities in building railway infrastructure are unparalleled. We cater to every aspect of railway infrastructure contracting: right from laying tracks; railway infrastructure; signaling, telecommunication and safety & security systems; overhead electrification. We aim to play as a connecting lifeline thereby reducing travel time, helping to create new markets for goods & services, accelerating economic development and social upliftment in adjoining regions.
Advantage EMC
I am pleased that during 2016-17, EMC reinforced its building blocks and emerged as a unique power sector company in India. The Company reported Turnover of ̀ 4,63,161.92 Lakhs. and PAT stood at ` 16,579.83 Lakhs. This profitability in a challenging environment was the result of a conscious business de-risking that the Company commenced a few years ago.
We believe that spreading wings is a transition from insight to innovation, fulfilling customer expectations and also exceeding it, and above all setting trends for other industry players to follow
12 13
Corporate overview Corporate overview Annual Report 2016-17Annual Report 2016-17

For one, we at EMC began bidding for increasingly complex projects marked by lower competition and higher margins to counter the decline in the strike-rate for usual EPC projects, graduated our business model towards predictable revenues and embarked on the exercise to evolve from a project contractor to diversified supplier of various components needed in a power T&D and EPC business. I am pleased to state that at a time these initiatives are well paying-off, strengthening EMC's prospects.
Secondly, we strategically intended to emerge as a power generator and so our foray into a 5MW Solar Power Plant at Naini in Allahabad, Uttar Pradesh and the power purchasing agreement (PPA) signed with NTPC Vidyut Vyaapar Limited reinforce our commitment towards forward integration and de-risking our business model through clean energy.
Thirdly, we are also a dependable vendor-partner-supplier at Indian Railways, and offers best-in-class design, installation, testing and commissioning of electronic signaling, telecommunication and OHE and TSS for railway networks, both mainline and mass transit systems with a huge experience of more than a century.
With this we have de-risked our business from dependency on revenue and healthy margin from one segment to multiple ones.
Banking on strengths
EMC possesses the skill of being one of the few companies with an experience of laying upto 16,000 kms of transmission lines and delivering complex projects across all voltage platforms and in challenging climatic and topographic condit ions that include deser ts, snowfields, seas, mountainous regions and thick forests as well as in exigent socio-political conditions including war-torn regions.
We enjoy a leadership position in 500-plus kV space and are one of the few companies to execute the premium 765 kV transmission line, sub-station and industrial power systems. We are also qualified to execute transmission lines of upto 400kV in leading African and European countries. We think as more private companies would enter into power generation, they would require the specialization of dependent partners like EMC for setting up transmission lines up to 1200kV.
We at EMC are proud that we executed India's largest 765kV/400 GIS kV substation in Vemagiri in Andhra Pradesh. We completed 212 km of 765 kV Salem –Tuticorin
transmission line in barely 4 months time thereby setting a new benchmark of turnkey execution of T&D projects. The 500kV transmission line project of 100kms in Georgia, 230 kV D/C Transmission Line project in Bangladesh and 400kV D/C TL & 400/220/33kV sub-station projects in Tanzania contract by us is going to be a game changer into the working history of EMC. We are also pleased to mention that we have successfully completed our first Railway OHE project on Turnkey Basis in Vizianagaram (Excl.) - Singapur Road and are also working on handful of projects of repute in the railway infrastructure business.
Survival Strategies
Future is promised to no one and therefore belongs to people who are ready to create it. At EMC, we have built a well-integrated Company with a business model relevant for all market cycles through the following initiatives:
Ÿ By retaining its industry pre-eminence through quality services supported by robust technical capabilities, rich project management skills and large, complex project execution.
Ÿ Improved the consistency and discipline of its business practices across all business verticals.
Ÿ Increased its capacity to execute contracts through the addition of engineers and technical members on the one hand and the expansion of design centre on the other.
Ÿ Pursued continuous improvement in everything we did.
Ÿ Leverage established position in key technologies; alliances with global leaders for access to superior capabilities in the execution of large and technically challenging projects.
Expectations and Prospects
EMC is attractively positioned for 2017-18. We are building on proven strengths, and your trust gives us the courage to continue doing what we love and are passionate about: Spreading wings and powering nations across the globe. We cherish your trust. I, on behalf of the Board of Directors and the entire leadership team, thank you for this love and support, and assure you a great future ahead.
With best wishes
Manoj Toshniwal
Spreading wings and widening geographical presence For all those companies dedicated to growing their presence in India, the last few years remained challenging yet bright.
Over the years we at EMC have reinforced our business model by widening our geographic presence across global pockets that not only enjoy similar demographics to India but also at those which are marked by growing sectoral potential.
For all those companies, whose sole dependency were on projects and services coming out of India's power and railway infrastructure business, were at visible risk on being dependent on a single geographical segment. At EMC, we did the opposite. We went on to bid and bag projects at countries outside with long term growth potentials. The result being, today we are present across 14 countries outside India. This multi locational presence have contributed significantly to our total revenue during the Financial Year 2016-17.
Today, we are having an order book of approx.100 million USD for transmission line and substation projects at Tanzania in Africa. We are also working on: 230 kV D/C Transmission Line on turnkey basis in Bangladesh from Power Grid Company of Bangladesh; 500 kV Transmission Line project of 100 kms in Georgia; 400 kV Transmission Line Project from Arusha – Namanga (Kenya – Tanzania Interconnection Project) of 114 kms; and 400/220/33kV, 2 X 250 MVA & 2X 125 MVA Substation at Arusha & extension of existing 220/33 kV substation at Singida.
Vrigstad, Sweden
Pori, Finland
Lima, Peru
Santiago, Chile
Venice, Italy
Tanzania
Kenya
Dubai, UAE
Riyadh, Saudi Arabia
Tulsa, USA
Kolkata, IndiaDelhi, IndiaChennai, India
Hyderabad, India
Mumbai, India
Hong Kong
Singapore
EMC possesses the skill of being one of the few companies with an experience of laying upto 16,000 kms of transmission lines and delivering complex projects across all voltage platforms and in challenging climatic and topographic conditions
Bangladesh
Georgia
14 15
Corporate overview Corporate overview Annual Report 2016-17Annual Report 2016-17

Crystal Star Award 2017 to ASC, Inc.Governor's Manufacturing
Leadership Award 2015 to ASC, Inc.
International Laurels
Ÿ ISO-9001 certification ISO-14001 certification by KVQA for Transmission line business.
Ÿ OHSAS-18001 certification by KVQA for occupational health and safety management system.
Ÿ The Company has been awarded by Power Grid for Transmission Line Performance - Volume of Work during the F.Y. 2016-17.
Ÿ The Company has been awarded by Power Grid for Substation Performance (765kV) during the F.Y. 2016-17.
Ÿ The Company has been awarded by Power Grid for support for critical targets – Transmission Line during the F.Y. 2016-17.
Ÿ The Company has been awarded by CORE for Gr.166 under RE Project.
Ÿ The Company's JV has also been appreciated for the Railway Electrification work in difficult terrain by Railway Electrification Board, Danapur division.
Ÿ The Company's JV has also been appreciated by CORE for exceeding target set for Railway Electrification work.
Quality Certi�cations
Support for critical targets - Transmission Line during the F.Y. 2016-17.
Special Performance during the year 2014. Extraordinary Achievement in completion of Transmission Lines during the year 2013.
Maximum Volume of work during FY 2015-16. Maximum Capitalization during FY 2015-16.
Transmission Line Performance-Volume of Work-II during the F.Y. 2016-17.
Substation Performance - 765kV during the F. Y. 2016-17.
Best Performance awards from Power Grid Corporation of India Limited (PGCIL) for consecutively last 4 years
16 17
Corporate overview Corporate overview Annual Report 2016-17Annual Report 2016-17
Spreading wings by focusing on quality parameterAt EMC Limited, our main objective is to be recognised as “quality enablers”. We always remain focused and ensure that the highest standards of products and utmost care are followed at our various factories and project sites. At EMC the quality function is reflected in the manner we handle every aspect of our business. We cannot be recalled as a dependable vendor-partner in the T&D industry if we are not concerned about the quality of our processes and deliverables. When we achieve this level of quality leadership in everything we do, then only we are recognised as quality enablers. This quality framework and implementation at our Company have made us won with various international laurels and certifications including:

Concept, design by MANJARI ENTERPRISESPh : (033) 40012822 | [email protected]
18
Corporate overviewAnnual Report 2016-17
Spreading wingsby fostering relationships At EMC Limited, we recognise that growth does not come from how well we can grow our assets. But from how well we can grow our relationships. The soul of our unwritten mission statement is not about the profits for the Company, but with value for the stakeholders associated with the Company.
Talent Management at EMC involves the design and implementation of strategies, policies and systems to ensure that highly qualified individuals can be attracted, recruited and retained. Our company is fully committed towards its responsibilities and is contributing effectively to facilitate value-creation in various arenas of its operations including health & safety, employee training. Our skilled team of over 1500 peoples including technical & non-technical staff, drives execution excellence. Through initiatives like employee engagement in decision making, annual get-together, sports & office picnic, the Company aims to foster a sense of equality and diversity amongst its human resource.
EMC Academy is one such unique institution established by the Company which imparts training in various disciplines for the professional development of engineers, supervisors and other skilled & non-skilled manpower to meet the growing need of trained manpower in the power sector.
We also work with our suppliers, customers and various other peoples associated with the Company on a long-term perspective. Innovative management policies ensure the development and trust of various stakeholders. Our above-industry average performance has come from the extension of this value beyond a one-off transaction into a sustainable relationship across the long-term.
A classroom session at EMC Academy

19
Management Discussions & Analysis Annual Report 2016-17
Global economy
Stagnant global trade, subdued investment and heightened policy uncertainty marked another difficult year in the world economy. A moderate recovery is expected for 2017, weak investment is weighing on medium term prospects across many emerging markets and developing economies. Although fiscal s mulus in major economies, if implemented, may boost global growth above expecta ons, risks to growth forecasts remain tled to the downside. Important downside risks stem from heightened policy uncertainty in major economies.
As per the World Bank, global growth rate is projected to accelerate to 2.7% in FY 18 and further expected to strengthen to 2.9% in FY 19, in line with previous projec ons. However, the world economy con nues to face a number of downside risks. These include increased protec onism, heightened policy uncertainty, the possibility of financial market turbulence and over the longer run weaker poten al growth. These risks highlight the urgency for policymakers in emerging market and developing economies to rebuild macroeconomic policies and implement policies that support investment and trade.
Indian economy
India remains one of the fastest growing economies in the world despite the temporary slowdown in growth due to government’s decision to withdraw high denomina on notes from circula on. High frequency data, such as automobile sales, cement consump on; personal loan growth and exports growth suggest that the economy is gradually recovering from the impact of demone sa on. RBI expects real GDP growth to accelerate to 7.3% in FY18 from 6.6% in FY17 (GVA basis). Sustained low infla on, falling fiscal deficit, low current account deficit, and a stable currency have created a posi ve environment for economic growth. Goods and Services Tax (GST) is expected to be implemented in India in FY18. This unified tax regime, coupled with the Central Government’s thrust on areas, such as power, infrastructure, and affordable housing should help accelerate India’s growth rate closer to 8% in the medium term.
India’s consump on growth over the past decade has been strong and resilient even during periods of slower GDP growth. This bodes well for our industry, as spends on power and t&d (transmission and distribu on) are linked to government’s readiness to upgrade the exis ng power network and power-up newer terrains. The year 2016-17 con nued to be challenging with moderate growth in the market, be er than the preceding three years that saw a steady decline in growth. Power Infrastructure investments were primarily driven by the central u li es, state u li es and private transmission players, with focus on building high capacity power transmission corridors and strengthening the inter and intra-state transmission networks.
Indian Power industry review
India’s GDP has grown at a rate of 7.9% in 2016–17 in tandem with an increase in industrial and commercial ac vity in the country. With the growth in the economy, electricity consump on is set to grow rapidly in the next decade driven by popula on growth, as
well as increasing urbaniza on. This is par cularly relevant given increased expecta ons for economic growth and reforms. India has the fi h-largest power genera on sector globally, with a total installed capacity of more than 329.3 GW. The country has added 88.10 GW of capacity as part of the Twel h Five Year Plan, achieving 98.6% of its capacity addi on targets (88.50 GW). Thermal power dominates the genera on mix with total installed capacity of 211.90 GW (69.5%), followed by renewable power with 44.20 GW (14.5%), hydro with 42.90 GW (14.1%), and nuclear power with 5.80 GW (1.9%). The sizeable coal power project pipeline and the widespread availability of coal — from low cost Asia seaborne imports and growing domes c produc on — is likely to ensure that coal will remain the dominant fuel choice for India’s power sector, despite growth in renewable sources. The contribu on of the private sector in terms of total capacity addi on is increasing, and has now surpassed 126.60 GW (41.6%) followed by state governments and the Central Government with respec ve contribu on of 101.90 GW (33.4%) and 76.20 GW (25.0%).
India‘s power transmission network has expanded rapidly in the last five-year plans with 32.70% growth in transmission lines, and 61.1% in AC transforma on capacity from FY12 to end of FY16-17. Total transmission lines in India stood at 3,66,634 ckm and around 75,298 ckm of transmissions lines were commissioned between in FY16–17. In addi on, total transforma on capacity stands at 7,22,949 MVA.
Significant expansion of inter-state transmission system is under way to cater to the transmission requirement of new genera on projects. India has an inter-regional power transfer capacity of appx 64,000 MW. The transmission sector has taken up several ini a ves in order to expand the grid resource efficiently. The government is targe ng an addi onal investment of Rs.2,60,000 crores towards addi on of 1,05,580 ckm of transmission lines and 2,92,000 MVA of transmission capacity between 2017-2022. Transmission line capacity is being upgraded to high voltage 1,200 MW. To reduce Right of Way (ROW) requirements for transmission lines, 765 kV transmission voltage is increasingly being adopted. This is due to the fact that a single-circuit 765 kV line can carry as much power as three single-
9876543210
FY 14 FY 15 FY 16 FY 17 FY 18(E)
FY14 FY15 FY16 FY17 FY18(E)
6.2 6.9 7.9 6.6 7.3
(Source: CSO & RBI)

20
Annual Report 2016-17 Management Discussions & Analysis
circuit 500 kV lines, three double-circuit 345 kV lines, or six single-circuit 345 kV lines, reducing the overall number of lines and rights of way required to deliver equivalent capacity. Moreover, gas-insulated substa ons (GIS) are preferred, since the total space required for a GIS is 10% of that needed for a conven onal substa on. This will help combat the problem of land requirement. Compe ve landscape/industry structure Power Grid Corpora on of India Ltd. (PGCIL), owns 80% of interstate transmission networks while accoun ng for 95% of state transforma on capacity. Ministry of Power (MoP) has also announced mandatory procurement of transmission services through compe ve bidding thereby, encouraging private sector investments in the industry. The private players can enter the power transmission industry via two routes — joint ventures and independent power transmission projects. These all expected to unfold tremendous opportuni es for players like us.
Distribu on reforms underway
Lowest peak power deficit ever
For the first me in the Indian power sector’s history, energy deficit has fallen below the 1% mark which is a significant achievement. The deficit which was during the beginning of 2016 further reduced to 0.6% at the end of 2016. On the peak deficit front, for 2016, peak demand recorded at 159,500 MW during September 2016 and peak deficit in that month was 1.6% which is also the lowest for any calendar year. Consistent genera on capacity addi on and almost a flat growth in power demand have helped this cause.
UDAY – yet to see the full impact of it on Distribu on U li es
The Ujwal Discom Assurance Yojana (UDAY) has been one of the most talked about schemes related to the Indian power sector. The scheme has been designed in such a way so as to strike at the heart of the issues bugging the whole sector – the inefficient opera on of the power distribu on companies. As per the report from the ministry, of the 16 states which are part of the scheme, at least eight have a lower gap between their average cost of electricity supply and average cost of realisa on and about 12 states have reduced their Aggregate Technocal & Commercial (AT&C) loss levels. If successfully implemented, this policy can permanently solve the long-standing issues of the distribu on sector and revive energy demand of the country.
‘Power For All’ and 100 percent Rural Electrifica on – going on full thro le and may achieve targets sooner
Under Deen Dayal Upadhyay Gram Jyo Yojana’s (DDUGJY) rural electrifica on package, measures were taken up in mission mode star ng August 2015 with a target to electrify un-electrified villages of the country by May 2018, to fit into the grander plans of providing ’24×7 Power for All’ by 2019. As per GARV dashboard, of the 18,452 villages to be electrified, electrifica on has already been done for 11,434 villages. Electrifica on needs to be carried out in 6,320 villages and the remaining 698 villages are uninhabited. Other than the above men oned mega policies, few other policies like New Tariff Policy, Wind Re-
powering policy, Wind Solar Hybrid Policy etc. were announced in 2016 which is going to help the sector in coming years.
Never seen before Transparency in the Power Sector
Every aspect of the power sector performance is now mostly available on a tap on a mobile phone through various apps being developed by the Ministry. This is a far improved scenario in a sector which was known for its bureaucra c and opaque func oning. Various apps have been developed to bring in transparency and instant informa on dissemina on. Some of these apps include Garv, Vidyut Pravah, DEEP, Tarang, Ujjala etc
Energy efficiency in the forefront and crea on of a Major PSU ‘Ratna’ in the making in double quick me
Energy efficiency has been in the forefront since the last 2.5-3 years and a separate PSU named EESL (Energy Efficiency Service Ltd) was formed with the task of crea ng the market for Energy Efficiency through a business plan and not be dependent on Government subsidies. This has taken a huge turn and we have nearly 180 million LED Bulbs and 1.5 million LED Street Lights having been distributed
Power points:
• India is world’s sixth largest energy consumer, accoun ng for 3.4% of global energy consump on.
• The aim of Government of India is to provide each household access to electricity, round the clock (24x7).
• The per capita power consump on in India is 733.54KWh/yr.
• Total capacity increased by 24 GW in 2016-17.
• The es mated private sector investments in T&D is expected to reach Rs. 3 trillion by 2019 including government support of Rs. 1 trillion through Deen Dayal Upadhyay Gram Jyo Yojana (DDUGVY) and the Integrated Power Development Scheme (IPDS).
• At the end of 12th Five - Year Plan, 42% growth in the transmission line capacity addi on is expected and 69% in the substa on capacity. By the end of 12th Five-Year Plan it is expected that the na onal grid inter regional power transfer capacity will be 72,250 MW.
• In the beginning of FY16-17, India, for the first me in history, India became a power-surplus country, leaving behind a historical legacy of increasing power deficit. In the April-February period, it exported around 5,798 MU to Nepal, Bangladesh, and Myanmar. As per the Central Electricity Authority, India is likely to end FY17 with 1.1% excess electricity supplies thus paving a way to become an exporter in this industry space.

21
Management Discussions & Analysis Annual Report 2016-17
already and many other energy efficiency products are on the way to create self- sustaining and low cost energy efficiency market in India.
Renewable sources of energy
For the first me in the country, capacity addi ons in the renewable energy sector were close to those of the thermal power segment in 2016-17. The renewable energy sector has ended 2016-17 with a record capacity addi on of 11,320 MW, though it fell short of its target (16,660 MW) for the year. Capacity addi ons in thermal power segment stood at 11,551 MW during the fiscal.
The fiscal 2016-17 witnessed many milestones in the clean energy segment – total installed capacity of the sector crossed 50 GW and solar contribu on stood at 10 GW. During 2016-17 solar industry brought in 5,526 MW of new capacity to the grid against the target of 12,000 MW (including Wind Energy) and total installed capacity of solar power stood at 12,289 MW (Source: Union Ministry of New and Renewable Energy).
In order to achieve the renewable energy target of 175 GW by the year 2022, the major programmes/schemes on implementa on of Solar Park, Solar Defence Scheme, Solar scheme for CPUs Solar PV power plants on Canal Bank and Canal Tops, Solar Pump, Solar Roo op etc have been launched during the last two years.
Various policy measures have been ini ated and special steps taken in addi on to providing financial support to various schemes being implemented by the Ministry of New and Renewable Energy (MNRE) for achieving the target of renewable energy capacity to 175 GW by the year 2022. These include, inter alia, suitable amendments to the Electricity Act and Tariff Policy for strong enforcement of Renewable Purchase Obliga on (RPO) and for providing Renewable Genera on Obliga on (RGO); se ng up of exclusive solar parks; development of power transmission network through Green Energy Corridor project; iden fica on of large government complexes/ buildings for roo op projects; provision of roof top solar and 10% renewable energy as mandatory under Mission Statement and Guidelines for development of smart ci es; amendments in building bye-laws for mandatory provision of roof top solar for new construc on or higher Floor Area Ra o; infrastructure status for solar projects; raising tax free solar bonds; providing long tenor loans; making roof top solar as a part of housing loan by banks/ NHB; incorpora ng measures in Integrated Power Development Scheme (IPDS) for encouraging distribu on companies and making net-metering compulsory and raising funds from bilateral and interna onal donors as also the Green Climate Fund to achieve the target.
Major Ini a ves taken by Ministry for development of Solar Power
• Under Na onal Solar Mission, the target for se ng up solar capacity increased from 20 GW to 100 GW by 2021-22. Target of 10,500 MW, set for 2016-17 which will take the cumula ve capacity to 17 GW ll 31st March 2017.
• As on date, 19,276 MW has been tendered out, of which LOI issued for 13,910 MW/PPA signed for 10,824 MW.
• 34 Solar Parks of capacity 20,000 MW in 21 states have been sanc oned which are under various stages of execu on.
• Total amount of Rs.67.01 crore has been sanc oned for prepara on of master plans, solar city cells, promo onal ac vi es and installa on of renewable energy projects and an amount of Rs.24.16 crore has been released, so far, under Solar City Programme.
• Various departments and ministries under central government have collec vely commi ed to deploying 5,938 MW of roo op solar capacity for their internal power consump on. SECI is aggrega ng demand for a part of this requirement and helping in procuring roo op solar systems. SECI has issued a tender for development of 1,000 MW roo op solar capacity on pre-iden fied central government/department owned buildings. It is the largest such tender in India’s fledgling roo op solar market.
• Several schemes namely (i) Defence scheme (ii) Central Public Sector Undertakings (CPSUs) scheme (iii) Bundling scheme (iv) Canal Bank/Canal Top scheme (v) VGF Scheme (vi) Solar Park scheme (vii) Solar roo ops, have been ini ated/launched by the Ministry under Na onal Solar Mission which are under implementa on.
• A target of 40 GW grid connected solar roo ops to be achieved by 2022 has been set. So far, about 500 MW have been installed and about 3,000 MW has been sanc oned which is under installa on. All major sectors i.e. Railways, Airports, Hospitals, Educa onal Ins tu ons; Government Buildings of Central/State/PSUs are being targeted besides, the private sector.
• A massive Grid Connected Solar Roo op Programme launched with 40 GW target. State Electricity Regulatory Commissions of 30 States/UTs no fied regula ons for net-metering/feed-in-tariff mechanism. Rs.5000 crore approved for solar roo ops. About 500 MW solar roo op capaci es installed ll 30.09.2016.
• Ministry has ed up with ISRO for Geo tagging of all the Roo op plants using ISRO’s VEDAS Portal.
India Railway – a jewel in our crown
EMC Ltd is also engaged into the business of Railway infrastructure.
Indian Railways, is among the world’s largest rail networks. The Indian Railways network is spread over 115,000 km, with 12,617 passenger trains and 7,421 freight trains each day from 7,172 sta ons plying 23 million travellers and 3 million tonnes (MT) of freight daily. India’s railway network is recognised as one of the largest railway systems in the world under single management.
22
Annual Report 2016-17 Management Discussions & Analysis
In the last budget, the Government decided to provide Rs. 55,000 crore (US$ 8.25 billion) towards capital and development expenditure of Railways. The Government proposed to commission 3500 kms of Railway line in 2017-18. The Ministry of Railways has signed a memorandum of understanding (MoU) with the Ministry of Urban Development, under which railway sta ons in each city included in the SMART Ci es and AMRUT scheme will be redeveloped to create an integrated public transit hub around the railway sta ons and encourage transit oriented development. The Government of India and The World Bank have signed a US$ 650 million loan agreement for the Eastern Dedicated Freight Corridor-III (EDFC-III) project, which is expected to enhance railway transport capacity, improve service quality and boost freight carriage on the 401-km- long Ludhiana-Khurja sec on of the EDFC, along with developing ins tu onal capacity of Dedicated Freight Corridor Corpora on of India Ltd (DFCCIL) to build, maintain and operate the en re network.
On infrastructure front the government has proposed commissioning of 2,800 km of new tracks, nearly 30% higher than last year; 7 km of broad gauge lines to be commissioned every day; 400 sta ons to be re-developed through PPP; Railway electrifica on to be increased by 50%; Nearly 2,000 km route to be electrified next fiscal; 44 new projects valued at Rs. 92,714 crore (US$ 13.5 billion) to be implemented this year; Enhanced capacity of e- cke ng system - from 2,000 ckets per minute to 7,200 per minute (to support 120,000 concurrent users).
Outlook
The long term outlook for transmission and distribu on sector remains posi ve as the bulk power generated in the country needs grid infrastructure for reliable, efficient and stable power supply to consumer. The government seems deeply commi ed to drive the economic growth, enable recovery of sick Gencos and SEBs and stabilize the banking system in the economy. The focus on Power and T&D sector is high. There is an increasing trend towards the use of high voltage alterna ng current (HVAC) and high voltage direct current (HVDC) overhead lines to carry large amounts of electricity from genera on hubs to load centres, especially in countries like China, India and Brazil. The coming decade is expected to witness greater commercial applica on of these technologies. Making land available for new investments, implemen ng GST and improving the ease of doing business also seems to be in high focus. Our company is overall op mis c that various reforms ini ated by Government if India will lead to revival of the economy, primarily due to resul ng increase in capital expenditure in u li es, power genera on, industry and infrastructure. Our EMC team is fully ready to address such growth opportuni es. The strong thrust on renewable power genera on, evacua on and integra on of clean energy opens up new market opportuni es within the power sector.
We are an integrated player in railway infrastructure and undertake projects related to civil and track works, electrifica on and signaling works. Presently, the Company’s business mainly comes from conven onal railway projects but it is also looking at relevant opportuni es in Dedicated Freight Corridors and Metro Railway projects.
Under the current challenges, the Company’s management team remains holis cally focused and commi ed to deliver increased value for its stakeholders.
Adequacy and Internal Controls
A strong Internal Control framework has been an important part of opera ons and corporate governance. The Internal Control process of the Company has been robust and provides reasonable assurance on - reliability of financial informa on, compliances with laws and regula ons in force and realiza on and op miza on of opera ons. It ensures documenta on and evalua on of unit and en ty level controls through exis ng policies and procedures, primarily to iden fy any significant gaps and define key ac ons for improvement. Also, a formal system exists for periodic monitoring and repor ng of the results of the internal control self-assessments.
The Audit Commi ee and the Board of Directors reviewed the internal controls and the progress of implementa on of the recommenda ons of internal audits. The management ac vely implements the recommenda ons of such reviews.
During the year, as per the provisions of Companies Act, 2013, an in-depth exercise for evalua ng the adequacy of Internal Controls over financial repor ng was undertaken and their design and opera ng effec veness was assessed by the management. It was concluded that as at March 31, 2017, controls were opera ng effec vely.
Further, as part of the statutory audit, the statutory auditors opinionated that the Company has, in all material respects, an adequate internal financial controls system over financial repor ng and such controls were opera ng effec vely as at March 31, 2017.
Human Resources
We at EMC have grown exponen ally and have seen a dras c change in the way our people are performing. We firmly believe that people are the biggest strength. It is the display of our Values of Courage, Trust and Commitment by our employees that provides us the ability to expand our horizons at this place. We go beyond the boundaries of talent acquisi on, compensa on, performance reviews etc. and look at employee’s well-being holis cally. We partner with our employees to ensure mely interven ons that help build a career that is long las ng. We nurture employees by pu ng great emphasis on learning & development, career progression and employee welfare. Towards this end, we have developed and implemented a gamut of employee-centric policies and interven ons We put more focus on developing and promo ng internal talent as part of our people strategy. We assess internal candidates for their poten al to take on enhanced responsibili es and leadership roles wherever possible and this strategy ensures that we con nue to have strong talent pipelines across all levels. We engage with our employees and offer opportuni es to help build successful careers.

23
Management Discussions & Analysis Annual Report 2016-17
Besides this, we have HR policies of the group which are uniform across all the business ver cals, which gives us the flexibility to internally transfer the workforce and quickly meet the requirement from within the organiza on. A number of ini a ves are taken to ensure that care and support is extended to the employees through policies which help us improve quality of life of our employees.
We believe that constant feedback on performance and career development helps our workforce perform with greater efficiency. We have rolled out an ini a ve which ensures a structured appraisal feedback. We recognize that for crea ng a sustainable organiza on Iden fying Hi – Poten al employees and training them for future organiza onal needs plays a very cri cal role. Training needs of these high poten als are iden fied by carrying out Assessment/ development plans. Development of these iden fied employees is monitored by the Management of the organiza on.
Training and educa on has always been considered as an integral part of Human Resource development. We provide extensive training and learning opportuni es to our employees through well-designed and customized training programs which are carried out through the year. The training and development requirements of the employees are iden fied through a structured competency framework. We are commi ed to fair employment prac ces and freedom of expression, supported by a strong, Companywide value system.
Risk Management
The Company is predominantly engaged in the Engineering Procurement and Construc on (EPC) business. As business is spread across many countries and faces various risks associated with turnkey projects, its long-term success depends largely on robust risk iden fica on and management system, which helps the Company con nuously iden fy and mi gate various risks. It con nuously reviews its systems to ensure they are in-line with current internal and external environments.
Details of some of the risks involved in the business and their mi ga on ways are discussed below:
Commodity price varia ons and currency fluctua ons: The Company deals with various commodi es, such as steel, zinc, copper and aluminium. Fixed price contracts can have a nega ve impact if input costs rise, if it is not appropriately hedged in me. With a significant contribu on to the business from interna onal markets, the Company is exposed to the risk of currency fluctua ons, if any exposure remains open.
Mi ga on: The Company believes in keeping its commodity and currency exposures hedged to op mum levels. It measures and manages these risks centrally and carries out periodic reviews of these risks.
Infrastructure Investment Slowdown: Infrastructure investment slowdown can lead to lower order intake and lower sales.
Mi ga on: The Company’s global presence helps it minimise impact on business during investment slowdown in one country or region. Further, the Company is significantly exposed to underdeveloped and emerging economies, where infrastructure investment is a key priority for sustainable growth.
Poli cal Unrests: Poli cal unrest in countries and markets where the Company is present can impact the progress of its projects.
Mi ga on: The Company carries out detailed studies of the poten al risks involved in a market before bidding for a project in a country. This careful selec on of the country, along with the Company’s prior experience, aids in coping with the challenges.
Delays in execu on of projects: EPC projects could face delays due to issues rela ng to right of way, forest clearances, man power shortage and so on. This could lead to payment postponements, thereby prolonging the working capital cycle and increasing the overall project costs.
Mi ga on: The Company reviews these risks periodically and employs suitable strategies and ac ons to minimize their impact.
Control Risks: Since, the Company works on diverse projects across different loca ons, weak opera onal control could lead to project delays.
Mi ga on: The Company has responded to this challenge through proac ve investments in SAP technology thereby resul ng in informed decision-making which in turn have quickened the project execu on capability of the Company.
Competence Risks: Failure to successfully execute challenging projects could tarnish the Company’s repute.
Mi ga on: The Company possesses an experienced team of engineers to successfully carry its Power Transmission line and Railway infrastructure business. The Company avoids picking projects in areas that fall outside the realm of its exper se.

Annual Report 2016-17 Directors' Report
24
Dear Members,
The Board of Directors presents the Company’s Annual Report, together with the audited financial statements for the financial year ended March 31, 2017.
FINANCIAL RESULTSThe Company’s performance for the financial year ended 31st March, 2017 as per Standalone Financial Statements is summarized below –
(` in Lacs)
2016-17 2015-16
INCOME
Revenue from Opera ons 4,63,161.92 4,13,126.66
Other Income 1,402.32 1,427.81
4,64,564.24 4,14,554.47
EXPENDITURE
Manufacturing and Other Expenses 4,16,213.66 3,71,280.02
Finance Cost 21,319.49 18,565.18
Deprecia on and Amor za on expenses 1,730.83 1,755.51
4,39,263.98 3,91,600.70
Profit before Excep onal, Extraordinary Items and Taxa on 25,300.25 22,953.77
Add/Less: Excep onal / Extraordinary Items - -
Profit before Taxa on from con nuing opera ons 25,300.25 22,953.77
Tax Expenses 8,720.43 7,900.65
Profit a er Taxa on 16,579.83 15,053.13
FINANCIALSThe total income of your Company has increased from ` 4,14,554.47 Lacs to ` 4,64,564.24 Lacs during the financial year under considera on. The profit before tax (PBT) increased from ` 22,953.77 Lacs to ` 25,300.25 Lacs. The profit a er tax for the current year is ` 16,579.83 Lacs as against ` 15,053.13 Lacs in the previous financial year.
AMALGAMATION OF THE COMPANY
The management in view of the recent changes in the business dynamics and financial markets decided not to go ahead with the Scheme of Amalgama on of EMC Limited, McNally Bharat Engineering Company Limited and McNally Sayaji Engineering Limited with Kilburn Engineering Limited and hence resolved to withdraw the proposed Scheme on 3rd December, 2016.
DIVIDEND
Your Board has not recommended any Dividend for the financial year 2016-17 to the Equity shareholders of your Company.
TRANSFER TO GENERAL RESERVEThe Company proposes not to transfer any funds out of its total profit for the financial year to the General Reserve.
CONSOLIDATED FINANCIAL STATEMENTThe consolidated financial statement for all the subsidiary companies is provided in the Statutory Auditors’ Report, which forms a part of this Annual Report.

Directors' Report Annual Report 2016-17
25
CHANGE IN THE NATURE OF BUSINESS, IF ANYThere is no change in the nature of the business of the Company for the year 2016-17.
DETAILS OF SIGNIFICANT AND MATERIAL ORDERS PASSED BY THE REGULATORS OR COURTS OR TRIBUNALS IMPACTING THE GOING CONCERN STATUS AND COMPANY’S OPERATIONS IN FUTUREThere were no significant and material orders passed by regulators or courts or tribunals impac ng the going concern status and Company’s opera ons in future.
MATERIAL CHANGES AND COMMITMENTS, IF ANY, AFFECTING THE FINANCIAL POSITION OF THE COMPANY WHICH HAVE OCCURRED BETWEEN THE END OF THE FINANCIAL YEAR OF THE COMPANY TO WHICH THE FINANCIAL STATEMENTS RELATE AND THE DATE OF THE REPORTThere were no material changes and commitments affec ng the financial posi on of the Company occurring between March 31, 2017 and the date of this Report of the Directors.
SUBSIDIARY As on 31st March, 2017, your Company has fourteen subsidiary companies namely EMC Hardware Limited, EMC Solar Limited, EMC Tower Limited, EMC Forging Limited, EMC Logis cs Limited, EMC Academy Limited, EMC Overseas Limited, Quatro Rail Tech Solu ons Limited, ASC Inc. (formerly, Advanced Steel & Crane Inc.), Tecnolines S.r.l, EMC West Asia DMCC, EMC East Asia Limited, Tecnolines Singapore Pte. Limited and EMC Saudi LLC.The statement containing the salient features of the financial performance and posi on of the Company’s subsidiaries/ joint ventures is given in Form AOC – 1, which forms a part of this Annual Report and is included in the Consolidated Financial Statements. Details pertaining to companies that became subsidiaries/ joint ventures and those that ceased to be the subsidiaries/ joint ventures of the Company during the year are provided in the notes to the Consolidated Financial Statements.
SHARE CAPITALDuring the year 2016-17, the Company allo ed 13,35,000 equity shares of Rs.10 each pursuant to conversion of loan. Consequently, the paid up equity share capital of the Company stood at Rs.48,33,50,000/- (Rupees Forty-Eight Crore Thirty-Three Lakh Fi y Thousand only) consis ng of 4,83,35,000 (Four Crore Eighty-Three Lakh Thirty-Five Thousand ) equity shares of Rs.10 each.
DEPOSITSDuring the year under review the Company has neither invited nor accepted deposit from the public falling within the ambit of Sec on 73 of the Companies Act 2013 and the Companies (Acceptance of Deposits) Rules 2014.
PARTICULARS OF LOANS, GUARANTEES AND INVESTMENTS BY COMPANYLoans, guarantees and investments covered under Sec on 186 of the Companies Act, 2013 form part of the Notes to the financial statements provided in this Annual Report.
RELATED PARTY TRANSACTIONAll RPTs, including those rela ng to the Company’s overseas direct/indirect subsidiaries, are done on an arm’s length basis and in the ordinary course of business. The Company presents a detailed landscape of all RPTs to the Audit Commi ee, specifying the nature, value and terms and condi ons of the transac on. Apart from the Related Party Transac ons in the ordinary course of business and at arm’s length basis, details of which are given in the notes to the financial statements, there were no other Related Party Transac ons requiring disclosure in the Directors’ Report. Accordingly, the disclosure required u/s 134(3)(h) of the Act in Form AOC-2 is not applicable to the Company.
MEETINGS OF THE BOARDThe Board of Directors of the Company met 4 (Four) mes during the financial year on 4th July, 2016, 31st August, 2016, 3rd December, 2016 and 31st March, 2017. The intervening gap between the Mee ngs was within the period prescribed under the Companies Act, 2013.
EXTRACT OF ANNUAL RETURNThe details forming part of the extract of the Annual Return in Form MGT – 9 as required under Sec on 92 of the Companies Act 2013 is included in this Report as ‘Annexure A’.
DIRECTORS AND KEY MANAGERIAL PERSONNELThe Members at the Annual General Mee ng held on 29th September, 2016 approved the appointment of Mr. Biplab Shankar Bose (DIN: 01737400) as Whole Time Director, with effect from 4th July, 2016 for a period of two years on and from 4th July, 2016 to 3rd July, 2018, by passing an ordinary resolu on at the Mee ng.

Annual Report 2016-17 Directors' Report
26
The Nomina on and Remunera on Commi ee at its mee ng recommended to the Board of Directors the appointment of Mr. Bijan Roy, Mr. Sanjay Khandelwal, each excelling in their careers and holding valuable experience and exper se as Independent Directors of the Company. The Board on the recommenda on and on receiving the declara on of independence and consent in Form DIR-2 from Mr. Bijan Roy and Mr. Sanjay Khandelwal and a er careful considera on appointed them to the Board, subject to the approval of members at the ensuing Annual General Mee ng.During the year, Mr. Suraj Mall Singhi, Mr. Manish Agarwal and Mr. Sanjay Khandelwal resigned from the Board on 1st October, 2016, 1st December, 2016 and 3rd February, 2016 respec vely. The Board placed on record their deep apprecia on for the valuable contribu on made by Mr. Suraj Mall Singhi, Mr. Manish Agarwal and Mr. Sanjay Khandelwal during their uns nted tenure of services with the Company.All the Independent Directors have given their declara on of independence as required under Sec on 149(6) of the Companies Act, 2013;In accordance with the provisions of the Ar cles of Associa on of the Company read with sec on 152 of the Companies Act, 2013, Mr. Manoj Toshniwal, Director, re res by rota on in the forthcoming Annual General Mee ng and being eligible, offers himself for re-appointment.The Board of Directors have laid down the manner for carrying out an annual evalua on of its own performance, its various Commi ees and individual directors pursuant to the provisions of the Act and relevant Rules. The performance of the Board was evaluated by the Board a er seeking inputs from all the Directors on the basis of various criteria such as Board Composi on, process, dynamics, quality of delibera ons, strategic discussions, effec ve reviews, commi ee par cipa on, governance reviews etc. The performance of the Commi ees was evaluated by the Board a er seeking inputs from the Commi ee members on the basis of criteria such as Commi ee composi on, process, dynamics, delibera on, strategic discussions, effec ve reviews etc. The Nomina on and Remunera on Commi ee reviewed the performance of the individual Directors on the basis of the criteria such as Transparency, Analy cal Capabili es, Performance, Leadership, Ethics and ability to take balanced decisions regarding stakeholders etc.During the year under review your Company has the following persons as Key Managerial Person (KMP) –
Sl. No. Name Designa on
1. Mr. Manoj Toshniwal Managing Director
2. Mr. Ramesh Chandra Bardia Joint Managing Director
3. Mr. Arun Kumar Kedia Chief Financial Officer
4. Mr. Sumit Kumar Surana Company Secretary
MEETING OF INDEPENDENT DIRECTORSA separate mee ng of Independent Directors was held on 31st March, 2017 to evaluate performance of the Chairman of the Board of the Directors and the Board as a whole and the same was found sa sfactory.
WHISTLE BLOWER POLICYThe Company has in place a robust vigil mechanism for repor ng genuine concerns through the Company’s Whistle Blower Policy. All cases reported as part of whistle blower mechanism are taken to their logical conclusion within a reasonable meframe. However, during the year under review, no Whistle Blower Cases were reported to the Audit Commi ee of the Company.
RISK MANAGEMENTOur Risk Management Framework is designed to help the organiza on meet its objec ves through alignment of opera ng controls with the Company’s mission and vision.The main objec ve of this policy is to ensure sustainable business growth with stability and to promote a pro-ac ve approach in repor ng, evalua ng and resolving risks associated with the business. In order to achieve the key objec ve, the policy establishes a structured and disciplined approach to Risk Management, in order to guide decisions on risk related issues.
REMUNERATION AND NOMINATION POLICYFor the purpose of selec on of any Director, the Nomina on & Remunera on Commi ee iden fies persons of integrity who possess relevant exper se, experience and leadership quali es required for the posi on. The Commi ee also ensures that the incumbent fulfills such other criteria with regard to age and other qualifica ons as laid down under the Act or other applicable laws. The Board has, on the recommenda on of the Nomina on & Remunera on Commi ee framed a policy for selec on, appointment and remunera on of Directors & Senior Management. The appointments are made based on this policy.

Directors' Report Annual Report 2016-17
27
STATUTORY AUDITAt the Annual General Mee ng held on September 29, 2016, M/s SRB & Associates, Chartered Accountants, were appointed as statutory auditors of the Company to hold office from the conclusion of Annual General Mee ng for the financial year 2015-16 ll the conclusion of the Annual General Mee ng for the financial year 2020-21. In terms of the first proviso to Sec on 139 of the Companies Act, 2013, the appointment of the auditors shall be placed for ra fica on at every Annual General Mee ng. Accordingly, the appointment of M/s SRB & Associates, Chartered Accountants, as statutory auditors of the Company, is placed for ra fica on by the shareholders. M/s. Acharyya Swapan & Co., Chartered Accountants are the Internal Auditors of the Company. They func on independently and submit their report to the Audit Commi ee.Any query from the Auditors is being dealt with in the Notes to Accounts.
COST AUDITAs per the requirement of Central Government and pursuant to Sec on 148 of the Companies Act, 2013 read with the Companies (Cost Records and Audit) Rules, 2014 as amended from me to me, the Company has been carrying out audit of cost records every year.The Board of Directors on the recommenda on of Audit Commi ee has appointed M/s. N. Radhakrishnan & Co., Cost Accountants as Cost Auditors to audit the cost accounts of the Company for the financial year 2017-18. As required under the Companies Act, 2013 a resolu on seeking member’s approval for the remunera on payable to the Cost Auditor forms part of the No ce convening the Annual General Mee ng.
SECRETARIAL AUDITPursuant to the provisions of the Sec on 204 of the Companies Act, 2013 and rules made thereunder, the Company has appointed B.Nair & Company, a firm of Company Secretaries in Prac ce (C. P. No. 10778) to undertake the Secretarial Audit of the Company for the financial year 2017-18. The Report of the Secretarial Audit for the Financial Year 2016-17 in the Form MR-3 is annexed herewith as ‘Annexure B’. The Board has taken note of the observa ons made by the Secretarial Auditor and the same are being complied with.
INTERNAL CONTROL SYSTEMS AND THEIR ADEQUACYThe Board of Directors (Board) has devised systems, policies and procedures / frameworks, which are currently opera onal within the Company for ensuring the orderly and efficient conduct of its business, which includes adherence to Company’s policies, safeguarding assets of the Company, preven on and detec on of frauds and errors, accuracy and completeness of the accoun ng records and mely prepara on of reliable financial informa on. In line with best prac ces, the Audit Commi ee and the Board reviews these internal control systems to ensure they remain effec ve and are achieving their intended purpose. Where weaknesses, if any, are iden fied as a result of the reviews, new/revised standard opera ng procedures are put in place to strengthen controls. These controls are in turn reviewed at regular intervals.The systems/frameworks include proper delega on of authority, opera ng philosophies, policies and procedures, effec ve IT systems aligned to business requirements, an internal audit framework, an ethics framework, a risk management framework and adequate segrega on of du es to ensure an acceptable level of risk.The Company’s internal control system is commensurate with its size, scale and complexi es of its opera ons. The internal audit is entrusted to M/s. Acharya Swapan & Co., Chartered Accountants. To enhance internal controls, the internal audit follows a stringent grading mechanism, focusing on the implementa on of recommenda ons of internal auditors. The internal auditors make periodic presenta ons on audit observa ons, including the status of follow-up to the Audit Commi ee.Based on the informa on provided, nothing has come to the a en on of the Directors to indicate that any material breakdown in the func on of these controls, procedures or systems occurred during the year under review. There have been no significant changes in the Company’s internal financial controls during the year that have materially affected, or are reasonably likely to materially affect its internal financial controls.There are inherent limita ons to the effec veness of any system of disclosure, controls and procedures, including the possibility of human error and the circumven on or overriding of the controls and procedures. Accordingly, even effec ve disclosure controls and procedures can only provide reasonable assurance of achieving their objec ves. Moreover, in the design and evalua on of the Company’s disclosure controls and procedures, the management was required to apply its judgment in evalua ng the cost-benefit rela onship of possible controls and procedures.
PARTICULARS OF EMPLOYEESThe statement containing employee informa on as required under Sec on 197(12) of the Act, read with Rule 5(2) of the Companies (Appointment and Remunera on of Managerial Personnel) Rules, 2014 forms part of this report. The Reports and Accounts are being sent to members and other en tled thereto, excluding the informa on on employee’s par culars which is available for inspec on by the members at the Registered Office of the Company during business hours on any working day. If any member is interested in obtaining a copy thereof, such member may write to Company Secretary in this regard.

Annual Report 2016-17 Directors' Report
28
CORPORATE SOCIAL RESPONSIBILITYAs on March 31, 2017 the Corporate Social Responsibility (CSR) Commi ee consists of the Members as stated below:
Name of Members Chairman / Member Category
Mr. Manoj Toshniwal Chairman Managing Director
Ms. Arundhu Dhar Member Independent Director
Mr. Bijan Roy Member Independent Director
The said Commi ee has been entrusted with the responsibility of formula ng and recommending to the Board, a Corporate Social Responsibility Policy (CSR Policy) indica ng the ac vi es to be undertaken by the Company, monitoring the implementa on of the framework of the CSR Policy and recommending the amount to be spent on CSR ac vi es.The Company has in place the CSR Policy formulated by the Commi ee and approved by the Board of Directors. The formal CSR policy of the Company is available on the website of the Company www.emcpower.com at the link h ps://www.emcpower.com /pdf/Company_Policies/CSR_Policy.pdf.The CSR Commi ee mee ng was held on 23rd March, 2017 wherein the Commi ee discoursed about the discussions which the Company has been having with schools and NGOs regarding the implementa on of the proposed policy and the various other ac vi es under which the Company can undertake its CSR Ini a ves and the avenues to invest the funds of the Company as prescribed in the Act. The Commi ee also praised and emphasized on the social ac vi es the Company has been carrying out at ground levels at various project sites of the Company across the Country and encouraged the Company to con nue to carry out the same.Your Company would like to submit that it is under process of e-up with various associa ons/ organisa on/ trust for pursuing the CSR ac vi es as envisaged in the CSR Policy. The process of iden fying ac vi es and various e ups delayed the CSR spend and hence the Company could not spend the amount of envisaged CSR expenditure. The Company is commi ed to the underlying intent of CSR and is op mis c of mee ng its commitment by spending higher amount in the coming financial year and thereby make a posi ve impact on the society.
DIRECTORS’ RESPONSIBILITY STATEMENTThe Board of Directors acknowledges the responsibility for ensuring compliance with the provisions of sec on 134(3)(c) read with sec on 134(5) of the Companies Act, 2013 in the prepara on of the annual accounts for the year ended on 31st March, 2017 and state that :i. In the prepara on of the annual accounts, the applicable accoun ng standards have been followed along with proper explana on
rela ng to material departures, if any ;ii. the Directors have selected such accoun ng policies and applied them consistently and made judgments and es mates that are
reasonable and prudent so as to give a true and fair view of the state of affairs of the Company at the end of the financial year and of the profit of the Company for that period;
iii. the Directors have taken proper and sufficient care for the maintenance of adequate accoun ng records in accordance with the provisions of this Act for safeguarding the assets of the Company and for preven ng and detec ng fraud and other irregulari es;
iv. the Directors have prepared the annual accounts on a going concern basis;v. there is a proper system to ensure compliance with the provisions of all applicable laws and that such systems are adequate and
opera ng effec vely.
AUDIT COMMITTEEYour Company is having an Audit Commi ee comprising of the following Directors –
Sl. No. Name Status Category1. Mr. Bijan Roy Chairman Non Execu ve & Independent Director2. Ms. Arundhu Dhar Member Non Execu ve & Independent Director3. Mr. Biplab Shankar Bose Member Whole- me Director
Four Audit Commi ee Mee ngs were held during the financial year under considera on.

Directors' Report Annual Report 2016-17
29
NOMINATION AND REMUNERATION COMMITTEEYour Company is having a Nomina on and Remunera on Commi ee comprising of the following Directors -
Sl. No. Name Status Category1. Mr. Bijan Roy Chairman Non Execu ve & Independent Director3. Ms. Arundhu Dhar Member Non Execu ve & Independent Director
Two Nomina on and Remunera on Commi ee Mee ngs were held during the financial year under considera on.
STAKEHOLDERS RELATIONSHIP COMMITTEEYour Company is having a Stakeholder Rela onship Commi ee comprising of the following Directors –
Sl. No. Name Status Category1. Mr. Bijan Roy Chairman Non Execu ve & Independent Director2. Mr. Manoj Toshniwal Member Managing Director3. Mr. Ramesh Chandra Bardia Member Joint Managing Director
Necessary Stakeholder Rela onship Commi ee mee ngs were held during the F.Y 16-17 to approve the necessary transfer of shares.
ENERGY CONSERVATION, TECHNOLOGY ABSORPTIONEnergy conserva on con nued to be an area of priority. Con nued efforts on ra onaliza on of demands in manufacturing loca ons and increase in produc on volume resulted in the saving of energy compared to the earlier years. Your Company has used modern technology to install solar power plants and thereby genera ng solar energy.
FOREIGN EXCHANGE EARNINGS AND OUTGOThe detail rela ng to Foreign Exchange Earnings and outgo is provided in the Statutory auditors’ Report, which forms a part of this Annual Report.
DISCLOSURES UNDER SEXUAL HARASSMENT OF WOMEN AT WORKPLACE (PREVENTION, PROHIBITION AND REDRESSAL) ACT, 2013Your Company has endeavored to encourage women professionals by crea ng proper policies to tackle issues rela ng to safe and proper working condi ons, and create and maintain a healthy and conducive work environment that is free from discrimina on. This includes discrimina on on any basis, including gender, as well as any form of sexual harassment. Your Company has an Internal Complaints Commi ee in place in accordance with the requirements under the Sexual Harassment of Women at Workplace (Preven on, Prohibi on and Redressal) Act, 2013 which ensures implementa on and compliance with the Law as well as the policy at every unit and tackle issues rela ng to sexual harassment. The Internal Compliant Commi ee is formed with the following members –
Sl. No. Name Chairperson / Member1. Ms. Yamini More Chairperson2. Ms. Madhumita Bha acharyya Member3. Mr. Swapan Kumar Du a Member4. Mr. Apurva Roy – NGO Representa ve Member
There were no cases/ complaints reported in this regard during the year 2016-17 and no mee ngs were held during the year.
APPRECIATIONThe Directors place on record their sincere apprecia on for the significant contribu on made by employees through their dedica on, hard work and commitment to ensure the Company’s long-term growth and sustainability.The Board places on record its apprecia on for the support and coopera on your Company has received from its customers, vendors, suppliers, business partners, who are our partners in progress. The Directors acknowledge the support and assistance extended to us by the Government of India, various State Governments and government departments, financial ins tu ons, bankers, shareholders and all other statutory agencies at large and look forward to their support in our future endeavours.
For and on behalf of the Board
Manoj Toshniwal Ramesh Chandra BardiaPlace: Kolkata Managing Director Joint Managing DirectorDated: 30/06/2017 DIN : 00022787 DIN : 00374148

Annual Report 2016-17 Annexure to the Directors' Report
30
'ANNEXURE A'MGT - 9
EXTRACT OF ANNUAL RETURN as on financial year ended on 31.03.2017
[Pursuant to Sec on 92 (3) of the Companies Act, 2013 and rule 12(1) of the Company (Management & Administra on) Rules]
I. REGISTRATION & OTHER DETAILS
i) CIN U31901WB1953PLC021044
ii) Registra on Date 18th May, 1953
iii) Name of the Company EMC Limited
iv) Category/Sub-category of the Company Public Company
v) Address of the Registered office & contact details “Constan a Office Complex” 8th Floor, (South Block)11, Dr. U.N. Brahmachari Street Kolkata - 700017
vi) Whether listed company - Yes No No (Unlisted)
vii) Name, Address & contact details of the Registrar & Transfer Agent, if any.
Maheshwari Datama cs Private Limited23, R. N. Mukherjee Road, 5th Floor, Kolkata - 700001Ph: 033 - 22435809
II. PRINCIPAL BUSINESS ACTIVITIES OF THE COMPANY
All the business ac vi es contribu ng 10% or more of the total turnover of the company shall be stated :
S. No. Name and Descrip on of main products / services NIC Code of the Product/service
% to total turnover of the company
1 EPC contractors in the field of EHV, Transmission Line projects upto 800 KV, EHV substa ons projects upto 765 KV including GIS substa ons, Power Distribu on for large industrial projects like steel plant, cement plants, railways and distribu on projects like APDRP/R-APDRP
42202 92.24%
2 Manufacturing of Transmission Line Towers, Conductors and Hardware, Aluminium Extrusion & Forging
3510 Nil
3 Solar Power Produc on 35105 Nil

Annexure to the Directors' Report Annual Report 2016-17
31
III. PARTICULARS OF HOLDING, SUBSIDIARY COMPANIES
Sl.No.
Name and Address of the Company CIN/GLN Holding/ Subsidiary/ Associate
% of shares held
Applicable Sec on
1 EMC Solar Limited51, Canal East Road, Kolkata - 700085
U40108WB2010PLC149583 Subsidiary 100% 2 (87)
2 EMC Tower Limited51, Canal East Road, Kolkata - 700085
U40107WB2010PLC149842 Subsidiary 100% 2 (87)
3 EMC Forging Limited 51, Canal East Road, Kolkata - 700085
U40102WB2010PLC149843 Subsidiary 100% 2 (87)
4 EMC Logis cs Limited51, Canal East Road, Kolkata - 700085
U60230WB2010PLC150647 Subsidiary 100% 2 (87)
5 EMC Academy Limited51, Canal East Road, Kolkata - 700085
U80221WB2010PLC151754 Subsidiary 100% 2 (87)
6 EMC Overseas Limited51, Canal East Road, Kolkata - 700085
U40102WB2011PLC162101 Subsidiary 100% 2 (87)
7 EMC Hardware Limited51, Canal East Road, Kolkata - 700085
U24299WB1982PLC183166 Subsidiary 100% 2 (87)
8 ASC, Inc. (formerly, Advanced Steel & Crane Inc.)6420 S. 39th West AvenueTulsa Ok 74132, USA
- Subsidiary 100% 2 (87)
9 Tecnolines S.r.lVia San Daniele, n.8 33170 Pordenone, Italy
02507970347 Subsidiary 90% 2 (87)
10 EMC West Asia DMCCUnit No. 2109, Jumeirah Bay Tower, Plot No. X2,Jumeirah Lakes Towers, Dubai, U.A.E.
JLT5180 Subsidiary 100% 2 (87)
11 Quatro Rail Tech Solu ons Ltd. 756, (1st Floor), 80 Feet Road, 4th Block,Koramangala, Bangalore, Karnataka - 560034
U74900KA2012PTC064625 Subsidiary 60% 2 (87)
12 EMC East Asia Limited18th Floor, Unit 1803, Lemmi Centre 50 Hoi Yuen Road, Kwun Tong, Kowloon, HongKong
62649163-000-01-14-7 Subsidiary 100% 2 (87)
13 Tecnolines Singapore Pte. Limited3, Philip Street, 17-01, Commerce PointSingapore - 048693
204402856R Subsidiary 100% 2 (87)
14 EMC Saudi LLCPO BOX 60768 ZIP Code 11555, Riyadh, KSA
1010441917 Subsidiary 60% 2 (87)
IV. SHAREHOLDING PATTERN (Equity Share Capital Breakup as percentage of Total Equity)
i) Category-wise ShareholdingCategory of Shareholders No.of Shares held at the beginning of the year No.of Shares held at the end of the year % Change
duringthe year
Demat Physical Total % of TotalShare
Demat Physical Total % of TotalShares
A Promoters
(1) Indian
(a) Individual/HUF 11954300 0 11954300 25.4347 12754300 0 12754300 26.3873 0.9526(b) Central Government 0 0 0 0 0 0 0 0 0(c) State Government 0 0 0 0 0 0 0 0 0(d) Bodies Corporate 34161520 0 34161520 72.6841 30496520 0 30496520 63.0941 -9.59(e) Banks/Fin.Ins tu on 0 0 0 0 0 0 0 0 0(f) Any Other 0 0 0 0 0 0 0 0 0 Sub-total (A)(1) : 46115820 0 46115820 98.1188 43250820 0 43250820 89.4814 -8.6374

Annual Report 2016-17 Annexure to the Directors' Report
32
Category of Shareholders No.of Shares held at the beginning of the year No.of Shares held at the end of the year % Changeduring
the yearDemat Physical Total % of Total
ShareDemat Physical Total % of Total
Shares(2) Foreign
(a) NRIs - Individuals 0 0 0 0 0 0 0 0 0(b) Other - Individuals 0 0 0 0 0 0 0 0 0(c) Bodies Corporate 0 0 0 0 0 0 0 0 0(d) Banks/Fin.Ins tu on 0 0 0 0 0 0 0 0 0(e) Any Other 0 0 0 0 0 0 0 0 0
Sub-total (A)(2) : 0 0 0 0 0 0 0 0 0Total Shareholding of Promoter (A)= (A) (1)+(A)(2)
46115820 0 46115820 98.1188 43250820 0 43250820 89.4814 -8.6374
B Public Shareholding
(1) Ins tu ons
(a) Mutual Funds 0 0 0 0 0 0 0 0 0
(b) Banks/Fin.Ins tu on 0 50 50 0.0001 0 50 50 0.0001 0
(c) Central Government 0 0 0 0 0 0 0 0 0
(d) State Govrnments 0 0 0 0 0 0 0 0 0
(e) Venture Capital Funds
0 0 0 0 0 0 0 0 0
(f) Insurance Companies 0 0 0 0 0 0 0 0 0
(g) FIIs 0 0 0 0 0 0 0 0 0
(h) Foreign Venture Funds
0 0 0 0 0 0 0 0 0
(i) Others (Specify) 0 0 0 0 0 0 0 0 0
Sub-total (B)(1) : 0 50 50 0.0001 0 50 50 0.0001 0
(2) Non-Ins tu ons
(a) Bodies Corporate 1951 3250 5201 0.0111 5001951 3250 5005201 10.3552 10.3441
(i) Indian 0 0 0 0 0 0 0 0 0
(ii) Overseas 0 0 0 0 0 0 0 0 0
(b) Individuals:
(i) Individualshareholders holding nominal share capital upto Rs.2 lakh
22057 56872 78929 0.1679 22807 56122 78929 0.1633 -0.0046
(ii) Individualshareholders holding nominal share capital upto Rs.2 lakh
800000 0 800000 1.7021 0 0 0 0 -1.7021
(c) Others (Specify) 0 0 0 0 0 0 0 0 0
Sub-total (B)(2) : 824008 60122 884130 1.8811 5024758 59372 5084130 10.5185 8.6374
Total Public Shareholding (B)=(B)(1)+(B)(2)
824008 60172 884180 1.8812 5024758 59422 5084180 10.5186 8.6374
C Shares held by custodian for GDRs & ADRsGrand Total (A+B+C) 46939828 0 47000000 100 48275578 0 48335000 100 0

Annexure to the Directors' Report Annual Report 2016-17
33
(ii) Shareholding of PromotersSl.
No.Shareholder's Name Shareholding at the beginning of the
yearShareholding at the end of the year % change
in share-holding
during the year
No.ofShares
% of totalShares of
the company
% of SharesPledged /
encumberredto total shares
No.ofShares
% of totalShares of
the company
% of SharesPledged /
encumberredto total shares
1 Mr. Sunder Lal Dugar 199020 0.4234 0 0 0 0 -0.42342 Mr. Manoj Toshniwal 1035683 2.2036 0 1035683 2.1427 0 -0.06083 Mr. Ramesh Chandra Bardia 1109089 2.3598 0 1109089 2.2945 0 -0.06534 Mr. Vinod Dugar 4318624 9.1886 0 4517644 9.3465 0 0.15785 Smt. Sheetal Dugar 4429145 9.4237 0 4429145 9.1634 0 -0.26036 Smt. Kusum Devi Dugar 45962 0.0978 0 45962 0.0951 0 -0.00267 Mr. Shree Kumar Toshniwal 532159 1.1323 0 532159 1.1009 0 -0.03148 Smt. Sunita Bardia 284618 0.6056 0 284618 0.5888 0 -0.01679 Siddhartha Bardia 0 0 0 800000 1.6551 0 1.6551
10 YMS Finance Private Limited 6040001 12.8511 0 6040001 12.4961 0 -0.355011 Trinetra Electronics Limited 2448528 5.2096 0 2448528 5.0657 0 -0.143812 Sharada Commerce Private Limited 1100000 2.3404 0 1100000 2.2757 0 -0.064613 Tamkore Investment Private Limited 2400000 5.1064 0 2400000 4.9653 0 -0.141114 Subhas Impex Private Limited 3453252 7.3473 0 3453252 7.1444 0 -0.202815 Statefield Trade Link Private Limited 1869425 3.9775 0 1869425 3.8676 0 -0.109816 Metalind Private Limited 2850000 6.0638 0 2850000 5.8963 0 -0.167417 MKN Investment Private Limited 14000314 29.7879 0 10335314 21.3826 0 -8.4053
Total : 46115820 98.1188 0 43250820 89.4807 0 -8.6374
(iii) Change in Promoters' Shareholding
Sl.No.
Name of the Promoter Shareholding at thebeginning of the year
Cumula ve Shareholdingduring the year
No.of Shares
% of total Shares of the Company
No.of Shares
% of total Shares of the Company
1 MKN Investment Private LimitedAt the beginning of the year 14000314 29.7879 14000314 29.7879Decrease during the year 5000000 10.6382 9000314 19.1496Increase during the year 1335000 2.7619 10335314 21.3826At the end of the Year 10335314 21.3826
2 Mr. Sunder Lal DugarAt the beginning of the year 199020 0.4234 199020 0.4234Decrease during the year 199020 0.4234 0 0At the end of the Year 0 0
3 Mr. Vinod DugarAt the beginning of the year 4318624 9.1886 4318624 9.1886Increase during the year 199020 0.4234 4517644 9.3465At the end of the Year 4517644 9.3465

Annual Report 2016-17 Annexure to the Directors' Report
34
(iv) Shareholding Pa ern of top ten Shareholders (other than Directors, Promoters and Holders of GDRs and ADRs):
Sl. No.
For Each of Top 10 Shareholders at the beginning of the year Date wise Increase/Decrease in Shareholding during the year specifying the reasons for increase/decrease
Shareholding at the beginning of the year
Cumula ve Shareholding during the year
No. of Shares % of total Shares of the Company
No. of Shares % of total Shares of the Company
1 Shri Parasram Securi es Pvt. Ltd.At the beginning of the year 2950 0.0063 2950 0.0063At the end of the year 2950 0.0063
2 Pinakin Chimanlal ShahAt the beginning of the year 2750 0.0059 2750 0.0059At the end of the year 2750 0.0059
3 Dr. Ramsudhi GangulyAt the beginning of the year 1450 0.0031 1450 0.0031At the end of the year 1450 0.0031
4 Rajni Kan lal SanghviAt the beginning of the year 1150 0.0024 1150 0.0024At the end of the year 1150 0.0024
5 Prem BawariAt the beginning of the year 1000 0.0021 1000 0.0021At the end of the year 1000 0.0021
6 Dinesh Vrijlal LakhaniAt the beginning of the year 1000 0.0021 1000 0.0021At the end of the year 1000 0.0021
7 Shah Paresh ChimanlalAt the beginning of the year 900 0.0019 900 0.0019At the end of the year 900 0.0019
8 Mrs. Pushpa GoenkaAt the beginning of the year 900 0.0019 900 0.0019At the end of the year 900 0.0019
9 Shri Parasram Holdings Pvt. Ltd.At the beginning of the year 800 0.0017 800 0.0017At the end of the year 800 0.0017
10 Mrs. Maneckbai Kooverji GamadiaAt the beginning of the year 700 0.0015 700 0.0015At the end of the year 700 0.0015
(v) Shareholding of Directors and Key Managerial Personnel :Sl.
No.For Each of the Directors and KMP at the beginning of the year Date wise Increase/Decrease in Shareholding during the year specifying the reasons for increase/decrease e.g. allotment/ transfer/bonus/sweat equity etc.):
Shareholding at the beginning of the year
Cumula ve Shareholding during the year
No. of Shares % of total Shares of the
Company
No. of Shares % of total Shares of the
Company1 Mr. Manoj Toshniwal
At the beginning of the year 1035683 2.7991 1035683 2.7991At the end of the Year 1035683 2.2036
2 Mr. Ramesh Chandra BardiaAt the beginning of the year 1109089 2.3598 1109089 2.3598At the end of the Year 1109089 2.3598At the end of the Year 1109089 2.3598

Annexure to the Directors' Report Annual Report 2016-17
35
V. INDEBTEDNESS Secured Loans
Excluding DepositsUnsecured Loans Deposits Total Indebtedness
Indebtedness at the Beginning of the financial yeari) Principal Amount 58,84,17,770 4,57,60,00,000 - 5,16,44,17,770 ii) Interest due but not paid 38,61,882 8,49,23,720 - 8,87,85,602 iii) Interest Accrued but not due - - - Total : (I + ii + iii) 59,22,79,652 4,66,09,23,720 - 5,25,32,03,372 * Addi on 2,23,03,49,358 74,88,25,751 - 2,97,91,75,109 * Reduc on 40,77,52,234 3,11,37,22,719 - 3,52,14,74,953 Net Change 1,82,25,97,124 -2,36,48,96,968 - -54,22,99,844 Indebtedness at the end of the financial yeari) Principal Amount 2,33,13,55,682 2,15,45,00,000 - 4,48,58,55,682 ii) Interest due but not paid 8,35,21,094 3.71.64,476 - 12,06,85,570 iii) Interest Accrued but not due - 10.43.62,276 - Total : (I + ii + iii) 2,41,48,76,776 2,29,60,26,752 - 4,71,09,03,528
VI. REMUNERATION OF DIRECTORS AND KEY MANAGERIAL PERSONNEL
A. Remunera on to Managing Director, Whole- me Directors and/or Manager:Sl.
No.Par culars of Remunera on Name of MD/WTD/Manager Total Amount
Mr. Manoj Toshniwal
Mr. Ramesh Chandra Bardia
Mr. Biplab Shankar Bose
Mr. Durga Prasad Sharma
1 Gross salary(a) Salary as per provisions contained in sec on 17(1) of the Income Tax Act, 1961
1,18,80,000.00 1,18,80,000.00 46,77,030.00 21,73,122.00 3,06,10,152.00
(b) Value of perquisites u/s 17(2) Income Tax Act, 1961
- - - - -
(c) Profits in lieu of salary under sec on 17(3) Income-tax Act, 1961
- - - - -
2 Stock Op on - - - - -3 Sweat Equity - - - - -4 Commission
- as % of profit - - - - -- others, specify - - - - -
5 Others, specify - - - - -TOTAL (A) 1,18,80,000.00 1,18,80,000.00 46,77,030.00 21,73,122.00 3,06,10,152.00Ceiling as per the Act 10% of Net Profit

Annual Report 2016-17 Annexure to the Directors' Report
36
B. Remunera on to other Directors Sl.
No.Par culars of Remunera on Name of Directors Total Amount
Mr. Suraj Mall Singhi
Mr. Sanjay Khandelwal
Ms. Arundhu Dhar
Mr. Bijan Roy Mr. Manish Agarwal
1 Independent Directors- Fee for a ending board commi ee mee ngs
80,000.00 10,000.00 1,40,000.00 35,000.00 - 3,00,000.00
- Commission - - - - -- Others, please specify - - - - -Total (1) 80,000.00 10,000.00 1,40,000.00 35,000.00 - 3,00,000.00
2 Other Non-Execu ve Directors- Fee for a nding board commi ee mee ngs
- - - - 35,000.00 -
- Commission - - - - - -- Others, please specify - - - - - -Total (2) - - - - - -Total (B) = (1 + 2) 80,000.00 10,000.00 1,40,000.00 35,000.00 35,000.00 3,00,000.00Total Managerial Remunera on
3,09,10,152.00
Ceiling as per the Act 1% of Net ProfitOverall Ceiling as per the Act 11% of Net Profit
C. Remunera on to Key Managerial Personnel other than MD/Manager/WTDSl.
No.Par culars of Remunera on Key Managerial Personnel Total Amount
CFO CS1 Gross salary
(a) Salary as per provisions contained in sec on 17(1) of the Income Tax Act, 1961
66,06,794.00 17,32,020.00 83,38,814.00
(b) Value of perquisites u/s 17(2) Income Tax Act, 1961 - - -(c) Profits in lieu of salary under sec on 17(3) Income-tax Act, 1961 - - -
2 Stock Op on - - -3 Sweat Equity - - -4 Commission
- as % of profit - - -- others, specify - - -
5 Others, please specify - - -Total 66,06,794.00 17,32,020.00 83,38,814.00

Annexure to the Directors' Report Annual Report 2016-17
37
VI. PENALTIES / PUNISHMENT / COMPOUNDING OF OFFENCES
Type Sec on of theCompanies Act
Brief Descrip on Details ofPenalty/
Punishment /Compoundingfees imposed
Authority[RD /NCLT/
COURT
Appeal madeif any give
details)
A. COMPANY
PenaltyPunishmentCompounding
B. DIRECTORS
PenaltyPunishmentCompounding
C. OTHER OFFICERS IN DEFAULT
PenaltyPunishmentCompounding
NIL

Annual Report 2016-17 Annexure to the Directors' Report
38
'ANNEXURE B'SECRETARIAL AUDIT REPORT
FOR THE FINANCIAL YEAR ENDED 31.03.2017[Pursuant to Sec on 204(1) of the Companies Act, 2013 and Rule No. 9 of the Companies
(Appointment and Remunera on of Managerial Personnel) Rules, 2014]
ToThe Members,EMC Limited“Constan a Office Complex” South Block, 8th Floor, 11, Dr. U. N. Brahmachari Street,Kolkata - 700 017West Bengal
We have conducted the secretarial audit of the compliance of applicable statutory provisions and the adherence to good corporate prac ces by EMC Limited (hereina er called the Company). Secretarial Audit was conducted in a manner that provided us a reasonable basis for evalua ng the corporate conducts/statutory compliances and expressing our opinion thereon.
Based on our verifica on of the company’s books, papers, minute books, forms and returns filed and other records maintained by the Company and also the informa on provided by the Company, its officers, agents and authorized representa ves during the conduct of secretarial audit, we hereby report that in our opinion, the Company has, during the audit period covering the financial year ended 31.03.2017 complied with the statutory provisions listed hereunder and also that the Company has proper Board-processes and compliance-mechanism in place to the extent, in the manner and subject to the repor ng made hereina er.
We have examined the books, papers, minute books, forms and returns filed and other records maintained by the Company for the financial year ended on 31st March, 2017 according to the provisions of:
(i) The Companies Act, 2013 (the Act) and the rules made thereunder;
(ii) The Securi es Contracts (Regula on) Act, 1956 (‘SCRA’) and the rules made thereunder;
(iii) The Depositories Act, 1996 and the Regula ons and Bye-laws framed thereunder;
(iv) Foreign Exchange Management Act, 1999 and the rules and regula ons made thereunder to the extent of Foreign Direct Investment, Overseas Direct Investment;
(v) The Regula ons and guidelines prescribed under the Securi es and Exchange Board of India Act, 1992(‘SEBI Act”) with respect to Securi es are not applicable to the company, as being an unlisted Public Company.
(vi) The Company is engaged in EPC Contract, Transmission Line Projects, Sub-sta on and Power Distribu on for large Projects.
We have also examined compliance with the applicable clauses of the followings :-
a) Secretarial Standards 1 and 2 issued by the Ins tute of Company Secretaries of India.
We report that during the period under review the Company complied with the provisions of the Act, Rules, Regula ons, Guidelines, Standards etc. men oned above, except that :
(a) the Company has not made the requisite expenditure towards the Corporate Social Responsibility (CSR) in terms of Sec on 135 of the Companies Act, 2013;
We further report that compliance of applicable financial laws including Direct and Indirect Tax laws by the Company has not been reviewed in this Audit since the same has been subject to review by the Statutory Auditors and other designated professionals.
MANAGEMENT RESPONSIBILITY:
i. Maintenance of secretarial records is the responsibility of the management of the Company. Our responsibility is to express an opinion on these secretarial records based on our audit;
ii. We have followed the audit prac ces and the processes as were appropriate to obtain reasonable assurance about the correctness of the contents of the secretarial records. The verifica on was done on test basis to ensure that correct facts are reflected in secretarial records. We believe that the processes and prac ces, we followed provide a reasonable basis for our opinion;
iii. We have not verified the correctness and appropriateness of financial records and Books of Accounts of the Company or verified compliances of laws other than those men oned above;
iv. The compliance of the provisions of Corporate and other applicable laws, rules, regula ons, standards is the responsibility of

Annexure to the Directors' Report Annual Report 2016-17
39
management. Our examina on was limited to the verifica on of procedure on test basis;
v. The Secretarial Audit report is neither an assurance as to the future viability of the Company nor of the efficacy or effec veness with which the management has conducted the affairs of the Company.
We further report that:
(a) The Board of Directors of the Company is duly cons tuted with proper balance of Execu ve Directors, Non-Execu ve Directors and Independent Directors. The changes in the composi on of the Board of Directors that took place during the period under review were carried out in compliance with the provisions of the Act.
(b) Adequate no ce is given to all directors to schedule the Board Mee ngs, agenda and detailed notes on agenda were sent atleast seven days in advance, and a system exists for seeking and obtaining further informa on and clarifica ons on the agenda items before the mee ng and for meaningful par cipa on at the mee ng.
(c) Majority decision is carried through majority while the dissen ng members’ ,if any, views are captured and recorded as part of the minutes.
(d) There are adequate systems and processes in the company commensurate with the size and opera ons of the company to monitor and ensure compliance with applicable laws, rules, regula ons and guidelines.
We further report that during the audit period :
(a) A lender of the Company have converted the loan amount of Rs. 250,312,500/- into 1,335,000 Equity shares of Rs. 10/- each at a premium of Rs. 177.50 per share in terms of the Special Resolu on passed by the shareholders during the year under audit.
(b) The company has made further investment in Technolines S.r.l., Italy, a subsidiary of the company during the period under report.
(c) The Scheme of Amalgama on/merger of EMC Limited, Mcnally Bharat Engineering Co. Ltd, Macnally Bharat Sayaji Engineering Limited with Kilburn Engineering Limited was withdrawn by the Board due to prevailing unfavourable market environment.
For B. NAIR AND COMPANYCompany Secretary In Prac ce
CS. B U NAIRPlace : Kolkata Membership No. FCS 5546Dated : 30th day of June, 2017 CP NO. 10778

40
Annual Report 2016-17 Annexure to the Directors' Report
40
STANDALONE FINANCIAL STATEMENTS

Independent Auditor's Report Annual Report 2016-17
4141
To The Members ofEMC Limited
REPORT ON THE STANDALONE IND AS FINANCIAL STATEMENTS
We have audited the accompanying standalone Ind AS financial statements of EMC Limited (‘the Company’), which comprise the balance sheet as at 31 March 2017, the statement of profit and loss (including other comprehensive income), the statement of cash flows and the statement of changes in equity for the year then ended and a summary of the significant accoun ng policies and other explanatory informa on (herein a er referred to as “standalone Ind AS financial statements”).
MANAGEMENT’S RESPONSIBILITY FOR THE STANDALONE FINANCIAL STATEMENTS
The Company’s Board of Directors is responsible for the ma ers stated in Sec on 134(5) of the Companies Act, 2013 (“the Act”) with respect to the prepara on of these standalone Ind AS financial statements that give a true and fair view of the financial posi on, financial performance including other comprehensive income, cash flows and changes in equity of the Company in accordance with the accoun ng principles generally accepted in India, including the Indian Accoun ng Standards (Ind AS) prescribed under Sec on 133 of the Act read with relevant rules issued thereunder.
This responsibility also includes maintenance of adequate accoun ng records in accordance with the provisions of the Act for safeguarding the assets of the Company and for preven ng and detec ng frauds and other irregulari es; selec on and applica on of appropriate accoun ng policies; making judgments and es mates that are reasonable and prudent; and design, implementa on and maintenance of adequate internal financial controls, that were opera ng effec vely for ensuring the accuracy and completeness of the accoun ng records, relevant to the prepara on and presenta on of the standalone Ind AS financial statements that give a true and fair view and are free from material misstatement, whether due to fraud or error.
AUDITOR’S RESPONSIBILITY
Our responsibility is to express an opinion on these standalone Ind AS financial statements based on our audit.
We have taken into account the provisions of the Act, the accoun ng and audi ng standards and ma ers which are required to be included in the audit report under the provisions of the Act and the Rules made thereunder.
We conducted our audit in accordance with the Standards on Audi ng specified under Sec on 143(10) of the Act. Those Standards require that we comply with ethical requirements and plan and perform the audit to obtain reasonable assurance about whether the standalone Ind AS financial statements are free from material misstatement.
An audit involves performing procedures to obtain audit evidence about the amounts and the disclosures in the standalone Ind AS financial statements. The procedures selected depend on the auditor’s judgment, including the assessment of the risks of material misstatement of the standalone Ind AS financial statements, whether due to fraud or error. In making those risk assessments, the auditor considers internal financial control relevant to the Company’s prepara on of the standalone Ind AS financial statements that give a true and fair view in order to design audit procedures that are appropriate in the circumstances. An audit also includes evalua ng the appropriateness of the accoun ng policies used and the reasonableness of the accoun ng es mates made by the Company’s Directors, as well as evalua ng the overall presenta on of the standalone Ind AS financial statements.
We believe that the audit evidence we have obtained is sufficient and appropriate to provide a basis for our audit opinion on the standalone Ind AS financial statements.
OPINION
In our opinion and to the best of our informa on and according to the explana ons given to us, the aforesaid standalone Ind AS financial statements give the informa on required by the Act in the manner so required and give a true and fair view in conformity with the accoun ng principles generally accepted in India including the Ind AS, of the financial posi on of the Company as at 31 March, 2017, and its financial performance including other comprehensive income, its cash flows and the changes in equity for the year ended on that date.
REPORT ON OTHER LEGAL AND REGULATORY REQUIREMENTS
(1) As required by the Companies (Auditor’s Report) Order, 2016(‘’the Order’’) issued by the Central Government of India in terms of sub-sec on (11) of sec on 143 of the Companies Act, 2013, we give in the ‘Annexure A’; a statement on the ma ers specified in the paragraph 3 and 4 of the said order, to the extent applicable.
(2) As required by Sec on 143 (3) of the Act, we report that:
(a) We have sought and obtained all the informa on and explana ons which to the best of our knowledge and belief were necessary for the purposes of our audit;

Annual Report 2016-17 Independent Auditor's Report
42
(b) in our opinion, proper books of account as required by law have been kept by the Company so far as it appears from our examina on of those books;
(c) the Standalone Ind AS Balance Sheet, Statement of Profit and Loss, the statement of cash flows and the statement of changes in equity dealt with by this Report are in agreement with the books of account;
(d) in our opinion, the aforesaid standalone Ind AS financial statements comply with the Indian Accoun ng Standards (Ind AS) specified under sec on 133 of the Act, read with relevant rule issued thereunder;
(e) on the basis of the wri en representa ons received from the Directors as on 31st March, 2017, taken on record by the Board of Directors, none of the Directors is disqualified as on 31st March, 2017 from being appointed as a Director in terms of sec on 164 (2) of the Act;
(f) with respect to the adequacy of the internal financial controls over financial repor ng of the Company and the opera ng effec veness of such controls, refer to our separate Report in ‘Annexure B’; and
(g) with respect to the other ma ers to be included in the Auditor’s Report in accordance with rule 11 of the companies (Audit and Auditors) Rules, 2014, in our opinion and to the best of our informa on and according to the explana ons given to us:
(i) The Company has disclosed the pending li ga ons in its Ind AS financial statements;
(ii) The Company did not have any long- term contracts, including deriva ve contracts. Accordingly, no provisions for material foreseeable losses have been made; and
(iii) There were no amounts which are required to be transferred to the investor educa on & protec on fund by the Company.
(iv) The Company has provided requisite disclosures in its standalone Ind AS financial statements as to holdings as well as dealings in Specified Bank Notes during the period from 8 November, 2016 to 30 December, 2016. Based on audit procedures and relying on the management representa on we report that the disclosure are in accordance with the books of accounts maintained by the Company and as produced to us by the Management.
For SRB & AssociatesChartered Accountants
Firm Registra on No-310009E
Bisworanjan SutarKolkata, Partner30th June 2017 Membership No: 066708

Independent Auditor's Report Annual Report 2016-17
43
Annexure-A to the Independent Auditors’ Report
The Annexure referred to in Independent Auditors’ Report to the members of the Company on the standalone Ind AS financial statements for the year ended 31 March 2017, we report that: (i) (a) The Company has maintained proper records showing full par culars, including quan ta ve details and situa on of fixed
assets. (b) The Company has a regular programme of physical verifica on of its fixed assets, by which all fixed assets are verified in a
phased manner over a period of two years. In our opinion, this periodicity of physical verifica on is reasonable having regard to the size of the Company and the nature of its assets. Pursuant to such program, a por on of fixed asset has been physically verified by the management during the year and no material discrepancies were no ced on such verifica on.
(c) In our opinion and according to the informa on and explana ons given to us, the tle deeds of immovable proper es are held in the name of the Company.
(ii) (a) The inventory has been physically verified by the management during the year. In our opinion, the frequency of such verifica on is reasonable.
(b) The discrepancies no ced on the aforesaid verifica on between the physical stocks and book records were not material.(iii) (a) According to the informa on and explana ons given to us, the terms and condi ons in respect of the loans granted by
the Company (secured/ unsecured loans) to companies/ firms/ limited liability partnerships or other par es covered in the register maintained under sec on 189 of the Act are not prima-facie prejudicial to the interest of the Company.
(b) In respect of the aforesaid loans, the par es are repaying the principal amounts as s pulated and are also regular in payment of interest, where applicable.
(c) In respect of the aforesaid loans, there is no overdue amount for a period exceeding 90 days.(iv) In our opinion and according to the informa on and explana ons given to us, the Company has complied with the provisions
of sec on 185 and 186 of the Act in respect of grant of loans, making investments and providing guarantees and securi es, as applicable.
(v) In our opinion and according to the informa on and explana ons given to us, the Company has not accepted any deposits from public and accordingly paragraph 3 (v) of the Order is not applicable.
(vi) We have broadly reviewed the books of account maintained by the Company pursuant to the rules prescribed by the Central Government for maintenance of cost records under sub-sec on (1) of sec on 148 of the Act and are of the opinion that, prima facie, the prescribed accounts and records have been made and maintained. However, we have not made a detailed examina on of the records.
(vii) (a) According to the informa on and explana ons given to us and on the basis of our examina on of the records of the Company, amounts deducted/accrued in the books of account in respect of undisputed statutory dues including provident fund, employees’ state insurance, income-tax, sales tax, service tax, duty of customs, duty of excise, value added tax, cess and other material statutory dues have been generally regularly deposited during the year by the Company with the appropriate authori es.
(b) According to the informa on and explana ons given to us, the following dues of sales tax & service tax have not been deposited by the Company on account of disputes:
Sl. No.
Name of the Statute Nature of the Dues
Year since pending
Forum where Disputes is pending Amount involved(` In Lakhs)
1. Central Excise Act, 1944
Service Tax 2007-08 The CESTAT (Chennai) 26.012007-082008-092009-102010-11
The CESTAT(Kolkata) 302.63
2. Central Sales Tax Act, 1956 & Sales Tax Act of Various States
Sales Tax/VAT and Entry Tax
2012-13 The Sales Tax Appeal, Revision Board(WB) 123.062011-12 The Add. Commissioner Sales Tax Appeal(AP) 122.822011-12 The Sales Tax Appeal, Revision Board(WB) 24.562012-13 The Add. Commissioner Sales Tax Appeal(MP) 378.942012-13 The DY. Commissioner Sales Tax Appeal(TS) 39.232012-13,
2013-14 & 2014-15
The Sales Tax Appeal, Tribunal(Rajasthan) 85.41
2012-13 The Dy. Commissioner, Sales Tax Appeal(TN) 63.912013-14 The Add. Commissioner, Sales Tax Appeal(MP) 340.95

Annual Report 2016-17 Independent Auditor's Report
44
(viii) In our opinion and according to the informa on and explana ons given to us, the Company has not defaulted in repayment of dues to any financial ins tu ons, bankers and government or debenture holders during the year.
(ix) In our opinion and according to the informa on and explana ons given to us, the term loans taken by the Company have been applied for the purpose for which they were raised. The Company has not raised any moneys by way of ini al public offer or further public offer (including debt instruments) during the year.
(x) According to the informa on and explana ons given to us, no fraud by the Company or on by its officers or employees has been no ced or reported during the course of our audit.
(xi) According to the informa on and explana ons given to us, managerial remunera on has been paid or provided in accordance with the requisite approvals mandated by the provisions of sec on 197 read with schedule V to the Companies Act.
(xii) In our opinion and according to the informa on and explana ons given to us, the Company is not a Nidhi Company. Accordingly, paragraph (xii) of the Order is not applicable.
(xiii) According to the informa on and explana ons given to us and based on our examina on of the records of the Company, transac ons with the related par es are in compliance with sec on 177 &188 of the Act where applicable and the details of such transac ons have been disclosed in the standalone Ind AS financial statements of the Company as required by the applicable accoun ng standards.
(xiv) According to the informa on & explana ons given to us and based on our examina on of the records of the Company, the Company has made preferen al allotment of fully paid up equity shares during the year under review incompliance with the requirements of sec on 42 and 62 of the Companies Act and the amount so raised have been used for the purposes for which the funds were raised.
(xv) According to the informa on and explana ons given to us and based on our examina on of the records of the Company, the Company has not entered into non-cash transac ons with directors or persons connected with them. Accordingly, paragraph (xv) of the Order is not applicable.
(xvi) The Company is not required to be registered under sec on 45-IA of the Reserve Bank of India Act, 1934.
For SRB & AssociatesChartered Accountants
Firm Registra on No-310009E
Bisworanjan SutarKolkata, Partner30th June 2017 Membership No: 066708

Independent Auditor's Report Annual Report 2016-17
45
Annexure -B to the Independent Auditors’ Report REPORT ON THE INTERNAL FINANCIAL CONTROLS UNDER CLAUSE (I) OF SUB SECTION 3 OF SECTION 143 OF THE COMPANIES ACT, 2013 (“THE ACT”) We have audited the internal financial controls over financial repor ng of EMC Limited (“the Company”) as of March 31, 2016 in conjunc on with our audit of the standalone Ind AS financial statements of the Company for the year ended on that date.MANAGEMENT’S RESPONSIBILITY FOR INTERNAL FINANCIAL CONTROLSThe Company’s management is responsible for establishing and maintaining internal financial controls based on the internal control over financial repor ng criteria established by the Company considering the essen al components of internal control stated in the Guidance Note on Audit of Internal Financial Controls over Financial Repor ng issued by the Ins tute of Chartered Accountants of India (‘ICAI’). These responsibili es include the design, implementa on and maintenance of adequate internal financial controls that were opera ng effec vely for ensuring the orderly and efficient conduct of its business, including adherence to company’s policies, the safeguarding of its assets, the preven on and detec on of frauds and errors, the accuracy and completeness of the accoun ng records, and the mely prepara on of reliable financial informa on, as required under the Companies Act, 2013. AUDITORS’ RESPONSIBILITYOur responsibility is to express an opinion on the Company's internal financial controls over financial repor ng based on our audit. We conducted our audit in accordance with the Guidance Note on Audit of Internal Financial Controls over Financial Repor ng (the “Guidance Note”) and the Standards on Audi ng, issued by ICAI and deemed to be prescribed under sec on 143(10) of the Companies Act, 2013, to the extent applicable to an audit of internal financial controls, both applicable to an audit of Internal Financial Controls and, both issued by the Ins tute of Chartered Accountants of India. Those Standards and the Guidance Note require that we comply with ethical requirements and plan and perform the audit to obtain reasonable assurance about whether adequate internal financial controls over financial repor ng was established and maintained and if such controls operated effec vely in all material respects. Our audit involves performing procedures to obtain audit evidence about the adequacy of the internal financial controls system over financial repor ng and their opera ng effec veness. Our audit of internal financial controls over financial repor ng included obtaining an understanding of internal financial controls over financial repor ng, assessing the risk that a material weakness exists, and tes ng and evalua ng the design and opera ng effec veness of internal control based on the assessed risk. The procedures selected depend on the auditor’s judgment, including the assessment of the risks of material misstatement of the standalone Ind AS financial statements, whether due to fraud or error. We believe that the audit evidence we have obtained is sufficient and appropriate to provide a basis for our audit opinion on the Company’s internal financial controls system over financial repor ng. MEANING OF INTERNAL FINANCIAL CONTROLS OVER FINANCIAL REPORTINGA company's internal financial control over financial repor ng is a process designed to provide reasonable assurance regarding the reliability of financial repor ng and the prepara on of financial statements for external purposes in accordance with generally accepted accoun ng principles. A company's internal financial control over financial repor ng includes those policies and procedures that (1) pertain to the maintenance of records that, in reasonable detail, accurately and fairly reflect the transac ons and disposi ons of the assets of the company; (2) provide reasonable assurance that transac ons are recorded as necessary to permit prepara on of financial statements in accordance with generally accepted accoun ng principles, and that receipts and expenditures of the company are being made only in accordance with authorisa ons of management and directors of the company; and (3) provide reasonable assurance regarding preven on or mely detec on of unauthorised acquisi on, use, or disposi on of the company's assets that could have a material effect on the financial statements. INHERENT LIMITATIONS OF INTERNAL FINANCIAL CONTROLS OVER FINANCIAL REPORTINGBecause of the inherent limita ons of internal financial controls over financial repor ng, including the possibility of collusion or improper management override of controls, material misstatements due to error or fraud may occur and not be detected. Also, projec ons of any evalua on of the internal financial controls over financial repor ng to future periods are subject to the risk that the internal financial control over financial repor ng may become inadequate because of changes in condi ons, or that the degree of compliance with the policies or procedures may deteriorate. OPINIONIn our opinion, the Company has, in all material respects, an adequate internal financial controls system over financial repor ng and such internal financial controls over financial repor ng were opera ng effec vely as at 31 March 2017, based on the internal control over financial repor ng criteria established by the Company considering the essen al components of internal control stated in the Guidance Note on Audit of Internal Financial Controls Over Financial Repor ng issued by the Ins tute of Chartered Accountants of India.
For SRB & AssociatesChartered Accountants
Firm Registra on No-310009E
Bisworanjan SutarKolkata, Partner30th June 2017 Membership No: 066708

Annual Report 2016-17 Standalone Balance Sheet as at 31st March, 2017
46
As per our Report of even date a achedFor SRB & AssociatesChartered Accountants (F. Regd. No.310009E)
Bisworanjan Sutar(Partner)Membership No. - 066708Kolkata, The 30th day of June, 2017
For and on behalf of the Board
Manoj Toshniwal Ramesh Chandra Bardia Managing Director Jt. Managing Director DIN : 00022787 DIN : 00374148
Arun Kumar Kedia Sumit Kumar Surana Chief Financial Officer Company Secretary
Yamini MoreVP (Finance & Accounts)
(` in lacs)
Par culars Note No.
As at 31st March, 2017
As at 31st March, 2016
As at 1st April, 2015
I. ASSETS1. Non-current Assets
a. Property,Plant and Equipment 5 26,164.36 16,736.22 18,229.72 b. Capital Work-in-Progress 5 - 22.00 62.82 c. Intangible Assets 5 59.03 51.31 44.62 d. Financial Assets
(i) Investments 6(i) 13,905.27 18,456.54 7,121.18 (ii) Trade Receivables 7(i) 2,853.94 2,593.69 2,099.59 (iii)Other Financial Assets 8(i) 3.62 3.62 3.18
e. Other Assets 9(i) 3,899.73 3,011.95 2,048.45 2. Current Assets
a. Inventories 11 11,032.94 13,488.49 13,849.90 b. Financial Assets
(i) Trade Receivables 7(ii) 1,92,105.99 1,70,163.12 1,49,711.45 (ii) Cash & Cash Equivalent 12 497.99 892.88 477.02 (iii) Other Financial Assets 8(ii) 14,984.82 13,458.71 9,635.97
c. Other Assets 9(ii) 1,37,530.21 1,34,969.71 1,04,416.08 TOTAL ASSETS 4,03,037.90 3,73,848.24 3,07,699.98
II. EQUITY AND LIABILITIES1. Equity
a. Equity Share Capital 13 4,833.50 4,700.00 3,700.00 b. Other Equity 14 94,547.74 71,524.03 58,850.69
2. Non-current liabili esa. Financial Liabili es
(i) Borrowings 15(i) 23,358.39 32,663.47 24,561.27 (ii) Trade Payables 16(i) 5,826.66 4,829.85 5,733.15 (iii) Other Financial Liabili es 17(i) 20,498.04 22,938.61 12,682.92 b.Deferred Tax Liabili es (net) 10 18,927.36 11,233.38 119.27
3. Current liabili esa. Financial Liabili es
(i) Borrowings 15(ii) 77,001.53 76,900.90 60,522.14 (ii) Trade Payables 16(ii) 1,28,112.28 1,21,684.66 1,21,373.53 (iii) Other Financial Liabili es 17 (ii) 27,051.43 22,338.64 12,348.04
b. Provisions 18 195.10 169.23 229.39 c. Other Liabili es 19 2,571.79 4,827.55 1,360.42 d. Current Tax Liability (net) 20 114.08 37.92 6,219.15
TOTAL EQUITY AND LIABILITIES 4,03,037.90 3,73,848.24 3,07,699.98 Significant Accoun ng Policies 1 to 2Notes form an integral part of Standalone Financial Statement 3 to 46

Standalone Statement of Profit & Loss for the year ended 31st March, 2017 Annual Report 2016-17
47
(` in lacs)
Par culars Note No. 31st March, 2017 31st March, 2016 INCOMEI. Revenue from Opera ons 21 4,63,161.93 4,13,126.65 II. Other Income 22 1,402.31 1,427.81
Total Income 4,64,564.24 4,14,554.46 III. EXPENSES
(a) Cost of Materials Consumed 23 3,48,884.49 3,08,588.20 (b) Change in Inventory (Increase)/Decrease 24 2,715.36 840.98 (c) Manufacturing and Processing Costs 25 34,316.80 34,062.35 (d) Employee Benefit Expenses 26 8,265.31 7,672.73 (e) Finance cost 27 21,319.50 18,565.19 (f) Deprecia on and Amor za on expenses 28 1,730.83 1,755.51 (g) Other Expenses 29 22,031.73 20,115.76 Total Expenses 4,39,264.02 3,91,600.71
IV. Profit Before excep onal items and tax 25,300.22 22,953.75 Excep onal items - -
V. Profit before Taxes 25,300.22 22,953.74 VI. Tax Expenses 30
(a)Current Tax 1,236.68 1,376.79 (b)Deferred Tax 7,483.75 6,523.86
VII. Profit (Loss) for the Year 16,579.79 15,053.09 VIII. Other Comprehensive Income
(i) Items that will not be reclassified subsequently to profit or loss:(a) Changes in investments in equity shares carried at Fair Value through OCI
(3,469.66) (3,429.28)
(b) Re-measurement of defined employee benefit plans 16.63 (10.01)(c) Revalua on Surplus on Property, Plant & Equipment 10,237.53 - (d) Income tax effect - - - on Revalua on Surplus on Property, Plant & Equipment (201.01) - - on Re-measurement of defined employee benefit plans (9.22) 3.47(ii) Items that will be reclassified subsequently to profit or loss : - - (a) Changes in investments other than equity(b) Income tax effect
IX. Total Other comprehensive Income a er tax 6,574.27 3,435.83X. Total comprehensive income for the period 23,154.09 11,617.30XI. Earnings per equity share:
(1) Basic in ( ` ) 35 35.28 33.09 (2) Diluted in ( ` ) 35 35.28 33.09
Significant Accoun ng Policies 1 to 2Notes form an integral part of Standalone Financial Statement 3 to 46
As per our Report of even date a achedFor SRB & AssociatesChartered Accountants (F. Regd. No.310009E)
Bisworanjan Sutar(Partner)Membership No. - 066708Kolkata, The 30th day of June, 2017
For and on behalf of the Board
Manoj Toshniwal Ramesh Chandra Bardia Managing Director Jt. Managing Director DIN : 00022787 DIN : 00374148
Arun Kumar Kedia Sumit Kumar Surana Chief Financial Officer Company Secretary
Yamini MoreVP (Finance & Accounts)

Annual Report 2016-17 Standalone Statement of Changes in Equity for the year ended 31st March, 2017
48
A. Equity Share Capital (` in lacs)
Par culars AmountAs at 1 April 2015 3,700.00 Changes in equity share capital 1,000.00 As at 31 March 2016 4,700.00 Changes in equity share capital 133.50 As at 31 March 2017 4,833.50
B. Other Equity (` in lacs)
Par culars A ributable to owners of EMC LimitedShare
Applica on Money
Equity Component
of Debt Instrument
Reserves & Surplus Other Comprehensive Income
Total other equitySecuri es
Premium Reserve
Retained Earnings
FVOCI-equity
investments
Revalua on Surplus
Balance at 1 April 2015 12,500.00 - 7,300.00 39,048.56 2.14 - 58,850.70 Profit for the year - - - 15,053.13 - - 15,053.13 Other comprehensive income - - - (6.55) (3,429.28) - (3,435.83)Total comprehensive income for the year
- - - 15,046.58 (3,429.28) - 11,617.30
Other Adjustments - 2,500.00 - 1.35 - - 2,501.35 Issue of equity shares (12,500.00) - 11,500.00 - - - (1,000.00)Dividends paid - - - (445.32) - - (445.32)Balance at 31 March 2016 - 2,500.00 18,800.00 53,651.17 (3,427.14) - 71,524.03 Profit for the year - - - 16,579.83 - - 16,579.83 Other comprehensive income - - - 7.41 (3,469.66) 10,036.50 6,574.26 Total comprehensive income for the year
- - - 16,587.24 (3,469.66) 10,036.50 23,154.09
Other Adjustments - 3.13 - - - - 3.13 Issue of equity shares - (2,503.13) 2,369.63 - - - (133.50)Balance at 31 March 2017 - - 21,169.63 70,238.41 (6,896.80) 10,036.50 94,547.74
As per our Report of even date a achedFor SRB & AssociatesChartered Accountants (F. Regd. No.310009E)
Bisworanjan Sutar(Partner)Membership No. - 066708Kolkata, The 30th day of June, 2017
For and on behalf of the Board
Manoj Toshniwal Ramesh Chandra Bardia Managing Director Jt. Managing Director DIN : 00022787 DIN : 00374148
Arun Kumar Kedia Sumit Kumar Surana Chief Financial Officer Company Secretary
Yamini MoreVP (Finance & Accounts)

Standalone Cash Flow Statement for the year ended 31st March, 2017 Annual Report 2016-17
49
(` in lacs)
Par culars Year Ended31st March, 2017
Year Ended31st March, 2016
A OPERATING ACTIVITIESProfit before tax from con nuing opera ons 25,300.22 22,953.74 Profit/(loss) before tax from discon nuing opera ons - - Profit before tax 25,300.22 22,953.77 Adjustment to reconcile profit before tax opera ng cash flows:Deprecia on on Property,plant and equipment 1,720.30 1,746.81 Amor sa on of intangible assets 10.53 8.70 Net foreign exchange differences 110.35 (139.60)Finance income (including fair value change in financial instruments) (1,235.48) (1,150.43)Finance costs (including fair value change in financial instruments) 21,319.49 18,565.18 Working capital adjustments:Decrease/(Increase) in Trade receivables (22,203.12) (20,945.77)Decrease/(Increase) in Deriva ve Financial Assets 51.94 (31.27)Decrease/(Increase) in Inventories 2,455.54 361.42 Decrease/(Increase) in Other Assets (3,558.63) (31,377.53)(Decrease)/Increase in Trade Payables 7,424.41 (592.16)(Decrease)/Increase in Other Financial Liability 2,288.86 20,236.27(Decrease)/Increase in Other Liability (2,229.87) 3,406.97
31,454.54 13,042.36Income tax paid 1,160.52 2,964.30 NET CASH GENERATED BY OPERATING ACTIVITIES (A) 30,294.03 10,078.06
B INVESTING ACTIVITIESPurchase of property, plant and equipment (888.31) (198.37)Purchase of Intangible Assets (18.25) (15.39)Purchase of Capital Work In Progress (0.61) (13.68)Purchase/(Sale) of Investments 1,081.62 (14,764.65)Interest received (finance income) 1,235.48 1,150.43 NET CASH USED IN INVESTING ACTIVITIES (B) 1,409.93 (13,841.65)
C FINANCING ACTIVITIESProceeds from issue of equity shares 2,503.13 - Changes in Other Equity (2,500.00) 2,500.92Interest paid (21,319.49) (18,565.18)Proceeds/(Repayment) from borrowings (9,204.45) 24,480.95Dividends paid including Dividend Distribu on Tax - (445.32)NET CASH USED IN FINANCING ACTIVITIES (C) (30,520.82) 7,971.37Net increase in cash and cash equivalents (A+B+C) 1,183.17 4,207.78 Cash and cash equivalents at the beginning of the year 14,303.27 10,095.50 Cash and cash equivalents at year end 15,486.43 14,303.27
The above cashflow statement has been prepared under the “Indirect method” set out in Ind AS 7 “ Statement of Cash flows”
As per our Report of even date a achedFor SRB & AssociatesChartered Accountants (F. Regd. No.310009E)
Bisworanjan Sutar(Partner)Membership No. - 066708Kolkata, The 30th day of June, 2017
For and on behalf of the Board
Manoj Toshniwal Ramesh Chandra Bardia Managing Director Jt. Managing Director DIN : 00022787 DIN : 00374148
Arun Kumar Kedia Sumit Kumar Surana Chief Financial Officer Company Secretary
Yamini MoreVP (Finance & Accounts)

Annual Report 2016-17 Notes on Standalone Financial Statements for the year ended 31st March, 2017
50
NOTE 1 BACKGROUND
EMC Limited with over six decades of experience is one of India’s fastest growing Engineering, Procurement and Construc ons (EPC) companies and a world-class provider of end-to-end power systems solu ons across the world. Since 1953 EMC Limited has built cri cal power & infrastructure assets for our country & clients globally. Today EMC Limited is a global company with a world wide presence in Power Transmission, Power Distribu on, Balance of Plant and Railways.
NOTE 2 SIGNIFICANT ACCOUNTING POLICIES
2.1 Basis of prepara on : i) Compliance with Ind AS The financial statements comply in all material aspects with Indian Accoun ng Standards (Ind AS) no fied under Sec on 133
of the Companies Act, 2013 (the Act), read with Companies (Indian Accoun ng Standards) Rules, 2015 and other relevant provisions of the Act.
The financial statements up to year ended 31st March 2016 were prepared in accordance with the accoun ng standards no fied under Companies (Accoun ng Standard) Rules, 2006 (as amended) and other relevant provisions of the Act.
These financial statements are the first financial statements under Ind AS. Refer to note no.45 for an explana on of how the transi on from previous GAAP to Ind AS has affected the company’s financial posi on, financial performance and net cash flows.
ii) Historical cost conven on The financial statements have been prepared under the historical cost conven on, except for the followings asset and
liabili es which have been measured at fair value: a) Certain financial assets and liabili es (including deriva ves) b) Net Defined Obliga ons iii) Current And Non-Current Classifica on All assets and liabili es have been classified as current and non-current as per the company’s opera ng cycle and other
criteria set out in the Schedule III to the Companies Act 2013. The company has ascertained its opera ng cycle as 12 months for the purpose of current and non-current classifica ons.
2.2 Property, Plant and Equipment, Intangible Assets and Capital Work-in-progress : i) Recogni on and Measurement Freehold land is carried at historical cost. All other items of property, plant and equipment are stated at historical cost less
accumulated deprecia on. Historical cost includes expenditure that is directly a ributable to the acquisi on of the items. Subsequent costs are included in the asset’s carrying amount or recognized as separate assets, as appropriate, only when it
is probable that future economic benefits associated with the item will flow to the company and the cost of the item can be measured reliably. The carrying amount of any component accounted as separate assets is derecognized when replaced. All other repairs and maintenance are charged to profit and loss during the repor ng period in which they are incurred.
The cost of Property, plant and equipment not available for use as on each repor ng date are disclosed under capital work-in-progress.
If an asset carrying amout is increased as a result of revalua on the increase shall be recognised in other comprehensive income and accumulated in equity under the heading revalua on surplus. If an asset carrying amount is decreased as a result of revalua on, the decrease shall be recognised in statement of profit and loss. The revalua on surplus included in equity shall be directly transferred to retained earning when the asset is derecognized.
Stores and Spares that meets the criteria for recogni on as Property, plant and equipment are recognized as Property, plant and equipment.
ii) Transi on to Ind AS On transi on to Ind AS, the company has opted to con nue with the carrying amount of all of its property, plant and
equipment recognized as at 1st April 2015 measured as per the previous GAAP and use that carrying value as the deemed cost of the property, plant and equipment.
Amount lying in revalua on reserve as on transi on date is transferred to retained earnings in accordance with Ind AS Transi on Facilita on Group Bulle n-8 issued by Ins tute of Chartered Accountant of India (ICAI) .
iii) Deprecia on methods, es mated useful lives and residual value a) Deprecia on is calculated using the straight line method to allocate their cost, net of their residual values over
their es mated useful lives. The useful lives have been determined based on the technical evalua on done by the independent experts which are in line with the useful life prescribed under Schedule II to the Companies Act, 2013.

Notes on Standalone Financial Statements for the year ended 31st March, 2017 Annual Report 2016-17
51
b) Any assets whose aggregate actual cost does not exceed five thousand rupees has been fully charged off in the year of addi on.
c) The residual values are not more than 5% of the original cost of the assets. The assets’ residual values and useful lives are reviewed and adjusted at the end of each repor ng period.
d) Deprecia on on assets purchased/acquired during the year is charged from the date of purchase of the assets. Assets that are acquired during the year are depreciated on pro rata basis from the date of such addi on or, as the case may be, up to the date on which such assets has been derecognized.
e) An asset’s carrying amount is wri en down immediately to its recoverable amount if the asset’s carrying amount is greater than its es mated recoverable amount.
f) Gains and losses on disposals are determined by comparing proceeds with carrying amount. These are included in statement of profit or loss within other gains/(losses).
iv) Intangible assets : a) Recogni ons and Measurements Intangible assets acquired separately are measured on ini al recogni on at cost. Following ini al recogni on, intangible
assets are carried at cost less accumulated amor za on and accumulated impairment losses , if any. b) Amor za on methods and periods Intangible Assets with finite useful lives are amor zed on straight line basis over their es mated useful lives. c) Transi on to Ind AS On transi on to Ind AS, the company has opted to con nue with the carrying amount of all of intangible assets
recognized as at 1st April 2015 measured as per the previous GAAP and use that carrying amount as the deemed cost of intangible assets.
2.3 Leases : Leases under which the company assumes substan ally all the risks and rewards of ownership are classified as finance leases.
When acquired, such assets are capitalized at fair value or present value of the minimum lease payments at the incep on of the lease, whichever is lower. Lease payments under opera ng leases are recognized as an expense on a straight line basis in net profit in the Statement of Profit and Loss over the lease term.
2.4 Investment proper es : Investment proper es held to earn rentals or for capital apprecia on or both are stated in the balance sheet at cost, less
any subsequent accumulated deprecia on and subsequent accumulated impairment losses. Any gain or loss on disposal of investment property is determined as the difference between net disposal proceeds and the carrying amount of the property and is recognized in the statement of profit and loss. Transfer to, or from, investment property are recognized at the carrying amount of the property.
2.5 Revenue recogni on : Revenue is measured at the fair value of the considera on received or receivable. Amounts disclosed as revenue are inclusive of
excise duty and net of returns, trade allowances, rebates, value added taxes and amounts collected on behalf of third par es. It recognizes revenue when the amount of revenue can be reliably measured and it is probable that future economic benefits will
flow to the company and specific criteria have been met for each of the groups ac vi es as described below: The company adopts the following criteria as for recognizing the revenue:- a) Sale of Services- Erec on and Installa on Contracts Revenue from the erec on and installa on of power infrastructure is recognized by reference to the stage of comple on.
Stage of comple on is determined based on the joint cer fica ons by the company and the customers . b) Sale of Products- Time and Material Contracts Revenue from the me and material contracts are recognized when the significant risk and rewards of ownerships of the
materials have been transferred to the customer. c) Other Incomes Insurance claims has been recognized as revenue on cash basis.2.6 Inventories : Raw materials, Stores and spares, Semi-finished goods, traded and finished goods Inventories are valued as under – a) Raw materials, Stores spares, loose tools and Erec on materials are valued at cost b) Cost of Semi Finished Goods and Finished Goods have been valued on Weighted Average basis.

Annual Report 2016-17 Notes on Standalone Financial Statements for the year ended 31st March, 2017
52
c) Finished goods are valued at lower of Cost and Net Realisable Value d) Saleable scraps, whose cost is not iden fiable, are valued at es mated realisable value Cost of raw materials and stores comprises cost of purchase. Cost of work in progress and finished goods comprises direct
materials, direct labour and an appropriate por on of variable and fixed overhead expenditure. Cost of inventories also include all other costs incurred in bringing the inventories to their present loca on and condi on. Net realizable value is the es mated selling price in the ordinary course of business less the es mated cost of comple on and the es mated costs necessary to make the sale.
2.7 Financial Instruments : Financial assets and liabili es are recognized when the company becomes party to the contractual provisions of the instrument. Financial Assets i) Trade Receivables Trade Receivables are recognized ini ally at fair value and subsequently measured at amor zed costs less of provisions for
impairment. ii) Investments in subsidiaries, associates and joint ventures SUBSIDIARY - A subsidiary is an en ty that is controlled by another en ty. Control is achieved when the Company: a) Has power over the investee; b) Is exposed, or has rights, to variable returns from its involvement with the investee; and c) Has the ability to use its power to affect its returns. The Company reassesses whether or not it controls an investee if facts and circumstances indicate that there are changes to
one or more of the three elements of control listed above. ASSOCIATE - An associate is an en ty over which the Company has significant influence. Where as significant influence is the
power to par cipate in the financial and opera ng policy decisions of the investee but is not control or joint control over those policies.
INTERESTS IN JOINT VENTURES - A joint venture is a joint arrangement whereby the par es that have joint control of the arrangement have rights to the net assets of the joint arrangement. Joint control is the contractually agreed sharing of control of an arrangement, which exists only when decisions about the relevant ac vi es require unanimous consent of the par es sharing control.
Investment in subsidiaries, associates and joint ventures are measured at cost in accordance with Ind AS 27 – Separate Financial Statements.
iii) Deriva ves Deriva ves are ini ally recognized at fair value at the date the deriva ve contracts are entered into and are subsequently
remeasured to their fair value at the end of each repor ng period. The resul ng gain or loss is recognized in profit or loss immediately unless the deriva ve is designated and effec ve as a hedging instrument, in which event the ming of the recogni on in profit or loss depends on the nature of the hedging rela onship and the nature of the hedged item.
iv) Other Financial Assets a) Classifica ons The company classifies its financial assets in the following categories: i) Those to be measured subsequently at fair value (either through other comprehensive income or through profit
and loss). ii) Those measured at amor zed costs The classifica on depends upon the business model for managing the financial assets and contractual
characteris cs of the cash flows. b) Measurements Ini al Recogni on Financial assets are ini ally measured at fair value. Transac on costs that are directly a ributable to the acquisi on or
issue of financial assets (other than financial assets at fair value through profit or loss) are added to or deducted from the fair value measured on ini al recogni on of financial assets. The transac on costs are directly a ributable to the acquisi on of financial assets at fair value through profit or loss are immediately recognized in profit or loss.
Subsequent Measurement There are three subsequent measurement categories into which the company classifies its debt instruments financial
assets:

Notes on Standalone Financial Statements for the year ended 31st March, 2017 Annual Report 2016-17
53
i) measured at amor zed cost Financial assets are subsequently measured at amor zed cost if these financial assets are held within a business
whose objec ve is to hold these assets to collect contractual cash flows and the contractual terms of the financial assets give rise on specified dates to cash flow that are solely payments of principal and interest on the principal amount outstanding.
ii) measured at fair value through other comprehensive income Financial assets are measured at fair value through other comprehensive income if these financial assets are held
within a business whose objec ve is achieved by both collec ng contractual cash flows on specified dates to cash flow that are solely payments of principal and interest on the principal amount outstanding and selling financial assets.
iii) measured at fair value through profit or loss Financial assets are measured at fair value through profit or loss unless it is measured at amor zed cost or fair
value through other comprehensive income on ini al recogni on. Equity instruments An equity instruments is a contract that evidences residual interest in the assets of the company a er deduc ng all of
its liabili es. Equity instruments recognized at the proceeds received net off direct issue cost. All equity instruments classified under financial assets are subsequently measured at fair value. c) Impairment of Financial Assets The company assesses on forward looking basis the expected credit losses associated with its assets carried at amor zed
costs. The impairment methodology applied depends on whether there has been a significant increase in credit risks. For trade receivables only, the company has applied the simplified approach permi ed by Ind AS 109 Financial
Instruments, which requires expected life me credit losses to be recognized from ini al recogni on of the trade receivables.
d) Derecogni on of Financial Assets A financial assets is derecognized only when : The company has transferred the rights to receive cash flows from the financial assets or retains the contractual rights
to receive the cash flows of the financial assets but assumes a contractual obliga on to pay the cash flows to one or more recipients.
e) Income from Financial Assets i) Interest Income : Interest income from debt instruments is recognized using the effec ve interest rate method. ii) Dividends : Dividends are recognized in the statement of profit and loss only when the right to receive the payment is
established, it is probable that economic benefits associated with the dividend will flow to the group, and the amount of the dividend can be measured reliably.
Financial Liabili es a) Borrowings : i) Borrowings are ini ally recognized at fair value, net of transac on costs incurred. Borrowings are
subsequently measured at amor zed cost. Any difference between the proceeds (net of transac on costs) and the redemp on amount is recognized in profit or loss over the period of the borrowings using the effec ve interest method.
ii) Borrowings are removed from the balance sheet when the obliga on specified in the contract is discharged, cancelled or expired. The difference between the carrying amount of a financial liability that has been ex nguished or transferred to another party and the considera on paid, including any non-cash assets transferred or liabili es assumed, is recognized in profit or loss as other gains/(losses).
iii) Borrowings are classified as current liabili es unless the en ty has an uncondi onal right to defer se lement of the liability for at least 12 months a er the repor ng period. Where there is a breach of a material provision of a long-term loan arrangement on or before the end of the repor ng period with the effect that the liability becomes payable on demand on the repor ng date, the en ty does not classify the liability as current, if the lender agreed, a er the repor ng period and before the approval of the financial statements for issue, not to demand payment as a consequence of the breach.

Annual Report 2016-17 Notes on Standalone Financial Statements for the year ended 31st March, 2017
54
b) Trade and other payables : These amounts represent liabili es for goods and services provided to the en ty prior to the end of financial year
which are unpaid. The amounts are unsecured and are usually paid within 180 days of recogni on. Trade and other payables are presented as current liabili es unless payment is not due within 12 months a er the repor ng period. They are recognized ini ally at their fair value and subsequently measured at amor zed cost using the effec ve interest method.
c) Other Financial Liabili es : Financial liabili es are measured at amor zed cost using effec ve interest method. Financial liabili es carried
at fair value through profit or loss are measured at fair value with all changes in fair value recognized in the statement of profit and loss.
Interest bearing loans and borrowings are subsequently measured at amor zed cost using effec ve interest rate method. Gain and losses recognized in profit and loss when the liabili es are derecognized.
d ) Offse ng of Financial Instruments : A financial asset and a financial liability shall be offset and the net amount presented in the balance sheet when,
and only when, an en ty: a) currently has a legally enforceable right to set off the recognized amounts; and b) intends either to se le on a net basis, or to realize the asset and se le the liability simultaneously.2.8 Employee benefits : i) Short-term employee benefit obliga ons Liabili es for wages and salaries, including non-monetary benefits that are expected to be se led wholly within 12 months
a er the end of the period in which the employees render the related service are recognized in respect of employees’ services up to the end of the repor ng period and are measured at the amounts expected to be paid when the liabili es are se led. The liabili es are presented as current employee benefit obliga ons in the balance sheet.
All Short term employee benefits such as salaries, incen ves, special award, medical benefits which fall due within 12 months of the period in which the employee renders related services, which en tles him to avail such benefits and non accumula ng compensated absences (like maternity leave and sick leave) are recognized on an undiscounted basis and charged to Profit and Loss Statement.
ii) Post-employment obliga ons The en ty operates the following post-employment schemes: a) defined benefit plans such as gratuity, Superannua on and b) defined contribu on plans such as provident fund. Gratuity obliga ons The liability or assets recognized in the balance sheet in respect of defined benefit gratuity plan is the present value of the
defined benefit obliga on at the end of the repor ng period less than the fair value of plan assets. The defined benefit obliga on is calculated annually by actuaries using the projected unit credit method.
The present value of the defined benefit obliga ons denominated in INR is determined by discoun ng the es mated future cash flows by reference to market yields at the end of the repor ng period on government bonds that have terms approxima ng to the term of related obliga ons.
The net interest cost is calculated by applying the discount rate to the net balance of the defined benefit obliga on and the fair value of plan assets. This cost is included in employee benefit expenses in statement of profit and loss.
Re-measurements gains and losses arising from experience adjustments and changes in actuarial assump ons are recognized in the period in which they occur, directly in other comprehensive income. They are included in retained earnings in the statement of changes in equity and in the balance sheet.
Provident fund obliga ons Contribu on to the provident fund, which is a defined contribu on plan, made to the Regional Provident Fund Commissioner
is charged to the Profit and loss Statement on accrual basis.2.9 Foreign currency transla on : i) Func onal and presenta on currency Each items included in the financial statements are measured using the currency of the primary economic environment in
which the en ty operates (‘the func onal currency’). The financial statements are presented in Indian rupee (`), which is func onal and presenta on currency.

Notes on Standalone Financial Statements for the year ended 31st March, 2017 Annual Report 2016-17
55
ii) Transac ons and balances Foreign currency transac ons i.e. Revenue, expense and cash-flow items denominated in foreign currencies are translated
into the func onal currency using the exchange rates at the dates of the transac ons. Foreign exchange gains and losses resul ng from the se lement of such transac ons and from the transla on of monetary assets and liabili es denominated in foreign currencies at year end exchange rates are generally recognized in profit or loss.
Non monetary items that are measured at fair value in a foreign currency are translated using the exchange rates at the date when the fair value is determined.Transla on differences on assets and liabili es carried at fair value are reported as part of fair value gain or loss.
2.10 Income tax : i) The income tax expense or credit for the period is the tax payable on the current period’s taxable income based on the
applicable income tax rate for each jurisdic on adjusted by changes in deferred tax assets and liabili es a ributable to temporary differences and to unused tax losses.
ii) The current income tax charge is calculated on the basis of the tax laws enacted or substan vely enacted at the end of the repor ng period in the countries where the company and its subsidiaries and associates operate and generate taxable income. Management periodically evaluates posi ons taken in tax returns with respect to situa ons in which applicable tax regula on is subject to interpreta on. It establishes provisions where appropriate on the basis of amounts expected to be paid to the tax authori es.
iii) Current income tax expense comprises taxes on income from opera ons in India and is determined in accordance with the provisions of the Income Tax Act, 1961. Minimum Alternate Tax (MAT) is paid in accordance with the tax laws, which gives rise to future economic benefits in the form of tax credit against future income tax liability. The company offsets on a year on basis, the current tax assets and liabili es, where it intends to se le such assets and liabili es on a net basis. The current tax expense recognized in the financial statements is net off MAT credit u lized during the period.
iv) Deferred income tax is provided in full, using the balance sheet approach, on temporary differences arising between the tax bases of assets and liabili es and their carrying amounts in the financial statements. However, deferred tax liabili es are not recognized if they arise from the ini al recogni on of goodwill. Deferred income tax is also not accounted for if it arises from ini al recogni on of an asset or liability in a transac on other than a business combina on that at the me of the transac on affects neither accoun ng profit nor taxable profit (tax loss). Deferred income tax is determined using tax rates (and laws) that have been enacted or substan ally enacted by the end of the repor ng period and are expected to apply when the related deferred income tax asset is realized or the deferred income tax liability is se led.
v) Deferred tax assets are recognised for all deduc ble temporary differences and unused tax losses only if it is probable that future taxable amounts will be available to u lise those temporary differences and losses.
vi) Deferred tax assets and liabili es are offset when there is a legally enforceable right to offset current tax assets and liabili es and when the deferred tax balances relate to the same taxa on authority. Current tax assets and tax liabili es are offset where the en ty has a legally enforceable right to offset and intends either to se le on a net basis, or to realise the asset and se le the liability simultaneously.
vii) Current and deferred tax is recognised in profit or loss, except to the extent that it relates to items recognised in other comprehensive income or directly in equity. In this case, the tax is also recognised in other comprehensive income or directly in equity, respec vely.
2.11 Cash and cash equivalents : For the purpose of presenta on in the statement of cash flows, cash and cash equivalents includes cash on hand, demand
deposits with bank and other financial ins tu ons, other short-term, highly liquid investments with original maturi es of three months or less that are readily conver ble to known amounts of cash and which are subject to an insignificant risk of changes in value, and bank overdra s.
2.12 Borrowing costs : a) General and specific borrowing costs that are directly a ributable to the acquisi on, construc on or produc on of a
qualifying asset are capitalised during the period of me that is required to complete and prepare the asset for its intended use or sale. Qualifying assets are assets that necessarily take a substan al period of me to get ready for their intended use or sale.
b) Other borrowing costs are expensed in the period in which they are incurred.2.13 Provisions, Con ngent Liabili es and Con ngent Assets: a) A provision is recognized if, as a result of a past event, the Company has a present legal obliga on that can be es mated
reliably, and it is probable that an ou low of economic benefits will be required to se le the obliga on. Provisions are determined by the best es mate of the ou low of economic benefits required to se le the obliga on at the repor ng date. Where no reliable es mate can be made, a disclosure is made as con ngent liability. Con ngent assets are not recognized.

Annual Report 2016-17 Notes on Standalone Financial Statements for the year ended 31st March, 2017
56
b) Where there are a number of similar obliga ons, the likelihood that an ou low will be required in se lement is determined by considering the class of obliga ons as a whole. A provision is recognised even if the likelihood of an ou low with respect to any one item included in the same class of obliga ons may be small.
c) Con ngent assets are not recognized in the financial statement, but are disclosed where an inflow of economic benefit is probable.
2.14 Contributed equity : a) Equity: Equity shares are classified as equity. Incremental costs directly a ributable to the issue of new shares or op ons are shown in equity as a deduc on, net of tax,
from the proceeds. b) Dividends : Provision is made for any amount of dividend declared, being appropiately authorized and no longer at the discre on of the
en ty, on or before the end of repor ng period but not distributed at the end of the repor ng period.2.15 Earning Per Share : a) Basic Earning Per Share Basic Earning Per Share is calculated by dividing the profit a ributable to owners of the company by the weighted average
number of equity shares outstanding during the financial year. b) Diluted Earning Per Share Diluted Earning Per Share adjusts the figures used in the determina on of the basic earning per share to take into account
the a er income tax effect of interest or other finance costs associated with the dilu ve poten al equity shares and the weighted average number of addi onal equity shares that would have been outstanding assuming the conversion of all dilu ve poten al equity shares.
2.16 Segment Repor ng : Ind AS 108 “opera ng segments” establishes standards for the way that public business enterprises report informa on about
opera ng segments and related disclosures about products and services, geographic areas, and major customers. The Company’s opera ons predominantly relate to providing end-to-end business solu ons to enable clients to enhance business performance. Based on the “management approach” as defined in Ind AS 108, the Chief Opera ng Decision Maker (CODM) evaluates the Company’s performance and allocates resources based on an analysis of various performance indicators by business segments and geographic segments. The accoun ng principles used in the prepara on of the financial statements are consistently applied to record revenue and expenditure in individual segments, and are as set out in the significant accoun ng policies.
Revenue and iden fiable opera ng expenses in rela on to segments are categorized based on items that are individually iden fiable to that segment. Allocated expenses of segments include expenses incurred for rendering services. Certain expenses, which form a significant component of total expenses, are not specifically allocable to specific segments as the underlying assets are used interchangeably. Management believes that it is not prac cal to provide segment disclosures rela ng to those costs and expenses, and accordingly these expenses are separately disclosed as “unallocated” and adjusted against the total income of the Company.
Assets and liabili es in rela on to segmnets are categorised based on items that are individually iden fiable to segments. 2.17 Impairment of non-financial assets - property, plant and equipment and intangible assets : The Company assesses at each repor ng date as to whether there is any indica on that any property, plant and equipment
and intangible assets or group of assets, called cash genera ng units (CGU) may be impaired. If any such indica on exists the recoverable amount of an asset or CGU is es mated to determine the extent of impairment, if any. When it is not possible to es mate the recoverable amount of an individual asset, the Company es mates the recoverable amount of the CGU to which the asset belongs.
An impairment loss is recognised in the Statement of Profit and Loss to the extent, asset’s carrying amount exceeds its recoverable amount. The recoverable amount is higher of an asset’s fair value less cost of disposal and value in use. Value in use is based on the es mated future cash flows, discounted to their present value using pre-tax discount rate that reflects current market assessments of the me value of money and risk specific to the assets.
The impairment loss recognised in prior accoun ng period is reversed if there has been a change in the es mate of recoverable amount.
2.18 Rounding of amounts : All amounts disclosed in the financial statements and notes have been rounded off to the nearest Lacs as per the requirement of
Schedule III, unless otherwise stated.

Notes on Standalone Financial Statements for the year ended 31st March, 2017 Annual Report 2016-17
57
NOTE 3 RECENT ACCOUNTING PRONOUNCEMNET :Accoun ng Pronouncement Issued but not effec ve :In March 2017, the Ministry of Corporate Affairs issued the Companies (Indian Accoun ng Standards) (Amendments) Rules, 2017, no fying amendments to Ind AS 7, ‘Statement of cash flows’ and Ind AS 102, ‘Share-based payment.’ These amendments are in accordance with the recent amendments made by Interna onal Accoun ng Standards Board (IASB) to IAS 7, ‘Statement of cash flows’ and IFRS 2, ‘Share-based payment,’ respec vely. The amendments are applicable to the company from April 1, 2017.a) Amendment to Ind AS 7: The amendment to Ind AS 7 requires the en es to provide disclosures that enable users of financial statements to evaluate
changes in liabili es arising from financing ac vi es, including both changes arising from cash flows and non-cash changes, sugges ng inclusion of a reconcilia on between the opening and closing balances in the balance sheet for liabili es arising from financing ac vi es, to meet the disclosure requirement.
The company is in the process of evalua ng the disclosure requirements of the amendment and the effect on the financial statements.
b) Amendment to Ind AS 102: The amendment to Ind AS 102 provides specific guidance to measurement of cash-se led awards, modifica on of cash-se led
awards and awards that include a net se lement feature in respect of witholding taxes. It clarifies that the fair value of cash-se led awards is determined on a basis consistent with that used for equity-se led awards. Market-based performance condi ons and non-ves ng condi ons are reflected in the ‘fair values’, but non-market performance condi ons and service ves ng condi ons are reflected in the es mate of the number of awards expected to vest. Also, the amendment clarifies that if the terms and condi ons of a cash-se led share-based payment transac on are modified with the result that it becomes an equity-se led share-based payment transac on, the transac on is accounted for as such from the date of the modifica on. Further, the amendment requires the award that include a net se lement feature in respect of withholding taxes to be treated as equity-se led in its en rety. The cash payment to the tax authority is treated as if it was part of an equity se lement.
This has no implica on on the company’s financial statement as there is no share based transac on as on the repor ng date.
NOTE 4 CRITICAL ESTIMATES AND JUDGMENTS :a) Use of Es mates : The prepara on of the financial statements in conformity with Ind AS requires management to make es mates, judgments
and assump ons. These es mates, judgments and assump ons affect the applica on of accoun ng policies and the reported amounts of assets and liabili es, the disclosures of con ngent assets and liabili es at the date of the financial statements and reported amounts of revenues and expenses during the period. Applica on of accoun ng policies that require cri cal accoun ng es mates involving complex and subjec ve judgments and the use of assump ons in these financial statements have been disclosed below. Accoun ng es mates could change from period to period. Actual results could differ from those es mates. Appropriate changes in es mates are made as management becomes aware of changes in circumstances surrounding the es mates. Changes in es mates are reflected in the financial statements in the period in whichchanges are made and, if material, their effects are disclosed in the notes to the financial statements.
b) Cri cal Accoun ng Es mates and Judgments : i) Property, plant and equipment Property, plant and equipment represent a significant propor on of the asset base of the Company. The charge in respect
of periodic deprecia on is derived a er determining an es mate of an asset’s expected useful life and the expected residual value at the end of its life. The useful lives and residual values of company’s assets are determined by management at the
me the asset is acquired and reviewed periodically, including at each financial year end. The lives are based on historical experience with similar assets as well as an cipa on of future events, which may impact their life, such as changes in technology.
ii) Income Taxes The Company’s major tax jurisdic on is India. Significant judgements are involved in determining the provision for income
taxes, including amount expected to be paid/recovered for uncertain tax posi ons. iii) Equity instruments The company has made an irrecoverable elec on at the me of ini al recogni on to account for the equity instrument at fair
value through other comprehensive income. iv) Defined benefit obliga on The cost of the defined benefit plans and the present value of the defined benefit obliga on are based on actuarial valua on
using the projected unit credit method. An actuarial valua on involves making various assump ons that may differ from actual developments in the future. These include the determina on of the discount rate, future salary increases and mortality rates. Due to the complexi es involved in the valua on and its long term nature, a defined benefit obliga on is highly sensi ve to changes in these assump ons. All assump ons are reviewed at each repor ng date.
v) Impairment of trade receivables The company es mates the uncollectability of accounts receivables by analysing historical payment pa erns, customer
concentra ons, customer credit worthiness and current economic trends. If the financial condi on of customer deteriorates, addi onal allowances may be required.

Annual Report 2016-17 Notes on Standalone Financial Statements for the year ended 31st March, 2017
58
Net Book Value As at31st March, 2017
As at31st March, 2016
As at1st April, 2015
NOTE 5 PROPERTY, PLANT AND EQUIPMENT [at deemed cost] INR INR INR
Property,Plant and Equipment 26,164.36 16,736.22 - 18,229.72 Capital Work-in-progress - 22.00 62.82 Intangible Assets 59.03 51.31 44.62
Par culars Freehold Land
Buildings Furniture, Fi ngs
and Equipment
Plant and Machinery
Vehicles TOTAL Capital Work-in-Progress
Intangible Assets
Es mated Useful Life (in years) NA 3 - 60 3 -10 2 - 40 8 -10 NA 10 Gross Carrying AmountAt 1st April, 2015 34.50 933.12 653.49 23,898.22 218.09 25,737.41 62.82 71.63 Addi ons/Adjustments during the year - 32.54 75.60 106.59 38.15 252.88 13.68 15.39 Disposals during the year - - - - - - (54.50) -At 31st March, 2016 34.50 965.66 729.09 24,004.81 256.24 25,990.30 22.00 87.02 Addi ons/Adjustments during the year 9,656.70 671.85 100.74 265.70 453.46 11,148.44 0.61 18.25 Disposals during the year - - - - - - (22.61) -At 31st March, 2017 9,691.20 1,637.51 829.83 24,270.51 709.71 37,138.74 - 105.27 Accumulated Deprecia on and ImpairmentAt 1st April, 2015 - 272.36 417.00 6,718.07 100.26 7,507.69 - 27.01 Deprecia on charge for the year - 58.09 107.82 1,559.52 20.96 1,746.39 - 8.70 Disposals during the year - - - - - - - - At 31st March, 2016 - 330.45 524.82 8,277.59 121.22 9,254.08 - 35.71 Deprecia on charge for the year - 58.69 89.35 1,499.63 72.62 1,720.30 10.53 Disposals during the year - - - - - - - -At 31st March, 2017 - 389.14 614.17 9,777.22 193.84 10,974.38 - 46.24 Net Book Value as at 31st March, 2017 9,691.20 1,248.37 215.65 14,493.29 515.86 26,164.36 - 59.03 Net Book Value as at 31st March, 2016 34.50 635.22 204.27 15,727.22 135.03 16,736.22 22.00 51.31 Deemed cost as at 1st April, 2015 34.50 660.76 236.49 17,180.15 117.83 18,229.72 62.82 44.62
(` in lacs)

Notes on Standalone Financial Statements for the year ended 31st March, 2017 Annual Report 2016-17
59
Par culars As at 31st March, 2017
As at 31st March, 2016
As at 1st April, 2015
NOTE 6 INVESTMENTSInvestment in Equity InstrumentsQuoted at FVTOCI3,878 (31 March 2016: 3,878, 1 April 2015 : 3,878) Shares of ` 10/- each fully paid-up in Powergrid Corpora on of India Ltd.
7.65 5.39 5.63
1,42,87,689 (31 March 2016: 1,42,87,689) Shares of ̀ 10/- each fully paid in McNally Bharat Engineering Ltd(65,36,722 Shares out of 1,42,87,689 is pledged)
7,386.74 10,858.64 -
Unquoted at Cost Indian Subsidiary/Joint Ventures15,000 (31 March 2016:15,000, 1 April 2015:15,000)Shares of ` 100/- each fully paid in EMC Hardware Ltd.
15.00 15.00 15.00
50,000 (31 March 2016:50,000, 1 April 2015:50,000)Shares of ` 10/- each fully paid in EMC Logis cs Ltd.
5.00 5.00 5.00
Nil (31 March 2016: 2,500, 31 March 2015:2,500) Shares of ` 10/- each fully paid in EMC Infrastructure Ltd.
- 0.25 0.25
50,000 (31 March 2016: 50,000, 31 March 2015: 50,000) Shares of ` 10/- each fully paid in EMC Forging Ltd.
5.00 5.00 5.00
1,30,00,000 (31 March 2016: 1,30,00,000, 31 March 2015: 1,30,00,000) Shares of ` 10/- each fully paid in EMC Tower Ltd.
1,300.00 1,300.00 1,300.00
50,000 (31 March 2016: 50,000, 31 March 2015: 50,000) Shares of ` 10/- each fully paid in EMC Solar Ltd.
5.00 5.00 5.00
50,000 (31 March 2016: 50,000, 31 March 2015: 50,000) Shares of ̀ 10/- each fully paid in EMC Academy Ltd.
5.00 5.00 5.00
15,00,000 (31 March 2016: 15,00,000, 31 March 2015:15,00,000) Shares of ` 10/- each fully paid-up in EMC Overseas Ltd.
150.00 150.00 150.00
6,00,000 (31 March 2016: 6,00,000, 31 March 2015:6,00,000) Shares of ` 10/- each fully paid-up in Quatro Rail Tech Solu ons Ltd.
60.00 60.00 60.00
Investment in BCPL - EMC - JV 2.45 2.45 2.45Foreign Subsidiary/Joint Ventures4,900 (31 March 2016: 4,900, 31 March 2015: 4,900) shares of ASC, Inc. 1,105.85 1,105.85 1,105.85 NIL (31 March 2016: 22,500, 31 March 2015: 22,500) Shares of Euro 1/- each CE Maschinenbau GmbH (formerly, MBE Colonge Engineering GmbH)
- 1,251.90 1,251.90
90% (31 March 2016: 70%, 31 March 2015: 70%) Quota of Tecnolines S.r.l. 3,047.19 2,901.55 2,901.55 1,850 (31 March 2016: 1850, 31 March 2015: 1850) shares of AED 1000/- each fully paid in EMC West Asia DMCC
304.00 304.00 304.00
1,000 (31 March 2016: 1000, 31 March 2015: 1000) shares of Singapore $1/- each, subscribed in Tecnolines Singapore PTE Ltd.
0.49 0.49 0.49
87,500 (31 March 2016 : 87500) shares of OMR 1/- each fully paid up in EMC MBE Contrac ng Co. LLC
151.97 151.97 -
1,800 (31 March 2016 - 1800) Shares of SAR 1,000/- each, fully paid up in EMC Saudi LLC
324.99 324.99 -
51,000 (31 March 2016: 51,000, 31 March 2015: 51,000) shares of HK $1/- each, subscribed in EMC East Asia Ltd.
4.06 4.06 4.06
Investment in Structured En ty36,013 Shares of ` 10/- each fully paid in McNally Sayaji Engineering Ltd 24.88 - - Total 13,905.27 18,456.54 7,121.18 i) Non-current 13,905.27 18,456.54 7,121.18 ii) Current - - - Aggregate cost price of quoted shares 14,291.18 14,291.18 3.49 Aggregate market value of quoted shares 7,394.38 10,864.04 5.63
(` in lacs)
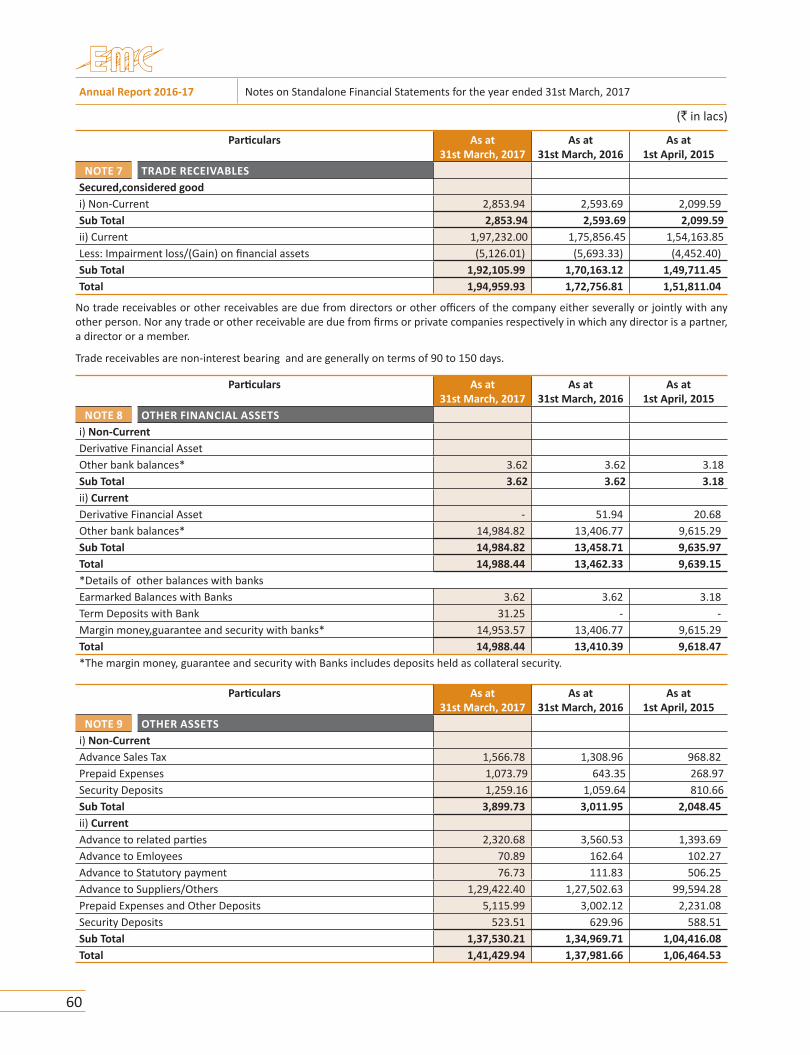
Annual Report 2016-17 Notes on Standalone Financial Statements for the year ended 31st March, 2017
60
Par culars As at 31st March, 2017
As at 31st March, 2016
As at 1st April, 2015
NOTE 7 TRADE RECEIVABLESSecured,considered goodi) Non-Current 2,853.94 2,593.69 2,099.59 Sub Total 2,853.94 2,593.69 2,099.59 ii) Current 1,97,232.00 1,75,856.45 1,54,163.85 Less: Impairment loss/(Gain) on financial assets (5,126.01) (5,693.33) (4,452.40) Sub Total 1,92,105.99 1,70,163.12 1,49,711.45 Total 1,94,959.93 1,72,756.81 1,51,811.04
No trade receivables or other receivables are due from directors or other officers of the company either severally or jointly with any other person. Nor any trade or other receivable are due from firms or private companies respec vely in which any director is a partner, a director or a member.
Trade receivables are non-interest bearing and are generally on terms of 90 to 150 days.
Par culars As at 31st March, 2017
As at 31st March, 2016
As at 1st April, 2015
NOTE 8 OTHER FINANCIAL ASSETSi) Non-CurrentDeriva ve Financial AssetOther bank balances* 3.62 3.62 3.18 Sub Total 3.62 3.62 3.18 ii) CurrentDeriva ve Financial Asset - 51.94 20.68 Other bank balances* 14,984.82 13,406.77 9,615.29 Sub Total 14,984.82 13,458.71 9,635.97 Total 14,988.44 13,462.33 9,639.15 *Details of other balances with banksEarmarked Balances with Banks 3.62 3.62 3.18 Term Deposits with Bank 31.25 - - Margin money,guarantee and security with banks* 14,953.57 13,406.77 9,615.29 Total 14,988.44 13,410.39 9,618.47 *The margin money, guarantee and security with Banks includes deposits held as collateral security.
Par culars As at 31st March, 2017
As at 31st March, 2016
As at 1st April, 2015
NOTE 9 OTHER ASSETSi) Non-CurrentAdvance Sales Tax 1,566.78 1,308.96 968.82 Prepaid Expenses 1,073.79 643.35 268.97 Security Deposits 1,259.16 1,059.64 810.66 Sub Total 3,899.73 3,011.95 2,048.45 ii) CurrentAdvance to related par es 2,320.68 3,560.53 1,393.69 Advance to Emloyees 70.89 162.64 102.27 Advance to Statutory payment 76.73 111.83 506.25 Advance to Suppliers/Others 1,29,422.40 1,27,502.63 99,594.28 Prepaid Expenses and Other Deposits 5,115.99 3,002.12 2,231.08 Security Deposits 523.51 629.96 588.51 Sub Total 1,37,530.21 1,34,969.71 1,04,416.08 Total 1,41,429.94 1,37,981.66 1,06,464.53
(` in lacs)

Notes on Standalone Financial Statements for the year ended 31st March, 2017 Annual Report 2016-17
61
Par culars As at 31st March, 2017
As at 31st March, 2016
As at 1st April, 2015
NOTE 10 DEFERRED TAX ASSETS /LIABILITIES NETProperty, plant and equipment 2,071.87 1,750.27 1,612.90 Intangible Assets 9.09 6.42 6.36 Employee Benefit Obliga on 7.07 33.33 13.38 Reten on Money/Price Varia on Receivable 18,613.34 11,413.71 - Impairment loss/(gain) on financial assets (1,774.01) (1,970.35) (1,513.37) Total 18,927.36 11,233.38 119.27
Par culars As at 31st March, 2017
As at 31st March, 2016
As at 1st April, 2015
NOTE 11 INVENTORIESa) Raw Materials 275.12 455.43 968.59 b) Stores, Loose Tools and Spares includes goods in transit 1,465.38 1,149.61 1,155.12 c) Semi Finished Goods 324.83 739.50 1,206.57 d) Finished Goods 1,825.14 4,103.92 4,457.44 e) Construc on work in Progress 7,127.33 7,002.98 6,004.74 f) Scrap 15.14 37.05 57.44 Total 11,032.94 13,488.49 13,849.90
Refer Significant accoun ng policy for method of valua on.
Par culars As at 31st March, 2017
As at 31st March, 2016
As at 1st April, 2015
NOTE 12 CASH AND CASH EQUIVALENTSBalances with banks
i) Cash at Bank 15,284.88 13,744.28 9,848.42 ii) Cash in Hand 124.67 296.03 111.85 iii) Cheques in Hand 76.88 262.96 135.22 Less: Bank overdra - - - Sub Total 15,486.43 14,303.27 10,095.50 Less: Balances with bank other than above 14,988.44 13,410.39 9,618.47 Total 497.99 892.88 477.02 Specified Bank Note Disclosure(SBNs)In accordance with the MCA no fica on G.S.R.308E dated 30th March,2017 details of Specified Bank Note(SBN) and Other Denomina on Notes(ODN) held and transacted during the period from 8th November,2016 to 30th December, 2016 is given below:
Par culars SBNs ODNs TOTAL Closing cash on hand as on November 8, 2016 232.49 104.76 337.24 (+) Non permi ed receipts - - - (+) Permi ed receipts 3.70 177.95 181.65 (-) Permi ed payments 89.96 130.93 220.89 (-) Amounts Deposited in Banks 146.23 - 146.23 Closing cash on hand as on December 30, 2016 - 151.78 151.78
(` in lacs)

Annual Report 2016-17 Notes on Standalone Financial Statements for the year ended 31st March, 2017
62
Par culars As at 31st March, 2017
As at 31st March, 2016
As at 1st April, 2015
NOTE 13 SHARE CAPITALEquity Share Capitala) Authorised7,50,00,000 Nos of Equity shares of 10/- each 7,500.00 7,500.00 7,500.00
7,500.00 7,500.00 7,500.00b) Issued, Subscribed and Paid UpEquity Shares:4,83,35,000 Nos of shares of 10/- each fully paid up 4,833.50 4,700.00 3,700.00(2015-2016: 4,70,00,000 Nos of shares of 10/- each fully paid up)(2014-2015: 3,70,00,000 Nos of shares of 10/- each fully paid up)Total 4,833.50 4,700.00 3,700.00c) Reconcilia on of number of equity shares are set out below:
a) Shares outstanding at the beginning of the financial year 470.00 370.00 370.00b) Issued during the year 13.35 100.00 - c) Shares forfeited/brought back/cancelled during the year - - -d) Shares outstanding at the end of the financial year 483.35 470.00 370.00
d) Details of shareholders holding more than 5% of shares
Name of the Shareholders As at31st March, 2017
As at31st March, 2016
As at1st April, 2015
% held No.of Shares % held No.of Shares % held No.of Shares i) MKN Investments Private Limited 21.38% 1,03,35,314 29.79% 1,40,00,314 10.81% 40,00,014 ii) YMS Finance Private Limited 12.50% 60,40,001 12.85% 60,40,001 16.32% 60,40,001 iii) Trinetra Electronics Limited 5.07% 24,48,528 5.21% 24,48,528 6.62% 24,48,528 iv) Tamkore Investments Private Limited 4.97% 24,00,000 5.11% 24,00,000 6.49% 24,00,000 v) Metalind Private Limited 5.90% 28,50,000 6.06% 28,50,000 7.70% 28,50,000 vi) Subhas Impex Private Limited 7.14% 34,53,252 7.35% 34,53,252 9.33% 34,53,252 vii) Mr. Vinod Dugar 9.35% 45,17,644 9.19% 43,18,624 11.67% 43,18,624 viii) Ms. Sheetal Dugar 9.16% 44,29,145 9.42% 44,29,145 11.97% 44,29,145
e) The Company has a single class of Equity shares. Accordingly, all equity shares rank equally with regard to dividend and share in the company’s residual assets.
f) For the period of five years immediately preceding the date at which the balance sheet is prepared, the company has not :- i) Issued class of shares allo ed as fully paid up by way of bonus shares; and ii) Bought back any shares.g) For the period of five years immediately preceding the date at which the balance sheet is prepared, the company has issued the
following equity shares for considera on other than cash
Name of Allotee AllotmentDate
No.of Shares Face Value Amountincluding premium per share
MKN Investment Pvt Ltd. 30.03.2013 40,00,000 10.00 125.00MKN Investment Pvt Ltd. 25.05.2015 1,00,00,000 10.00 125.00MKN Investment Pvt Ltd. 30.03.2017 13,35,000 10.00 187.50Total : 1,53,35,000
(` in lacs)

Notes on Standalone Financial Statements for the year ended 31st March, 2017 Annual Report 2016-17
63
Par culars As at 31st March, 2017
As at 31st March, 2016
As at 1st April, 2015
NOTE 14 OTHER EQUITY a) Share Applica on Money - - 12,500.00Sub Total - - 12,500.00 b) Equity Component of debt InstrumentOpening Balance 2,500.00 Add: Addi on during the Year 3.13 2,500.00 Less: Issued during the year (2,503.13)
- 2,500.00 - This represents mandatorily conver ble loan from MKN Investment Pvt Ltd. The company has computed the equity and debt component in accordance with IND AS 109 whereas the value of debt component is Nil.c) Capital ReserveOpening Balance - - 14.52 Less:Transferred to Retained Earnings - - (14.52)Sub Total - - - d) Securi es PremiumOpening Balance 18,800.00 7,300.00 7,300.00 Add:-Addi ons during the year 2,369.63 11,500.00 - Sub Total 21,169.63 18,800.00 7,300.00 e) Revalua on ReserveOpening Balance - - 27.50 Add: Received During the Year 10,036.51 - - Less: Transferred to Retained Earnings - - (27.50)Sub Total 10,036.51 - - f) Reserve for Investments at Fair Value through OCIOpening Balance (3,427.14) 2.14 - Add: Net fair value gain/(loss) on investments during the period (3,469.66) (3,429.28) 2.14 Sub Total (6,896.80) (3,427.14) 2.14 g) Retained EarningsOpening Balance 53,651.16 39,048.56 41,665.75 Add: Profit/(Loss) during the year 16,579.83 15,053.13 - Add: Re-measurement of defined employee benefit plans through OCI 7.41 (6.55) - Add: Adjustment for earlier years - 1.35 - Less: Deferred Tax liability / (Assets) on Transi on date - - 1,347.35 Less: Impairment loss on financial assets - - (4,452.40)Less: Final dividend - (370.00) 370.00 Less: Dividend Distribu on Tax - (75.32) 75.32 Less:Transfer from Revalua on Reserve - - 27.50 Less:Transfer from Capital Reserve - - 14.52 Less:Transfer from Forfeiture reserve Account - - 0.51Sub Total 70,238.40 53,651.17 39,048.55 h) Foreign currency transla on reserveOpening Balance - - - Sub Total - - -i) Forfeiture reserve AccountOpening Balance - - 0.51 Less: Transferred to Retained Earnings - - (0.51)Sub Total - - - Grand Total 94,547.74 71,524.03 58,850.69
(` in lacs)

Annual Report 2016-17 Notes on Standalone Financial Statements for the year ended 31st March, 2017
64
Par culars As at 31st March, 2017
As at 31st March, 2016
As at 1st April, 2015
NOTE 15 BORROWINGSi) Non-Current BorrowingsSecured Loana) Term Loan From Banks 2,231.20 4,047.92 2,936.22 b) Term Loan From others 14,545.09 554.84 604.84 c) Financial Lease Obliga ons 251.43 4.07 20.21 Unsecured Loan Loans from Bank 1,664.00 3,332.00 - Loan from Others 4,666.67 24,724.64 21,000.00 Total non-current borrowings 23,358.39 32,663.47 24,561.27 ii) Current BorrowingsCash Credit 77,001.53 76,900.90 60,522.14 Current maturi es of long term Borrowings 11,287.16 8,220.71 5,101.92 Total current borrowings 88,288.69 85,121.61 65,624.06 Less : Amount clubbed under Other Financial Liability 11,287.16 8,220.71 5,101.92 Net Borrowings 1,00,359.91 1,09,564.37 85,083.41
Notes :
1) Term Loans from Punjab Na onal Bank and Oriental Bank of Commerce are secured by way of crea on of charge ranking Pari Passu on the movable and immovable assets of Solar Power Project. The loans are further secured by personal guarantees of some of the Directors of the Company.
2) Term Loans from Punjab Na onal Bank & Oriental Bank of Commerce are repayable over 35 Quarterly Installments commencing from the quarter ending October 2012 and bears an Interest rate of 5 year MCLR + 2.95% from PNB & BR + 2.25% from OBC.
3) Loan from Govt. of West Bengal is secured by way of Pari Passu charge ranking next only to the charges in favour of financial ins -tu ons / Banks, on the fixed assets of the company, both present as well as future. The Loan is repayable in fourteen equal annual installments (excluding interest) star ng from 31st March, 2013. The Loan carries interest of 8.75% p.a with a rebate of 2% p.a for
mely repayment. Interest is paid as and when due.
4) Vehicle loans are secured by way of mortgage of vehicles. The loans are repayable by april 2021.
5) Term Loan from Karur Vysya Bank is secured by way of crea on of Mortage on the commercial space being purchased by the com-pany. The loans are further secured by personal guarantees of some of the Directors of the Company. The loan is repayable in 19 quarterly instalments commencing from quarter ending March’16 and bears an interest rate of BR + 2.25%.
6) Unsecured Term Loan from banks (to the tune of ` 50 crores) was taken during the FY 15-16, its repayment started from the quarter ending June 2016-2017 and bears an interest rate of BR + 2.30%.
7) Secured Term Loan from others (to the tune of ` 200 crores) was taken during the FY 15-16, its repayment started from the quarter ending Sep 2016-2017 and bears an interest rate of BR + 3.00% . It is secured by way of pledge of shares of Mcnally Bharat Engineer-ing Co. Ltd by EMC Ltd.
8) Unsecured Term Loan from others (to the tune of ` 100 crores) was taken during the FY 15- 16, its repayment started from the quar-ter ending June 2016-2017 and bears an interest rate of BR + 3.00%.
9) Working Capital Facili es are secured by way of :
i) Hypotheca on on Pari Passu basis with the Working Capital Banks of the Company on the en re Stock in Trade, Book Debts and any other current assets of the company, both present and future excluding OBC’s Share of charge in receivable and proceeds in bank account related to Solar Power Project at Naini, Allahabad.
ii) First charge on the en re immovable and movable Fixed Assets of the Company and equitable mortgage on Landed proper es of the Company at Naini (Allahabad) excluding OBC’s share on Solar Power equipments and equipment purchased through equipment Loan present and future.
iii) Personal guarantees of some of the Directors of the Company.
(` in lacs)

Notes on Standalone Financial Statements for the year ended 31st March, 2017 Annual Report 2016-17
65
Par culars As at31st March, 2017
As at31st March, 2016
As at1st April, 2015
NOTE 16 TRADE PAYABLESi) Non-Current 5,826.66 4,829.85 5,733.15 Sub Total 5,826.66 4,829.85 5,733.15 ii) Current 1,28,112.28 1,21,684.66 1,21,373.53 Sub Total 1,28,112.28 1,21,684.66 1,21,373.53 Grand Total 1,33,938.94 1,26,514.51 1,27,106.68
Par culars As at31st March, 2017
As at31st March, 2016
As at1st April, 2015
NOTE 17 OTHER FINANCIAL LIABILITIESi) Non-CurrentOther Loans & advances 20,498.04 22,938.61 12,682.92 Sub Total 20,498.04 22,938.61 12,682.92 ii) CurrentCurrent maturi es of long term borrowings 11,287.16 8,220.71 5,101.92 Other Loans & advances 15,037.67 13,134.57 6,329.62 Unpaid Dividend 3.61 3.61 3.17 Other Liabili es* 722.99 979.75 913.33 Sub Total 27,051.43 22,338.64 12,348.04 Total 47,549.47 45,277.25 25,030.96
* Other liabili es includes current account with subsidiaries and payables to employees.
Par culars As at31st March, 2017
As at31st March, 2016
As at1st April, 2015
NOTE 18 PROVISIONSProvision for Excise duty on Closing Stock 195.10 169.23 229.39 Total 195.10 169.23 229.39
Par culars As at31st March, 2017
As at31st March, 2016
As at1st April, 2015
NOTE 19 OTHER LIABILITIESCurrent Liabili esInterest payable 1,206.86 445.20 298.39 Statutory dues 1,364.93 4,382.35 1,062.03 Total 2,571.79 4,827.55 1,360.42
Par culars As at31st March, 2017
As at31st March, 2016
As at1st April, 2015
NOTE 20 CURRENT TAX LIABILITY NETIncome tax payable 114.08 37.92 6,219.15 Total 114.08 37.92 6,219.15
(` in lacs)

Annual Report 2016-17 Notes on Standalone Financial Statements for the year ended 31st March, 2017
66
Par culars 31st March, 2017 31st March, 2016 NOTE 21 REVENUE FROM OPERATIONSSale of Products (Including Excise Duty) 4,20,210.15 3,74,010.88 Sale of Services 42,793.22 38,947.54 Other Opera ng Revenue 158.56 168.23 Total 4,63,161.93 4,13,126.65
Par culars 31st March, 2017 31st March, 2016 NOTE 22 OTHER INCOMEInterest Income 1,235.48 1,150.43 Miscellaneous Income 166.83 277.38 Total 1,402.31 1,427.81
Par culars 31st March, 2017 31st March, 2016 NOTE 23 COST OF MATERIAL CONSUMEDOpening Stock 6,740.18 8,128.45 Add:Purchased during the year 3,51,012.14 3,07,199.94 Less:Closing Stock 8,867.83 6,740.18 Total 3,48,884.49 3,08,588.20 Details of materials consumedSteels 3,764.69 5,149.92 Aluminium 141.37 235.22 Zinc 568.02 894.63 Stores & Spares 408.90 482.62 Erec on & Concre ng Material 6,269.57 4,111.12 Project Purchase 3,37,704.54 2,97,667.20 Other Materials 27.40 47.49 Total 3,48,884.49 3,08,588.20
Par culars 31st March, 2017 31st March, 2016 NOTE 24 CHANGE IN INVENTORIESOpening StockFinished Goods 4,103.92 4,457.44 Semi-Finished Goods 739.50 1,206.57 Srap Material 37.05 57.44 Sub Total 4,880.47 5,721.45 Less: Closing StockFinished Goods 1,825.14 4,103.92 Semi-Finished Goods 324.83 739.50 Scrap Material 15.14 37.05 Sub Total 2,165.11 4,880.47 INCREASE(-)/DECREASE(+) 2,715.36 840.98
Par culars 31st March, 2017 31st March, 2016 NOTE 25 MANUFACTURING AND PROCESSING COSTS
INR INR Processing / Job Charges 26,980.35 28,588.63 Freight,Carriage & Transport 5,412.05 3,503.38 Power & Fuel 342.98 392.86 Rent 762.72 723.72 Insurance 818.70 853.76 Total 34,316.80 34,062.35
(` in lacs)

Notes on Standalone Financial Statements for the year ended 31st March, 2017 Annual Report 2016-17
67
Par culars 31st March, 2017 31st March, 2016 NOTE 26 EMPLOYEE BENEFIT EXPENSESSalaries,Wages & Bonus 7,744.85 7,255.77 Contribu on to Provident and other Funds 278.01 273.29 Workmen & Staff welfare Expenses 242.45 143.67 Total 8,265.31 7,672.73
Par culars 31st March, 2017 31st March, 2016 NOTE 27 FINANCE COSTInterest on Borrowings 15,659.56 14,294.92 Interest on finance lease obliga ons 31.58 3.54 Interest to Others* 5,628.36 4,266.73 Total 21,319.50 18,565.19
* Interest to others includes interest on other advances
Par culars 31st March, 2017 31st March, 2016 NOTE 28 DEPRECIATION AND AMORTISATION EXPENSESDeprecia on on Property,plant and equipments 1,720.30 1,746.81 Amor sa on of intangible assets 10.53 8.70 Total 1,730.83 1,755.51
Par culars 31st March, 2017 31st March, 2016 NOTE 29 OTHER EXPENSESRepairs & Renewals:
Plant & Machinery 19.99 40.47 Building 22.81 7.64 Others 81.40 67.30
Hire Charges 641.63 718.51 Travelling & Conveyance 508.22 483.25 Auditors Remunera on:
Statutory Audit Fees 25.00 25.00 Internal Audit Fees 2.25 2.02 Tax Audit 0.50 0.50
Custom Duty 6.25 64.09 Excise Duty 867.46 1,187.31 Rates & Taxes 1,988.51 1,180.45 Communica on Expenses 128.21 163.86 Bank Commission and Charges 15,613.01 13,151.75 Transla on Loss 110.35 (139.60) Loss on Contract Performance 39.41 16.77 Impairment loss/(gain) on financial assets (567.32) 1,240.93 Miscellaneous Expenses (A) 2,544.05 1,905.51 Total 22,031.73 20,115.76 (A) Miscellaneous ExpensesLegal Charges, Lis ng & Filing Fees 127.76 120.97 Sales Promo on & Adver sement Expenses 58.69 62.22 Tes ng Charges 93.56 95.00 Computer/R&D Charges 28.59 21.58 Entertainment Expenses 28.48 27.51 General Charges 86.81 93.30 Office Up-Keep 97.73 73.42
(` in lacs)

Annual Report 2016-17 Notes on Standalone Financial Statements for the year ended 31st March, 2017
68
Par culars 31st March, 2017 31st March, 2016 NOTE 29 OTHER EXPENSES (Contd.)Prin ng & Sta onery 73.38 64.29 Subscrip on & Dona on 6.77 5.23 Professional fees & Service Charges 1,800.35 1,173.85 Motor Car Expenses 5.39 5.62 Mobilisa on Expenses 56.36 99.86 Tender Fees 19.90 20.99 Others 41.94 24.48 Rebate 14.15 15.40 Recruitment Expenses 4.19 1.79 Total 2,544.05 1,905.51
NOTE 30 INCOME TAX EXPENSES
This note provides an analysis of the company’s tax expenses, show amounts that are recognised directly in equity and how the tax expenses is affected by non-assessable and non-deduc ble items. It also explains significant es mates made in rela on to the group’s tax posi on.
Par culars 31st March, 2017 31st March, 2016a) Income Tax Expenses
Current Tax :Current Tax on profits for the year 1,236.68 1,376.79 Total Current Tax Expenses 1,236.68 1,376.79 Deferred Tax :Decrease/(Increase) in deferred tax assets (35.48) 23.42 (Decrease)/Increase in deferred tax liabili es 7,519.23 11,094.16 Adjustments for deferred tax of prior periods (4,593.72)Total Deferred tax expenses/(benefits) 7,483.75 6,523.86 Total Income Tax Expenses 8,720.43 7,900.65 Income Tax Expenses is a ributable to :Current Tax 1,236.68 1,376.79 Deferred Tax 7,483.75 6,523.86 Total 8,720.43 7,900.65
b) Reconcilia on of tax expenses and the accoun ng profit mul plied by India's tax rate :Profit from con nuing opera ons before income tax expenses 25,300.22 22,953.74 Tax at the Indian tax rate of 34.608% (2015-16: 34.608%) 8,755.91 7,943.84 Tax effect of amounts which are not deduc ble (taxable) in calcula ng taxable income :Deprecia on (123.26) (107.93)Reten on Money/Price Varia on (7,199.63) (6,733.17)Remeasurement of Employee Benefit Obliga on - (3.47)Adjustments for current tax of prior periods - (67.10)Tax losses for which no deferred income tax was recognised - - Unrecognised tax losses recouped to reduce current tax expenses - (84.85)Impairment losses used to reduce deferred tax expenses (196.34) 429.46 Tax Expenses 1,236.68 1,376.79
(` in lacs)

Notes on Standalone Financial Statements for the year ended 31st March, 2017 Annual Report 2016-17
69
Par culars As at31st March, 2017
As at31st March, 2016
As at 1st April, 2015
Through PL Through OCI Through PL Through OCI Transi onNOTE 31 MOVEMENT IN DEFERRED TAX ASSET /
LIABILITYProperty,Plant and Equipment 120.59 201.01 137.37 - 1,612.90 Intangible Assets 2.67 - 0.06 - 6.36 Employee benefit obliga on (35.48) 9.22 23.42 (3.47) 13.38 Reten on Money/Price Varia on Receivable# 7,199.63 - 6,819.99 - - Impairment loss/(gain) on financial assets 196.34 - (456.98) - (1,513.37)Impact 7,483.75 210.23 6,523.86 (3.47) 119.27
Note : This excludes deferred tax amoun ng to ` in lacs 4,593.72 created in the Financial year 2015-16 on account of earlier year adjustments.
(All amounts in ` in Lacs, unless otherwise stated)
NOTE 32 FAIR VALUE MEASUREMENTS
i) Financial instruments by category:Par culars 31st March, 2017 31st March, 2016 1st April, 2015
FVPL FVOCI Amor sed cost
FVPL FVOCI Amor sed cost
FVPL FVOCI Amor sed cost
Financial assetsInvestments: Equity instruments (*) - 7,394.38 6,510.89 - 10,864.04 7,592.51 - 5.63 7,115.55 Trade receivables - - 1,94,959.93 - - 1,72,756.81 - - 1,51,811.04 Cash and cash equivalents - - 15,486.43 - - 14,303.27 - - 10,095.50 Other bank balances - - 14,984.82 - - 13,458.71 - - 9,635.97 Deriva ve financial assets - - - 51.94 - - 20.68 - - Total financial assets - 7,394.38 2,31,942.08 51.94 10,864.04 2,08,111.29 20.68 5.63 1,78,658.05 Financial liabili esBorrowings - - 1,00,359.91 - - 1,09,564.37 - - 85,083.41 Trade payables - - 1,33,938.94 - - 1,26,514.51 - - 1,27,106.68 Other financial liabili es - - 47,549.47 - - 45,277.25 - - 25,030.96 Total financial liabili es - - 2,81,848.33 - - 2,81,356.12 - - 2,37,221.05 * Includes investments in subsidiaries accounted as per cost model as prescribed under paragraph 10 of Ind AS 27 "Separate Financial Statements".
ii) Fair value hierarchy:This sec on explains the judgements and es mates made in determining the fair values of the financial instruments that are a) recognised and measured at fair value, andb) measured at amor sed cost and for which fair values are disclosed in the financial statements.To provide an indica on about the reliability of the inputs used in determining fair value, the company has classified its financial instruments into three levels prescribed under the Ind AS 113 "Fair Value Measurements". An explana on of each level follows underneath the table.
Financial assets and liabili es measured at fair value - recurring fair value measurements at March 31, 2017
Level 1 Level 2 Level 3 Total
Financial assetsFinancial investments at FVPL Equity instruments 7,394.38 - - 7,394.38 Deriva ves Foreign exchange forward contracts - - - -Total 7,394.38 - - 7,394.38
(` in lacs)

Annual Report 2016-17 Notes on Standalone Financial Statements for the year ended 31st March, 2017
70
Financial assets and liabili es measured at fair value - recurring fair value measurements At March31, 2016
Level 1 Level 2 Level 3 Total
Financial assetsFinancial investments at FVPL Equity instruments 10,864.04 - - 10,864.04 Deriva ves Foreign exchange forward contracts - 51.94 - 51.94 Total 10,864.04 51.94 - 10,915.98
Financial assets and liabili es measured at fair value - recurring fair value measurements At March31, 2015
Level 1 Level 2 Level 3 Total
Financial assetsFinancial investments at FVPL Equity instruments 5.63 - - 5.63 Deriva ves Foreign exchange forward contracts - 20.68 - 20.68 Total 5.63 20.68 - 26.31
Level 1:Level 1 hierarchy includes financial instruments measured using quoted prices. This includes listed equity instruments and mutual funds that have quoted price. The fair value of all equity instruments(including bonds) which are traded in the stock exchanges is valued using the closing price as at the repor ng period.Level 2:Fair value of financial instruments that are not traded in an ac ve market (for example, traded bonds, over the counter deriva ves) is determined using valua on techniques which maximize the use of observable market data and rely as li le as possible on en ty-specific es mates. If all significant inputs required to fair value an instrument as observable, the insturment is included in level 2.Level 3:If one or more of the significant inputs is not based on observable data, the instrument is included in level 3. This is the case for unlisted equity securi es, con gent considera on and indemnifica on assets.
iii) Valua on technique used to determine fair value The following methods and assump ons were used to es mate the fair value of the level 2 financial instruments included in the
above tables: 1) Deriva ve instruments: The company enters into foreign currency forward contracts with banks with investment grade
credit ra ngs. These are valued using the forward pricing valua on technique, using present value calcula ons. The models incorporate various inputs including the credit quality of counterpar es and foreign exchange spot and forward rates. The changes in counterparty credit risk had no material effect on the hedge effec veness assessment for deriva ves designated in hedge rela onships.
iv) As per Ind AS 107 "Financial Instrument:Disclosure", fair value disclosures are not required when the carrying amounts reasonably approximate the fair value. Accordingly fair value disclosures have not been made for the following financial instruments:-
1) Trade receivables 2) Cash and cash Equivalent 3) Other Bank Balances 4) Interest Accrued On Deposits 5) Borrowings 6) Trade payables 7) Capital creditors 8) Other payables
(` in lacs)

Notes on Standalone Financial Statements for the year ended 31st March, 2017 Annual Report 2016-17
71
NOTE 33 FINANCIAL RISK MANAGEMENT
The company's few por on of ac vi es are exposed to variety of financial risks i.e. market risk, credit risk and liquidity risk.a) Market Risk The company operates globally and a por on of the business is transacted in several currencies and consequently the company
is exposed to foreign exchange risk through its sales and services outside India, and purchases from overseas suppliers in various foreign currencies. The exchange rate between the rupee and foreign currencies has changed substan ally in recent years and may fluctuate substan ally in the future. Consequently, the results of the company's opera ons are affected posi vely/ adversely as the rupee appreciates/ depreciates against these currencies. The company evaluates exchange rate exposure arising from these transac ons and enters into foreign exchange forward contracts to mi gate the risk of changes in exchange rate on foreign currency exposures as and when required.
aa) The company's exposure to foreign currency risk as on March 31, 2017 expressed in ` in lacs, is as follows:
Par culars 31st March, 2017USD Other
currenciesTotal
Financial assets Cash and cash equivalents 19.64 244.10 263.74 Trade receivables 14,233.50 - 14,233.50 Other Assets 1,289.21 1,793.13 3,082.34 Financial liabili es - Trade payables 1,249.05 - 1,249.05 Employee benefit obliga ons - - - Other liabili es 21,531.90 1,602.04 23,133.94 Net assets/ (liabili es) (7,238.62) 435.20 (6,803.42)
ab) The company's exposure to foreign currency risk as on March 31, 2016 expressed in ` in lacs, is as follows:
Par culars 31st March, 2016USD Other
currenciesTotal
Financial assets Cash and cash equivalents - - - Trade receivables 12,887.27 - 12,887.27 Other Assets 55.76 2,623.91 2,679.67 Financial liabili esTrade payables 7,706.24 - 7,706.24 Employee benefit obliga ons - - - Other liabili es 2,981.95 1,673.16 4,655.11 Net assets/ (liabili es) 2,254.84 950.75 3,205.59
ac) The company's exposure to foreign currency risk as on April 1, 2015 expressed in ` in lacs, is as follows:
Par culars 1st April, 2015USD Other
currenciesTotal
Financial assets Cash and cash equivalents - - - Trade receivables 20,249.93 - 20,249.93 Other Assets 0.83 999.81 1,000.64 Financial liabili esTrade payables 18,201.11 - 18,201.11 Employee benefit obliga ons - - - Other liabili es - - - Net assets/ (liabili es) 2,049.66 999.81 3,049.47
(` in lacs)

Annual Report 2016-17 Notes on Standalone Financial Statements for the year ended 31st March, 2017
72
ad) Deriva ve financial Instruments
The company holds deriva ve financial instruments such as foreign exchange forward contracts to mi gate the risk of changes in exchange rates on foreign currency exposures. The counterparty for these contracts is generally a bank. These financial instruments are valued based on quoted prices for similar assets and liabili es in ac ve markets or inputs that are directly or indirectly observa on in the marketplace.
The following table gives details in respect of outstanding foreign exchange contracts:
Par culars 31st March, 2017 31st March, 2016 1st April, 2015Deriva ves Forward Contracts FC in lacs ` in lacs FC in lacs ` in lacs FC in lacs ` in lacsForward contracts In USD - - 25.30 1726.38 25.30 1597.96Total forwards - - 25.30 1,726.38 25.30 1,597.96
The foreign exchange forward contracts mature within twelve months. The table below analyzes the deriva ve financial into relevant maturity groupings based on the remaining period of the balance sheet date:
Par culars 31st March, 2017 31st March, 2016 1st April, 2015Not later than one month - - - Later than one month and later than three months - 1,726.38 778.28 Later than three months and not later than one year - - 819.68
ae) Sensi vity- Interest rate risk exposure
Profit or loss sensi ve to higher/ lower of interest expense from borrowings as a result of changes in interest rates.
Par culars Impact on profit a er tax (*)31st March, 2017 31st March, 2016
Interest rates-increase by 50 basis points (50bps) -0.12% -0.20%Interest rates-decrease by 50 basis points (50bps) 0.12% 0.20%
*holding all other variables constant
b) Credit risk
Credit risk refers to the risk of default on its obliga on by the counterparty resul ng in a financial loss. The maximum exposure to the credit risk at the repor ng date is primarily trade receivables from customers other than goverment en es. These Trade receivables are typically unsecured and are derived from revenue earned from domes c and foreign customers. Credit risk is managed through credit approvals, establishing credit limits and con nously monitoring the creditworthiness of customers to which the company grants credit terms in the normal course of business. On account of adop on of Ind AS 109, the company uses expected credit loss model to assess impairment loss or gain. the company uses a matrix to compute the expected credit loss allowance for trade receivable.
bb) The allowance for life me expected credit loss on customer balances for the year ended March 31, 2017 and March 31, 2016 was ` 5,126.01 lakhs and ` 5,693.33 lakhs respec vely. The movement of allowance for bad and doub ul debt is as below :
Par culars 31st March, 2017 31st March, 2016Balance at the beginning of the year 5,693.33 4,452.40 Transla on differences - - Allowance for doub ul debt (567.32) 1,240.93 Write offs - - Balance at the end of the year 5,126.01 5,693.33
The company's credit period generally ranges from 120-150 days
Par culars 31st March, 2017 31st March, 2016Trade receivables 1,94,959.93 1,72,756.81 Days sales outstanding - DSO (Days) 154 days 155 days
bc) Credit risk on cash and cash equivalents is limited as the company generally invites in deposits with banks and financial ins tu ons with high credit ra ngs assigned be interna onal and domes c credit ra ng agencies.
(` in lacs)

Notes on Standalone Financial Statements for the year ended 31st March, 2017 Annual Report 2016-17
73
NOTE 34 CAPITAL MANAGEMENTa) Risk management The company's objec ves when managing capital are to: -safeguard their ability to con nue as a going concern, so that they can con nue to provide returns for shareholders and benefits
for other stakeholders, and -maintain an op mal capital structure to reduce the cost of capital. In order to maintain or adjust the capital structure, the company may adjust the amount of dividends paid to shareholders, return
on capital to shareholders or issue new shares. The company monitors capital using gearing ra o, which is net debt divided by total Equity. Net debt comprises of long term and short term borrowings less cash and bank balances. Equity includes equity share capital and reserves that are managed as capital. The gearing at the end of repor ng period was as follows:
(` in lacs)Par culars 31st March, 2017 31st March, 2016 1st April 2015
Net Debt 84,873.48 95,261.10 74,987.91 Total Equity 99,381.24 76,224.03 62,550.69 Net debt to Equity Ra o 0.85 1.25 1.20
b) Dividends
Par culars 31st March, 2017 31st March, 2016(i) Equity sharesFinal dividend for the year ended 31.03.2017 of ` NIL (31.03.2016 ` NIL) per fully paid share - -Interim dividend for the year ended 31.03.2017 of ` NIL (31.03.2016 ` Nil) per fully paid share
- -
(ii) Dividends not recognised at the end of the repor ng period - -In addi on to the above dividends, since year end the directors have recommended the payment of final dividend of ` NIL per fully paid equity share (31.03.2016 ` NIL). This proposed dividend is subject to the approval of shareholders in the ensuing annual general mee ng.
- -
Par culars 31st March, 2017 31st March, 2016 NOTE 35 EARNINGS PER SHARE EPS
i) Net Profit a er tax as per statement of Profit & Loss a ributable to Equity Shareholders (` In Lacs) 16,579.79 15,053.09 ii) Weighted Average number of equity shares used as denominator for calcula ng EPS 4,70,00,000 4,54,93,151 iii) Basic and Diluted Earnings per share (`) 35.28 33.09iv) Face Value per Equity Share (`) 10.00 10.00
Par culars 31st March, 2017 31st March, 2016 NOTE 36 FOREIGN EXCHANGEEARNINGS IN FOREIGN EXCHANGEFOB Value of Exports 16,746.83 22,202.76 EXPENDITURE IN FOREIGN CURRENCYImported Material 14,440.59 21,876.10 Tour Expenses 75.51 75.91 Others 1,034.99 197.30
15,551.09 22,149.31
Par culars 31st March, 2017 31st March, 2016 NOTE 37.1 CONTINGENT LIABILITIESi) Guarantees given by Company's Bankers on behalf of the Company. 2,26,557.28 1,91,019.46 ii) Claims against the Company not acknowledged as debts:
a) Sales Tax 1,178.87 1,439.76 b) Service Tax 328.64 333.08
iii) Corporate Guarantees given by Company 5,273.18 11,603.78 However as per management percep on, the above liabili es will not devolve upon the company in future.

Annual Report 2016-17 Notes on Standalone Financial Statements for the year ended 31st March, 2017
74
(` in lacs)
Par culars 31st March, 2017 31st March, 2016 NOTE 37.2 CAPITAL COMMITMENTSEs mated value of contracts in capital account remaining to be executed 571.12 700.05
Par culars 31st March, 2017 31st March, 2016 NOTE 38 SEGEMENT REPORTING AS PER IND AS 108Segment Revenue:Project Construc on Division 4,38,282.28 3,79,561.39 Tower Manufacturing Division 8,914.89 9,863.17 Aluminium Extrusion,Forging & Conductor Division 489.70 696.98 Solar Power Division 871.69 937.80 Others 14,603.36 22,067.32 Segment Total 4,63,161.93 4,13,126.65 Segment Results:Project Construc on Division 47,454.49 43,133.31 Tower Manufacturing Division 130.86 396.20 Aluminium Extrusion,Forging & Conductor Division 1.38 5.69 Solar Power Division 540.85 603.04 Segment Total 48,127.58 44,138.24 Unallocated income over expenses (1,507.86) (1,387.95) Profit Before Interest & Tax 46,619.72 42,750.29 Interest 21,319.50 18,565.18 Provision for Current Year Tax 8,720.43 8,218.03 Profit a er Current Year Tax 16,579.79 15,967.09
Par culars As at 31st March, 2017
As at 31st March, 2016
As at 1st April, 2015
NOTE 38 SEGEMENT REPORTING AS PER IND AS 108 (Contd.)Segment Assets & Liabili es: AssetsSegment AssetsProject Construc on Division 3,31,214.03 3,03,437.24 2,58,883.75 Tower Manufacturing Division 21,500.95 23,396.21 17,078.44 Aluminium Extrusion,Forging & Conductor Division 10,365.25 738.80 1,170.70 Solar Power Division 6,231.06 6,205.50 6,852.25 Unallocated Assets & Liabili es 33,726.61 40,070.47 23,714.84 Total 4,03,037.90 3,73,848.22 3,07,699.98
Liabili es
Segment Liabili esProject Construc on Division 1,69,611.17 1,69,094.77 1,45,441.91 Tower Manufacturing Division 1,338.13 1,241.07 756.38 Aluminium Extrusion,Forging & Conductor Division 85.38 186.87 146.75 Solar Power Division - - 3.56 Unallocated Assets & Liabili es 77,728.12 74,500.82 62,500.68 Total 2,48,762.80 2,45,023.53 2,08,849.28

Notes on Standalone Financial Statements for the year ended 31st March, 2017 Annual Report 2016-17
75
(` in lacs)
NOTE 39 RELATED PARTY DISCLOSURE AS PER IND AS 24
Name Rela on Par culars Net Transac on During the year
Balance as on 31st March, 2017
EMC Hardware Ltd 100% Subsidiary Investment - 15.00 Advance 0.33 4.76 Interest 0.32 -
EMC Tower Ltd 100% Subsidiary Investment - 1,300.00 Advance 43.74 744.86 Interest 54.75 -
EMC Solar Ltd. 100% Subsidiary Investment - 5.00 Advance 0.25 (1.94)Interest (0.15) -
EMC Forging Ltd. 100% Subsidiary Investment - 5.00 Advance 0.33 (1.58)Interest (0.13) -
EMC Logis c Ltd. 100% Subsidiary Investment - 5.00 Advance 0.23 (1.93)Interest (0.15) -
EMC Overseas Ltd. 100% Subsidiary Investment - 150.00 Advance 1.18 (141.30)Interest (10.09) -
EMC Academy Ltd. 100% Subsidiary Investment - 5.00 Advance 2.12 123.58 Interest 8.70 -
ASC, Inc. (Formerly, Advanced Steel & Crane Inc.) 100% Subsidiary Investment - 1,105.85 Tecnolines S.r.l 90% Subsidiary Investment 145.64 3,047.19
Advance 36.37 526.26 EMC West Asia DMCC 100% Subsidiary Investment - 303.99
Advance 406.82 626.06 Interest 52.23 -
BCPL - EMC Joint Venture Joint Venture Investment - 2.45 Sales 351.91 382.90
Advance - - EMC - BCPL Joint Venture Joint Venture Investment - -
Sales 558.05 182.33 Advance - -
EMC - BCPL Joint Venture Subir Joint Venture Investment - - Sales 761.34 85.72
Advance - - Quatro Rail Tech Solu ons Ltd.(Formerly, Quatro Rail Tech Solu ons Pvt. Ltd)
60% Subsidiary Investment - 60.00
Advance 150.00 282.38 Interest 16.61 -
EMC MBE Contrac ng Co. LLC Joint Venture Investment - 151.97 Advance (18,810.55) (18,810.55)
EMC Saudi LLC 60 % Subsidiary Investment - 324.99 Fedders - EMC - Quatro JV Joint Venture Sales 429.63 (666.65)
Advance - -

Annual Report 2016-17 Notes on Standalone Financial Statements for the year ended 31st March, 2017
76
(` in lacs)
Name Rela on Par culars Net Transac on During the year
Balance as on 31st March, 2017
EMC East Asia Ltd 100% Subsidiary Investment - 4.06 Advance 2,658.89 12.42
Tecnolines Singapore PTE Ltd. 100% Subsidiary Investment - 0.49 Advance (0.01) 0.38 Interest 0.02 -
Mr. Manoj Toshniwal Key Managerial Personnel
Salary 130.32 -
Mr. Ramesh Chandra Bardia Key Managerial Personnel
Salary 130.32 -
Mr. Nikunj Toshniwal Rela ve of Key Managerial Personnel
Salary 34.20 -
Mr. Keshav Toshniwal Rela ve of Key Managerial Personnel
Salary 3.98 -
Mr. Siddhartha Bardia Rela ve of Key Managerial Personnel
Salary 17.02 -
* Figures in Brackets indicate amounts payable to related par es.
Par culars As at 31st March, 2017
As at 31st March, 2016
NOTE 40 FINANCIAL HEDGING INSTRUMENTSFor hedging Currency Related Risksi) Forward Contracts - Outstanding Nominal Value Nil 1,726.38
NOTE 41 AS PER IND AS 19 "EMPLOYEE BENEFITS", THE DISCLOSURES AS DEFINED IN THE ACCOUNTING STANDARD ARE GIVEN BELOW:
Defined Benefit PlanThe employees' gratuity fund scheme managed by a trust is a defined benefit plan. The Present Value of obliga ons is determined based on actuarial valua on using the Projected Unit Cost Method.
2016-17 2015-161) Change in Defined Benefit Obliga on :
Defined Benefit Obliga on at the beginning of the year 348.83 328.81 Interest Cost 27.35 25.58 Current Service Cost 44.63 43.88 Benefits Paid (42.84) (59.00)Actuarial Gain / (Loss) on Obliga on (18.30) 9.56 Present Value of obliga on as at the end of the year 359.67 348.83
2) Change in Fair Value of the AssetFair Value of the plan assets at the beginning of the year 252.52 289.45 Investment Income 19.80 22.52 Contribu ons 111.44 Benefits paid (42.84) (59.00)Return on plan assets, excluding amount recognised in Net Interest Expenses (1.67) (0.45)Fair Value of Plan assets at the end of the year 339.25 252.52
3) Net Asset/(Liability) recognised in the Balance SheetFair Value of the Plan Assets 339.25 252.52 Present Value of the obliga on as at the end of the year 359.67 348.83 Amount recognized in Balance Sheet (20.42) (96.31)

Notes on Standalone Financial Statements for the year ended 31st March, 2017 Annual Report 2016-17
77
(` in lacs)
2016-17 2015-164) Expenses recognised in the Income Statement
(under the head contribu on to provident fund and other funds)Current Service Cost 44.63 43.88 Net Interest Income/(cost) on the Net Defined Benefit liability 7.55 3.06 Expenses recognised in the statement of Profit and Loss 52.18 46.94
5) Other Comprehensive IncomeExpected Return from Plan Asset 1.67 9.56 Net Actuarial Gain/(Loss) recognized in the year (18.30) 0.45 Components of defined benefit costs recognised in Other Comprehensive income (16.63) 10.01
Par culars 31st March, 2017 31st March, 2016 31st March, 2015NOTE 41.1 THE KEY ASSUMPTIONS USED IN THE CALULATIONS ARE AS
FOLLOWS :Discount Rate 7.34% p.a. 7.84% p.a. 7.78% p.a. Rate of increase in salaries 6.00% p.a. 6.00% p.a. 6.00% p.a. Mortality IALM 06-08
Ul mate IALM 06-08
Ul mate IALM 06-08
Ul mate A ri on Rate 2.00% p.a. 2.00% p.a. 2.00% p.a.
Par culars As on 31st March, 2017 As on 31st March, 2016 NOTE 41.2 SENSITIVITY ANALYSIS Decrease Increase Decrease Increase Discount Rate (-/+ 1%) 390.71 333.18 376.22 325.38 % change compared to base due to sensi vity 8.63% -7.36% 7.85% -6.72%Salary Growth (-/+1%) 333.85 389.37 326.02 374.87 % change compared to base due to sensi vity -7.18% 8.26% -6.54% 7.46%A ri on Rate (-/+1%) 356.62 362.26 344.86 352.23 % change compared to base due to sensi vity -0.85% 0.72% -1.14% 0.97%Mortality Rate (-/+1%) 358.90 360.43 347.90 349.75 % change compared to base due to sensi vity -0.21% 0.21% -0.27% 0.26%
NOTE 41.3 DESCRIPTION OF RISK EXPOSURES
Valua ons are performed on certain basic set of pre-determined assump ons and other regulatory framework which may vary over me. Thus, the Company is exposed to various risks in providing the above gratuity benefit which are as follows:
Interest Rate risk : The plan exposes the Company to the risk of fall in interest rates. A fall in interest rates will result in an increase in the ul mate cost of providing the above benefit and will thus result in an increase in the value of the liability (as shown in financial statements).
Liquidity Risk : This is the risk that the Company is not able to meet the short-term gratuity payouts. This may arise due to non-availabilty of enough cash / cash equivalent to meet the liabili es or holding of illiquid assets not being sold in me.
Salary Escala on Risk : The present value of the defined benefit plan is calculated with the assump on of salary increase rate of plan par cipants in future. Devia on in the rate of increase of salary in future for plan par cipants from the rate of increase in salary used to determine the present value of oblga on will have a bearing on the plan's liability.
Demographic Risk : The Company has used certain mortality and a ri on assump ons in valua on of the liability. The Company is exposed to the risk of actual experience turning out to be worse compared to the assump on.
Regulatory Risk : Gratuity benefit is paid in accordance with the requirements of the Payment of Gratuity Act , 1972(as amended from me to me). There is a risk of change in regula ons requiring higher gratuity payouts.

Annual Report 2016-17 Notes on Standalone Financial Statements for the year ended 31st March, 2017
78
(` in lacs)
Par culars As at 31st March, 2017
As at 31st March, 2016
As at 1st April, 2015
NOTE 42 ASSETS PROVIDED AS SECURITY ` in Lacs ` in Lacs ` in LacsCurrent AssetsFinancial AssetsTrade Receivables 1,92,105.99 1,70,163.12 1,49,711.45 Other Financial Assets 1,29,422.40 1,27,502.63 99,594.28 Non Financial AssetsInventories 11,032.94 13,488.48 13,849.90 Total Current assets provided as security 3,32,561.33 3,11,154.22 2,63,155.63 Non Current assetsProperty, Plant and Equipment 26,164.35 16,736.21 18,229.72 Intangible Assets 59.04 51.31 44.62 Investment 3,379.49 1,292.00 -Total Non - Current assets provided as security 29,602.88 18,079.52 18,274.34 Total Assets provided as Security 3,62,164.21 3,29,233.74 2,81,429.97
Par culars As at 31st March, 2017
As at 31st March, 2016
As at 1st April, 2015
NOTE 43 THE OBLIGATIONS ON LONG TERM , NON CANCELLABLE FINANCE LEASES PAYABLE AS PER THE RESPECTIVE AGREEMENTS ARE AS FOLLOWS :
Future minimum lease payableNot Later than 1 year 71.29 16.14 14.20 Later than 1 year and not later than 5 years 251.43 4.07 20.21 Later than 5 year - - -
322.72 20.21 34.41
Par culars Revalua on of NOTE 44 REVALUATION OF PROPERTY, PLANT AND EQUIPMENT Land BuildingEffec ve date of the revalua on 31st March, 2017 31st March, 2017Revalua on by United Serveyors
& ValuersUnited Serveyors
& ValuersCarring amount before revalua on 34,50,280 3,39,86,212 Revalua on Amount 96,56,69,720 5,80,82,788 Carring amount a er revalua on 96,91,20,000 9,20,69,000 Deprecia on - -Fair value Hirarchy II IIValua on techniques Sales Comparison
market approachSales Comparison market approach
NOTE 45 FIRST TIME ADOPTION OF IND AS
The accoun ng policy set out in Note 2 have been applied in preparing the financial statements for the year ended 31st March 2017, the compara ve informa on presented in these financial statements for the year ended 31st March 2016 and in the prepara on of an opening Ind AS Balance sheet at 01st Apr 2015( transi on date ).In preparaing its opening Ind AS balance sheet, the company has adjusted the amounts reported previously in financial statements prepared in accordance with the accoun ng standards no fied under companies (Accoun ng Standards ) Rules, 2006 (as amended) and other relevant provisions of the Act (Previous GAAP).An explana on of how the transi on from previous GAAP to Ind AS has affected the company's financial pos on, financial performance and cash flows is set out in the following tables and notes.

Notes on Standalone Financial Statements for the year ended 31st March, 2017 Annual Report 2016-17
79
A) Exemp on Availed
1) Deemed Cost
Ind As 101 permits a first me adopter to elect to con nue with the carrying value for all of its Property , Plant & Equipment as recognized in the financial statements as at the date of transi on to Ind AS,measured as per the previous GAAP and use that as its deemed cost as at the date of transi on. Accordingly the company has elected to measure all of its Property, Plant & Equipment, Intangible assets at their previous GAAP carrying value.
2) Designa on of previously recognised financial instruments
Ind AS 101 allows an en ty to designate investments in equity instruments at FVTOCI on the basis of the facts and circumstances at the date of transi on to Ind AS. The company has elected to apply this exemp on for its investment in equity investments.
B) Excep ons Followed
a) Es mates
An en ty’s es mates in accordance with Ind AS at the date of transi on to Ind AS shall be consistent with es mates made for the same date in accordance with previous GAAP (a er adjustments to reflect any difference in accoun ng policies). Ind AS es mates as at 1st April, 2015 are consistent with the es mates as at the same date made in conformity with previous GAAP. The Company made es mates for following items in accordance with Ind AS at the date of transi on as these were not required under previous GAAP:- Investment in equity instruments carried at FVTPL or FVOCI; and
- Impairment loss/gain on Financial assets.
b) Classifica on and measurement of financial assets
Ind AS 101 requires an en ty to assess classifica on and measurement of financial assets on the basis of the facts and circumstances that exist at the date of transi on to Ind AS.
C) Transi on to Ind AS -Reconcilia on
The following reconcilia ons provide a quan fica on of the effect of significant differences arising from the transi on from previous GAAP to Ind AS in accordance with Ind AS 101:
I. Reconcilia on of Balance sheet as at April 1, 2015 and March 31, 2016
II. Reconcilia on of Statement of Profit and Loss for the year ended March 31, 2016
III. Reconcilia on of Equity as at April 1, 2015 and March 31, 2016
The presenta on requirements under Previous GAAP differs from Ind AS and hence Previous GAAP informa on has been regrouped for ease of reconcilia on with Ind AS. The Regrouped Previous GAAP informa on is derived from the Financial Statements of the Company prepared in accordance with Previous GAAP.

Annual Report 2016-17 Notes on Standalone Financial Statements for the year ended 31st March, 2017
80
I. Reconcilia ons of Balance Sheet as at April 1, 2015 and March 31, 2016
(a) Reconcilia ons of Balance Sheet as at April 1, 2015 (` in Lacs)
Par culars Note No.
As at 1st April, 2015
Adjustments As at1st April, 2015
(Previous GAAP) (Ind AS)I. ASSETS
1. Non-current assetsa. Property,Plant and Equipments 18,229.72 - 18,229.72 b. Capital work-in-progress 62.82 - 62.82 c. Intangible Assets 44.63 - 44.62 d. Financial Assets
(i) Trade Receivables 2,099.59 - 2,099.59 (ii) Investments 1 7,119.04 2.14 7,121.18 (iii)Other Financial assets 3.18 - 3.18
e. Other non-current asset 2,048.45 - 2,048.45 f. Deferred tax assets(net) - - -
2. Current assets a. Inventories 13,849.90 - 13,849.90 b. Financial Assets
(i) Current investments - - -(ii) Trade Receivables 3 1,54,163.85 (4,452.40) 1,49,711.45 (iii) Cash & Bank balances 477.02 - 477.02 (iv) Other financial Assets 9,635.97 - 9,635.97
c. Other assets 1,04,416.08 - 1,04,416.08 Total 3,12,150.24 (4,450.26) 3,07,699.98
II. EQUITY AND LIABILITIES 1. Equity
a. Equity Share Capital 3,700.00 - 3,700.00 b. Other Equity 6 61,508.28 (2,657.58) 58,850.69
2. Non-current liabili es a. Financial Liabili es
(i) Borrowings 24,561.27 - 24,561.27 (ii) Trade payables 5,733.15 - 5,733.15 (iii) Other Financial Liabili es 12,682.92 - 12,682.92
b. Provisions - - -c. Deferred Tax Liabili es (net) 2 1,466.62 (1,347.35) 119.27 d. Other Non-current Liabili es - - -
3. Current liabili es a. Financial Liabili es
(i) Borrowings 60,522.14 - 60,522.14 (ii) Trade payables 1,21,373.53 - 1,21,373.53 (iii) Other Financial Liabili es 12,348.04 - 12,348.04
b. Provisions 4 674.71 (445.32) 229.39 c. Other Liabili es 1,360.42 - 1,360.42 d. Current Tax Liability (Net) 6,219.15 - 6,219.15
Total 3,12,150.24 (4,450.26) 3,07,699.98

Notes on Standalone Financial Statements for the year ended 31st March, 2017 Annual Report 2016-17
81
(b) Reconcilia ons of Balance Sheet as at March 31, 2016 (` in Lacs)
Par culars Note No.
As at31st March, 2016
Adjustments As at31st March, 2016
(Previous GAAP) (Ind AS)I. ASSETS
1. Non-current assetsa. Property,Plant and Equipments 16,736.22 - 16,736.22 b. Capital work-in-progress 22.00 - 22.00 c. Intangible Assets 51.31 - 51.31 d. Financial Assets
(i) Trade Receivables 2,593.69 - 2,593.69 (ii) Investments 1 21,883.68 (3,427.14) 18,456.54 (iii)Other Financial assets 3.62 - 3.62
e. Other non-current asset 3,011.95 - 3,011.95 f. Deferred tax assets(net)
2. Current assets a. Inventories 13,488.49 - 13,488.49 b. Financial Assets
(i) Current investments - - - (ii) Trade Receivables 3 1,75,856.45 (5,693.33) 1,70,163.12 (iii) Cash & Bank balances 892.88 - 892.88 (iv) Other financial Assets 13,458.71 - 13,458.71
c. Other assets 1,34,969.71 - 1,34,969.71 Total 3,82,968.71 (9,120.47) 3,73,848.24
II. EQUITY AND LIABILITIES 1. Equity
a. Equity Share Capital 4,700.00 - 4,700.00 b. Other Equity 6 76,193.46 (4,669.43) 71,524.03
2. Non-current liabili es
a. Financial Liabili es - (i) Borrowings 32,663.47 - 32,663.47 (ii) Trade payables 4,829.85 - 4,829.85 (iii) Other Financial Liabili es 22,938.61 - 22,938.61
b. Provisions - - - c. Deferred Tax Liabili es (net) 2 12,901.58 (1,668.20) 11,233.38 d. Other Non-current Liabili es - - -
3. Current liabili es - a. Financial Liabili es
(i) Borrowings 76,900.90 - 76,900.90 (ii) Trade payables 1,21,684.66 - 1,21,684.66 (iii) Other Financial Liabili es 11 24,838.64 (2,500.00) 22,338.64
b. Provisions 4 489.99 (282.84) 207.15 c. Other Current Liabili es 4,827.55 - 4,827.55
Total Equity and Liabili es 3,82,968.71 (9,120.47) 3,73,848.24

Annual Report 2016-17 Notes on Standalone Financial Statements for the year ended 31st March, 2017
82
II. Reconcilia on of Statement of Profit and Loss for the year ended March 31, 2016 (` in Lacs)
Par culars Note No.
31st March, 2016
Adjustments 31st March, 2016
(Previous GAAP) (Ind AS) Income I. Revenue from Opera ons 9 4,12,108.58 1,018.08 4,13,126.65 II. Other Incomes 1,427.81 - 1,427.81
Total Income 4,13,536.39 1,018.08 4,14,554.46 III. Expenses
(a) Cost of Raw Materials Consumed 3,08,588.20 - 3,08,588.20 (b) Change in Inventory (Increase) /decrease 840.99 - 840.98 (c) Manufacturing and Processing Costs 34,062.35 - 34,062.35 (d) Employee Benefit Expenses 5 7,682.75 (10.01) 7,672.73 (e) Finance cost 18,565.18 - 18,565.19 (f) Deprecia on and Amor za on expenses 10 1,755.09 0.43 1,755.51 (g) Other Expenses 9, 3 17,856.71 2,259.01 20,115.76 Total expenses 3,89,351.26 2,249.43 3,91,600.71
IV. Profit Before excep onal and tax 24,185.13 (1,231.35) 22,953.75 Excep onal items - - -
V. Profit before Taxes 24,185.13 (1,231.35) 22,953.75 VI. Provision for Taxes
(a) Current Tax 1,376.79 - 1,376.79 (b) Deferred Tax 2 6,841.24 (317.39) 6,523.86
VII. Profit (Loss) for the Year 15,967.10 (913.96) 15,053.09 VIII. Other Comprehensive Income
(i) Items that will not be reclassified subsequently to profit or loss :
7
(a) Changes in investments in equity shares carried at FVTOCI
- (3,429.28) (3,429.28)
(b) Re-measurement of defined employee benefit plans
- (10.01) (10.01)
(c) Income tax effect - 3.47 3.47IX. Total Other comprehensive Income a er tax - (3,435.83) (3,435.83)X. Total comprehensive income for the period 15,967.10 (4,349.79) 11,617.29
III. Reconcilia on of Equity as at April 1, 2015 and March 31, 2016 (` in Lacs)
Par culars Refer Notes below
As at31st March, 2016
As at1st April, 2015
Total equity as per previous GAAP 80,893.45 65,208.28 Deferred taxes under balance sheet approach 2 1,668.20 1,347.35 Reserves for equity instruments through OCI 1 (3,427.14) 2.14 Revalu on Surplus of Plant, Property and Equipment 10 - -Reversal of Proposed Dividend with distribu on tax on it 4 283 445 Impairment Losses on Financial Assets 3 (5,693) (4,452)Recogniza on of equity component of debt instrument 11 2,500 -Total equity as per Ind AS 76,224.02 62,550.70

Notes on Standalone Financial Statements for the year ended 31st March, 2017 Annual Report 2016-17
83
Notes to first me adop on
1) Fair Valua on of Investments
Under previous GAAP, investment in equity instruments were classified into long term and current investments. Long term investments were carried at cost less provision other than temporary in nature. Current investments were carried at lower of cost or fair value. Under Ind AS, these investments are require to be measured at fair value either through OCI (FVTOCI).The company has opted to fair value these investments through other comprehensive income (FVTOCI). Accordingly, resul ng fair value change of these investments have been recognised in retained earnings as at the date of transi on and subsequently in the other comprehensive income for the year ended March 31, 2016.
2) Deferred Taxes
Under previous GAAP, deferred taxes were recognised based on Profit & loss approach i.e. tax impact on difference between the accoun ng income and taxable income. Under Ind AS, deferred tax is recognised by following balance sheet approach i.e. tax impact on temporary difference between the carrying value of asset and liabili es in the books and their respec ve tax base. The Deferred tax impact has been recognised in retained earning on the date of transi on and subsequent adjustments in statement of profit and loss.
3) Impairement of Trade receivables
As per Ind AS 109, the company is required to apply expected credit loss model for recognising the impaiement loss or gain on Trade receivables, consequently the impairement loss on date of transi on has been recognised in retained earnings and subsequent changes in statement of profit and loss.
4) Proposed dividend
Under the previous GAAP, dividends proposed by the board of directors a er the balance sheet but before the approval of the financial statements were considered as adjus ng events. Accordingly, provision for proposed dividend was recognised as a liability. Under Ind AS, such dividends are recognised when the same is approved by the shareholders in the general mee ng, accordingly provision for the proposed dividend lying as on the date of transi on is derecognized.
5) Remeasurement of post employment benefit obliga ons
Under Ind AS, remeasuremnet i.e. actuarial gains and losses and the return on plan assets, excluding amounts included in the net interest expenses on the net benefit liability are recognised in other comprehensive income instead of profit or loss.
6) Retained earnings
Retained earnings as at April 1, 2015 has been adjusted consequent to Ind AS transi on adjustments.
7) Other comprehensive income
Under Ind AS, all items of income and expenses recognised in a period should be included in profit or loss for the period, unless a standard required or permits otherwise. Items of income and expenses that are not recognised in profit and loss but are shown in the statement of profit and loss as ‘other comprehensive income’ includes remeasurements of defined benefit plans, foreign exchange difference arising on transla on of foreign opera ons, effec ve por on of gain s and losses on cash flow hedging instruments and fair value gains or (losses) on FVTOCI equity instruments. The concept of other comprehensive income did not exist under previous GAAP.
8) Financial Guarantee
The company has extended financial guarantees on behalf of it related en es, the recogni on of financial liabili es arising thereon has not been accounted in the books of account being the fair value is immaterial.
9) Excise Duty
Under the previous GAAP, revenue from sale of products was presented exclusive of excise duty. Under Ind AS, revenue from sale of goods is presented inclusive of excise duty. The excise duty paid is presented on the face of the statement of profit and loss as part of expenses.

Annual Report 2016-17 Notes on Standalone Financial Statements for the year ended 31st March, 2017
84
10) Revalua on Reserve
The Amount lying in revalua on reserve as on transi on date is transferred to retained earnings in accordance with Ind AS Transi on Facilita on Group Bulle n-8 issued by Ins tute of Chartered Accountant of India (ICAI).
11) Recogniza on of equity component of debt instrument
Under previous GAAP, the company had classified mandatorily conver ble debt under other loans and advances, the same has been measured and recognized as equity component in accordance with Ind AS 109 and 32.
NOTE 46 FIGURES FOR THE PREVIOUS YEAR HAVE BEEN RE ARRANGED AND RE GROUPED WHEREVER NECESSARY.
As per our Report of even date a achedFor SRB & AssociatesChartered Accountants (F. Regd. No.310009E)
Bisworanjan Sutar(Partner)Membership No. - 066708Kolkata, The 30th day of June, 2017
For and on behalf of the Board
Manoj Toshniwal Ramesh Chandra Bardia Managing Director Jt. Managing Director DIN : 00022787 DIN : 00374148
Arun Kumar Kedia Sumit Kumar Surana Chief Financial Officer Company Secretary
Yamini MoreVP (Finance & Accounts)

Independent Auditor's Report Annual Report 2016-17
85
CONSOLIDATED FINANCIAL STATEMENTS

Annual Report 2016-17 Independent Auditor's Report
86
To The Members ofEMC Limited
REPORT ON THE CONSOLIDATED IND AS FINANCIAL STATEMENTS
We have audited the accompanying consolidated Ind AS financial statements of EMC Limited(“the Holding Company”) and its subsidiaries ( collec vely referred to as ‘the Company’ or ‘the Group’), which comprises the Consolidated Balance Sheet as at 31st March, 2017, the Consolidated Statement of Profit and Loss (including other comprehensive income), the Consolidated Statement of Cash Flows and the Consolidated Statement of changes in Equity for the year then ended and a summary of the significant accoun ng policies and other explanatory informa on (hereina er referred to as ‘the Consolidated Ind AS Financial Statements’).
MANAGEMENT’S RESPONSIBILITY FOR THE CONSOLIDATED IND AS FINANCIAL STATEMENTS
The Holding Company’s Board of Directors is responsible for the prepara on of these consolidated Ind AS financial statements in terms of the requirements of the Companies Act, 2013 (hereina er referred to as ‘the Act’) that give a true and fair view of the consolidated financial posi on, consolidated financial performance, consolidated cash flows and consolidated changes in equity of the Group in accordance with the accoun ng principles generally accepted in India, including the Accoun ng Standards (Ind AS) specified under Sec on 133 of the Act, read with relevant rules issued thereunder. The respec ve Board of Directors of the companies included in the Group are responsible for maintenance of adequate accoun ng records in accordance with the provisions of the Act for safeguarding the assets of the Group and for preven ng and detec ng frauds and other irregulari es; the selec on and applica on of appropriate accoun ng policies; making judgments and es mates that are reasonable and prudent; and the design, implementa on and maintenance of adequate internal financial controls, that were opera ng effec vely for ensuring the accuracy and completeness of the accoun ng records, relevant to the prepara on and presenta on of the consolidated Ind AS financial statements that give a true and fair view and are free from material misstatement, whether due to fraud or error, which have been used for the purpose of prepara on of the consolidated Ind AS financial statements by the Directors of the Holding Company, as aforesaid.
AUDITOR’S RESPONSIBILITY
Our responsibility is to express an opinion on these consolidated Ind AS financial statements based on our audit. While conduc ng the audit, we have taken into account the provisions of the Act, the accoun ng and audi ng standards and ma ers which are required to be included in the audit report under the provisions of the Act and the Rules made there under.
We conducted our audit in accordance with the Standards on Audi ng specified under Sec on 143(10) of the Act. Those Standards require that we comply with ethical requirements and plan and perform the audit to obtain reasonable assurance about whether the consolidated Ind AS financial statements are free from material misstatement.
An audit involves performing procedures to obtain audit evidence about the amounts and the disclosures in the consolidated Ind AS financial statements. The procedures selected depend on the auditor’s judgment, including the assessment of the risks of material misstatement of the consolidated Ind AS financial statements, whether due to fraud or error. In making those risk assessments, the auditor considers internal financial control relevant to the Holding Company’s prepara on of the consolidated Ind AS financial statements that give a true and fair view in order to design audit procedures that are appropriate in the circumstances. An audit also includes evalua ng the appropriateness of the accoun ng policies used and the reasonableness of the accoun ng es mates made by the Holding Company’s Board of Directors, as well as evalua ng the overall presenta on of the consolidated Ind AS financial statements.
We believe that the audit evidence obtained by us is Sufficient and appropriate to provide a basis for our audit opinion on the consolidated Ind AS financial Statements.
OPINION
In our opinion and to the best of our informa on and according to the explana ons given to us, the aforesaid consolidated Ind AS financial statements give the informa on required by the Act in the manner so required and give a true and fair view in conformity with the accoun ng principles generally accepted in India including the Ind AS, of the consolidated financial posi on of the Group, as at 31st March, 2017 and its consolidated financial performance including other comprehensive income, its consolidated cash flows and the consolidated changes in equity for the year then ended.
OTHER MATTERS
(a) We did not audit the financial statements of twelve subsidiaries, whose financial statements reflect total assets and liabili es of ` 46,797.01/- Lakhs and ̀ 38,894.88/- Lakhs respec vely as at 31st March, 2017, total revenues of ̀ 51,215.68/- Lakhs and net cash flows amoun ng to ` 733.17/- Lakhs for the year ended on that date, as considered in the consolidated Ind AS financial statements. The consolidated Ind AS financial statements also includes the Group’s share of net loss of ` 99.27/- Lakhs for the year ended March 31, 2017, as considered in the consolidated Ind AS Financial Statements, in respect of five joint ventures, whose financial statements have not been audited by us. These financial statements have been audited by other auditors whose reports have been furnished to us by the Management and our opinion on the consolidated Ind AS financial statements, in so far as it relates to the

Independent Auditor's Report Annual Report 2016-17
87
amounts and disclosures included in respect of these subsidiaries and joint ventures, and our report in terms of sub-sec ons (3) and (11) of Sec on 143 of the Act, insofar as it relates to the aforesaid subsidiaries and joint ventures, is based solely on the reports of the other auditors.
(b) We did not audit the financial statements of two subsidiaries, whose financial statements reflect total assets and liabili es of` 27,375.55/- Lakhs and ` 23,293.30/- Lakhs respec vely as at 31st March, 2017 and total revenue of ` 22,781.94 Lakhs and net cash flows amoun ng to ` 863.82/- Lakhs for the year ended on that date, as considered in the consolidated Ind AS financial statements. The financial statements are unaudited and have been furnished to us by the management and our opinion on the consolidated Ind AS financial statements, in so far as it relates to the amounts and disclosures included in respect of the subsidiary is based solely on such unaudited financial statements. In our opinion and according to the informa on and explana ons given to us by the management, the financial statements are not material to the Group.
Our opinion on the consolidated Ind AS financial statements above, and our report on Other Legal and Regulatory Requirements below, is not modified in respect of the above ma ers with respect to our reliance on work done and the reports of the other auditors and the financial statement/ financial informa on cer fied by the management.
REPORT ON OTHER LEGAL AND REGULATORY REQUIREMENTS
1. As required by Sec on 143 (3) of the Act, we report, to the extent applicable, that:
(a) We have sought and obtained all the informa on and explana ons which to the best of our knowledge and belief were necessary for the purposes of our audit of the aforesaid consolidated Ind AS financial statements.
(b) In our opinion, proper books of account as required by law rela ng to prepara on of the aforesaid consolidated Ind AS financial statements have been kept so far as it appears from our examina on of those books and the reports of the other auditors.
(c) The Consolidated Balance Sheet, the Consolidated Statement of Profit and Loss, the Consolidated Cash Flow Statement and Consolidated Statement of Changes in Equity dealt with by this Report are in agreement with the relevant books of account maintained for the purpose of prepara on of the consolidate Ind AS financial statements.
(d) In our opinion, the aforesaid consolidated Ind AS financial statements comply with the Accoun ng Standards specified under Sec on 133 of the Act, read with Rule 7 of the Companies (Accounts) Rules, 2014.
(e) On the basis of the wri en representa ons received from the directors of the Holding Company as on 31st March, 2017 taken on record by the Board of Directors of the Holding Company and the reports of the statutory auditors of its subsidiary companies incorporated in India, none of the directors of the Group companies, incorporated in India is disqualified as on 31st March, 2017 from being appointed as a director in terms of Sec on 164 (2) of the Act.
(f) With respect to the adequacy of the internal financial controls over financial repor ng of the Group and the opera ng effec veness of such controls, refer to our separate Report in ‘Annexure A’; and
(g) With respect to the other ma ers to be included in the Auditor’s Report in accordance with Rule 11 of the Companies (Audit and Auditor’s) Rules, 2014, in our opinion and to the best of our informa on and according to the explana ons given to us:
i. The Holding Company has disclosed the pending li ga ons in its consolidated Ind AS financial statements.
ii. The Holding Company did not have any long-term contracts including deriva ve contracts. Accordingly, no provision for material foreseeable losses have been made; and
iii. There were no amounts which were required to be transferred to the Investor Educa on and Protec on Fund by the Holding Company, and its subsidiary companies incorporated in India; and
iv. The Company has provided requisite disclosures in its consolidated Ind AS financial statements as to holdings as well as dealings in Specified Bank Notes during the period from 8 November, 2016 to 30 December, 2016. Based on audit procedures and relying on the management representa on, we report that the disclosures are in accordance with the books of accounts maintained by the Company and as produced to us by the management.
For SRB & AssociatesChartered Accountants
Firm Registra on No-310009E
Bisworanjan SutarKolkata, Partner30th June 2017 Membership No: 066708

88
Annual Report 2016-17 Annexure - A to the Independent Auditor's Report
88
(Referred to in paragraph 1 (f) under ‘Report on Other Legal and Regulatory Requirements’ sec on of our report of even date)
REPORT ON THE INTERNAL FINANCIAL CONTROLS UNDER CLAUSE (I) OF SUB SECTION 3 OF SECTION 143 OF THE COMPANIES ACT, 2013 (“THE ACT”)
In conjunc on with our audit of the consolidated Ind AS financial statements of the Company as of and for the year ended March 31, 2017, we have audited the internal financial controls over financial repor ng of EMC Limited (“the Holding Company”) and its subsidiary companies which are companies incorporated in India, as of that date.
MANAGEMENT’S RESPONSIBILITY FOR INTERNAL FINANCIAL CONTROLS
The respec ve Board of Directors of the Holding Company and its subsidiary companies, which are companies incorporated in India are responsible for establishing and maintaining internal financial controls based on the internal control over financial repor ng criteria established by the Company considering the essen al components of internal control stated in the Guidance Note on Audit of Internal Financial Controls over Financial Repor ng issued by the Ins tute of Chartered Accountants of India (‘ICAI’). These responsibili es include the design, implementa on and maintenance of adequate internal financial controls that were opera ng effec vely for ensuring the orderly and efficient conduct of its business, including adherence to Holding company’s policies, the safeguarding of its assets, the preven on and detec on of frauds and errors, the accuracy and completeness of the accoun ng records, and the mely prepara on of reliable financial informa on, as required under the Companies Act, 2013.
AUDITORS’ RESPONSIBILITY
Our responsibility is to express an opinion on the Company’s internal financial controls over financial repor ng based on our audit. We conducted our audit in accordance with the Guidance Note on Audit of Internal Financial Controls over Financial Repor ng (the ‘Guidance Note’) issued by ICAI and the Standards on Audi ng, issued by ICAI and deemed to be prescribed under sec on 143 (10) of the Companies Act, 2013, to the extent applicable to an audit of internal financial controls both issued by the ICAI.
Those Standards and the Guidance Note require that we comply with ethical requirements and plan and perform the audit to obtain reasonable assurance about whether adequate internal financial controls over financial repor ng was established and maintained and if such controls operated effec vely in all material respects.
Our audit involves performing procedures to obtain audit evidence about the adequacy of the internal financial controls system over financial repor ng and their opera ng effec veness. Our audit of internal financial controls over financial repor ng included obtaining an understanding of internal financial controls over financial repor ng, assessing the risk that a material weakness exists, and tes ng and evalua ng the design and opera ng effec veness of internal control based on the assessed risk. The procedures selected depend on the auditor’s judgment, including the assessment of the risks of material misstatement of the Ind AS financial statements, whether due to fraud or error.
We believe that the audit evidence we have obtained is sufficient and appropriate to provide a basis for our audit opinion on the Company’s internal financial controls over financial repor ng.
MEANING OF INTERNAL FINANCIAL CONTROLS OVER FINANCIAL REPORTING
A company's internal financial control over financial repor ng is a process designed to provide reasonable assurance regarding the reliability of financial repor ng and the prepara on of financial statements for external purposes in accordance with generally accepted accoun ng principles. A company's internal financial control over financial repor ng includes those policies and procedures that (i) pertain to the maintenance of records that, in reasonable detail, accurately and fairly reflect the transac ons and disposi ons of the assets of the company; (ii) provide reasonable assurance that transac ons are recorded as necessary to permit prepara on of financial statements in accordance with generally accepted accoun ng principles, and that receipts and expenditures of the company are being made only in accordance with authoriza ons of management and directors of the company; and (iii) provide reasonable assurance regarding preven on or mely detec on of unauthorized acquisi on, use, or disposi on of the company's assets that could have a material effect on the financial statements.
INHERENT LIMITATIONS OF INTERNAL FINANCIAL CONTROLS OVER FINANCIAL REPORTING
Because of the inherent limita ons of internal financial controls over financial repor ng, including the possibility of collusion or improper management override of controls, material misstatements due to error or fraud may occur and not be detected.
Also, projec ons of any evalua on of the internal financial controls over financial repor ng to future periods are subject to the risk that the internal financial control over financial repor ng may become inadequate because of changes condi ons, or that the degree of compliance with the policies or procedures may deteriorate.
Consolidated Statement of Profit & Loss for the year ended 31st March, 2017 Annual Report 2016-17
8989
OPINION
In our opinion, the Holding Company and its subsidiary companies, which are companies incorporated in India, have, in all material respects, an adequate internal financial controls over financial repor ng and such internal financial controls over financial repor ng were opera ng effec vely as at March 31, 2017, based on the internal control over financial repor ng criteria established by the Company considering the essen al components of internal control stated in the Guidance Note on Audit of Internal Financial Controls Over Financial Repor ng issued by the ICAI.
OTHER MATTERS
Our aforesaid report under sec on 143(3)(1) of the Act on the adequacy and opera ng effec veness of the Internal Financial Control Over Financial Repor ng insofar as it relates to eight Subsidiary Companies & four Joint Ventures, which are companies incorporated in India. Our opinion is not qualified in respect of this ma er.
For SRB & AssociatesChartered Accountants
Firm Registra on No-310009E
Bisworanjan SutarKolkata, Partner30th June 2017 Membership No: 066708

Annual Report 2016-17 Consolidated Balance Sheet as at 31st March, 2017
90
As per our Report of even date a achedFor SRB & AssociatesChartered Accountants (F. Regd. No.310009E)
Bisworanjan Sutar(Partner)Membership No. - 066708Kolkata, The 30th day of June, 2017
For and on behalf of the Board
Manoj Toshniwal Ramesh Chandra Bardia Managing Director Jt. Managing Director DIN : 00022787 DIN : 00374148
Arun Kumar Kedia Sumit Kumar Surana Chief Financial Officer Company Secretary
Yamini MoreVP (Finance & Accounts)
(` in lacs)
Par culars Note No.
As at 31st March, 2017
As at 31st March, 2016
As at 1st April, 2015
I. ASSETS1. Non-current Assets
a. Property,Plant and Equipment 2 35,154.99 25,332.08 26,256.01b. Capital Work-in-Progress 2 226.85 553.00 3,648.96c. Goodwill on Consolidation 1,238.91 3,456.44 3,124.08 d. Other Intangible Assets 2 513.96 5,343.94 1,961.80 e. Financial Assets
(i) Investments 3(i) 7,898.57 11,480.54 233.49 (ii) Trade Receivables 4(i) 3,289.36 2,593.69 2,099.59 (iii)Other Financial Assets 5(i) 3.62 3.62 3.18
f. Other Assets 6(i) 4,043.20 5,173.43 2,059.58 2. Current Assets
a. Inventories 8 13,965.00 17,714.24 16,988.79 b. Financial Assets -
(i) Trade Receivables 4(ii) 2,34,671.73 2,31,377.16 1,64,913.22 (ii) Cash & Cash Equivalent 9 5,828.48 4,586.63 2,483.54 (iii) Other Financial Assets 5(ii) 15,008.22 13,678.67 9,640.11
c. Other Assets 6(ii) 1,43,455.63 1,34,119.43 1,04,332.02 TOTAL ASSETS 4,65,298.52 4,55,412.87 3,37,744.36
II. EQUITY AND LIABILITIES1. Equity
a. Equity Share Capital 10 4,833.50 4,700.00 3,700.00 b. Other Equity 11 1,01,161.41 79,435.41 61,073.82 Attributable to owners of EMC Limited 1,05,994.91 84,135.41 64773.82Non Controlling Interest 380.47 404.04 218.17
2. Non-current liabilitiesa. Financial Liabilities
(i) Borrowings 12(i) 31,918.02 39,911.21 29,635.83 (ii) Trade Payables 13(i) 6,100.18 4,829.85 5,733.15 (iii) Other Financial Liabilities 14(i) 24,497.41 23,136.04 12,682.92
b. Deferred Tax Liabilities (net) 7 19,294.19 11,417.38 119.65 3. Current liabilities
a. Financial Liabilities(i) Borrowings 12(ii) 77,449.16 78,676.07 61,155.80 (ii) Trade Payables 13(ii) 1,61,664.44 1,81,630.71 1,37,441.15 (iii) Other Financial Liabilities 14 (ii) 34,471.15 25,987.98 18,135.03
b. Provisions 15 195.11 169.23 229.39 c. Other Liabilities 16 3,159.33 5,059.24 1,381.65 d. Current Tax Liability (net) 17 174.15 55.71 6,237.79
TOTAL EQUITY AND LIABILITIES 4,65,298.52 4,55,412.87 3,37,744.36 Significant Accounting Policies 1Notes form an integral part of Consolidated Financial Statements 2 to 46

Consolidated Statement of Profit & Loss for the year ended 31st March, 2017 Annual Report 2016-17
91
As per our Report of even date a achedFor SRB & AssociatesChartered Accountants (F. Regd. No.310009E)
Bisworanjan Sutar(Partner)Membership No. - 066708Kolkata, The 30th day of June, 2017
For and on behalf of the Board
Manoj Toshniwal Ramesh Chandra Bardia Managing Director Jt. Managing Director DIN : 00022787 DIN : 00374148
Arun Kumar Kedia Sumit Kumar Surana Chief Financial Officer Company Secretary
Yamini MoreVP (Finance & Accounts)
(` in lacs)
Par culars Note No. 31st March, 2017 31st March, 2016 INCOMEI. Revenue from Opera ons 18 5,35,686.61 5,16,263.46 II. Other Income 19 2,694.16 3,693.84
Total Income 5,38,380.77 5,19,957.30 III. EXPENSES
(a) Cost of Materials Consumed 20 4,07,209.51 3,92,853.94 (b) Change in Inventory (Increase)/Decrease 21 2,715.36 421.97 (c) Manufacturing and Processing Costs 22 40,571.88 42,810.37 (d) Employee Benefit Expenses 23 13,451.67 14,665.52 (e) Finance cost 24 21,810.80 18,963.39 (f) Deprecia on and Amor za on expenses 25 2,600.52 2,814.64 (g) Other Expenses 26 23,685.96 21,554.19 Total Expenses 5,12,045.70 4,94,084.02
IV. Share of Net Profit of Joint Ventures accounted under Equity Method
(135.98) 224.22
V. Profit Before excep onal items and tax 26,199.09 26,097.50 Excep onal items - -
VI. Profit before Taxes 26,199.09 26,097.50 VII. Tax Expenses 27
(a) Current Tax 1,377.61 1,754.52 (b) Deferred Tax 7,666.57 6,707.47
VIII. Profit (Loss) for the Year 17,154.91 17,635.51 IX. Other Comprehensive Income
(i) Items that will not be reclassified subsequently to profit or loss:(a) Changes in investments in equity shares carried at Fair Value through OCI
(3,469.66) (3,429.28)
(b) Re-measurement of defined employee benefit plans 16.63 (10.01)(c) Revalua on Surplus on Property, Plant & Equipment 10,237.53 - (d) Income tax effect - on Revalua on Surplus on Property, Plant & Equipment (201.01) - - on Re-measurement of defined employee benefit plans (9.22) 3.47 (ii) Items that will be reclassified subsequently to profit or loss :(a) Exchange differences in transla ng the financial statements of foreign opera ons
(568.40) 1,507.04
(b) Income tax effect - -X. Total Other comprehensive Income a er tax 6,005.87 (1,928.79)XI. Total comprehensive income for the period 23,160.78 15,706.73
Profit for the periodA ributable to :-Owners of EMC Limited 17,177.98 17,649.19 Non - Controlling Interest (23.07) (13.67) Total comprehensive income for the periodA ributable to :-Owners of EMC Limited 23,190.84 15,732.60 Non - Controlling Interest (30.06) (25.87)
XII. Earnings per equity share:(1) Basic (in `) 32 36.55 38.80 (2) Diluted (in `) 32 36.55 38.80 Significant Accoun ng Policies 1Notes form an integral part of Consolidated Financial Statements 2 to 46

Annual Report 2016-17 Consolidated Statement of Changes in Equity for the year ended 31st March, 2017
92
A. Equity Share Capital (` in lacs)
Par culars AmountAs at 1 April 2015 3,700.00 Changes in equity share capital 1,000.00 As at 31 March 2016 4,700.00 Changes in equity share capital 133.50 As at 31 March 2017 4,833.50
B. Other Equity (` in lacs)
Par culars Reserves & Surplus Other Comprehensive Income A ributable to owners
of EMC Limited
Non - Controlling
Interest
Total other equity
Share Applica on
Money
Equity Component
of Debt Instrument
Capital Reserve on
Consolida on
Securi es Premium Reserve
Retained Earnings
Statutory Reserve
FVOCI-equity
investments
Revalua on Surplus
Foreign Currency
Transla on Reserve
Balance at 1 April 2015 12,500.00 - 18.44 7,300.00 40,193.44 1,277.98 2.14 - - 61,073.83 218.17 61,292.00 Profit for the year - - - - 17,635.52 - - - - 17,649.19 (13.67) 17,635.52 Other comprehensive income - - - - (6.55) - (3,429.28) - 1,507.04 (1,916.59) (12.20) (1,928.79)Total comprehensive income for the year
- - - - 17,628.97 - (3,429.28) - 1,507.04 15,732.60 (25.87) 15,706.73
Other Adjustments - 2,500.00 - - 1,689.98 (115.67) - - - 4,074.31 - 4,074.31 Issue of equity shares (12,500.00) - - 11,500.00 - - - - - (1,000.00) - (1,000.00)Dividends paid - - - - (445.32) - - - - (445.32) - (445.32) Transac on with Non - Controlling Interest
- - - - 211.74 - - - - - 211.74 211.74
Balance at 31 March 2016 - 2,500.00 18.44 18,800.00 59,278.81 1,162.31 (3,427.14) - 1,507.04 79,435.41 404.04 79,839.45 Profit for the year - - - - 17,154.91 - - - - 17,177.98 (23.07) 17,154.91 Other comprehensive income - - - - 7.41 - (3,469.66) 10,036.51 (568.40) 6,012.86 (6.99) 6,005.87 Total comprehensive income for the year
- - - - 17,162.32 - (3,469.66) 10,036.51 (568.40) 23,190.84 (30.06) 23,160.78
Other Adjustments - 3.13 69.13 - (1,397.11) - - - - (1,331.34) 6.48 (1,324.86)Issue of equity shares - (2,503.13) - 2,369.63 - - - - - (133.50) - (133.50)Balance at 31 March 2017 - - 87.56 21,169.63 75,044.02 1,162.31 (6,896.80) 10,036.51 938.64 1,01,161.41 380.47 1,01,541.88
As per our Report of even date a achedFor SRB & AssociatesChartered Accountants (F. Regd. No.310009E)
Bisworanjan Sutar(Partner)Membership No. - 066708Kolkata, The 30th day of June, 2017
For and on behalf of the Board
Manoj Toshniwal Ramesh Chandra Bardia Managing Director Jt. Managing Director DIN : 00022787 DIN : 00374148
Arun Kumar Kedia Sumit Kumar Surana Chief Financial Officer Company Secretary
Yamini MoreVP (Finance & Accounts)

Consolidated Cash Flow Statement for the year ended 31st March, 2017 Annual Report 2016-17
93
(` in lacs)
Par culars Year Ended31st March, 2017
Year Ended31st March, 2016
A OPERATING ACTIVITIESProfit before tax from con nuing opera ons 26,199.10 26,097.52 Profit/(loss) before tax from discon nuing opera ons - - Profit before tax 26,199.10 26,097.52 Adjustment to reconcile profit before tax opera ng cash flows:Deprecia on on Property,plant and equipment 2,409.09 2,571.29 Amor sa on of intangible assets 191.43 243.35 Transla on Loss 88.01 (138.84)Finance income (including fair value change in financial instruments) (1,135.58) (972.81)Finance costs (including fair value change in financial instruments) 21,810.80 18,963.39 Share of (profit)/losses of Joint Ventures 135.96 (224.24) Other Non Cash Adjustment 16.48 -Foreign Currency Transla on Difference (568.40) 1,507.04 Changes in Opera ng Assets and Liabili esDecrease/(Increase) in Trade receivables (3,990.25) (66,958.05) Decrease/(Increase) in Deriva ve Financial Assets 51.94 (31.27) Decrease/(Increase) in Inventories 3,749.23 (725.44) Decrease/(Increase) in Other Assets (6,092.94) (33,094.78) (Decrease)/Increase in Trade Payables (18,695.94) 43,286.27 (Decrease)/Increase in Other Financial Liability 9,844.54 18,306.06 (Decrease)/Increase in Other Liability (1,857.40) 3,607.42
32,156.09 12,436.92 Income tax paid 1,259.17 3,342.89 NET CASH (USED)/GENERATED BY OPERATING ACTIVITIES (A) 30,896.91 9,094.03
B INVESTING ACTIVITIESPurchase of property, plant and equipment (1,994.44) (1,647.37)Purchase of Intangible Assets 4,638.54 (3,625.49)Purchase of Capital Work In Progress 326.14 3,095.97 (Purchase)/Sale of Investments (23.65) (14,452.09)Interest received (finance income) 1,135.58 972.81 NET CASH (USED)/GENERATED IN INVESTING ACTIVITIES (B) 4,082.18 (15,656.17)
C FINANCING ACTIVITIESProceeds from issue of equity shares 2,503.13 - Changes in Other Equity (3,827.98) 4,286.05 Interest paid (21,810.80) (18,963.39)Proceeds/(Repayment) from borrowings (9,220.09) 27,795.64 Dividends paid including Dividend Distribu on Tax - (445)NET CASH (USED)/GENERATED IN FINANCING ACTIVITIES (C) (32,355.75) 12,672.98 Net increase in cash and cash equivalents (A+B+C) 2,623.34 6,110.84 Cash and cash equivalents at the beginning of the year 18,216.99 12,106.15 Cash and cash equivalents at year end 20,840.33 18,216.99
The above cashflow statement has been prepared under the “Indirect method” set out in Ind AS 7 “ Statement of Cash flows”As per our Report of even date a achedFor SRB & AssociatesChartered Accountants (F. Regd. No.310009E)
Bisworanjan Sutar(Partner)Membership No. - 066708Kolkata, The 30th day of June, 2017
For and on behalf of the Board
Manoj Toshniwal Ramesh Chandra Bardia Managing Director Jt. Managing Director DIN : 00022787 DIN : 00374148
Arun Kumar Kedia Sumit Kumar Surana Chief Financial Officer Company Secretary
Yamini MoreVP (Finance & Accounts)

94
Annual Report 2016-17 Significant Accoun ng Policies
94
NOTE 1 SIGNIFICANT ACCOUNTING POLICIES
A) Basis of prepara on :
i) Compliance with Ind AS :
The financial statements comply in all material aspects with Indian Accoun ng Standards (Ind AS) no fied under Sec on 133 of the Companies Act, 2013 (the Act), read with Companies (Indian Accoun ng Standards) Rules, 2015 and other relevant provisions of the Act.
The financial statements up to year ended 31 March, 2016 were prepared in accordance with the accoun ng standards no fied under Companies (Accoun ng Standard) Rules, 2006 (as amended) and other relevant provisions of the Act.
These financial statements are the first financial statements under Ind AS. Refer to note no.45 for an explana on of how the transi on from previous GAAP to Ind AS has affected the company’s financial posi on, financial performance and net cash flows.
ii) Historical cost conven on :
The financial statements have been prepared under the historical cost conven on, except for the following asset and liabili es which have been measured at fair value:
a) Certain financial assets and liabili es (including deriva ves).
b) Net Defined Obliga ons.
iii) Current and Non-Current Classifica on :
All assets and liabili es have been classified as current and non-current as per the company’s opera ng cycle and other criteria set out in the Schedule III to the Companies Act, 2013. The company has ascertained its opera ng cycle as 12 months for the purpose of current and non-current classifica ons.
B) Principles of Consolida on and Equity Accoun ng
The Consolidated Financial Statements consist of EMC Limited (“the Company”) , its subsidiary companies and Joint ventures (collec vely referred to as “the Group”). The Consolidated Financial Statements have been prepared on the following basis:
i) Subsidiaries
Subsidiaries are all en es over which the group has control. The group controls an en ty when the group is exposed to or has rights to variable returns from con nuous involvement with the en ty and has ability to affect those returns through its power to direct the relevant ac vi es of the eni ty. Subsidiaries are fully consolidated from the date on which control is transferred to the group. They are deconsolidated from the date on which control ceases.
The group consolidates the financial statements of the parent and its subsidiaries by adding line by line together like items of assets, liabili es, equity, income and expenses. Intercompany balances, transac ons and unrealized gains or losses on transac ons between the group companies are eliminated. Accoun ng policies of subsidiaries have been changed and realigned wherever necessary to ensure consistency with the policies adopted by the group.
Non-controlling Interest in the results and equity of subsidiaries are shown separately in the consolidated statement of profit and loss, consolidated statement of changes in equity and balance sheet respec vely.
The group treats transac ons with non-controlling interests that do not result in a loss of control as transac ons with equity owners of the group. A change in ownership interest results in an adjustment between the carrying amounts of the controlling and non-controlling interest to reflect their rela ve interests in the subsidiary is recognized within equity.
ii) Joint Ventures
Interest in joint ventures are accounted using the equity method a er ini ally being recognized at cost in the consolidated financial statements.
Under the equity method of accoun ng, investments are ini ally recognized at cost and adjusted therea er to recognize the group’s share of post acquisi on profit or loss of the investee in profit and loss and the group’s share of other comprehensive income of the investee in the other comprehensive income. Dividend receivable from the joint ventures are recognized as a reduc on in the carrying amount of the investment.
Unrealized gains or losses on transac on between the group and its joint ventures are eliminated to the extent group’s interest in the en ty. Accoun ng policies of Joint Ventures have been changed and realigned wherever necessary to ensure consistency with the policies adopted by the group.
iii) Loss of Control
When the group ceases to consolidate or do equity accoun ng of an investment because of loss of control or joint control, any retained interest in the investee is measured to its fair value with the change in carrying amount recognized in the statement of profit and loss.

Notes on Consolidated Financial Statements for the year ended 31st March, 2017 Annual Report 2016-17
9595
Net Book Value As at31st March, 2017
As at31st March, 2016
As at1st April, 2015
NOTE 2 PROPERTY, PLANT AND EQUIPMENT [at deemed cost]Property, Plant and Equipment 35,154.99 25,332.08 26,256.01 Capital Work-in-progress 226.85 553.00 3,648.96 Other Intangible Assets 513.96 5,343.94 1,961.80
Par culars Freehold Land
Buildings Furniture, Fi ngs
and Equipment
Plant and Machinery
Vehicles TOTAL Capital Work-in-Progress
Other Intangible
Assets
Es mated Useful Life (in years) NA 3 - 60 3 -10 2 - 40 8 -10 NA 10 Gross Carrying AmountAt 1st April, 2015 670.46 4,941.44 5,541.12 26,193.55 258.57 37,605.13 3,648.96 2,544.89 Addi ons/Adjustments during the year 83.89 231.99 197.97 209.92 81.75 805.52 13.69 3,587.36 Effect of Foreign Currency Transla on - 363.47 380.75 258.06 - 1,002.28 - 103.11 Disposals during the year - - - - - - (3,109.65) -At 31st March, 2016 754.35 5,536.90 6,119.84 26,661.53 340.32 39,412.94 553.00 6,235.34 Addi ons/Adjustments during the year 9,670.81 1,666.31 859.74 1,151.94 465.01 13,813.80 0.61 29.62 Derecognized the assets of disposed subsidiary (147.52) (435.86) (1,530.14) - (2,113.53) - (4,727.93)Effect of Foreign Currency Transla on (5.39) (270.01) (385.85) (10.53) (14.60) (686.38) - (112.56) Disposals during the year - - - - - - (326.75) -At 31st March, 2017 10,419.77 6,785.68 6,157.87 26,272.80 790.73 50,426.84 226.85 1,424.47 Accumulated Deprecia on and ImpairmentAt 1st April, 2015 2.00 1,287.03 2,099.41 7,835.78 124.90 11,349.12 - 583.09 Deprecia on charge for the year 1.89 203.91 521.66 1,811.23 32.61 2,571.29 - 243.35 Disposals/Adjustment during the year - 98.10 62.34 - - 160.44 - 64.96 At 31st March, 2016 3.89 1,589.04 2,683.41 9,647.01 157.51 14,080.87 - 891.40 Deprecia on charge for the year 5.17 187.85 511.54 1,620.04 84.49 2,409.09 - 191.43 Disposals/Adjustment during the year - (104.34) (23.26) (1,077.54) (12.93) (1,218.07) - (172.33)At 31st March,2017 9.06 1,672.53 3,171.71 10,189.50 229.07 15,271.90 - 910.51 Net Book Value as at 31st March, 2017 10,410.71 5,113.15 2,986.16 16,083.29 561.66 35,154.94 226.85 513.96 Net Book Value as at 31st March, 2016 750.46 3,947.86 3,436.43 17,014.52 182.81 25,332.08 553.00 5,343.94 Deemed cost as at 1st April, 2015 668.46 3,654.41 3,441.71 18,357.77 133.67 26,256.01 3,648.96 1,961.80
(` in lacs)
In addi on any amount previously recognized in other comprehensive income in respect of the en ty are accounted for as if the group had directly disposed of the related assets or liabili es.
iv) Foreign Opera on
The result and financial posi on of foreign opera ons (none of which has the currency of a hyperinfla onary economy ) that have a func onal currency different from the presenta on currency are translated into the presenta on currency as follows:-
i) Assets and liabili es are translated at closing rate at the date of balance sheet.
ii) Income and expenses are translated at average exchange rates and
iii) All resul ng exchange differences are recognized in other comprehensive income.
When a foreign opera on is sold, the associated exchange differences are reclassified to profit or loss as a part of the gain or loss on sale of investment.
Goodwill and fair value adjustments arising on the acquisi on of foreign opera on are treated as assets and liabili es of the foreign opera on and translated at the closing rate.
C) Other Significant accoun ng policies
These are set out under “ Significant Accoun ng Policies, Recent Accoun ng Pronouncement and Cri cal Es mates and Judgements” as given in the Company’s separate financial statements.

Annual Report 2016-17 Notes on Consolidated Financial Statements for the year ended 31st March, 2017
96
Par culars As at 31st March, 2017
As at 31st March, 2016
As at 1st April, 2015
NOTE 3 INVESTMENTSInvestment in Equity InstrumentsQuoted at FVTOCI3,878 (31 March 2016: 3,878, 1 April 2015 : 3,878) Shares of ` 10/- each fully paid-up in Powergrid Corpora on of India Ltd.
7.65 5.39 5.63
1,42,87,689 (31 March 2016: 1,42,87,689) Shares of ̀ 10/- each fully paid in McNally Bharat Engineering Ltd
7,386.74 10,858.64 -
(65,36,722 Shares out of 1,42,87,689 is pledged)Unquoted at Cost Nil (31 March 2016: 2,500, 31 March 2015: 2,500) Shares of ` 10/- each fully paid in EMC Infrastructure Ltd.
- 0.25 0.25
Joint Ventures (Carrying amount determined using the equity method of accoun ng) Indian Joint VenturesInvestment in BCPL - EMC - JV 2.45 2.45 2.45 Add: Share of profit/(Losses) upto 31.03.2017 34.82 61.83 74.46 Investment in EMC - BCPL - JV - - - Add: Share of profit/(Losses) upto 31.03.2017 68.11 60.73 48.12 Investment in EMC - BCPL - SUBIR JV - - - Add: Share of profit/(Losses) upto 31.03.2017 95.07 77.90 38.96 Investment in Fedders - EMC - Quatro JV - - - Add: Share of profit/(Losses) upto 31.03.2017 133.41 248.94 63.62 Foreign Joint Ventures87,500 (31 March 2016 : 87500) shares of OMR 1/ each fully paid up in EMC MBE Contrac ng Co. LLC
151.97 151.97 -
Add: Share of profit/(Losses) upto 31.03.2017 (17.98) - -Investment in Structured En ty36,013 Shares of ` 10/- each fully paid in McNally Sayaji Engineering Ltd 24.88 - - Tecnolines Makedonjia Doel 10.41 11.31 -Tecnolines Czech 1.04 1.13 -Total 7,898.57 11,480.54 233.49 i) Non-current 7,898.57 11,480.54 233.49 ii) Current - - - Aggregate cost price of quoted shares 14,291.18 14,291.18 3.49 Aggregate market value of quoted shares 7,394.38 10,864.04 5.63
(` in lacs)

Notes on Consolidated Financial Statements for the year ended 31st March, 2017 Annual Report 2016-17
97
Par culars As at 31st March, 2017
As at 31st March, 2016
As at 1st April, 2015
NOTE 4 TRADE RECEIVABLESSecured,considered goodi) Non-Current 3,289.36 2,593.69 2,099.59 Sub Total 3,289.36 2,593.69 2,099.59 ii) Current 2,39,811.03 2,37,070.49 1,69,365.62 Less: Impairment loss/(Gain) on financial assets (5,139.30) (5,693.33) (4,452.40) Sub Total 2,34,671.73 2,31,377.16 1,64,913.22 Total 2,37,961.09 2,33,970.85 1,67,012.81
No trade receivables or other receivables are due from directors or other officers of the company either severally or jointly with any other person. Nor any trade or other receivable are due from firms or private companies respec vely in which any director is a partner, a director or a member.
Trade receivables are non-interest bearing and are generally on terms of 90 to 150 days.
Par culars As at 31st March, 2017
As at 31st March, 2016
As at 1st April, 2015
NOTE 5 OTHER FINANCIAL ASSETSi) Non-CurrentDeriva ve Financial AssetOther bank balances* 3.62 3.62 3.18 Sub Total 3.62 3.62 3.18 ii) CurrentDeriva ve Financial Asset - 51.94 20.68 Other bank balances* 15,008.22 13,626.74 9,619.43 Sub Total 15,008.22 13,678.67 9,640.11 Total 15,011.84 13,682.29 9,643.29 *Details of other balances with banksEarmarked Balances with Banks 3.62 3.62 3.18 Term Deposits with Bank 31.25 - - Margin money,guarantee and security with banks* 14,976.97 13,626.74 9,619.43 Total 15,011.84 13,630.36 9,622.61 *The margin money, guarantee and security with banks includes deposits held as collateral Security.
Par culars As at 31st March, 2017
As at 31st March, 2016
As at 1st April, 2015
NOTE 6 OTHER ASSETSi) Non-CurrentAdvance Sales Tax 1,566.78 1,308.96 968.82 Other Loan and advances - 2,150.07 - Prepaid Expenses 1,073.79 643.35 268.97 Security Deposits 1,402.63 1,071.05 821.79 Sub Total 4,043.20 5,173.43 2,059.58 ii) CurrentAdvance to related par es 29.35 1.33 11.58 Advance to Employees 85.98 180.46 113.95 Advance to Statutory payment 726.40 532.85 896.66 Advance to Suppliers/Others 1,36,574.59 1,28,703.14 1,00,004.93 Prepaid Expenses and Other Deposits 5,515.80 4,066.21 2,711.02 Security Deposits 523.51 635.44 593.87 Sub Total 1,43,455.63 1,34,119.43 1,04,332.02 Total 1,47,498.83 1,39,292.86 1,06,391.60
(` in lacs)

Annual Report 2016-17 Notes on Consolidated Financial Statements for the year ended 31st March, 2017
98
Par culars As at 31st March, 2017
As at 31st March, 2016
As at 1st April, 2015
NOTE 7 DEFERRED TAX ASSETS /LIABILITIES NETThe balance comprises temporary differences a ributable to:Property, plant and equipment 2,438.69 1,934.27 1,613.28 Intangible Assets 9.09 6.42 6.36 Employee Benefit Obliga on 7.07 33.33 13.38 Reten on Money/Price Varia on Receivable 18,613.34 11,413.71 - Impairment loss/(gain) on financial assets (1,774.01) (1,970.35) (1,513.37) Total 19,294.19 11,417.38 119.65
Par culars As at 31st March, 2017
As at 31st March, 2016
As at 1st April, 2015
NOTE 8 INVENTORIESa) Raw Materials 801.44 854.75 1,109.56 b) Stores, Loose Tools and Spares (including goods in transit) 1,476.13 1,164.40 1,162.16 c) Semi Finished Goods 547.43 1,158.51 1,396.33 d) Finished Goods 1,825.14 4,103.92 7,258.56 e) Construc on work in Progress 9,299.72 10,395.61 6,004.74 f) Scrap 15.14 37.05 57.44 Total 13,965.00 17,714.24 16,988.79
Refer Significant accoun ng policy for mode of valua on.
Par culars As at 31st March, 2017
As at 31st March, 2016
As at 1st April, 2015
NOTE 9 CASH AND CASH EQUIVALENTSi) Cash at Bank 20,624.21 17,624.96 11,846.89 ii) Cash in Hand 139.24 329.07 124.04 iii) Cheques in Hand 76.87 262.96 135.22 Less: Bank overdra - - - Sub Total 20,840.32 18,216.99 12,106.15 Less: Balances with bank other than above 15,011.84 13,630.36 9,622.61 Total 5,828.48 4,586.63 2,483.54 Specified Bank Note Disclosure (SBNs)In accordance with the MCA no fica on G.S.R.308E dated 30th March,2017 details of Specified Bank Note(SBN) and Other Denomina on Notes (ODN) held and transacted during the period from 8th November, 2016 to 30th December, 2016 are given below:
Par culars SBNs ODNs TOTAL Closing cash on hand as on November 8, 2016 245.44 104.82 350.26 (+) Non permi ed receipts - - - (+) Permi ed receipts 3.70 179.43 183.13 (-) Permi ed payments 100.07 131.61 231.68 (-) Amounts Deposited in Banks 149.07 - 149.07 Closing cash on hand as on December 30, 2016 - 152.64 152.64
(` in lacs)

Notes on Consolidated Financial Statements for the year ended 31st March, 2017 Annual Report 2016-17
99
Par culars As at 31st March, 2017
As at 31st March, 2016
As at 1st April, 2015
NOTE 10 SHARE CAPITALEquity Share Capitala) Authorised7,50,00,000 Nos of Equity shares of ` 10/- each 7,500.00 7,500.00 7,500.00
7,500.00 7,500.00 7,500.00b) Issued, Subscribed and Paid UpEquity Shares:4,83,35,000 Nos of shares of ` 10/- each fully paid up 4,833.50 4,700.00 3,700.00 (2015-2016: 4,70,00,000 Nos of shares of ` 10/- each fully paid up)(2014-2015: 3,70,00,000 Nos of shares of ` 10/- each fully paid up)Total 4,833.50 4,700.00 3,700.00 c) Reconcilia on of number of equity shares are set out below:
a) Shares outstanding at the beginning of the financial year 470.00 370.00 370.00 b) Issued during the year 13.35 100.00 - c) Shares forfeited/brought back/cancelled during the year - - - d) Shares outstanding at the end of the financial year 483.35 470.00 370.00
d) Details of shareholders holding more than 5% of shares
Name of the Shareholders As at31st March, 2017
As at31st March, 2016
As at1st April, 2015
% held No.of Shares % held No.of Shares % held No.of Shares i) MKN Investments Private Limited 21.38% 1,03,35,314 29.79% 1,40,00,314 10.81% 40,00,014 ii) YMS Finance Private Limited 12.50% 60,40,001 12.85% 60,40,001 16.32% 60,40,001 iii) Trinetra Electronics Limited 5.07% 24,48,528 5.21% 24,48,528 6.62% 24,48,528 iv) Tamkore Investments Private Limited 4.97% 24,00,000 5.11% 24,00,000 6.49% 24,00,000 v) Metalind Private Limited 5.90% 28,50,000 6.06% 28,50,000 7.70% 28,50,000 vi) Subhas Impex Private Limited 7.14% 34,53,252 7.35% 34,53,252 9.33% 34,53,252 vii) Mr. Vinod Dugar 9.35% 45,17,644 9.19% 43,18,624 11.67% 43,18,624 viii) Ms. Sheetal Dugar 9.16% 44,29,145 9.42% 44,29,145 11.97% 44,29,145
e) The Company has a single class of Equity shares. Accordingly, all equity shares rank equally with regard to dividend and share in the company’s residual assets.
f) For the period of five years immediately preceding the date at which the balance sheet is prepared, the company has not :-
i) Issued class of shares allo ed as fully paid up by way of bonus shares; and
ii) Bought back any shares.
g) For the period of five years immediately preceding the date at which the balance sheet is prepared, the company has issued the following equity shares for considera on other than cash.
Name of Allotee AllotmentDate
No.of Shares Face Value Amountincluding premium per share
MKN Investment Pvt Ltd. 30.03.2013 40,00,000 10.00 125.00MKN Investment Pvt Ltd. 25.05.2015 1,00,00,000 10.00 125.00MKN Investment Pvt Ltd. 30.03.2017 13,35,000 10.00 187.50Total : 1,53,35,000
(` in lacs)

Annual Report 2016-17 Notes on Consolidated Financial Statements for the year ended 31st March, 2017
100
Par culars As at 31st March, 2017
As at 31st March, 2016
As at 1st April, 2015
NOTE 11 OTHER EQUITY a) Share Applica on Money - - 12,500.00Sub Total - - 12,500.00 b) Equity Component of debt InstrumentOpening Balance 2,500.00 - -Add: Addi on during the Year 3.13 2,500.00 -Less: Issued during the year (2,503.13) - -Sub Total - 2,500.00 - This represents mandatorily conver ble loan from MKN Investment Pvt Ltd. The company has computed the equity and debt component in accordance with IND AS 109 whereas the value of debt component is Nil.c) Capital Reserve on Consolida onOpening Balance 18.44 18.44 32.96 Add: Addi ons during the year 69.13 - -Less: Transferred to Retained Earnings - - (14.52)Sub Total 87.56 18.44 18.44 d) Securi es PremiumOpening Balance 18,800.00 7,300.00 7,300.00 Add: Addi ons during the year 2,369.63 11,500.00 - Sub Total 21,169.63 18,800.00 7,300.00 e) Revalua on ReserveOpening Balance - - 27.50 Add: Received During the Year 10,036.51 - - Less: Transferred to Retained Earnings - - (27.50)Sub Total 10,036.51 - - f) Reserve for Investments at Fair Value through OCIOpening Balance (3,427.14) 2.14 - Add: Net fair value gain/(loss) on investments during the period (3,469.66) (3,429.28) 2.14 Sub Total (6,896.80) (3,427.14) 2.14 g) Retained EarningsOpening Balance 59,278.81 40,193.44 43,229.63 Add: Profit/(Loss) during the year 17,154.91 17,635.52 -Add: Re-measurement of defined employee benefit plans through OCI 7.41 (6.55) -Add: Adjustment for earlier years - 1,574.31 -Less: Transac on on cease of control in Subsidiary (1,213.98) - -Add: Transac on with Non - Controlling Interest (183.13) 211.74 -Add: Profit for the Joint venture - - 225.15 Less: Deferred Tax liability / (Assets) on Transi on date - - 1,347.35 Less: Impairment loss on financial assets - - (4,452.40)Less: Final dividend - (370.00) 370.00 Less: Dividend Distribu on Tax - (75.32) 75.32 Less: Transfer from Revalua on Reserve - - 27.50 Less: Transfer from Capital Reserve - - 14.52 Less: Transfer from Forfeiture reserve Account - - 0.51 Less: Transfer from Foreign currency transla on reserve - - (560.33)Less: Transfer from Statutory & Other Reserves - 115.67 (83.82)Sub Total 75,044.02 59,278.81 40,193.43
(` in lacs)

Notes on Consolidated Financial Statements for the year ended 31st March, 2017 Annual Report 2016-17
101
Par culars As at 31st March, 2017
As at 31st March, 2016
As at 1st April, 2015
h) Foreign currency transla on reserveOpening Balance 1,507.04 - (560.33)Add: Addi ons during the year (568.40) -Less:Transferred to Retained Earnings - 1,507.04 560.33 Sub Total 938.64 1,507.04 - i) Statutory & Other Reserves*Opening Balance 1,162.31 1,277.98 1,277.98 Less: Transferred to Retained Earnings - (115.67) - Sub Total 1,162.31 1,162.31 1,277.98 * Reserve created to compliant with overseas statutory requirementj) Forfeiture Reserve AccountOpening Balance - - 0.51 Less:Transferred to Retained Earnings - - (0.51)Sub Total - - - Grand Total 1,01,541.88 79,839.45 61,291.99
Par culars As at 31st March, 2017
As at 31st March, 2016
As at 1st April, 2015
NOTE 12 BORROWINGSi) Non-Current BorrowingsSecured Loana) Term Loan From Banks 10,790.83 11,295.66 8,010.77b) Term Loan From others 14,545.09 554.84 604.84 c) Financial Lease Obliga ons 251.43 4.07 20.21 Unsecured Loan Loans from Bank 1,664.00 3,332.00 - Loan from Others 4,666.67 24,724.64 21,000.00 Total non-current borrowings 31,918.02 39,911.21 29,635.83ii) Current BorrowingsCash Credit 77,449.16 78,676.07 61,155.80Current maturi es of long term Borrowings 15,123.26 9,940.13 5,126.30Sub Total 92,572.42 88,616.19 66,282.10Less : Amount clubbed under Other Financial Liability 15,123.26 9,940.13 5,126.30Total current borrowings 77,449.16 78,676.07 61,155.79Net Borrowings 1,09,367.18 1,18,587.27 90,791.61
Notes :
1) Term Loans from Punjab Na onal Bank and Oriental Bank of Commerce are secured by way of crea on of charge ranking Parri Passu on the movable and immovable assets of Solar Power Project. The loans are further secured by personal guarantees of some of the Directors of the Company.
2) Term Loans from Punjab Na onal Bank & Oriental Bank of Commerce are Repayable over 35 Quarterly Installments commencing from the quarter ending October 2012 and bears an Interest rate of 5 year MCLR + 2.95% from PNB & BR + 2.25% from OBC.
3) Loan from Govt. of West Bengal is secured by way of Pari Passu charge ranking next only to the charges in favour of financial ins -tu ons / Banks , on the fixed assets of the company, both present as well as future. The Loan is repayable in fourteen equal annual installments (excluding interest) star ng from 31st March, 2013.The Loan carries interest of 8.75% p.a with a rebate of 2% p.a for
mely repayment. Interest is paid as and when due.
4) Vehicle loans are secured by way of mortgage of vehicles. The loans are repayable by April 2021.
5) Term Loan from Karur Vysya Bank is secured by way of crea on of Mortgage on the commercial space being purchased by the com-pany. The loans are further secured by personal guarantees of some of the Directors of the Company. The loan is repayable in 19 quarterly installments commencing from quarter ending March’16 and bears an interest rate of BR + 2.25%.
(` in lacs)

Annual Report 2016-17 Notes on Consolidated Financial Statements for the year ended 31st March, 2017
102
6) Unsecured Term Loan from banks (to the tune of ` 50 crores) was taken during the FY 15-16, its repayment started from the quarter ending June 2016-2017 and bears an interest rate of BR + 2.30%.
7) Secured Term Loan from others (to the tune of ` 200 crores) was taken during the FY 15-16, its repayment started from the quarter ending Sep 2016-2017 and bears an interest rate of BR + 3.00% . It is secured by way of pledge of shares of McNally Bharat Engineer-ing Co. Ltd by EMC Ltd.
8) Unsecured Term Loan from others (to the tune of ` 100 crores) was taken during the FY 15- 16, its repayment started from the quar-ter ending June 2016-2017 and bears an interest rate of BR + 3.00% .
9) Foreign Term Loans related to Foreign subsidiaries are secured by the Guarantees given by Holding company.
10) Bank Loan In Technolines from Cariparma Credit Agricole and Abanca Espanol is secured by collaterals on the company’s building in Pordenone and its subsidiary’s building in Spain respec vely.
11) Bank Loans in Asc Inc. is secured by collateral on the company’s tangible assets.
12) Working Capital Facili es are secured by way of :
i) Hypotheca on on Pari Passu basis with the Working Capital Banks of EMC Limited on the en re Stock in Trade, Book Debts and any other current assets of the company, both present and future excluding OBC’s Share of charge in receivable and proceeds in bank account related to Solar Power Project at Naini, Allahabad.
ii) First charge on the en re immovable and movable Fixed Assets of EMC Limited and equitable mortgage on Landed proper es of the Company at Naini (Allahabad) excluding OBC’s share on Solar Power equipments and equipment purchased through equip-ment Loan present and future.
iii) Personal guarantees of some of the Directors of EMC Limited. (` in lacs)
Par culars As at31st March, 2017
As at31st March, 2016
As at1st April, 2015
NOTE 13 TRADE PAYABLESi) Non-Current 6,100.18 4,829.85 5,733.15 Sub Total 6,100.18 4,829.85 5,733.15 ii) Current 1,61,664.44 1,81,630.71 1,37,441.15 Sub Total 1,61,664.44 1,81,630.71 1,37,441.15 Grand Total 1,67,764.62 1,86,460.56 1,43,174.30
Par culars As at31st March, 2017
As at31st March, 2016
As at1st April, 2015
NOTE 14 OTHER FINANCIAL LIABILITIESi) Non-CurrentOther Loans & advances 24,497.41 23,136.04 12,682.92 Sub Total 24,497.41 23,136.04 12,682.92 ii) CurrentCurrent maturi es of long term borrowings 15,123.26 9,940.13 5,126.30 Other Loans & advances 17,107.21 11,502.71 9,864.51 Unpaid Dividend 3.61 3.61 3.17 Other Liabili es 2,237.07 4,541.53 3,141.04 Sub Total 34,471.15 25,987.98 18,135.02 Total 58,968.56 49,124.02 30,817.94

Notes on Consolidated Financial Statements for the year ended 31st March, 2017 Annual Report 2016-17
103
(` in lacs)
Par culars As at31st March, 2017
As at31st March, 2016
As at1st April, 2015
NOTE 15 PROVISIONSProvision for Excise duty on Closing Stock 195.11 169.23 229.39 Total 195.11 169.23 229.39
Par culars As at31st March, 2017
As at31st March, 2016
As at1st April, 2015
NOTE 16 OTHER LIABILITIESCurrent Liabili esInterest payable 1,206.86 445.20 298.39 Statutory dues 1,952.47 4,614.04 1,083.26 Total 3,159.33 5,059.24 1,381.65
Par culars As at31st March, 2017
As at31st March, 2016
As at1st April, 2015
NOTE 17 CURRENT TAX LIABILITY NETIncome tax payable 174.15 55.71 6,237.79 Total 174.15 55.71 6,237.79

Annual Report 2016-17 Notes on Consolidated Financial Statements for the year ended 31st March, 2017
104
Par culars 31st March, 2017 31st March, 2016 NOTE 18 REVENUE FROM OPERATIONSSale of Products (Including Excise Duty) 4,68,965.51 4,61,543.13 Sale of Services 66,562.54 54,552.10 Other Opera ng Revenue 158.56 168.23 Total 5,35,686.61 5,16,263.46
Par culars 31st March, 2017 31st March, 2016 NOTE 19 OTHER INCOMEInterest Income 1,135.58 972.81 Miscellaneous Income 1,558.58 2,721.03 Total 2,694.16 3,693.84
Par culars 31st March, 2017 31st March, 2016 NOTE 20 COST OF MATERIAL CONSUMEDOpening Stock 7,154.29 8,276.46 Add:Purchased during the year 4,09,246.63 3,91,731.79 Less:Closing Stock 9,191.39 7,154.29 Total 4,07,209.51 3,92,853.94 Details of materials consumedSteels 3,764.69 5,149.92 Alluminium 141.37 235.22 Zinc 568.02 894.63 Stores & Spares 408.90 482.62 Erec on & Concre ng Material 6,269.57 4,111.12 Project Purchase 3,96,029.58 3,81,932.95 Other Materials 27.40 47.49 Total 4,07,209.53 3,92,853.95
Par culars 31st March, 2017 31st March, 2016 NOTE 21 CHANGE IN INVENTORIESOpening StockFinished Goods 4,103.92 4,457.44 Semi-Finished Goods 1,158.51 1,206.57 Scrap Material 37.05 57.44 Sub Total 5,299.48 5,721.45 Less: Closing StockFinished Goods 1,825.14 4,103.92 Semi-Finished Goods 743.84 1,158.51 Scrap Material 15.14 37.05 Sub Total 2,584.12 5,299.48 INCREASE(-)/DECREASE(+) 2,715.36 421.97
Par culars 31st March, 2017 31st March, 2016 NOTE 22 MANUFACTURING AND PROCESSING COSTS
INR INR Processing / Job Charges 33,013.64 36,652.68 Freight,Carriage & Transport 5,457.83 3,549.98 Power & Fuel 360.17 628.38 Rent 849.41 1,122.72 Insurance 890.83 856.61 Total 40,571.88 42,810.37
(` in lacs)

Notes on Consolidated Financial Statements for the year ended 31st March, 2017 Annual Report 2016-17
105
Par culars 31st March, 2017 31st March, 2016 NOTE 23 EMPLOYEE BENEFIT EXPENSESSalaries, Wages & Bonus 12,593.36 13,107.88 Contribu on to Provident and other Funds 424.25 1,243.89 Workmen & Staff welfare Expenses 434.06 313.75 Total 13,451.67 14,665.52
Par culars 31st March, 2017 31st March, 2016 NOTE 24 FINANCE COSTInterest on Borrowings 16,162.20 14,325.98 Interest on finance lease obliga ons 31.58 3.54 Interest to Others* 5,617.02 4,633.87 Total 21,810.80 18,963.39
* Interest to others includes interest on other advances.
Par culars 31st March, 2017 31st March, 2016 NOTE 25 DEPRECIATION AND AMORTISATION EXPENSESDeprecia on on Property, plant and equipments 2,409.09 2,571.29 Amor sa on of intangible assets 191.43 243.35 Total 2,600.52 2,814.64
Par culars 31st March, 2017 31st March, 2016 NOTE 26 OTHER EXPENSESRepairs & Renewals:Plant & Machinery 19.99 40.47 Building 22.81 7.64 Others 128.11 263.96 Hire Charges 1,207.25 1,015.38 Travelling & Conveyance 611.55 617.13 Auditors Remunera on:Statutory Audit Fees 39.82 39.01 Internal Audit Fees 2.25 2.02 Tax Audit 0.50 0.50 Custom Duty 6.25 64.09 Excise Duty 867.46 1,187.31 Rates & Taxes 2,004.07 1,032.90 Communica on Expenses 142.58 378.32 Bank Commission and Charges 15,613.03 13,170.28 Transla on Loss 88.01 (138.84) Loss on Contract Performance 39.41 29.18 Impairment loss/(gain) on financial assets (554.04) 1,240.93 Miscellaneous Expenses (A) 3,446.91 2,603.91 Total 23,685.96 21,554.19
(` in lacs)

Annual Report 2016-17 Notes on Consolidated Financial Statements for the year ended 31st March, 2017
106
Par culars 31st March, 2017 31st March, 2016 NOTE 26 OTHER EXPENSES (Contd.)(A) Miscellaneous Expenses
Legal Charges, Lis ng & Filing Fees 143.12 136.76 Sales Promo on & Adver sement Expenses 80.06 76.79 Tes ng Charges 93.71 95.25 Computer/R&D Charges 28.89 21.93 Entertainment Expenses 28.88 29.96 General Charges 89.67 93.30 Office Up-Keep 127.71 57.02 Prin ng & Sta onery 73.80 66.83 Subscrip on & Dona on 19.67 20.62 Professional fees & Service Charges 2,215.73 1,486.21 Motor Car Expenses 18.48 14.09 Mobilisa on Expenses 101.01 99.86 Tender Fees 47.49 26.05 Others 360.35 362.05 Rebate 14.15 15.40 Recruitment Expenses 4.19 1.79 Total 3,446.91 2,603.91
NOTE 27 INCOME TAX EXPENSES
This note provides an analysis of the company’s tax expenses, show amounts that are recognised directly in equity and how the tax expenses is affected by non-assessable and non-deduc ble items. It also explains significant es mates made in rela on to the group’s tax posi on.
Par culars 31st March, 2017 31st March, 2016a) Income Tax Expenses
Current Tax :Current Tax on profits for the year 1,377.61 1,754.52 Total Current Tax Expenses 1,377.61 1,754.52 Deferred Tax :Decrease/(Increase) in deferred tax assets (35.48) 23.42 (Decrease)/Increase in deferred tax liabili es 7,702.06 11,277.78 Adjustments for deferred tax of prior periods - (4,593.72)Total Deferred tax expenses/(benefits) 7,666.57 6,707.47 Total Income Tax Expenses 9,044.18 8,461.99 Income Tax Expenses is a ributable to :Current Tax 1,377.61 1,754.54 Deferred Tax 7,666.57 6,707.47
9,044.18 8,462.01 b) Reconcilia on of tax expenses and the accoun ng profit mul plied by India's tax rate :
Profit from con nuing opera ons before income tax expenses 26,199.10 26,097.52 Tax at the Indian tax rate of 34.608% (2015-16: 34.608%) 9,066.98 9,031.84 Tax effect of amounts which are not deduc ble (taxable) in calcula ng taxable income :Deprecia on (306.09) (291.54)Reten on Money/Price Varia on (7,199.63) (6,733.17)Remeasurement of Employee Benefit Obliga on - (3.47)Impact of change in Tax rates 76.99 88.98 Effect of Non taxable Income (64.30) (614.76)Adjustments for current tax of prior periods - (67.47)Tax losses for which no deferred income tax was recognised - (0.49)Unrecognised tax losses recouped to reduce current tax expenses - (84.85)Impairment losses used to reduce deferred tax expenses (196.34) 429.46 Tax Expenses 1,377.61 1,754.54
(` in lacs)

Notes on Consolidated Financial Statements for the year ended 31st March, 2017 Annual Report 2016-17
107
Par culars As at31st March, 2017
As at31st March, 2016
As at 1st April, 2015
Through PL Through OCI Through PL Through OCI Transi onNOTE 28 MOVEMENT IN DEFERRED TAX ASSET /
LIABILITYProperty,Plant and Equipment 303.41 201.01 320.99 - 1,613.28 Intangible Assets 2.67 - 0.06 - 6.36 Employee benefit obliga on (35.48) 9.22 23.42 (3.47) 13.38 Reten on Money/Price Varia on Receivable # 7,199.63 - 6,819.99 - - Impairment loss/(gain) on financial assets 196.34 - (456.98) - (1,513.37)Impact 7,666.57 210.23 6,707.47 (3.47) 119.65
# Note: This excludes deferred tax amoun ng to ` in lacs 4,593.72 created in the Financial year 2015-16 on account of earlier year adjustments.
(All amounts in ` in Lacs, unless otherwise stated)
NOTE 29 FAIR VALUE MEASUREMENTS
i) Financial instruments by category:Par culars 31st March, 2017 31st March, 2016 1st April, 2015
FVPL FVOCI Amor sed cost
FVPL FVOCI Amor sed cost
FVPL FVOCI Amor sed cost
Financial assetsInvestments: Equity instruments (*) - 7,394.38 504.19 - 10,864.04 616.50 - 5.63 227.85 Trade receivables - - 2,37,961.09 - - 2,33,970.85 - - 1,67,012.81 Cash and cash equivalents - - 5,828.48 - - 4,586.63 - - 2,483.54 Other bank balances - - 15,011.84 - - 13,630.36 - - 9,622.61 Deriva ve financial assets - - - 51.94 - - 20.68 - - Total financial assets - 7,394.38 2,59,305.60 51.94 10,864.04 2,52,804.34 20.68 5.63 1,79,346.81 Financial liabili esBorrowings - - 1,09,367.18 - - 1,18,587.27 - - 90,791.61 Trade payables - - 1,67,764.62 - - 1,86,460.56 - - 1,43,174.30 Other financial liabili es - - 58,968.56 - - 49,124.02 - - 30,817.95 Total financial liabili es - - 3,36,100.36 - - 3,54,171.85 - - 2,64,783.86 *Includes investments in Joint Ventures accounted as per equity method as prescribed under Ind AS 28 “ Investments in Associates and Joint Ventures”.
ii) Fair value hierarchy:This sec on explains the judgements and es mates made in determining the fair values of the financial instruments that are a) recognised and measured at fair value, andb) measured at amor sed cost and for which fair values are disclosed in the financial statements.To provide an indica on about the reliability of the inputs used in determining fair value, the company has classified its financial instruments into three levels prescribed under the Ind AS 113 "Fair Value Measurements ". An explana on of each level follows underneath the table.
Financial assets and liabili es measured at fair value - recurring fair value measurements At March 31, 2017
Level 1 Level 2 Level 3 Total
Financial assetsFinancial investments at FVPL Equity instruments 7,394.38 - - 7,394.38 Deriva ves Foreign exchange forward contracts - - - -Total 7,394.38 - - 7,394.38
(` in lacs)

Annual Report 2016-17 Notes on Consolidated Financial Statements for the year ended 31st March, 2017
108
Financial assets and liabili es measured at fair value - recurring fair value measurements At March 31, 2016
Level 1 Level 2 Level 3 Total
Financial assetsFinancial investments at FVPL Equity instruments 10,864.04 - - 10,864.04 Deriva ves Foreign exchange forward contracts - 51.94 - 51.94 Total 10,864.04 51.94 - 10,915.98
Financial assets and liabili es measured at fair value - recurring fair value measurements At April 1, 2015
Level 1 Level 2 Level 3 Total
Financial assetsFinancial investments at FVPL Equity instruments 5.63 - - 5.63 Deriva ves Foreign exchange forward contracts - 20.68 - 20.68 Total 5.63 20.68 - 26.31
Level 1:Level 1 hierarchy includes financial instruments measured using quoted prices. This includes listed equity instruments and mutual funds that have quoted price. The fair value of all equity instruments (including bonds) which are traded in the stock exchanges is valued using the closing price as at the repor ng period.Level 2:Fair value of financial instruments that are not traded in an ac ve market (for example, traded bonds, over the counter deriva ves) is determined using valua on techniques which maximize the use of observable market data and rely as li le as possible on en ty-specific es mates. If all significant inputs required to fair value an instrument as observable, the instrument is included in level 2.Level 3:If one or more of the significant inputs is not based on observable data, the instrument is included in level 3. This is the case for unlisted equity securi es, con ngent considera on and indemnifica on assets.
iii) Valua on technique used to determine fair value
The following methods and assump ons were used to es mate the fair value of the level 2 financial instruments included in the above tables:
1) Deriva ve instruments: The company enters into foreign currency forward contracts with banks with investment grade credit ra ngs. These are valued using the forward pricing valua on technique, using present value calcula ons. The models incorporate various inputs including the credit quality of counterpar es and foreign exchange spot and forward rates. The changes in counterparty credit risk had no material effect on the hedge effec veness assessment for deriva ves designated in hedge rela onships.
iv) As per Ind AS 107 "Financial Instrument: Disclosure", fair value disclosures are not required when the carrying amounts reasonably approximate the fair value. Accordingly fair value disclosures have not been made for the following financial instruments:
1) Trade receivables
2) Cash and cash Equivalent
3) Other Bank Balances
4) Interest Accrued on Deposits
5) Borrowings
6) Trade payables
7) Capital creditors
8) Other payables
(` in lacs)

Notes on Consolidated Financial Statements for the year ended 31st March, 2017 Annual Report 2016-17
109
NOTE 30 FINANCIAL RISK MANAGEMENT
The company's few por on of ac vi es are exposed to variety of financial risks i.e. market risk, credit risk and liquidity risk.a) Market Risk The company operates globally and a por on of the business is transacted in several currencies and consequently the company
is exposed to foreign exchange risk through its sales and services outside India , and purchases from overseas suppliers in various foreign currencies. The exchange rate between the rupee and foreign currencies has changed substan ally in recent years and may fluctuate substan ally in the future. Consequently, the results of the company's opera ons are affected posi vely/ adversely as the rupee appreciates/ depreciates against these currencies. The company evaluates exchange rate exposure arising from these transac ons and enters into foreign exchange forward contracts to mi gate the risk of changes in exchange rate on foreign currency exposures as and when required.
aa) The group's exposure to foreign currency risk as on March 31, 2017 expressed in ` in lacs, is as follows: (` in lacs)Par culars 31st March, 2017
USD Other currencies
Total
Financial assets Cash and cash equivalents 1,409.06 244.83 1,653.89 Trade receivables 32,380.69 - 32,380.69 Other Assets 1,289.21 1,793.13 3,082.34 Financial liabili esTrade payables 19,856.91 - 19,856.91 Employee benefit obliga ons - - - Other liabili es 21,531.90 1,602.04 23,133.94 Net assets/ (liabili es) (6,309.85) 435.92 (5,873.93)
ab) The group's exposure to foreign currency risk as on March 31, 2016 expressed in ` in lacs, is as follows:
Par culars 31st March, 2016USD Other
currenciesTotal
Financial assets Cash and cash equivalents 167.47 0.03 167.51 Trade receivables 35,934.17 - 35,934.17 Other Assets 55.76 2,623.91 2,679.67 Financial liabili esTrade payables 30,690.83 - 30,690.83 Employee benefit obliga ons - - - Other liabili es 2,981.95 1,673.16 4,655.11 Net assets/ (liabili es) 2,484.63 950.78 3,435.42
ac) The group's exposure to foreign currency risk as on April 1, 2015 expressed in ` in lacs, is as follows:
Par culars 1st April, 2015USD Other
currenciesTotal
Financial assets Cash and cash equivalents 7.95 - 7.95 Trade receivables 20,249.93 - 20,249.93 Other Assets 0.83 999.81 1,000.64 Financial liabili esTrade payables 18,201.11 - 18,201.11 Employee benefit obliga ons - - - Other liabili es - - - Net assets/ (liabili es) 2,057.61 999.81 3,057.42

Annual Report 2016-17 Notes on Consolidated Financial Statements for the year ended 31st March, 2017
110
ad) Deriva ve financial Instruments
The group holds deriva ve financial instruments such as foreign exchange forward contracts to mi gate the risk of changes in exchange rates on foreign currency exposures. The counterparty for these contracts is generally a bank. These financial instruments are valued based on quoted prices for similar assets and liabili es in ac ve markets or inputs that are directly or indirectly observa on in the marketplace.
The following table gives details in respect of outstanding foreign exchange contracts: (` in lacs)
Par culars 31st March, 2017 31st March, 2016 1st April, 2015Deriva ves Forward Contracts FC in lacs ` in lacs FC in lacs ` in lacs FC in lacs ` in lacsForward contracts In USD - - 25.30 1,726.38 25.30 1,597.96Total forwards - - 25.30 1,726.38 25.30 1,597.96
The foreign exchange forward contracts mature within twelve months. The table below analyzes the deriva ve financial into relevant maturity groupings based on the remaining period of the balance sheet date:
Par culars 31st March, 2017 31st March, 2016 1st April, 2015Not later than one month - - - Later than one month and not later than three months - 1,726.38 778.28 Later than three months and not later than one year - - 819.68
b) Credit risk
Credit risk refers to the risk of default on its obliga on by the counterparty resul ng in a financial loss. The maximum exposure to the credit risk at the repor ng date is primarily trade receivables from customers other than government en es .These Trade receivables are typically unsecured and are derived from revenue earned from domes c and foreign customers. Credit risk is managed through credit approvals, establishing credit limits and con nuously monitoring the creditworthiness of customers to which the company grants credit terms in the normal course of business. On account of adop on of Ind AS 109, the company uses expected credit loss model to assess impairment loss or gain. the company uses a matrix to compute the expected credit loss allowance for trade receivable .
ba) The allowance for life me expected credit loss on customer balances for the year ended March 31, 2017 and March 31, 2016 was ` 5,139.29 lakhs and ` 5,693.33 lakhs respec vely. The movement of allowance for bad and doub ul debt is as below:
Par culars 31st March, 2017 31st March, 2016Balance at the beginning of the year 5,693.33 4,452.40 Transla on differences - - Allowance for doub ul debt (554.04) 1,240.93 Write offs - - Balance at the end of the year 5,139.29 5,693.33
The company's credit period generally ranges from 120-150 days.
Par culars 31st March, 2017 31st March, 2016Trade receivables 2,37,961.09 2,33,970.85 Days sales outstanding - DSO (Days) 154 days 155 days
bb) Credit risk on cash and cash equivalents is limited as the company generally invites in deposits with banks and financial ins tu ons with high credit ra ngs assigned be interna onal and domes c credit ra ng agencies.
NOTE 31 CAPITAL MANAGEMENTa) Risk management The group's objec ves when managing capital are to: -safeguard their ability to con nue as a going concern, so that they can con nue to provide returns for shareholders and benefits
for other stakeholders, and -maintain an op mal capital structure to reduce the cost of capital. In order to maintain or adjust the capital structure, the group may adjust the amount of dividends paid to shareholders, return
on capital to shareholders or issue new shares. The company monitors capital using gearing ra o, which is net debt divided by

Notes on Consolidated Financial Statements for the year ended 31st March, 2017 Annual Report 2016-17
111
total Equity. Net debt comprises of long term and short term borrowings less cash and bank balances. Equity includes equity share capital and reserves that are managed as capital. The gearing at the end of repor ng period was as follows:
(` in lacs)Par culars 31st March, 2017 31st March, 2016 1st April 2015
Net Debt 88,526.86 1,00,370.29 78,685.46 Total Equity 1,06,375.38 84,539.45 64,991.99 Net debt to Equity Ra o 0.83 1.19 1.21
b) Dividends
Par culars 31st March, 2017 31st March, 2016i) Equity sharesFinal dividend for the year ended 31.03.2017 of ` NIL (31.03.2016 ` NIL) per fully paid share - -Interim dividend for the year ended 31.03.2017 of ` NIL (31.03.2016 ` Nil) per fully paid share
- -
ii) Dividends not recognised at the end of the repor ng period - -In addi on to the above dividends, since year end the directors have recommended the payment of final dividend of ` NIL per fully paid equity share (31.03.2016 ` NIL). This proposed dividend is subject to the approval of shareholders in the ensuing annual general mee ng.
- -
Par culars 31st March, 2017 31st March, 2016 NOTE 32 EARNINGS PER SHARE EPS
i) Net Profit a er tax as per statement of Profit & Loss a ributable to Equity Shareholders (` In Lacs) 17,177.98 17,649.19ii) Weighted Average number of equity shares used as denominator for calcula ng EPS 4,70,00,000 4,54,93,151 iii) Basic and Diluted Earnings per share (`) 36.55 38.80iv) Face Value per Equity Share (`) 10.00 10.00
Par culars 31st March, 2017 31st March, 2016 NOTE 33 FOREIGN EXCHANGEEARNINGS IN FOREIGN EXCHANGEFOB Value of Exports 16,746.83 22,202.76 EXPENDITURE IN FOREIGN CURRENCYImported Material 14,440.59 21,876.10 Tour Expenses 75.51 75.91 Others 1,034.99 197.30
15,551.09 22,149.31
Par culars 31st March, 2017 31st March, 2016 NOTE 34 CONTINGENT LIABILITIESi) Guarantees given by Group's Bankers on behalf of the Group. 2,26,657.28 1,91,021.13ii) Claims against the Group not acknowledged as debts:
a) Sales Tax 1,178.87 1,439.76b) Service Tax 328.64 333.08
iii) Corporate Guarantees given by Group 6,929.15 11,603.78iv) Accrued Liabili es/Guarantees for leased property 1,339.19 -
However as per management percep on, the above liabili es will not devolve upon the company in future.

Annual Report 2016-17 Notes on Consolidated Financial Statements for the year ended 31st March, 2017
112
(` in lacs)
Par culars 31st March, 2017 31st March, 2016 NOTE 35 CAPITAL COMMITMENTSEs mated value of contracts in capital account remaining to be executed 571.12 700.05
Par culars 31st March, 2017 31st March, 2016 NOTE 36 SEGEMENT REPORTING AS PER IND AS 108Segment Revenue:Project & Services 4,65,780.56 3,98,012.28 Manufacturing 13,918.30 22,173.99 Others 55,987.75 96,077.19 Segment Total 5,35,686.61 5,16,263.46Segment Results:Project & Services 48,461.23 47,422.73 Manufacturing 392.07 1,423.72 Others 452.22 (1,968.40) Segment Total 49,305.52 46,878.05Unallocated income over expenses (1,431.57) -1592.9Profit Before Interest & Tax Expenses 47,873.94 45,285.15 Interest 21,810.80 18,963.39 Share of net profit of Joint Venture (135.96) 224.24 Profit before Tax 26,199.09 26,097.52 Tax Expenses 9,044.18 8,461.99 Profit a er Tax 17,154.91 17,635.52
Par culars As at 31st March, 2017
As at 31st March, 2016
As at 1st April, 2015
NOTE 36 SEGEMENT REPORTING AS PER IND AS 108 (Contd.)Segment Assets & Liabili es: AssetsSegment AssetsProject & Services 3,61,700.04 3,31,761.04 2,77,615.40 Manufacturing 35,807.77 36,931.44 29,456.60 Others 67,790.71 86,720.39 30,672.37 Total 4,65,298.52 4,55,412.87 3,37,744.37
Liabili esSegment Liabili esProject & Services 1,79,705.13 1,74,149.37 1,49,067.43 Manufacturing 1,896.21 6,150.03 9,118.56 Others 1,09,605.32 1,28,804.39 73,148.40 Total 2,91,206.66 3,09,103.79 2,31,334.39

Notes on Consolidated Financial Statements for the year ended 31st March, 2017 Annual Report 2016-17
113
(` in lacs)
NOTE 37 RELATED PARTY DISCLOSURE AS PER IND AS 24
Name Rela on Par culars Net Transac on During the year
Balance as on 31st March, 2017
BCPL - EMC Joint Venture Joint Venture Investment - 2.45Sales 351.91 382.90
EMC - BCPL Joint Venture Joint Venture Investment - 0Sales 558.05 182.33
EMC - BCPL Joint Venture Subir Joint Venture Investment - 0Sales 761.34 85.72
EMC MBE Contrac ng Co. LLC Joint Venture Investment - 217.10Advance (18,804.75) (18,804.75)
Fedders - EMC - Quatro JV Joint Venture Sales 429.63 (666.65)Tecnolines Makedonjia Doel
Subsidiary of Tecnolines S.r.lAdvance 27.06 27.06
Tecnolines Czech Advance 2.29 2.29Mr. Manoj Toshniwal Key Managerial Personnel Salary 130.32 0Mr. Ramesh Chandra Bardia Key Managerial Personnel Salary 130.32 0Mr. Sarbananda Lahiri
Key Managerial PersonnelAdvance (64.00) (64.00)
Salary 57.00 0Mr. Partho Mullick Key Managerial Personnel Salary 34.00 0Mr. Amitava Majumdar Key Managerial Personnel Salary 34.15 0Mr. Subroto Chaudhury Key Managerial Personnel Advance (15.00) (15.00)Mr. Nikunj Toshniwal Rela ve of Key Managerial Personnel Salary 34.20 0Mr. Siddhartha Bardia Rela ve of Key Managerial Personnel Salary 17.02 0Mr. Keshav Toshniwal Rela ve of Key Managerial Personnel Salary 3.98 0
* Figures in Brackets indicate amounts payable to related par es.
Par culars As at31st March, 2017
As at31st March, 2016
NOTE 38 FINANCIAL HEDGING INSTRUMENTSFor hedging Currency Related Risks :
i) Forward Contracts - Outstanding Nominal Value - 1,726.38

Annual Report 2016-17 Notes on Consolidated Financial Statements for the year ended 31st March, 2017
114
NOTE 39 AS PER IND AS 19 "EMPLOYEE BENEFITS", THE DISCLOSURES AS DEFINED IN THE ACCOUNTING STANDARD ARE GIVEN BELOW :
Defined Benefit PlanThe employees' gratuity fund scheme managed by a trust is a defined benefit plan.The Present Value of obliga ons is determined based on actuarial valua on using the Projected Unit Cost Method.
(` in Lacs)2016-17 2015-16
1) Change in Defined Benefit Obliga on :Defined Benefit Obliga on at the beginning of the year 348.83 328.81 Interest Cost 27.35 25.58 Current Service Cost 44.63 43.88 Benefits Paid (42.84) (59.00)Actuarial Gain / (Loss) on Obliga on (18.30) 9.56 Present Value of obliga on as at the end of the year 359.67 348.83
2) Change in Fair Value of the AssetFair Value of the plan assets at the beginning of the year 252.52 289.45 Investment Income 19.80 22.52 Contribu ons 111.44 -Benefits paid (42.84) (59.00)Return on plan assets, excluidng amount recognised in Net Interest Expenses (1.67) (0.45)Fair Value of Plan assets at the end of the year 339.25 252.52
3) Net Asset/(Liability) recognised in the Balance SheetFair Value of the Plan Assets 339.25 252.52 Present Value of the obliga on as at the end of the year 359.67 348.83 Amount recognized in Balance Sheet (20.42) (96.31)
4) Expenses recognised in the Income Statement(under the head contribu on to provident fund and other funds)Current Service Cost 44.63 43.88 Net Interest Income/(cost) on the Net Defined Benefit liability 7.55 3.06 Expenses recognised in the statement of Profit and Loss 52.18 46.94
5) Other Comprehensive IncomeExpected Return from Plan Asset 1.67 9.56 Net Actuarial Gain/(Loss) recognized in the year (18.30) 0.45 Components of defined benefit costs recognised in Other Comprehensive income (16.63) 10.01
Par culars 31st March, 2017 31st March, 2016 31st March, 2015NOTE 39.1 THE KEY ASSUMPTIONS USED IN THE CALULATIONS ARE AS
FOLLOWS :Discount Rate 7.34% p.a 7.84% p.a 7.78% p.a Rate of increase in salaries 6.00% p.a 6.00% p.a 6.00% p.a Mortality IALM 06-08
Ul mate IALM 06-08
Ul mate IALM 06-08
Ul mate A ri on Rate 2.00% p.a 2.00% p.a 2.00% p.a

Notes on Consolidated Financial Statements for the year ended 31st March, 2017 Annual Report 2016-17
115
(` in lacs)
Par culars As on 31st March, 2017 As on 31st March, 2016 NOTE 39.2 SENSITIVITY ANALYSIS Decrease Increase Decrease Increase Discount Rate (-/+ 1%) 390.71 333.18 376.22 325.38 % change compared to base due to sensi vity 8.63% -7.36% 7.85% -6.72%Salary Growth (-/+1%) 333.85 389.37 326.02 374.87 % change compared to base due to sensi vity -7.18% 8.26% -6.54% 7.46%A ri on Rate (-/+1%) 356.62 362.26 344.86 352.23 % change compared to base due to sensi vity -0.85% 0.72% -1.14% 0.97%Mortality Rate (-/+1%) 358.90 360.43 347.90 349.75 % change compared to base due to sensi vity -0.21% 0.21% -0.27% 0.26%
NOTE 39.3 DESCRIPTION OF RISK EXPOSURES
Descrip on of Risk Exposures
Valua ons are performed on certain basic set of pre-determined assump ons and other regulatory framework which may vary over me. Thus, the Company is exposed to various risks in providing the above gratuity benefit which are as follows:
Interest Rate risk : The plan exposes the Company to the risk of fall in interest rates. A fall in interest rates will result in an increase in the ul mate cost of providing the above benefit and will thus result in an increase in the value of the liability (as shown in financial statements).
Liquidity Risk : This is the risk that the Company is not able to meet the short-term gratuity payouts. This may arise due to non-availability of enough cash / cash equivalent to meet the liabili es or holding of illiquid assets not being sold in me.
Salary Escala on Risk : The present value of the defined benefit plans calculated with the assump on of salary increase rate of plan par cipants in future. Devia on in the rate of increase of salary in future for plan par cipants from the rate of increase in salary used to determine the present value of obliga on will have a bearing on the plan's liability.
Demographic Risk : The Company has used certain mortality and a ri on assump ons in valua on of the liability. The Company is exposed to the risk of actual experience turning out to be worse compared to the assump on.
Regulatory Risk : Gratuity benefit is paid in accordance with the requirements of the Payment of Gratuity Act, 1972 (as amended from me to me). There is a risk of change in regula ons requiring higher gratuity payouts.
Par culars As at 31st March, 2017
As at 31st March, 2016
As at 1st April, 2015
NOTE 40 ASSETS PROVIDED AS SECURITY ` in Lacs ` in Lacs ` in LacsCurrent AssetsFinancial AssetsTrade Receivables 1,93,190.43 1,70,920.87 1,50,019.49 Other Financial Assets 1,29,422.40 1,27,502.63 99,594.28 Non Financial AssetsInventories 11,267.89 13,809.91 13,859.40 Total Current assets provided as security 3,33,880.72 3,12,233.40 2,63,473.17 Non Current assetsProperty, Plant and Equipment 29,082.42 18,575.05 19,789.61 Intangible Assets 59.04 51.31 44.63 Investment 3,379.49 1,292.00 - Total Non - Current assets provided as security 32,520.95 19,918.36 19,834.23 Total Assets provided as Security 3,66,401.67 3,32,151.76 2,83,307.41

Annual Report 2016-17 Notes on Consolidated Financial Statements for the year ended 31st March, 2017
116
(` in lacs)
Par culars As at 31st March, 2017
As at 31st March, 2016
As at 1st April, 2015
NOTE 41 THE OBLIGATIONS ON LONG TERM , NON CANCELLABLE FINANCE LEASES PAYABLE AS PER THE RESPECTIVE AGREEMENTS ARE AS FOLLOWS :
Future minimum lease payableNot Later than 1 year 71.29 16.14 14.20 Later than 1 year and not later than 5 years 251.43 4.07 20.21 Later than 5 year - - -
322.72 20.21 34.41
Par culars Revalua on of NOTE 42 REVALUATION OF PROPERTY, PLANT AND EQUIPMENT Land BuildingEffec ve date of the revalua on 31st March, 2017 31st March, 2017Revalua on by United Surveyors
& ValuersUnited Surveyors
& ValuersCarring amount before revalua on 34.50 339.86 Revalua on Amount 9,656.70 580.83 Carring amount a er revalua on 9,691.20 920.69 Deprecia on - -Fair value Hirarchy II IIValua on techniques Sales Comparison
market approachSales Comparison market approach
NOTE 43.1 ENTERPRISES CONSOLIDATED AS SUBSIDIARY IN ACCORDANCE WITH IND AS 110 CONSOLIDATED FINANCIAL STATEMENTS
Name of the Enterprise Country of Incorpora on
Percentage of Ownership Interest (%) as at 31.03.2017
Percentage of Ownership Interest (%) as at 31.03.2016
Percentage of Ownership Interest (%) as at 31.03.2015
ASC, Inc. (Formerly, Advanced Steel & Crane Inc.)
U.S.A 100% 100% 100%
Tecnolines S.r.l Italy 90% 70% 70%EMC West Asia DMCC U.A.E 100% 100% 100%EMC East Asia Limited China 100% 100% 100%Quatro Rail Tech Solu ons Limited (Formerly, Quatro Rail Tech Solu ons Pvt Ltd)
India 60% 60% 60%
Tecnolines Singapore PTE Limited Singapore 100% 100% 100%CE Maschinenbau GmbH (Formerly, MBE Cologne Engineering GmbH)
Germany Nil 90% 90%
EMC Saudi LLC U.A.E 60% 60% - EMC Tower Limited India 100% 100% 100%EMC Hardware Limited India 100% 100% 100%EMC Solar Limited India 100% 100% 100%EMC Forging Limited India 100% 100% 100%EMC Logis cs Limited India 100% 100% 100%EMC Overseas Limited India 100% 100% 100%EMC Academy Limited India 100% 100% 100%

Notes on Consolidated Financial Statements for the year ended 31st March, 2017 Annual Report 2016-17
117
NOTE 43.2 ENTERPRISES ACCOUNTED AS JOINT VENTURES IN ACCORDANCE WITH IND AS-28 INVESTMENT IN ASSOCIATES AND JOINT VENTURES
Name Of the Enterprise Country of Incorpora on
Percentage of Ownership Interest (%) as at 31.03.2017
Percentage of Ownership Interest (%) as at 31.03.2016
Percentage of Ownership Interest (%) as at 31.03.2015
EMC - BCPL Joint Venture India 51% 51% 51%BCPL - EMC Joint Venture India 49% 49% 49%FEDDERS - EMC - QUATRO Joint Venture India 74% 74% - EMC MBE Contrac ng Co. LLC Oman 35% 35% - EMC - BCPL Subir Joint Venture India 71% 71% 71%
NOTE 44 ADDITIONAL INFORMATION REQUIRED BY SCHEDULE - III
(` in lacs)
Sr, No
Name of the Enterprise Net Assets i.e total Assets minus total liabili es
Share in Profit or (Loss) Share in Other Comprehensive Income
Share in Total Comprehensive Income
As % of Consolidated
Net Assets
Amount As % of Consolidated Profit/(Loss)
Amount As % of Consolidated
Other Comprehensive
Income
Amount As % of Consolidated
Total Comprehensive
Income
Amount
Parent CompanyEMC Limited 86.33% 91,831.63 95.89% 16,449.96 100.12% 6,012.86 96.99% 22,462.82 SubsidiariesIndian
1 Quatro Rail Tech Solu ons Limited (Formerly, Quatro Rail Tech Solu ons Private Limited)
0.45% 476.45 0.37% 63.48 - - 0.27% 63.48
2 EMC Tower Limited 1.65% 1,758.96 0.38% 64.36 - - 0.28% 64.36 3 EMC Hardware Limited 0.02% 17.45 0.00% 0.18 - - 0.00% 0.18 4 EMC Solar Limited 0.00% 0.37 0.00% (0.26) - - 0.00% (0.26)5 EMC Forging Limited 0.00% 0.46 0.00% (0.34) - - 0.00% (0.34)6 EMC Logis cs Limited 0.00% 0.37 0.00% (0.23) - - 0.00% (0.23)7 EMC Overseas Limited 0.00% (0.44) (0.02%) (3.59) - - (0.02%) (3.59)8 EMC Academy Limited 0.00% 1.26 0.00% (0.54) - - 0.00% (0.54)
Foreign1 Tecnolines Singapore
PTE Limited0.02% 21.98 (0.06%) (11.08) - - (0.05%) (11.08)
2 ASC, Inc. (Formerly, Advanced Steel & Crane Inc.)
1.44% 1,528.08 0.40% 68.92 - - 0.30% 68.92
3 Tecnolines S.r.l 0.78% 832.72 0.83% 142.31 - - 0.61% 142.31 4 EMC West Asia DMCC 8.35% 8,882.81 3.69% 632.44 - - 2.73% 632.44 5 EMC Saudi LLC 0.18% 193.95 (0.70%) (119.28) - - (0.51%) (119.28)6 EMC East Asia Limited 0.13% 135.42 0.16% 27.61 - - 0.12% 27.61
Non - Controlling Interest in all Subsidiaries
0.36% 380.47 (0.13%) (23.07) (0.12%) (6.99) (0.13%) (30.06)

Annual Report 2016-17 Notes on Consolidated Financial Statements for the year ended 31st March, 2017
118
(` in lacs)
Sr, No
Name of the Enterprise Net Assets i.e total Assets minus total liabili es
Share in Profit or (Loss) Share in Other Comprehensive Income
Share in Total Comprehensive Income
As % of Consolidated
Net Assets
Amount As % of Consolidated Profit/(Loss)
Amount As % of Consolidated
Other Comprehensive
Income
Amount As % of Consolidated
Total Comprehensive
Income
Amount
Joint Ventures1 EMC - BCPL Joint
Venture0.06% 68.11 0.04% 7.38 - - 0.03% 7.38
2 BCPL - EMC Joint Venture
0.03% 34.82 (0.16%) (27.01) - - (0.12%) (27.01)
3 FEDDERS -EMC - QUATRO Joint Venture
0.13% 133.41 (0.67%) (115.52) - - (0.50%) (115.52)
4 EMC MBE Contrac ng Co. LLC
(0.02%) (17.98) (0.10%) (17.98) - - (0.08%) (17.98)
5 EMC - BCPL Subir Joint Venture
0.09% 95.07 0.10% 17.17 - - 0.07% 17.17
Total 100.00% 1,06,375.38 100.00% 17,154.91 100.00% 6,005.87 100.00% 23,160.78
NOTE 45 FIRST TIME ADOPTION OF IND AS
These are the group’s first consolidated financial statement prepared in accordance with Ind AS .
The accoun ng policy set out in Note 2 to the Consolidated Financial Statements have been applied in preparing the financial statements for the year ended 31st March 2017, the compara ve informa on presented in these financial statements for the year ended 31st March 2016, and in the prepara on of an opening Ind AS Balance Sheet at 1st April 2015 (transi on date) respec vely. In preparing its opening Ind AS balance sheet, the company has adjusted the amounts reported previously in financial statements prepared in accordance with the accoun ng standards no fied under the Companies (Accoun ng Standards) Rules, 2006 (as amended) and other relevant provisions of the Act (Previous GAAP). An explana on of how the transi on from previous GAAP to Ind AS has affected the group’s financial pos on, financial performance and cash flows as on transi on date as well as the compara ve period, is set out in the following tables and notes.
Set out below are the applicable Ind AS 101 op onal Exemp on and mandatory excep ons applied in the transi on from previous GAAP to Ind AS.
A) Exemp on Availed
1) Deemed Cost
Ind As 101 permits a first me adopter to elect to con nue with the carrying value for all of its Property , Plant & Equipment as recognized in the financial statements as at the date of transi on to Ind AS, measured as per the previous GAAP and use that as its deemed cost as at the date of transi on. Accordingly the company has elected to measure all of its Property, Plant & Equipment, Intangible assets at their previous GAAP carrying value.
2) Cumula ve Transla on Differences
Ind AS 101 permits cumula ve transla on gains or losses to be reset to zero at the transi on date. This provides relief from determining cumula ve currency transla on difference in accordance with Ind AS 21 from the date of subsidiary or equity method investee was formed or acquired. The group has elected to reset all cumula ve transla on gains or losses to zero by transferring it to opening retained earnings at its transi on date.
3) Joint Ventures
Ind AS 101 provides an exemp on from changing from propor onate consolida on to equity method of accoun ng. As per the exemp on, when changing from propor onate consolida on to equity method accoun ng, an en ty should recognise its investment in joint ventures at transi on date to Ind AS. The ini al investment should be measured as the aggregate of the carrying amount of the assets and liabili es that the en ty has previously propor onately consolidated, including any goodwill arising from acqusi on. The balance of the investment in joint venture at the date of transi on to Ind AS, determined in accordance with above is regarded as the deemed cost of the investment at ini al recogni on. The group has elected to apply this exemp on for its joint venture en es.

Notes on Consolidated Financial Statements for the year ended 31st March, 2017 Annual Report 2016-17
119
4) Designa on of previously recognised financial instruments.
Ind AS 101 allows an en ty to designate investments in equity instruments at FVTOCI on the basis of the facts and circumstances at the date of transi on to Ind AS. The company has elected to apply this exemp on for its investment in equity investments.
B) Ind AS Excep ons Followed
1) Es mates
An en ty’s es mates in accordance with Ind AS at the date of transi on to Ind AS shall be consistent with es mates made for the same date in accordance with previous GAAP (a er adjustments to reflect any difference in accoun ng policies).Ind AS es mates as at 1st April,2015 are consistent with the es mates as at the same date made in conformity with previous GAAP. The Company made es mates for following items in accordance with Ind AS at the date of transi on as these were not required under previous GAAP:
- Investment in equity instruments carried at FVTPL or FVOCI; and
- Impairment loss/gain on Financial assets.
2) Non Controlling Interest
Ind AS 110 requires en es to a ribute the profit or loss and each component of other comprehensive income to the owners of parent and to non controlling interests. This requirement needs to be followed even if this results in deficit balance of the non controlling interest. Ind AS 101 requires the above requirement to be followed prospec vely from the date of transi on. Consequently, the group has applied the above requirement prospec vely.
3) Classifica on and measurement of financial assets
Ind AS 101 requires an en ty to assess, classify and measure the financial assets on the basis of the facts and circumstances that exist at the date of transi on to Ind AS.
C) Transi on to Ind AS -Reconcilia on
The following reconcilia ons provide a quan fica on of the effect of significant differences arising from the transi on from previous GAAP to Ind AS in accordance with Ind AS 101:
I. Reconcilia on of Balance sheet as at April 1, 2015 and March 31, 2016.
II. Reconcilia on of Statement of Profit and Loss for the year ended March 31, 2016.
III. Reconcilia on of Equity as at April 1, 2015 and March 31, 2016.
The presenta on requirements under Previous GAAP differs from Ind AS and hence Previous GAAP informa on has been regrouped for ease of reconcilia on with Ind AS. The Regrouped Previous GAAP informa on is derived from the Financial Statements of the Company prepared in accordance with Previous GAAP.
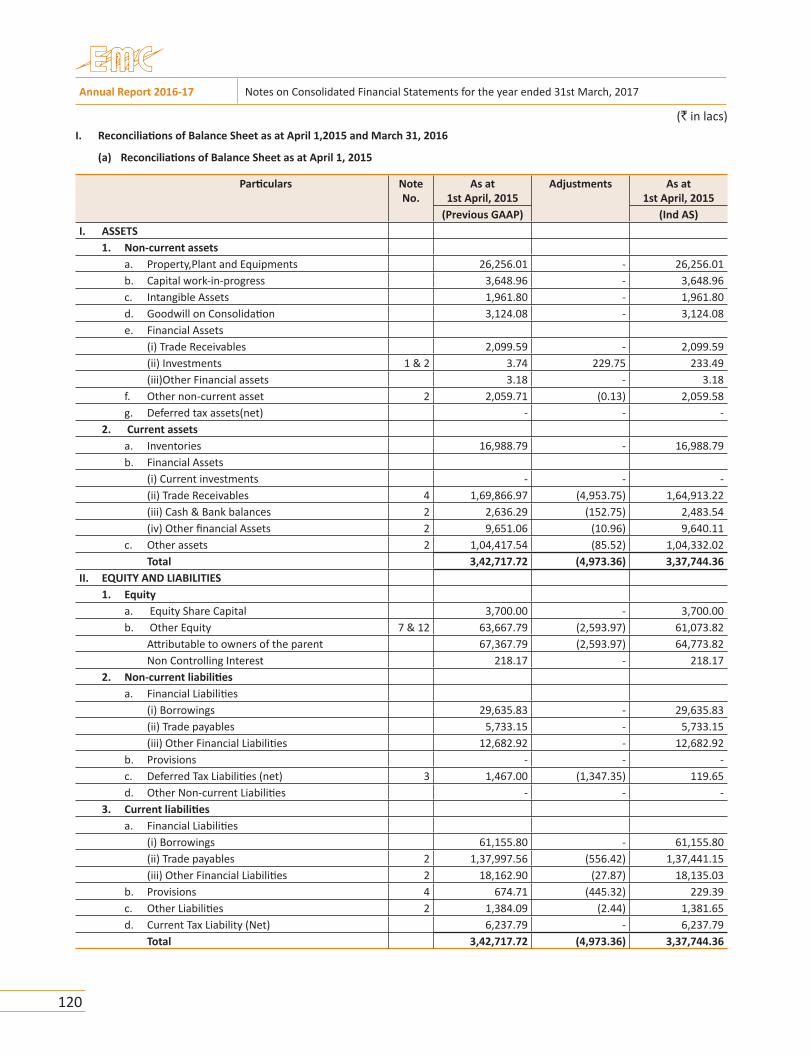
Annual Report 2016-17 Notes on Consolidated Financial Statements for the year ended 31st March, 2017
120
I. Reconcilia ons of Balance Sheet as at April 1,2015 and March 31, 2016
(a) Reconcilia ons of Balance Sheet as at April 1, 2015
Par culars Note No.
As at1st April, 2015
Adjustments As at1st April, 2015
(Previous GAAP) (Ind AS)I. ASSETS
1. Non-current assetsa. Property,Plant and Equipments 26,256.01 - 26,256.01 b. Capital work-in-progress 3,648.96 - 3,648.96 c. Intangible Assets 1,961.80 - 1,961.80 d. Goodwill on Consolida on 3,124.08 - 3,124.08 e. Financial Assets
(i) Trade Receivables 2,099.59 - 2,099.59 (ii) Investments 1 & 2 3.74 229.75 233.49 (iii)Other Financial assets 3.18 - 3.18
f. Other non-current asset 2 2,059.71 (0.13) 2,059.58 g. Deferred tax assets(net) - - -
2. Current assets a. Inventories 16,988.79 - 16,988.79 b. Financial Assets
(i) Current investments - - -(ii) Trade Receivables 4 1,69,866.97 (4,953.75) 1,64,913.22 (iii) Cash & Bank balances 2 2,636.29 (152.75) 2,483.54 (iv) Other financial Assets 2 9,651.06 (10.96) 9,640.11
c. Other assets 2 1,04,417.54 (85.52) 1,04,332.02 Total 3,42,717.72 (4,973.36) 3,37,744.36
II. EQUITY AND LIABILITIES 1. Equity
a. Equity Share Capital 3,700.00 - 3,700.00 b. Other Equity 7 & 12 63,667.79 (2,593.97) 61,073.82
A ributable to owners of the parent 67,367.79 (2,593.97) 64,773.82 Non Controlling Interest 218.17 - 218.17
2. Non-current liabili es a. Financial Liabili es
(i) Borrowings 29,635.83 - 29,635.83 (ii) Trade payables 5,733.15 - 5,733.15 (iii) Other Financial Liabili es 12,682.92 - 12,682.92
b. Provisions - - - c. Deferred Tax Liabili es (net) 3 1,467.00 (1,347.35) 119.65 d. Other Non-current Liabili es - - -
3. Current liabili es a. Financial Liabili es
(i) Borrowings 61,155.80 - 61,155.80 (ii) Trade payables 2 1,37,997.56 (556.42) 1,37,441.15 (iii) Other Financial Liabili es 2 18,162.90 (27.87) 18,135.03
b. Provisions 4 674.71 (445.32) 229.39 c. Other Liabili es 2 1,384.09 (2.44) 1,381.65 d. Current Tax Liability (Net) 6,237.79 - 6,237.79
Total 3,42,717.72 (4,973.36) 3,37,744.36
(` in lacs)

Notes on Consolidated Financial Statements for the year ended 31st March, 2017 Annual Report 2016-17
121
(b) Reconcilia ons of Balance Sheet as at March 31, 2016
Par culars Note No.
As at31st March, 2016
Adjustments As at31st March, 2016
(Previous GAAP) (Ind AS)I. ASSETS
1. Non-current assetsa. Property,Plant and Equipments 25,332.08 - 25,332.08 b. Capital work-in-progress 553.00 - 553.00 c. Intangible Assets 5,343.94 - 5,343.94 d. Goodwill on Consolida on 3,456.44 - 3,456.44 e. Financial Assets
(i) Trade Receivables 2,593.69 - 2,593.69 (ii) Investments 1 & 2 14,291.43 (2,810.89) 11,480.54 (iii)Other Financial assets 3.62 - 3.62
f. Other non-current asset 2 5,185.99 (12.56) 5,173.43 g. Deferred tax assets(net) - - -
2. Current assets a. Inventories 17,714.23 - 17,714.23 b. Financial Assets
(i) Current investments - - - (ii) Trade Receivables 4 2,37,699.92 (6,322.77) 2,31,377.16 (iii) Cash & Bank balances 2 4,685.62 (98.99) 4,586.63 (iv) Other financial Assets 13,678.68 - 13,678.68
c. Other assets 2 1,34,316.99 (197.56) 1,34,119.43 Total 4,64,855.63 (9,442.77) 4,55,412.87
II. EQUITY AND LIABILITIES 1. Equity
a. Equity Share Capital 4,700.00 - 4,700.00 b. Other Equity 7 83,946.75 (4,511.34) 79,435.41
A ributable to owners of the parent 88,646.75 (4,511.34) 84,135.41 Non Controlling Interest 404.04 - 404.04
2. Non-current liabili es a. Financial Liabili es
(i) Borrowings 39,911.21 - 39,911.21 (ii) Trade payables 4,829.85 - 4,829.85 (iii) Other Financial Liabili es 23,136.04 - 23,136.04
b. Provisions - - - c. Deferred Tax Liabili es (net) 3 13,085.58 (1,668.20) 11,417.38 d. Other Non-current Liabili es - - -
3. Current liabili es a. Financial Liabili es
(i) Borrowings 78,676.07 - 78,676.07 (ii) Trade payables 2 1,82,027.51 (396.80) 1,81,630.71 (iii) Other Financial Liabili es 2 28,500.22 (2,512.24) 25,987.98
b. Provisions 5 465.34 (296.11) 169.23 c. Other Current Liabili es 5,059.24 - 5,059.24 d. Current Tax Liability (Net) 2 113.79 (58.08) 55.71
Total Equity and Liabili es 4,64,855.64 (9,442.77) 4,55,412.87
(` in lacs)

Annual Report 2016-17 Notes on Consolidated Financial Statements for the year ended 31st March, 2017
122
II. Reconcilia on of Statement of Profit and Loss for the year ended March 31, 2016
Par culars Note No.
31st March, 2016
Adjustments 31st March, 2016
(Previous GAAP) (Ind AS) Income I. Revenue from Opera ons 10 5,17,597.13 (1,333.67) 5,16,263.46 II. Other Incomes 2 3,680.01 13.83 3,693.84
Total Income 5,21,277.14 (1,319.84) 5,19,957.30 III. Expenses
(a) Cost of Raw Materials Consumed 2 3,94,696.15 (1,842.20) 3,92,853.94 (b) Change in Inventory (Increase) /decrease 421.98 (0.00) 421.97 (c) Manufacturing and Processing Costs 42,810.37 - 42,810.37 (d) Employee Benefit Expenses 5 14,675.53 (10.01) 14,665.52 (e) Finance cost 2 18,963.62 (0.24) 18,963.39 (f) Deprecia on and Amor za on expenses 11 2,814.22 0.43 2,814.64 (g) Other Expenses 10 & 4 19,455.16 2,099.01 21,554.19 Total expenses 4,93,837.03 247.00 4,94,084.02
IV. Share of profit of Joint Ventures 224.24 224.22 V. Profit Before excep onal items and tax 27,440.11 (1,342.60) 26,097.50
Excep onal items - - - VI. Profit before Taxes 27,440.11 (1,342.60) 26,097.50 VII. Provision for Taxes
(a) Current Tax 2,049.74 - 1,754.52 (b) Deferred Tax 2 6,840.89 (133.42) 6,707.47
VIII. Profit (Loss) for the Year 18,549.48 (1,209.18) 17,635.51 IX. Other Comprehensive Income
(i) Items that will not be reclassified subsequently to profit or loss : (a) Changes in investments in equity shares carried at FVTOCI
- (3,429.28) (3429.28)
(b) Re-measurement of defined employee benefit plans
- (10.01) (10.01)
(c) Income tax effect - 3.47 3.47(ii) Items that will be reclassified subsequently to
profit or loss : (a) Exchange differences in transla ng the financial statements of foreign opera ons
- 1,507.04 1507.04
X. Total Other comprehensive Income a er tax - (1,928.79) (1928.79)XI. Total comprehensive income for the period 18,549.48 (3,137.97) 15,706.76
(` in lacs)

Notes on Consolidated Financial Statements for the year ended 31st March, 2017 Annual Report 2016-17
123
III. Reconcilia on of Equity as at April 1,2015 and March 31, 2016
Par culars Refer Notes below
As at31st March, 2016
As at1st April, 2015
Total equity as per previous GAAP 89,050.79 67585.97Deferred taxes under balance sheet approach 3 1,668.20 1347.35Reserves for equity instruments through OCI 1 (3,427.14) 2.14Revalu on Surplus of Plant, Property and Equipment 11 - -Reversal of Proposed Dividend with distribu on tax on it 5 282.84 445.32Impairment Losses on Financial Assets 4 (5,693.33) (4452.40)Recogniza on of equity component of debt instrument 11 2,500.00 -Discon nua on of Propor on consolida on of Interest in Joint Venture 2 158.09 63.62 Total equity as per Ind AS 84,539.45 64,992.00
Notes to first me adop on
1) Fair Valua on of Investments
Under previous GAAP, investment in equity instruments were classified into long term and current investments. Long term investments were carried at cost less provision other than temporary in nature. Current investments were carried at lower of cost or fair value. Under Ind AS, these investments are require to be measured at fair value either through OCI (FVTOCI).The group has opted to fair value these investments through other comprehensive income (FVTOCI). Accordingly, resul ng fair value change of these investments have been recognised in retained earnings as at the date of transi on and subsequently in the other comprehensive income for the year ended March 31 2016.
2) Joint Venture
Under previous GAAP Jointly Controlled En es accounted for using the propor onate consolida on method. Under Ind AS, the group has accounted interest in joint venture using equity method. For the purpose of applying equity method, as at transi on date, the investment in joint venture has been measured as the aggregate of the carrying amounts of assets and liabili es including any goodwill arising from acquisi on, that the group has previously propor onately consolidated.
3) Deferred Taxes
Under previous GAAP, deferred taxes were recognised based on Profit & loss approach i.e. tax impact on difference between the accoun ng income and taxable income. Under Ind AS, deferred tax is recognised by following balance sheet approach i.e. tax impact on temporary difference between the carrying value of asset and liabili es in the books and their respec ve tax base. The Deferred tax impact has been recognised in retained earning on the date of transi on and subsequent adjustments in statement of profit and loss.
4) Impairement of Trade receivables
As per Ind AS 109, the company is required to apply expected credit loss model for recognising the impairment loss or gain on Trade receivables, consequently the impairment loss on date of transi on has been recognised in retained earnings and subsequent changes in statement of profit and loss.
5) Proposed dividend
Under the previous GAAP, dividends proposed by the board of directors a er the balance sheet but before the approval of the financial statements were considered as adjus ng events. Accordingly, provision for proposed dividend was recognised as a liability. Under Ind AS, such dividends are recognised when the same is approved by the shareholders in the general mee ng, accordingly provision for the proposed dividend lying as on the date of transi on is derecognized.
6) Remeasurement of post employment
Under Ind AS, remeasuremnet i.e. actuarial gains and losses and the return on plan assets, excluding amounts included in the net interest expenses on the net benefit liability are recognised in other comprehensive income instead of profit or loss.
7) Retained earnings
Retained earnings as at April 1, 2015 has been adjusted consequent to Ind AS transi on adjustments.
(` in lacs)

124
Annual Report 2016-17 Notes on Consolidated Financial Statements for the year ended 31st March, 2017
As per our Report of even date a achedFor SRB & AssociatesChartered Accountants (F. Regd. No.310009E)
Bisworanjan Sutar(Partner)Membership No. - 066708Kolkata, The 30th day of June, 2017
For and on behalf of the Board
Manoj Toshniwal Ramesh Chandra Bardia Managing Director Jt. Managing Director DIN : 00022787 DIN : 00374148
Arun Kumar Kedia Sumit Kumar Surana Chief Financial Officer Company Secretary
Yamini MoreVP (Finance & Accounts)
8) Other comprehensive income
Under Ind AS , all items of income and expenses recognised in a period should be included in profit or loss for the period, unless a standard required or permits otherwise. Items of income and expenses that are not recognised in profit and loss but are shown in the statement of profit and loss as ‘other comprehensive income’ includes remeasurements of defined benefits plans, foreign exchange difference arising on transla on of foreign opera ons, effec ve por on of gains and losses on cash flow hedging instruments and fair value gains or (losses) on FVTOCI equity instruments. The concept of other comprehensive income did not exist under previous GAAP.
9) Financial Guarantee
The company has extended financial guarantees on behalf of it related en es, the recogni on of financial liabili es arising thereon has not been accounted in the books of account being the fair value is immaterial.
10) Excise Duty
Under the previous GAAP, revenue from sale of products was presented exclusive of excise duty. Under Ind AS, revenue from sale of goods is presented inclusive of excise duty. The excise duty paid is presented on the face of the statement of profit and loss as part of expenses.
11) Revalua on Reserve
The Amount lying in revalua on reserve as on transi on date is transferred to retained earnings in accordance with Ind AS Transi on Facilita on Group Bulle n-8 issued by Ins tute of Chartered Accountant of India (ICAI).
12) Recogniza on of equity component of debt instrument
Under previous GAAP, the company had classified mandatorily conver ble debt under other loans and advances, the same has been measured and recognized as equity component in accordance with Ind AS 109 and 32.
NOTE 46 FIGURES FOR THE PREVIOUS YEAR HAVE BEEN RE ARRANGED AND RE GROUPED WHEREVER NECESSARY.

Salient features of financial statements of subsidiary as per Companies Act , 2013 Annual Report 2016-17
125
A) SU
BSID
IARI
ES
No.
Name
ofSu
bsidi
ary Co
mpan
yDa
te of
Acqu
ision
Repo
rng
Cu
rrenc
y Sh
are
Capit
al Re
serve
s &
Surpl
us
Total
As
sets
Total
Lia
bilie
s Inv
estme
nts
Turno
ver /
To
tal In
come
Pr
ofit B
efore
Taxa
on
Prov
ision f
or Ta
xaon
Pr
ofit A
er Ta
xaon
Pro
pose
d Div
idend
%
of Sh
are-
holdi
ng
1EM
C West
Asia
DMCC
06-05
-2013
INR32
6.69
3,612
.32
32,76
9.27
28,83
0.26
- 31
,462.7
9 55
1.86
- 55
1.86
- 10
0.00%
AED
18.50
20
4.56
1,85
5.67
1,632
.61
- 1,7
63.81
30
.92
- 30
.92
-
2AS
C, Inc
. (Form
erly, A
dvan
ced
Steel
& Cra
ne In
c.)19
-07-20
12INR
3.18
2,201
.06
4,61
7.73
2,413
.49
- 4,5
89.72
28
7.68
190.9
1 96
.77
- 10
0.00%
USD
0.05
33.94
71
.20
37.21
-
70.05
4.2
1 2.
91
1.30
-
3Tec
nolin
es S.r
.l18
-10-20
12INR
69.38
3,9
97.57
23
,505.8
2 19
,438.8
7 11
.45
22,78
1.94
253.6
484
.90
168.7
5 -
90.00
%
EURO
1.00
57.62
33
8.78
280.1
6 0.1
7 31
4.77
3.50
1.17
2.
33
-
4Tec
nolin
es Sin
gapo
re PT
E Ltd
28-01
-2014
INR0.4
9 14
.80
3,86
9.72
3,854
.43
- -
(11.1
0)-
(11.10
) -
100.0
0%
USD
0.01
0.23
59.66
59
.43
- -
(0.17
)-
(0.17
) -
5EM
C East
Asia
Ltd17
-01-20
14INR
4.27
59.15
4,
469.2
0 4,4
05.79
-
11,17
1.36
31.05
3.
44
27.61
-
100.0
0%
USD
0.07
0.91
68.91
67
.93
- 17
0.51
0.47
0.05
0.
42
-
6EM
C Sau
di LLC
16-02
-2016
INR51
8.81
(198.7
9) 37
3.90
53.88
-
- (19
8.79)
- (1
98.79
) -
60.00
%
SAR
30.00
(1
1.38)
21.62
3.0
0 -
- (1
1.38)
- (11
.38)
-
7Qu
atro R
ail Te
ch So
luon
s Ltd
. (Form
erly, Q
uatro
Rail
Tech S
oluon
s Pvt
Ltd)
31-07
-2013
INR10
0.00
223.4
5 1,
940.6
1 1,6
17.17
-
3,011
.66
116.1
6 41
.12
75.04
-
60.00
%
8EM
C Sola
r Ltd.
26-05
-2010
INR5.0
0 (2.
69)
2.36
0.0
5 -
0.17
(0.10
)-
(0.10
) -
100.0
0%
9EM
C Ove
rseas
Ltd.
28-04
-2011
INR15
0.00
(9.13
) 14
2.13
1.26
- 11
.22
11.01
3.
39
7.62
-
100.0
0%
10EM
C Log
iscs
Ltd.
24-06
-2010
INR5.0
0 (2.
70)
2.35
0.0
5 -
0.17
(0.07
)-
(0.07
) -
100.0
0%
11EM
C Hard
ware
Ltd.
22-09
-1982
INR 25
.00
(12.3
1)17
.59
4.89
- 0.4
6 (0.
18)
- (0
.18)
- 10
0.00%
12EM
C Forg
ing Lt
d.28
-05-20
10INR
5.00
(2.96
) 2.
09
0.05
- 0.1
4 (0.
20)
- (0
.20)
- 10
0.00%
13EM
C Tow
er Ltd
.28
-05-20
10INR
1,300
.00
(285.9
0) 2,
457.5
0 1,4
43.39
-
968.0
0 3.8
2 -
3.82
-
100.0
0%
14EM
C Acad
emy L
td.28
-07-20
10INR
5.00
(127.3
3) 2.
27
124.6
0 -
- (1
0.21)
- (10
.21)
- 10
0.00%
As on
31.03
.2017
: EUR
O - 6
9.384
, USD
- 64.8
589,
AED
- 17.6
59, S
AR - 1
7.293
6As
on 31
.03.20
16: E
URO
- 75.3
674,
USD
- 66.1
753,
AED
- 18.0
169,
SAR -
17.64
47,
As on
31.03
.2015
: EUR
O - 6
6.966
3, US
D - 6
2.335
5, AE
D - 1
6.973
1
(` in
Lac
s)

Annual Report 2016-17 Salient features of financial statements of subsidiary as per Companies Act , 2013
126
B) Jo
int V
ent u
res
(` in
Lac
s)
SL
No.
Nam
e of
Joi
nt V
entu
reIn
dian
JVFo
reig
n JV
EMC
- BCP
L JV
BCPL
- EM
C - J
V F
edde
rs -
EMC
- Q
uatr
o E
MC-
BCP
L - S
ubir
EM
C M
BE C
ontr
actin
g Co
. LLC
1
Late
st a
udite
d Ba
lanc
e Sh
eet D
ate
31-0
3-20
1731
-03-
2017
31-0
3-20
1731
-03-
2017
31-0
3-20
17
2Da
te o
n w
hich
the
Join
t Ven
ture
was
ass
ocia
ted
or a
cqui
red
04-0
2-20
1304
-08-
2012
03-1
2-20
1402
-04-
2014
26-1
0-20
16
3Sh
ares
of
Join
t Ve
ntur
es h
eld
by t
he C
ompa
ny
on th
e ye
ar e
nd-
Amou
nt
of
Inve
stm
ent
in
Join
t Ve
ntur
es(`
in L
acs)
- 2
.45
--
151
.97
- Ext
ent o
f Hol
ding
%51
%49
%74
%71
%35
%4
Desc
riptio
n of
how
ther
e is
signi
fican
t inf
luen
ceJo
int V
entu
reJo
int V
entu
reJo
int V
entu
reJo
int V
entu
reJo
int V
entu
re5
Reas
on w
hy t
he A
ssoc
iate
/Joi
nt V
entu
re is
not
co
nsol
idat
edCo
nsol
idat
edCo
nsol
idat
edCo
nsol
idat
edCo
nsol
idat
edCo
nsol
idat
ed
6N
et w
orth
att
ribut
able
to
Shar
ehol
ding
as
per
late
st a
udite
d Ba
lanc
e Sh
eet (
` in
Lac
s) 6
8.11
37.
27 1
33.4
1 9
5.07
133
.99
7Pr
ofit/
(Los
s) fo
r the
yea
r (`
in L
acs)
i. Co
nsid
ered
in C
onso
lidat
ion
16.
03
3.2
3 (1
15.5
2) 1
4.97
(1
7.98
)ii.
Not
con
sider
ed in
Con
solid
atio
n 1
5.41
3
.36
(40.
59)
6.1
1 (3
3.38
)

Concept, design by MANJARI ENTERPRISESPh : (033) 40012822 | [email protected]
18
Corporate overviewAnnual Report 2016-17
Spreading wingsby fostering relationships At EMC Limited, we recognise that growth does not come from how well we can grow our assets. But from how well we can grow our relationships. The soul of our unwritten mission statement is not about the profits for the Company, but with value for the stakeholders associated with the Company.
Talent Management at EMC involves the design and implementation of strategies, policies and systems to ensure that highly qualified individuals can be attracted, recruited and retained. Our company is fully committed towards its responsibilities and is contributing effectively to facilitate value-creation in various arenas of its operations including health & safety, employee training. Our skilled team of over 1500 peoples including technical & non-technical staff, drives execution excellence. Through initiatives like employee engagement in decision making, annual get-together, sports & office picnic, the Company aims to foster a sense of equality and diversity amongst its human resource.
EMC Academy is one such unique institution established by the Company which imparts training in various disciplines for the professional development of engineers, supervisors and other skilled & non-skilled manpower to meet the growing need of trained manpower in the power sector.
We also work with our suppliers, customers and various other peoples associated with the Company on a long-term perspective. Innovative management policies ensure the development and trust of various stakeholders. Our above-industry average performance has come from the extension of this value beyond a one-off transaction into a sustainable relationship across the long-term.
A classroom session at EMC Academy

EMC LIMITEDConstantia Office Complex, 11, Dr. U. N. Brahmachari Street,
th8 Floor, (South Block), Kolkata – 700017e-mail : [email protected], website : www.emcpower.com
Phone : +91 33 2289 3122 - 24 / 4015 8888, Fax : +91 33 2289 3121