Embley Projectfor South of Environmental Impact Statement · SW03 use Level Troll 500 pressure...
31
Environmental Impact Statement for South of Embley Project Section 5 Water Resources
Transcript of Embley Projectfor South of Environmental Impact Statement · SW03 use Level Troll 500 pressure...

Environ
men
tal Impact Statem
ent
for South
ofE
mbley Project
Section 5Water Resources


Rio Tinto AlcanEnvironmental Impact StatementSouth of Embley Project
5 WATER RESOURCES
5.1 Surface Water
The Project is located on a gently undulating bauxite plateau landform cut by a network ofrivers and smaller creeks. The elevated bauxite plateau is fringed for most of the coastal marginby low cliffs and lateritic outcrop. A number of semi-perennial watercourses plus numeroussmaller ephemeral creeks traverse the Project area and flow in a westerly direction eventuallydischarging into the Gulf of Carpentaria. In terms of primary surface water bodies, the Projectarea is bound by the Hey and Embley Rivers to the north, the Ward River to the south, and theGulf of Carpentaria to the west. There are large estuaries associated with the Hey, Embley andWard Rivers.
The Watson River is located south of the southern boundary of ML7024 and, while part of theriver's catchment is within ML7024, the proposed footprint of the Project is outside thecatchment boundary of the Watson River. The Archer River, a declared Wild River, is locatedsouth of the Watson River catchment and is not affected by the Project. The Wen lock River is adeclared Wild River with a catchment north of the Project area. That catchment extends westnorth-west across the Cape and the river discharges into the Gulf of Carpentaria north ofMapoon. The catchment boundaries of the main rivers surrounding the Project area are shownon Figure 5-1.
5.1.1 Surface Water Hydrology
Numerous catchments are located within the Project area. The northern part of the Project areacontains Triluck Creek, Winda Winda Creek and a small part of the Hey River catchment. TheNorman Creek catchment and the Ina Creek catchment are within the western central portionof the Project area. The Ward River catchment encompasses the eastern and southern projectarea and includes the following sub-catchments: Coconut Creek, Tappelbang Creek, SandyCreek and Possum Creek.
The principal catchment boundaries in the Project area are shown in Figure 5-2 and theassociated catchment areas are presented in Table 5-1.
Table 5-1 Catchment Areas
Project Area Catchments Area (km2)
Embley River 1,000
Hey River 756
Triluck Creek 108
Winda Winda Creek 94
Norman Creek (all tributaries) 259
Ina Creek 65
Ward River (all tributaries) 666
Ward River sub-catchment 187
Coconut Creek 119
Tappelbang Creek 127
Sandy Creek 105
Possum Creek 130
Adjacent Catchments
Watson River 2,872
Archer River 13,820
Section 5 Water Resources Page 5-1

8
oco
E
coCD_
(1,
7
LL
Oco
.6
LL
O
0)
[-n-o
LT_
Gulf
of
12° Map onCarpentaria
13°
South ofEmbleyProjectArea
NormanCreek
d 1
rr
ARCHERRIVER/
-14°
Lease boundary
Township
_ River / Creek
Road / track
River catchment boundary
South of Embley Project
Fig. 5-1: Weipa RegionCatchment Boundaries
0 50km
Datum/Projection: GDA941MGA Zone 54 Date: 23/03/2011

Lease boundary
Township
Road/track
5m topographic contour
Drainage
'''' Catchment boundaries40 Year Mine Plan
South of Embley Project
Fig. 5-2: Project AreaCatchment Boundaries
0 10km
Datum /Projection: GDA941MGA Zone 54 Date: 21/07/2010

Rio Tinto AlcanEnvironmental Impact StatementSouth of Embley Project
The Watson River drains a relatively small area in the southern extremity of ML7024. TheEmbley River catchment is located north of the Project area and is partially within ML7024(refer Figure 5-1).
The drainage patterns of the catchments in the Project area are dendritic (tree-like). Thesecatchments are typified by confluences with one or more tributaries that join larger reaches atacute angles, which give way to broader flood plains downstream.
The characteristics of the creeks (including length, source and habitat) with catchmentspredominantly within the Project area are summarised in Table 5-2. Riparian vegetationassociated with groundwater fed reaches of creeks is shown in Figure 7-8. Groundwaterdependent ecosystems are discussed in more detail in Section 7.5.1, and Table 7-4 andTable 7-9.
Table 5-2 Project Area Creek Characteristics
Creek Approx.length(km)
SamplingLocations
Source Habitat Part of larger system?
Winda 13.8 9, 9A Seasonal groundwater fed Supports perennial Winda Winda Creek flows intoWindaCreek
reaches with some isolatedperennial pools (9)
pools /lagoons Triluck Creek which discharges intothe mouth of the Embley Riverestuary.
Triluck 14.0 19, 21 Seasonal groundwater fed Supports perennial Winda Winda Creek joins twoCreek reaches with some isolated
perennial pools (19)pools /lagoons lowerreaches (21) aretidal
branches of Triluck Creek whichdischarges into the mouth of theEmbley River estuary.
Norman 27.1 1A, 2A, 4, Perennial stream with some Supports pools, Norman Creek has three mainCreek 5A, 7A, 10A, seasonal/semi-perennial lagoons and tree branches which join and discharge
1013, 11 stream channels (4, 2A) andperennial groundwater fedreaches (7A)
swamps (11) andlower reaches (10Aand 1013) are tidal
into the Gulf of Carpentaria.
Ina 12.9 26, 31 Seasonal stream channel Supports perennial Isolated. Discharges into the Gulf ofCreek with isolated perennial pools pools (26) and is
tidally influenced atlower reaches (31)
Carpentaria.
Ward 42.1 25A, WP8, Combination of seasonal Supports pools and Coconut Creek joins withRiver WP16 surface flow and perennial
groundwater fed reachestree swamp (WP16)and is tidallyinfluenced at lowerreaches (WP8,WP14)
Tappelbang Creek and becomesWard River. Sandy Creek andPossum Creek enter downstream.Ward River estuary links to largerWatson and Archer estuary system.
Coconut 21.2 14A, 22A Seasonal stream channel Supports tree swamp Coconut Creek is a tributary ofCreek (22A), not tidally
influencedWard River which discharges intothe Gulf of Carpentaria.
A network of stream gauging stations and rain gauges were installed in the Project area (referFigure 5-3). The stream gauging stations were installed in October 2007 and were operationalfor various periods until the data was last downloaded in August 2009. Stations SW02 andSW03 use Level Troll 500 pressure transducer sensors and Stations SW01 and SW03 useArgonaut SW Acoustic Doppler sensors. The five rain gauges were installed for various periodsthroughout the Project area, starting in 2006.
The response of streamflow to rainfall at four various gauging stations (SW01, SW02, SW03,and SW04) is shown in Figure 5-4.
Section 5 Water Resources Page 5-4

0)
LL
Li2
2
LL
O
0)
8575000 mN
IPeraHead
RGO1
Gulf
of
Carpentaria
BoydPoint
Woo ldrumPoint rlapraum
\ 4 8V c---
\ =v) River
Z \19
27 \ \ \\ 1h \ /IIP / \
/ \ // \ /9A
9
5A SW01
7),SW021A
8550000 mN
8525000 mN
FalsePeraHead
I
WorbodyPoint
WP8
9'16/WF,118,
WP-14
Aurukunf--\
RTA Mining Lease boundary
Road/track
Town
Surface water quality sampling sites
Stream Gauge (with data logger)
Rain Gauge
Mining Years 1 -13
Mining Years 14 40
South of Embley Project
Fig. 5-3: Surface WaterMonitoring Locations
0 10km
ZIL Datum/Projection: GDA941MGA Zone 54 Date: 14/07/2010

Rio Tinto AlcanEnvironmental Impact StatementSouth of Embley Project
Figure 5-4 Streamflow in Response to Rainfall
Streamflow in Response to Rainfall
75
50co
E
N
al-c0co
25
0
I 1111
71 IIII i 1111'711,17nllIl
ilIl
50EE
al.cEl
CC
100
MIIIIIIIIII 1 1119
1111
BA III1
11.1,ramoollome millariamehillialwili
Oct Nov Dec Jan Feb Mar Apr May Jun Jul Aug Sep Oct Nov Dec Jan Feb Mar Apr May Jun Jul Aug Sep
2007 2008 2009
SWO 1 SW02 SW03 SW04 Rainfall
Section 5 Water Resources Page 5-6

Rio Tinto AlcanEnvironmental Impact StatementSouth of Embley Project
Rainfallrunoff relationships were derived using Boughton's Australian Water Balance Model(AWBM) (CRC for Catchment Hydrology, undated). AWBM is a catchment water balance modelthat relates runoff to rainfall, based on a conceptualised representation of a catchment'stemporary surface and baseflow stores, rainfall loss to evaporation and gradual release of waterfrom both stores to streamflow at the catchment outlet. The sum of water released fromsurface and baseflow stores provides an estimate of daily runoff (Boughton 1993).
The model was calibrated to establish representative model parameters to use for predictivemodel simulations of streamflow. The model parameters are catchment specific and it is
therefore necessary to calibrate to gauged streams in close proximity to the Project area wherepossible.
The AWBM has been calibrated at two streamflow gauging stations:
SW01 (upstream of proposed Dam C on a Norman Creek tributary); and
SW04 (on the Ward River).
The input data for calibration included:
catchment area;
rainfall;
runoff (streamflow); and
evapotranspiration.
The catchment area reporting to SW01 is 33.02km2 and to SW04 is 281.73km2. Local rainfalldata recorded at RG04 was used for the calibration of AWBM at SW01 and at RG06 for thecalibration at SW04. Data gaps in rain gauge records were filled at RG04 with data from RG06and at RG06 from RG05.
Streamflow data was recorded by Argonaut SW Acoustic Dopplers (Dopplers) located at SW01and SW04. Evapotranspiration data was obtained from SILO data drill (BoM 2009d). Data drill isgridded interpolated data from point observations provided by the Bureau of Meteorology(BoM).
The calibration procedure is undertaken to determine the model parameters that provide thebest fit of "modelled" to "measured" streamflow in terms of runoff from the surface andrecession curve (baseflow) components, and the overall total flow volume.
The following calibration parameters are identified by the model:
Cl, C2 and C3 (surface storage capacities);
Al, A2 and A3 (partial areas of surface stores);
Ks (surface recession constant) the rate of discharge of water from the surface store;
BFI (baseflow index) the amount of runoff that becomes baseflow; and
Kb (baseflow recession constant) the rate of discharge of water from the baseflowstore.
An initial visual assessment of the runoff hydrograph showed the falling limb (representative ofbaseflow) meets the zero flow axis at a greater angle than is typically the case. The falling limbtypically asymptotes to a point of lowest flow (or zero flow). It was concluded that a proportionof baseflow continues below the invert of the stream channel and the actual asymptote of thefalling limb occurs at a point approximately 0.5mm/day (d) below the axis of the hydrograph.This value of up to 0.5mm/d has been concluded to be representative of "deep baseflow"(baseflow that does not enter the stream at the flow measurement point) and is included aspart of the calibration. The AWBM calibration parameters are shown in Table 5-3.
Section 5 Water Resources Page 5-7
Rio Tinto AlcanEnvironmental Impact StatementSouth of Embley Project
Table 5-3 AWBM Calibration Parameters
Calibration Parameter Value
Al 0.134
A2 0.433
Cl 0
C2 0
C3 260
Ks 0.1
BFI 0.99
Kb 0.979
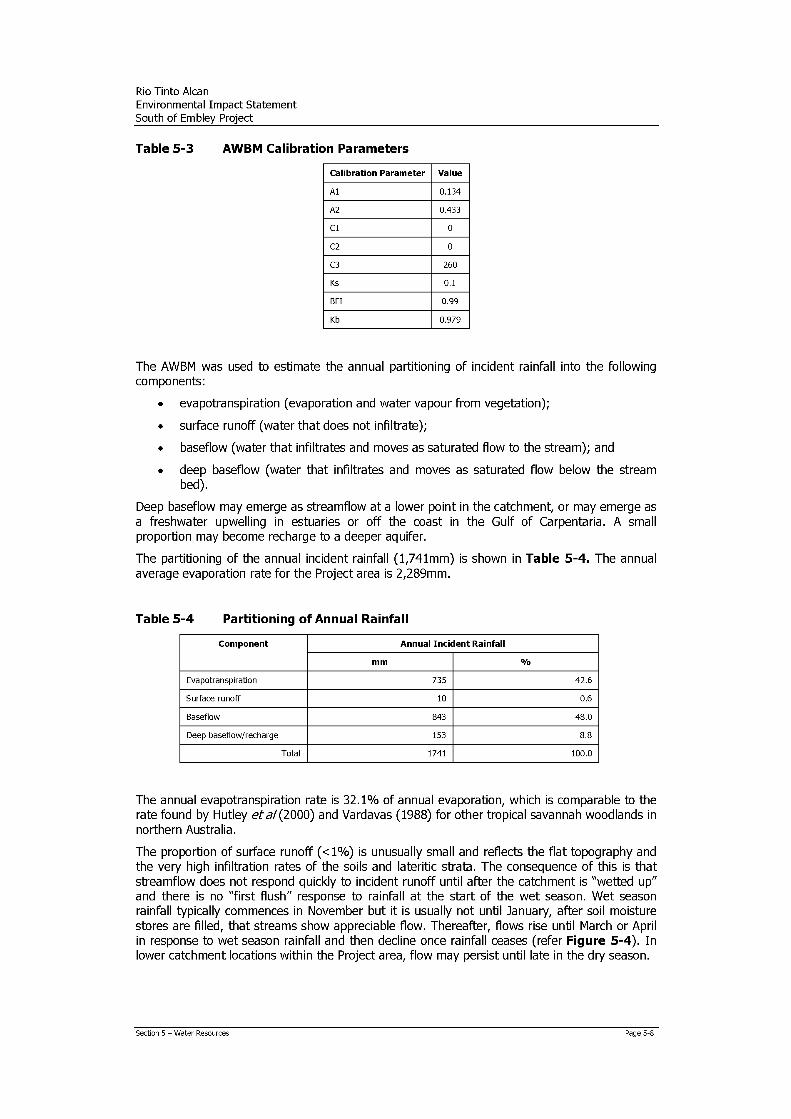
The AWBM was used to estimate the annual partitioning of incident rainfall into the followingcomponents:
evapotranspiration (evaporation and water vapour from vegetation);
surface runoff (water that does not infiltrate);
baseflow (water that infiltrates and moves as saturated flow to the stream); and
deep baseflow (water that infiltrates and moves as saturated flow below the streambed).
Deep baseflow may emerge as streamflow at a lower point in the catchment, or may emerge asa freshwater upwelling in estuaries or off the coast in the Gulf of Carpentaria. A smallproportion may become recharge to a deeper aquifer.
The partitioning of the annual incident rainfall (1,741mm) is shown in Table 5-4. The annualaverage evaporation rate for the Project area is 2,289mm.
Table 5-4 Partitioning of Annual Rainfall
Component Annual Incident Rainfall
mm 0/0
Evapotranspiration 735 42.6
Surface runoff 10 0.6
Baseflow 843 48.0
Deep baseflow/recharge 153 8.8
Total 1741 100.0
The annual evapotranspiration rate is 32.1% of annual evaporation, which is comparable to therate found by Nutley et a/(2000) and Vardavas (1988) for other tropical savannah woodlands innorthern Australia.
The proportion of surface runoff (<1%) is unusually small and reflects the flat topography andthe very high infiltration rates of the soils and lateritic strata. The consequence of this is thatstreamflow does not respond quickly to incident runoff until after the catchment is "wetted up"and there is no "first flush" response to rainfall at the start of the wet season. Wet seasonrainfall typically commences in November but it is usually not until January, after soil moisturestores are filled, that streams show appreciable flow. Thereafter, flows rise until March or Aprilin response to wet season rainfall and then decline once rainfall ceases (refer Figure 5-4). Inlower catchment locations within the Project area, flow may persist until late in the dry season.
Section 5 Water Resources Page 5-8

Rio Tinto AlcanEnvironmental Impact StatementSouth of Embley Project
In typical "hard" ephemeral catchments there are short-term spikes in stream-flow volumefollowing rainfall events. The response of streams on the bauxite plateau to rainfall is muchmore modulated given that the baseflow component is so dominant and direct surface runoffcomponent is usually very small. The low surface runoff component also means streams carry alow concentration of suspended solids, even during high flows (refer Section 5.1.4 for furtherdiscussion on turbidity).
The stream gauge data from Norman Creek (SW01) and Ward River (SW04) was analysed todetermine the ARI of "bank full" flow. Once bank full flow is exceeded, over bank flow occursand any adjacent floodplains and wetlands are inundated. The timing and frequency of bank fullflows may have significant ecological implications. The AWBM was used to generate syntheticstreamflow records from SILO rainfall records. The bank full flow at the Norman Creek site(4.5m3/s) was found to have an ARI of 1:2.5 and the bank full flow at the Ward River site(30.5m3/s) had an ARI of 1:1.5. The 1:100 ARI flood event flows for these respective sites are7.4m3/s and 65m3/s. The relatively small increment in flow rate between bank full flow and a1:100 year flood reflects the relatively minor contribution of direct surface to flow. Thestreamflow data indicates that adjacent floodplains and wetlands are inundated almost everyyear and the ecology of these areas is not dependent on extreme flood events. The streamflowinformation has been used to evaluate the potential impact of a water storage dam on thehydrological regime (refer Section 5.2.3). The potential impacts of the Project on aquaticecology are discussed in Section 8.13 through to Section 8.17.
5.1.2 Existing Surface Water Users
There are no existing surface water dams or weirs in the Project area. The surface waters ofthe Project area are used by Traditional Owners and visitors for fishing, camping andrecreation. RTA uses very small amounts of surface water during mineral exploration activities.There are no cattle in the Project area.
5.1.3 Stream Geomorphology
This section describes the Project area geomorphology in terms of methodology and surveyresults from two field events: the first within the northern region of the Project area (NormanCreek, Triluck, Winda Winda, Coconut and Ina Catchments) during May 2008 and the secondwithin the Ward River catchment during May 2009. Representative sites were inspected torecord the baseline geomorphic conditions of the Project area and assess any potential impactsfrom mining activities, particularly in relation to construction of Dam C.
Northern Region
A total of twelve locations located up stream, down stream and within northern mining areaswere inspected during May 2008 to provide a representative sample of stream types andhydrological regimes. The locations of the study sites are shown in Figure 5-5. The northernregion includes the area for proposed Dam C.
An in situ, site based assessment of channel stability was undertaken using methodology basedon Pfankuch (1975), Rosgen (2001), and the Australian Index of Stream Condition. Descriptivedata (e.g. channel size, stream type, bed and bank material, active hydrology) was recordedand assessments of characteristics to determine bank, bed and overall channel stability, thepotential for adjacent mass failure and the erodibility of bed and bank materials. Sites werecategorised according to their stability score and stream type (Rosgen 1996). Field data and sitephotos are provided in Appendix 5A.
Stream types were classified according to Rosgen (1994, 1996, 2001; Appendix 5A). Whilestreams generally fitted into the hierarchy of streams developed by Rosgen, there were someoutliers (e.g. unique streams within wetlands). As such, they were grouped in the RosgenStream Type that most resembled what was observed. A classification scheme specific to theProject area was established to ensure correct stream groupings.
Section 5 Water Resources Page 5-9

LL
OO
Co
ErnOO
LLI0
07
0_
Gulf
of
Carpentaria
8575000 mN
BoydInfrastructure
Area
8550000 mN
8525000 mN
4A
Dam C5A
/A
AurukunProjectonyeybr
Norman CreekInfrastructure
Area
26
25A
-14A
WR01
WRO6
MO/ °I/)) I
Pump
WRO2WR03
RTA Mining Lease boundary
Road/track
Town
Drainage
Tailings Dam
Infrastructure corridor
Geomorphic assessment site
South of Embley Project
Fig. 5-5: GeomorphicAssessment Site Locations
0 10km
Datum/Projection: GDA94/MGA Zone 54 Date: 15/07/2010

Rio Tinto AlcanEnvironmental Impact StatementSouth of Embley Project
General Geomorphic Description and Assessment
The stream types observed within the northern region of the Project area are listed in Table 5-5.
Table 5-5 Northern region Project area stream types
Stream Type Valley Description Stream Description
1
Broad, flat wetland / swampSmall, incised stream within a swamp, with low width:depth ratio
2 Large incised meandering stream within swampy surrounds, with low width:depth ratio
3 Broad, flat wetland / swamp Very wide, shallow depression within a swamp
4 Broad, flat floodplain Generally slightly incised channel with varying degrees of sinuosity
5 Moderately confined valley Incised channel with varying sinuosity
6 Moderately confined valley Chain of ponds
General observations regarding the geomorphic nature of the streams within the northernregion of the SoE Project area include:
Streams are classified into six broad categories, however diversity of stream form withinthese categories was great. Similarly, diversity within catchments, streams and reaches wasalso considerable.
Regardless of stream type, boundary material was variable. All sites consisted of bedmaterial finer than gravel, with gravel-like clay conglomerates prevalent at many sites. Bankmaterial was generally composed of sandy loams, silty clays and clayey silts, although rockoutcropping was observed at three sites (Sites 2A lateritic facies; 25A and 9A weatheredrock; refer Plate 5-1).
Riparian vegetation was generally composed of largely "undisturbed" moderately densetrees with variable ground cover providing additional stability. Swamp-like stream typesgenerally had sparser trees with denser ground cover (refer Plate 5-2). Vegetation densitygenerally decreased markedly with distance from the bank.
Most streams within the study area had high sediment transport potential incisedchannels, with high velocities allow for great sediment transport, irrespective of slope.
Climate was wet dry tropical, yet many of these streams were perennial, with flows of up to2m/s observed during May 2008 in the larger, more incised streams (e.g. Site 25a). Allstudy sites were flowing at the time of inspection.
The point at which aquifer discharge occurred within the catchment (refer Plate 5-3)varies in time throughout the dry season, moving downstream as the water table drops.The different streams have adapted to these variable hydrological conditions within theconstraints of the underlying topography and geology.
Most sites were stable, with very little active bed incision / deposition or major bank scour /failure occurring. Site 4a was an exception at the point of observation major head cuttingwas occurring due to the particularly erodible material at that point below the surface layer.However, upstream (Site 4) and downstream of this point the stream was stable(refer Plate 5-4). It is likely that stability is a consequence of a very old, inherently stablelandscape with both lateral and vertical stability controlled to a large degree by the lateriticfacies within which most of the stream channels sit.
Section 5 Water Resources Page 5-11

Rio Tinto AlcanEnvironmental Impact StatementSouth of Embley Project
Plate 5-1 Bank material (a) fine silt/clay, (b) weathered rock
Plate 5-2 Riparian vegetation (a) Site 9a dense trees and minimalgroundcover; (b) Site 11 denser ground cover and sparse trees
Plate 5-3 Shallow aquifer discharge point
Section 5 Water Resources Page 5-12

Rio Tinto AlcanEnvironmental Impact StatementSouth of Embley Project
(a) (b)
Plate 5-4 Site 4a (a) headcutting stream and upstream stability; (b)downstream stability
Detailed stability ratings for the study sites within Dam C are listed in Appendix 5A to providethe baseline required for future monitoring assessment. All sites were either moderately stableor stable. Vegetation protection was generally rated as moderate (due to the naturallymoderately dense riparian vegetation communities), but still offered adequate additionalstability. The channel types downstream of the proposed locations of the dam walls were bothmeandering incised systems. Both were, however, stable due to outcropping of the lateriticfacies within the bank and bed and the stabilising effect of bank vegetation.
Ward River Catchment
The Ward River catchment was assessed in May 2009. The Ward River catchment waspreviously considered as a location for a water storage dam but this option has not beenpursued. Some direct pumping of water from the lower Ward River is proposed (refer Section5.2.3).
Aerial photographs were reviewed to understand the regional geomorphic setting and the long-term processes that have led to the current estuary and coastal form. Following the desktopassessment, the lower Ward River was navigated between WR1 and WRO5 (refer Figure 5-5)to record field observations and provide an estuary-wide understanding of the generalgeomorphic condition, active low-flow (and tidal) processes and to understand high-flowcondition and processes. At easily accessible points along the channel the adjacent floodplainwas traversed to record floodplain characteristics and processes and to provide an in situdescription of the valley sides bordering the floodplain. A total of 10 sites located upstream anddownstream of the proposed Ward River pump location were inspected during May 2009. Thelocations of the study sites are shown in Figure 5-5.
General Geomorphic Description and Assessment
The Ward River flows into Archer Bay prior to entering the Gulf of Carpentaria. Archer Bay is anunrestricted, tide-dominated estuary. It is a branched bay with off-channel embayments.Freshwater input is dominated by that from the Archer River, although the Ward River is also amajor tributary (OzCoasts 2008). The greater ArcherWard estuary was observed to bedominated by several major features (refer Figure 5-6), including:
beach ridges along the current coastline dissected by the Ward and Archer rivers.Historically these extended between about one and six kilometres inland and were acontinuation of the Holocene beach ridges common to the eastern and southern
Section 5 Water Resources Page 5-13

Rio Tinto AlcanEnvironmental Impact StatementSouth of Embley Project
sections of the Gulf of Carpentaria (Eisma 1998, Smart 1976). These ridges have beenshown to rise up to six metres above mean sea level. This elevation, along with thepresence of shell layers within the ridges and the low variation in Holocene sea levels,suggests they were formed by storm surge and waves (Nott 2006). The deposition ofthese beach deposits appears to have redirected flow of the Ward River into Archer Bayfrom its previous mouth to the north;
an infilling 'lake' at the most downstream point of the Ward River estuary (Ward RiverLake) (refer Plate 5-5a), the condition and form of which appeared to be dictated bythe "choke" point at its most downstream point created by the higher land adjacent toAurukun on the east and the formed beach ridges to the west;
an irregularly meandering river (Ward River) (Plate 5-5b) with a narrow floodplaincomprised of marine-sourced sediments (Plate 5-6) set within the gradually slopingsides of the bauxite plateau (Plate 5-7). The meandering nature of the channelindicated homogeneous bank sediments (Plate 5-8a). Field observations supportedthis and active erosion was observed (Plate 5-8b), suggesting similarly homogeneousmarine-sourced sediments within the greater floodplain (Plate 5-6). Windblowndeposits of sands from coastal and terrigenous sources are expected to be mixed withthe silts and clays, but these were not evident on the surface. The floodplain depositsthat appeared to be recent have occurred as a result of more recent higher mean sealevels, backup of the Ward River flow by the Archer River, or a combination of the two.The deposits were assumed to be set within an old valley incised into the bauxiteplateau. An extensive coring plan would be required for further understanding of thestratigraphy;
small, irregularly meandering streams draining east to west that have cut into thebauxite plateau. The more downstream points of these consisted of similar (butsmaller) floodplain features such as the Ward River;
depressions along the western floodplainplateau margins with small catchmentsdraining the plateau, forming a combination of intermittent and perennial wetlands(Plate 5-9); and
small, irregularly meandering streams draining from the depressions across thefloodplain into Ward River.
The Ward River section of the ArcherWard estuary consists of two main sections: the WardRiver Lake and the narrower meandering section within the floodplain. Within these systemsthere are two main active processes dictating the form and condition of the Ward River estuary:
a wet season backup of the Ward River by the larger discharge of the Archer River,resulting in a poor flushing capability of the Ward River and a largely depositionalenvironment within Ward River Lake. This explains the apparent general infilling of theWard River Lake and in conjunction with the more recent higher mean sea levels hasprobably contributed to past deposition further upstream on what is now the Ward Riverfloodplain. The choke point located at the most downstream point of the Ward River Lakehas probably contributed to these processes; and
dry season channel maintenance flows within the meandering section of the Ward Riverestuary, where freshwater input dominated over the tidal influence, resulting in highenough stream velocities to cause bed and bank erosion, particularly considering the non-cohesive nature of the bank sediments. These flows would also maintain the thalweg withinthe Ward River Lake.
Section 5 Water Resources Page 5-14

Rio Tinto AlcanEnvironmental Impact StatementSouth of Embley Project
Wetland-draining streaSmall east-west draining
B -ach ridges
Source Google Earth
Figure 5-6 Ward River Estuary Geomorphic Features
Section 5 Water Resources Page 5-15

Rio Tinto AlcanEnvironmental Impact StatementSouth of Embley Project
(a) WRO5 (b) WRO4
Plate 5-5 Ward River estuary (a) Ward River Lake; (b) Ward River meanderingchannel
Plate 5-6 Floodplain extent and surficial sediment composition (WR02)
Plate 5-7 Floodplainplateau margin (WR02)
Section 5 Water Resources Page 5-16

Rio Tinto AlcanEnvironmental Impact StatementSouth of Embley Project
(a) WRO3 (b) WRO3
Plate 5-8 Meandering channel banks (a) homogeneous sediments; (b) minorundercutting
Plate 5-9 Western floodplain wetlands (WRO6 and WR07)
Geomorphic Potential Impacts and Mitigation
Geomorphic attributes may be affected by dam construction and operation and the miningprocess, as discussed below.
Dam-Related Impacts and Mitigation
Sediment-related geomorphological impacts may occur during dam construction although theyare expected to be generally of a local and short-term nature. Unplanned sediment runoff mayoccur without adequate controls. This runoff would be of a temporary nature and composedpredominantly of fine (clays, silts) material, although some coarser material may also bereleased. Finer material would run off in plumes following heavy rain events. Coarser materialwould likely be transported downstream as slower-moving pulses, depositing temporarily onbars and in pools. Due to its temporary nature and the existing high sediment transportcapacity of the two streams in question, sediment input from construction activities would notproduce long-lasting impacts on sediment load.
Erosion and sediment control procedures would be prepared prior to construction to mitigatepotential impacts during dam construction.
Section 5 Water Resources Page 5-17

Rio Tinto AlcanEnvironmental Impact StatementSouth of Embley Project
Potential impacts associated with a typical dam may include:
siltation of bed and banks within the upstream sections of the proposed inundation area;
formation of deposition zones (and macrophyte colonisation of these);
contraction of channel and reduction of flow conveyance within the upstream reaches ofthe proposed inundation area;
major reductions in fine and coarse sediment load immediately downstream of theproposed dam resulting from trapping of sediment within the dam;
release of "clear" water during dry season environmental flow releases from the dam, dueto the trapping effect of the dam. This issue should be minimal considering the existing lowsuspended sediment concentrations within dry season flows discussed above;
alterations to bank and bed erosion processes immediately downstream of the damresulting from changes to flow characteristics; and
a gradual reduction in the magnitude of hydrological and sediment transport impacts withdistance downstream, including concurrent impacts on erosional, depositional or habitatmaintenance processes.
However, water flow within the streams of the Project area are naturally "clear" and channelshave adapted to these conditions. As such, many of the geomorphic impacts expected to occurfollowing dam construction either would not apply in this case or the impacts would benegligible.
The primary impact associated with dam operation is change to downstream hydrological andsediment transport regimes and concurrent impacts to in-stream geomorphic integrity andhydraulic habitat. Reducing these flows within the meandering section (where freshwater flowswere prominent during the middle of the dry season) may move the saltwaterfreshwaterinterface further upstream and bring its upstream movement earlier in the seasonal cycle and,as such, may shift this section of the estuary towards tide dominance compared with thecurrent dominance of fluvial processes.
The degree of potential impacts would be largely dependent on dam size, environmental flowreleases and trapping efficiency. The mean natural flow at the proposed Dam C location issummarised in Table 5-6. The dam would be fitted with a low level outlet pipe which wouldpermit the controlled release of environmental flows when required (refer to Section 5.2.3).Sufficient water would be reserved for environmental flows to enable continued release in thedriest months (August to October) of a volume equivalent to 25% of dam inflows. When naturaldam inflows cease, environmental flow releases would cease. Once the dam is full following theonset of the wet season, the spillway would typically overflow on a regular basis. Given thecomparable volumes, environmental releases are anticipated to mitigate the effects of alteredsurface water flow on the upper estuary during the dry season.
Table 5-6 Mean Streamflow at Dam C
Month Mean Streamflow at Dam C(L/s)
July 459
Aug 84
Sept 2
Oct 4
Nov 48
Dec 462
Jan 2374
Feb 5646
Section 5 Water Resources Page 5-18

Rio Tinto AlcanEnvironmental Impact StatementSouth of Embley Project
Month Mean Streamflow at Dam C(L/s)
Mar 6988
Apr 5229
May 2824
June 1279
Annual 2088
Ongoing monitoring of geomorphic assessment sites in Norman Creek downstream of Dam Cwould be conducted. The results of the monitoring would provide a baseline between pre- andpost- construction. If water quality sampling results (refer Section 5.5.1) indicatesedimentation is an issue the sites would be further investigated to evaluate erosion. Inaddition, the following mitigation measures and monitoring would be implemented:
an Erosion and Sediment Control Management Plan would be prepared prior toconstruction;
streamflow gauging stations would be used to monitor streamflows upstream anddownstream of Dam C, as well as two Norman Creek sub-catchments (one to be minedand one non-mined); and
saltwaterfreshwater interface mapping: mapping of representative vegetation ecotonalboundaries (e.g. sclerophyll, riparian/wetland/estuarine) from aerial photography todetect any long-term (decadal) shift; monitoring of surface water for salinity atmonitoring points located in each of the major estuaries.
Mine-Related Impacts and Mitigation
With implementation of the riparian vegetation buffer system, as described in Section 7.9.2,most mine-related geomorphic impacts would be negligible, in terms of impacts on streamgeomorphic integrity. Minor impacts to sedimentation within channels would be expected tosome degree in the most heavily mined catchments as a by-product of reduced velocities, minerunoff, changed hydrological regime (perennial to intermittent / intermittent to ephemeral) andresulting alterations to the sediment transport regime.
5.1.4 Surface Water Quality
This section describes existing surface water quality conditions both upstream, downstream andwithin the Project area. Where applicable, results are compared with the Australian and NewZealand Guidelines for Fresh and Marine Water Quality (ANZECC/ARMCANZ, 2000).
A total of 25 locations within different catchments and habitat types were sampled over multipleseasons. The spatial and seasonal variation in sampling was designed to account for thevariation in wet and dry season climatic conditions that influence surface water in the Projectarea. The locations of the sampling sites are shown in Figure 5-3.
Four rounds of sampling were initially undertaken for the EIS:
mid dry season between 30 August and 1 September 2007 (10 locations);
late dry season between 26 and 30 November 2007 (12 locations);
wet season between 26 February and 3 March 2008 (19 locations); and
early dry season between 22 and 25 May 2008 (19 locations).
After this sampling, an additional water supply dam in the Ward River catchment was proposedfor the Project, and additional sampling was completed in this river system (along with somerepeat sampling elsewhere). Three additional rounds of sampling were undertaken:
late dry season between 4 and 11 December 2008 (12 locations);
Section 5 Water Resources Page 5-19

Rio Tinto AlcanEnvironmental Impact StatementSouth of Embley Project
wet season between 24 February and 3 March 2009 including the additional Wardcatchment sites (22 locations); and
early dry season on 18 and 19 May 2009 (5 locations; Ward only).
The category and catchment of each sampling location are summarised in Table 5-7.
Table 5-7 Sampling Location by Category and Catchment
Category Catchment Locations
Freshwater Norman Creek 1A, 2A, 4, 5A, 7A
Triluck Creek 9, 9A, 19
Ward River 14A, 25A
Ina Creek 26, 31
Norman Creek 11, 24
Tree swamps Ward River WP16, WP18, 22
Hey River 27
Norman Creek 23
Estuarine Ward River WP8
Norman Creek 10A, 10B, 21
Lagoon (back dune) Norman Creek 16A
Marine Ward River WP05
Representative habitat types were sampled at multiple locations in the main catchments. Thecharacteristics of sampling locations are summarised in Table 5-8.
At each site, physicochemical conditions were measured using a multi-parameter water qualitymeter and water samples were collected for laboratory analysis. Sampling was conducted inaccordance with the Queensland EPA Water Quality Sampling Manual (EPA 1999), except wherenoted below. Samples were analysed for physiochemical parameters, cations, anions, nutrientsand a suite of total and dissolved metals. Select samples were also analysed for hydrocarbons.
For the analysis of metals, other than calcium, magnesium, potassium and sodium, field andlaboratory procedures were modified to achieve ultra trace levels (below 1pg/L). Ultra tracelevels were sought because the default low reliability trigger value of ANZECC/ARMCANZ (2000)for aluminium in freshwaters with pH below 6.5 (as are the waters in this area) of 0.8pg/L isless than commercial laboratory detection limits. The only laboratory in Australia that is able toachieve levels of resolution for aluminium at or below this level on a commercial basis is theCSIRO Centre for Environmental Contaminants Research (CECR) laboratory at Lucas Heights,NSW. This laboratory was contracted to undertake the trace metals analyses, with otherparameters subcontracted to the National Measurement Institute (NMI) in Sydney. CECRprepared all sampling and sample filtration equipment for the Project, and shipped them toWeipa.
Field sample collection required two persons, using a "clean hands""dirty hands" procedure.The person taking the sample wore two pairs of unpowdered nitrile gloves, and only handledthe trace metals sample bottles after the seal on the two zip-lock plastic bags that containedthe bottle had been opened by the other person, who also wore unpowdered nitrile gloves. Thesamples were collected below the water surface, by placing the opened bottle into the water,initially with the opening facing downstream, and then rotating the bottle underwater to faceupstream. The bottle was rinsed three times in site water, then filled and capped underwaterbefore removal from the water and placement back into the two zip-lock plastic bags andresealing of the bags. A paper label was placed inside the outer plastic bag. Field filtration forfiltered metal samples was conducted either in an air-conditioned room, or in a dedicated tent
Section 5 Water Resources Page 5-20

Rio Tinto AlcanEnvironmental Impact StatementSouth of Embley Project
Table 5-8 Sampling Location, Habitat and Catchment
Sampling Habitat typeLocation
Catchment
1A Perennial channel hosted pools/lagoons Norman Creek (eastern tributary)
2A Semi-perennial stream (flowing) Norman Creek (northern tributary)
4 Seasonal stream channel (flowing) Norman Creek (northern tributary)
5A Perennial stream (flowing) Norman Creek (eastern tributary)
7A Perennial stream (flowing) Norman Creek (eastern tributary)
9 Seasonal stream channel (flowing) Winda Winda Creek
9A Perennial channel hosted pools/lagoons Winda Winda Creek
10A Estuary (tidal) Norman Creek
10B Estuary (tidal) Norman Creek
11 Seasonal tree swamp with perennial stream(flowing)
Norman Creek (northern tributary)
14A Seasonal stream channel (flowing) Coconut Creek
16A Semi-perennial coastal lakes/lagoons (pool) Pera HeadBackdune lagoon
19 Seasonal stream channel (flowing) Triluck Creek
21 Estuary (tidal) Winda Winda Triluck Creek
22 Seasonal tree swamp (pool with seasonal flowingspring)
Coconut Creek / Ward River
23 Seasonal tree swamp (pool) east of False Pera Head
24 Seasonal stream channel (flowing) un-named drainage False Pera Head
25A Seasonal stream with perennial channel hostedpools (tidally influenced in dry season)
Ward River downstream of Coconut andTapplebang Creek confluence
26 Seasonal stream with semi-perennial channelhosted pools
Ina Creek
27 Seasonal tree swamp (pool) Hey River
WP8 Estuary (tidal) Ward River
WP14 Estuary (tidal) Ward River
WP16 Seasonal tree swamp (pool) Ward River
WP18 Seasonal tree swamp (pool) Ward River
with dust-proof door seals, using acid washed and rinsed syringes and 0.45pm filters. All tracemetal bottles and filtration equipment were acid washed, rinsed and sealed by CECR beforeshipment to Weipa. Bottles for other parameters were provided by NMI and were stored ineskies before and after sampling. Samples were kept cold in the field on ice bricks in an esky ora portable fridge/freezer, and kept in a refrigerator at or near 4°C until shipping in eskiescontaining ice bricks to Sydney for analysis. Nutrient samples were kept frozen where possibleor at 4°C where not possible to freeze them.
It was recognised that the modified field and laboratory procedures are not feasible for long-term data collection and thus duplicate samples were collected in May 2009 for analyses by acommercial laboratory (ALS Environmental, a NATA-accredited laboratory) and commercial low-level detection limits were requested.
Section 5 Water Resources Page 5-21

Rio Tinto AlcanEnvironmental Impact StatementSouth of Embley Project
Results
Field and laboratory results are summarised in Tables 5-9 to 5-11 by surface water category:freshwater streams, freshwater tree swamps and estuarine/marine, respectively. In general,freshwater stream locations (refer Table 5-9) were flowing at the time of sampling but thisgroup contains some samples from pools (26A, 9A, 1A, 11 and 25A) whereas tree swamps(refer Table 5-10) represent stagnant water. The full water quality data set is available fromRTA.
The 20th and 80th percentiles of measured parameters were calculated for categories with morethan five data points and these are presented along with the median (50th percentile) value inTables 5-9 to 5-11.
The Environmental Protection (Water) Policy 2009 (Qld) (EPP (Water)) consists of a frameworkthat identifies environmental values (EVs) and water quality objectives (WQOs) to enhance orprotect EVs. However, WQO's have not yet been established for the Cape York region.Therefore, in conformity with the Queensland Water Quality Guidelines (DERM 2009a), thenational guidelines (ANZECC) described below have been used for comparison purposes.
The results are discussed below and are compared with:
Local data other habitat categories in the Project area;
Regional data northern Australian tropical waters; and
National guidelines Australian and New Zealand GuidelinesWater Quality (ANZECC/ARMCANZ 2000).
The following data from northern Australian tropical waters has been5-12.
for Fresh and Marine
summarised in Table
metal concentration data from a reference stream in the Gove bauxite deposit area andgeneral parameter data from the wider Gove area (RTA data and Zaar et al. 1999);
streams from baseline sampling in the Ely bauxite deposit area, north of Weipa (RTAdata);
post- first flush wet season flows in Magela Creek in the Alligator Rivers Region in theNorthern Territory (data from Hart et al. 1987);
rivers in the southern Gulf of Carpentaria and the Mitchell River, southern Cape YorkPeninsula (Hydrobiology 2004a); and
Mary River catchment, Northern Territory (Shultz et al. 2002).
ANZECC/ARMCANZ (2000) proposes water quality guidelines designed to protect the EVs ofaquatic ecosystems. The guidelines are not mandatory standards; rather, they provide a risk-based decision framework, wherever possible, to enable the development of guideline triggervalues for application at local and/or regional scales. The guidelines provide default waterquality trigger values and a process to derive guideline trigger values tailored to the localenvironment, where required. In cases where baseline water quality parameters exceed defaulttrigger values, it is recommended that local or regional trigger values are derived based on astatistical analysis of the baseline dataset. In some instances, default guidelines have not beendeveloped due to data deficiencies and low reliability or interim working levels have beenproposed for comparative purposes.
pH
The streams and tree swamps were generally acidic. The 20th percentile field pH of bothstreams and tree swamps was 4.6 and the 80th percentile pH was 5.8 and 5.5 respectively. ThepH of Project area freshwaters is typically at the lower end of the range of other freshwatertropical streams and typically below the ANZECC/ARMCANZ default trigger value of 6.
Section 5 Water Resources Page 5-22

Rio Tinto AlcanEnvironmental Impact StatementSouth of Embley Project
The pH of marine waters ranged from 7.0 to 7.7 and was within the ANZECC/ARMCANZ rangeof 7 to 8.5. Estuarine waters exhibited a wider pH range of 5.1 to 7.7 owing to the seasonalinflow of freshwater.
Table 5-9 SoE Project Freshwater Stream Quality StatisticsParameter units Min Max Mean Median 20th percent 80th percent n ANZECC
Freshwater
95%
Hardness
modified
ANZECC
guideline
Commercial
laboratory LOR
Field pH-fld pH 4.0 6.9 5.3 5.4 4.6 5.8 44 6-8
EC uS/cm 12 91 26 21 18 30 56 20-250
ORP mV -21.5 252 128 148 41.6 211 45
Turb NTU 0.1 930 19 1.4 0.4 4.2 58 2-15
Temperature °C 23.2 41.0 28.2 28.1 26.6 29.6 58
DOpc %
saturation
31.5 105 78.2 79.1 74.3 87.0 17 85-120
DO mg/L 0.6 7.8 5.1 5.6 4.2 6.4 48
Cations / Ca-F mg/L 0.005 1.6 0.1 0.06 0.03 0.15 56
Anions! Mg-F mg/L 0.09 1.6 0.4 0.3 0.2 0.4 56
Nutrients Hard mg 0.4 9 1.9 1.3 0.82 2.0 56
CaCO3/L
Si-F ug/L 1.1 3200 592 135 9.0 892 18
K-F mg/L 0.003 1.2 0.09 0.03 0.03 0.03 56
Na-F mg/L 0.6 8.8 3 2.4 1.5 3.2 56
CI mg/L 2.8 33 6 4.2 3.3 6.4 56
Alkalinity pH 3 10 3.3 2.5 2.5 2.5 57
Total
phosphorus
mg/L 0.01 0.06 0.03 0.03 0.03 0.03 27 0.01a
NH4-N mg/L 0.003 0.45 0.02 0.003 0.003 0.01 48 0.01a
Total nitrogen
as N
mg/L 0.03 1.1 0.10 0.03 0.03 0.09 49 0.2-0.3a
NOx mg/L 0.01 0.01 0.01 0.01 0.01 0.01 49 0.01a
TDS mg/L 9 280 21 13 10 20 56
TOC mg/L 2 11 3.8 3 2 8.8 7
DOC mg/L 0.5 10 1.8 1 0.5 2.4 19
SO4 mg/L 0.05 6.5 1 0.1 0.05 3.7 56
Metals ALF ug/L 0.1 668 40 18 6.2 40 57 0.8d 5
Al-T ug/L 19 1820 169 68 29 140 57 0.8d 5
Fe-F ug/L 2 553 46 11 5 65 57 300b 50
Fe-T ug/L 5 4940 276 36 10 179 57 300b 50
Cr-F ug/L 0.005 0.56 0.06 0.03 0.02 0.08 57 la 0.078 1
Cr-T ug/L 0.005 0.47 0.09 0.05 0.02 0.13 57 la 1
Mn-F ug/L 0.02 80 3.9 0.94 0.33 2.55 57 1900 1
Mn-T ug/L 0.1 213 7.6 1.03 0.49 2.80 57 1900 1
Ni-F ug/L 0.005 0.28 0.04 0.02 0.01 0.06 57 11 0.783 1
Ni-T ug/L 0.001 0.48 0.06 0.02 0.01 0.08 57 11 1
Cu-F ug/L 0.003 0.39 0.03 0.01 0.01 0.03 57 1.4 0.100 1
Cu-T ug/L 0.003 1.92 0.09 0.02 0.01 0.13 57 1.4 1
Zn-F ug/L 0.004 7.1 0.61 0.08 0.03 0.38 57 8 0.570 5
Zn-T ug/L 0.005 3.1 0.22 0.04 0.01 0.21 57 8 5
As-F ug/L 0.005 0.44 0.06 0.03 0.02 0.05 57 13e 1
As-T ug/L 0.003 0.43 0.06 0.03 0.02 0.06 57 13e 1
Cd-F ug/L 0.0002 0.02 0.003 0.002 0.001 0.003 56 0.2 0.013 0.1
Cd-T ug/L 0.0002 0.09 0.005 0.002 0.001 0.003 56 0.2 0.1
Pb-F ug/L 0.001 0.65 0.05 0.02 0.01 0.05 56 3.4 0.066 1
Pb-T ug/L 0.005 1.03 0.10 0.05 0.03 0.13 56 3.4 1
Notes:
*: LOR maybe elevated if matrix interference (e.g. salts) in sample
a. ANZECC Default trigger values for Tropical Australian Lowland Rivers
b: interim working level
a: assumes all as Cr(VI)
d: low reliability working level , pH<6.5
e: assumes all As(V)
Section 5 Water Resources Page 5-23

Rio Tinto AlcanEnvironmental Impact StatementSouth of Embley Project
Table 5-10 SoE Project Freshwater Tree Swamp Stream Quality StatisticsParameter units Min Max Mean Median 20th percent 80th percent n ANZECC
Freshwater95%
HardnessmodifiedANZECCguideline
Commerciallaboratory LOR
Field pH-fld pH 4.2 6.6 5.1 4.9 4.6 5.5 11 6-8EC uS/cm 15 136 43 26 22 29 12 20-250ORP mV 52 331 147 84 61 248 9
Turb NTU 0.1 3.7 1.6 1.1 0.3 3.4 11 2-15Temperature °C 23.9 34.5 28.7 28.4 26.8 30.1 13
DOpc % saturation 52 78 52 25 16 61 14 85-120DO mg/L 1.3 6.0 3.4 3.1 2.3 4.6 10
Cations/A Ca-F mg/L 0.008 0.60 0.15 0.07 0.02 0.17 12
nions/Nutr Mg-F mg/L 0.08 2.0 0.55 0.30 0.27 0.46 12lents Hard mg CaCO3 /L 0.36 9.7 2.6 1.4 1.2 2.3 12
Si-F ug/L 46 3700 835 350 106 838 7
K-F mg/L 0.03 0.36 0.09 0.03 0.03 0.13 12Na-F mg/L 0.55 16 4.6 3.4 1.9 3.8 12
CI mg/L 2.8 29 8.3 4.9 3.4 5.4 12
Alkalinity pH 2.5 8.0 3.0 2.5 2.5 3 12
Totalphosphorus
mg/L 0.03 0.025 0.03 0.03 0.03 0.03 7 0.01a
NH4-N mg/L 0.003 0.02 0.01 0.003 0.003 0.01 12 0.01aTotal nitrogenas N
mg/L 0.03 0.41 0.1 0.03 0.03 0.23 12 0.2-0.3a
NOx mg/L 0.01 0.005 0.01 0.01 0.01 0.01 12 0.01'TDS mg/L 10 3640 322 16 13 23 12
TOC mg/L NA NA NA NA NA NA NADOC mg/L 0.5 10 3.7 2.5 1 6.2 8SO4 mg/L 0.05 11 1.5 0.2 0.05 0.4 11
Metals Al-F ug/L 3.0 108 44.7 40.5 19.7 73.1 12 0.8d 5
Al-T ug/L 13.0 189 84.5 72.6 37.7 135 12 0.8d 5
Fe-F ug/L 0.05 1920 251 11.5 2.4 32.2 12 300' 50
Fe-T ug/L 2.0 2450 334 12.5 7.8 32.7 12 300" 50
Cr-F ug/L 0.01 0.24 0.06 0.02 0.01 0.10 12 1c 0.078 1
Cr-T ug/L 0.01 0.29 0.1 0.03 0.015 0.12 12 1c 1
Mn-F ug/L 0.01 7.3 1.4 0.36 0.16 1.9 12 1900 1
Mn-T ug/L 0.01 7.1 1.4 0.47 0.18 2.0 12 1900 1
Ni-F ug/L 0.01 0.26 0.1 0.03 0.02 0.06 12 11 1
Ni-T ug/L 0.01 0.27 0.1 0.04 0.02 0.05 12 11 1
Cu-F ug/L 0.005 0.11 0.02 0.01 0.01 0.02 10 1.4 0.783 1
Cu-T ug/L 0.005 0.14 0.03 0.01 0.01 0.03 11 1.4 1
Zn-F ug/L 0.01 2.4 0.36 0.10 0.03 0.42 12 8 0.100 5Zn-T ug/L 0.01 2.3 0.4 0.14 0.03 0.57 12 8 5
As-F ug/L 0.01 0.44 0.08 0.03 0.02 0.06 12 13° 0.570 1
As-T ug/L 0.01 0.49 0.09 0.03 0.02 0.06 12 13° 1
Cd-F ug/L 0.0002 0.006 0.002 0.002 0.001 0.003 12 11
Cd-T ug/L 0.0002 0.009 0.003 0.003 0.001 0.003 12 11
Pb-F ug/L 0.005 0.082 0.025 0.017 0.010 0.034 12 3.4 1
Pb-T ug/L 0.013 0.059 0.034 0.038 0.015 0.049 12 3.4 1
Notes:": LOR maybe elevated if matrix interference (e.g. salts) in samplea: ANZECC Default trigger values for Tropical Australian Lowland Riversb. interim working level
c: assumes all as Cr(VI)
low reliability working level , pHe6.5
e: assumes all As(V)NA: not analyzed
Section 5 Water Resources Page 5-24

Rio Tinto AlcanEnvironmental Impact StatementSouth of Embley Project
Table 5-11 SoE Project Estuarine and Marine Water Quality Statistics
Parameter unitsEstuary (WP8, 10A, 10B, 21)
Min Max Mean Median 20th percent 80th percent n
WP14 Ward River Marine
Min Max Mean Median 20th percent 80th percent n Min
16A Pera Head Back dune Lagoon
Max Mean Median 20th percent 80th percent nANZECCMarine 95%
pH-Id pH 5.1 7.7 6.3 6.3 5.7 6.7 11 7.0 7.7 7.3 7.3 NA NA 3 4.5 8.2 6.2 6.2 5.1 7.1 6 7-8.5EC uS/cm 50 51592 16600 2100 430 45300 11 19000 53233 35478 34200 NA NA 3 13 14412 2889 287 69 2266 6ORP mV -104.1 366 79 69 -19 135 9 -32 322 110 41 NA NA 3 -51.9 133 76.9 108 57.2 115 5Turb NTU 1.2 5 2.7 2.6 1.54 3.3 12 5.9 16.5 10.6 9.5 NA NA 3 0.8 14 4.7 3.0 1.1 6.2 6 1-20Temperature °C 25.1 32.2 28.6 28.6 26.4 31 11 29.4 30.2 29.8 29.9 NA NA 3 22.4 42.9 30.5 29.6 26.6 31.6 6DOpc % saturation
46 83 65 60 56 79 5 64 109 85 82 NA NA 3 64 118 91 91 NA NA 2 80-120DO mg/L 2.3 6.0 4.3 4.6 3.2 5.0 9 4.0 5.9 4.9 4.9 NA NA 2 4.3 8.7 5.9 4.8 4.7 7.2 5Ca-F mg/L 0.19 450 119 14.6 2.08 328 12 96 410 239 210 NA NA 3 0.2 160 45 6.3 0.39 98 6Mg-FHard
mg/Lmg
0.72 1390 1376 49 6.4 1050 12 300 1310 750 640 NA NA 3 0.78 340 117 18.4 1.5 320 6
CaCO3/L 3.4 6848 2156 238 24 6049 10 1475 6418 3684 3160 NA NA 3 3.7 1800 676 9.0 6.5 1610 5Si-F ug/L 0.79 3500 1300 1150 2 2000 6 0.9 2600 1150 850 NA NA 3 7.5 2600 1304 1304 NA NA 2K-F mg/L 0.16 430 112 14.6 2.2 299 12 110 420 237 180 NA NA 3 0.17 97 33 6.9 0.41 87 6Na-F mg/L 5.6 12700 3379 420 64.6 9502 12 2570 12100 6827 5810 NA NA 3 7.7 2510 875 173 16 2370 6CI mg/L 12 18000 5151 1100 142 12940 12 5100 20000 13367 15000 NA NA 3 15 4200 1403 385 31 3400 6AlkalinityTotal
pHmg/L
2.5 96 26 15 3.2 33 12 3 110 51 40 NA NA 3 10 24 15 12 10.6 17 4
phosphorus 0.02 0.14 0.05 0.03 0.03 0.06 7 0.03 0.14 0.06 0.03 NA NA 3 0.03 0.18 0.08 0.03 NA NA 3 0.02"NH4-N mg/L 0.003 0.04 0.008 0.003 0.003 0.013 11 0.003 0.03 0.02 0.03 NA NA 3 0.003 1.8 0.36 0.003 0.003 0.37 5 0.015'Total nitrogen mg/L 0.72 0.22 0.17 0.14 0.22 9as N 0.06 0.12 0.26 0.18 0.15 NA NA 3 0.025 4.8 1.2 0.18 0.025 1.6 5 0.25'NOx mg/L 0.01 0.03 0.01 0.005 0.005 0.005 11 <0.01 <0.01 <0.01 <0.01 NA NA 3 0.005 0.01 0.006 0.005 0.005 0.006 5 0.03'TOC mg/L 3 5 4 4.00 NA NA 2 4 4 4 4 NA NA 1 52 52 52 52 NA NA 1
DOC mg/L 0.5 5 2.2 2.00 1.4 2.6 8 2 4 2.7 2 NA NA 3 1 52 19 3 1.8 32.4 3TDS mg/L 33 32000 9495 2250 332 23000 12 9910 34000 21303 20000 NA NA 3 44 8800 2940 860 77 7000 6Al-F ug/L 0.1 15 4.8 4 1.8 7.4 13 0.5 3 1.8 2 NA NA 3 1.7 850 268 50.5 3.6 650 6 0.5dAl-T ug/L 0.5 559 110 56 27 147 13 475 1980 1205 1160 NA NA 3 12 68 29 21 12 40 6 0.5dFe-F ug/L 0.5 85 24 13 3.8 31 13 1 4 2 1 NA NA 3 25 718 219 104 33 327 6Fe-T ug/L 0.5 742 267 218 174 409 13 279 1410 710 440 NA NA 3 8.4 414 123 52.7 11.6 198 6Cr-F ug/L 0.005 0.1 0.05 0.02 0.02 0.09 11 0.04 0.25 0.18 0.25 NA NA 3 0.015 0.28 0.13 0.12 0.03 0.21 6 4.4Cr-T ug/L 0.005 0.7 0.18 0.11 0.05 0.21 12 0.4 1 0.7 0.7 NA NA 2 0.015 0.61 0.28 0.23 0.08 0.50 6 4.4Mn-F ug/L 0.005 8.7 3.3 2.5 1.5 4.1 2.2 2.2 2.2 2.2 NA NA 1 0.29 42.6 11.1 2.3 0.33 19.1 6 sodMn-T ug/L 0.005 9.8 3.4 2.8 1.0 4.4 13 13 13 13 NA NA 1 0.37 44.5 11.4 2.1 0.64 18.9 6 sodNi-F ug/L 0.005 0.47 0.11 0.05 0.02 0.16 11 0.22 0.24 0.23 0.23 NA NA 2 0.01 1.06 0.27 0.03 0.01 0.48 6 70Ni-T ug/L 0.01 0.43 0.14 0.09 0.03 0.23 12 0.34 0.69 0.52 0.52 NA NA 2 0.01 0.98 0.32 0.06 0.02 0.81 6 70Cu-F ug/L 0.005 0.19 0.06 0.01 0.005 0.11 11 0.12 0.19 0.16 0.16 NA NA 2 0.01 0.43 0.13 0.06 0.03 0.23 6 1.3Cu-T ug/L 0.005 0.2 0.09 0.08 0.01 0.15 12 0.19 0.36 0.28 0.28 NA NA 2 0.01 0.99 0.25 0.12 0.02 0.26 6 1.3Zn-F ug/L 0.015 3.4 0.72 0.5 0.04 0.65 11 0.09 0.23 0.16 0.16 NA NA 2 0.04 6.49 1.36 0.25 0.15 0.96 6 15Zn-T ug/L 0.015 1.2 0.40 0.33 0.06 0.66 12 0.33 0.93 0.63 0.63 NA NA 2 0.04 6.33 1.65 0.27 0.04 2.98 6 15As-F ug/L 0.01 0.49 0.17 0.12 0.03 0.26 11 NA NA NA NA NA NA 0 0.02 4.86 1.02 0.19 0.04 0.83 6As-T ug/L 0.01 0.52 0.25 0.19 0.06 0.42 11 NA NA NA NA NA NA 0 0.03 5.3 1.13 0.21 0.07 0.95 6Cd-F ug/L 0.002 0.03 0.01 0.004 0.003 0.01 10 0.007 0.008 0.008 0.008 NA NA 2 0.002 0.09 0.02 0.003 0.002 0.02 6 5.5Cd-T ug/L 0.003 0.04 0.01 0.004 0.003 0.01 11 0.01 0.02 0.02 0.02 NA NA 2 0.002 0.06 0.01 0.002 0.002 0.005 6 5.5Pb-F ug/L 0.002 0.08 0.02 0.009 0.003 0.03 9 0.004 0.11 0.06 0.06 NA NA 2 0.01 0.14 0.05 0.03 0.02 0.07 6 4.4Pb-T ug/L 0.002 0.15 0.06 0.05 0.04 0.09 11 0.14 0.39 0.26 0.26 NA NA 2 0.01 0.50 0.18 0.12 0.04 0.28 6 4.4
Notes:
* LOR may be elevated if matrix interface (e.g. salts) in sample
ANZECC Default trigger values for Tropical Australian Lowland Rivers
b Interim working level
assumes all as Cr(VI)
d low reliability working level, pH<6.5
e assumes all As(V)
NA: not analysed/applicable
Section 5 Water Resources Page 5-25

Rio Tinto AlcanEnvironmental Impact StatementSouth of Embley Project
Table 5-12 Comparison of Fresh Water Quality in Tropical StreamsLocation South of Embley Gove, NT Ely, Qld. Magela Creek, NT Mitchell River, Qld. Gregory River, Qld. Nicholson River,
Qld.Mary River, NT
Reference This project all
freshwaterRTA data and Zaar
et al. 1999RTA data Hart et al. (1987) Hydrobiology (2004) Hydrobiology (2004) Hydrobiology (2004) Shultz et al. (2002)
Field Physico-ChemistrypH Field 4.0-6.9 5.4-7 4.5-6.6 4.8-6 6-9.6 6-9 6-9 6-8
EC (pS/cm) 12-136 9-390 3-11.8 5.4-50 36-400 55-700 33-700 12-342
Turbidity (NTU) 0.1-930 <0.1-4.7 0.7-40
Dissolved Oxygen (% saturation) 31.5-105 28-97 25-102
Dissolved Oxygen (mg/L) 0.55-7.8 3-7.9 2.2-8.8
Major Anions/Cations & SolidsCa filtered (mg/L) 0.005-1.6 1-144 <0.1-3.2 <0.1-1.8 0.7-53 5-104 1-34
Mg filtered (mg/L) 0.08-2 0.5-1 0.2-10 0.2-2.7 0.1-12.3 2-58 1-54
K filtered (mg/L) 0.003-1.2 0.7-2 0.2-1.1 0.5-5.4 0.3-6 1-9
Na filtered (mg/L) 0.55-16 7-12 0.6-3.7 2-34 1-124 1-92
CI filtered (mg/L) 2.8-33 <1-9 0.78-34 1-165 2-165
Hardness (mgCaCO3 /L) 0.36-9.7 4-12 <1-3.6 1.1-15.6 2-157 31-406 7-290 3.2-153
Alkalinity (mgCaCO3 /L) 2.5-10 4-4.5 4.1-174 20-435 8-301 4-200
Silica (mg/L) 1.1-3700 3-29
Sulphate (mg/L) 0.05-11 1-410 2-9 0.32-12.5 1-12 2-12
Total Organic Carbon (mg/L) 2-4 1-5
NutrientsTotal Phosphorous (mg/L) 0.02-0.063 <2-3 <0.02 <0.01-0.03 0.001-0.036
Ammonium-N (mg/L) 0.003-0.45 <0.01 <0.01-0.04
Total Nitrogen (mg/L) 0.025-1.1 0.05-0.25 <0.05-0.18 <0.03-0.32
Oxides of Nitrogen (mg/L) <0.01-0.01 0.2-2 <0.01-0.42 0.0005-141 0.2-11 0.4-2
MetalsAl filtered (pg/L) 3-668 <5-23
Al total (pg/L) 13-1820 5-260
As filtered (pg/L) 0.005-0.44 <5-5
As total (pg/L) 0.003-0.49 <1
Cd total (pg/L) 0.0002-0.02 <0.1
Cr total (pg/L) 0.005-0.47 <1-2 0.1-6 <1
Cu filtered (pg/L) 0.003-0.39 <0.2-1.2
Cu total (pg/L) 0.0025-0.73 1-2 <1-12
Fe filtered (pg/L) 0.05-1920 50-420 34-2600
Fe total (pg/L) 2-4940 110-3900 44-1200
Mn filtered (pg/L) 0.01-79.5 2-8
Mn total (pg/L) 0.01-213 <1-94 11749 3.8-390
Ni total (pg/L) 0.001-0.48 0.1-0.4 <1-16
Pb filtered (pg/L) 0.0005-0.65 <1-1 <0.2-0.4
Pb total (pg/L) 0.005-1.03 <1-1 <1
Zn filtered (pg/L) 0.004-7.1 <5 <0.5-1.8
Zn total (pg/L) 0.005-3.1 <5-13 <1-200
Section 5 Water Resources

Rio Tinto AlcanEnvironmental Impact StatementSouth of Embley Project
Electrical Conductivity
The electrical conductivity of freshwaters ranged from 12 to 136 microsiemens per centimetre(pS/cm). The median conductivity for freshwater tree swamps was 27pS/cm, similar to themedian for freshwater streams (21pS/cm). The fresh surface waters of the Project area weretypically at the lower end of the conductivity range found in other tropical streams, althoughhigher than Ely stream water. The ANZECC/ARMCANZ default conductivity trigger values forfreshwater ranges from 20 to 250pS/cm for upland and lowland rivers. The single backdunelagoon (site 16A at Pera Head), was intermediate in its characteristics, but became brackish inDecember 2008, when king tides breached the dune system at its mouth, and it remainedbrackish in March 2009 with a conductivity of 2,266pS/cm.
During the late dry season, conductivity in pools within streams that became isolated fromother surface or ground waters (e.g. isolated deep clay lined pools in Winda Winda Creek (site9A)) increased moderately from 26pS/cm (September 2007) to 80pS/cm (November 2007).
The water quality characteristics of the Project area reflect the nature of water flowing throughand within bauxite terraces, with the ferro-alluminosilicate matrix of the laterite layers acting asa physical and chemical filter for particulates resulting in very clear, almost salt-free surfacewaters. The low conductivity of the Project area surface waters presents challenges both to theaccurate measurement of its chemical characteristics and comparison with appropriateguidelines (refer Section 8.5.1).
Conductivity in estuaries ranged from 50 to 51,590pS/cm, reflecting the tidal influence.Conductivity was less variable in marine waters, ranging from 19,000 to 53,200pS/cm.
During December 2008, at a time when the upper Ward estuary (site WP8) was tidallyinfluenced, there appears to have been groundwater upwelling along the bed of the upperestuary. In places this was strong enough to maintain a slight lowering (11pS/cm) of salinitynear the bottom, the reverse of the situation in the lower estuary (WP14) which had a layer ofslightly more brackish water at the surface (refer Figure 5-7). This demonstrates the influenceof groundwater inflows into the estuaries on water quality, particularly in the late dry seasonwhen surface freshwater flows have ceased in some streams.
0
1
3
4
WP8WP14
32700 32800 52500
Conductivity uS/cm
53000 53500
Figure 5-7 Conductivity Profiles in Upper (WP8) and Lower (WP14) Ward RiverEstuary
Section 5 Water Resources Page 5-27

Rio Tinto AlcanEnvironmental Impact StatementSouth of Embley Project
Turbidity
Freshwater turbidity was very low, with a median of 1.1NTU in tree swamps and 1.4NTU instreams. This is lower than most tropical streams, but comparable to that found in the Elybauxite deposit area. The ANZECC/ARMCANZ range for turbidity is 2 to 15NTU in freshwater.The surface waters of the Project area are characterised by high clarity.
Turbidity in estuarine waters ranged from 1.2 to 5NTU, with a median value of 2.6NTU.Turbidity increased in marine waters, with a range of 5.9 to 16.5NTU and a median value of9.5NTU. The ANZECC/ARMCANZ range for turbidity is 1 to 20NTU in marine waters and theProject estuarine and marine waters are within this range.
Nutrients
The ANZECC/ARMCANZ (2000) default guideline criteria for ammonium, total nitrogen and totalphosphorus were exceeded by select freshwater and estuarine/marine samples and arediscussed below.
A maximum concentration of 0.06mg/L total phosphorus, 1.1mg/L total nitrogen and 0.45mg/Lammonium was recorded for freshwater, which exceeded the ANZECC/ARMCANZ (2000)guideline for tropical lowland rivers of 0.01 total phosphorus, 0.2-0.3mg/L total nitrogen and0.01mg/L ammonium.
Estuarine and marine waters had higher concentrations of total phosphorus, total nitrogen andammonium when compared with project freshwater. The maximum concentration of totalphosphorus estuarine/marine waters was 0.18mg/L. The maximum concentration of totalnitrogen in estuarine/marine waters was 4.8mg/L and ammonium was 1.8mg/L.
The nutrient levels were generally at or near the level of resolution of the analyses for all otheranalytes in freshwater samples. Despite the generally low concentrations of solutes, surfacewaters contribute nutrient inputs into the drainage networks, thereby affecting downstreamproductivity (refer Section 8.5.1). Nutrient levels in the Project area freshwaters weregenerally as low as or lower than that of Ely, Magela Creek, Gove, and/or Mary River.
Dissolved Organic Carbon
The concentration of dissolved organic carbon ranged from 0.5 to 10mg/L in freshwatersamples with a median of 1mg/L in stream samples and 2.5mg/L in tree swamp samples. Theconcentration of dissolved organic carbon in estuarine sample ranged from 0.5 to 5mg/L with amedian of 2mg/L. Organic carbon can complex some trace metals, such as aluminium, copper,zinc and cadmium into non-biologically available forms (ANZECC/ARMCANZ 2000). Based onthese results in the fresh surface waters of the Project area dissolved organic carbon is notconsidered an appreciable contributor to metal complexation.
Hardness
Freshwater hardness ranged from 0.4 to 9mg/L CaCO3. Freshwater hardness was predominantlyvery low with a median of 1.4mg/L CaCO3 in freshwater tree swamps and 1.3mg/L CaCO3 infreshwater streams.
Hardness in estuarine waters ranged from 3.4 to 6,800mg/L CaCO3, reflecting seasonalfreshwater inflows, with a median value of 238mg/L CaCO3. The range in marine waters wasfrom 1,475 to 6,418mg/L CaCO3, with a median value of 3,160mg/L CaCO3.
The hardness for the Project area fresh surface waters was generally lower than for othertropical streams, but comparable to that for the Ely area, Gove and Magela Creek.
Hardness may affect metal toxicity in two ways: first, in terms of the competition for uptakesites between calcium and other metals; and second, as an indicator for the potential forinorganic complexation of metals in solution into forms of low bioavailability. Therefore, somemetals have hardness dependent trigger values and the ANZECC/ARMCANZ (2000) guidelinesprovide a mechanism for adjustment of the trigger values for hardness. Weiner (2008) classifiessoft waters as being waters with hardness below 75mg/L CaCO3. The hardness of fresh surfacewaters in the Project area is less than 30mg/L CaCO3 (with the exception of three outliers
Section 5 Water Resources Page 5-28

Rio Tinto AlcanEnvironmental Impact StatementSouth of Embley Project
December 2008 when king tides had caused saltwater intrusion into certain sites affecting bothconductivity and hardness). All other hardness measurements were less than 10mg/L CaCO3,with most below 3mg/L CaCO3.
When the ANZECC/ARMCANZ (2000) hardness correction algorithms are applied to determinetrigger values for relevant metals (cadmium, chromium (III), lead, nickel, zinc) in such softwaters the hardness modified trigger value is commonly below commercial laboratory detectionlimits. The applicability and limitations of hardness correction are discussed further in Section8.5.1.
Metals in Freshwater
The maximum dissolved concentration of arsenic cadmium, chromium, copper, lead,manganese, nickel and zinc was less than the default ANZECC/ARMCANZ guideline trigger valuein freshwater streams and tree swamps.
An ANZECC/ARMCANZ guideline for iron in freshwaters has not yet been developed and theCanadian criterion of 300pg/L has been adopted in the interim. Freshwater dissolved ironconcentrations were usually below 300pg/L with the 80th percentile of stream samples being65pg/L and tree swamps 32pg/L. The maximum concentration of dissolved iron in somefreshwater stream and tree swamp samples exceeded the 300pg/L. Iron is a parameter thatmay be affected by natural or anthropogenic geochemical changes in water, as discussedfurther below in relation to seasonality.
The dissolved concentration of manganese in freshwaters did not exceed theANZECC/ARMCANZ guideline of 1900pg/L. The median concentration of dissolved manganese insurface waters ranged from 0.94pg/L in streams to 0.36pg/L in tree swamps.
Aluminium concentrations for freshwater sites exceeded the ANZECC/ARMCANZ low reliabilitytrigger value of 0.8pg/L (applicable to waters with pH below 6.5). The median concentration ofdissolved aluminium ranged from 17.6pg/L in freshwater streams to 41pg/L in tree swamps.
Generally, the dominant metals in surface waters of the Project area are aluminium and iron.The concentration of dissolved aluminium, iron and manganese in surface water is seasonal.While for many sites concentrations of aluminium were above the default trigger values in allmonths, much higher values and greater variability was found for samples from the late dryseason in November 2007 and December 2008. The median concentration of aluminium infreshwater streams ranged from 55pg/L in December (before onset of wet season flows) to12pg/L in January, after the onset of streamflows. Similarly, the median concentration of ironand manganese in freshwater streams ranged from 162pg/L and 5.1pg/L in December to10pg/L and 0.98pg/L in January, respectively.
Iron is much more soluble in anoxic water, and rapidly oxidises and flocculates out of solutionwhen exposed to air. The presence of elevated dissolved iron concentrations late in the dryseason indicates that, where surface waters could be sampled at that time of the year, theywere influenced by surface expression of groundwater close to the point of sampling. Whilesurface water flow post- wet season ultimately results from expression of groundwater, beforethe last months of the year the combined flow of the expressed waters results in aeratedstreamflow, and the removal of iron from solution with distance (and time) from the point(s) ofsurface expression of groundwater. In the late dry season, few streams receive sufficientinflows to form a continuous flow of water in any reach, resulting in a greater dominance ofrecently expressed groundwater in the existing surface waters, with higher dissolved iron.Therefore, the relatively higher dissolved aluminium concentrations in the late dry seasonreflect the higher proportion of recently expressed groundwater in the remaining surfacewaters.
For the perennially flowing sites 7A, 5A and 1A in the eastern branch of Norman Creek, theseasonality of dissolved aluminium and iron was much less marked, because longitudinalsurface waters flows and aeration were maintained.
When iron flocculates out of solution the floc tends to adsorb other metals and remove themfrom solution. Although defined as dissolved, the water sample fraction that can be filtered
Section 5 Water Resources Page 5-29