EFFICIENCY OF SWALE AND DRY POND FOR STORMWATER MANAGEMENT...
39
EFFICIENCY OF SWALE AND DRY POND FOR STORMWATER MANAGEMENT by ASNOL ADZHAN BIN ABD. MANAP Thesis submitted in fulfillment of the requirements for the degree of Master of Science AUGUST 2009
Transcript of EFFICIENCY OF SWALE AND DRY POND FOR STORMWATER MANAGEMENT...

EFFICIENCY OF SWALE AND DRY POND FOR STORMWATER MANAGEMENT
by
ASNOL ADZHAN BIN ABD. MANAP
Thesis submitted in fulfillment of the requirements for the degree of
Master of Science
AUGUST 2009

i
ACKNOWLEDGEMENTS
First, I would like to express my appreciation and my sincere gratitude to my main
supervisor Prof. Dr. Aminuddin Ab. Ghani for overseeing the project and keeping on
track. His inspiration, enthusiasm and encouragement have made this research
successful. I am also thankful to Prof. Dr. Nor Azazi Zakaria as my co-supervisor,
without his constant support and help this thesis could not have been completed.
My sincere grateful also goes to River Engineering and Urban Drainage
Research Centre (REDAC), Universiti Sains Malaysia especially staff who involved in
this project for helping me in data collection and providing necessary information. I also
would like to thank the Department of Drainage and Irrigation (DID) Malaysia for
helping me in providing data and necessary information.
Last but not least, my sincere thanks and appreciations also goes to my
employer, Department of Drainage and Irrigation Malaysia for giving me a study leave
and Public Service Department for awarding me a scholarship and sponsoring my
degree. Without them, this research could not be successful.
I am deeply conscious of the importance in my family, without them, I would not
have completed this research. I would like to show my appreciation to my parents who
gave me a priceless education. Special thanks also due to my loving wife, Siti Zarina
Md. Naziri who has been a constant source of encouragement. Last but not least; I
thank my sons, Muhammad Danish Imran, Muhammad Syahmi Zafran and Muhammad
Mizan Adli those who missed their father a lot during this study period.

ii
TABLE OF CONTENTS
Page ACKNOWLEDGEMENTS i
TABLE OF CONTENTS ii
LIST OF TABLES v
LIST OF FIGURES vii
ABSTRAK xi
ABSTRACT xiii
CHAPTER ONE : INTRODUCTION
1
1.0 Introduction 1
1.1 Background of Research 3
1.2 Objective of Research 4
1.3 Scope of Research 4
1.4 Significance of Research 5
1.5 Thesis Summary 6
CHAPTER TWO : LITERATURE REVIEW 8 2.1 Stormwater Management in Malaysia 8
2.2 Overseas Studies on Stormwater Management 11
2.3 Stormwater Management Modelling 22
2.4 Quran as a guide 29
2.5 Summary 29
CHAPTER THREE : METHODOLOGY 30
3.0 Introduction 30
3.1 Study Area 30
3.2 Description of BIOECODS components 31
3.3 Main features of BIOECODS 32
3.4 Study Components 34
3.4.1 Swale 34
3.4.2 Dry Pond 37
3.4.3 Wetpond 38

iii
3.4.4 Detention pond 40
3.4.5 Wetland 41
3.4.6 Recreational pond 43
3.5 BIOECODS design dimension 44
3.6 Research framework 44
3.7 Data collection 46
3.7.1 Rainfall data 47
3.7.2 Flow data 48
3.7.3 Water level data 49
3.7.4 Infiltration data 50
3.8 Data analysis 51
3.8.1 Rainfall 51
3.8.2 Swale 55
3.8.3 Dry pond 56
3.8.4 Wetpond 60
3.8.5 Detention pond 62
3.8.6 Wetland 62
3.8.7 Recreational pond 64
3.8.8 Loss Rate 67
3.9 Summary 67
CHAPTER FOUR : HYDROLOGIC AND HYDRAULIC ANALYSIS 68 4.0 Introduction 68
4.1 Hydrologic Parameters and Design Method 68
4.1.1 Minor and Major System 68
4.1.2 Average Recurrence Interval (ARI) 69
4.1.3 Time of Concentration 70
4.1.4 Rainfall Intensity 74
4.1.5 Rainfall Temporal Pattern 75
4.1.6 Loss 76
4.2 Hydrologic and Hydraulic Analysis 78
4.2.1 Hydrologic Analysis 79
4.2.2 Hydraulic Analysis 81
4.3 Summary 86

iv
CHAPTER FIVE : HYDROLOGIC AND HYDRAULIC MODELLING USING SWMM 5
87
5.0 Introduction 87
5.1 SWMM 5 Model
5.1.1 Model Background
87
87
5.1.2 Model development for BIOECODS
5.1.3 Model Calibration
5.1.4 Model Validation
88
95
98
5.2 SWMM 5 Applications 101
5.2.1 Design Data 101
5.2.2 SWMM 5 simulation 102
5.3 Summary 105
CHAPTER SIX : CONCLUSIONS AND RECOMMENDATIONS 106 6.0 Conclusions 106
6.1 Recommendations for future research 107
BIBLIOGRAPHY 108

v
LIST OF TABLES
Page
2.1 Detention Volume using the Analytical Probabilistic Approach (Guo, 2001)
23
2.2 Comparison of Flood Control Detention Volume Requirements Determined Using Different Methods (Guo, 2001)
24
3.1 Observed flow measurement points 47
3.2 Sieve analysis result at study area for Surface Soil (Depth less than 0.3 m) (DID, 2004)
50
3.3 Sieve analysis result at study area for Subsurface Soil (Depth between 0.3 and 0.6 m) (DID, 2004)
50
3.4 Infiltration test result for sub-catchment area (DID, 2004)
51
3.5 Summary on observed rainfall data (October 2003 – December 2008)
52
3.6 Detailed analysis on observed data at location 1 (inlet wetpond)
53
3.7 Detailed analysis on selected observed data at swale Type B (AERO)
56
3.8 Observed level, velocity and flow for event on 15 July 2007 at inlet and outlet wetpond
60
3.9 Observed level, velocity and flow for event on 22 July 2007 at inlet and outlet wetpond
61
3.10 Computed rating curve at outlet wetpond 61
3.11 Observed level, flow and velocity at detention pond at almost the highest velocity
62
4.1 Design Storm ARIs for Urban Stormwater Systems (DID,2001)
70
4.2 Fitted coefficients for IDF curves (30 ≤ t ≤ 1000 min) (DID,2001)
74
4.3 Values of FD (DID, 2001)
75
4.4 Temporal Patterns for West Coast of Peninsular Malaysia (DID, 2001)
76
4.5 Recommended Loss Models and Values (DID, 2001)
78
4.6 Flow Control Performance Criteria for Detention and Retention (DID, 2001)
81

vi
4.7 Example of spreadsheet application for the infiltration rate of flow through the surface swale
83
4.8 Sample of Spreadsheet Application On Level Pool Routing in Wetpond
86
5.1 Data input for hydrologic parameter for school, administration, hostel and recreational subcatchment using SWMM 5
92
5.2 Value for N-Perv and N-Imperv (McCuen, et. al., 1996)
94
5.3 Recommended value for Depression Storage (ASCE, 1992)
94
5.4 Value for Horton Method
94
5.5 Observed rainfall depth, duration and intensity for different ARI
95
5.6 Data input for conduit
95
5.7 Comparison of peak and predicted flows for swale Type B (AWAM)
98
5.8 Comparison of peak and predicted flows for swale Type B (AERO)
98
5.9 Comparison of peak and predicted flows for swale Type B (AWAM)
101
5.10 Comparison of peak and predicted flows for swale Type B (AERO)
101
5.11 Design rainfall depth, duration and intensity for 10-year ARI
102
5.12 Simulated difference for concrete and swale systems 103
5.13 Simulated difference with and without dry ponds 104

vii
LIST OF FIGURES
Page
2.1 Typical Cross Section for Grassed Swale (Lau et al., 2004)
10
2.2 Typical Cross Section for Detention Storage (Lau et al., 2004)
10
2.3 Side View of Dry Pond (Lau et al., 2004)
10
2.4 Detention basin outlet configurations (Nehrke and Roesner, 2004)
12
2.5 Effects of flood detention and extended detention basins in (a) Fort Collins and (b) Atlanta (Nehrke and Roesner, 2004)
13
2.6 Effects of detention and four-orifice extended detention basins in (a) Fort Collins and (b) Atlanta (Nehrke and Roesner, 2004)
14
2.7 Effects of multiple extended detention basins configuration in (a) Fort Collins and (b) Atlanta (Nehrke and Roesner, 2004)
15
2.8 Effects of extended detention basin designed to historical levels in (a) Fort Collins and (b) Atlanta (Nehrke and Roesner, 2004)
16
2.9 Effects of extended detention basin designed to 1 - 4 year historical levels in Fort Collins (Nehrke and Roesner, 2004)
17
2.10 Idealized cross-section of modeled grassed waterways (Fiener and Auerswald, 2006)
18
2.11 Potential grassed waterways (GWWs) in the Lauterbach watershed under predominantly arable land use in all sub-watersheds and diversified land use (Fiener and Auerswald, 2006)
19
2.12 Modeled reduction of runoff volume (left) and peak discharge (right) for 24-h storms for a predominantly arable land use [grassed waterways assumed in all sub-watersheds; note: for summer storms recurrence times of 10–50-yr (no runoff in case of 2-yr storms), while for winter events recurrence times of 2–10-yr are presented; winter storms >10-yr are excluded due to unknown vegetation behavior (Fiener and Auerswald, 2006)]
20
2.13 Modeled reduction of runoff volume (left) and peak discharge (right) for 24-h storms for a diversified land use [grassed waterways assumed where ever possible due to topography and land use; note: for summer storms recurrence times of 10–50-yr (no runoff in case of 2-yr storms), while for winter events recurrence times of 2–10-yr are presented; winter storms >10-yr are excluded due to unknown vegetation behavior (Fiener and Auerswald, 2006)]
21
viii
2.14 Comparison of Stormwater Management Model Simulation and Analytical Probabilistic Results (Guo, 2001)
25
2.15 Comparison of Design Storm Modelling and Analytical Probabilistic Results for the Test Catchment without Flood Control (Guo, 2001)
25
2.16 Comparison of Design Storm Modelling and Analytical Probabilistic Results for the Test Catchment Serviced by a Flood Control Detention Pond (Guo, 2001)
26
2.17 Comparison of TSS CDFs of observed and two-model predicted washoff loads (Behera et al., 2006)
28
3.1 Study Area at USM Engineering Campus, Pulau Pinang, Malaysia
30
3.2 Flow Chart of Bio-Ecological Drainage Systems (BIOECODS) (Ab. Ghani et al., 2004)
33
3.3 Swale constructed at USM Engineering Campus, Nibong Tebal, Pulau Pinang
35
3.4 Swale cross sections
36
3.5 Dry pond constructed at USM Engineering Campus, Nibong Tebal, Pulau Pinang
38
3.6 Dry pond cross section
38
3.7 Wetpond constructed at USM Engineering Campus, Nibong Tebal, Pulau Pinang
39
3.8 Wetpond cross section
39
3.9 Detention pond constructed at USM Engineering Campus, Nibong Tebal, Pulau Pinang
40
3.10 Detention pond cross section
41
3.11 Wetland constructed at USM Engineering Campus, Nibong Tebal, Pulau Pinang
42
3.12 Wetland cross section
43
3.13 Present research framework
45
3.14 Layout of the measurement points 46 3.15 Rain gauge at USM Engineering Campus, Nibong Tebal,
Pulau Pinang
48
3.16 SIGMA 950AV Area Velocity Flow Module to measure flow in swale
48
ix
3.17 Location of flow meter SIGMA 950 AV installed at inlet wetpond
49
3.18 ISCO 4120 Submerged Water Level Probe
49
3.19 Relationship of effective rainfall depth and runoff depth for subcatchment school and administration
54
3.20 Flow rating curve and Manning’s n for Swale Type B (Bong, 2006)
55
3.21 Layout of the dry ponds A to N
57
3.22 Water level in Dry Pond E on 8 December 2006
58
3.23 Water level in Dry Pond H on 8 December 2006
58
3.24 Water level in Dry Pond E on 22 July 2007
59
3.25 Water level in Dry Pond H on 22 July 2007
59
3.26 Water level in Wetland on 21 – 25 July 2007
63
3.27 Water level in Wetland on 7 – 9 September 2006
63
3.28 Water level at outlet recreational pond on 21-25 July 2007
64
3.29 Water level at outlet recreational pond on 7-9 September 2006
65
3.30 Flow at outlet recreational pond on 21-25 July 2007
66
3.31 Flow at outlet recreational pond on 7-9 September 2006
66
4.1 Minor and Major System Design Concepts (DID, 2001)
68
4.2 Systems diagram of the runoff process at local scale (Ward, 1975)
77
4.3 Impact of Flow Depth on Hydraulic Roughness (Barling and Moore, 1993)
82
4.4 Preliminary Estimate of Required Storage (DID, 2001)
85
5.1 Water profile in surface and subsurface swale at same note and time
88
5.2 Modelling Schematic Procedure
89
5.3 Detail layout for administration area 89 5.4 Detail layout for recreational area
90
5.5 Calibration result at swale Type B (AWAM) for 23 December 2008 (5-year ARI)
96

x
5.6 Calibration result at swale Type B (AERO) for 23 December 2008 (5-year ARI)
96
5.7 Calibration result at swale Type B (AWAM) for 6 September 2008 (2-year ARI)
97
5.9 Validation result at swale Type B (AWAM) for 8 October 2008 (5-year ARI)
99
5.10 Validation result at swale Type B (AERO) for 8 October 2008 (5-year ARI)
99
5.11 Validation result at swale Type B (AWAM) for 25 August 2008 (2-year ARI)
100
5.12 Validation result at swale Type B (AERO) for 25 August 2008 (2-year ARI)
100
5.13 Simulated hydrographs for a 10-year ARI event
103
5.14 Simulated hydrographs with and without dry ponds 104

xi
KEBERKESANAN SALURAN BERUMPUT DAN KOLAM TAKUNGAN KERING BAGI PENGURUSAN AIR RIBUT
ABSTRAK
Perlaksanaan tata pengurusan terbaik sistem saliran baru melalui aplikasi “Stormwater
Management Manual For Malaysia” atau lebih dikenali sebagai Manual Saliran Mesra
Alam (MSMA), yang memfokuskan saluran berumput dan kolam takungan kering di
Malaysia telah dikaji.
Kajian ini dijalankan ke atas Sistem Saliran Bio-Ekologi (BIOECODS) di
Kampus Kejuruteraan, Universiti Sains Malaysia (USM), Nibong Tebal, Pulau Pinang,
yang terletak dalam Lembangan Sungai Kerian. Di samping mengkaji keberkesanan
saluran berumput dan kolam takungan kering ke atas hidrograf masukan bagi satu siri
kolam takungan (“wetpond”, “detention pond”, “wetland” dan kolam rekreasi atau
ECOPOND) dalam mengurus kuantiti air ribut bagi kawasan pembangunan, faktor-
faktor yang mempengaruhi keberkesanan saluran berumput dan kolam takungan
kering menggunakan permodelan hidrologi dan hidraulik turut dikenalpasti dan
dianalisa.
Data-data lapangan yang diambil di USM seperti data hujan, luahan, aras air,
masa pengosongan dan kadar penyusupan mulai Oktober 2003 hingga Desember
2008 dianalisa menggunakan model SWMM 5. Simulasi hidrograf bagi saluran
berumput, kolam takungan kering dan kolam takungan dibandingkan dengan luahan
yang direkodkan di lapangan. Model SWMM 5 didapati menghasilkan kejituan
sehingga 30% dalam menyelakukan hidrograf yang dicerap.
Saluran berumput dan kolam takungan kering yang direkabentuk bagi
BIOECODS mampu mengecilkan luahan puncak berbanding sistem saliran konkrit.

xii
Model SWMM 5 menunjukkan pengecilan luahan puncak sebanyak 121.4%.
Peningkatan luahan puncak dijangkakan sekiranya kolam takungan kering sediada
digantikan dengan pembangunan. Hasil kajian ini akan memacu ke arah pemahaman
yang lebih mendalam bagi peranan saluran berumput sejajar dengan iklim dan
suasana di Malaysia.

xiii
EFFICIENCY OF SWALE AND DRY POND FOR STORMWATER MANAGEMENT
ABSTRACT
The implementation of the Best Management Practices (BMPs) in a drainage system
through the Stormwater Management Manual For Malaysia or better known as Manual
Saliran Mesra Alam (MSMA), focusing on constructed swale and dry pond, was
studied.
The study was carried out on the Bio-Ecological Drainage System (BIOECODS)
at Engineering Campus, Universiti Sains Malaysia (USM), Nibong Tebal, Pulau Pinang,
located in Kerian River Basin. Besides the implication of the swale and dry pond toward
the inflow hydrograph of a series of ponds (detention pond, wetland and recreational
pond known as ECOPOND) in managing stormwater quantity in development area,
factors that affect the effectiveness of the swale and dry pond using hydrologic and
hydraulic model were also identified.
The collected data such as rainfall, flow, water level, emptying time and
infiltration rate from October 2003 until December 2008 at USM were analysed using
SWMM 5 model. The simulated hydrographs for swale, dry pond, wetpond, detention
pond, wetland and recreational pond were compared with recorded flow at the sites.
The modeling shows that the SWMM 5 model has the accuracy up to 30% in simulating
the observed hydrographs.
The integrated swale and dry pond as designed for BIOECODS has attenuated
the peak flow compared to that of a concrete drain system. The SWMM 5 model shows
that there is a reduction of 121.4% in peak flow. Also, the increase in peak flow is
expected if several of the existing dry ponds are to be replaced for new development

xiv
purposes. These results can lead to better understanding of the role of swale and dry
pond that suit the Malaysia climate and environment.

1
CHAPTER 1
INTRODUCTION
1.0 Introduction
Water play as an important entity on the earth and for human need. The
important of water is proved by Quran verses meaning “Have not those who disbelieve
known that the heavens and the earth were of one piece, then We parted them, and we
made every living thing of water? Will they not then believe?” (Anbiya’, 30). But, if we
failure to manage the water wisely, the impact of our failure will worsen our life as
stated in Quran “And weigh with the true balance. Wrong not mankind in their goods,
and do not evil, making mischief, in the earth” (Asy-Syu’ara’, 182 - 183).
The world is changing, the higher and more intense precipitation has already
been observed in many warmer globe areas. This change includes in the terrestrial
environment (hydrological systems and ecosystems) (Kundzewics and Menzel, 2005)
or changes in climate: including an increasing atmospheric holding capacity for water
vapour.
For the flood, the occurrence generally due to change of catchment hydrology
via an increase in the impervious area and reduction in catchment storage (Schueler,
1987). Roesner et al. (2001) also mentioned that the effect of a reduction in the
catchments response time due to development was to the increase in the maximum
rate of flow discharge by a factor of 2 to more than 10 into the conventional drainage
system thus increases the frequency of significant floods. Depressional storage in
urban areas can be reduced by a factor of 5 to 10 depending on the original state of the
watershed and the degree of imperviousness generated from the urbanization
(Viessman and Lewis, 1996).

2
The importance on determining the timing and the depth of flooding is also
mentioned by Collier and Fox (2003) with the amount and distribution of rainfall in
space and time are the prime factors. Ward and Robinson (2000) stated that besides
heavy rainfall, flood flows maybe intensified by factors associated either with the
catchment itself, or with the configuration of the drainage network and stream
channels.
By referring on the pre and post development hydrographs, Schueler (1987)
described that the increased in peak flows are two to five times higher than pre-
urbanisation conditions. A moderately developed watershed can produce over twice
the runoff volume as compared to pre-urbanisation conditions. If extensive ‘drainage’
improvements are made in an urbanizing watershed, time of concentration can be
decreased by a factor of 2. Land use modification can either reduce lag time or flow
travel time (as in urbanization) or increase lag time or flow travel time (as for retention/
detention or infiltration).
For an engineered system, the successful operation usually depends more on a
non-engineering analysis (e.g., economic and social analyses) as a sound engineering
design (Chin, 2000). Therefore, a design of the hydraulic structures in urban area and
river basin need knowledge and understanding of hydraulic and hydrology with
experiment and engineering judgement besides creative thinking and manipulation of
the input (including subjectives parameters) and output used in the design (for selected
methods and tools) to satisfy site condition (Plate, 1996; Nakato and Ettema, 1996).
Looking at the frequency and intensity of rainfall in Malaysia, which are much
higher than in most countries, especially those with temperate climates, design
methods, which have been developed in other countries, may not always be suitable
for application in Malaysia (DID, 2001). Besides that, every rainfall event is unique,

3
varies in space and time according to general pattern of atmospheric circulation and
according to local factors (Chow et al., 1988).
Study by Nehrke and Roesner (2004) on the outflow hydrograph where in their
study that although the predevelopment curve can be reproduced in the developed
state, but the flow verses time curve for the developed state must shift to the right. This
will lead to water flowing from site impact the downstream due to increase of volume
cause by the outflow hydrograph that not the exact shape and volume of the
hydrograph for pre-development conditions (Glazner, 2006).
Thus, understanding on how to minimize the effect of development when
practicing MSMA by maintained at pre-development flow or basin flow limit although
the upper catchment is developed is a must. With establishing an environmental flow
(Shirakawa and Tamai, 2003), waterway can be managed and rehabilitated by “giving
room to river” (Sponge, 2001). This will lead to a better water-resources engineering
which is concerned with the analysis and design of system to control the quantity,
quality, timing, and distribution of water to meet the needs of human habitation and the
environment (Chin, 2000).
1.1 Background of Research
There are many masterplans had been carried out by government agencies
such as DID related to drainage system and river basin. In the masterplans, many
stormwater facilities had been proposed are based on priority and phase. When the
budget is not enough, selection on implementation of the masterplans towards the
effectiveness rate and the implication of not implementing the masterplans are needed
to analysis further.

4
In designing a stormwater facilities using MSMA, there are many parameters
that can be used and analyzed by a designer using reliable data and based on certain
principle and accepted formulation. Due to the effect of the parameters such as time of
concentration, tc and runoff coefficient, C that relates to losses and percent of pervious
and impervious area in the design, a study need to be carried out on implication and
the sensitivity of these parameters.
1.2 Objective of Research
The objectives of research are:
• To verify the flow attenuation due to an integrated swale and dry pond
system in comparison with a concrete drain system, and
• To predict the effects of storage due to dry ponds in attenuating peak
flow.
1.3 Scope of Research
The scope and limitations of research are as follows:
(a) The recorded data i.e. rainfall, flow discharge and water level are used from
October 2003 until December 2008. These data were measured
automatically at several locations along BIOECODS.
(b) The SWMM 5 model was applied in the study to evaluate the dynamic
behavior of BIOECODS.

5
1.4 Significance of Research
Generally, research need to be carried out as Quran had mentioned that “Read:
In the name of thy Lord Who createth” (Alaq, 1) and “Lo! In the creation of the heavens
and the earth and (in) the difference of night and day are tokens (of His Sovereignty)
for men of understanding” (Al-E-Imran, 190). Hence, by investigating and studying the
creation in this world, leads to a better understanding on why the creation is formed.
This study was carried out because there have been a very few studies on
combined performance of BMPs for humid tropic country. Although Ainan (2003) and
Sidek (2005) had carried out a study on Bio-Ecological Drainage System (BIOECODS)
to prove that BMPs can control stormwater, but detailed study on hydrologic analysis
on hydrologic parameters has not been carried out due to lack of collected data for
minor and major storm events.
MSMA had highlighted on importance of the storage and conveyance oriented
approach in managing the stormwater. Besides, most of the design criteria and method
adopted in MSMA refers from other countries manuals. Therefore, there is a need in
studying the adopted design criteria to seek their suitability under tropical conditions.
This study will lead in giving a clear and precise method to engineers and agencies
especially in managing, designing and implementing actions (Dorge and Windolf, 2003)
in developed area in a river basin.
Series of testing need to be done as proposed by Gibson (1908) and given by
Knight (1985) that the best that can be done is to discuss each phenomenon on
assumption that the fluid in motion is perfect. In order to achieve it, one of the easy way
to gain is by doing many design and modeling. Besides that, the engineer or modeler
would know and understand the use and important of subjective talents of an

6
experienced modeler with the models, mathematical nuances and the watershed
(League and Freeze, 1985).
Collier and Fox (2003) said that there are a need of research into how such
precipitation forecasts can be effectively presented to hydrologists and how they can
be used in combination with hydrological models to provide indications of future flows.
Johnson (2000) has pointed out that generalized procedures are needed for dealing
with the influence of uncertainty on hydrologic forecast. However the effectiveness and
usability of these procedures needed to be established.
1.5 Thesis Summary
This thesis discusses on effectiveness and factors that affect the BMPs as a
system such as grass swale and dry pond in hydrologic field to control a stormwater
quantity in MSMA application.
The thesis is divided into six chapters. Chapter 1 discusses the background of
the study, significance of the research and the objectives of the study. Chapter 2
elaborates the detail on literature review of stormwater management in other countries
and scenario of current stormwater management practices in Malaysia. Besides that,
the urbanization effect on stormwater, stormwater management facilities and relevant
software that had been used to model the drainage network also is discussed.
Chapter 3 discusses on the study area and the concept and design of swale
and dry pond. In addition, a discussion on research methodology in carried out the
studies such on equipment for experimental set up, monitoring and collection of data in
the field together with analysis on data collection is also highlighted in this chapter.

7
Meanwhile, Chapter 4 is designed to elaborate on hydrologic fundamental and
design methods that will be used to derive the designed parameter that is used in a
hydrologic and hydraulic model for studying the BMPs.
Chapter 5 describes on stormwater model and the input data in SWMM 5 model
used in developing the hydrologic and hydraulic model. Elaboration on how the
sensitivity analysis, calibration and validation are also further described. The hydrologic
model which represents the BIOECODS system will be analyzed, calibrated and
validated based on the collected results. Result and discussion from the modeling
together with the simulation using design rainfall is being presented in this chapter.
Finally, Chapter 6 concludes the findings from the study which discusses on the
outcome of the study and recommendations for future research related to stormwater
management practices in Malaysia.

8
CHAPTER 2
LITERATURE REVIEW
2.1 Stormwater Management in Malaysia
Since 1975, Malaysia has been using the DID Manual “Planning and Design
procedures No.1: Urban Drainage Design Standards and Procedures for Peninsular
Malaysia” in designing drainage system. The approach used is based on conveyance-
oriented or known as rapid disposal.
Due to new technological developments in urban drainage and more conscious
on environment, on 1 January 2001, the Department of Irrigation and Drainage (DID)
Malaysia had introduced Stormwater Management Manual for Malaysia or better
known as Manual Saliran Mesra Alam (MSMA). The new approach, combination of
conveyance and storage-oriented approach, provide temporary storage of stormwater
runoff at or near its point of origin with subsequent slow release to the downstream
stormwater system or receiving water (detention), or infiltration into the surrounding soil
(retention) through Best Management Practices (BMPs) so as to reduce the nuisance
problems of flash flood and river pollution (DID, 2001).
Definition of urban stormwater management as produced by DID (2001), simply
stated as everything done within a catchment to remedy existing stormwater problems
and to prevent the occurrence of new problems. It involves the development and
implementation of a combination of structural and non-structural measures to reconcile
the conveyance and storage function of stormwater systems within the space,
development and implementation of a range of measures or Best Management
Practices (BMPs) to improve the quality of urban stormwater runoff prior to its

9
discharge to receiving waters (DID, 2001) and related needs of an expanding urban
population.
MSMA introduces a combination of storage and conveyance oriented including
quantity control as a system by dealing and constructing natural measures,
(Kundzewics and Menzel, 2005). This concept states that post development peak
discharge, Qa must be less or equivalent to pre-development peak discharge (DID,
2001). In Poland, MSMA concept can be regarded similiar to Dynamic Slow Down
concept where the flows are slowed (continuity of flow is always maintained) wherever
possible and at relevant point in the catchment, and providing the temporary storage
(Christine et al., 2005).
In Malaysia, one of the projects that implement MSMA concept was a
construction of a new building for the forensic ward of Tanjung Rambutan Hospital on
the area of approximately 1.5 hectares in Ipoh, Perak Darul Ridzuan. The original
condition of this area was cultivated field. For the proposed project, more than 60 % of
the total area has been developed into impervious area such as paved road and car
park, sheltered walkway and utilities other than the building.
The project used drainage system which is known as Bio-ecological Drainage
System (BIOECODS) comprises of grassed swale, detention storage and dry pond
components to focus on the control of both the quantity and quality of urban runoff for
both minor and major system. The BIOECODS components were shown in Figures 2.1
to 2.3.

10
Figure 2.1: Typical Cross Section for Grassed Swale (Lau et al., 2004)
Figure 2.2: Typical Cross Section for Detention Storage (Lau et al., 2004)
Figure 2.3: Side View of Dry Pond (Lau et al., 2004)

11
2.2 Overseas Studies on Stormwater Management
Stormwater Management is defined as the integrated management of
stormwater to control the quantity and quality of stormwater runoff using a multi-
disciplinary approach in applying appropriate technology to preserve the natural
environment, enhance living standards and improve the quality of life. Stormwater
management practices are used to delay, capture, store, treat, or infiltrate stormwater
runoff (Urbonas, 1994; Strecker et al., 2001).
The integrated approach of comprehensive Best Management Practices
(BMPs) for stormwater management is becoming a very popular topic for urban
drainage in developed countries. Stormwater BMP’s are widely used in drainage
planning in United Kingdom (Bettes, 1996), United States (Stahre & Urbanos, 1995;
Nehrke and Roesner, 2004), Germany (Fiener and Auerswald, 2006), Australia (Argue
and Pezzanti, 1998), Japan (Akagawa et al., 1997) and Guo (2001). It is also
mentioned (Mohd Sidek, 2005) that in order to control the increase in peak discharge
for urban development, most of the urban communities require the use of stormwater
detention ponds.
A number of studies with regards to the performance of detention basins have
been conducted. Involving an area of 9.7 ha, a study was undertaken in Fort Collins,
Colorado and Atlanta, Georgia by Nehrke and Roesner (2004) using 50 years of hourly
rainfall data. Fort Collins represents an arid climate receiving relatively low amounts of
annual rainfall (335 mm/year), while Atlanta represents a wetter climate (1,262
mm/year)
The study is carried out to examine the effects of the state of practice of
quantity and quality controls for urban flow control by combining flood control (for large

12
storms) and pollutant removal devices (for small storms) affecting the post
development flow frequency curve. In code of practice, for the quantity control, the flow
target low-frequency events (storm equal to or larger than 2-year ARI event) rather
than higher-frequency events. For quality control, the removal of pollutants in urban
runoff has targeted control of high-frequency event (smaller than 2-year ARI storm).
This study is carried out on a detention ponds using variety of orifices sized for
peak-flow control using traditional and innovative methods. Storm Water Management
Model (SWMM) was used to develop the model. The model was not calibrated, but the
values used are typical for urban systems.
The simulation is carried out by modelling the detention basin as stacked orifice
system shown in Figure 2.4 with the smallest orifice on the bottom and additional
orifices progressively larger with increasing elevation.
Figure 2.4: Detention basin outlet configurations (Nehrke and Roesner, 2004)
During the simulation, surcharged is assumed not occuring. The volume and
discharge rate of detention basin is sized to ensure that the peak flow discharged from
the basin for the specified return interval storm does not exceed the predevelopment
peak flow for the same storm. Results as shown in Figures 2.5 to 2.9 at different
scenarios are evaluated on how well the post-development flow frequency curve
matches the pre-delopment curve.

13
Figure 2.5: Effects of flood detention and extended detention basins in (a) Fort Collins and (b) Atlanta (Nehrke and Roesner, 2004)

14
Figure 2.6: Effects of detention and four-orifice extended detention basins in (a) Fort Collins and (b) Atlanta (Nehrke and Roesner, 2004)

15
Figure 2.7: Effects of multiple extended detention basins configuration in
(a) Fort Collins and (b) Atlanta (Nehrke and Roesner, 2004)

16
Figure 2.8: Effects of extended detention basin designed to historical levels in (a) Fort Collins and (b) Atlanta (Nehrke and Roesner, 2004)

17
Figure 2.9: Effects of extended detention basin designed to 1 - 4 historical levels in Fort Collins (Nehrke and Roesner, 2004)
The preceeding figures show that for both Fort Collins and Atlanta, flow control
alone is effective for storms larger than smallest design storm, but for smallest design
storms, the flow-frequency curve wanders back toward the uncontrolled curve, showing
that runoff from very frequent storms is essentially uncontrolled. Better control by
showing attenuation in peak flows for the higher-frequency storms than the flood
control only when the BMP orifice is placed. The BMP was sized to capture 85% of the
annual runoff volume with drowdown time of the 24 h. Generally, the combination of
stacked orifice was capable of controlling the peak flows over the range of design
storms.
From the results, it seemed that 100/2/BMP configuration might be sufficient to
achieve the desired control of the postdevelopment flow frequency curve to match the
predelopment curve. Although the predevelopment curve can be reproduced in the
developed state, the flow –duration curve for the developed state must be shifted to the
right. However, it is believed by Nehrke and Roesner (2004) that through the

18
appropriate use of runoff controls and properly designed BMPs can control the urban
runoff and protect urban headwater streams geomorphically and ecologically.
For swale, Fiener and Auerswald (2006) had mentioned that the efficiency of
grassed waterways (GWWs) in reducing runoff has been investigated only in few
studies. Thus, they had carried out a study on GWWs using a model at the Lauterbach
watershed, an area of approximately 16.7 km2, located in North Rhine-Westphalia,
Germany.
The study area was modeled according to a modified SCS curve number (CN)
technique according to SCS standard procedures by calculating runoff travel time and
replacing the empirical equation for shallow concentrated flow along drainage lines by
proposed Manning’s equation and using the graphical discharge method. The idealized
cross-section of GWW was shown in Figure 2.10.
Figure 2.10: Idealized cross-section of modeled grassed waterways (Fiener and Auerswald, 2006)
The approach was modified to take into account: (i) the seasonal variation in
runoff generation in draining fields and (ii) the location of a GWW in a watershed as
well as its high infiltration capacity and hydraulic roughness, which prolongs runoff
travel time after the end of a rain event. The model was tested under two land use as
shown in Figure 2.11 (land use dominated by arable lines and diversified land use).

19
Figure 2.11: Potential grassed waterways (GWWs) in the Lauterbach watershed under predominantly arable land use in all sub-watersheds and diversified land use (Fiener
and Auerswald, 2006)
The simulation used two summers period (one prior to and one after small grain
harvest) and one winter condition at recurrence times of 2, 10, 20 and 50-year ARI.
The results were shown in Figures 2.12 and 2.13.
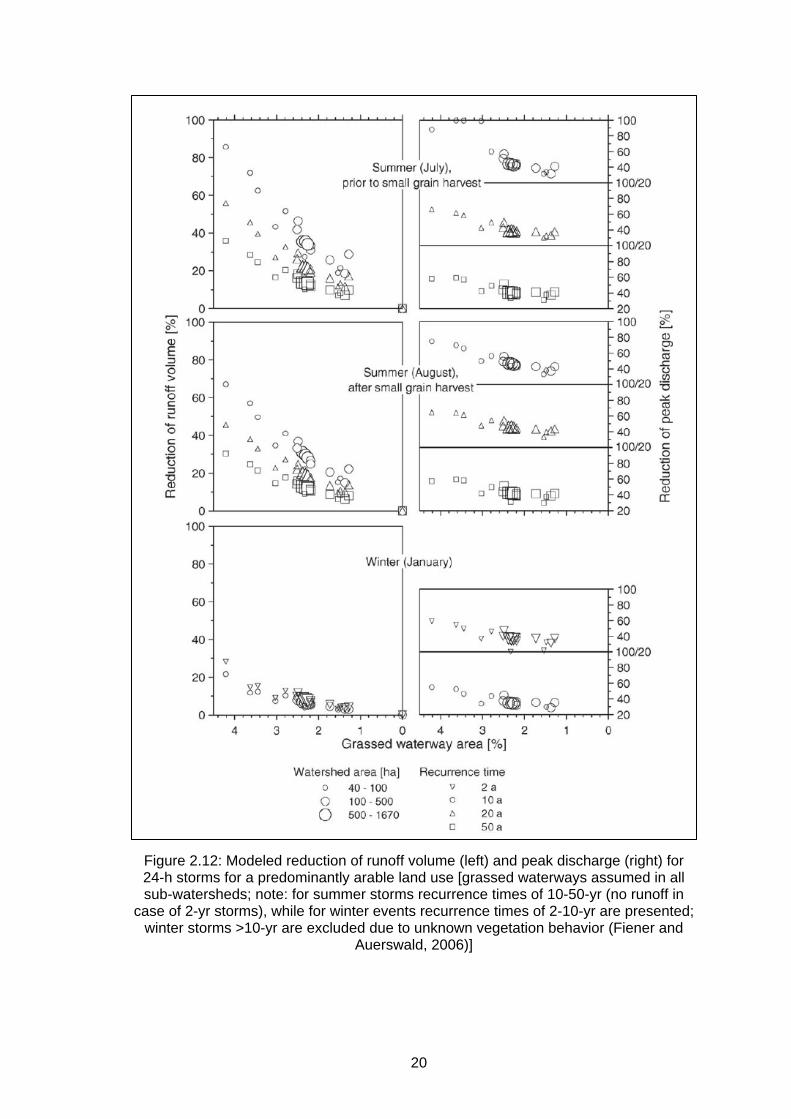
20
Figure 2.12: Modeled reduction of runoff volume (left) and peak discharge (right) for 24-h storms for a predominantly arable land use [grassed waterways assumed in all sub-watersheds; note: for summer storms recurrence times of 10-50-yr (no runoff in
case of 2-yr storms), while for winter events recurrence times of 2-10-yr are presented; winter storms >10-yr are excluded due to unknown vegetation behavior (Fiener and
Auerswald, 2006)]

21
Figure 2.13: Modeled reduction of runoff volume (left) and peak discharge (right) for 24-h storms for a diversified land use [grassed waterways assumed where ever
possible due to topography and land use; note: for summer storms recurrence times of 10-50-yr (no runoff in case of 2-yr storms), while for winter events recurrence times of 2-10-yr are presented; winter storms >10-yr are excluded due to unknown vegetation
behavior (Fiener and Auerswald, 2006)]

22
From Figures 2.12 and 2.13, GWWs show a large reduction in runoff volume
and peak discharge in a pre-dominantly small area arable land use, but the efficiency
had no remarkable effect on runoff reduction with an increasing watershed size of
similar GWWs area.
Besides that, reduction in the runoff and peak discharge decreased with higher
storm size due to high amounts of inflow into the GWWs. Other than watershed size
and type of storm, a proper designed and well managed of GWWs especially to keep
their vegetation in good condition and to shape and maintain their cross section flat-
bottomed are of major importance (Fiener and Auerswald, 2006).
2.3 Stormwater Management Modelling
To a greater understanding on the modeling, Guo (2001) had carried out a
study at Chigago, Illinois on the hydrologic design of the flood control detention ponds
with 35% of 250 ha is an urban catchments area. Using a 50-year hourly historical
rainfall record (1948-1997) from Midway Airport in Chigago (excluded data from
November through March each year), the study assumed that the statistical
characteristics of the rainfall remain the same in the future. The approaches using: (1)
design storm approach; (2) continuous simulation approach; and (3) analytical
probabilistic approach.
The design storm approach for various durations are developed through
statistical analysis shows peak discharges which extremely sensitive to storm duration.
In continuous simulation approach, the historical rainfall data are used directly in
Stormwater Management Model (SWMM) (Huber and Dickinson, 1988). For the
analytical probabilistic approach, Guo and Adam (1998) assumed that exponential
distributions were well approximated to the observed frequency distributions. The

23
exponential probability for rainfall event, volume, duration and inter-arrival time can be
used to represent the complete spectrum of future rainfall condition. Thus, for rainfall
data, only the statistical analysis in supporting the analytical probabilistic approach is
used. Spreadsheet application is used by Guo and Adam (1998) as an alternative for
the hydrologic design of the flood control detention ponds.
The results are presented by showing a comparison between two approaches;
(1) analytical probabilistic and continuous simulation; and (2) analytical probabilistic
and design storm modeling. In design, it is important to determine the storage volume
generated using the approaches adopted. The results are shown in Tables 2.1 and 2.2.
Table 2.1: Detention Volume using the Analytical Probabilistic Approach (Guo, 2001)

24
Table 2.2: Comparison of Flood Control Detention Volume Requirements Determined Using Different Methods (Guo, 2001)
Approach used Detention volume required
to satisfy level 1 control (X 1000 m3)
Detention volume required to satisfy level 2 control
(X 1000 m3) SWMM with 3-h storm peaking at 1st quartile
170 144
SWMM with 3-h storm peaking at 2nd quartile
178 155
SWMM with 6-h storm peaking at 1st quartile
173 144
SWMM with 6-h storm peaking at 3rd quartile
211 184
SWMM with 24-h storm peaking at 3rd quartile
113 26
HEC-HMS with 3-h storm peaking at 1st quartile
211 185
HEC-HMS with 3-h storm peaking at 2nd quartile
226 207
HEC-HMS with 6-h storm peaking at 1st quartile
212 186
HEC-HMS with 6-h storm peaking at 3rd quartile
254 229
HEC-HMS with 24-h storm peaking at 3rd quartile
136 49
Analytical Probabilistic Approach
175 154
From Tables 2.1 and 2.2, the storage volume determined using the design
storm approach can vary significantly depending on which model and design storm are
used. When excluded the results from the 24-h storms, the design storm approach with
storm durations of 3 or 6 hours shows that for control level 1, the maximum difference
can be 41% of the average value; while for control level 2, the maximum difference can
be 47% of the average value. Generally, the storage volume determined from the
analytical probabilistic approach is within the range determined from the design storm
approach with storm durations of 3 or 6 hours (Guo, 2001). The study on the peak
discharge simulated, the results are shown in Figures 2.14 to 2.16.