Effect plasma and cellular fibronectin of human gingival...
14
Effect of 3D microgroove surface topography on plasma and cellular fibronectin of human gingival fibroblasts Yingzhen Lai a , Jiang Chen b, *, Tao Zhang c , Dandan Gu d , Chunquan Zhang d , Zuanfang Li e , Shan Lin f , Xiaoming Fu a , Stefan Schultze-Mosgau g a School of Stomatology, Fujian Medical University, Fuzhou, Fujian 350000, China b Department of Oral Implantology, Affiliated Stomatological Hospital of Fujian Medical University, Fuzhou, Fujian 350002, China c Department of Immunology, Fujian Academy of Medical Science, Fuzhou, Fujian 350000, China d MEMS Research Center of Xiamen University, Xiamen, Fujian 361000, China e Fujian Academy of Integrative Medicine, Fujian University of Traditional Chinese Medicine, Fuzhou, Fujian 350122, China f First Affiliated Hospital of Fujian Medical University, Fuzhou, Fujian 350000, China g Department of Oral and Maxillofacial Surgery/Plastic Surgery, University of Jena, Jena, Thuringia 07747, Germany j o u r n a l o f d e n t i s t r y 4 1 ( 2 0 1 3 ) 1 1 0 9 – 1 1 2 1 a r t i c l e i n f o Article history: Received 3 May 2013 Received in revised form 2 August 2013 Accepted 3 August 2013 Keywords: Dental implant Microgroove Titanium surfaces Plasma FN Human gingival fibroblasts Cellular FN a b s t r a c t Objectives: Fibronectin (FN), an extracellular matrix (ECM) glycoprotein, is a key factor in the compatibility of dental implant materials. Our objective was to determine the optimal dimensions of microgrooves in the transmucosal part of a dental implant, for optimal absorption of plasma FN and expression of cellular FN by human gingival fibroblasts (HGFs). Methods: Microgroove titanium surfaces were fabricated by photolithography with parallel grooves: 15 mm, 30 mm, or 60 mm in width and 5 mm or 10 mm in depth. Smooth titanium surfaces were used as controls. Surface hydrophilicity, plasma FN adsorption and cellular FN expression by HGFs were measured for both microgroove and control samples. Results: We found that narrower and deeper microgrooves amplified surface hydrophobic- ity. A 15-mm wide microgroove was the most hydrophobic surface and a 60-mm wide microgroove was the most hydrophilic. The latter had more expression of cellular FN than any other surface, but less absorption of plasma FN than 15-mm wide microgrooves. Variation in microgroove depth did not appear to effect FN absorption or expression unless the groove was narrow (15 or 30 mm). In those instances, the shallower depths resulted in greater expression of cellular FN. Conclusions: Our microgrooves improved expression of cellular FN, which functionally compensated for plasma FN. A microgroove width of 60 mm and depth of 5 or 10 mm appears to be optimal for the transmucosal part of the dental implant. # 2013 Elsevier Ltd. All rights reserved. * Corresponding author. Tel.: +86 591 83735488; fax: +86 591 83700838. E-mail address: [email protected] (J. Chen). Available online at www.sciencedirect.com journal homepage: www.intl.elsevierhealth.com/journals/jden 0300-5712/$ – see front matter # 2013 Elsevier Ltd. All rights reserved. http://dx.doi.org/10.1016/j.jdent.2013.08.004
Transcript of Effect plasma and cellular fibronectin of human gingival...
Effect of 3D microgroove surface topography onplasma and cellular fibronectin of humangingival fibroblasts
Yingzhen Lai a, Jiang Chen b,*, Tao Zhang c, Dandan Gu d,Chunquan Zhang d, Zuanfang Li e, Shan Lin f, Xiaoming Fu a,Stefan Schultze-Mosgau g
a School of Stomatology, Fujian Medical University, Fuzhou, Fujian 350000, ChinabDepartment of Oral Implantology, Affiliated Stomatological Hospital of Fujian Medical University, Fuzhou,
Fujian 350002, ChinacDepartment of Immunology, Fujian Academy of Medical Science, Fuzhou, Fujian 350000, ChinadMEMS Research Center of Xiamen University, Xiamen, Fujian 361000, Chinae Fujian Academy of Integrative Medicine, Fujian University of Traditional Chinese Medicine, Fuzhou, Fujian 350122,
Chinaf First Affiliated Hospital of Fujian Medical University, Fuzhou, Fujian 350000, ChinagDepartment of Oral and Maxillofacial Surgery/Plastic Surgery, University of Jena, Jena, Thuringia 07747, Germany
j o u r n a l o f d e n t i s t r y 4 1 ( 2 0 1 3 ) 1 1 0 9 – 1 1 2 1
a r t i c l e i n f o
Article history:
Received 3 May 2013
Received in revised form
2 August 2013
Accepted 3 August 2013
Keywords:
Dental implant
Microgroove
Titanium surfaces
Plasma FN
Human gingival fibroblasts
Cellular FN
a b s t r a c t
Objectives: Fibronectin (FN), an extracellular matrix (ECM) glycoprotein, is a key factor in
the compatibility of dental implant materials. Our objective was to determine the optimal
dimensions of microgrooves in the transmucosal part of a dental implant, for optimal
absorption of plasma FN and expression of cellular FN by human gingival fibroblasts
(HGFs).
Methods: Microgroove titanium surfaces were fabricated by photolithography with parallel
grooves: 15 mm, 30 mm, or 60 mm in width and 5 mm or 10 mm in depth. Smooth titanium
surfaces were used as controls. Surface hydrophilicity, plasma FN adsorption and cellular
FN expression by HGFs were measured for both microgroove and control samples.
Results: We found that narrower and deeper microgrooves amplified surface hydrophobic-
ity. A 15-mm wide microgroove was the most hydrophobic surface and a 60-mm wide
microgroove was the most hydrophilic. The latter had more expression of cellular FN than
any other surface, but less absorption of plasma FN than 15-mm wide microgrooves.
Variation in microgroove depth did not appear to effect FN absorption or expression unless
the groove was narrow (�15 or 30 mm). In those instances, the shallower depths resulted in
greater expression of cellular FN.
Conclusions: Our microgrooves improved expression of cellular FN, which functionally
compensated for plasma FN. A microgroove width of 60 mm and depth of 5 or 10 mm appears
to be optimal for the transmucosal part of the dental implant.
# 2013 Elsevier Ltd. All rights reserved.
* Corresponding author. Tel.: +86 591 83735488; fax: +86 591 83700838.
Available online at www.sciencedirect.com
journal homepage: www.intl.elsevierhealth.com/journals/jden
E-mail address: [email protected] (J. Chen).
0300-5712/$ – see front matter # 2013 Elsevier Ltd. All rights reserved.http://dx.doi.org/10.1016/j.jdent.2013.08.004
j o u r n a l o f d e n t i s t r y 4 1 ( 2 0 1 3 ) 1 1 0 9 – 1 1 2 11110
1. Introduction
Soft tissue integration is a prerequisite for implant success
and requires an effective seal between the soft tissue and
implant to protect the underlying bone from microorganism
invasion.1 Peri-implantitis begins at the soft tissue of implant
is a risk factor in implant failure.2 The soft tissue interface
consists of two zones: a slim epithelium and a thicker
connective tissue. Connective tissues have poor mechanical
resistance at the implant interface compared to natural teeth.3
Furthermore, as Jansen et al. state: ‘‘the quality of the
connective tissue in the transitional area is apparently more
important for the long-term prognosis of oral implants than
the epithelial attachment’’.4 Epithelial down-growth and
attachment to the implant can be inhibited by a firm
connection between the underlying connective tissue and
the implant.3 Our study focused on reinforcing the attachment
between connective tissue and titanium implants via well-
defined surface topographies.
New advances in micro-electromechanical systems
(MEMS) allow the fabrication of biological MEMS (BioMEMS)
and have been used in the investigation of cell response to
microgrooved surfaces.5 Microgrooves integrated into the
structure of an implant have advantages compared with the
traditionally smooth implant surface. For instance, epithelial
down-growth could be inhibited by microgroove-induced
contact guidance of connective tissue during growth.6 The
microgroove surface has also affects cell interaction and
behaviour, including modulation of cell adhesion, prolifera-
tion and gene expression.7,8 However, how the specific
microgroove dimensions affect the extracellular matrix
(ECM) has not yet been studied.
The organization and composition of the ECM mediate
cell adhesion by controlling the degree to which cells can
attach. Fibronectin (FN) is a high-molecular weight
(�440 kDa) glycoprotein of the ECM that is a typical marker
of the biocompatibility of new materials for connective
tissue in dental implant studies.9 FN occurs in two forms:
soluble plasma FN in blood, and insoluble cellular FN in ECMs
or on cell surfaces.10 Plasma FN is a major protein
component of blood plasma and is produced in the liver
by hepatocytes.10 Cellular FN is secreted by various cells,
primarily fibroblasts, as a soluble protein dimer and is then
assembled into an insoluble matrix in a complex cell-
mediated process.11 In both forms, FN is involved in tissue
repair. The plasma form of FN is incorporated into fibrin
clots, affecting platelet function and mediating the early
stages of wound healing. Plasma FN also can be bound to the
cell surface and assembled into extracellular fibrils.12
Cellular FN is synthesized and assembled by cells for
attachment to the ECM as they migrate into a clot to repair
damaged tissue.10 Both forms of FN are vital for establishing
and maintaining tissue architecture and for regulating
cellular processes and behaviours, such as adhesion,
spreading, proliferation, migration and differentiation.10–12
Plasma proteins are spontaneously adsorbed onto an
implant surface within seconds and therefore help determine
the bioactivity of implants.13,14 Plasma FN plays an important
role in the interactions of implants with their surrounding
ECMs by enhancing the attachment of cells to implant
materials.15,16 Furthermore, the surface structure and wetta-
bility of implant materials determine the extent of protein
adsorption.17,18 However, observations regarding the effects of
surface wettability on protein have not been consistent.
Though many previous studies have shown that FN absorp-
tion is enhanced on hydrophobic surfaces,19–21 it has also been
reported that FN adsorption is greater on hydrophilic
surfaces.22,23 Anisotropic wetting is attributed to a liquid
contact line encountering a physical discontinuity (e.g., a solid
edge along a microgroove present on solid surfaces).24 The
microgroove surface leads to anisotropic wetting and
these micro-scale topographical surface structures may
encourage macroscopic changes in droplet wetting behaviour.
What is more, to the best of our knowledge there has been only
a few studies23 on anisotropic wetting and the dimensions of
microgrooves affecting plasma FN absorption.
Cells continuously synthesize their own FN matrix, which
they deposit and organize as a three-dimensional network.
Material-mediated cellular FN reorganization is an important
factor in determining the biocompatibility of a material,25 cell
attachment is required for cellular synthesis of FN.26 Cells
react to micromaterial corrugation, possibly through mem-
brane deformation and stretching.27 Thus, forces can be
generated from just the process of cells recognizing topo-
graphical or other cues.28,29 This is relevant because mechani-
cal forces are necessary for efficient (integrin-mediated)
cellular FN assembly to fibrillar matrices.30–32 Furthermore,
the forces placed upon cells, stimulated by material topogra-
phy, can influence cellular FN assembly.27–32 Since topograph-
ical features alter surface wettability, adsorption of preferred
proteins might result. We hypothesized that the dimensions of
some microgroove surfaces might influence the synthesis and
assembly of cellular FN more effectively than others.
The tissue repair function of FN is ubiquitous and useful for
dental implant biocompatibility studies. The aim of this work
was to investigate the effect of 3D microgroove surfaces on
plasma and cellular FN. Through this effort, we hoped to
identify an optimal set of dimensions for microgroove surfaces
suitable for the transmucosal part of a dental implant. Plasma
FN adsorption on different surface topographies was mea-
sured by immunofluorescence and ELISA. Human gingival
fibroblasts (HGFs) were chosen for this study as they are most
abundantly found in gingival connective tissues and have
been used in numerous in vitro studies of implant integra-
tion.33,34 Cells were cultured on the topographically modified
surfaces; real-time PCR and Western blotting were used to
confirm enhanced cellular FN activity. The structure and
properties of the microgrooves, including topography, groove
dimensions, surface wettability in FN adsorption and synthe-
sis are discussed in detail.
2. Materials and methods
2.1. Fabrication of micro-structured substrates
Microgroove surfaces were fabricated by photolithography
with a micro-structured silicon substrate and an overlying
200-nm thick layer of titanium sputtering. Groove widths of
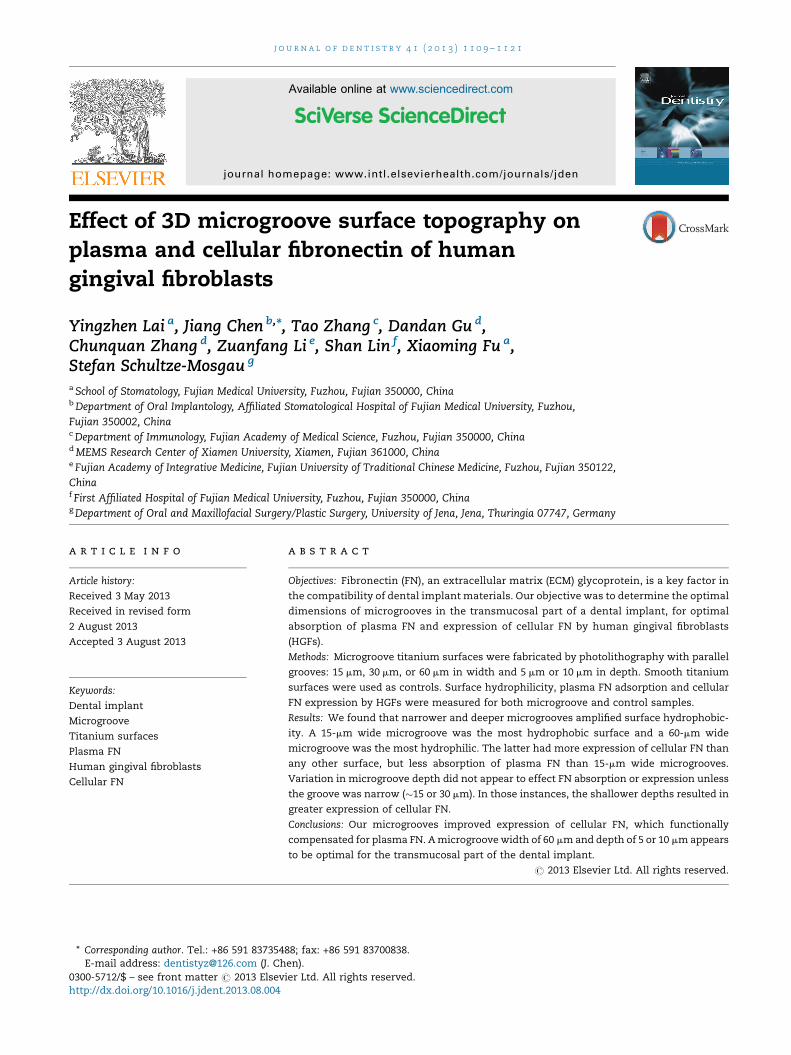
Fig. 1 – (A) Schematic diagram of each sample surface with the microgroove dimensions. (B) The key steps of the
photolithography.
j o u r n a l o f d e n t i s t r y 4 1 ( 2 0 1 3 ) 1 1 0 9 – 1 1 2 1 1111
60 mm, 30 mm, and 15 mm, and groove depths of 5 mm and
10 mm were fabricated. The combinations of groove width and
depth are hereafter denoted as T15/5, T15/10, T30/5, T30/10,
T60/5, T60/10 (Fig. 1(A)). The cross-sectional shape of each
groove was an inverted trapezoid, with an angle between the
sidewall and groove-ridge of 54.748. Group T0 (i.e. the controls)
meanwhile was a sputter of titanium on a simple planar
silicon substrate.
The key steps of the MEMS wet etching process (Fig. 1(B))
were as follows: a 4-in. silicon wafer was chemically cleaned (III:
4H2SO4 + H2O2; II: NH4OH + H2O2 + 5H2O; I: HNO3 + H2O2 +
5H2O), forming a 1.5-mm silicon dioxide layer on the wafer
(by four micro-controlled diffusion system 4470) (1100 8C, 7 h). A
photoresistant layer (AZ 5214-E Japan) was next coated to a
thickness of approximately 1.8 mm, followed by pre-baking at
96 8C for 12 min. The wafer was exposed to UV light through a
photo-mask containing patterns with 15-mm, 30-mm, or 60-mm
wide lines for 15 s, and developed for 80 s; post-baking followed
at 135 8C for 12 min. The pattern was transferred into the silicon
by etching silicon dioxide. The photo-resistant layer was
removed, silicon etching and silicon dioxide were removed,
and the wafer was cleaned. Lastly, a 200-nm thick sputter of
titanium was deposited on the silicon wafers. Etching time
controlled the depth of the microgrooves; the patterned mask
determined the width of the ridge and groove. The wafers were
then cut to 10 mm � 10 mm and 20 mm � 20 mm chips. Small
chips were placed in the bottom of 24-well plates for
immunostaining, 20 mm � 20 mm chips were placed in the
bottom of 6-well plates for real-time PCR and Western blotting.
In all experiments, the substrates were cleaned by ultrasonica-
tion for 5 min in acetone, soaked in absolute ethylalcohol for
2 h, washed another three times with distilled water and dried
for 20 min in ultraviolet light before the cells were plated.
2.2. Scanning electron microscopy
The surfaces and profiles of the samples were imaged using
a scanning electron microscope (1000�) (Philips-XL30;
Netherlands).
2.3. Contact angle determination
Surface hydrophilicity was determined by measuring liquid
contact angles. A 1-ml drop of distilled water (about 2 mm in
diameter) was placed on the disc perpendicular to the surface
microgrooves and then photographed. The contact angle
between the surface and the drop tangent was measured on
the photograph (Dataphysics OCA20, Germany). The mean
value was calculated from five separate measurements.
2.4. Culture of HGFs
Healthy gingival tissues were obtained from orthodontic
patients who had their premolar teeth removed. The process
was approved by the Ethics Committee of Affiliated Stoma-
tological Hospital of Fujian Medical University. Tissues from
different donors were minced to about 3 mm3, placed in 6-well
plates and covered by a cover slip to prevent tissues from
floating. Tissues were maintained in Dulbecco’s Modified
Eagle’s Medium (DMEM, Gibco, USA) supplemented with 10%
foetal bovine serum (FBS, Hyclone, USA) and antibiotics with
1% (v/v) penicillin–streptomycin solution (Hyclone, USA).
Cultures were maintained in a humidified atmosphere of 5%
(v/v) CO2 at 37 8C. After reaching 80% confluence the HGFs
were digested with 0.25% (w/v) trypsin and 0.02% (w/v) EDTA,
and subcultured at a 1:3 ratio. The cells from passages 3–5
were used in this study.
2.5. Immunofluorescence staining of adsorbed plasma FN
Samples were cut to 10 mm � 10 mm and placed in separate
wells in 24-well plate prepared for immunofluorescence
staining of adsorbed proteins. Human plasma FN (Sigma, F
2006) was reconstituted to a concentration of 20 mg/ml in
PBS. The low concentration value was taken with the
fundamental interest of understanding the adsorption
behaviour and morphology of plasma FN as in previous
studies.35 The surfaces of experimental samples were
immersed in the prepared plasma FN solution (1 ml) for
j o u r n a l o f d e n t i s t r y 4 1 ( 2 0 1 3 ) 1 1 0 9 – 1 1 2 11112
2 h at room temperature with gentle rotation. Additional
samples were also immersed in PBS solution, without
protein, to be used as control surfaces. After incubation,
the solutions were removed and the samples were carefully
washed three times with PBS to eliminate any unbound
protein. The patterned and control surfaces were removed
from PBS and incubated in 2% bovine serum albumin (BSA,
Sigma, A2058) solution for 30 min at room temperature, in
order to block non-specific antibody binding. The immuno-
fluorescence procedure was performed with mouse anti-
human FN (1:50, Sigma, F 0791) for 1 h. Following a PBS wash,
samples were incubated for 30 min in anti-mouse FITC (1:32,
Sigma, F 0257). The sample was then washed with PBS.
Finally, each sample surface was mounted with fluorescence
mounting medium (DAKO, S3023). The protein adsorbed on
each surface was observed with a fluorescence microscope
(OLYMPUS BX43). Plasma FN was visualized as green dots.
Colour fluorescence micrographs were converted to black-
and-white bitmaps with ‘Image J’ (from NIH and available at
http://rsb.info.nih.gov/ij/); its operation and use were de-
scribed previously.36,37 The white spots represented plasma
FN. Image J’s ‘‘Analyze particles’’ was used to count the FN
spots in each bitmap. Seven digital images of each sample
group were captured and analysed for adhesion in the
smooth and microgroove areas.
2.6. Plasma FN adsorption by enzyme-linkedimmunosorbent assay (ELISA)
Plasma FN was suspended in PBS to a concentration of 200 mg/
ml (close to the physiological concentration of FN in plasma)20
to determine the relative adsorption of plasma FN on each
group using ELISA absorbance.36 The procedure for preparing
samples pre-coated with plasma FN was as previously
described (Section 2.5), the only difference being the specific
concentration of FN in solution between the two tests.
Negative controls without FN were also assayed. After
blocking with 2% BSA for 30 min, samples were then incubated
with mouse anti-human FN (1:50, Sigma F 0791) as the primary
antibody for 1 h and anti-mouse-alkaline phosphatase anti-
body (1:10,000, Sigma A-1293) as the secondary antibody for
30 min. Unbound antibodies were rinsed away with two PBS
washes, using p-nitrophenyl-phosphate (pNPP, SigmaN2765)
as substrate for 30 min. The reaction was stopped with 3 M
NaOH. Finally, the reaction solution was transferred to a 96-
well plate and the absorbances of each well were recorded
with a microplate reader at 405 nm. Corrected absorbances
were obtained by subtracting the negative control absor-
bances from the experimental values. All experiments were
performed in triplicate.
2.7. Morphology of cellular FN by immunofluorescence
Samples were introduced to separate wells in a 24-well plate.
HGFs were seeded onto the samples at a density of 5 � 103 cells/
well for one day. Cells were then fixed with 4% formaldehyde for
30 min and permeabilized for 5 min with 0.1% Triton X-100 in
PBS. A solution of 1% BSA in PBS was added for 30 min before
samples were subjected to the primary antibody, mouse anti-
human FN (1:50, Sigma, F 0791), for another 60 min at 37 8C.
Following a PBS wash, cells were stained with the secondary
antibody, anti-mouse-FITC (1:32, Sigma, F 0257), for 30 min,
then rhodamine-labelled with Phalloidin (1:400, Cytoskeleton,
Cat. # PHDR1) for 30 min to view the cytoskeletal actin. Finally,
6-diamidino-2-phenylindole (DAPI) (1:1000, sigma, D9542) was
added for nuclear fluorescence at 1:1000 for 3–5 min. Samples
were washed three times in PBS and mounted with fluorescence
mounting medium (DAKO, S3023) before analysis with by
confocal laser scanning microscopy (CLSM, LSM710, Carl Zeiss,
Germany). We used a laser combiner featuring a diode laser
(405 nm; blue fluorescence) to visualize the cell nucleus, an
argon-ion laser (488 nm; green fluorescence) for cellular FN, and
a helium-neon laser (543 nm; red fluorescence) for cytoskeletal
actin. For smooth controls (T0) we collected 2D images. For
microgroove groups, optical sections were gathered in 1-mm
steps perpendicular to the microscope optical axis. Assembling
a stack of these 3D images from successive focal planes created
the full image.
2.8. Quantification of mRNA levels of cellular FN by real-time PCR
Samples were cut down to 20 mm � 20 mm and were prepared
for real-time PCR. Six of each sample type were introduced onto
a 6-well plate. HGFs were seeded onto the sample surfaces
simultaneously at a density of 3 � 105 cells/well and incubated
for three days until confluent. Total RNA was extracted using
Trizol (Invitrogen). The RNA concentration was determined
using a NanoDrop 1000 (Thermo, USA). Total RNA (1 mg) was
then reverse transcribed with a cDNA Reverse Transcription Kit
(TaKaRa PrimeScript1 RT reagent Kit DRR037A). TaKaRa real-
time PCR primers for human FN (GenBank Accession
NM_212482) included a forward primer: (AGGAAGCCGAGGTTT-
TAACTG) and a reverse primer: (AGGACGCTCATAAGTGT-
CACC), primers for human b-actin (GenBank Accession
NM_001101) included a forward primer (CATGTACGTTGCT
ATCCAGGC) and a reverse primer (CTCCTTAATGTCACGCAC-
GAT). For each experimental condition, reverse-transcribed
cDNA was amplified using SYBR1 Premix Ex TaqTM II (Tli
RNaseH Plus; TaKaRa Code:DRR820A) for each gene on an ABI
Prism 7500 real-time PCR cycler (Applied Biosystems). Data
were analysed by the Ct method; values for FN were normalized
to b-actin for each sample. Data are the means � SD of three
independent experiments.
2.9. Quantification of protein levels of cellular FN byWestern blotting
Six of each sample type (20 mm � 20 mm) were introduced
onto a 6-well plate. HGFs were seeded at a density of
3 � 105 cells/well and incubated for three days until confluent.
Samples with attached cells were removed to a new plate,
washed with ice cold PBS three times and subsequently
scraped in RIPA buffer (RIPA Lysis Buffer, Strong, P0013B,
Beyotime, China) containing a 1% Halt Protease Inhibitor
Cocktail (Thermo, USA). Protein concentration was deter-
mined by BCA Protein Assay Kit (P0012, Beyotime, China).
Equal amounts of proteins were applied to 10% polyacryl-
amide SDS gels (SDS-PAGE), separated electrophoretically
and blotted using PVDF membranes. For detection of FN
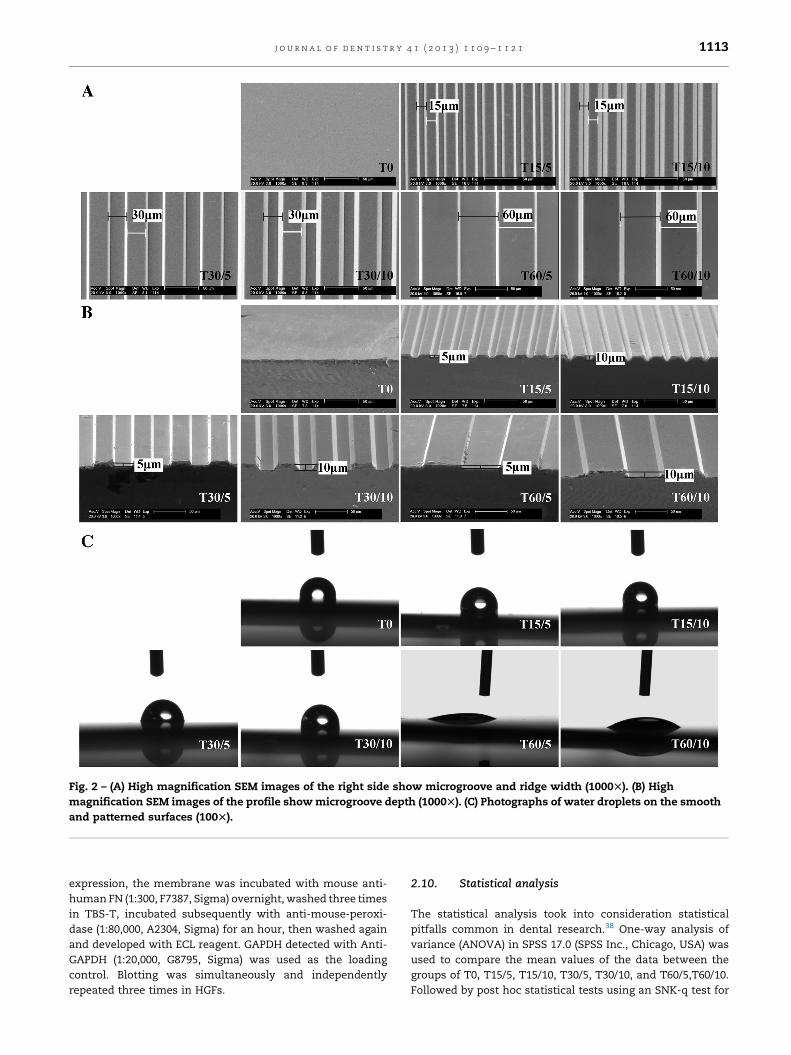
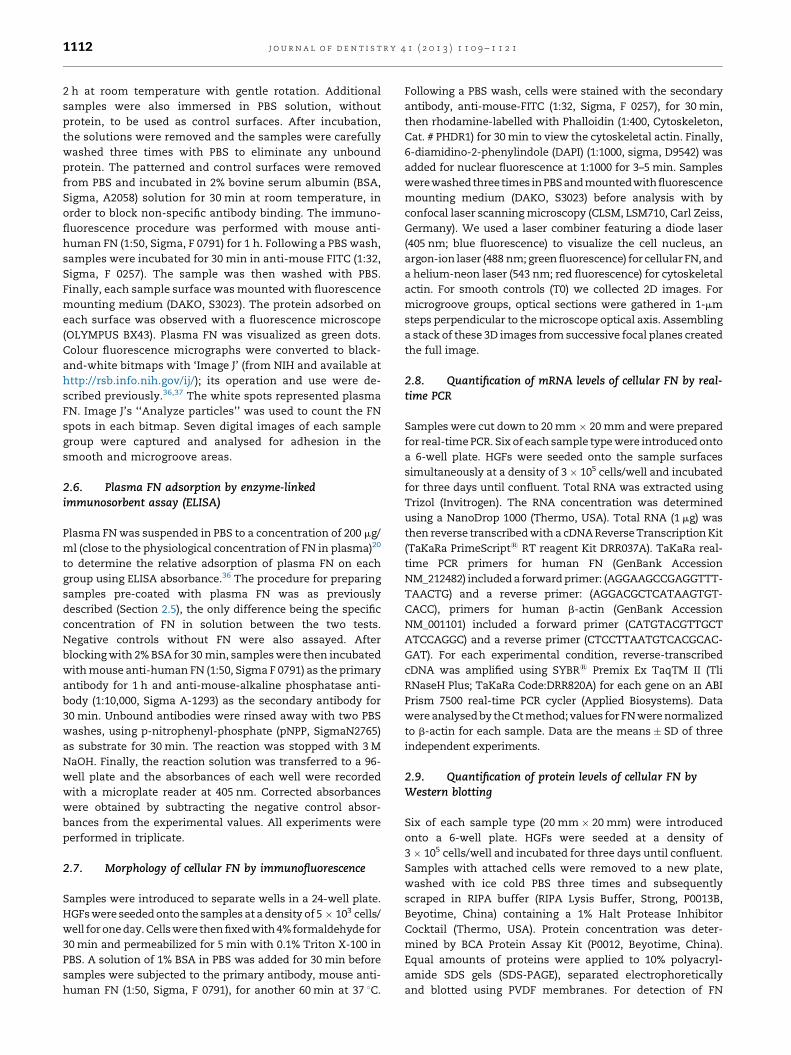
Fig. 2 – (A) High magnification SEM images of the right side show microgroove and ridge width (1000T). (B) High
magnification SEM images of the profile show microgroove depth (1000T). (C) Photographs of water droplets on the smooth
and patterned surfaces (100T).
j o u r n a l o f d e n t i s t r y 4 1 ( 2 0 1 3 ) 1 1 0 9 – 1 1 2 1 1113
expression, the membrane was incubated with mouse anti-
human FN (1:300, F7387, Sigma) overnight, washed three times
in TBS-T, incubated subsequently with anti-mouse-peroxi-
dase (1:80,000, A2304, Sigma) for an hour, then washed again
and developed with ECL reagent. GAPDH detected with Anti-
GAPDH (1:20,000, G8795, Sigma) was used as the loading
control. Blotting was simultaneously and independently
repeated three times in HGFs.
2.10. Statistical analysis
The statistical analysis took into consideration statistical
pitfalls common in dental research.38 One-way analysis of
variance (ANOVA) in SPSS 17.0 (SPSS Inc., Chicago, USA) was
used to compare the mean values of the data between the
groups of T0, T15/5, T15/10, T30/5, T30/10, and T60/5,T60/10.
Followed by post hoc statistical tests using an SNK-q test for
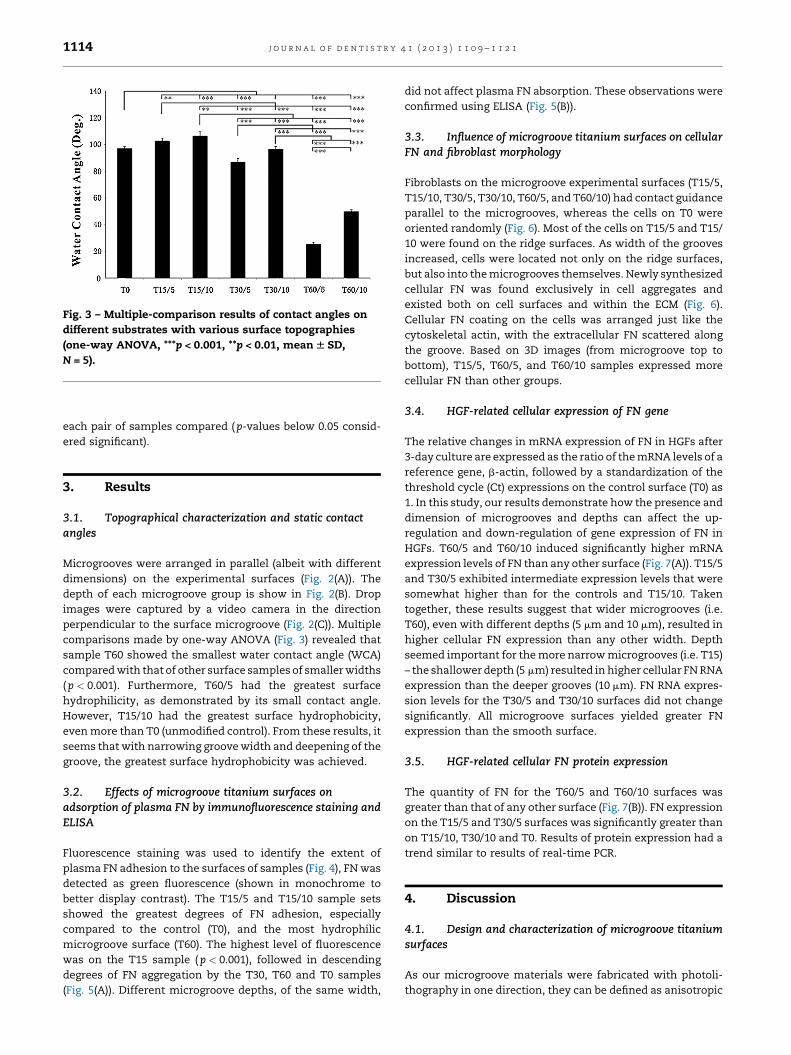
Fig. 3 – Multiple-comparison results of contact angles on
different substrates with various surface topographies
(one-way ANOVA, ***p < 0.001, **p < 0.01, mean W SD,
N = 5).
j o u r n a l o f d e n t i s t r y 4 1 ( 2 0 1 3 ) 1 1 0 9 – 1 1 2 11114
each pair of samples compared ( p-values below 0.05 consid-
ered significant).
3. Results
3.1. Topographical characterization and static contactangles
Microgrooves were arranged in parallel (albeit with different
dimensions) on the experimental surfaces (Fig. 2(A)). The
depth of each microgroove group is show in Fig. 2(B). Drop
images were captured by a video camera in the direction
perpendicular to the surface microgroove (Fig. 2(C)). Multiple
comparisons made by one-way ANOVA (Fig. 3) revealed that
sample T60 showed the smallest water contact angle (WCA)
compared with that of other surface samples of smaller widths
( p < 0.001). Furthermore, T60/5 had the greatest surface
hydrophilicity, as demonstrated by its small contact angle.
However, T15/10 had the greatest surface hydrophobicity,
even more than T0 (unmodified control). From these results, it
seems that with narrowing groove width and deepening of the
groove, the greatest surface hydrophobicity was achieved.
3.2. Effects of microgroove titanium surfaces onadsorption of plasma FN by immunofluorescence staining andELISA
Fluorescence staining was used to identify the extent of
plasma FN adhesion to the surfaces of samples (Fig. 4), FN was
detected as green fluorescence (shown in monochrome to
better display contrast). The T15/5 and T15/10 sample sets
showed the greatest degrees of FN adhesion, especially
compared to the control (T0), and the most hydrophilic
microgroove surface (T60). The highest level of fluorescence
was on the T15 sample ( p < 0.001), followed in descending
degrees of FN aggregation by the T30, T60 and T0 samples
(Fig. 5(A)). Different microgroove depths, of the same width,
did not affect plasma FN absorption. These observations were
confirmed using ELISA (Fig. 5(B)).
3.3. Influence of microgroove titanium surfaces on cellularFN and fibroblast morphology
Fibroblasts on the microgroove experimental surfaces (T15/5,
T15/10, T30/5, T30/10, T60/5, and T60/10) had contact guidance
parallel to the microgrooves, whereas the cells on T0 were
oriented randomly (Fig. 6). Most of the cells on T15/5 and T15/
10 were found on the ridge surfaces. As width of the grooves
increased, cells were located not only on the ridge surfaces,
but also into the microgrooves themselves. Newly synthesized
cellular FN was found exclusively in cell aggregates and
existed both on cell surfaces and within the ECM (Fig. 6).
Cellular FN coating on the cells was arranged just like the
cytoskeletal actin, with the extracellular FN scattered along
the groove. Based on 3D images (from microgroove top to
bottom), T15/5, T60/5, and T60/10 samples expressed more
cellular FN than other groups.
3.4. HGF-related cellular expression of FN gene
The relative changes in mRNA expression of FN in HGFs after
3-day culture are expressed as the ratio of the mRNA levels of a
reference gene, b-actin, followed by a standardization of the
threshold cycle (Ct) expressions on the control surface (T0) as
1. In this study, our results demonstrate how the presence and
dimension of microgrooves and depths can affect the up-
regulation and down-regulation of gene expression of FN in
HGFs. T60/5 and T60/10 induced significantly higher mRNA
expression levels of FN than any other surface (Fig. 7(A)). T15/5
and T30/5 exhibited intermediate expression levels that were
somewhat higher than for the controls and T15/10. Taken
together, these results suggest that wider microgrooves (i.e.
T60), even with different depths (5 mm and 10 mm), resulted in
higher cellular FN expression than any other width. Depth
seemed important for the more narrow microgrooves (i.e. T15)
– the shallower depth (5 mm) resulted in higher cellular FN RNA
expression than the deeper grooves (10 mm). FN RNA expres-
sion levels for the T30/5 and T30/10 surfaces did not change
significantly. All microgroove surfaces yielded greater FN
expression than the smooth surface.
3.5. HGF-related cellular FN protein expression
The quantity of FN for the T60/5 and T60/10 surfaces was
greater than that of any other surface (Fig. 7(B)). FN expression
on the T15/5 and T30/5 surfaces was significantly greater than
on T15/10, T30/10 and T0. Results of protein expression had a
trend similar to results of real-time PCR.
4. Discussion
4.1. Design and characterization of microgroove titaniumsurfaces
As our microgroove materials were fabricated with photoli-
thography in one direction, they can be defined as anisotropic
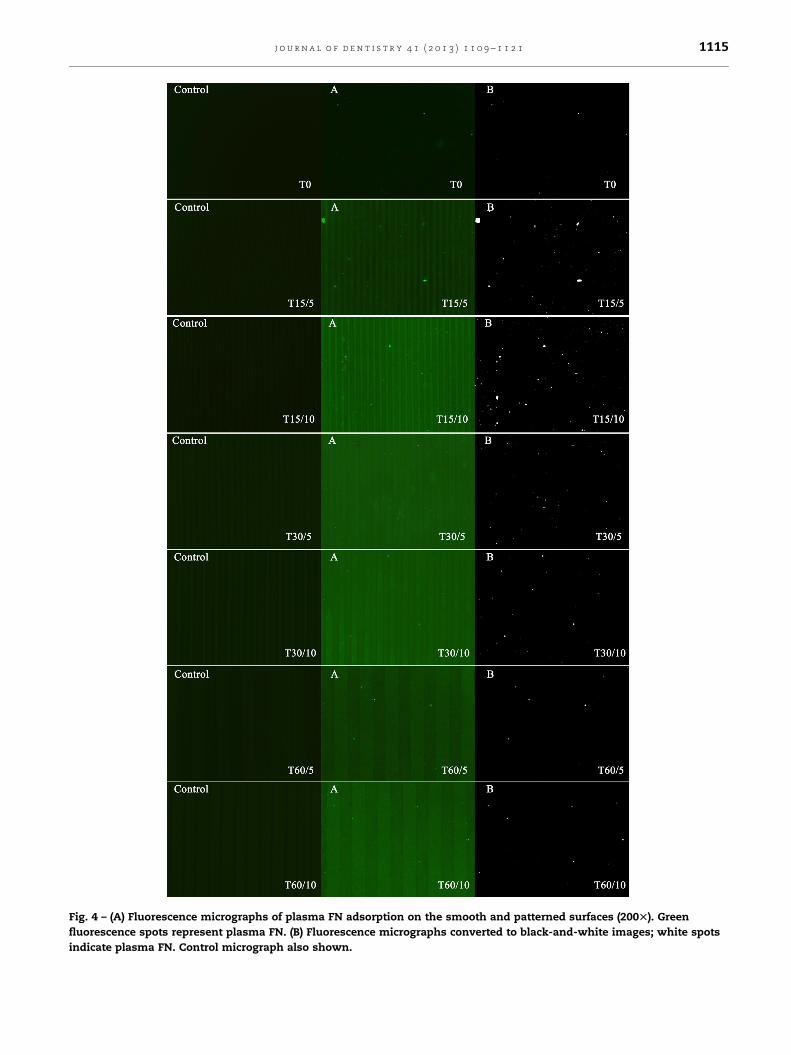
Fig. 4 – (A) Fluorescence micrographs of plasma FN adsorption on the smooth and patterned surfaces (200T). Green
fluorescence spots represent plasma FN. (B) Fluorescence micrographs converted to black-and-white images; white spots
indicate plasma FN. Control micrograph also shown.
j o u r n a l o f d e n t i s t r y 4 1 ( 2 0 1 3 ) 1 1 0 9 – 1 1 2 1 1115
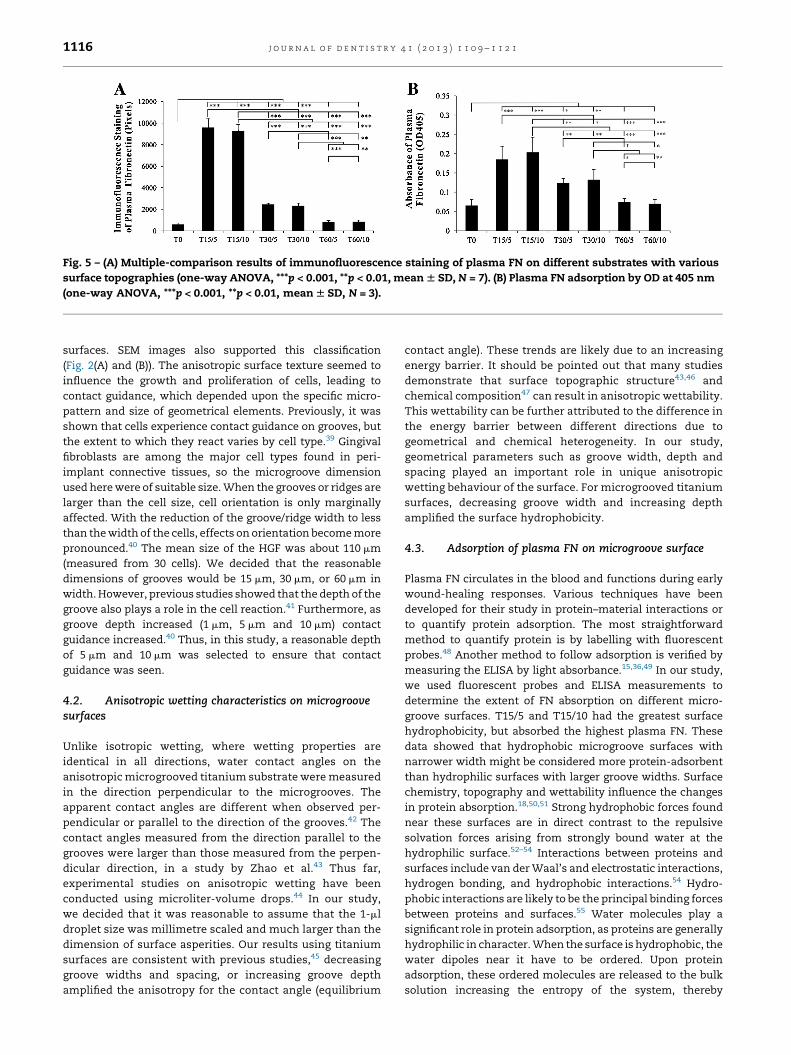
Fig. 5 – (A) Multiple-comparison results of immunofluorescence staining of plasma FN on different substrates with various
surface topographies (one-way ANOVA, ***p < 0.001, **p < 0.01, mean W SD, N = 7). (B) Plasma FN adsorption by OD at 405 nm
(one-way ANOVA, ***p < 0.001, **p < 0.01, mean W SD, N = 3).
j o u r n a l o f d e n t i s t r y 4 1 ( 2 0 1 3 ) 1 1 0 9 – 1 1 2 11116
surfaces. SEM images also supported this classification
(Fig. 2(A) and (B)). The anisotropic surface texture seemed to
influence the growth and proliferation of cells, leading to
contact guidance, which depended upon the specific micro-
pattern and size of geometrical elements. Previously, it was
shown that cells experience contact guidance on grooves, but
the extent to which they react varies by cell type.39 Gingival
fibroblasts are among the major cell types found in peri-
implant connective tissues, so the microgroove dimension
used here were of suitable size. When the grooves or ridges are
larger than the cell size, cell orientation is only marginally
affected. With the reduction of the groove/ridge width to less
than the width of the cells, effects on orientation become more
pronounced.40 The mean size of the HGF was about 110 mm
(measured from 30 cells). We decided that the reasonable
dimensions of grooves would be 15 mm, 30 mm, or 60 mm in
width. However, previous studies showed that the depth of the
groove also plays a role in the cell reaction.41 Furthermore, as
groove depth increased (1 mm, 5 mm and 10 mm) contact
guidance increased.40 Thus, in this study, a reasonable depth
of 5 mm and 10 mm was selected to ensure that contact
guidance was seen.
4.2. Anisotropic wetting characteristics on microgroovesurfaces
Unlike isotropic wetting, where wetting properties are
identical in all directions, water contact angles on the
anisotropic microgrooved titanium substrate were measured
in the direction perpendicular to the microgrooves. The
apparent contact angles are different when observed per-
pendicular or parallel to the direction of the grooves.42 The
contact angles measured from the direction parallel to the
grooves were larger than those measured from the perpen-
dicular direction, in a study by Zhao et al.43 Thus far,
experimental studies on anisotropic wetting have been
conducted using microliter-volume drops.44 In our study,
we decided that it was reasonable to assume that the 1-ml
droplet size was millimetre scaled and much larger than the
dimension of surface asperities. Our results using titanium
surfaces are consistent with previous studies,45 decreasing
groove widths and spacing, or increasing groove depth
amplified the anisotropy for the contact angle (equilibrium
contact angle). These trends are likely due to an increasing
energy barrier. It should be pointed out that many studies
demonstrate that surface topographic structure43,46 and
chemical composition47 can result in anisotropic wettability.
This wettability can be further attributed to the difference in
the energy barrier between different directions due to
geometrical and chemical heterogeneity. In our study,
geometrical parameters such as groove width, depth and
spacing played an important role in unique anisotropic
wetting behaviour of the surface. For microgrooved titanium
surfaces, decreasing groove width and increasing depth
amplified the surface hydrophobicity.
4.3. Adsorption of plasma FN on microgroove surface
Plasma FN circulates in the blood and functions during early
wound-healing responses. Various techniques have been
developed for their study in protein–material interactions or
to quantify protein adsorption. The most straightforward
method to quantify protein is by labelling with fluorescent
probes.48 Another method to follow adsorption is verified by
measuring the ELISA by light absorbance.15,36,49 In our study,
we used fluorescent probes and ELISA measurements to
determine the extent of FN absorption on different micro-
groove surfaces. T15/5 and T15/10 had the greatest surface
hydrophobicity, but absorbed the highest plasma FN. These
data showed that hydrophobic microgroove surfaces with
narrower width might be considered more protein-adsorbent
than hydrophilic surfaces with larger groove widths. Surface
chemistry, topography and wettability influence the changes
in protein absorption.18,50,51 Strong hydrophobic forces found
near these surfaces are in direct contrast to the repulsive
solvation forces arising from strongly bound water at the
hydrophilic surface.52–54 Interactions between proteins and
surfaces include van der Waal’s and electrostatic interactions,
hydrogen bonding, and hydrophobic interactions.54 Hydro-
phobic interactions are likely to be the principal binding forces
between proteins and surfaces.55 Water molecules play a
significant role in protein adsorption, as proteins are generally
hydrophilic in character. When the surface is hydrophobic, the
water dipoles near it have to be ordered. Upon protein
adsorption, these ordered molecules are released to the bulk
solution increasing the entropy of the system, thereby
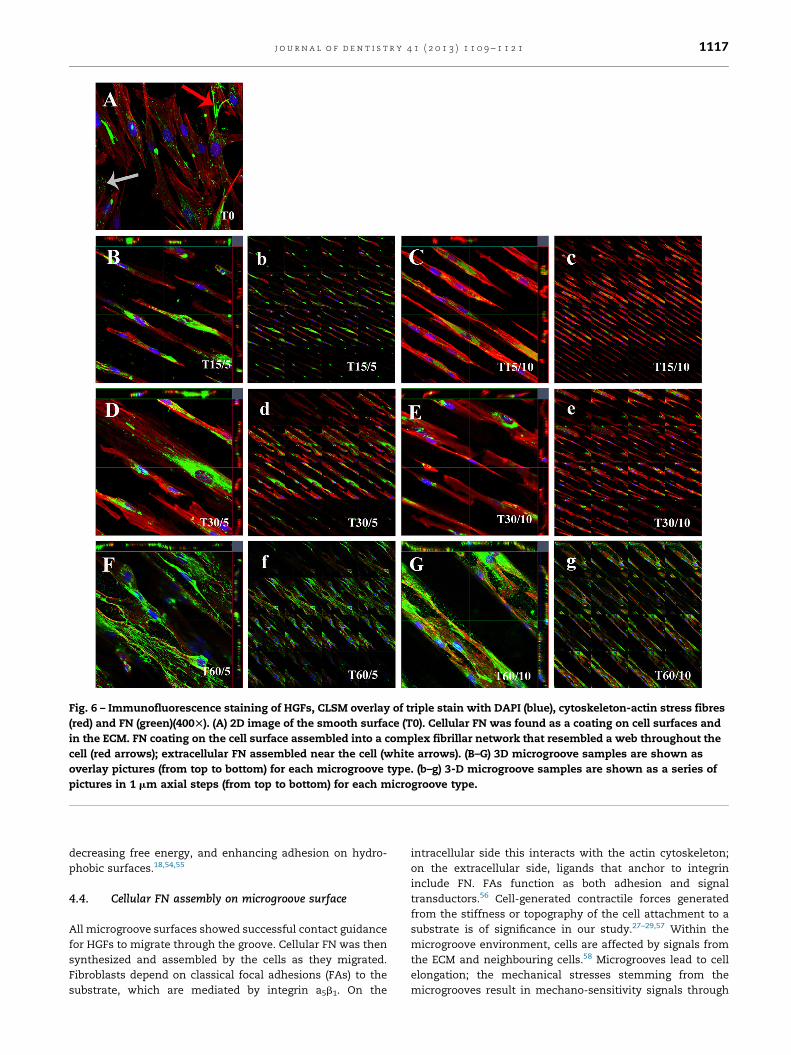
Fig. 6 – Immunofluorescence staining of HGFs, CLSM overlay of triple stain with DAPI (blue), cytoskeleton-actin stress fibres
(red) and FN (green)(400T). (A) 2D image of the smooth surface (T0). Cellular FN was found as a coating on cell surfaces and
in the ECM. FN coating on the cell surface assembled into a complex fibrillar network that resembled a web throughout the
cell (red arrows); extracellular FN assembled near the cell (white arrows). (B–G) 3D microgroove samples are shown as
overlay pictures (from top to bottom) for each microgroove type. (b–g) 3-D microgroove samples are shown as a series of
pictures in 1 mm axial steps (from top to bottom) for each microgroove type.
j o u r n a l o f d e n t i s t r y 4 1 ( 2 0 1 3 ) 1 1 0 9 – 1 1 2 1 1117
decreasing free energy, and enhancing adhesion on hydro-
phobic surfaces.18,54,55
4.4. Cellular FN assembly on microgroove surface
All microgroove surfaces showed successful contact guidance
for HGFs to migrate through the groove. Cellular FN was then
synthesized and assembled by the cells as they migrated.
Fibroblasts depend on classical focal adhesions (FAs) to the
substrate, which are mediated by integrin a5b1. On the
intracellular side this interacts with the actin cytoskeleton;
on the extracellular side, ligands that anchor to integrin
include FN. FAs function as both adhesion and signal
transductors.56 Cell-generated contractile forces generated
from the stiffness or topography of the cell attachment to a
substrate is of significance in our study.27–29,57 Within the
microgroove environment, cells are affected by signals from
the ECM and neighbouring cells.58 Microgrooves lead to cell
elongation; the mechanical stresses stemming from the
microgrooves result in mechano-sensitivity signals through
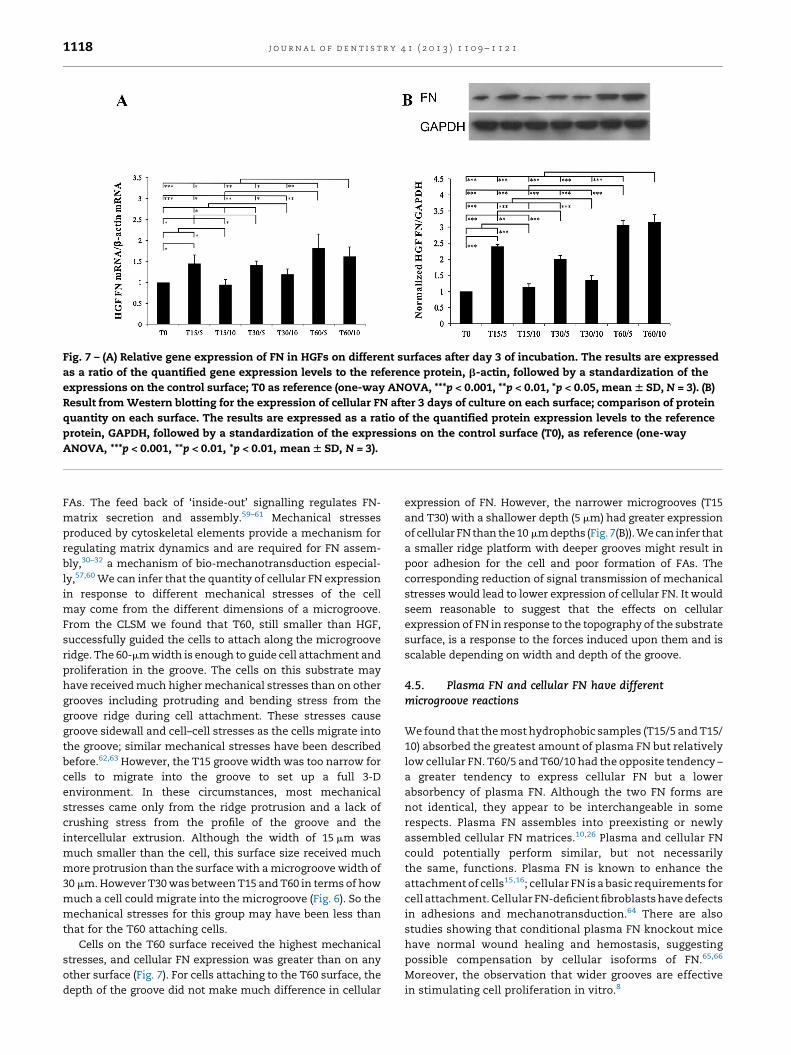
Fig. 7 – (A) Relative gene expression of FN in HGFs on different surfaces after day 3 of incubation. The results are expressed
as a ratio of the quantified gene expression levels to the reference protein, b-actin, followed by a standardization of the
expressions on the control surface; T0 as reference (one-way ANOVA, ***p < 0.001, **p < 0.01, *p < 0.05, mean W SD, N = 3). (B)
Result from Western blotting for the expression of cellular FN after 3 days of culture on each surface; comparison of protein
quantity on each surface. The results are expressed as a ratio of the quantified protein expression levels to the reference
protein, GAPDH, followed by a standardization of the expressions on the control surface (T0), as reference (one-way
ANOVA, ***p < 0.001, **p < 0.01, *p < 0.01, mean W SD, N = 3).
j o u r n a l o f d e n t i s t r y 4 1 ( 2 0 1 3 ) 1 1 0 9 – 1 1 2 11118
FAs. The feed back of ‘inside-out’ signalling regulates FN-
matrix secretion and assembly.59–61 Mechanical stresses
produced by cytoskeletal elements provide a mechanism for
regulating matrix dynamics and are required for FN assem-
bly,30–32 a mechanism of bio-mechanotransduction especial-
ly,57,60 We can infer that the quantity of cellular FN expression
in response to different mechanical stresses of the cell
may come from the different dimensions of a microgroove.
From the CLSM we found that T60, still smaller than HGF,
successfully guided the cells to attach along the microgroove
ridge. The 60-mm width is enough to guide cell attachment and
proliferation in the groove. The cells on this substrate may
have received much higher mechanical stresses than on other
grooves including protruding and bending stress from the
groove ridge during cell attachment. These stresses cause
groove sidewall and cell–cell stresses as the cells migrate into
the groove; similar mechanical stresses have been described
before.62,63 However, the T15 groove width was too narrow for
cells to migrate into the groove to set up a full 3-D
environment. In these circumstances, most mechanical
stresses came only from the ridge protrusion and a lack of
crushing stress from the profile of the groove and the
intercellular extrusion. Although the width of 15 mm was
much smaller than the cell, this surface size received much
more protrusion than the surface with a microgroove width of
30 mm. However T30 was between T15 and T60 in terms of how
much a cell could migrate into the microgroove (Fig. 6). So the
mechanical stresses for this group may have been less than
that for the T60 attaching cells.
Cells on the T60 surface received the highest mechanical
stresses, and cellular FN expression was greater than on any
other surface (Fig. 7). For cells attaching to the T60 surface, the
depth of the groove did not make much difference in cellular
expression of FN. However, the narrower microgrooves (T15
and T30) with a shallower depth (5 mm) had greater expression
of cellular FN than the 10 mm depths (Fig. 7(B)). We can infer that
a smaller ridge platform with deeper grooves might result in
poor adhesion for the cell and poor formation of FAs. The
corresponding reduction of signal transmission of mechanical
stresses would lead to lower expression of cellular FN. It would
seem reasonable to suggest that the effects on cellular
expression of FN in response to the topography of the substrate
surface, is a response to the forces induced upon them and is
scalable depending on width and depth of the groove.
4.5. Plasma FN and cellular FN have differentmicrogroove reactions
We found that the most hydrophobic samples (T15/5 and T15/
10) absorbed the greatest amount of plasma FN but relatively
low cellular FN. T60/5 and T60/10 had the opposite tendency –
a greater tendency to express cellular FN but a lower
absorbency of plasma FN. Although the two FN forms are
not identical, they appear to be interchangeable in some
respects. Plasma FN assembles into preexisting or newly
assembled cellular FN matrices.10,26 Plasma and cellular FN
could potentially perform similar, but not necessarily
the same, functions. Plasma FN is known to enhance the
attachment of cells15,16; cellular FN is a basic requirements for
cell attachment. Cellular FN-deficient fibroblasts have defects
in adhesions and mechanotransduction.64 There are also
studies showing that conditional plasma FN knockout mice
have normal wound healing and hemostasis, suggesting
possible compensation by cellular isoforms of FN.65,66
Moreover, the observation that wider grooves are effective
in stimulating cell proliferation in vitro.8
j o u r n a l o f d e n t i s t r y 4 1 ( 2 0 1 3 ) 1 1 0 9 – 1 1 2 1 1119
Our data also indicate that the 60-mm grooves were best at
inducing cells to secrete cellular FN. This greater secretion
may compensate for the decreasing absorption of plasma FN,
since it has been shown that cellular FN function can
compensate for plasma FN.
5. Conclusion
Groove widths of 60 mm, 30 mm, and 15 mm, and groove depths
of 5 mm and 10 mm were fabricated. Narrower and deeper
microgrooves amplified surface hydrophobicity. These results
have implications for the design and application of anisotropic
wetting surfaces.
The effects of microgroove width on plasma FN and cellular
FN were quite different: wide microgrooves were favourable
for adhesion of cellular FN while narrower grooves were
favourable for plasma FN. Microgroove depth did not affect
plasma FN absorption. While groove depth did not effect
cellular FN expression to wide microgrooves (T60), narrow
microgrooves of 5-mm depth (T15/5 and T30/5) resulted in
higher cellular FN adhesion than deeper grooves of the same
width. In general, forces generated from the stiffness or
topography of the cells during attachment to a substrate is of
some considerable biological significance. These parameters
need to be considered during the design of 3D biomaterials as
they provide a means to influence the ‘‘mechanical stress
effect’’ on cells and therefore their physiological and bio-
chemical behaviour.
Due to the adaptability and functionality of FN, our results
pertain to the design of implant surfaces. It seems that the
microgroove width of 60 mm with a depth of either 5 mm or
10 mm would be the best choice for the transmucosal part of
the dental implant.
Acknowledgments
This work was supported by the Science and Technology
Project of Fujian Province (2010H6009) and Provincial
Development and Reform Commission (NDRC) project
([2010]1002). We gratefully thank the staff of the MEMS
Research Center of Xiamen University for fabricating
smooth and microgroove samples used in this study. We
also thank Mr. Tao Zhang and Mr. Zuanfang Li for their
technical assistance.
Appendix A. Supplementary data
Supplementary material related to this article can be
found, in the online version, at http://dx.doi.org/10.1016/
j.jdent.2013.08.004.
r e f e r e n c e s
1. Welander M, Abrahamsson I, Berglundh T. The mucosalbarrier at implant abutments of different materials. ClinicalOral Implants Research 2008;19:635–41.
2. Al-Radha AS, Pal A, Pettemerides AP, Jenkinson HF.Molecular analysis of microbiota associated with peri-implant diseases. Journal of Dentistry 2012;40:989–98.
3. Rompen TE, Domken O, Degidi M, Pontes AE, Piattelli A. Theeffect of material characteristics, of surface topography andof implant components and connections on soft tissueintegration: a literature review. Clinical Oral Implants Research2006;2:55–67.
4. Jansen JA, den Braber ET, Walboomers XF, de Ruijter JE. Softtissue and epithelial models. Advances in Dental Research1999;13:57–66.
5. Park TH, Shuler ML. Integration of cell culture andmicrofabrication technology. Biotechnology Progress2003;19:243–53.
6. Gehrke TA, Walboomers XF, Jansen JA. Influence oftransforming growth factor-beta3 on fibrous capsuleformation around microgrooved subcutaneous implantsin vivo. Tissue Engineering 2000;6:505–17.
7. Kokubu E, Hamilton DW, Inoue T, Brunette DM. Modulationof human gingival fibroblast adhesion, morphology,tyrosine phosphorylation, and ERK 1/2 localization onpolished, grooved and SLA substratum topographies. Journalof Biomedical Materials and Research A 2009;91:663–70.
8. Kim SY, Oh N, Lee MH, Kim SE, Leesungbok R, Lee SW.Surface microgrooves and acid etching on titaniumsubstrata alter various cell behaviors of cultured humangingival fibroblasts. Clinical Oral Implants Research2009;20:262–72.
9. Pivodova V, Frankova J, Ulrichova J. Osteoblast and gingivalfibroblast markers in dental implant studies. BiomedicalPapers of the Medical Faculty of the University Palacky OlomoucCzech Republic 2011;155:109–16.
10. To WS, Midwood KS. Plasma and cellular fibronectin:distinct and independent functions during tissue repair.Fibrogenesis and Tissue Repair 2011;4:1–17.
11. Winters BS, Raj BK, Robinson EE, Foty RA, Corbett SA. Three-dimensional culture regulates Raf-1 expression to modulatefibronectin matrix assembly. Molecular Biology of the Cell2006;17:3386–96.
12. Peters DM, Portz LM, Fullenwider J, Mosher DF. Co-assemblyof plasma and cellular fibronectins into fibrils in humanfibroblast cultures. Journal of Cell Biology 1990;111:249–56.
13. Molino PJ, Higgins MJ, Innis PC, Kapsa RM, Wallace GG.Fibronectin and bovine serum albumin adsorption andconformational dynamics on inherently conductingpolymers: a QCM-D study. Langmuir 2012;28:8433–45.
14. Zhu XD, Zhang HJ, Fan HS, Li W, Zhang XD. Effect of phasecomposition and microstructure of calcium phosphateceramic particles on protein adsorption. Acta Biomaterialia2010;6:1536–41.
15. Tsai WB, Ting YC, Yang JY, Lai JY, Liu HL. Fibronectinmodulates the morphology of osteoblast-like cells (MG-63)on nano-grooved substrates. Journal of Materials ScienceMaterials in Medicine 2009;20:1367–78.
16. Pendegrass CJ, El-Husseiny M, Blunn GW. The developmentof fibronectin-functionalised hydroxyapatite coatings toimprove dermal fibroblast attachment in vitro. Journal ofBone and Joint Surgery British Volume 2012;94:564–9.
17. Vogler EA. Protein adsorption in three dimensions.Biomaterials 2012;33:1201–37.
18. Sethuraman A, Han M, Kane RS, Belfort G. Effect of surfacewettability on the adhesion of proteins. Langmuir2004;20:7779–88.
19. Fischer M, Sperling C, Werner C. Synergistic effect ofhydrophobic and anionic surface groups triggers bloodcoagulation in vitro. Journal of Materials Science Materials inMedicine 2010;21:931–7.
20. Vadillo-Rodrıguez V, Pacha-Olivenza MA, Gonzalez-MartınML, Bruque JM, Gallardo-Moreno AM. Adsorption behavior
j o u r n a l o f d e n t i s t r y 4 1 ( 2 0 1 3 ) 1 1 0 9 – 1 1 2 11120
of human plasma fibronectin on hydrophobic andhydrophilic Ti6Al4V substrata and its influence on bacterialadhesion and detachment. Journal of Biomedical Materials andResearch A 2013;101:1397–404.
21. Campillo-Fernandez AJ, Unger RE, Peters K, Halstenberg S.Analysis of the biological response of endothelial andfibroblast cells cultured on synthetic scaffolds with varioushydrophilic/hydrophobic ratios: influence of fibronectinadsorption and conformation. Tissue Engineering Part A2009;15:1331–41.
22. Wei J, Igarashi T, Okumori N, Igarashi T, Maetani T, Liu B,et al. Influence of surface wettability on competitive proteinadsorption and initial attachment of osteoblasts. BiomedicalMaterials 2009;4:1–7.
23. Lee SW, Lee MH, Oh N, Park JA, Leesungbok R, Ahn SJ.Correlation between surface hydrophilicity and osteoblasticdifferentiation on microgrooved titanium substrata. Journalof Oral Implantology 2012;38:11–9.
24. Bliznyuk O, Jansen HP, Kooij ES, Zandvliet HJ, Poelsema B.Smart design of stripe-patterned gradient surfaces tocontrol droplet motion. Langmuir 2011;27:11238–45.
25. Iuliano DJ, Saavedra SS, Truskey GA. Effect of theconformation and orientation of adsorbed fibronectin onendothelial cell spreading and the strength of adhesion.Journal of Biomedical Materials Research 1993;27:1103–13.
26. Ruoslahti E. Fibronectin in cell adhesion and invasion.Cancer and Metastasis Reviews 1984;3:43–51.
27. Lim JY, Donahue HJ. Cell sensing and response to micro-and nanostructured surfaces produced by chemical andtopographic patterning. Tissue Engineering 2007;13:1879–91.
28. Ventre M, Causa F, Netti PA. Determinants of cell-materialcrosstalk at the interface: towards engineering of cellinstructive materials. Journal of the Royal Society Interface2012;9:2017–32.
29. Reilly GC, Engler AJ. Intrinsic extracellular matrix propertiesregulate stem cell differentiation. Journal of Biomechanics2010;43:55–62.
30. Smith ML, Gourdon D, Little WC, Kubow KE, Eguiluz RA,Luna-Morris S, et al. Force-induced unfolding of fibronectinin the extracellular matrix of living cells. PLoS Biology2007;5:2243–54.
31. Lemmon CA, Chen CS, Romer LH. Cell traction forces directfibronectin matrix assembly. Biophysical Journal 2009;96:729–38.
32. Singh P, Carraher C, Schwarzbauer JE. Assembly offibronectin extracellular matrix. Annual Review of Cell andDevelopmental Biology 2010;26:397–419.
33. Abdulmajeed AA, Walboomers XF, Massera J, Kokkari AK,Vallittu PK, Narhi TO. Blood and fibroblast responses tothermoset BisGMA-TEGDMA/glass fiber-reinforcedcomposite implants in vitro. Clinical Oral Implants Research2013;3:1–9.
34. Bruckmann C, Walboomers XF, Matsuzaka K, Jansen JA.Periodontal ligament and gingival fibroblast adhesion todentin-like textured surfaces. Biomaterials 2005;26:339–46.
35. Sousa SR, Bras MM, Moradas-Ferreira P, Barbosa MA.Dynamics of fibronectin adsorption on TiO2 surfaces.Langmuir 2007;23:7046–54.
36. Puckett SD, Taylor E, Raimondo T, Webster TJ. Therelationship between the nanostructure of titaniumsurfaces and bacterial attachment. Biomaterials 2010;31:706–13.
37. Pool M, Thiemann J, Bar-Or A, Fournier AE. NeuriteTracer: anovel Image J plug in for automated quantification ofneurite outgrowth. Journal of Neuroscience Methods2008;168:134–9.
38. Hannigan A, Lynch CD. Statistical methodology in oral anddental research: pitfalls and recommendations. Journal ofDentistry 2013;41:385–92.
39. Hasirci V, Pepe-Mooney BJ. Understanding the cell behavioron nano-/micro-patterned surfaces. Nanomedicine2012;7:1375–89.
40. Clark P, Connolly P, Curtis AS, Dow JA, Wilkinson CD.Topographical control of cell behavior: I. Simple step cues.Development 1987;99:439–48.
41. Kaiser JP, Reinmann A, Bruinink A. The effect of topographiccharacteristics on cell migration velocity. Biomaterials2006;27:5230–41.
42. Chen Y, He B, Lee J, Patankar NA. Anisotropy in the wettingof rough surfaces. Journal of Colloid and Interface Science2005;281:458–64.
43. Zhao Y, Lu Q, Li M, Li X. Anisotropic wetting characteristicson submicrometer-scale periodic grooved surface. Langmuir2007;23:6212–7.
44. Yang J, Rose FR, Gadegaard N, Alexander MR. Effect ofsessile drop volume on the wetting anisotropy observed ongrooved surfaces. Langmuir 2009;25:2567–71.
45. Li W, Fang G, Li Y, Qiao G. Anisotropic wetting behaviorarising from superhydrophobic surfaces: parallel groovedstructure. Journal of Physical Chemistry B 2008;112:7234–43.
46. Bukowsky C, Torres JM, Vogt BD. Slip-stick wetting and largecontact angle hysteresis on wrinkled surfaces. Journal ofColloid and Interface Science 2011;354:825–31.
47. Neuhaus S, Spencer ND, Padeste C. Anisotropic wetting ofmicrostructured surfaces as a function of surface chemistry.ACS Applied Materials &Interfaces 2012;4:123–30.
48. Pankov R, Momchilova A. Fluorescent labeling techniquesfor investigation of fibronectin fibrillogenesis (labelingfibronectin fibrillogenesis). Methods in Molecular Biology2009;522:261–74.
49. Salim M, O’Sullivan B, McArthur SL, Wright PC.Characterization of fibrinogen adsorption onto glassmicrocapillary surfaces by ELISA. Lab on a Chip 2007;7:64–70.
50. Roach P, Farrar D, Perry CC. Interpretation of proteinadsorption: surface-induced conformational changes.Journal of the American Chemical Society 2005;127:8168–73.
51. Glassford S, Chan KL, Byrne B, Kazarian SG. Chemicalimaging of protein adsorption and crystallization on awettability gradient surface. Langmuir 2012;28:3174–9.
52. Noh H, Vogler EA. Volumetric interpretation of proteinadsorption mass and energy balance for albumin adsorptionto particulate adsorbents with incrementally increasinghydrophilicity. Biomaterials 2006;27:5801–12.
53. Xu LC, Siedlecki CA. Effects of surface wettability andcontact time on protein adhesion to biomaterial surfaces.Biomaterials 2007;28:3273–83.
54. Xu LC, Siedlecki CA. Atomic force microscopy studies of theinitial interactions between fibrinogen and surfaces.Langmuir 2009;25:3675–81.
55. dos Santos EA, Farina M, Soares GA, Anselme K. Surfaceenergy of hydroxyapatite and beta-tricalcium phosphateceramics driving serum protein adsorption and osteoblastadhesion. Journal of Materials Science Materials in Medicine2008;19:2307–16.
56. Goldmann WH. Mechanotransduction and focal adhesions.Cell Biology International 2012;36:649–52.
57. Chen CS. Mechanotransduction – a field pulling together?Journal of Cell Science 2008;121:3285–92.
58. Harjanto D, Zaman MH. Modeling extracellular matrixreorganization in 3D environments. PLoS ONE 2013;8:1–11.
59. De R, Zemel A, Safran SA. Theoretical concepts and modelsof cellular mechanosensing. Methods in Cell Biology2010;98:143–75.
60. Daley WP, Peters SB, Larsen M. Extracellular matrixdynamics in development and regenerative medicine.Journal of Cell Science 2008;121:255–64.
61. Geiger B, Bershadsky A, Pankov R, Yamada KM.Transmembrane crosstalk between the extracellular matrix

j o u r n a l o f d e n t i s t r y 4 1 ( 2 0 1 3 ) 1 1 0 9 – 1 1 2 1 1121
– cytoskeleton crosstalk. Nature Reviews Molecular Cell Biology2001;2:793–805.
62. Walboomers XF, Jansen JA. Cell and tissue behavior onmicro-grooved surfaces. Odontology 2001;89:2–11.
63. Seo CH, Furukawa K, Montagne K, Jeong H, Ushida T. Theeffect of substrate microtopography on focal adhesionmaturation and actin organization via the RhoA/ROCKpathway. Biomaterials 2011;32:9568–75.
64. Lutz R, Sakai T, Chiquet M. Pericellular fibronectin isrequired for RhoA-dependent responses to cyclic strain infibroblasts. Journal of Cell Science 2010;123:1511–21.
65. Rohwedder I, Montanez E, Beckmann K, Bengtsson E,Duner P, Nilsson J, et al. Plasma fibronectindeficiency impedes atherosclerosis progression andfibrous cap formation. EMBO Molecular Medicine 2012;4:564–76.
66. Sakai T, Johnson KJ, Murozono M, Sakai K, Magnuson MA,Wieloch T, et al. Plasma fibronectin supports neuronalsurvival and reduces brain injury following transientfocal cerebral ischemia but is not essential for skin-wound healing and hemostasis. Nature Medicine2001;7:324–30.

本文献由“学霸图书馆-文献云下载”收集自网络,仅供学习交流使用。
学霸图书馆(www.xuebalib.com)是一个“整合众多图书馆数据库资源,
提供一站式文献检索和下载服务”的24 小时在线不限IP
图书馆。
图书馆致力于便利、促进学习与科研,提供最强文献下载服务。
图书馆导航:
图书馆首页 文献云下载 图书馆入口 外文数据库大全 疑难文献辅助工具