Efecto Del Fuego- Ingles
17
A study of reinforced concrete corner columns after fire Wen-Chen Jau * , Kuo-Li Huang Department of Civil Engineering, National Chiao-Tung University, 1001 Ta Hsueh Road, 300 Hsinchu, Taiwan Received 20 November 2006; received in revised form 21 September 2007; accepted 25 September 2007 Available online 7 November 2007 Abstract This study investigated the behavior of corner columns under axial loading, biaxial bending and asymmetric fire loading. It is found that, under a longitudinal stress ratio of 0:1f 0 c , the residual strength ratios of the columns after fire loading show: (a) the 2 and 4 h fire loadings result in residual strength ratios of 67% and 57%, respectively; a 10% reduction on residual strength results as the duration changes from 2 to 4 h; (b) reductions in reinforcing steel ratio cause lower residual strength ratios; and (c) increasing the thickness of con- crete cover causes lower residual strength ratios. It was also found that the temperature distribution across the cross-section is not affected by concrete cover thickness and steel ratio. The residual strengths can be used for future evaluation, repair and strengthening. Ó 2007 Elsevier Ltd. All rights reserved. Keywords: Mechanical properties; High temperature; Residual strength; Residual strength ratio; Corner column; Reinforced concrete 1. Introduction In recent years, many researchers, such as Lie [1–4]; Lin [5]; Ng [6,7]; Purkiss [8]; Lin [9–11]; Terro [12]; Kodur [13– 19]; Dotreppe [20,21]; Zha [22]; Tan [23–25]; Faris [26]; Chung [27]; Persson [28]; Bratina [29]; and Benmarce [30,31] studied the fire safety behavior of concrete columns. These studies included experimental and analytical evalua- tions for columns made of normal strength concrete and high performance (or high strength) concrete. Most of these studies focused on the axial loading and four-sided fire loading, except for the study of Tan [25] who per- formed an analytical study for columns under non-sym- metrical fire loading, although no experimental work was done to validate the results. The behavior of reinforced concrete (RC) columns under high temperature is mainly affected by the strength of the concrete by the changes of material property and explosive spalling. Normal strength concrete (NSC), high strength concrete (HSC), high performance concrete (HPC), or self-compacting concrete (SCC) are commonly used in the RC columns. NSC has been defined as having compression strength below 42 MPa, while concrete with compressive strength higher than 42 MPa has been defined as HSC [32]. HPC may have high strength, high durability, and/or high modulus of elasticity [33]. SCC is an innova- tive concrete that does not require vibration for placing and compaction. It is able to flow under its own weight, completely filling formwork and achieving full compaction, even in the presence of congested reinforcement. The hard- ened concrete is dense, homogeneous and has at least the same engineering properties and durability as traditional vibrated concrete [34]. However, high temperatures affect the strength of the concrete by explosive spalling and so affect the integrity of the concrete structure. High strength concrete has a relative higher strength loss when exposed to the same heating condition than normal strength concrete, because high strength concrete is prone to explosive spalling. Early research on the fire performance of concrete col- umns includes that done at the Portland Cement Associa- tion (PCA). Not only were material property studies conducted but also full-scale experiments under fire. Lie [1–8] established a thermal conductivity model and 0958-9465/$ - see front matter Ó 2007 Elsevier Ltd. All rights reserved. doi:10.1016/j.cemconcomp.2007.09.009 * Corresponding author. Tel.: +886 3 5715255; fax: +886 3 5734111. E-mail address: [email protected] (W.-C. Jau). www.elsevier.com/locate/cemconcomp Available online at www.sciencedirect.com Cement & Concrete Composites 30 (2008) 622–638
-
Upload
dely-dominguez -
Category
Documents
-
view
225 -
download
1
description
Concreto
Transcript of Efecto Del Fuego- Ingles
Available online at www.sciencedirect.com
www.elsevier.com/locate/cemconcomp
Cement & Concrete Composites 30 (2008) 622–638
A study of reinforced concrete corner columns after fire
Wen-Chen Jau *, Kuo-Li Huang
Department of Civil Engineering, National Chiao-Tung University, 1001 Ta Hsueh Road, 300 Hsinchu, Taiwan
Received 20 November 2006; received in revised form 21 September 2007; accepted 25 September 2007Available online 7 November 2007
Abstract
This study investigated the behavior of corner columns under axial loading, biaxial bending and asymmetric fire loading. It is foundthat, under a longitudinal stress ratio of 0:1f 0c , the residual strength ratios of the columns after fire loading show: (a) the 2 and 4 h fireloadings result in residual strength ratios of 67% and 57%, respectively; a 10% reduction on residual strength results as the durationchanges from 2 to 4 h; (b) reductions in reinforcing steel ratio cause lower residual strength ratios; and (c) increasing the thickness of con-crete cover causes lower residual strength ratios. It was also found that the temperature distribution across the cross-section is not affectedby concrete cover thickness and steel ratio. The residual strengths can be used for future evaluation, repair and strengthening.� 2007 Elsevier Ltd. All rights reserved.
Keywords: Mechanical properties; High temperature; Residual strength; Residual strength ratio; Corner column; Reinforced concrete
1. Introduction
In recent years, many researchers, such as Lie [1–4]; Lin[5]; Ng [6,7]; Purkiss [8]; Lin [9–11]; Terro [12]; Kodur [13–19]; Dotreppe [20,21]; Zha [22]; Tan [23–25]; Faris [26];Chung [27]; Persson [28]; Bratina [29]; and Benmarce[30,31] studied the fire safety behavior of concrete columns.These studies included experimental and analytical evalua-tions for columns made of normal strength concrete andhigh performance (or high strength) concrete. Most ofthese studies focused on the axial loading and four-sidedfire loading, except for the study of Tan [25] who per-formed an analytical study for columns under non-sym-metrical fire loading, although no experimental work wasdone to validate the results.
The behavior of reinforced concrete (RC) columnsunder high temperature is mainly affected by the strengthof the concrete by the changes of material property andexplosive spalling. Normal strength concrete (NSC), highstrength concrete (HSC), high performance concrete
0958-9465/$ - see front matter � 2007 Elsevier Ltd. All rights reserved.
doi:10.1016/j.cemconcomp.2007.09.009
* Corresponding author. Tel.: +886 3 5715255; fax: +886 3 5734111.E-mail address: [email protected] (W.-C. Jau).
(HPC), or self-compacting concrete (SCC) are commonlyused in the RC columns. NSC has been defined as havingcompression strength below 42 MPa, while concrete withcompressive strength higher than 42 MPa has been definedas HSC [32]. HPC may have high strength, high durability,and/or high modulus of elasticity [33]. SCC is an innova-tive concrete that does not require vibration for placingand compaction. It is able to flow under its own weight,completely filling formwork and achieving full compaction,even in the presence of congested reinforcement. The hard-ened concrete is dense, homogeneous and has at least thesame engineering properties and durability as traditionalvibrated concrete [34]. However, high temperatures affectthe strength of the concrete by explosive spalling and soaffect the integrity of the concrete structure. High strengthconcrete has a relative higher strength loss when exposed tothe same heating condition than normal strength concrete,because high strength concrete is prone to explosivespalling.
Early research on the fire performance of concrete col-umns includes that done at the Portland Cement Associa-tion (PCA). Not only were material property studiesconducted but also full-scale experiments under fire.Lie [1–8] established a thermal conductivity model and
Nomenclature
T average temperature in the furnace (�C)t time after the start of fire (min)fc concrete compressive strength of high tempera-
tures at a give strain ec (MPa)fr concrete residual compressive strength of high
temperatures (MPa)f 0c concrete compressive strength at 28 days (MPa)ec concrete strain (mm/mm)fy yield stress of steel (MPa)Es elastic modulus of steel (N/mm2)es strain of steel (mm/mm)ey yield strain of steel (mm/mm)Dax,Dbx displacements from LVDTeax, ebx strains calculated from Dax,Dbx along X-axis at a
and b
efx, eux predicted strains at two edge along X-axisux curvature of X-axisPn approximate value of nominal load in biaxial
with eccentricities ex and ey (kN)Pny0 nominal load when only eccentricity ex is pres-
ent (ey = 0) (kN)Pnx0 nominal load when only eccentricity ey is present
(ex = 0) (kN)P0 nominal load for concentrically loaded column
(kN)k thermal conductivity (W m�1 �C�1)q density (kg m�3)c specific (J kg�1 �C�1)
W.-C. Jau, K.-L. Huang / Cement & Concrete Composites 30 (2008) 622–638 623
experimentally studied the effects of axial loading, cross-sectional dimensions, moisture content and various typesof aggregates on the residual strength of interior concretecolumns. Their results showed that both concentricallyloaded and eccentrically loaded interior columns, designedaccording to ACI 318, have a nominal fire endurance of3 h.
In 1988, Lin [9–11] conducted a series of experiments toinvestigate the residual strength and stiffness of fire-dam-aged and subsequently repaired columns under four-sidedfire and eccentric axial loads in Taiwan. The results showedthat most of the repaired columns could develop their ori-ginal or even higher strength and stiffness or than those ofthe original columns.
From 1990 to 2006, more concrete columns experimentshave been done for high strength concrete (HSC), high per-formance concrete (HPC), self-compacting concrete (SCC)and fiber-reinforced polymer (FRP) repaired RC columns.Kodur [13–17] performed a series of experiments at theNational Research Council of Canada (NRCC) on the fireresistance of interior columns made of HSC. Data fromthis study indicated that the type of aggregate, concretestrength, load intensity, and detailing and spacing of tiescould affect the fire resistance and performance of HSC col-umns. Furthermore, the test results also showed that thebetter tie configuration (bending of ties at 135� and provi-sion of cross ties) and closer tie spacing have significantbenefits on the fire resistance of HSC columns. Kodur alsofound that the fire resistance of a NSC column is higherthan a HSC column. The addition of polypropylene fibersand the use of carbonate aggregate improved the fireresistance.
Kodur [18,19] also performed a research study on FRP-confined reinforced concrete columns. FRP in structuralengineering applications involves repair and rehabilitationof existing RC columns by bonding a circumferentialFRP wrap to their exterior. The experiments consisted of
fire endurance tests on five RC columns: one unstrength-ened circular and one unstrengthened square RC column,two circular FRP-wrapped and insulated RC columns,and one square FRP-wrapped and insulated RC column.Data obtained from the experiments shows that the firebehavior of FRP-wrapped concrete columns incorporatingappropriate fire protection systems is as good or betterthan that of unstrengthened RC columns. Comparing thefire resistance of the circular columns, it was found thatunstrengthened RC columns had a resistance of 245 min,whereas FRP-strengthened RC columns had a fire resis-tance greater than 330 min. This result is significant in thatit demonstrates that the FRP strengthened columns arecapable of providing satisfactory fire resistance under theirstrengthened service loads. In terms of the performance ofthe square columns, unstrengthened RC columns had a fireresistance of 262 min, whereas FRP-strengthened RC col-umn had a fire resistance of 256 min. Again, the satisfac-tory fire behavior of the strengthened column underincreased service loads can be attributed to the thermalinsulation provided by the fire protection system.
The fire resistance of SCC is similar to that of NSC [34].In general a low permeability concrete may be more proneto spalling, but the severity of the spalling depends uponthe type of aggregate used, concrete quality and moisturecontent. SCC can easily achieve the requirements for highstrength, low permeability concrete. The use of polypropyl-ene fibers (PPF) in concrete has been shown to be effectivein improving its resistance to spalling. The mechanism isbelieved to be due to the fibers melting and being absorbedin the cement matrix. The fiber voids then provide expan-sion chambers for steam, thus reducing the risk of spalling.Polypropylene fibers have been successfully used with SCC.Persson [28] suggested that one way to limit the amount ofexplosive fire spalling in columns with SCC to the samelevel as in columns with NSC is to introduce PPF intothe concrete mix; another way was to keep the combination
624 W.-C. Jau, K.-L. Huang / Cement & Concrete Composites 30 (2008) 622–638
of cement/powder and water/cement sufficiently high, amethod that has been proven to be very effective.
In addition, predictive methods were developed andthen compared to experimental results. The procedureincludes two parts. The first part is the heat-transfer prob-lem, which is to solve the heat-balance equation by finitedifference method or finite element method. The tempera-ture distribution across the concrete section can beobtained. The second part is the calculation of mechanicalproperties of the concrete material and concrete structuresproblem based on the temperature distribution from part 1.The methods can predict the fire endurance, the tempera-ture distribution across the section, the strength of thecolumn under fire, and the residual strength after the fire.These methods include:
(a) FRCP (fire resistance computer program) [6]: It ana-lyzes the influence of selected parameters on theresponse and behavior of square reinforced concretecolumns axially loaded and subjected to fire. The pro-gram calculates the internal temperature distributionof the column resulting from the external fire temper-ature using the finite difference method.
(b) SAFE-RCC (structural analysis of fire exposed rein-forced concrete columns) [8]: The computer programcalled SAFE-RCC takes into account the change inload carrying capacity and stiffness of a column dur-ing a fire, as well as the change in stiffness of the fram-ing system at each end of the column. Following thepresentation of the results of some proving tests, itpresents the results from an exploratory series of runswhich clearly indicate that the flexural stiffness of therestraint system plays a large part in determining thefire response.
(c) SAFIR [20]: SAFIR is a finite element model that wasdeveloped at the University of Liege, Belgium, for thesimulation of the behavior of a building subjected tofire. This software calculates the evolution of the tem-peratures in a structure subject to fire and the evolu-tion of the equilibrium conditions (stresses, strains,displacements, moments, etc.) of the heated structureuntil failure. This model solves the transient analysisof the temperature in the structure and the mechani-cal analysis of the structure during the fire.
(d) European standards [21,29]: Eurocode 2 (2002)assesses the duration of the fire resistance of rein-forced concrete columns and provides a simple for-mula for the duration of fire resistance of areinforced concrete column as a member of a non-sway structure subjected mainly to compression.
(e) Extended ACI code [23–25]: The idea behind theextended ACI 318 code method is to find the ultimatefailure points on the P–M interaction curves corre-sponding to different temperatures.
(f) Numerical method (transformed into a square net-work) [1,9–11,15–17,35,36]: This numerical methodcombined with the normal RC theory can be used
to calculate the performance of RC columns duringor after a fire. Assuming that the temperatures distri-bution within an element is constant and the elementis homogeneous, the element is stacked to calculatethe residual strengths. A further examination of thesenumerical modeling studies shows that these methodscan be used both during fire and after a fire, and someliteratures refer to his method as the lumped systemmethod [35,36]. The methods (a)–(e) are used duringa fire. Although the numerical method is an approx-imate method, many studies have proven it to be agood approach and could conveniently justified byexperiment results. The numerical method is usuallycombined with the finite difference method or a pack-age program to obtain the distribution of tempera-ture of the concrete cross-section.
In the above-mentioned studies, the concerned is mainlyon the fire-endurance of the column, and is especiallyfocused on the spalling phenomenon for HSC columns,and only a few studies considered the residual strength ofthe column [1,9–11]. The main purpose of the present paperis to study the residual strength of RC columns subjected toonly a two-sided fire exposure, axial loading and biaxialbending and to verify the applicability of a numericalmethod and RC theory. There are no previous similar testsavailable in the literature. This study employs the numeri-cal method to justify the experimental of results.
2. Background
Corner columns are usually under high biaxial eccentric-ity. Furthermore, during a fire, only the interior two facesof corner columns may be exposed to fire in contrast tointerior columns of which all four faces are exposed. Thematerial asymmetry of concrete after fire further compli-cated the behavior of corner columns. This study investi-gated the behavior of corner columns under axialloading, biaxial bending and asymmetric fire loading. SixRC corner columns were manufactured for this researchunder high temperatures.
2.1. Fire laboratory
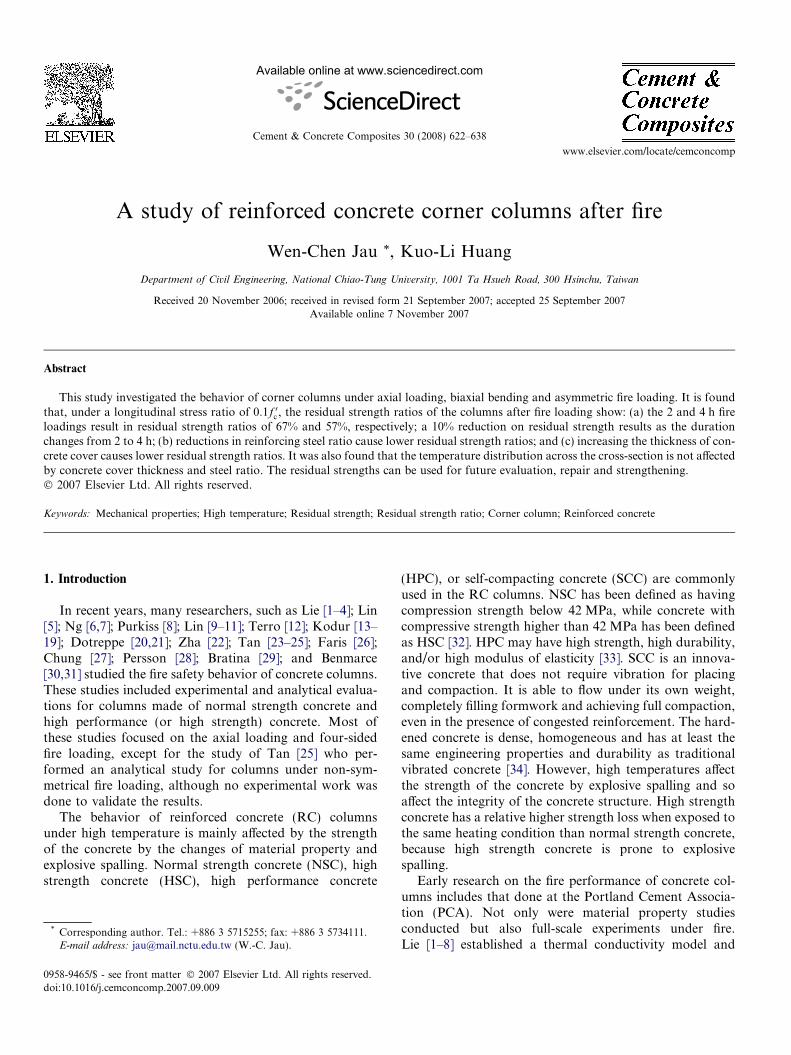
All experiments were performed in the fire laboratory ofthe Architecture and Building Research Institute (ABRI) inGui-Ren, Tainan, Taiwan. The fire curve followed the Chi-nese National Standards (CNS) 12514 [37], which is thesame as the curve from International Organization forStandardization (ISO) 834 [38]. The temperature changeis as in Eq. (1). After two hours the temperature reaches1049 �C, and after 4 h the temperature reaches 1153 �C,as shown in Fig. 1.
T ¼ 345log10ð8t þ 1Þ þ 20 ð1Þwhere T is the average temperature in the furnace (�C) andt is the time after the start of fire (minute).
0
200
400
600
800
1000
1200
1400
0 60 120 180 240 300 360 420 480
Time (sec)
Tem
pera
ture
(°) CNS&ISO
Fig. 1. Fire curve.
0
0.2
0.4
0.6
0.8
1
1.2
0 200 400 600 800 1000
Temp (°C)
fr/f
c'
Lie[1]
Jau[36]
Fig. 3. Residue strength relation by Lie and Jau research.
10
14
1112
2
7
15
11
14
2
02468
10121416
0.6 0.8 1 1.2 1.4interval
Num
er o
f te
st
Lie/Test
Jau/Test
Fig. 4. Residue strength relation by Lie and Jau research.
W.-C. Jau, K.-L. Huang / Cement & Concrete Composites 30 (2008) 622–638 625
2.2. Material properties at elevated temperatures
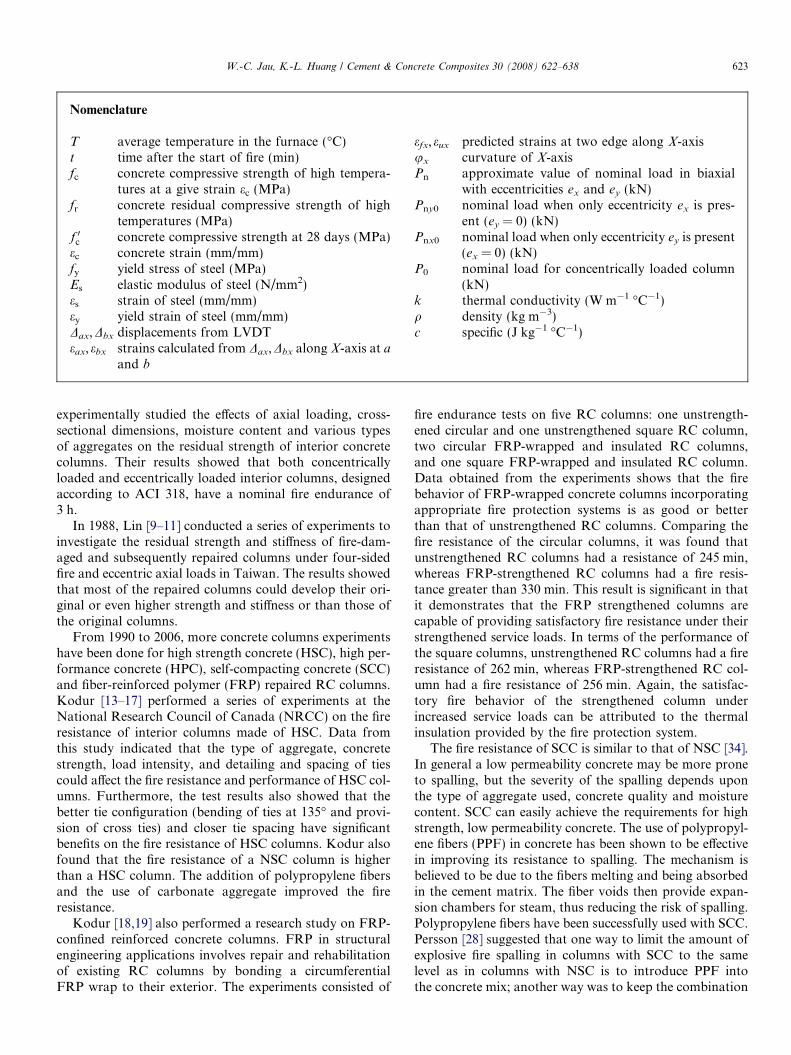
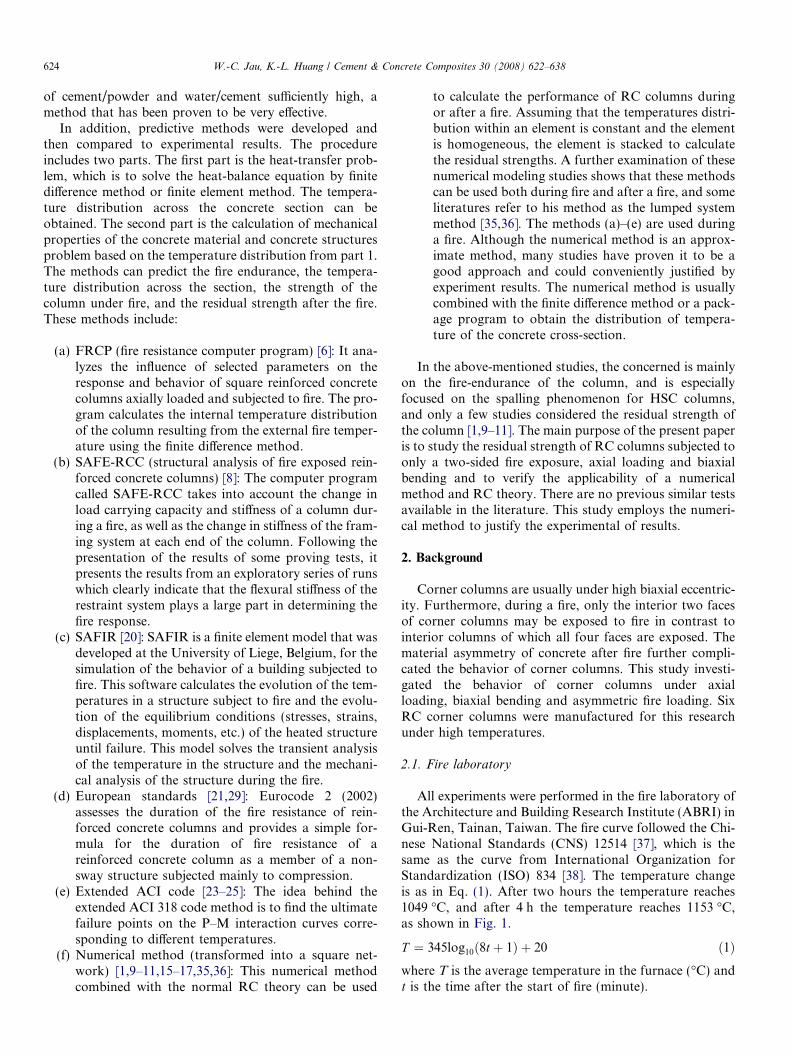
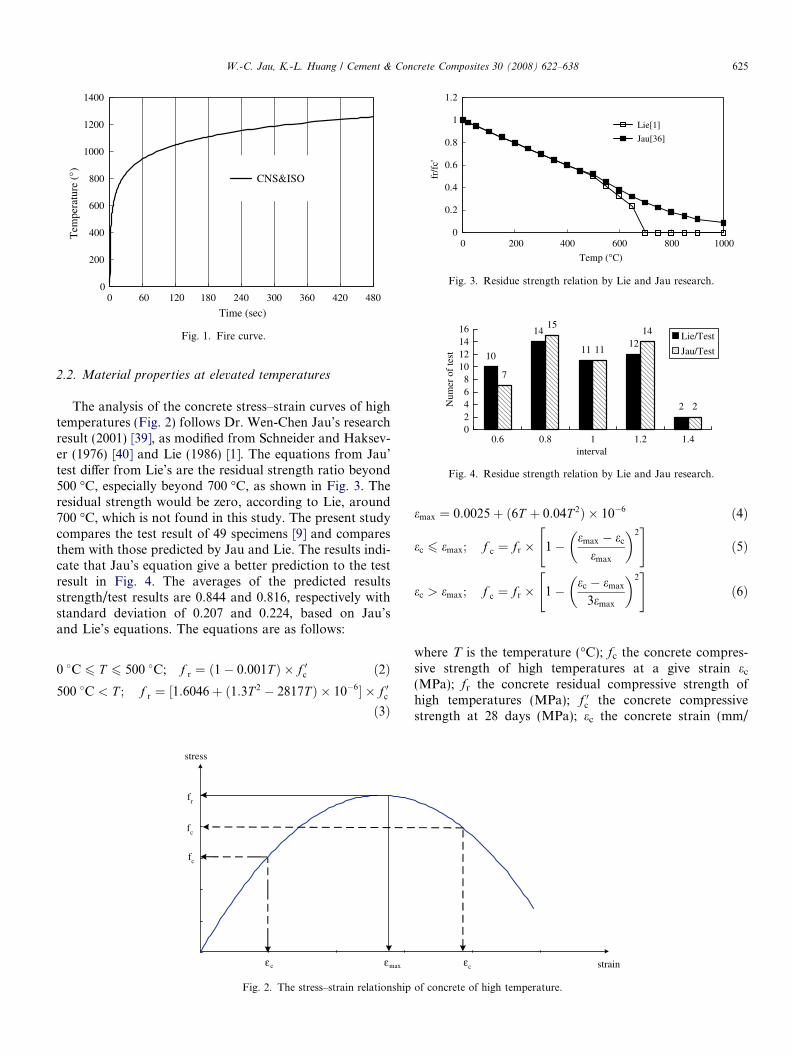
The analysis of the concrete stress–strain curves of hightemperatures (Fig. 2) follows Dr. Wen-Chen Jau’s researchresult (2001) [39], as modified from Schneider and Haksev-er (1976) [40] and Lie (1986) [1]. The equations from Jau’test differ from Lie’s are the residual strength ratio beyond500 �C, especially beyond 700 �C, as shown in Fig. 3. Theresidual strength would be zero, according to Lie, around700 �C, which is not found in this study. The present studycompares the test result of 49 specimens [9] and comparesthem with those predicted by Jau and Lie. The results indi-cate that Jau’s equation give a better prediction to the testresult in Fig. 4. The averages of the predicted resultsstrength/test results are 0.844 and 0.816, respectively withstandard deviation of 0.207 and 0.224, based on Jau’sand Lie’s equations. The equations are as follows:
0 �C 6 T 6 500 �C; f r ¼ ð1� 0:001T Þ � f 0c ð2Þ500 �C < T ; f r ¼ ½1:6046þ ð1:3T 2 � 2817T Þ � 10�6� � f 0c
ð3Þ
stress
fr
max
fc
c
fc
ε ε
Fig. 2. The stress–strain relationship
emax ¼ 0:0025þ ð6T þ 0:04T 2Þ � 10�6 ð4Þ
ec 6 emax; f c ¼ fr � 1� emax � ec
emax
� �2" #
ð5Þ
ec > emax; f c ¼ fr � 1� ec � emax
3emax
� �2" #
ð6Þ
where T is the temperature (�C); fc the concrete compres-sive strength of high temperatures at a give strain ec
(MPa); fr the concrete residual compressive strength ofhigh temperatures (MPa); f 0c the concrete compressivestrength at 28 days (MPa); ec the concrete strain (mm/
straincε
of concrete of high temperature.
strain
stress
fy
yε
Fig. 5. The stress–strain relationship of steel of high temperature.
Fire
Fire
column column
column column
column column 2700 mmC. L.1500 mm
450 mm 450 mm
300 mm
300 mm
(a) top view
(b) side view
Fig. 6. A sketch map of column specimens under high temperature.
300 mm 300 mm
450
mm
450
mm
75 mm
75 m
m
75 mm
75 m
m
75 mm 75 mm
actuator
center line of column
universal joint(preloading positions)
Fig. 7. Column arrangement and load application during fire test.
626 W.-C. Jau, K.-L. Huang / Cement & Concrete Composites 30 (2008) 622–638
mm); and emax is the max. concrete strain at given temper-ature (mm/mm).
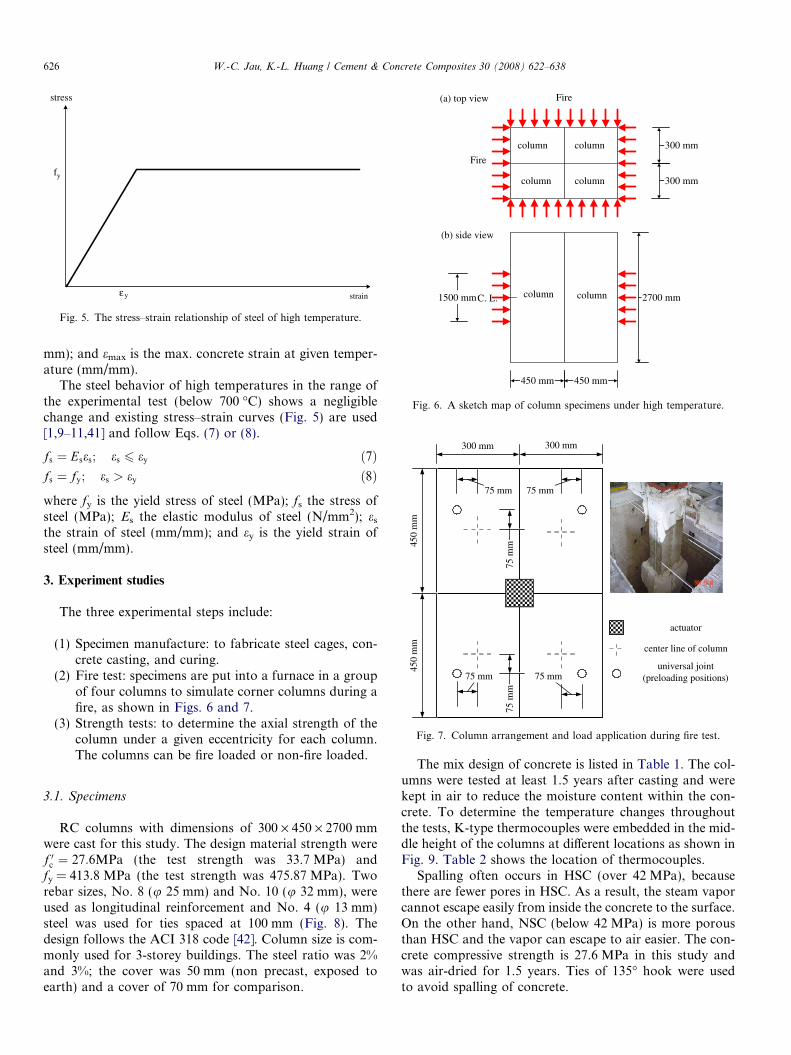
The steel behavior of high temperatures in the range ofthe experimental test (below 700 �C) shows a negligiblechange and existing stress–strain curves (Fig. 5) are used[1,9–11,41] and follow Eqs. (7) or (8).
fs ¼ Eses; es 6 ey ð7Þfs ¼ fy; es > ey ð8Þ
where fy is the yield stress of steel (MPa); fs the stress ofsteel (MPa); Es the elastic modulus of steel (N/mm2); es
the strain of steel (mm/mm); and ey is the yield strain ofsteel (mm/mm).
3. Experiment studies
The three experimental steps include:
(1) Specimen manufacture: to fabricate steel cages, con-crete casting, and curing.
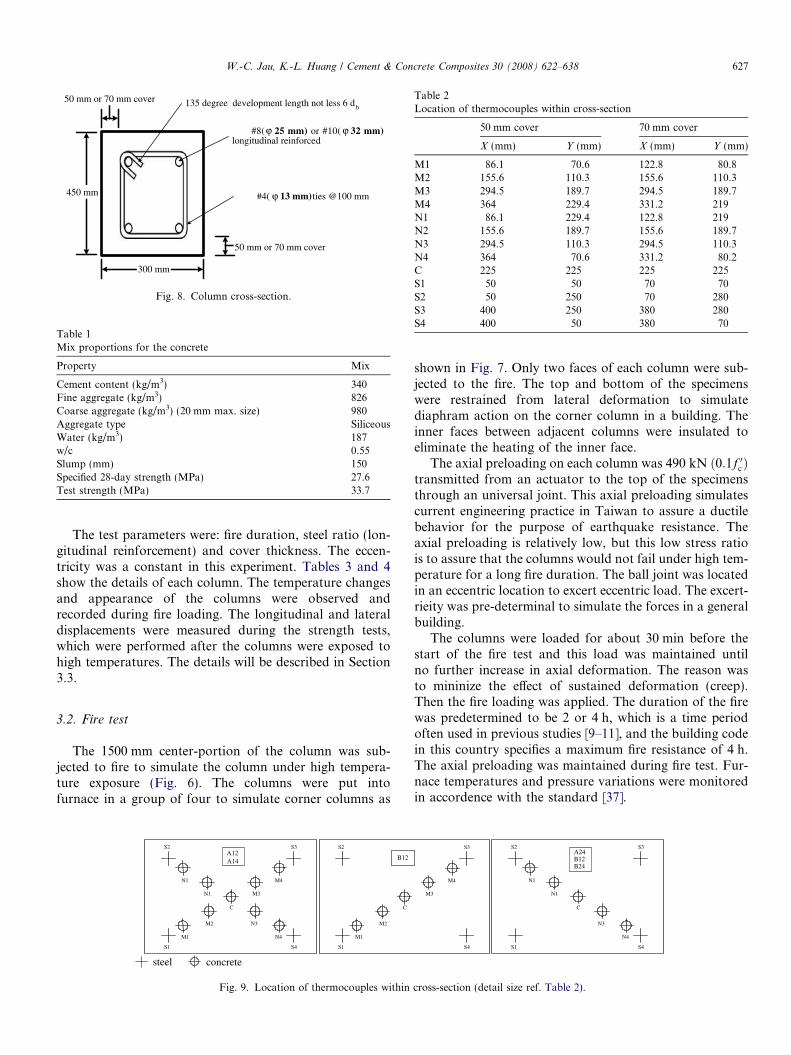
(2) Fire test: specimens are put into a furnace in a groupof four columns to simulate corner columns during afire, as shown in Figs. 6 and 7.
(3) Strength tests: to determine the axial strength of thecolumn under a given eccentricity for each column.The columns can be fire loaded or non-fire loaded.
3.1. Specimens
RC columns with dimensions of 300 · 450 · 2700 mmwere cast for this study. The design material strength weref 0c ¼ 27:6MPa (the test strength was 33.7 MPa) andfy = 413.8 MPa (the test strength was 475.87 MPa). Tworebar sizes, No. 8 (u 25 mm) and No. 10 (u 32 mm), wereused as longitudinal reinforcement and No. 4 (u 13 mm)steel was used for ties spaced at 100 mm (Fig. 8). Thedesign follows the ACI 318 code [42]. Column size is com-monly used for 3-storey buildings. The steel ratio was 2%and 3%; the cover was 50 mm (non precast, exposed toearth) and a cover of 70 mm for comparison.
The mix design of concrete is listed in Table 1. The col-umns were tested at least 1.5 years after casting and werekept in air to reduce the moisture content within the con-crete. To determine the temperature changes throughoutthe tests, K-type thermocouples were embedded in the mid-dle height of the columns at different locations as shown inFig. 9. Table 2 shows the location of thermocouples.
Spalling often occurs in HSC (over 42 MPa), becausethere are fewer pores in HSC. As a result, the steam vaporcannot escape easily from inside the concrete to the surface.On the other hand, NSC (below 42 MPa) is more porousthan HSC and the vapor can escape to air easier. The con-crete compressive strength is 27.6 MPa in this study andwas air-dried for 1.5 years. Ties of 135� hook were usedto avoid spalling of concrete.
300 mm
450 mm
50 mm or 70 mm cover
50 mm or 70 mm cover 135 degree development length not less 6 db
#8( 25 mm) or #10( 32 mm)longitudinal reinforced
#4( 13 mm) ties @100 mm
ϕ ϕ
ϕ
Fig. 8. Column cross-section.
Table 1Mix proportions for the concrete
Property Mix
Cement content (kg/m3) 340Fine aggregate (kg/m3) 826Coarse aggregate (kg/m3) (20 mm max. size) 980Aggregate type SiliceousWater (kg/m3) 187w/c 0.55Slump (mm) 150Specified 28-day strength (MPa) 27.6Test strength (MPa) 33.7
Table 2Location of thermocouples within cross-section
50 mm cover 70 mm cover
X (mm) Y (mm) X (mm) Y (mm)
M1 86.1 70.6 122.8 80.8M2 155.6 110.3 155.6 110.3M3 294.5 189.7 294.5 189.7M4 364 229.4 331.2 219N1 86.1 229.4 122.8 219N2 155.6 189.7 155.6 189.7N3 294.5 110.3 294.5 110.3N4 364 70.6 331.2 80.2C 225 225 225 225S1 50 50 70 70S2 50 250 70 280S3 400 250 380 280S4 400 50 380 70
W.-C. Jau, K.-L. Huang / Cement & Concrete Composites 30 (2008) 622–638 627
The test parameters were: fire duration, steel ratio (lon-gitudinal reinforcement) and cover thickness. The eccen-tricity was a constant in this experiment. Tables 3 and 4show the details of each column. The temperature changesand appearance of the columns were observed andrecorded during fire loading. The longitudinal and lateraldisplacements were measured during the strength tests,which were performed after the columns were exposed tohigh temperatures. The details will be described in Section3.3.
3.2. Fire test
The 1500 mm center-portion of the column was sub-jected to fire to simulate the column under high tempera-ture exposure (Fig. 6). The columns were put intofurnace in a group of four to simulate corner columns as
S4
S3S2
S1
N4
M2
M3
M4N1
N1
N3
M1
C
S2
S1
M2
M1
C
steel concrete
A12B12A14
Fig. 9. Location of thermocouples within
shown in Fig. 7. Only two faces of each column were sub-jected to the fire. The top and bottom of the specimenswere restrained from lateral deformation to simulatediaphram action on the corner column in a building. Theinner faces between adjacent columns were insulated toeliminate the heating of the inner face.
The axial preloading on each column was 490 kN ð0:1f 0cÞtransmitted from an actuator to the top of the specimensthrough an universal joint. This axial preloading simulatescurrent engineering practice in Taiwan to assure a ductilebehavior for the purpose of earthquake resistance. Theaxial preloading is relatively low, but this low stress ratiois to assure that the columns would not fail under high tem-perature for a long fire duration. The ball joint was locatedin an eccentric location to excert eccentric load. The excert-rieity was pre-determinal to simulate the forces in a generalbuilding.
The columns were loaded for about 30 min before thestart of the fire test and this load was maintained untilno further increase in axial deformation. The reason wasto mininize the effect of sustained deformation (creep).Then the fire loading was applied. The duration of the firewas predetermined to be 2 or 4 h, which is a time periodoften used in previous studies [9–11], and the building codein this country specifies a maximum fire resistance of 4 h.The axial preloading was maintained during fire test. Fur-nace temperatures and pressure variations were monitoredin accordence with the standard [37].
S4
S3
M3
M4
S4
S3S2
S1
N4
N1
N1
N3
C
A24B12B24
cross-section (detail size ref. Table 2).
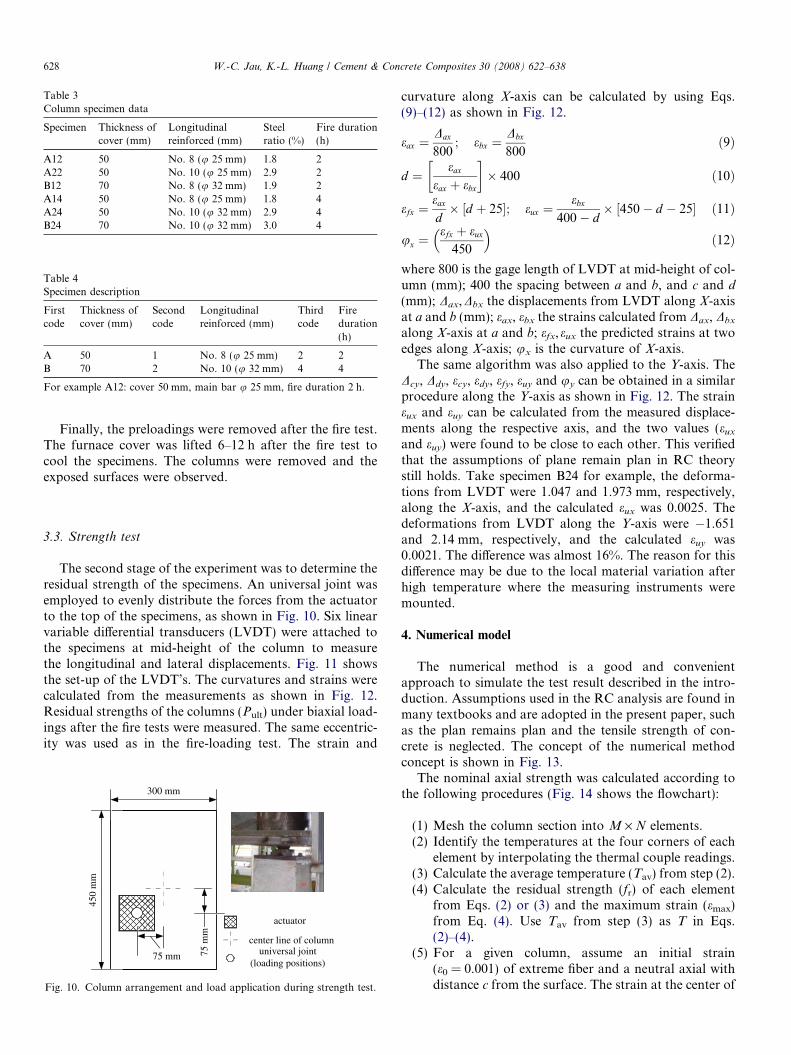
Table 3Column specimen data
Specimen Thickness ofcover (mm)
Longitudinalreinforced (mm)
Steelratio (%)
Fire duration(h)
A12 50 No. 8 (u 25 mm) 1.8 2A22 50 No. 10 (u 25 mm) 2.9 2B12 70 No. 8 (u 32 mm) 1.9 2A14 50 No. 8 (u 25 mm) 1.8 4A24 50 No. 10 (u 32 mm) 2.9 4B24 70 No. 10 (u 32 mm) 3.0 4
Table 4Specimen description
Firstcode
Thickness ofcover (mm)
Secondcode
Longitudinalreinforced (mm)
Thirdcode
Fireduration(h)
A 50 1 No. 8 (u 25 mm) 2 2B 70 2 No. 10 (u 32 mm) 4 4
For example A12: cover 50 mm, main bar u 25 mm, fire duration 2 h.
628 W.-C. Jau, K.-L. Huang / Cement & Concrete Composites 30 (2008) 622–638
Finally, the preloadings were removed after the fire test.The furnace cover was lifted 6–12 h after the fire test tocool the specimens. The columns were removed and theexposed surfaces were observed.
3.3. Strength test
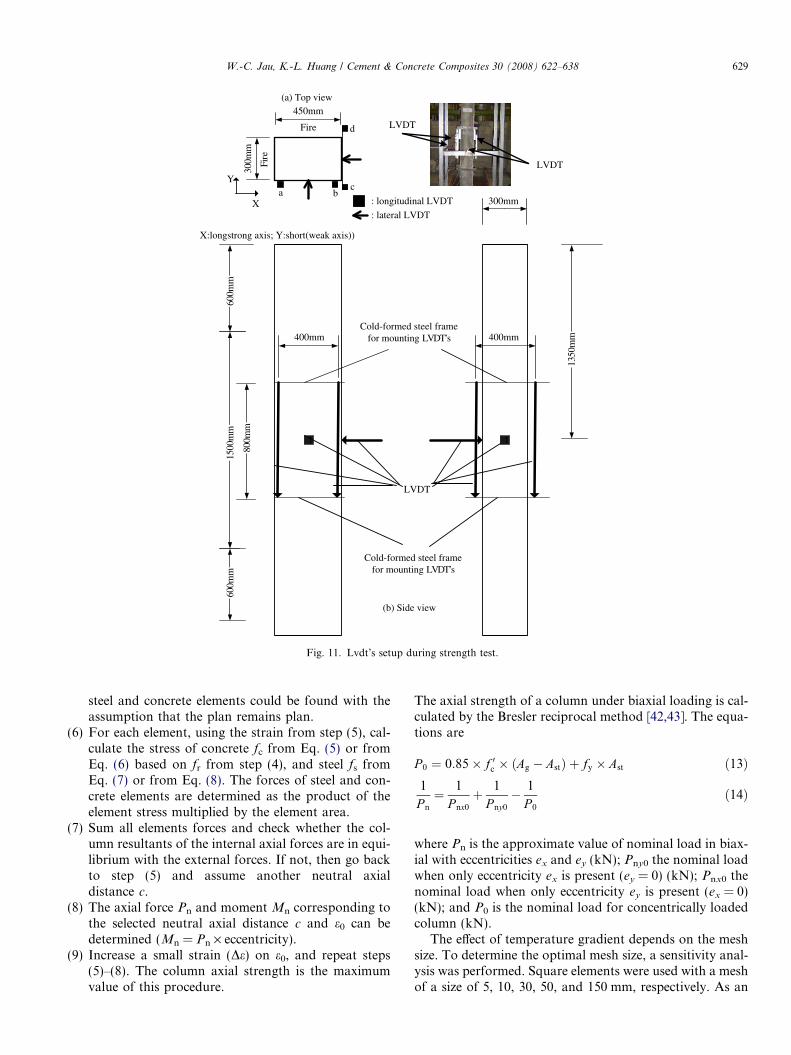
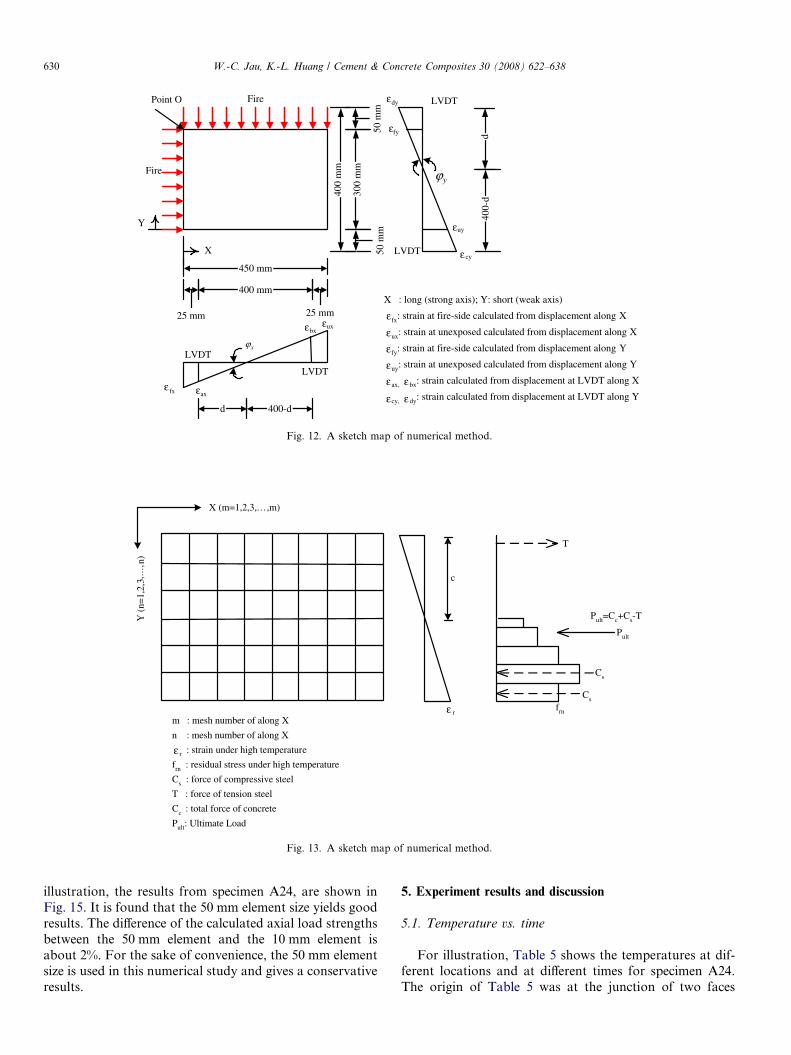
The second stage of the experiment was to determine theresidual strength of the specimens. An universal joint wasemployed to evenly distribute the forces from the actuatorto the top of the specimens, as shown in Fig. 10. Six linearvariable differential transducers (LVDT) were attached tothe specimens at mid-height of the column to measurethe longitudinal and lateral displacements. Fig. 11 showsthe set-up of the LVDT’s. The curvatures and strains werecalculated from the measurements as shown in Fig. 12.Residual strengths of the columns (Pult) under biaxial load-ings after the fire tests were measured. The same eccentric-ity was used as in the fire-loading test. The strain and
450
mm
75 m
m
75 mm
actuator
center line of columnuniversal joint
(loading positions)
300 mm
Fig. 10. Column arrangement and load application during strength test.
curvature along X-axis can be calculated by using Eqs.(9)–(12) as shown in Fig. 12.
eax ¼Dax
800; ebx ¼
Dbx
800ð9Þ
d ¼ eax
eax þ ebx
� �� 400 ð10Þ
efx ¼eax
d� ½d þ 25�; eux ¼
ebx
400� d� ½450� d � 25� ð11Þ
ux ¼efx þ eux
450
� �ð12Þ
where 800 is the gage length of LVDT at mid-height of col-umn (mm); 400 the spacing between a and b, and c and d
(mm); Dax,Dbx the displacements from LVDT along X-axisat a and b (mm); eax, ebx the strains calculated from Dax, Dbx
along X-axis at a and b; efx, eux the predicted strains at twoedges along X-axis; ux is the curvature of X-axis.
The same algorithm was also applied to the Y-axis. TheDcy, Ddy, ecy, edy, efy, euy and uy can be obtained in a similarprocedure along the Y-axis as shown in Fig. 12. The straineux and euy can be calculated from the measured displace-ments along the respective axis, and the two values (eux
and euy) were found to be close to each other. This verifiedthat the assumptions of plane remain plan in RC theorystill holds. Take specimen B24 for example, the deforma-tions from LVDT were 1.047 and 1.973 mm, respectively,along the X-axis, and the calculated eux was 0.0025. Thedeformations from LVDT along the Y-axis were �1.651and 2.14 mm, respectively, and the calculated euy was0.0021. The difference was almost 16%. The reason for thisdifference may be due to the local material variation afterhigh temperature where the measuring instruments weremounted.
4. Numerical model
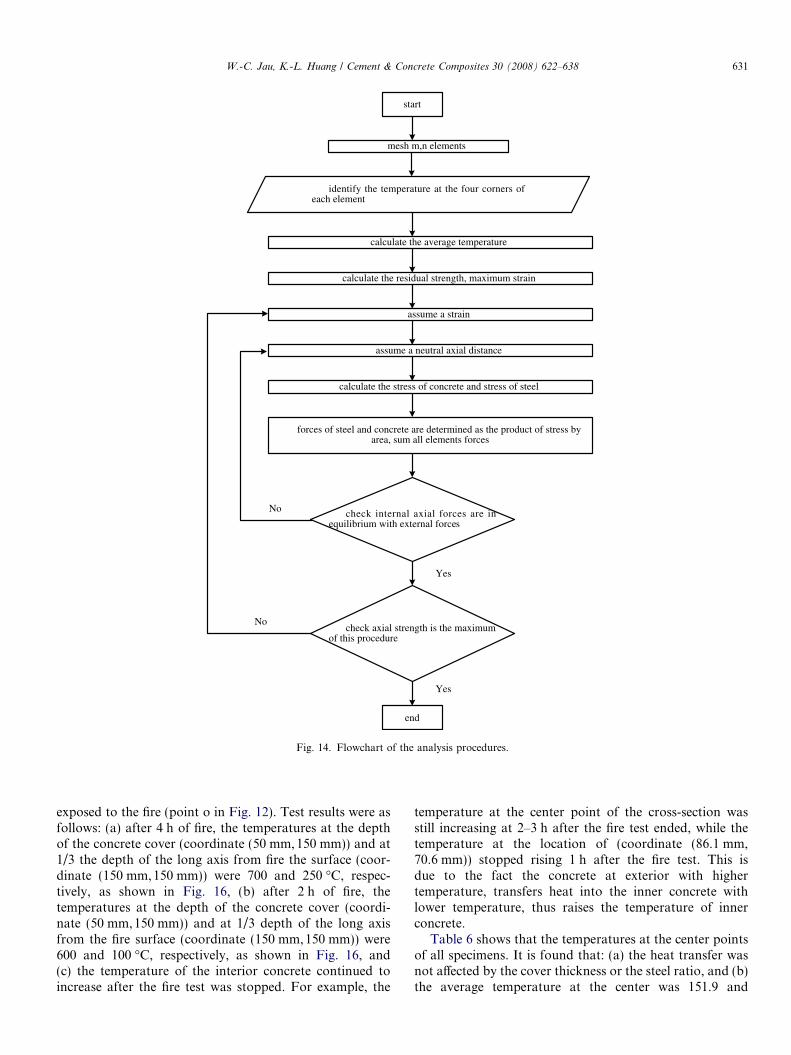
The numerical method is a good and convenientapproach to simulate the test result described in the intro-duction. Assumptions used in the RC analysis are found inmany textbooks and are adopted in the present paper, suchas the plan remains plan and the tensile strength of con-crete is neglected. The concept of the numerical methodconcept is shown in Fig. 13.
The nominal axial strength was calculated according tothe following procedures (Fig. 14 shows the flowchart):
(1) Mesh the column section into M · N elements.(2) Identify the temperatures at the four corners of each
element by interpolating the thermal couple readings.(3) Calculate the average temperature (Tav) from step (2).(4) Calculate the residual strength (fr) of each element
from Eqs. (2) or (3) and the maximum strain (emax)from Eq. (4). Use Tav from step (3) as T in Eqs.(2)–(4).
(5) For a given column, assume an initial strain(e0 = 0.001) of extreme fiber and a neutral axial withdistance c from the surface. The strain at the center of
Fire
Fire
450mm
300m
m
600m
m15
00m
m60
0mm
300mm
1350
mm
1 1
400mm
800m
m
400mm
X:longstrong axis; Y:short(weak axis))
Cold-formed steel framefor mounting LVDT’s
LVDT
X
Y
(a) Top view
(b) Side view
: longitudinal LVDT
: lateral LVDT
LVDT
LVDT
Cold-formed steel framefor mounting LVDT’s
a bc
d
Fig. 11. Lvdt’s setup during strength test.
W.-C. Jau, K.-L. Huang / Cement & Concrete Composites 30 (2008) 622–638 629
steel and concrete elements could be found with theassumption that the plan remains plan.
(6) For each element, using the strain from step (5), cal-culate the stress of concrete fc from Eq. (5) or fromEq. (6) based on fr from step (4), and steel fs fromEq. (7) or from Eq. (8). The forces of steel and con-crete elements are determined as the product of theelement stress multiplied by the element area.
(7) Sum all elements forces and check whether the col-umn resultants of the internal axial forces are in equi-librium with the external forces. If not, then go backto step (5) and assume another neutral axialdistance c.
(8) The axial force Pn and moment Mn corresponding tothe selected neutral axial distance c and e0 can bedetermined (Mn = Pn · eccentricity).
(9) Increase a small strain (De) on e0, and repeat steps(5)–(8). The column axial strength is the maximumvalue of this procedure.
The axial strength of a column under biaxial loading is cal-culated by the Bresler reciprocal method [42,43]. The equa-tions are
P 0 ¼ 0:85� f 0c � ðAg � AstÞ þ fy � Ast ð13Þ1
P n
¼ 1
P nx0
þ 1
P ny0
� 1
P 0
ð14Þ
where Pn is the approximate value of nominal load in biax-ial with eccentricities ex and ey (kN); Pny0 the nominal loadwhen only eccentricity ex is present (ey = 0) (kN); Pnx0 thenominal load when only eccentricity ey is present (ex = 0)(kN); and P0 is the nominal load for concentrically loadedcolumn (kN).
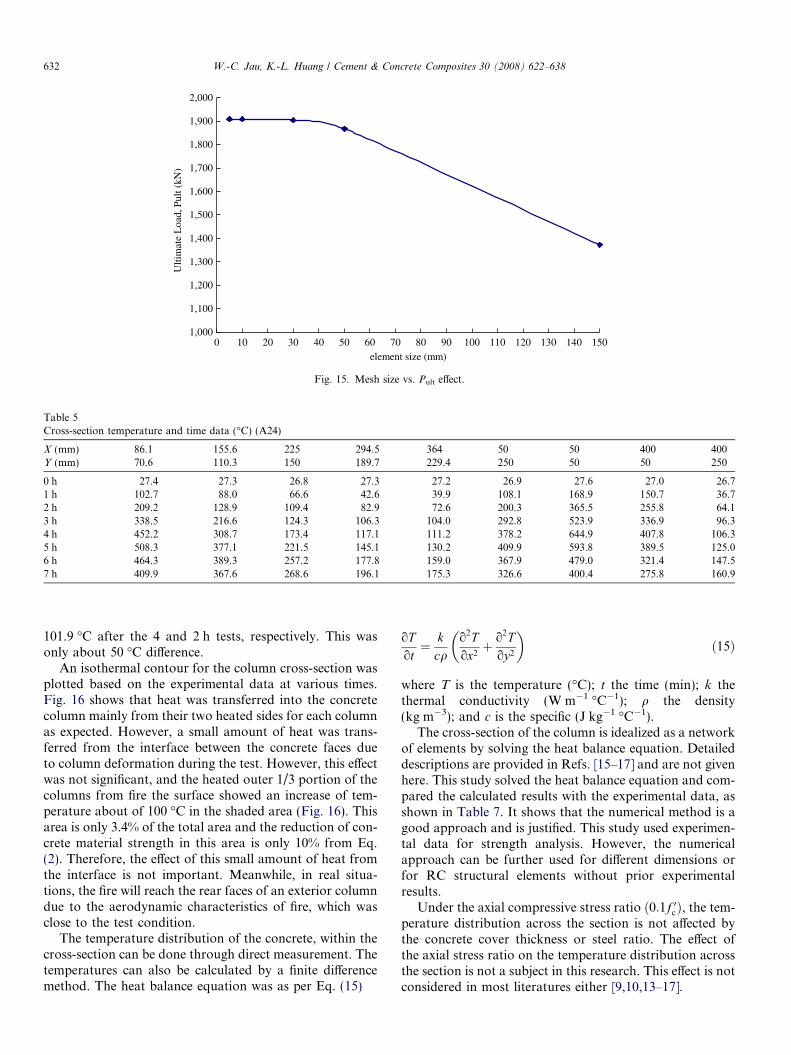
The effect of temperature gradient depends on the meshsize. To determine the optimal mesh size, a sensitivity anal-ysis was performed. Square elements were used with a meshof a size of 5, 10, 30, 50, and 150 mm, respectively. As an
X (m=1,2,3,.. . ,m)
Y (
n=1,
2,3,
...,
n)
c
Cs
T
Pult
Cs
frn
m : mesh number of along X
n : mesh number of along X
r : strain under high temperature
frn : residual stress under high temperature
Cs : force of compressive steel
T : force of tension steel
Cc : total force of concrete
Pult: Ultimate Load
r
Pult=Cc+Cs-T
ε
ε
Fig. 13. A sketch map of numerical method.
25 mm
400 mm
25 mm
450 mm
d 400-d
X
xϕ
Fire
50 m
m50
mm
300
mm
400
mm
d40
0-d
Y
Fire
fx ax
bxux
dy
fy
uy
cy
yϕ
X : long (strong axis); Y: short (weak axis)
fx: strain at fire-side calculated from displacement along X
ux: strain at unexposed calculated from displacement along X
fy: strain at fire-side calculated from displacement along Y
uy: strain at unexposed calculated from displacement along Y
ax, bx: strain calculated from displacement at LVDT along X
cy, dy: strain calculated from displacement at LVDT along Y
ε
εεεε ε
εεε ε
ε
ε
ε
ε
ε
ε
Point O LVDT
LVDT
LVDT
LVDT
Fig. 12. A sketch map of numerical method.
630 W.-C. Jau, K.-L. Huang / Cement & Concrete Composites 30 (2008) 622–638
illustration, the results from specimen A24, are shown inFig. 15. It is found that the 50 mm element size yields goodresults. The difference of the calculated axial load strengthsbetween the 50 mm element and the 10 mm element isabout 2%. For the sake of convenience, the 50 mm elementsize is used in this numerical study and gives a conservativeresults.
5. Experiment results and discussion
5.1. Temperature vs. time
For illustration, Table 5 shows the temperatures at dif-ferent locations and at different times for specimen A24.The origin of Table 5 was at the junction of two faces
mesh m,n elements
identify the temperature at the four corners ofeach element
calculate the average temperature
calculate the residual strength, maximum strain
assume a strain
assume a neutral axial distance
calculate the stress of concrete and stress of steel
forces of steel and concrete are determined as the product of stress byarea, sum all elements forces
check internal axial forces are inequilibrium with external forces
No
check axial strength is the maximumof this procedure
end
start
Yes
Yes
No
Fig. 14. Flowchart of the analysis procedures.
W.-C. Jau, K.-L. Huang / Cement & Concrete Composites 30 (2008) 622–638 631
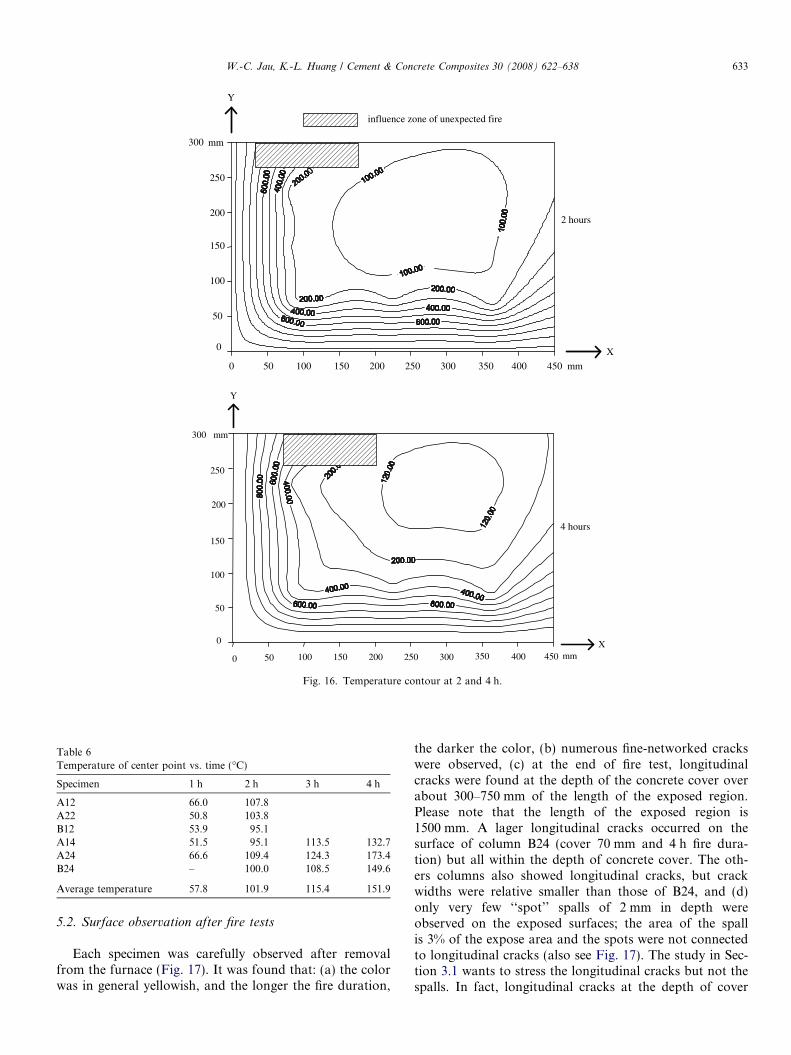
exposed to the fire (point o in Fig. 12). Test results were asfollows: (a) after 4 h of fire, the temperatures at the depthof the concrete cover (coordinate (50 mm, 150 mm)) and at1/3 the depth of the long axis from fire the surface (coor-dinate (150 mm,150 mm)) were 700 and 250 �C, respec-tively, as shown in Fig. 16, (b) after 2 h of fire, thetemperatures at the depth of the concrete cover (coordi-nate (50 mm,150 mm)) and at 1/3 depth of the long axisfrom the fire surface (coordinate (150 mm,150 mm)) were600 and 100 �C, respectively, as shown in Fig. 16, and(c) the temperature of the interior concrete continued toincrease after the fire test was stopped. For example, the
temperature at the center point of the cross-section wasstill increasing at 2–3 h after the fire test ended, while thetemperature at the location of (coordinate (86.1 mm,70.6 mm)) stopped rising 1 h after the fire test. This isdue to the fact the concrete at exterior with highertemperature, transfers heat into the inner concrete withlower temperature, thus raises the temperature of innerconcrete.
Table 6 shows that the temperatures at the center pointsof all specimens. It is found that: (a) the heat transfer wasnot affected by the cover thickness or the steel ratio, and (b)the average temperature at the center was 151.9 and
1,000
1,100
1,200
1,300
1,400
1,500
1,600
1,700
1,800
1,900
2,000
0 10 20 30 40 50 60 70 80 90 100 110 120 130 140 150element size (mm)
Ulti
mat
e L
oad,
Pul
t (kN
)
Fig. 15. Mesh size vs. Pult effect.
Table 5Cross-section temperature and time data (�C) (A24)
X (mm) 86.1 155.6 225 294.5 364 50 50 400 400Y (mm) 70.6 110.3 150 189.7 229.4 250 50 50 250
0 h 27.4 27.3 26.8 27.3 27.2 26.9 27.6 27.0 26.71 h 102.7 88.0 66.6 42.6 39.9 108.1 168.9 150.7 36.72 h 209.2 128.9 109.4 82.9 72.6 200.3 365.5 255.8 64.13 h 338.5 216.6 124.3 106.3 104.0 292.8 523.9 336.9 96.34 h 452.2 308.7 173.4 117.1 111.2 378.2 644.9 407.8 106.35 h 508.3 377.1 221.5 145.1 130.2 409.9 593.8 389.5 125.06 h 464.3 389.3 257.2 177.8 159.0 367.9 479.0 321.4 147.57 h 409.9 367.6 268.6 196.1 175.3 326.6 400.4 275.8 160.9
632 W.-C. Jau, K.-L. Huang / Cement & Concrete Composites 30 (2008) 622–638
101.9 �C after the 4 and 2 h tests, respectively. This wasonly about 50 �C difference.
An isothermal contour for the column cross-section wasplotted based on the experimental data at various times.Fig. 16 shows that heat was transferred into the concretecolumn mainly from their two heated sides for each columnas expected. However, a small amount of heat was trans-ferred from the interface between the concrete faces dueto column deformation during the test. However, this effectwas not significant, and the heated outer 1/3 portion of thecolumns from fire the surface showed an increase of tem-perature about of 100 �C in the shaded area (Fig. 16). Thisarea is only 3.4% of the total area and the reduction of con-crete material strength in this area is only 10% from Eq.(2). Therefore, the effect of this small amount of heat fromthe interface is not important. Meanwhile, in real situa-tions, the fire will reach the rear faces of an exterior columndue to the aerodynamic characteristics of fire, which wasclose to the test condition.
The temperature distribution of the concrete, within thecross-section can be done through direct measurement. Thetemperatures can also be calculated by a finite differencemethod. The heat balance equation was as per Eq. (15)
oTot¼ k
cqo2Tox2þ o2T
oy2
� �ð15Þ
where T is the temperature (�C); t the time (min); k thethermal conductivity (W m�1 �C�1); q the density(kg m�3); and c is the specific (J kg�1 �C�1).
The cross-section of the column is idealized as a networkof elements by solving the heat balance equation. Detaileddescriptions are provided in Refs. [15–17] and are not givenhere. This study solved the heat balance equation and com-pared the calculated results with the experimental data, asshown in Table 7. It shows that the numerical method is agood approach and is justified. This study used experimen-tal data for strength analysis. However, the numericalapproach can be further used for different dimensions orfor RC structural elements without prior experimentalresults.
Under the axial compressive stress ratio ð0:1f 0cÞ, the tem-perature distribution across the section is not affected bythe concrete cover thickness or steel ratio. The effect ofthe axial stress ratio on the temperature distribution acrossthe section is not a subject in this research. This effect is notconsidered in most literatures either [9,10,13–17].
0 50 100 150 200 250 300 350 400 450 mm
0
50
100
150
200
250
300 mm
X
Y
influence zone of unexpected fire
0 50 100 150 200 250 300 350 400 450 mm
0
50
100
150
200
250
300 mm
X
Y
2 hours
4 hours
Fig. 16. Temperature contour at 2 and 4 h.
Table 6Temperature of center point vs. time (�C)
Specimen 1 h 2 h 3 h 4 h
A12 66.0 107.8A22 50.8 103.8B12 53.9 95.1A14 51.5 95.1 113.5 132.7A24 66.6 109.4 124.3 173.4B24 – 100.0 108.5 149.6
Average temperature 57.8 101.9 115.4 151.9
W.-C. Jau, K.-L. Huang / Cement & Concrete Composites 30 (2008) 622–638 633
5.2. Surface observation after fire tests
Each specimen was carefully observed after removalfrom the furnace (Fig. 17). It was found that: (a) the colorwas in general yellowish, and the longer the fire duration,
the darker the color, (b) numerous fine-networked crackswere observed, (c) at the end of fire test, longitudinalcracks were found at the depth of the concrete cover overabout 300–750 mm of the length of the exposed region.Please note that the length of the exposed region is1500 mm. A lager longitudinal cracks occurred on thesurface of column B24 (cover 70 mm and 4 h fire dura-tion) but all within the depth of concrete cover. The oth-ers columns also showed longitudinal cracks, but crackwidths were relative smaller than those of B24, and (d)only very few ‘‘spot’’ spalls of 2 mm in depth wereobserved on the exposed surfaces; the area of the spallis 3% of the expose area and the spots were not connectedto longitudinal cracks (also see Fig. 17). The study in Sec-tion 3.1 wants to stress the longitudinal cracks but not thespalls. In fact, longitudinal cracks at the depth of cover
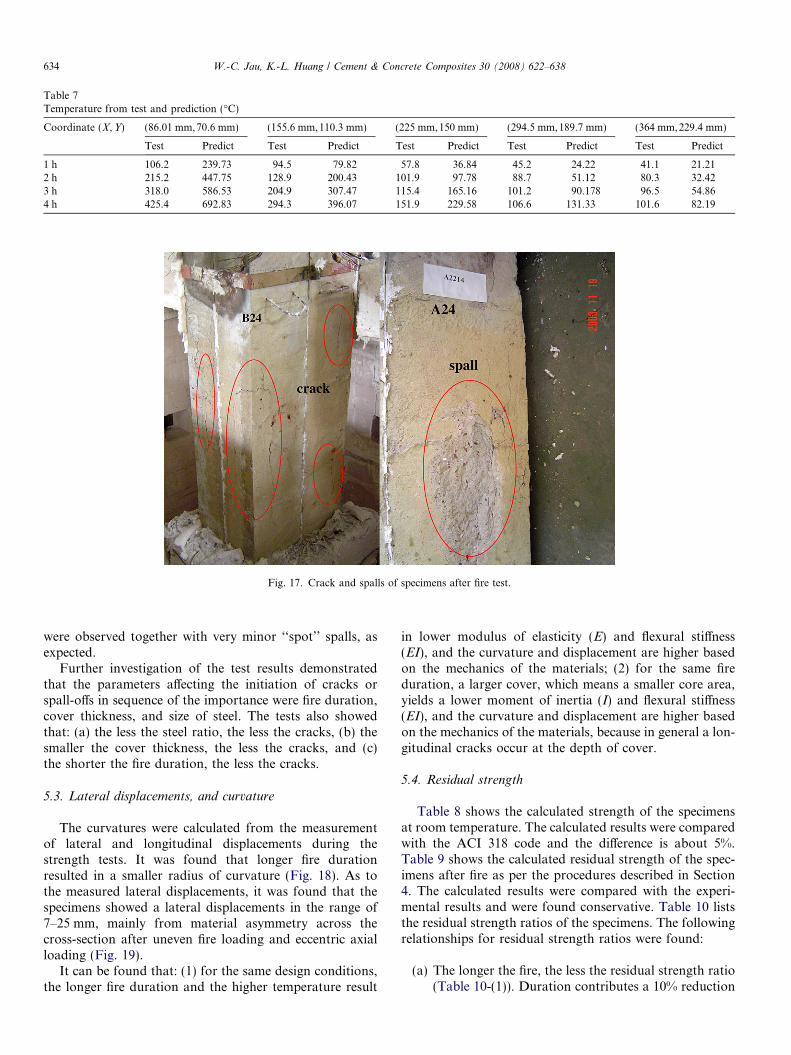
Fig. 17. Crack and spalls of specimens after fire test.
Table 7Temperature from test and prediction (�C)
Coordinate (X,Y) (86.01 mm,70.6 mm) (155.6 mm,110.3 mm) (225 mm,150 mm) (294.5 mm,189.7 mm) (364 mm,229.4 mm)
Test Predict Test Predict Test Predict Test Predict Test Predict
1 h 106.2 239.73 94.5 79.82 57.8 36.84 45.2 24.22 41.1 21.212 h 215.2 447.75 128.9 200.43 101.9 97.78 88.7 51.12 80.3 32.423 h 318.0 586.53 204.9 307.47 115.4 165.16 101.2 90.178 96.5 54.864 h 425.4 692.83 294.3 396.07 151.9 229.58 106.6 131.33 101.6 82.19
634 W.-C. Jau, K.-L. Huang / Cement & Concrete Composites 30 (2008) 622–638
were observed together with very minor ‘‘spot’’ spalls, asexpected.
Further investigation of the test results demonstratedthat the parameters affecting the initiation of cracks orspall-offs in sequence of the importance were fire duration,cover thickness, and size of steel. The tests also showedthat: (a) the less the steel ratio, the less the cracks, (b) thesmaller the cover thickness, the less the cracks, and (c)the shorter the fire duration, the less the cracks.
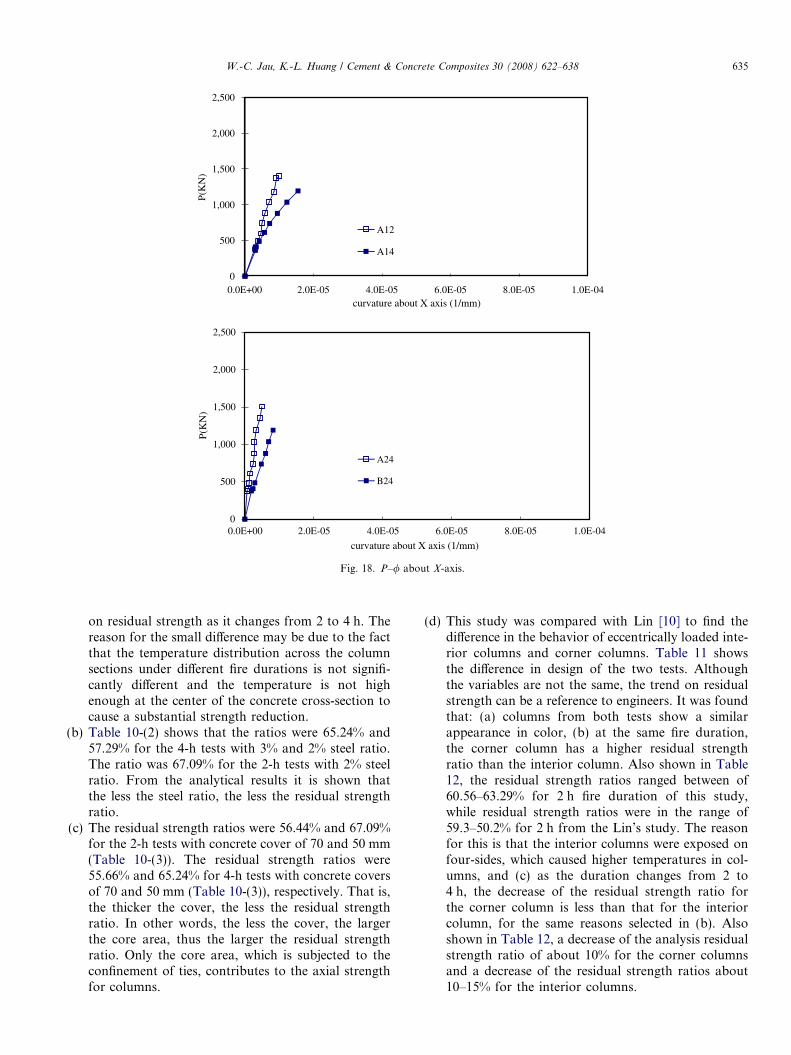
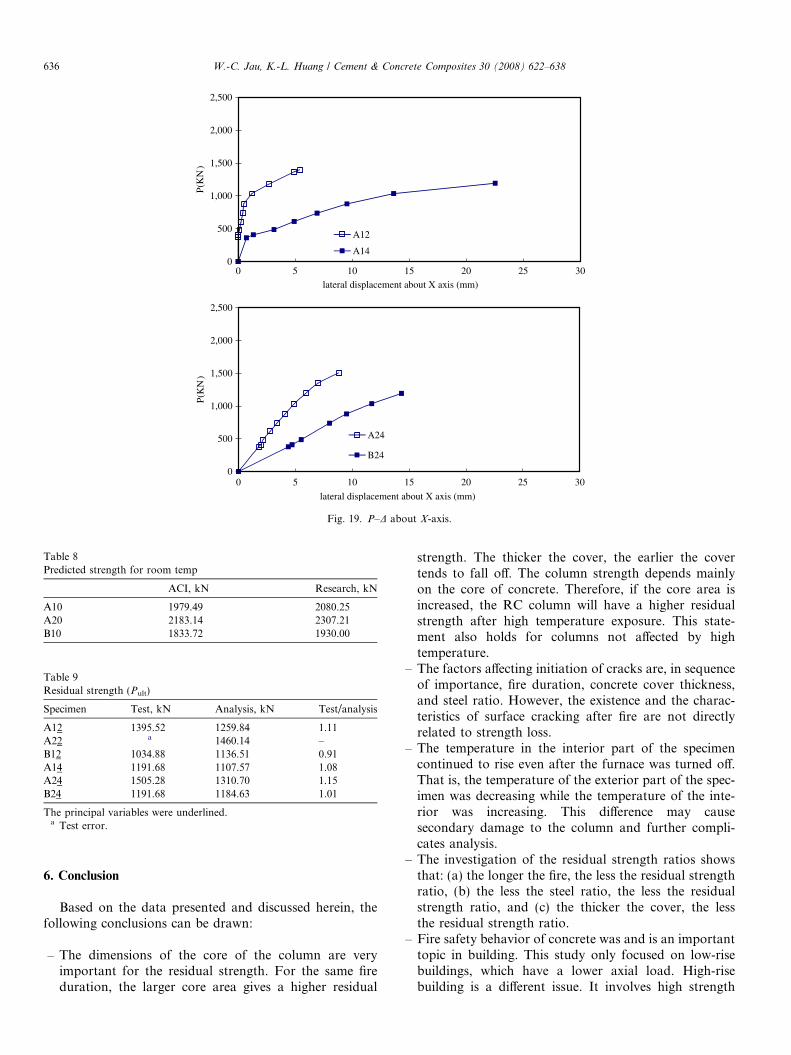
5.3. Lateral displacements, and curvature
The curvatures were calculated from the measurementof lateral and longitudinal displacements during thestrength tests. It was found that longer fire durationresulted in a smaller radius of curvature (Fig. 18). As tothe measured lateral displacements, it was found that thespecimens showed a lateral displacements in the range of7–25 mm, mainly from material asymmetry across thecross-section after uneven fire loading and eccentric axialloading (Fig. 19).
It can be found that: (1) for the same design conditions,the longer fire duration and the higher temperature result
in lower modulus of elasticity (E) and flexural stiffness(EI), and the curvature and displacement are higher basedon the mechanics of the materials; (2) for the same fireduration, a larger cover, which means a smaller core area,yields a lower moment of inertia (I) and flexural stiffness(EI), and the curvature and displacement are higher basedon the mechanics of the materials, because in general a lon-gitudinal cracks occur at the depth of cover.
5.4. Residual strength
Table 8 shows the calculated strength of the specimensat room temperature. The calculated results were comparedwith the ACI 318 code and the difference is about 5%.Table 9 shows the calculated residual strength of the spec-imens after fire as per the procedures described in Section4. The calculated results were compared with the experi-mental results and were found conservative. Table 10 liststhe residual strength ratios of the specimens. The followingrelationships for residual strength ratios were found:
(a) The longer the fire, the less the residual strength ratio(Table 10-(1)). Duration contributes a 10% reduction
0
500
1,000
1,500
2,000
2,500
0.0E+00 2.0E-05 4.0E-05 6.0E-05 8.0E-05 1.0E-04
P(K
N)
A12
A14
0
500
1,000
1,500
2,000
2,500
0.0E+00 2.0E-05 4.0E-05 6.0E-05 8.0E-05 1.0E-04
curvature about X axis (1/mm)
curvature about X axis (1/mm)
P(K
N)
A24
B24
Fig. 18. P–/ about X-axis.
W.-C. Jau, K.-L. Huang / Cement & Concrete Composites 30 (2008) 622–638 635
on residual strength as it changes from 2 to 4 h. Thereason for the small difference may be due to the factthat the temperature distribution across the columnsections under different fire durations is not signifi-cantly different and the temperature is not highenough at the center of the concrete cross-section tocause a substantial strength reduction.
(b) Table 10-(2) shows that the ratios were 65.24% and57.29% for the 4-h tests with 3% and 2% steel ratio.The ratio was 67.09% for the 2-h tests with 2% steelratio. From the analytical results it is shown thatthe less the steel ratio, the less the residual strengthratio.
(c) The residual strength ratios were 56.44% and 67.09%for the 2-h tests with concrete cover of 70 and 50 mm(Table 10-(3)). The residual strength ratios were55.66% and 65.24% for 4-h tests with concrete coversof 70 and 50 mm (Table 10-(3)), respectively. That is,the thicker the cover, the less the residual strengthratio. In other words, the less the cover, the largerthe core area, thus the larger the residual strengthratio. Only the core area, which is subjected to theconfinement of ties, contributes to the axial strengthfor columns.
(d) This study was compared with Lin [10] to find thedifference in the behavior of eccentrically loaded inte-rior columns and corner columns. Table 11 showsthe difference in design of the two tests. Althoughthe variables are not the same, the trend on residualstrength can be a reference to engineers. It was foundthat: (a) columns from both tests show a similarappearance in color, (b) at the same fire duration,the corner column has a higher residual strengthratio than the interior column. Also shown in Table12, the residual strength ratios ranged between of60.56–63.29% for 2 h fire duration of this study,while residual strength ratios were in the range of59.3–50.2% for 2 h from the Lin’s study. The reasonfor this is that the interior columns were exposed onfour-sides, which caused higher temperatures in col-umns, and (c) as the duration changes from 2 to4 h, the decrease of the residual strength ratio forthe corner column is less than that for the interiorcolumn, for the same reasons selected in (b). Alsoshown in Table 12, a decrease of the analysis residualstrength ratio of about 10% for the corner columnsand a decrease of the residual strength ratios about10–15% for the interior columns.
0
500
1,000
1,500
2,000
2,500
0 5 10 15 20 25 30lateral displacement about X axis (mm)
P(K
N)
A12
A14
0
500
1,000
1,500
2,000
2,500
0 5 10 15 20 25 30
lateral displacement about X axis (mm)
P(K
N)
A24
B24
Fig. 19. P–D about X-axis.
Table 9Residual strength (Pult)
Specimen Test, kN Analysis, kN Test/analysis
A12 1395.52 1259.84 1.11A22 a 1460.14 –B12 1034.88 1136.51 0.91A14 1191.68 1107.57 1.08A24 1505.28 1310.70 1.15B24 1191.68 1184.63 1.01
The principal variables were underlined.a Test error.
Table 8Predicted strength for room temp
ACI, kN Research, kN
A10 1979.49 2080.25A20 2183.14 2307.21B10 1833.72 1930.00
636 W.-C. Jau, K.-L. Huang / Cement & Concrete Composites 30 (2008) 622–638
6. Conclusion
Based on the data presented and discussed herein, thefollowing conclusions can be drawn:
– The dimensions of the core of the column are veryimportant for the residual strength. For the same fireduration, the larger core area gives a higher residual
strength. The thicker the cover, the earlier the covertends to fall off. The column strength depends mainlyon the core of concrete. Therefore, if the core area isincreased, the RC column will have a higher residualstrength after high temperature exposure. This state-ment also holds for columns not affected by hightemperature.
– The factors affecting initiation of cracks are, in sequenceof importance, fire duration, concrete cover thickness,and steel ratio. However, the existence and the charac-teristics of surface cracking after fire are not directlyrelated to strength loss.
– The temperature in the interior part of the specimencontinued to rise even after the furnace was turned off.That is, the temperature of the exterior part of the spec-imen was decreasing while the temperature of the inte-rior was increasing. This difference may causesecondary damage to the column and further compli-cates analysis.
– The investigation of the residual strength ratios showsthat: (a) the longer the fire, the less the residual strengthratio, (b) the less the steel ratio, the less the residualstrength ratio, and (c) the thicker the cover, the lessthe residual strength ratio.
– Fire safety behavior of concrete was and is an importanttopic in building. This study only focused on low-risebuildings, which have a lower axial load. High-risebuilding is a different issue. It involves high strength
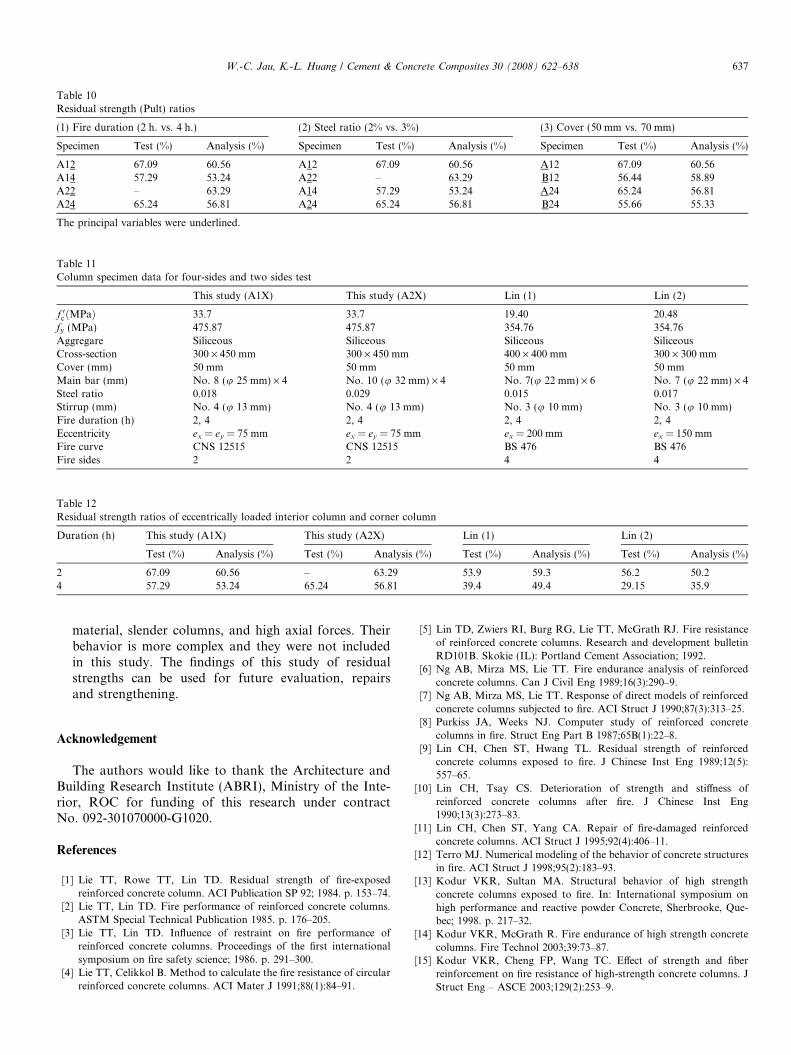
Table 11Column specimen data for four-sides and two sides test
This study (A1X) This study (A2X) Lin (1) Lin (2)
f 0cðMPaÞ 33.7 33.7 19.40 20.48fy (MPa) 475.87 475.87 354.76 354.76Aggregare Siliceous Siliceous Siliceous SiliceousCross-section 300 · 450 mm 300 · 450 mm 400 · 400 mm 300 · 300 mmCover (mm) 50 mm 50 mm 50 mm 50 mmMain bar (mm) No. 8 (u 25 mm) · 4 No. 10 (u 32 mm) · 4 No. 7(u 22 mm) · 6 No. 7 (u 22 mm) · 4Steel ratio 0.018 0.029 0.015 0.017Stirrup (mm) No. 4 (u 13 mm) No. 4 (u 13 mm) No. 3 (u 10 mm) No. 3 (u 10 mm)Fire duration (h) 2, 4 2, 4 2, 4 2, 4Eccentricity ex = ey = 75 mm ex = ey = 75 mm ex = 200 mm ex = 150 mmFire curve CNS 12515 CNS 12515 BS 476 BS 476Fire sides 2 2 4 4
Table 10Residual strength (Pult) ratios
(1) Fire duration (2 h. vs. 4 h.) (2) Steel ratio (2% vs. 3%) (3) Cover (50 mm vs. 70 mm)
Specimen Test (%) Analysis (%) Specimen Test (%) Analysis (%) Specimen Test (%) Analysis (%)
A12 67.09 60.56 A12 67.09 60.56 A12 67.09 60.56A14 57.29 53.24 A22 – 63.29 B12 56.44 58.89A22 – 63.29 A14 57.29 53.24 A24 65.24 56.81A24 65.24 56.81 A24 65.24 56.81 B24 55.66 55.33
The principal variables were underlined.
Table 12Residual strength ratios of eccentrically loaded interior column and corner column
Duration (h) This study (A1X) This study (A2X) Lin (1) Lin (2)
Test (%) Analysis (%) Test (%) Analysis (%) Test (%) Analysis (%) Test (%) Analysis (%)
2 67.09 60.56 – 63.29 53.9 59.3 56.2 50.24 57.29 53.24 65.24 56.81 39.4 49.4 29.15 35.9
W.-C. Jau, K.-L. Huang / Cement & Concrete Composites 30 (2008) 622–638 637
material, slender columns, and high axial forces. Theirbehavior is more complex and they were not includedin this study. The findings of this study of residualstrengths can be used for future evaluation, repairsand strengthening.
Acknowledgement
The authors would like to thank the Architecture andBuilding Research Institute (ABRI), Ministry of the Inte-rior, ROC for funding of this research under contractNo. 092-301070000-G1020.
References
[1] Lie TT, Rowe TT, Lin TD. Residual strength of fire-exposedreinforced concrete column. ACI Publication SP 92; 1984. p. 153–74.
[2] Lie TT, Lin TD. Fire performance of reinforced concrete columns.ASTM Special Technical Publication 1985. p. 176–205.
[3] Lie TT, Lin TD. Influence of restraint on fire performance ofreinforced concrete columns. Proceedings of the first internationalsymposium on fire safety science; 1986. p. 291–300.
[4] Lie TT, Celikkol B. Method to calculate the fire resistance of circularreinforced concrete columns. ACI Mater J 1991;88(1):84–91.
[5] Lin TD, Zwiers RI, Burg RG, Lie TT, McGrath RJ. Fire resistanceof reinforced concrete columns. Research and development bulletinRD101B. Skokie (IL): Portland Cement Association; 1992.
[6] Ng AB, Mirza MS, Lie TT. Fire endurance analysis of reinforcedconcrete columns. Can J Civil Eng 1989;16(3):290–9.
[7] Ng AB, Mirza MS, Lie TT. Response of direct models of reinforcedconcrete columns subjected to fire. ACI Struct J 1990;87(3):313–25.
[8] Purkiss JA, Weeks NJ. Computer study of reinforced concretecolumns in fire. Struct Eng Part B 1987;65B(1):22–8.
[9] Lin CH, Chen ST, Hwang TL. Residual strength of reinforcedconcrete columns exposed to fire. J Chinese Inst Eng 1989;12(5):557–65.
[10] Lin CH, Tsay CS. Deterioration of strength and stiffness ofreinforced concrete columns after fire. J Chinese Inst Eng1990;13(3):273–83.
[11] Lin CH, Chen ST, Yang CA. Repair of fire-damaged reinforcedconcrete columns. ACI Struct J 1995;92(4):406–11.
[12] Terro MJ. Numerical modeling of the behavior of concrete structuresin fire. ACI Struct J 1998;95(2):183–93.
[13] Kodur VKR, Sultan MA. Structural behavior of high strengthconcrete columns exposed to fire. In: International symposium onhigh performance and reactive powder Concrete, Sherbrooke, Que-bec; 1998. p. 217–32.
[14] Kodur VKR, McGrath R. Fire endurance of high strength concretecolumns. Fire Technol 2003;39:73–87.
[15] Kodur VKR, Cheng FP, Wang TC. Effect of strength and fiberreinforcement on fire resistance of high-strength concrete columns. JStruct Eng – ASCE 2003;129(2):253–9.
638 W.-C. Jau, K.-L. Huang / Cement & Concrete Composites 30 (2008) 622–638
[16] Kodur VKR, Cheng FP, Wang TC. Predicting the fire resistancebehavior of high strength concrete columns. Cement Concrete Comp2004;26(2):141–53.
[17] Kodur VKR. Guidelines for fire resistance design of high-strengthconcrete columns. J Fire Protect Eng 2005;15(2):93–106.
[18] Kodur VKR, Bisby LA, Green MF, Chowdhury E. Fire endurance ofinsulated FRP-strengthened square concrete columns. In: Proceed-ings of the 7th international symposium on fiber-reinforced (FRP)polymer reinforcement for concrete structures, SP-230-71; 2005. p.1253–68.
[19] Kodur VKR, Bisby LA, Green MF. Experimental evaluation of thefire behavior of insulated fiber-reinforced-polymer-strengthened rein-forced concrete columns. Fire Safety J 2006;41(7):547–57.
[20] Dotreppe JC, Franssen JM, Vanderzeypen Y. Calculation method fordesign of reinforced concrete columns under fire conditions. ACIStruct J 1999;96(1):9–18.
[21] Franssen JM, Dotreppe JC. Fire tests and calculation methods forcircular concrete columns. Fire Technol 2003;39:89–97.
[22] Zha XX, Li LY, Purkiss JA. Finite element analysis of the fireresistance of reinforced concrete columns. In: Proceedings of the eightinternational conference on civil and structural engineering comput-ing; 2001. p. 161–2.
[23] Tan KH, Yao Y. Fire resistance of four-face heated reinforcedconcrete columns. J Struct Eng – ASCE 2003;129(9):1220–9.
[24] Tan KH, Tang CY. Interaction formula for reinforced concretecolumns in fire conditions. ACI Struct J 2004;101(1):19–28.
[25] Tan KH, Yao Y. Fire resistance of reinforced concrete columnssubjected to 1-, 2-, and 3-face heating. J Struct Eng – ASCE2004;130(11):1820–8.
[26] Faris A, Ali N, Gordon S, Abid AT. Outcomes of a major researchon fire resistance of concrete columns. Fire Safety 2004;39(6):433–445.
[27] Chung JH. Consolazio GR. Finite element stress analysis of areinforced high-strength concrete column in severe fires. In: Proceed-ings of the 2004 structures congress – building on the past: securingthe future; 2004. p. 1183–90.
[28] Persson B. Fire resistance of self-compacting concrete, SCC. MaterStruct 2004;37:575–84.
[29] Bratina S, Cas B, Saje M. Numerical modeling of behavior ofreinforced concrete columns in fire and comparison with Euro code 2.Int J Solids Struct 2005;42(21–22):5715–33.
[30] Benmarce A, Guenfoud M. Experimental behavior of high-strengthconcrete columns in fire. Therm Sci 2007;l1(2):37–52.
[31] Benmarce A, Guenfoud M. Behavior of axially restrained highstrength concrete columns under fire. Construct Build Mater 2005;57(5):283–7.
[32] ACI Committee 363. State of the art report on high strength concrete.American Concrete Institute, Detroit; 1997.
[33] Neville AM. Properties of concrete, London; 1996.[34] The Self-Compacting Concrete European Project Group. The Euro-
pean guidelines for self compacting concrete; 2005.[35] Yunus AC. Heat transfer: a practical approach. McGraw-Hill; 1998.[36] Hsu JH (advisor: Lin CS.). Numerical modeling of mechanical
properties for reinforced concrete beam exposed to fire. PH.D. thesis,Institute of Mechanical Engineering, Yuan-Ze University, Chungli,Taiwan; 2005.
[37] CNS 12514. Method of fire resistance test for structural parts ofbuilding. Chinese National Standard 2005.
[38] ISO 834. Fire resistance tests – elements of building construction.International Organization for Standardization 1999.
[39] Chang CH (advisor: Jau WC.). Study of fired concrete strengthenedwith confinement. MS thesis, National Chiao Tung University,Hsinchu, Taiwan; 2001.
[40] Schneider U, Haksever A. Bestimmung der aguivalenten brandauervon statisch bestimmt gelagerten stahlbetonbalken bei NaturlichenBranden. Bericht des Technischen Iniversit at Braunschweig; 1976.
[41] Malhotra HL. Design of fire resisting structures. New York: Chap-man & Hall; 1982.
[42] ACI Committee 318. Building code requirements for reinforcedconcrete (ACI 318-02). American Concrete Institute, Detroit; 2002.
[43] Bresler B. Design criteria for reinforced columns with Biaxialbending. ACI J 1960;57(110):481–90.