ECTC Section 1 cover - UAB
32
UAB School of Engineering – Mechanical Engineering – Early Career Technical Journal, Volume 17 Page 1 SECTION 1 Thermal Sciences
Transcript of ECTC Section 1 cover - UAB

UABSchoolofEngineering–MechanicalEngineering–EarlyCareerTechnicalJournal,Volume17 Page1
SECTION 1
Thermal Sciences

UABSchoolofEngineering–MechanicalEngineering–EarlyCareerTechnicalJournal,Volume17 Page2

UABSchoolofEngineering-MechanicalEngineering-JournaloftheECTC,Volume17 Page3
Journal of UAB ECTC Volume 17, 2018
Department of Mechanical Engineering The University of Alabama, Birmingham
Birmingham, Alabama USA
PERFORMANCE OF A GRAVITY INDEPENDENT HEAT PIPE
O.Y.W. Abotsi, K. Kaddoura North Carolina A&T State University
Greensboro, NC, USA
J.P. Kizito North Carolina A&T State University
Greensboro, NC, USA
ABSTRACT Heat pipes are two phase cooling devices which provide one
dimensional heat flow. Passive transport of working fluid continually in heat pipes is enhanced by wicks, which exploit wicking through capillary action.
In the present study, an empty pipe, a thermosiphon, an un-sintered wick and a sintered wick heat pipe, were considered for comparison. The thermal behavior, total thermal resistance and heat transfer coefficient of these pipes were investigated at 5W, 10W, 15W, 25W, 35W and 50W. The thermosiphon performed better than the empty pipe due to the introduction of working fluid exchanging heat by phase change. The presence of a wick structure proved to further increase the thermal performance of the heat pipe. Sintering reduced pore spaces and increased the wicking ability and hence the thermal performance. Wicks were manufactured from 140 µm average diameter copper powder. Results show that temperatures at the evaporator section for the un-sintered and sintered wick heat pipe were identical.
The performance of the un-sintered and the sintered wick heat pipe were also investigated in against-gravity conditions. The results portrayed that their evaporator temperatures were alike. However, the un-sintered wick heat pipe performed better than the sintered wick heat pipe. KEY WORDS: Heat pipe, wick, gravity, thermal resistance, thermal performance, thermosiphon, sintering
INTRODUCTION Since their development in the late twentieth century, heat
pipes have been employed for cooling applications in electric motors, blast furnaces, space systems and the electronic industry [1-20]. Heat pipes are capable of transferring heat over reasonable distance with small temperature drop [4-8]. In addition, heat pipes require no power source for their operation.
Heat pipes have three sections, viz.; evaporator, condenser and the adiabatic section (the region between the evaporator and the condenser section). Heat pipes are normally filled with liquid containing its own vapor. When heat is applied to the evaporator, the liquid changes to vapor and is forced to move towards the relatively cooler condenser section. Here, the vaporized fluid
relinquishes its latent heat of vaporization and changes back to liquid. Wicks are the inner layer of the tube. Condensate is re-directed towards the evaporator section by capillary action, improved by a wick structure.
Fig. 1. Schematic of a general heat pipe showing its
sections and component [1]
Wicks and working fluids are the two most important components of a heat pipe [2] and [3]. Different types of working fluids such as water, acetone, methanol, ammonia or sodium can be used in heat pipes depending on the desired temperature range of operation [4]. Generally, the wicks for phase-change cooling devices include metal wire meshes, micro-grooves, sintered metal powder, metal foams, sintered metal fibers and composite wicks [5]. Wicks control capillarity pressure, permeability and the working fluid’s flow resistance.
Porous media allow fluid flow through their pores and have vast applications in thermal sciences, soil sciences, aerospace, and other engineering fields. A fluid-filled porous structure provides solid-liquid-vapor contact lines in the interstitial volumes between the solid particles where large capillary forces develop from interfacial tensions [6]. These forces pull the liquid through porous media by capillarity action. Porous materials, made from sintered metallic powder compacts, are used as wicks in heat pipes for continuous circulation of working fluid.
To provide effective water supply, the porous structure must contain a large number of pores so that enough water is supplied continuously from the condenser to the evaporator section. In addition, the pore size must be small enough so that the capillary pressure is high enough to draw the water through the porous wick, even against gravity [7-9]. Lin et al., examined the effects
UABSchoolofEngineering-MechanicalEngineering-JournaloftheECTC,Volume17 Page4
of powder shape on heat dissipation of a heat pipe using gas atomized spherical powder, water atomized and electrolytic copper powder to create a wick structure [7]. From the results, the gas atomized spherical powder gave the utmost capillarity speed and permeability, hence highest heat dissipation, even though its porosity was the lowest. It was concluded that capillarity speed affects heat dissipation more than permeability. Jo, et al., demonstrated enhanced fluid transport through a multilayer, porous wick comprising a micro-porous structure [4]. Wicking is the process by which heat is dissipated because of increased surface area through morphology modification [10].
Homogeneous wicks are constructed with one type of material or machining technique [11]. Sintered wicks are made by stuffing particles between the inner heat pipe walls [4]. Even though they are difficult to make, their capillary pressure developed (capillary limit) is easily predicted. Sintered wicks are designed to have small capillary radius if a large capillary difference is required.
The production of metallic parts by compacting metal powders in suitable dies and sintering them at elevated temperatures to obtain the desired density and strength is known as powder metallurgy [12]. Compaction process and escape of gases during sintering minimize the porosity in powder metallurgy. Besides having the necessary pore structure and size characteristics for fluid and heat transport, the wicks produced had to be mechanically rigid to be integrated into the heat pipe [11-15].
This present study investigates the thermal properties of an empty pipe, a thermosiphon, a sintered and an unsintered wick used in a heat pipe at six different heat loads. The effect of gravity on these pipes is also investigated. Copper powder, 140 µm average diameter, from Atlantic Equipment Engineers was used to construct the wick structure. In addition, copper 101 tubes, 200 mm long with 19.1 mm and 17.44 mm internal and external diameter respectively were used to make heat pipes.
EXPERIMENTAL SETUP Li et al. compared the performance of three different ranges
of copper powder; 80−110, 110−140 and 140− 170 µm. Results indicated that wicks produced from sintering 140−170 µm cell size range copper powders had better binding strength, improved uniformity, greater capillary pumping force and a reduced amount of back flow resistance [7], [16-30].
Copper powder of 140 µm average diameter was selected to make wicks. 87% of the powder was mixed with 13% of water-based binder to form a paste-like feedstock. Binder was made from polyvinyl alcohol supplied by the Carolina’s. Binder and copper powder mixing ratios were imperative in obtaining a smooth and uniform feedstock. Inadequate binder in the mixture would cause high viscosity and formation of voids in the mixture, while excess binder in the mixture would cause contraction of the sample during de-binding [12]. The wick was made in a stainless-steel mold by cold pressing. Two wick structures of 8.382 mm thickness were manufactured. Reports of sintering processes are well documented in the literature [13], [15] and [31-35].
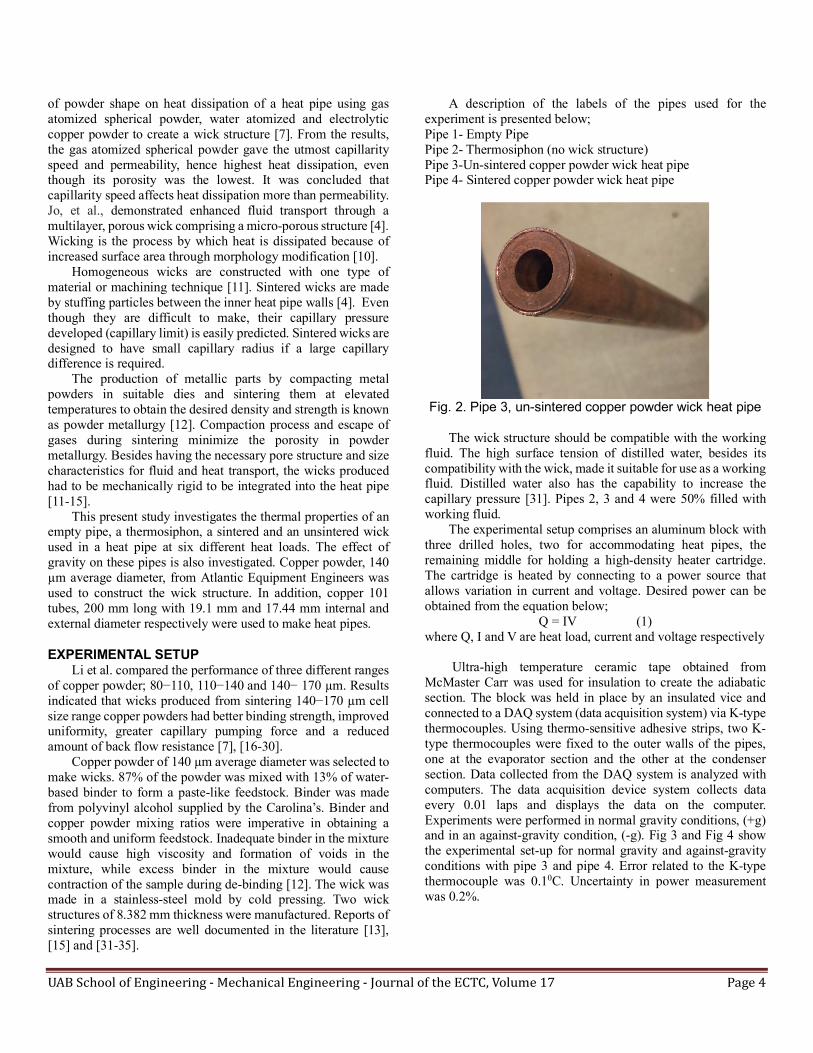
A description of the labels of the pipes used for the experiment is presented below; Pipe 1- Empty Pipe Pipe 2- Thermosiphon (no wick structure) Pipe 3-Un-sintered copper powder wick heat pipe Pipe 4- Sintered copper powder wick heat pipe
Fig. 2. Pipe 3, un-sintered copper powder wick heat pipe
The wick structure should be compatible with the working
fluid. The high surface tension of distilled water, besides its compatibility with the wick, made it suitable for use as a working fluid. Distilled water also has the capability to increase the capillary pressure [31]. Pipes 2, 3 and 4 were 50% filled with working fluid.
The experimental setup comprises an aluminum block with three drilled holes, two for accommodating heat pipes, the remaining middle for holding a high-density heater cartridge. The cartridge is heated by connecting to a power source that allows variation in current and voltage. Desired power can be obtained from the equation below;
Q = IV (1) where Q, I and V are heat load, current and voltage respectively
Ultra-high temperature ceramic tape obtained from McMaster Carr was used for insulation to create the adiabatic section. The block was held in place by an insulated vice and connected to a DAQ system (data acquisition system) via K-type thermocouples. Using thermo-sensitive adhesive strips, two K-type thermocouples were fixed to the outer walls of the pipes, one at the evaporator section and the other at the condenser section. Data collected from the DAQ system is analyzed with computers. The data acquisition device system collects data every 0.01 laps and displays the data on the computer. Experiments were performed in normal gravity conditions, (+g) and in an against-gravity condition, (-g). Fig 3 and Fig 4 show the experimental set-up for normal gravity and against-gravity conditions with pipe 3 and pipe 4. Error related to the K-type thermocouple was 0.10C. Uncertainty in power measurement was 0.2%.

UABSchoolofEngineering-MechanicalEngineering-JournaloftheECTC,Volume17 Page5
Fig. 3. Experimental set-up for normal gravity condition (+g)
Fig. 4. Experimental set-up for against gravity (-g) condition
RESULTS AND DISCUSSION The performance of porous wicks is determined by pore
sizes and porosity: with finer pores, the wick can provide higher capillary force; with higher porosity, the permeability of the wick is larger, which means less resistance for fluid flowing in the wick [34] and [36-40]. Fig. 5(a) and 5(b) show SEM images of un-sintered copper at 400 and 1200 magnification respectively. Also, Fig. 6 shows the SEM image of the sintered copper wick at 1200 magnification. It can be seen that powder particles bond together after the sintering process. The images also show reduced pore spaces after sintering.
Fig. 5 (a). SEM image of un-sintered copper wick;
magnification 400
Fig. 5 (b). SEM image of un-sintered copper wick,
magnification 1200
Fig. 6. SEM image of sintered copper wick, magnification
1200
Porosity is the ratio of the void’s volume to the entire wick’s volume. The porosity of a fabricated sintered wick can be calculated by the mass-volume method [38].
ε = #1 − &'()
* ∗ 100% (2),
where ε , m and V are the porosity, mass and volume of the wick structure, and ρ/ is the density of the copper powder

UABSchoolofEngineering-MechanicalEngineering-JournaloftheECTC,Volume17 Page6
sintered. The porosity of the sample is determined to be 40%. The mass was measured with a digital balance, and the uncertainty in the measurement was 1%.
Permeability is a measure of the wick’s resistance to axial liquid flow [4]. For sintered wicks, the permeability is determined by the Carman-Kozeny equation [41]
K = 23∗43
567∗(592)3 (3)
Here, d is the effective diameter of the copper powder.
The capillary pumping force of the wick is calculated as [42]
∆P= =>?@∗ cosθ (4)
where ∆P= is the capillary pumping force of the porous wick structure, σ is the surface tension of the liquid, r is the radius of curvature, and θ is the contact angle between the liquid and the surface. Capillary forces increase as pore sizes decrease .[10]
NORMAL GRAVITY CONDITION (+G) First and foremost, the general performance of all the pipes
used is studied. Experiments are performed with 5W, 10W, 15W, 25W, 35W and 50W heat input. Each experiment is performed twice for repeatability. The thermocouples acquire temperature readings every 100 seconds until steady state is achieved.
Fig. 7, denotes the temperature distribution across the un-sintered wick heat pipe at 5W power input. The applied heat to the evaporator section causes vaporization of the working fluid. Phase-change occurs at the condenser section. The capillary pressure developed in the wick continuously circulates the working fluid in the heat pipe.
Fig. 7. Behavior of un-sintered wick heat pipe at 5W heat
load
Fig. 7 shows that temperatures at the evaporator section increase at a higher rate as compared to temperatures at the
condenser section. Both evaporator and condenser temperatures eventually reach a constant value, which signifies steady state.
The thermal characteristics of heat pipes are compared using the difference in temperature between the condenser and evaporator sections, ΔT. Heat pipes with smaller ΔT values have higher thermal performance [4] and [29], [43-45].
ΔT = Te – Tc (5)
Here; Te and Tc are the evaporator and condenser steady state temperatures respectively.
Fig. 8 shows a plot of ΔT against heat load. The empty pipe has the largest temperature difference. The empty pipe represents heat transfer by pure conduction. Phase change is introduced when a working fluid is used in the pipe. Heat pipes use conduction and convection heat transfer, hence making their thermal performance better than empty pipes. The presence of a wick structure further reduces the temperature difference, ΔT, as depicted in the un-sintered heat pipe. The sintered heat pipe had the smallest temperature difference.
Sintering is a process in which powders are compacted and heated at appropriate temperatures and in appropriate atmospheres, with the result that the powders are conglutinated [25]. Sintering reduces the porosity of the compacted powder. Small pore sizes increase the circulation of working fluid by capillary action. The sintered wick heat pipe had the smallest value of ΔT.
Fig. 8. Steady state temperature difference between
evaporator and condenser (ΔT) vs. heat load
The total thermal resistance of the pipes investigated at different heat loads is shown in Fig. 9. To understand the thermal performance of a heat pipe, the total thermal resistance is determined.
UABSchoolofEngineering-MechanicalEngineering-JournaloftheECTC,Volume17 Page7
𝑅GH =IJ9IKL
, (6) Here, Q is the applied load at the evaporator section.
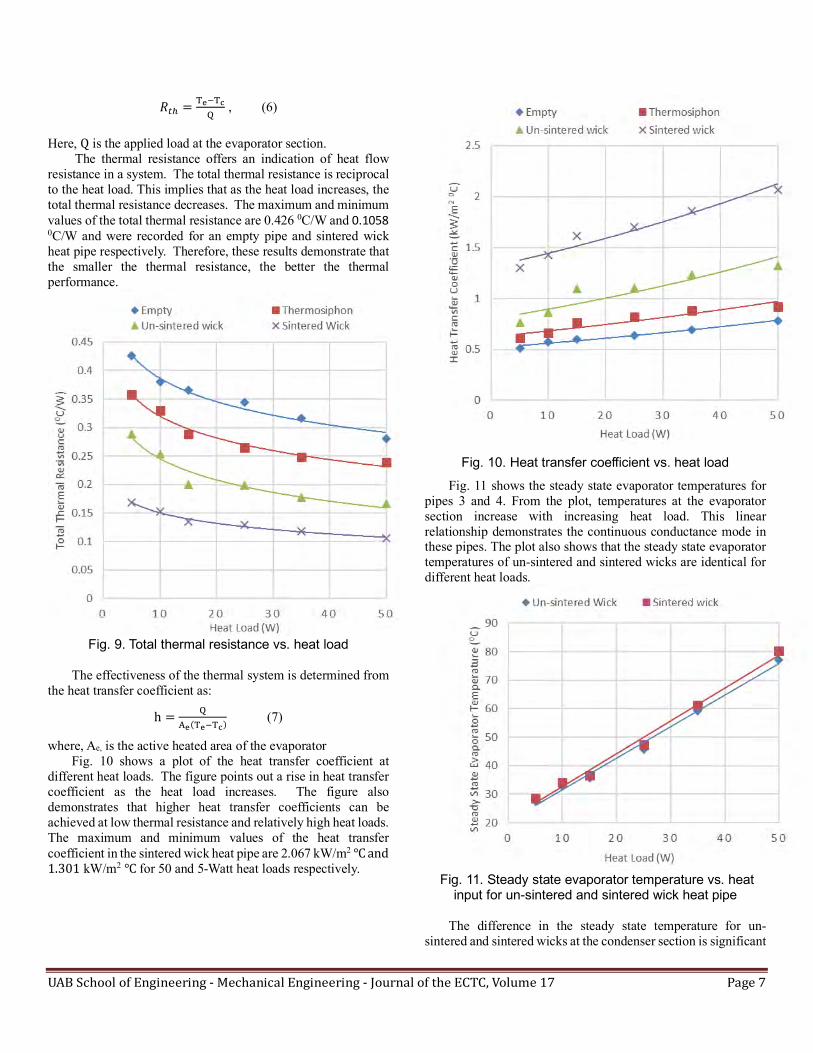
The thermal resistance offers an indication of heat flow resistance in a system. The total thermal resistance is reciprocal to the heat load. This implies that as the heat load increases, the total thermal resistance decreases. The maximum and minimum values of the total thermal resistance are 0.426 0C/W and 0.1058 0C/W and were recorded for an empty pipe and sintered wick heat pipe respectively. Therefore, these results demonstrate that the smaller the thermal resistance, the better the thermal performance.
Fig. 9. Total thermal resistance vs. heat load
The effectiveness of the thermal system is determined from
the heat transfer coefficient as:
h = LOJ(IJ9IK)
(7)
where, Ae, is the active heated area of the evaporator Fig. 10 shows a plot of the heat transfer coefficient at
different heat loads. The figure points out a rise in heat transfer coefficient as the heat load increases. The figure also demonstrates that higher heat transfer coefficients can be achieved at low thermal resistance and relatively high heat loads. The maximum and minimum values of the heat transfer coefficient in the sintered wick heat pipe are 2.067 kW/m2 ℃and1.301 kW/m2 ℃for 50 and 5-Watt heat loads respectively.
Fig. 10. Heat transfer coefficient vs. heat load
Fig. 11 shows the steady state evaporator temperatures for pipes 3 and 4. From the plot, temperatures at the evaporator section increase with increasing heat load. This linear relationship demonstrates the continuous conductance mode in these pipes. The plot also shows that the steady state evaporator temperatures of un-sintered and sintered wicks are identical for different heat loads.
Fig. 11. Steady state evaporator temperature vs. heat
input for un-sintered and sintered wick heat pipe The difference in the steady state temperature for un-
sintered and sintered wicks at the condenser section is significant
UABSchoolofEngineering-MechanicalEngineering-JournaloftheECTC,Volume17 Page8
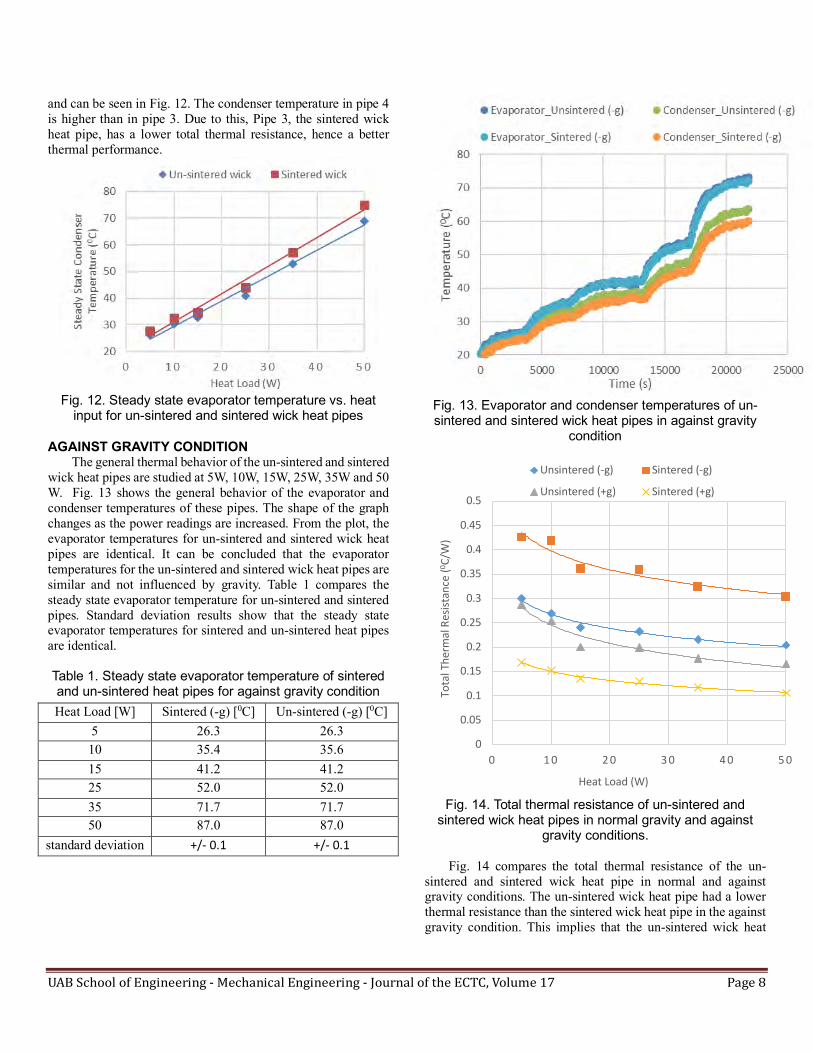
and can be seen in Fig. 12. The condenser temperature in pipe 4 is higher than in pipe 3. Due to this, Pipe 3, the sintered wick heat pipe, has a lower total thermal resistance, hence a better thermal performance.
Fig. 12. Steady state evaporator temperature vs. heat
input for un-sintered and sintered wick heat pipes
AGAINST GRAVITY CONDITION The general thermal behavior of the un-sintered and sintered
wick heat pipes are studied at 5W, 10W, 15W, 25W, 35W and 50 W. Fig. 13 shows the general behavior of the evaporator and condenser temperatures of these pipes. The shape of the graph changes as the power readings are increased. From the plot, the evaporator temperatures for un-sintered and sintered wick heat pipes are identical. It can be concluded that the evaporator temperatures for the un-sintered and sintered wick heat pipes are similar and not influenced by gravity. Table 1 compares the steady state evaporator temperature for un-sintered and sintered pipes. Standard deviation results show that the steady state evaporator temperatures for sintered and un-sintered heat pipes are identical. Table 1. Steady state evaporator temperature of sintered and un-sintered heat pipes for against gravity condition Heat Load [W] Sintered (-g) [0C] Un-sintered (-g) [0C]
5 26.3 26.3 10 35.4 35.6 15 41.2 41.2 25 52.0 52.0 35 71.7 71.7 50 87.0 87.0
standard deviation +/- 0.1 +/- 0.1
Fig. 13. Evaporator and condenser temperatures of un-sintered and sintered wick heat pipes in against gravity
condition
Fig. 14. Total thermal resistance of un-sintered and
sintered wick heat pipes in normal gravity and against gravity conditions.
Fig. 14 compares the total thermal resistance of the un-
sintered and sintered wick heat pipe in normal and against gravity conditions. The un-sintered wick heat pipe had a lower thermal resistance than the sintered wick heat pipe in the against gravity condition. This implies that the un-sintered wick heat
0
0.05
0.1
0.15
0.2
0.25
0.3
0.35
0.4
0.45
0.5
0 1 0 2 0 3 0 4 0 5 0
Tota
lThe
rmal
Resis
tanc
e(0 C
/W)
Heat Load (W)
Unsintered (-g) Sintered (-g)
Unsintered (+g) Sintered (+g)

UABSchoolofEngineering-MechanicalEngineering-JournaloftheECTC,Volume17 Page9
pipe will have much higher thermal performance than the sintered wick heat pipe.
CONCLUSION An empty pipe, a thermosiphon, a sintered and an un-
sintered heat pipe were fabricated from 200mm long copper tubing with 19.1mm diameter and 1.66mm thickness. 8.382 mm thick wicks were made from 140 µm average diameter copper powder.
In normal gravity conditions, the thermal performance of all heat pipes used was greater than that of the empty pipe. Heat pipes with wicks performed better when compared to the thermosiphon. In addition, the thermal performance of the heat pipe with wick structure increased when the wick was sintered. However, in against gravity conditions, the un-sintered wick had a higher thermal performance when compared to the sintered wick. The value of the evaporator temperature for the un-sintered and sintered heat pipes was identical either in the normal gravity condition or in the against-gravity condition.
ACKNOWLEDGEMENT We acknowledge the support from NASA NNH16ZEA001N: Electric Propulsion: Challenges and Opportunities.
REFERENCES [1] Modak, Y.A. (2016). CFD Analysis of vapor chamber with micro pillars as heat spreader for high power electronic devices. (Master’s Thesis, University of Texas at Arlington). [2] Khairnasov, S., & Naumova, A. (2015). Heat pipes application in electronics thermal control systems. Frontiers in Heat Pipes (FHP), 6(1). [3] Bodla, K. K., Murthy, J. Y., & Garimella, S. V. (2012). Direct simulation of thermal transport through sintered wick microstructures. Journal of heat transfer, 134(1), 012602. [4] Faghri, A. (2014). Heat pipes: review, opportunities and challenges. Frontiers in Heat Pipes (FHP), 5(1). [5] Jung, S. M., Preston, D. J., Jung, H. Y., Deng, Z., Wang, E. N., & Kong, J. (2016). Porous Cu nanowire aerosponges from one-step assembly and their applications in heat dissipation. Advanced Materials, 28(7), 1413-1419. [6] Iverson, B. D., Davis, T. W., Garimella, S. V., North, M. T., & Kang, S. S. (2007). Heat and mass transport in heat pipe wick structures. Journal of Thermophysics and Heat Transfer, 21(2), 392-404. [7] Lin, Y. J., & Hwang, K. S. (2009). Effects of powder shape and processing parameters on heat dissipation of heat pipes with sintered porous wicks. Materials transactions, 50(10), 2427-2434. [8] Vafai, K. (Ed.). (2015). Handbook of porous media. Crc Press. [9] Kostornov, A. G., Moroz, A. L., Shapoval, A. A., Kabov, O., Strizhak, P., & Legros, J. C. (2015). Composite structures with gradient of permeability to be used in heat pipes under microgravity. Acta Astronautica, 115, 52-57 [10] Jo, H. S., An, S., Nguyen, X. H., Kim, Y. I., Bang, B. H., James, S. C., ... & Yoon, S. S. (2018). Modifying capillary
pressure and boiling regime of micro-porous wicks textured with graphene oxide. Applied Thermal Engineering, 128, 1605-1610. [11] Faghri, A. (1995). Heat pipe science and technology. Global Digital Press. [12] H.S. Jo, S. An, H.G. Park, M.-W. Kim, S.S. Al-Deyab, S.C. James, J. Choi, S.S. Yoon (2017). Enhancement of critical heat flux and superheat through controlled wettability of cuprous-oxide fractal-like Nano textured surfaces in pool boiling, Int. J. Heat Mass Transfer 107 105–111 [13] Lin, Y. J., & Hwang, K. S. (2010). Swelling of copper powders during sintering of heat pipes in hydrogen-containing atmospheres. Materials transactions, 51(12), 2251-2258 [14] Leong, K. C., Liu, C. Y., & Lu, G. Q. (1997). Characterization of sintered copper wicks used in heat pipes. Journal of Porous Materials, 4(4), 303-308. [15] Li, Z., Wu, Y., Zhuang, B., Zhao, X., Tang, Y., Ding, X., & Chen, K. (2017). Preparation of novel copper-powder-sintered frame/paraffin form-stable phase change materials with extremely high thermal conductivity. Applied Energy, 206, 1147-1157. [16] Udell, K. S. (1985). Heat transfer in porous media considering phase change and capillarity—the heat pipe effect. International Journal of Heat and Mass Transfer, 28(2), 485-495. [17] Reay, D., McGlen, R., & Kew, P. (2013). Heat pipes: theory, design and applications. Butterworth-Heinemann. [18] Vasiliev, L. L. (2008). Micro and miniature heat pipes–Electronic component coolers. Applied Thermal Engineering, 28(4), 266-273. [19] Wang, B., Hong, Y., Hou, X., Xu, Z., Wang, P., Fang, X., & Ruan, X. (2015). Numerical configuration design and investigation of heat transfer enhancement in pipes filled with gradient porous materials. Energy Conversion and Management, 105, 206-215. [20] Ling, W., Zhou, W., Liu, R., Qiu, Q., & Ke, Y. (2017). Operational characteristics of loop heat pipes with porous copper fiber sintered sheet as wick. Applied Thermal Engineering, 122, 398-408. [21] Ji, X., Li, H., Xu, J., & Huang, Y. (2017). Integrated flat heat pipe with a porous network wick for high-heat-flux electronic devices. Experimental Thermal and Fluid Science, 85, 119-131. [22] Ingham, D. B., & Pop, I. (1998). Transport phenomena in porous media. Elsevier. [23] Nield, D. A., Bejan, A., & Nield-Bejan... (2006). Convection in porous media (Vol. 3). New York: springer. [24] Chen, X., Ye, H., Fan, X., Ren, T., & Zhang, G. (2016). A review of small heat pipes for electronics. Applied Thermal Engineering, 96, 1-17. [25] De Schampheleire, S., De Kerpel, K., Deruyter, T., De Jaeger, P., & De Paepe, M. (2015). Experimental study of small diameter fibres as wick material for capillary-driven heat pipes. Applied Thermal Engineering, 78, 258-267. [26] Yao, S., Lei, L., Deng, J. W., Lu, S., & Zhang, W. (2015). Heat transfer mechanism in porous copper foam wick heat pipes

UABSchoolofEngineering-MechanicalEngineering-JournaloftheECTC,Volume17 Page10
using nanofluids. International journal of heat and technology, 33(3), 133-138. [27] Li, X. B., Tang, Y., Li, Y., Zhou, S. Z., & Zeng, Z. X. (2010). Sintering technology for micro heat pipe with sintered wick. Journal of Central South University of Technology, 17(1), 102-109. [28] Wang, Y., Cen, J., Jiang, F., Cao, W., & Guo, J. (2016). LHP heat transfer performance: A comparison study about sintered copper powder wick and copper mesh wick. Applied Thermal Engineering, 92, 104-110. [29] Atabaki, N., & Baliga, B. R. (2007). Effective thermal conductivity of water-saturated sintered powder-metal plates. Heat and Mass Transfer, 44(1), 85-99. [30] Mantle, W. J., & Chang, W. S. (1991). Effective thermal conductivity of sintered metal fibers. Journal of thermophysics and heat transfer, 5(4), 545-549. [31] Kizito, J., & Hossain, M. M. (2015). Experimental study of thermal performance of a flat loop heat pipe. Frontiers in Heat Pipes (FHP), 6(1). [32] Dominguez Espinosa, F. A., Peters, T. B. and Brisson, J. G., (2012), "Effect of Fabrication Parameters on the Thermophysical Properties of Sintered Wicks for Heat Pipe Applications," International Journal of Heat and Mass Transfer, 55(25–26), 7471-7486. [33] Pruzan, D. A., Klingensmith, L. K., Torrance, K. E., & Avedisian, C. T. (1991). Design of high-performance sintered-wick heat pipes. International journal of heat and mass transfer, 34(6), 1417-1427. [34] Early, J. G., Lenel, F. V., & Ansell, G. S. (1963). The material transport mechanism during sintering of copper powder compacts at high temperatures (No. TID-20324). Rensselaer Polytechnic Inst., Troy, NY [35] Li, H., Liu, Z., Chen, B., Liu, W., Li, C., & Yang, J. (2012). Development of biporous wicks for flat-plate loop heat pipe. Experimental Thermal and Fluid Science, 37, 91-97. [36] Tang, H., Tang, Y., Wan, Z., Li, J., Yuan, W., Lu, L. & Tang, K. (2018). Review of applications and developments of ultra-thin micro heat pipes for electronic cooling. Applied Energy, 223, 383-400. [37] Zhong, G., Ding, X., Tang, Y., Yu, S., Chen, G., Tang, H., & Li, Z. (2018). Various orientations research on thermal performance of novel multi-branch heat pipes with different sintered wicks. Energy Conversion and Management, 166, 512-521. [38] Tang Y, Tang H, Li J, Zhang S, Zhuang B, Sun Y. (2017) Experimental investigation of capillary force in a novel sintered copper mesh wick for ultra-thin heat pipes. Appl Therm Eng; 115: 1020–30. [39] Zhou, W., Xie, P., Li, Y., Yan, Y., & Li, B. (2017). Thermal performance of ultra-thin flattened heat pipes. Applied Thermal Engineering, 117, 773-781. [40] Tang, Y., Deng, D., Huang, G., Wan, Z., & Lu, L. (2013). Effect of fabrication parameters on capillary performance of composite wicks for two-phase heat transfer devices. Energy conversion and management, 66, 66-76.
[41] Qu, Y., Zhou, K., Zhang, K. F., & Tian, Y. (2016). Effects of multiple sintering parameters on the thermal performance of bi-porous nickel wicks in Loop Heat Pipes. International Journal of Heat and Mass Transfer, 99, 638-646. [42] Ling, W., Zhou, W., Yu, W., & Chu, X. (2018). Capillary pumping performance of porous copper fiber sintered wicks for loop heat pipes. Applied Thermal Engineering, 129, 1582-1594 [43] Mwaba, M. G., Huang, X., & Gu, J. (2006). Influence of wick characteristics on heat pipe performance. International journal of energy research, 30(7), 489-499. [44] Grissa, Kods, Adel M. Benselama, Zied Lataoui, Yves Bertin, and Abdelmajid Jemni. "Investigations of the thermal performance of a cylindrical wicked heat pipe." International Journal of Energy Research (2018). [45] Brahim, T., & Jemni, A. (2014). Effect of the heat pipe adiabatic region. Journal of heat transfer, 136(4), 042901.

UABSchoolofEngineering-MechanicalEngineering-JournaloftheECTC,Volume17 Page11
Journal of UAB ECTC Volume 17, 2018
Department of Mechanical Engineering The University of Alabama, Birmingham
Birmingham, Alabama USA
COOLING OF A HOT SUBSTRATE WITH SUPERSONIC NOZZLE
Simon Esau, Rifat Kabir North Carolina A&T State University Greensboro, North Carolina, USA
John P. Kizito North Carolina A&T State University Greensboro, North Carolina, USA
ABSTRACT Supersonic flow cooling has always been an interesting
topic to study. The primary objective of this current paper is to analyze the cooling of a hot surface using an impinging jet created by a supersonic nozzle. Different parametric studies have been conducted to examine the effect of using supersonic flow over a hot surface with the purpose of cooling. A supersonic nozzle expands the surrounding air drastically and results in reducing temperature and pressure. The coolant considered in this paper is air. Comparative studies have been made to show the effectiveness of cooling using a converging nozzle and a converging-diverging nozzle. Supersonic flow through the converging-diverging nozzle shows more cooling than the other one. With the help of a conical shape facing the nozzle, the shock was reduced at the point of impact between the supersonic jet and the heated surface. KEY WORDS: converging-diverging nozzle, de Laval nozzle supersonic flow, cooling a hot surface, hot cylinder,
INTRODUCTION Supersonic flow cooling has always been an interesting
topic to study. A lot of work was done previously to show the effective cooling of supersonic flow. Use of a supersonic nozzle in fluid cooling is the most common one rather than a solid surface. References [1], [2], [3] discuss the gas or steam condensation, carbon dioxide removal from natural gas. Supersonic separation is a technology potentially applicable to the natural gas decarbonation process. Reference [1] indicated that the liquefaction of carbon dioxide can be achieved in a properly designed nozzle. Steam condensation is done by considering phase transition phenomena and by using wet non equilibrium wet steam in a nozzle [2]. Binary gas condensation characteristics in supersonic nozzles are numerically simulated [3]. In this paper, a Laval nozzle with a central body is designed to study the effects of swirling on the condensation characteristics [4-8] discussed mostly in terms of film cooling. Film cooling is an effective method used to cool many components exposed to severe heating. Supersonic film cooling
tangentially ejected through a half Laval nozzle set in a backward-facing slot was numerically simulated to investigate the structures of the flow field and the mechanisms of heat transfer after the slot. In particular, changes in flow field near the turning point in the cooling effectiveness curve were studied [4]. Ref. [5] focused on the film cooling of two parallel flows (primary flow and coolant flow) with supersonic or subsonic velocity, respectively. The results showed that the cooling effectiveness is enhanced by 45% for the supersonic primary and coolant flow. Ref. [7] analyzed the effect of shock produced by the supersonic flow. The results indicate that the impinging shock wave increases the wall pressure and the turbulent kinetic energy in the boundary layer, with the lower Mach numbers in the boundary layer reducing the film cooling effectiveness for the cases with the shock wave generator as wide as the flow channel. Ref. [9] evaluated the effectiveness of array of water jet cooling instead of single jet. It has been found that the cooling rate is enhanced by 60% in the case of a jet array compared to a single jet at the same water flow rate and impingement height. Refs. [10-16] talk about different cooling methods. A combined transpiration and opposing jet cooling method was experimentally investigated for protecting porous struts with micro slits in the leading edge. Results showed that this cooling method significantly affects the stability of the flow field and the profile of the detached shock wave [11]. The study in [13] focused on the porous blunt nosecone transpiration cooling process under supersonic incoming flow conditions using a two-domain approach based on the preconditioned density-based algorithm. The work in reference [15] was carried out to study the airflow and heat transfer above a cup of hot drink. Also, an experimental methodology was developed to determine the heat transfer coefficient between a cup of hot drink and ambient air. This parameter allows prediction of the cooling rate of a drink in room conditions. Ref. [16] also predicted local and overall heat transfer coefficients to determine cooling rate, but this work also compared between an array of jets and a single jet. Ref. [17] discussed the basic idea of overall cooling systems in terms of global and local cooling segments. This paper used a reverse Brayton cycle for global cooling problem. Instead of a turbine, a supersonic nozzle can be a better option for the expansion
UABSchoolofEngineering-MechanicalEngineering-JournaloftheECTC,Volume17 Page12
process of the reverse Brayton cycle. Ref. [18] discussed the effect of the wedge angle on fluid flow and heat transfer phenomenon.
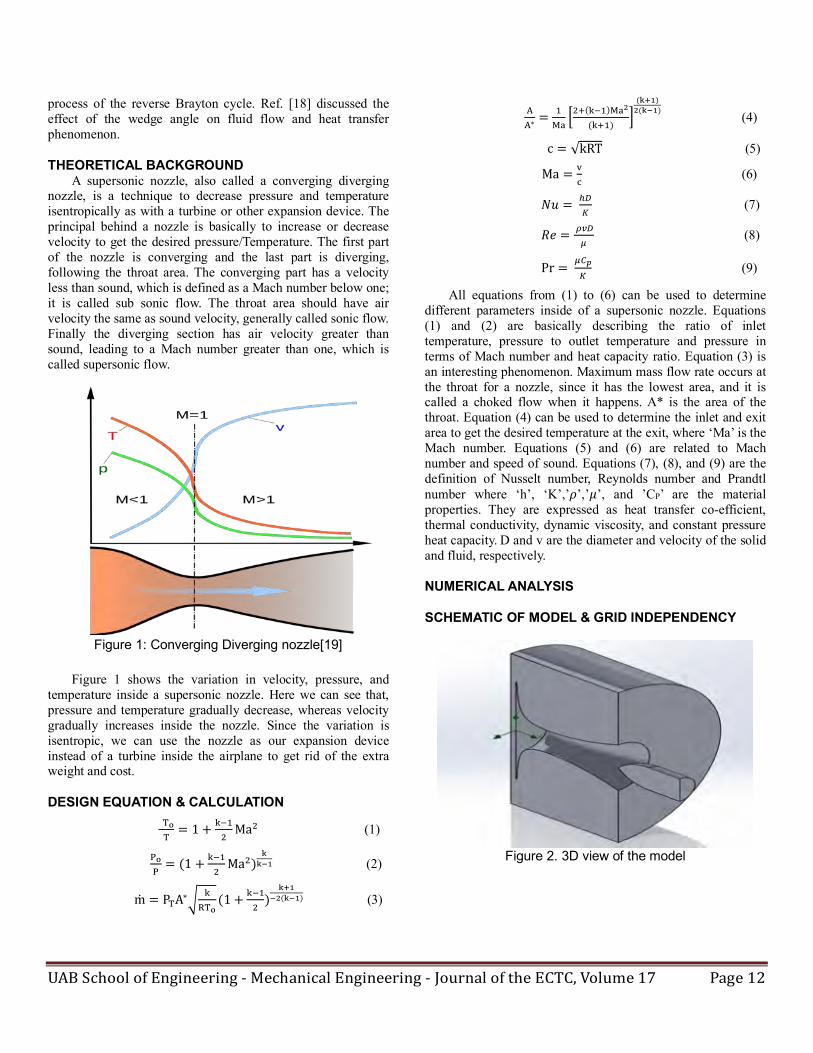
THEORETICAL BACKGROUND A supersonic nozzle, also called a converging diverging
nozzle, is a technique to decrease pressure and temperature isentropically as with a turbine or other expansion device. The principal behind a nozzle is basically to increase or decrease velocity to get the desired pressure/Temperature. The first part of the nozzle is converging and the last part is diverging, following the throat area. The converging part has a velocity less than sound, which is defined as a Mach number below one; it is called sub sonic flow. The throat area should have air velocity the same as sound velocity, generally called sonic flow. Finally the diverging section has air velocity greater than sound, leading to a Mach number greater than one, which is called supersonic flow.
Figure 1: Converging Diverging nozzle[19]
Figure 1 shows the variation in velocity, pressure, and
temperature inside a supersonic nozzle. Here we can see that, pressure and temperature gradually decrease, whereas velocity gradually increases inside the nozzle. Since the variation is isentropic, we can use the nozzle as our expansion device instead of a turbine inside the airplane to get rid of the extra weight and cost.
DESIGN EQUATION & CALCULATION
"#"= 1 + '()
*Ma* (1)
-#-= (1 + '()
*Ma*)
0012 (2)
m = P"A∗8'
9"#(1 + '()
*)
0:21;(012) (3)
<<∗= )
=>?*@('())=>
;
('@))A(0:2);(012) (4)
c = √kRT (5)
Ma = GH (6)
𝑁𝑢 = KLM
(7)
𝑅𝑒 = PQLR
(8)
Pr = RTUM
(9)
All equations from (1) to (6) can be used to determine different parameters inside of a supersonic nozzle. Equations (1) and (2) are basically describing the ratio of inlet temperature, pressure to outlet temperature and pressure in terms of Mach number and heat capacity ratio. Equation (3) is an interesting phenomenon. Maximum mass flow rate occurs at the throat for a nozzle, since it has the lowest area, and it is called a choked flow when it happens. A* is the area of the throat. Equation (4) can be used to determine the inlet and exit area to get the desired temperature at the exit, where ‘Ma’ is the Mach number. Equations (5) and (6) are related to Mach number and speed of sound. Equations (7), (8), and (9) are the definition of Nusselt number, Reynolds number and Prandtl number where ‘h’, ‘K’,’𝜌’,’𝜇’, and ’CP’ are the material properties. They are expressed as heat transfer co-efficient, thermal conductivity, dynamic viscosity, and constant pressure heat capacity. D and v are the diameter and velocity of the solid and fluid, respectively.
NUMERICAL ANALYSIS
SCHEMATIC OF MODEL & GRID INDEPENDENCY
Figure 2. 3D view of the model

UABSchoolofEngineering-MechanicalEngineering-JournaloftheECTC,Volume17 Page13
Figure 3. Side view of the model
Figures 2 and 3 show the Solidworks model of the
problem. A supersonic nozzle is placed in front of a heated cone. The distance between the nozzle and the hot solid is 200mm here. There is a specific heat generation rate of the heated cone. The areas of the nozzle are calculated in a way which ensures the Mach number is one at the throat. The equations described in the previous section are used to calculate areas. All these parameters are flexible and can be changed to accomplish parametric study of the effective cooling.
Figure 4. lowest mesh setting of the model
Figure 5. Highest mesh setting of the model
Figures 4 and 5 represent the grid numbers and Figure 6
shows the boundary conditions of the simulation. A boundary condition is given as a specific mass flow rate through the nozzle. A definite heat generation rate is also provided. Table 1 represents the outlet velocity and volumetric flow rate for different mesh settings. Mesh setting 3 has the lowest grid setting, and 6 has the highest grid. The variation among the values of different settings is very small. The maximum error is ~5%, and most of the values are in the error range of 1-2%. So we can conclude that, our design is grid independent.
Table 1. Grid Independency
Figure 6. Boundary conditions of the model
COMPARATIVE STUDY BETWEEN SUPERSONIC NOZZLE AND CONVERGING NOZZLE
A supersonic flow has very low temperature at the exit because of the high velocity and severe drop of pressure. On the contrary, in a converging nozzle, sonic flow is barely achievable. Figures 7 and 8 represent flow simulation of both the nozzle to compare the cooling effect.
Goal Name Total numbers of cells
Error(%) 413,036 3,354,403 7,555,808
Mach number 2.4 2.39 2.37 <1%
Bulk Average Temperature (Solid) [K]
368.15 366.42 361.84 <2%
Average Heat Transfer
Coefficient [W/m2/K]
141.96 142.57 140.87 < 1%
Surface heat flux(KW/m^2) 22.2 22.02 22.02 0%

UABSchoolofEngineering-MechanicalEngineering-JournaloftheECTC,Volume17 Page14
Figure 7. flow analysis of a converging nozzle
Figure 8. Flow analysis of converging-diverging nozzle
Figures 7 and 8 demonstrate the overall picture of cooling
a hot solid by a converging nozzle and a converging-diverging nozzle respectively for a specific mass flow rate of air. Here, the heat transfer coefficient of the hot solid and the temperature of the fluid have been presented. If we compare the simulations, we can see that, the temperature of the fluid at the exit of the converging nozzle is around 278K, whereas the converging-diverging nozzle delivers air at 150K (approx.). Also the maximum heat transfer coefficient for a converging nozzle is 174 W/m2/K, while in the converging-diverging nozzle, the average heat transfer coefficient is around 200 W/m2/K.
Figures 9 and 10 show the variation of different parameters of both the nozzles for mass flow rate of 1 kg/s. From Figure 6, we can predict that the supersonic nozzle has a higher heat transfer coefficient for different distances where the hot solid is being placed. At 300mm, the heat transfer coefficient of the converging nozzle is ~125 W/m2/K, whereas the supersonic nozzle produces ~200 W/m2/K for same hot solid. Figure 10 is a graphical representation of the temperature of a hot solid after being cooled down by both the nozzles. Here also, we can see that the converging-diverging nozzle develops better performance than the converging nozzle.
Figure 9. Variation of heat transfer coefficient
Figure 10. Variation of temperature of hot surface
RESULTS
Figure 11. Heat transfer coefficient vs surface heat flux
Figure 11 represents the variation in heat transfer
coefficient with the heat flux of the hot solid. The graph looks
UABSchoolofEngineering-MechanicalEngineering-JournaloftheECTC,Volume17 Page15
logical. Increasing surface heat flux increases heat transfer coefficient, because decreasing the area increases the surface heat flux and decreases the heat transfer coefficient. Therefore, we can say that, to increase the heat transfer coefficient, the surface heat flux needs to increase.
Figure 12 shows the heat transfer coefficient variation with the change of heat generation rate inside the hot solid. Here, we can see that increasing heat generates increased heat transfer coefficient for a specific mass flow rate of air, which is 1 kg/s in this case. But after 900W, it starts decreasing. The reason behind this is that the provided mass flow rate is not enough to cool down such a high heat generation. If we increase the mass flow rate, the heat transfer coefficient will start to increase.
Figure 12. Heat transfer coefficient vs heat generation
The next parametric study relates the wedge angle with the
performance of cooling. The wedge angle is basically the angle created by a wedge. Since the shape of the hot solid in this study is cylindrical with a nose, studies have been shown to determine the performance if the shape of the nose is changed. Figure 13 shows the definition of a wedge angle.
Figure 13: Wedge angle definition[20]
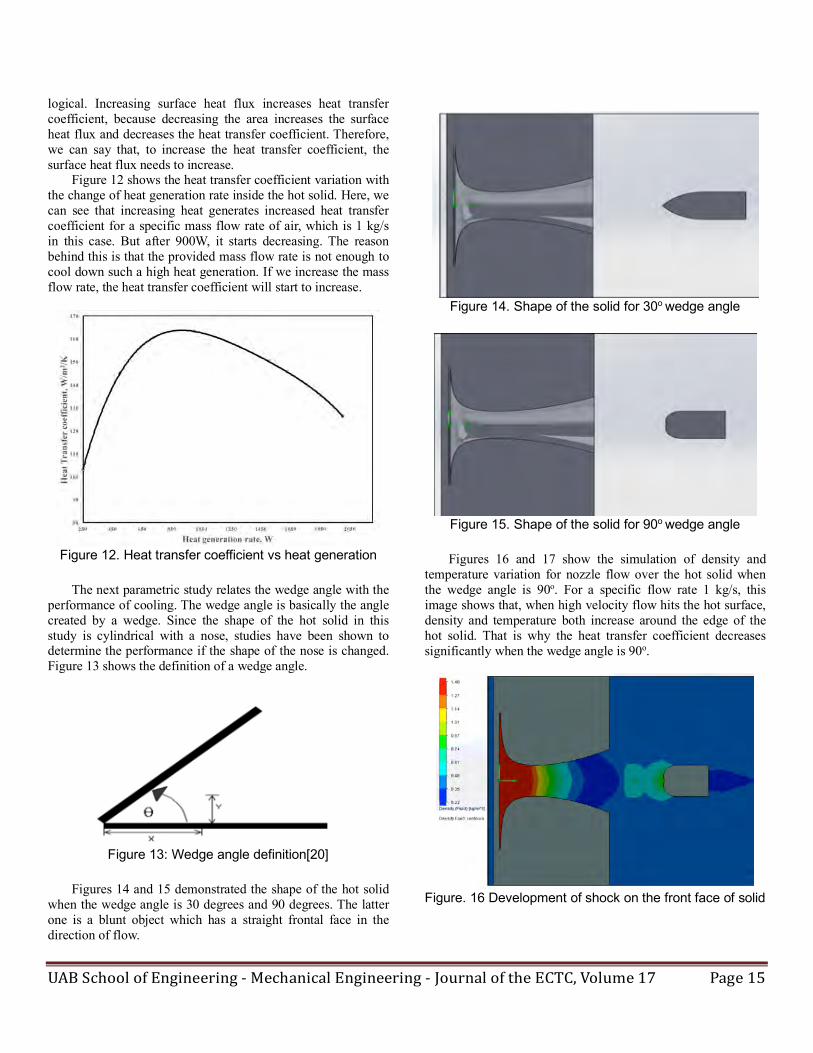
Figures 14 and 15 demonstrated the shape of the hot solid
when the wedge angle is 30 degrees and 90 degrees. The latter one is a blunt object which has a straight frontal face in the direction of flow.
Figure 14. Shape of the solid for 30o wedge angle
Figure 15. Shape of the solid for 90o wedge angle
Figures 16 and 17 show the simulation of density and
temperature variation for nozzle flow over the hot solid when the wedge angle is 90o. For a specific flow rate 1 kg/s, this image shows that, when high velocity flow hits the hot surface, density and temperature both increase around the edge of the hot solid. That is why the heat transfer coefficient decreases significantly when the wedge angle is 90o.
Figure. 16 Development of shock on the front face of solid

UABSchoolofEngineering-MechanicalEngineering-JournaloftheECTC,Volume17 Page16
Figure. 17 Temperature variation of the fluid
Figure 18. Variation of heat transfer coefficient with the
shape Figure 18 shows the variation of heat transfer coefficient
for different shapes of the nose for constant mass flow rate and heat generation. In this case, the mass flow rate is 1 kg/s and heat generation is 50W. A conclusion can be drawn by saying that increasing the wedge angle increases the front area of the solid where the supersonic flow will hit. This creates a temporary shock which prevents cooling by increasing the temperature. Therefore, the heat transfer co efficient decreases with the increment of wedge angle of the solid.
Figure 19 characterizes Nusselt number change with Mach number for both the nozzles. Increasing mass flow rate increases the Mach number, and it is obvious that, with the increment of mass flow rate, the heat transfer coefficient will increase as well as the Nusselt number. The Nusselt number is the ratio of convection over conduction. From Figure 17, we can conclude that, since The Nusselt number is greater than 1, convection dominates the heat transfer in this case which is very obvious. The other graph shows the Nusselt number for the converging nozzle. Here, for mass flow rate 0.5 kg/s, the converging nozzle provides a 0.7 Mach number, which is a subsonic flow; on the contrary, the converging-diverging nozzle gives a Mach number of around 2.2. This results in more heat
transfer as well as a bigger Nusselt number for a converging-diverging nozzle compared to a converging nozzle.
Figure 19. Nusselt number vs Mach number
Figure 20. Nusselt number vs ‘Reynolds number and
Prandtl number
Figure 20 shows the graph of Nusselt number with the change of the term Re0.8Pr1/3. The linearity of the graph validates the empirical correlation of Nusselt number with Reynolds number and Prandtl number.
CONCLUSION Supersonic flow is very effective for cooling purposes. A
converging-diverging nozzle can expand the fluid with a noticeable pressure ratio and provide sufficient cold fluid to cool the hot surface. Our preliminary research showed that, with the right shape of hot solid, shock can be minimized significantly. Also, a supersonic nozzle can be a cost effective means to expand, compared to a turbine. Therefore, a conclusion can be drawn by saying that the cooling of a hot solid by a converging-diverging nozzle can be a subject of immense potential, and extensive research on this can be very beneficial to several industries.
ACKNOWLEDGMENTS
We acknowledge the support from NASA Nnh16zea001n: Electric Propulsion: Challenges and Opportunities.

UABSchoolofEngineering-MechanicalEngineering-JournaloftheECTC,Volume17 Page17
REFERENCES 1. Sun, W., et al. Numerical simulation of carbon dioxide removal from natural gas using supersonic nozzles. in IOP Conference Series: Earth and Environmental Science. 2017. IOP Publishing. 2. Kim, C.H. Q1g#2QDrLvop, et al., Numerical analysis of non-equilibrium steam condensing flows in various Laval nozzles and cascades. Engineering Applications of Computational Fluid Mechanics, 2017. 11(1): p. 172-183. 3. Cao, X. and W. Yang, Numerical simulation of binary-gas condensation characteristics in supersonic nozzles. Journal of Natural Gas Science and Engineering, 2015. 25: p. 197-206. 4. Song, C. and C. Shen, Numerical simulation of supersonic film cooling in a rearward-facing slot. Advances in Mechanical Engineering, 2017. 9(12): p. 1687814017748014. 5. Shan, Y., et al., Numerical Study on Flow and Cooling Characteristics for Supersonic Film Cooling. Heat Transfer Engineering, 2017: p. 1-13. 6. Peng, W., et al., Effect of continuous or discrete shock wave generators on supersonic film cooling. International Journal of Heat and Mass Transfer, 2017. 108: p. 770-783. 7. Gao, X., et al., Heat transfer of single drop impact on a film flow cooling a hot surface. International Journal of Heat and Mass Transfer, 2017. 108: p. 1068-1077. 8. Bunker, R.S., Engine component with film cooling. 2017, Google Patents. 9. Sarkar, I., et al., Comparative study on different additives with a jet array on cooling of a hot steel surface. Applied Thermal Engineering, 2018. 137: p. 154-163. 10. Mosavat, M., et al., The influence of coolant jet direction on heat reduction on the nose cone with Aerodome at supersonic flow. Acta Astronautica, 2018. 11. Huang, G., et al., Experimental study on combined cooling method for porous struts in supersonic flow. Journal of Heat Transfer, 2018. 140(2): p. 022201. 12. Zditovets, A., et al. Influence of the parameters of supersonic flow on effectiveness of gazdynamic method of temperature separation. in Journal of Physics: Conference Series. 2017. IOP Publishing. 13. Wu, Y., et al., NUMERICAL STUDY OF POROUS BLUNT NOSECONE TRANSPIRATION COOLING UNDER SUPERSONIC INCOMING FLOW. Journal of Porous Media, 2017. 20(7). 14. Thomas, M.R., Methods and systems for cooling airflow. 2017, Google Patents. 15. Laguerre, O., et al., Experimental study of airflow and heat transfer above a hot liquid surface simulating a cup of drink. Journal of Food Engineering, 2017. 197: p. 24-33. 16. Gardon, R. and J.C. Akfirat, Heat transfer characteristics of impinging two-dimensional air jets. Journal of Heat Transfer, 1966. 88(1): p. 101-107. 17. Kabir, R., P. McCluskey, and J.P. Kizito. Investigation of a Cooling System for a Hybrid Airplane. in 2018 AIAA/IEEE Electric Aircraft Technologies Symposium. 2018. 18. Taher, M.A., Y.W. Lee, and H.D. Kim, Numerical Study of the Effect of Wedge Angle of a Wedge-Shaped Body
in a Channel using Lattice Boltzmann Method. Procedia Engineering, 2013. 56: p. 232-238. 19. Wikipedia. De laval nozzle. August 1, 2018; Available from: https://en.wikipedia.org/wiki/De_Laval_nozzle. 20. Inc., F.A. Wedge Angle (q). 2012; Available from: http://www.fekete.ca/SAN/TheoryAndEquations/WellTestTheoryEquations/Wedge_Angle.htm.

UABSchoolofEngineering-MechanicalEngineering-JournaloftheECTC,Volume17 Page18
Journal of UAB ECTC Volume 17, 2018
Department of Mechanical Engineering The University of Alabama, Birmingham
Birmingham, Alabama USA
A METHOD FOR THE DESIGN OF THERMODYNAMIC OPTIMIZED SCRAMJET CONFIGURATIONS
Dehua Feng, Frederick Ferguson North Carolina A&T State University Greensboro, North Carolina, U.S.A.
Mookesh Dhanasar, Julio Cesar Mendez North Carolina A&T State University Greensboro, North Carolina, U.S.A.
ABSTRACT A literature survey, conducted as part of this research effort,
revealed that the scramjet is an attractive alternative to rocket engines for access to space vehicles. Moreover, the scramjet has many attractive engineering characteristics and is worthy of a realsitic engineering evaluation. The objective of this effort is to inversely derive scramjet configurations at selected design points along the engine’s project flight corridor. The proposed engineering design process allows for the derivation of realistic scramjet geometries through the incorporation of real-world effects into the design process. Once constructed, the goal is to identify the scramjet design parametrs and evaluate their relationship to the scramjet overall performance. In accomplishing this goal, a quasi-one-dimensional flow field solver with capabilities of modeling the real-world effects was developed. The quasi-one-dimensional flow field solver is based on the Runge-Kutta 4th order scheme for solving systems of differential equations. In principle, the solver allows for the flow field evaluation within arbitrary shaped ducts in which the influences of ‘area change’, ‘friction’, ‘heating’ and ‘chemistry’ may be of importance. Plans are to conduct overall scramjet configuration performance evaluation in the Mach number range of 4 through 15. In addition, plans are underway to compare the performance of this new class of scramjets with existing scramjet models, report on any new findings and suggest recommendations for possible future improvements. KEY WORDS: Scramjet, Shock waves, nozzle, thermodynamics, waveriders, combustor.
INTRODUCTION Air-breathing access to space using combined-cycle engine
concepts is currently being investigated as a possible future replacement for conventional chemical rockets. The niche for the development of high speed air-breathing engines lies in the fact that an air-breathing engine uses the oxygen present in the atmosphere. As such there is no need for the engine to carry its oxidizer supply. This fact will significantly increase the effective specific impulse of the launch vehicle and consequently result in the ability to place larger payloads into orbit for the same amount of fuel as in a conventional vehicle.
Ideally, the combined cycle engine concept for hypersonic propulsion systems utilizes a combination of a low speed engine cycle and a high-speed engine cycle working in harmony to achieve hypersonic flight. The low speed engine cycle, which can be a conventional turbine, rocket or Pulse Detonation Engine (PDE), is used to accelerate the airflow from static conditions and smoothly transition into the high Mach number regime. In the high Mach number regime, the high-speed engine cycle, a Ram/Scram jet, is used to operate at and maintain hypersonic speeds. NASA’s Hypersonic research in the Fundamental Aeronautics program is focused on the development of a turbine-based engine cycle using a scramjet for high speed propulsion.
Controlling the operation of dual-mode combustion systems and the smooth transition between ramjet and scramjet modes in terms of fuel management procedures is an important design challenge currently being worked on by engineers and scientists. So far, scramjets have had a few successful tests in the upper atmosphere. However, the most recent test failed due to a phenomenon known as unstart. This phenomenon is mainly due to the lack of control mechanisms for the real-time management of unsteady perturbations within the scramjet flow path. Random perturbations within the scramjet combustion chamber develop into a wave like structure, which, when left unchecked, leads to a normal shockwave that propagates upstream to the inlet. Preventing unstart has become increasingly important to researchers as test flights have ramped up.
AEROPHYSICS OF RAM-SCRAMJET For a ramjet, the primary purpose of the inlet is to capture
and compress an appropriate quantity of air for sustained combustion. The air in the captured stream tube undergoes a reduction in Mach number with an appropriate increase in pressure and temperature [1-4]. In conventional jet engines, the inlet works in combination with the mechanical compressor to provide the necessary high pressure for the entire engine. However, at high speeds, above Mach 5, the operational physics of the ramjet engine no longer supports the traditional design mechanisms. Even though, the scramjet operates under the same scientific principles by which the ramjet operates, in the

UABSchoolofEngineering-MechanicalEngineering-JournaloftheECTC,Volume17 Page19
case of the scramjet, the incoming air stream does not decelerate to subsonic velocities before combustion is initiated. Rather, a scramjet combustor operates under supersonic conditions. The inlet and isolator are designed to decelerate the flow to a lower Mach number for sustained combustion, refer to Figure 1. As the flow passes the combustor, it is accelerated to an even higher Mach number through the use of a nozzle. By limiting the amount of deceleration, temperatures within the combustor are kept at tolerable levels with respect to both the engine materials and combustion stability requirements. Consequently, to satisfy these demands, scramjets require the use of high-energy fuels and active cooling mechanisms for sustained operation.
Fig. 1: Isolator and Combustor Aero-Physics4.
In reality, the sustained operations of the scramjet are no simple matter. In a well-designed system, there are shock waves and reflected waves built into the scramjet flow path to assist in the processing of the flow. In fact, under perfect conditions, the fluid physics associated with the flow field within the scramjet must follow the flow structure illustrated in Figure 1. However, the scramjet flow field is not stable, and is constantly subjected to perturbations from many sources. The sources of these perturbations include but are not limited to non-uniformities in the mixing and combustion processes within the combustor. Non-uniformities in the scramjet flow path are also due to phenomena associated with the inlet bow shocks, isentropic turning Mach waves, oblique reflecting shock waves, shock-boundary layer interaction, non-uniform inlet flow conditions, and three-dimensional effects.
OPTIMAL DESIGN OF DUAL-MODE SCRAMJET CONFIGURATIONS
The inverse design of an optimized scramjet engine requires the creation of a system that explicitly accommodates the basic physical principles under which the scramjet operates. In other words, the scramjet flow field physics highlighted in Fig. 1 must be the center around which the engine configuration is derived. As done in the design of traditional propulsion systems which comprise many subsystems, in the case of the scramjet, each subsystem must be fully and optimally coupled to the whole. Further, in parallel and in support of the inverse design of these scramjet models, an idealized thermodynamic scramjet model must be constructed. The research objective is to harmoniously couple these concepts with the goal of optimizing the scramjet overall operational efficiency while reducing its maximum operational temperature.
However, in the case of the dual-mode scramjet, the design of each subsystem faces aerothermodynamics, structural dynamics and control challenges. A key to the success of the dual-mode scramjet engine is minimizing the inevitable compromises that must be made in designing a single engine that can operate in different modes. Consequently, the inlet must be designed so that it can operate across the Mach number spectrum, while accommodating the proper management of the engine flow path. Shock locations and flow uniformity requirements must be met, since the scramjet flow path is much more sensitive to the peripheral flow gradients when compared to traditional jet engine design. In previous efforts [5-8], it was demonstrated that the star-shaped forebody, illustrated in Figure 2, meets these requirements. A review of the inverse design process that generated the scramjet configuration illustrated in Figure 2 is discussed later in this paper.
Fig. 2: Longitudinal Cross Section of dual-mode
Scramjet
AIR-BREATHING JET ENGINE THERMODYNAMIC CYCLE ANALYSIS
In general, it is useful to observe the changes of state of the working gas as it undergoes the appropriate thermodynamic changes within the engine. The changes of state are typically presented in the form of 2D plots; namely, pressure versus the specific volume and temperature versus entropy [9]. These plots, illustrated in Figures 3 and 4, are called the p-V and T-S diagrams, respectively. Of greater importance is the nature of the curves within the p-V and T-S diagrams.
Figure 3: Illustration of a typical p-V diagram9
UABSchoolofEngineering-MechanicalEngineering-JournaloftheECTC,Volume17 Page20
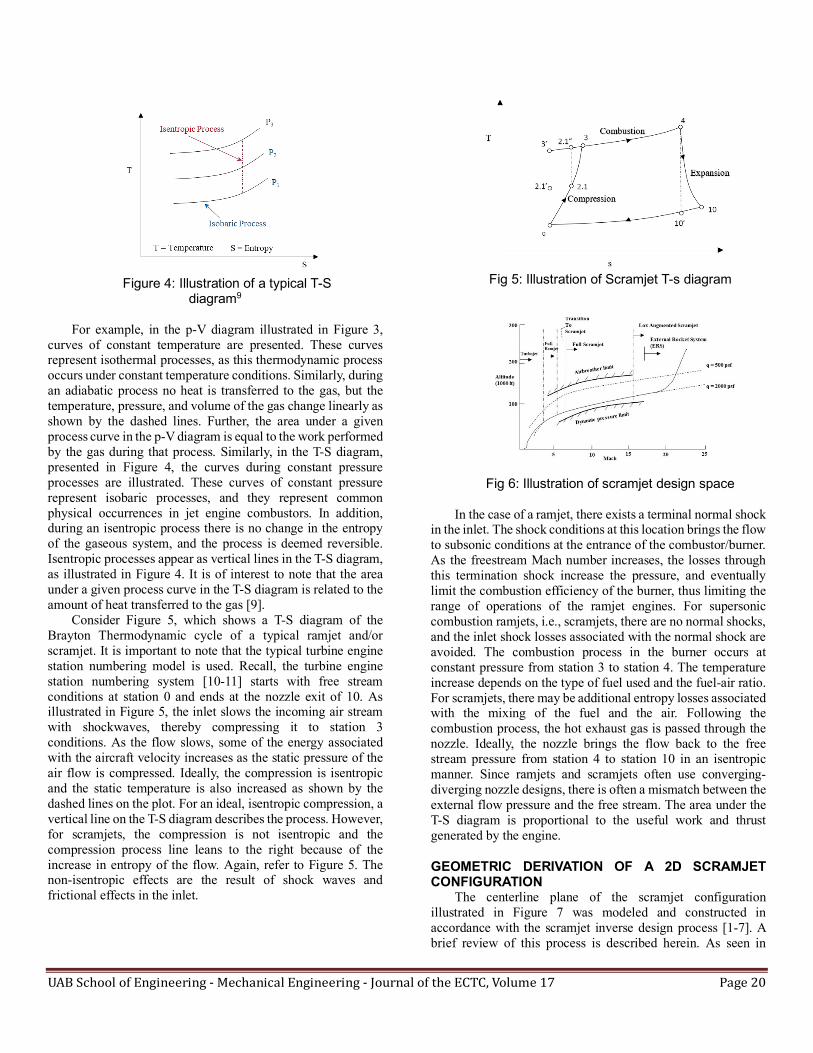
Figure 4: Illustration of a typical T-S
diagram9 For example, in the p-V diagram illustrated in Figure 3,
curves of constant temperature are presented. These curves represent isothermal processes, as this thermodynamic process occurs under constant temperature conditions. Similarly, during an adiabatic process no heat is transferred to the gas, but the temperature, pressure, and volume of the gas change linearly as shown by the dashed lines. Further, the area under a given process curve in the p-V diagram is equal to the work performed by the gas during that process. Similarly, in the T-S diagram, presented in Figure 4, the curves during constant pressure processes are illustrated. These curves of constant pressure represent isobaric processes, and they represent common physical occurrences in jet engine combustors. In addition, during an isentropic process there is no change in the entropy of the gaseous system, and the process is deemed reversible. Isentropic processes appear as vertical lines in the T-S diagram, as illustrated in Figure 4. It is of interest to note that the area under a given process curve in the T-S diagram is related to the amount of heat transferred to the gas [9].
Consider Figure 5, which shows a T-S diagram of the Brayton Thermodynamic cycle of a typical ramjet and/or scramjet. It is important to note that the typical turbine engine station numbering model is used. Recall, the turbine engine station numbering system [10-11] starts with free stream conditions at station 0 and ends at the nozzle exit of 10. As illustrated in Figure 5, the inlet slows the incoming air stream with shockwaves, thereby compressing it to station 3 conditions. As the flow slows, some of the energy associated with the aircraft velocity increases as the static pressure of the air flow is compressed. Ideally, the compression is isentropic and the static temperature is also increased as shown by the dashed lines on the plot. For an ideal, isentropic compression, a vertical line on the T-S diagram describes the process. However, for scramjets, the compression is not isentropic and the compression process line leans to the right because of the increase in entropy of the flow. Again, refer to Figure 5. The non-isentropic effects are the result of shock waves and frictional effects in the inlet.
Fig 5: Illustration of Scramjet T-s diagram
Fig 6: Illustration of scramjet design space
In the case of a ramjet, there exists a terminal normal shock
in the inlet. The shock conditions at this location brings the flow to subsonic conditions at the entrance of the combustor/burner. As the freestream Mach number increases, the losses through this termination shock increase the pressure, and eventually limit the combustion efficiency of the burner, thus limiting the range of operations of the ramjet engines. For supersonic combustion ramjets, i.e., scramjets, there are no normal shocks, and the inlet shock losses associated with the normal shock are avoided. The combustion process in the burner occurs at constant pressure from station 3 to station 4. The temperature increase depends on the type of fuel used and the fuel-air ratio. For scramjets, there may be additional entropy losses associated with the mixing of the fuel and the air. Following the combustion process, the hot exhaust gas is passed through the nozzle. Ideally, the nozzle brings the flow back to the free stream pressure from station 4 to station 10 in an isentropic manner. Since ramjets and scramjets often use converging-diverging nozzle designs, there is often a mismatch between the external flow pressure and the free stream. The area under the T-S diagram is proportional to the useful work and thrust generated by the engine.
GEOMETRIC DERIVATION OF A 2D SCRAMJET CONFIGURATION
The centerline plane of the scramjet configuration illustrated in Figure 7 was modeled and constructed in accordance with the scramjet inverse design process [1-7]. A brief review of this process is described herein. As seen in

UABSchoolofEngineering-MechanicalEngineering-JournaloftheECTC,Volume17 Page21
Figure 7 the scramjet consists of the following distinct but integrated chambers: the forebody, the inlet, the isolator, the mixing chamber, the combustor and the nozzle sections. In the 2D design phase, the objectives are to determine the lengths of the respective chambers, along with the thermodynamic variables at the inflow and outflow of these chambers.
Fig. 7: Morphing Scramjet 2D Configuration
It was shown in Refs. [1-7] that the 2D centerline scramjet
configuration can be constructed from the following set of design inputs: a Mach number, M∞, the length of the scramjet forebody, L, the shock angle, β, the cruising flight the altitude, H∞, and the isolator back-pressure ratio, Pin/Pexit. The shock angles and isolator design parameters are also prescribed. It is of interest to note, that once the Mach number and altitude are prescribed, all other freestream thermodynamic parameters are computed[ 3-6].
The scramjet forebody configuration is created to produce two oblique shocks, which aids in directing the flow into the combustion chamber. The two shock waves are illustrated with broken red lines in Figure 7. The shock from station A to B is the primary shock, and the shock from station B to C is the reflected shock. Since M1 and β1 are prescribed by the user, equation (1) is used to determine the wedge angle of the engine, 𝜃".
𝑡𝑎𝑛𝜃" = 2𝑐𝑜𝑡𝛽" +
,-. /01. 2-3",-.(56789:2-)6:
< (1) The two shock waves do not only alter the flow directions,
they also alter its thermodynamic properties. The relationship between the flow properties before and after an oblique shock are presented in equations (2 - 7),
𝑀>" = 𝑀"𝑠𝑖𝑛𝛽" (2)
𝑀>:: =
,A-. 6+ .BC-<
+ .BBC-<,A-. 3"
(3)
where γ represents the heat capacity ratio of air, which is considered as a constant equal to 1.4.
𝑀: =
,A./01(2-3D-)
(4)
E.E-= (56"),A-.
(53"),A-. 6: (5)
F.F-= 1 + :5
56"(𝑀>"
: − 1) (6)
J.J-= F.
F- E-E.
(7) The reflected shock is designed to return the flow to its
original direction, thus the keeping it parallel to the internal walls of the duct. Hence 𝜃: = 𝜃" = 𝜃 . Since the flow is deflected at supersonic conditions the shock will form at an angle of 𝛽: which is calculated using equations (8 - 10), where
𝑡𝑎𝑛𝛽: =
(,..3"6:L MN/OPQRS6MN/C-T)/VWX
VY"6BC-. ,..Z[\>D (8)
and where 𝛿 = 0 yields the strong shock and 𝛿 = 1 yields the weak solution. In equation (8) the symbols l and c are computed respectively as follows:
𝜆 = +(𝑀:
: − 1): − 3 Y1 + 53":𝑀::Z Y1 + 56"
:𝑀::Z tan: 𝜃<
-.(9)
𝜒 =P,.
.3"Xe3fY"6BC-. ,.
.ZY"6BC-. ,..6Bg-h ,.
hZ ij1. D
Le(10)
Once all angles are determined, the control points; A
through F, are computed as follows. Station A: Station A consists of the leading-edge point
which is considered as (0,0). Flow properties at station A are the freestream properties, which are a function of altitude as shown in Figure 8.
Station B: Station B consists of the point at the cowl lip, which is (LCowl, LCowl *tan β1). The flow properties at station B are derived from equations (4 – 7).
Station C: Station C consists of a design point where the reflected shock from the cowl lip meets the wedge of the scramjet. It is also the point where the constant area duct begins. Using points A and B along with the angle of the lines, which emanate from them towards C, the coordinates for point C can be obtained using equations (11) and (12).
𝐶l = 𝐿n8op[\>2-3[\>(D32.)[\>D3[\>(D32.)
(11)
𝐶q = tan𝜃 ∗ 𝐶l (12) In a similar manner, all required flow field properties at
station C are obtained. Station D: Station D is considered the end of the constant
area duct where sonic conditions exist. Therefore, M1=1.0. The y-coordinates of points D1 and D2 are known, since they are the same as the y-coordinates of B and C, respectively. The x-coordinates for D1 and D2 are equal and dependent on the length of the duct. Therefore,
𝐷"q = 𝐵q (13)
𝐷:q = 𝐶q (14)

UABSchoolofEngineering-MechanicalEngineering-JournaloftheECTC,Volume17 Page22
𝐷"l = 𝐷:l = 𝐷l (15) The isolator duct is considered a constant cross-sectional
area duct with a prescribed friction factor, f, of 0.005. Using Fanno 1D flow field theory, the length of the isolator, 𝐿uvw7[w8> , is computed as,
𝐿uvw7[w8> =
xy3nyQu
+"3,e.
5,e.+ 56"
:5ln Y (56"),e.
:6(53"),e.Z< (16)
Next, the scramjet coordinate Dx is evaluated from the
expression,
𝐷l = 𝐶l + 𝐿uvw7[w8> (17) The flow properties at station D are represented by sonic
conditions, such that the star-values, T*, are at sonic conditions. The quantities at the base of the isolator are computed by the equations 19-21.
JeJ∗= 56"
:6(53"),e. (19)
FeF∗= "
,e+ 56":6(53"),e.
<-. (20)
EeE∗= "
,e+:6(53"),e
.
56"<-. (21)
Stations E and F: Station E is the outlet of the combustor, and F the outlet of the nozzle. Further, station E represents a control point within the scramjet used to optimize the performance of both the combustor and the nozzle. Pont E primarily controls the exit Mach Number at station E. The nozzle is symmetrical about the centerline of the duct and is designed to ensure the flow increases to supersonic speeds at the outlet. The combustor exit length, its height and the nozzle angle, α, serve as the geometric control points at station E. Hence, the y and x-components of points at Station E are
𝐸"q = 𝐷"q + 𝐿n8|}~�w��[ (22)
𝐸:q = 𝐷:q + 𝐿n8|}~�w��[ (23)
𝐸"l = 𝐸:l = 𝐷"l + 𝐿n8|}��>�[� (24) The properties of flow at station E are determined using
Quasi One-dimensional flow theory, Ref. [19-20]. The Quasi One-dimensional flow theory was used to determine the function of M5 with respect to the area ratio. Equation 25 was determined using a trend line with a R2 value of 0.9975.
𝑀� = 1.1927 ln Y �
�∗Z + 1.2153, 1 < 𝑀 < 6.9 (25)
Since the flow is considered isentropic within the nozzle,
the stagnation properties at station E are equivalent to the stagnation properties at station F. The stagnation conditions at
D are 𝑇8Q =Jh
�.�VV and 𝑃8Q =
Fh�.�:�
. Therefore, the properties at station E can be found using equations (26 – 28).
J�hJ�= 1 + 53"
:𝑀�: (26)
F�hF�= Y1 + 53"
:𝑀�:Z
BBC- (27)
𝜌� =F��J�
(28)
where R is the gas constant. Once the 2D scramjet geometric configuration is determined, it is then transformed into 3D configurations using the waverider approach. Samples of this 3D configurations are illustrated in Figures 8 and 9.
Fig. 8: Inverse Derived 3D Rectangular
Configuration
Fig. 9: Inverse Derived 3D Axisymmetric
Configuration
DESIGNING SCRAMJETS FOR IDEALIZED THERMODYNAMIC CYCLES
Recall, for an air-breathing propulsion system such as the scramjet, the generic thermodynamic cycle can be illustrated as shown in Fig. 5. Also, as illustrated in Figure 7, the generic model of the scramjet includes an inlet, an isolator, a combustor and a nozzle. The corresponding thermodynamic cycle of the generic scramjet can also be described by the thermodynamic processes of compression, combustion, expansion and heat release. In the idealized model, the thermodynamic processes are assumed to be in thermodynamic equilibrium, the gas is calorically perfect with constant properties, and the mass flow rate of the fuel is negligible. In addition, the detailed flow physics within the scramjet isolator, combustor and nozzle are empirically modeled as described in geometric derivation of a 2D scramjet configuration section. In addition, the

UABSchoolofEngineering-MechanicalEngineering-JournaloftheECTC,Volume17 Page23
thermodynamic stations are modeled as follows: Station 0 is the entrance of the inlet and Station 1 its exit, Station 3 the exit of the isolator, Station 4 the exit of the combustor, and Station 10 the exit of the nozzle.
In the idealized approach, the process from station 0 to station 3 assumes adiabatic process. However, because of the primary and the reflected shocks, and the oblique shock train within the isolator at high Mach numbers, the thermodynamic process from station 0 to 3 cannot be assumed isentropic. In this region, the Temperature ratio, T3/T0, is an important thermodynamic parameter that is denoted as j ≡ T3/T0. The process from station 3 to station 4 assumes frictionless heat addition at relatively constant pressure conditions. In this region, the entropy increases mainly due to heat addition, qadd. Again, in an ideal situation the value of qadd can be determined by directly integrating the Gibbs equation for a calorically perfect gas. Next, the process from station 4 to station 10 assumes an isentropic expansion, where p10 strives to approximate p0. Finally, a closed imaginary thermodynamic system is assumed from station 10 to station 0, resulting in a constant pressure situation. During this process, sufficient heat is rejected to the surroundings and the flow returns to its original thermodynamic state. Specifically, qrej must reduce the entropy an equal amount from station 10 to station 0 to the entropy increase from station 3 to station 4.
ANALYZING THE IDEALIZED SCRAMJET THERMODYNAMIC CYCLE
First, consider the heat rejection process from station 10 to 0. For a calorically perfect gas, the heat rejected during the scramjet cycle can be obtained using
𝑞8�[ = ℎ"� − ℎ� (29)
Using the definitions of enthalpy and entropy, equation
(29) can be rearranged in the form.
𝑞8�[ = 𝐶�𝑇� �exp(�-�3��n�
) − 1� (30)
which results in an expression for heat rejection as a function of entropy change. In a similar manner, when the thermodynamic process from station 3 to 4 is considered, the thermal efficiency of the scramjet cycle, h,
𝜂[� =¡¢A3¡�£¤
¡¢A (31)
can be written as
𝜂[� = 1 −¥¦§(¨-�C¨�©�
)3"
¡ª (32)
where the symbol, 𝑞ª = 𝑞w> 𝐶�𝑇�⁄ is the non-dimensional heat added.
Observing equations (30) and (32) leads to the conclusion that the entropy increase parameter, (𝑆"� − 𝑆�) 𝐶�⁄ in both the heat addition and heat rejection processes is extremely
important to the thermodynamic cycle analysis. Therefore, the key to accurately evaluating the 'entropy increase' parameter lies within the accuracy of the thermodynamic state of the gas at station 3.
In this research a large number of isolator models were developed, including the empirical model of Billing et al., Ref. [16-17]. However, in this analysis to evaluate the state of the gas at station 3, the theory discussed in Section II.D is used. In the case when the Mach number at station 3 is known, the compression ratio of the static temperature-rise, y, is computed as follows:
𝜓 = :6(53"),�.
:6(53"),e. (33)
where Mo is the freestream Mach number and g is the ratio of specific heats.
IDEAL SCRAM-MODE CYCLE For the Scram-mode cycle of a scramjet, the entropy
increases from station 3 to station 4 can be given by
�h3�en�
= 𝑙𝑛 ¯,h.
,..Y"65,e
.
"65,h.Z(56") 5⁄
° (34)
The local Mach number at the termination of the heat addition process (station 4) can be obtained using the energy conservation equation between stations 3 and 4 in the form,
𝐶�𝑇V Y1+53":𝑀V:Z + 𝑞w> = 𝐶�𝑇Q Y1 +
53":𝑀Q:Z (35)
The static temperature ratio T4/T3 can be easily obtained through the analysis of Rayleigh flow model, by substituting T4/T3 into equation (35) to result in,
𝑞ª = Y1 + 53":𝑀�:Z ±+,h
.P"65,e.X
,e.("65,h
.) Y:6(53"),h
.
:6(53"),e.Z< − 1² (36)
Consequently, the thermal efficiency of an ideal Scramjet thermodynamic cycle can be determined by solving the equations (30), (32), (33) and (35). It can be observed from this analysis that the thermal efficiency for an ideal Scram-mode cycle is the function of 𝜓 and 𝑞ª. It should also be noted that freestream Mach number M0 is a key parameter for the scramjet cycle. In addition, the Mach number at the entrance of the combustor, M3, must be >1, and so this is a limit for compression static temperature ratio 𝜓.
Arising from this simplified scramjet analysis are the following two constraints: (a) 𝑞ª drives M4 to 1 and (b) 𝑞ª drives T4 to Tmax. If either of the constraints occurs, the value of heat addition reaches its maximum. Ramjet operations can be handled in a similar manner.
PERFORMANCE PARAMETERS OF THERMODYNAMIC CYCLE ANALYSIS
Once the cycle thermal efficiency is known, all other performance parameters, such as the fuel-to-air ratio f, the specific thrust Fs and the specific impulse Isp can be determined. As previously assumed in this analysis, the mass flow rate of

UABSchoolofEngineering-MechanicalEngineering-JournaloftheECTC,Volume17 Page24
fuel is negligible compared to that of the core air flow, and the exhaust flow is perfectly expanded to match the local ambient static pressure. The scramjet performance parameters of interest to this project are listed as follows:
𝑓 ∶=|¶
|�= ¡ªn�J�
~·¸ (37)
𝐹9 ∶=º|�= »𝑉�: + 2𝜂[�𝑓𝐻F� − 𝑉� (38)
𝐼9� ∶=º
|¶�= º¿
u� (39)
It is found that all the propulsion engine performance measurements depend directly on cycle thermal efficiency hth. Therefore, the enhancement of the thermal efficiency of the cycle is the only way to improve the engine performance.
AERO THERMODYNAMIC ANALYSIS OF SCRAMJET FLOW PATH
The MS Excel program created herein requires the input data described in Table 4. It is of interest to note that this input is required to create the initial framework of the scramjet configuration. Moreover, this framework is very flexible, as it allows for quick manipulation of the initial configuration into higher thrust performing models. A typical scramjet configuration that was generated from this data is illustrated in Figure 10. In a similar manner, the required assumptions, refer to Designing scramjet for idealized thermodynamic cycles section, for the generation of the Area, Heating and Friction Influence distributions are provided. In the case of interest to this analysis, the Area, Heating and Friction Influence distributions are plotted in Figure 11.
Fig. 10: Excel Generated 2D Scramjet Configuration
SCRAMJET PARAMETRIC ANALYSIS The resulting Velocity, Temperature, Pressure and Mach
number distribution obtained from this input are illustrated in Figures 12–15. The distribution of the aerodynamic parameters obtained from this study indicated that there are significant with scramjet components. In future studies, careful attention will be given to the accurate modeling on these interactions. A preliminary thermodynamic parametric study was also conducted. This study looked at the performance of the scramjet cycle generated over the range of Mach 4 through 16. The data, illustrated in the form of non-dimensional entropy versus non-
dimensional temperature, are plotted in Figure 16 for Mach 6, 10 and 16.
Table 4: Scramjet Configuration Input
Description Numbers Dimension
Flight Altitude 30.0 km
Mach Number 5.0
Wedge Angle 16.0 Degrees
Forebody Length 1.0 m
Fractional x & y Lengths of ID Values
Isolator Design Parameters
1.0 0.9
Combustor Design Parameters
1.0 0.8
Nozzle Design Parameters
1.0 0.0
Fig. 11: Prescribed Area, Heating and Friction Influence Distributions
0
0.06
0.12
0.18
1.2 1.6 2 2.4 2.8 3.2 3.6 4 4.4 4.8 5.2
Heat Influence Distribution (x10^0.1)
Friction Influence Distribution
Area Influence Distribution (x10^0.1)
(AI
& Q
I)*10
^-0.
1

UABSchoolofEngineering-MechanicalEngineering-JournaloftheECTC,Volume17 Page25
Fig. 12: Flow path velocity and temperature
distribution
Fig. 13: Flow path Mach and normal
pressure distribution
Fig. 14: Mach 4 – 10 path distributions
Fig. 15: Mach 4 – 10 Pressure path distributions
Fig. 16: Excel Generated Area, Heating and Friction
Influence Distributions
CONCLUSIONS This paper gives a preliminary report on efforts to design a
reconfigurable propulsion system that is capable of morphing from ramjet to scramjet mode of operation in flight. Preliminary results support the fact that hypersonic flight performance requirements will almost certainly dictate the use of a translating center body and associated outer ‘clamshell’ that are similar to the configurations of interest to this study. The creation of an integrated forebody-combustor design process was accomplished through the use of 2D planar flow fields. In addition, realistic ramjet-to-scramjet propulsion systems were derived and analyzed using Quasi 1D analysis methods. Studies of the ‘ramjet-to-scramjet propulsion systems’ performance at various Mach numbers and shock angles was conducted and the results presented.
0
200
400
600
800
1000
1200
1400
1600
1800
1.5 2 2.5 3 3.5 4 4.5 5
Flow Path VelocityDistributionFlow Path TemperatureDistribution
0
1
2
3
4
5
6
7
8
1.5 2 2.5 3 3.5 4 4.5 5
Flowpath MachNumberDistributionFlowpath NonDPressureDistribution
0
0.1
0.2
0.3
0.4
0.5
0.6
0 0.5 1 1.5 2
Thermo-Cycle at Mach 6, 10 & 16
Mach 10 Scramjet
Mach 16 Scramjet
Mach 6 Scramjet
DS/Cp
T/T0

UABSchoolofEngineering-MechanicalEngineering-JournaloftheECTC,Volume17 Page26
A major outcome of this effort is the development of a scramjet code. In general, the code developed as part of this research effort was used to conduct the following studies: 1. Generate propulsion systems configurations from
prescribed 2-D shock waves; 2. Evaluate the resulting engine geometric characteristics; 3. Evaluate the thrust performance of the engine, and; 4. Identify the design parameters that affect the engine’s
overall performance and shape; and develop the engine ‘optimization design space’. At this stage of its development, the optimization process
outline in this paper is yet to be fully formulated, tested and debugged.
The preliminary outcomes of this research can be classified in the following two categories. First, the propulsion system design and assembly process led to the discovery of engineering parameters that directly influence the aerodynamic performance of the resulting configuration. These parameters were manipulated to generate configurations with superior thrust and Isp characteristics. Second, design information needed to develop routines for the follow-on morphing and optimization of the ‘ramjet-to-scramjet configuration’ were generated.
ACKNOWLEDGEMENTS This work is sponsored by AFRL Eglin Airforce Base. In
addition, special appreciation is extended to Dr. Isaiah Blankson of NASA Glenn Research Center. REFERENCE [1] Corin Segal, THE SCRAMJET ENGINE, PROCESSES AND CHARACTERISTICS, Published in the United States of America by Cambridge University Press, New York, 2009. [2] McClinton, C.R., 2006, “X-43 – scramjet power breaks the hypersonic barrier: Dryden lectureship in research for 2006”, AIAA paper 2006-1. [3] Smart, M.K. and Trexler, C.A., “Mach 4 Performance of a Fixed-Geometry Hypersonic Inlet with Rectangular-to-Elliptical Shape Transition”, Journal of Propulsion and Power, Vol. 20, No. 2, pp 288-293, 2004. [4] Andreadis, Dean, ‘Scramjet Engines Enabling The Seamless Integration Of Air & Space Operations’, Pratt & Whitney Space Propulsion. [5] Frederick Ferguson, Mookesh Dhanasar, Jamil Grant, Leonard Uitenham, and Isaiah M. Blankson, “CFD Analysis of an Inlet-Isolator Combination for Dual Mode Scramjet Applications”, 49th AIAA Aerospace Sciences Conference and Exhibit FL, 2011 [6] F. Ferguson, Y. Fiagbe and N. Dasque, ‘Design of Optimized 3D Tip-to-tail Scramjet Engines’, AIAA-2009-1099, 47th American Institute of Aeronautics and Astronautics Aerospace Sciences Meeting and Exhibit, Orlando, FL 2009.
[7] Ferguson and M. Dhanasar and I. Blankson, ‘Preliminary Design of a Tip-to-Tail Model of a Ram-Scram Jet Engine,’ AIAA-2009-714, 47th American Institute of Aeronautics and Astronautics Aerospace Sciences Meeting and Exhibit, Orlando, FL 2009. [8] Frederick Ferguson, Thomas Lawrence, Mookesh Dhanasar and I. Blankson, ‘The Design and Performance Evaluation of Hypersonic Inlets for Scramjet Applications’, AIAA SciTech, 53rd AIAA Aerospace Sciences Meeting, 5-9 January 2015, Kissimmee, Florida. [9] https://www.grc.nasa.gov/www/BGH/braytonram.html [10] Mattingly, J. D., Heiser, W. H., and Daley, D. H., Aircraft Engine Design, AIAA, Inc., Washington, D.C., 1987. [11] Heiser, W. H., and Pratt, D. T., Hypersonic Airbreathing Propulsion, AIAA, Inc., Washington, D.C., 1994. [12] Roux, J. A., “Parametric Ideal Scramjet Cycle Analysis,” Journal of Thermophysics and Heat transfer, Vol. 25, No. 4, 2011, pp. 581-585. Doi:10.2514/1.T3758. [13] Brilliant H. M., ‘Analysis of scramjets engines using exergy methods’, AIAA 95-2767, 1995. [14] Amati V, Bruno C. Simone D and Sciubba E., “Development of a novel modular simulation tool for the exergy analysis of a scramjet at cruise condition”, International Journal of Thermodynamics 2006; 9(4):181-91 [15] J. Zhang and F. Ferguson, ‘Construction and Analysis of Hypersonic Vehicle Configurations’, 13th AIAA/CIRA International Space Planes and Hypersonic Systems and Technologies Conference, CIRCA, Italy, May 2005. [16] Billig F. S.; “Research on Supersonic Combustion” Journal of Propulsion and Power, Vol. 9, No 4, July-Aug 1993 [17] Waltrup, P. J., and Billig, F. S., ‘Prediction of Recompression Wall Pressure Distributions in Scramjet Engines, “Journal of Spacecraft and Rockets, Vol., 10, No. 9, 1973, pp. 620-622. [18] Doolan, C.J., ‘A Supersonic Combustion Model for Scramjet Vehicle Performance Studies’, 5th Asia-Pacific Conference on Combustion, The University of Adelaide, Adelaide, Australia, 18-20 July 2005. [19] Doolan, C.J., Birzer, C., ‘Quasi-One-Dimensional Modeling of Hydrogen Fuelled Scramjet Combustors’, The University of Adelaide, Adelaide, Australia [20] Doolan, C.J., Boyce, R., ‘A Quasi-One-Dimensional Mixing and Combustion Code for Trajectory Optimization and Design Studies’, AIAA 2008 15th AIAA International Space Planes and Hypersonic Systems and Technologies Conference May 2008, Dayton, OH.

UABSchoolofEngineering-MechanicalEngineering-JournaloftheECTC,Volume17 Page27
Journal of UAB ECTC Volume 17, 2018
Department of Mechanical Engineering The University of Alabama, Birmingham
Birmingham, Alabama USA
EFFECT OF SCREEN LAYERS AND ORIENTATIONS ON MESH WICKED HEAT PIPES
K. Kaddoura, O.Y.W. Abotsi North Carolina A&T State University
Greensboro, NC, USA
J.P. Kizito North Carolina A&T State University
Greensboro, NC, USA
ABSTRACT Thermosiphons utilize gravity, thermal conduction, and
convection to achieve desired cooling. On the other hand, wicked heat pipes are different versions of heat pipes that employ capillarity to overcome any gravitational limitations. Mesh screens provide additional pumping to enhance the thermal cycle within the heat pipe.
In this paper, an experimental study is carried out to compare the thermal performance of an empty copper pipe, a traditional thermosiphon, and two wicked heat pipes with different numbers of mesh screen layers. The comparison of the thermal performance is done through measuring the thermal resistivity, thermal conductivity, and heat transfer coefficient of the pipes at steady state. Then, the corresponding non-dimensional parameter, the Nusselt number, is calculated to relate the conductive and convective abilities of the pipes. With an identical percentage fill of 50%, the heat pipes are subjected to five different heat loads and five different orientations. Theoretically, the layers of mesh screens enhance the heat transfer, and the pipes perform best at the vertical position. The wicked heat pipes perform better than the copper tube and thermosiphon at any orientation. Furthermore, the mesh wicked heat pipes show an identical performance when they are rotated by 180°.
KEY WORDS: Thermosiphon, Heat Pipe, Mesh Screen, Capillarity, Capillary Limit, Dry-out Limit.
INTRODUCTION Thermal management in hybrid emerging technologies is a
main concern, in which local cooling becomes necessary to ensure the reliability of the electronic components by controlling the temperature and dissipation [1]. Heat pipes, in their simplest forms, are being utilized for their ability of carrying large heat quantities across small sectional areas. The ease of heat pipes’ manufacturing, operation, and integration are attractive aspects when coupled with the simplicity of design and control [2]. Even though Perkins introduced their first thermosiphon in 1836, the scientific revolution in heat
pipes didn’t climax until the 1960s [2, 3]. Thermosiphons, gravity assisted heat pipes, impose many limitations including the inflexibility of orientation, shape modifications, and operational environment. Several scholars, including Swanson, expected the adoption of the heat pipe technology by NASA in 2007 [4]. However, in the absence of the gravitational effects, a thermosiphon becomes useless. Various techniques exist in which the manufactured heat pipes are made gravity independent. Internal wicks presented in the pipe assist the condensate return to the evaporator section, and it was first implemented by Graugler in 1944 [5]. Nowadays, wicks include a wider variety of homogeneous and composite shapes and sizes.
Mesh screens are simple wicks that substitute for a mechanical pump by providing the capillary pressure needed to transport and distribute the working fluid in the heat pipe [6, 7]. Usually, screens are characterized by their high thermal conductivity, porosity, and wick permeability. The high thermal conductivity favors a more uniform temperature distribution across the wick and the heat pipe. Also, porosity of the wick represents the fraction of the void volume to the total volume of the screen [8]. The wick permeability is an empirical constant that describes the wick’s resistance to axial liquid flow. The high permeability maintains small liquid pressure drops and better thermal performance [2].
The small size of the screen’s opening induces high capillarity action to enhance the thermal cycle within the heat pipe. As the evaporator section is heated, the working fluid evaporates while the menisci recede into the wick. As the vapor pressure increases at the evaporator’s section, bubbles grow and escape through the wick's structure. The latent heat of vaporization is released to the ambient as the vapor condenses at the condenser section. The pressure difference generated by the capillarity force pumps the condensate to the evaporator section through the wick’s pores [2, 6, 9].
The maximum heat transfer and the effective thermal resistance contributed by the screen wick are common criteria to determine its performance [10]. The properties of the wick and the working fluid control the generated capillary pressure, which limits the heat transfer rate and thermal resistance of the

UABSchoolofEngineering-MechanicalEngineering-JournaloftheECTC,Volume17 Page28
heat pipe [11]. A commonly encountered limitation in capillary driven heat pipes is the inability to circulate the working fluid. Known as the capillary limit, the sum of the liquid and vapor pressure drops dominates the capillary pressure generated by the wick. The capillarity forces are insufficient to pump the condensate to the evaporator, and the wick is no longer saturated. The dry out that occurs at the evaporator section causes a sudden increase in its corresponding temperature [2, 12].
The choice of the working fluid affects the performance of the used wick as well. For instance, water is characterized by its large heat of vaporization and high surface tension; which are favorable for the capillarity action [1, 2].
THEORY Shifting from thermosiphons to capillary driven heat pipes
is beneficial when working in micro gravitational environments, like terrestrial applications. In such applications, inserting wicks is essential to drive the internal thermal cycle and achieve the desired thermal performance. However, the performance of the heat pipe relies on the performance of the wick’s structure and working fluid.
Beyond the geometrical specifications of available screen meshes, the performance of the wick structure relies on various thermo fluid parameters. The thermal conductivity of mesh screens is given by [8] as
𝑘"## = 𝑘&[(𝑘& + 𝑘*) − (1 − 𝜀)(𝑘& − 𝑘*)](𝑘& + 𝑘*) + (1 − 𝜀)(𝑘& − 𝑘*)
(1)
The effective thermal conductivity of mesh screens depends on the thermal conductivity of the wick material ‘𝑘*’, thermal conductivity of the working fluid ‘𝑘&’, and the porosity of the wick's structure ‘𝜀’.
The porosity of the wrapped screen meshes is also given by [8, 14, 15] as follows
𝜀 = 1 −𝜋𝐹𝑁𝑑4 (2)
where F represents the crimping factor that is approximated to be 1.05 [13]. The mesh number and wire diameter are referred to as ‘𝑁’ and ‘𝑑’, respectively. Moreover, the unit of the diameter is inches in eq. (2) and (3).
Knowing the corresponding porosity of the wick design is necessary to calculate its permeability, as the following equation shows [8, 15],
𝐾 =𝑑7𝜀8
122(1 − 𝜀)7 .(3)
A general comparison could be formulated based on the previously mentioned parameters regarding the wick's material and working fluid. However, the main parameter to be considered is the capillary contribution of the screen mesh. For the wicking to occur, the capillary pressure has to exceed the static pressure existing in the heat pipe. The general expression of the static pressure is
𝑃<=>=?@ = 𝜌𝑔ℎ𝑠𝑖𝑛𝜃, (4)
where “𝜌” corresponds to the density of the working fluid, “𝑔” corresponds to the gravitational acceleration, “ℎ” corresponds to the height of the fluid in the pipe, and “𝜃” corresponds to the angle of orientation.
On the other hand, the capillary pressure is defined as follows,
𝑃@>I =2𝜎𝑐𝑜𝑠𝜃𝑟"##
, (5)
where “𝜎” represents the surface tension of the working fluid and “𝑟"##” represents the effective radius of the wick. In case the wick is a wired screen, the effective radius is defined as follows [8]:
𝑟"## = 𝑤 + 𝑑*2 , (6)
where “𝑤” and “𝑑*” represent the wire spacing and diameter, respectively.
To avoid the dry-out and capillary limit, enough liquid has to be introduced into the wick to ensure its saturation. In the presence of mesh screen wicks, it is more convenient to describe the fluid charge relative to the saturation of the wick. The following equation defines the 100% charge of the mesh screen wick [9],
100% = 𝑉*?@T ∗ 𝜀, (7)
where “𝑉*?@T” represents the volume of the cylindrical mesh insert.
Various ways exist to understand the thermal performance of a heat pipe. The temperature difference describes how even the temperature is distributed along the heat pipe. The temperature difference between the evaporator’s and condenser’s section is defined as,
𝛿𝑇 = 𝑇" − 𝑇@. (8)
The small temperature difference indicates a better thermal distribution. Moreover, the thermal resistance of a heat pipe is directly related to the temperature difference, which is defined as follows,
𝑅=[ = 𝛿𝑇𝑄 , (9)
where “𝑄” corresponds to the heat load introduced at the evaporator section. The lower thermal resistance indicates a better heat transport along the heat pipe. The thermal conductivity of a heat pipe describes its ability in transporting the heat along; it is inversely proportional to the thermal resistance [10]:
𝑘[I = ln(𝑟𝑟?
)
2𝜋𝑅=[𝐿, (10)

UABSchoolofEngineering-MechanicalEngineering-JournaloftheECTC,Volume17 Page29
where “𝑟 ” and “𝑟?” are the outer and inner radii of the heat pipe, and L is the effective heat pipe length.
In addition to the conductive behavior of the pipe, the presence of the fluid in heat pipes provides convective heat transfer that is described by the heat transfer coefficient as,
ℎ = Q𝛿𝑇 .
(11)
Finally, the convective ability of the heat pipe is compared against its conductive capacity through the Nusselt Number as shown,
𝑁𝑢 =ℎ.𝐷𝑘>?e
, (12)
where “𝐷” refers to the active diameter of the pipe.
EXPERIMENTAL SETUP Four heat pipes are designed, and their thermal
performance is studied. Table 1 shows the specification and labeling of the pipes.
Table 1. Heat Pipes Studied.
Pipe 1 Pipe 2 Pipe 3 Pipe 4
Empty No wick 1-Mesh Layer
2-Mesh Layers
The common characteristics among all the manufactured pipes are shown in Table 2
Table 2. Pipes Characteristics [16].
Material Outer Diameter
Inner Diameter Length Thermal
Conductivity 101Copper 0.0191 m 0.0174 m 0.2 m 391 W/m.K
The working fluid charged in the pipes is water. Water is
characterized by the following thermo fluid properties, in Table 3.
Table 3. Water Thermo fluid Characteristics.
Density Surface Tension
Thermal Conductivity
997 Kg/m3 0.072 N/m 0.608 W/m.K
Finally, the characteristics of the mesh screen are tabulated in Table 4.
Table 4. Mesh Screen Characteristics.
Material Type Mesh size
Opening Size
Wire Diameter
Copper Wire Cloth 100x100 0.000152 m 0.0001143 m
Based on the characteristics presented in Table 4, the
mesh’s porosity is calculated by eq. (2) to be 63%. Thus, the permeability of the mesh screen used is calculated by eq. (3) to
be 3 x 10⁻⁷ m2. The effective thermal conductivity of the mesh screen used is 1.32 W/m.K, through eq. (1).
All pipe rigs possess similar geometrical properties, as presented in Table 2. The internal volume of the heat pipes is 4.76 x 10⁻⁵ m3; therefore, each can hold up to 47.6 ml of water. Previous experiments and literature show that that the optimum volume of working fluid for the best thermal performance is around 50% [17]. Thus, the heat pipes are charged with 50% working fluid, thus each pipe is filled with 23.8 ml of water. According to the porosity model described [13], 23.8 ml is enough to saturate the mesh screens inserted.
The saturation of the wick is necessary to avoid the dry out limit. Since the fluid occupies 50% of the total internal volume, the static pressure calculated using eq. (4) is 979 Pa. This pressure is competing against the capillary pressure that is calculated to be 1081 Pa through eq. (5) and (6). Since the capillary pressure exceeds the static pressure, wicking occurs.
An aluminum block holds the high density heat cartridge and the heat pipe under study. The heat cartridge is connected to an adjustable voltage supply that reads the power introduced. To ensure that all heat fluxes are introduced to the evaporator section, the aluminum block is insulated. Five J-type thermocouples are evenly spaced and attached to the outer wall of the heat pipe using thermo sensitive adhesive strips (KaptonTM). Temperature readings are acquired with MCC DAQ. The following image shows the experimental setup, where two heat pipes are placed into the aluminum block and two thermocouples are attached using Kapton tape.
Fig. 1. The experimental setup.
First, the thermal performance of the heat pipes is studied at 5 different power ratings to understand the general behavior of mesh screen wicked heat pipes. Then, the performance of the heat pipes is studied under the effect of inclination to understand the wicking ability of screen meshes.
RESULTS AND ANALYSIS: A. The Effect of Screen Layers: Table 5 shows the temperature differences between the
evaporator and condenser section of the pipes.

UABSchoolofEngineering-MechanicalEngineering-JournaloftheECTC,Volume17 Page30
Table 5. The temperature difference across the pipes.
Power (Watts) 𝜹T (°C) Pipe 1 Pipe 2 Pipe 3 Pipe 4
15 2.4 1.5 0.13 3.9 23.8 4.4 3.1 1.2 4 34.5 6.3 5.6 4.5 4.8 47.3 8.9 7.5 5.8 8 62 11.2 8.6 6.5 0.1
Figure 2 represents the trend of the temperature distribution as a function of heat load.
Fig. 2. The variation of temperature difference across the
pipes as a function of heat input.
As shown by Fig.2, the temperature difference generally increases across all the pipes as the heat input increases. However, the 1-Mesh layer heat pipe shows the lowest temperature difference. Moreover, the thermal resistivities of the pipes are plotted as follows.
Fig. 3. Thermal resistivity of the pipes as a function of the heat input.
As shown in Fig. 3, the 1-mesh layer heat pipe shows the least thermal resistivity across various powers. Generally, the thermal resistivity of all pipes follows the same trend except for
the 2-mesh layer heat pipe which shows high thermal resistivities due to the presence of extra copper layers within it.
To understand the convective characteristics of the pipes at hand, the corresponding heat transfer coefficients are tabulated below.
Table.6. The heat transfer coefficient across heat pipes.
Power (Watts) 𝒉(W/°C)
Pipe 1 Pipe 2 Pipe 3 Pipe 4 15 6.25 10 115.38 3.86
23.8 5.41 7.68 19.83 5.95 34.5 5.48 6.16 7.67 7.19 47.3 5.31 6.31 8.16 5.91 62 5.54 7.21 9.54 620
As the power increases, the heat transfer coefficient of the 1-Mesh layer heat pipe remains the highest up until 47.3W. At 62 W, the heat transfer coefficient of the 2-Mesh layer heat pipe exceeds all pipes by 10 orders of magnitude.
Fig. 4. The Nusselt number of the pipes at different heat
loads.
As shown in Fig. 4, the Nusselt number corresponding to the 1-Mesh layer heat pipe remains the highest as the power increases to 47.3 W. However, the Nusselt number of the 2-Mesh layer heat pipe exceeds all others by 10 orders of magnitude at 62 W.
B. The Effect of Orientation After exploring the thermal performance of the heat pipes
under vertical conditions, the study is extended to various orientations. The corresponding temperature differences are plotted as follows.
-100
0
100
200
300
400
500
0 20 40 60 80
Nu
Q(W)
EmptyThermpsiphon1-Mesh Layer2-Mesh Layer

UABSchoolofEngineering-MechanicalEngineering-JournaloftheECTC,Volume17 Page31
Fig. 5. The temperature difference across the pipes at
different orientations.
Based on Fig.5, the thermosiphon shows the most uniform distribution when set vertically and aligned with gravity (0 degrees). However, the thermosiphon does not perform effectively at different orientations nor against gravity (90 and 180 degrees, respectively) in which the empty pipe shows a better thermal performance. The 1-Mesh Layer and the 2-Mesh Layer show similar performance when oriented vertically in both directions; indicating their independency of gravity. Moreover, the 1-Mesh Layer shows the most uniform temperature distribution when oriented horizontally.
The Nusselt Numbers of the previous studies are plotted as Fig. 6.
Fig. 6. The Nusselt Number of the pipes at different
orientations.
According to Fig. 6, the 1-Mesh Layer and 2- Mesh Layer heat pipes always perform better than the empty pipe. The 2-Mesh Layer heat pipe shows its cooling superiority at high heat loads, whereas the 1-Mesh Layer shows its cooling superiority at lower heat loads. However, the thermosiphon performs better than the empty pipe when oriented vertically aligned with
gravity. All pipes show a convective trait of heat transfer where the Nusselt Number exceeds unity.
CONCLUSION In this paper, it was shown that utilizing capillarity using
mesh screens enhances the performance of a heat pipe. A layer of mesh screen was enough to exceed the performance of a thermosiphon. As the number of layers increases, the performance of the meshed heat piped showed a delay where the effectiveness did not show until the thermal resistivity of the wall and screen layers were overcome. Thus, the number of layers affects the operation range of the heat pipe. If the heat pipe was to be operated at low heat inputs, fewer screen layers are needed and vice versa.
Moreover, the thermosiphon performs best when aligned with gravity; which fits its definition. If oriented otherwise, the thermosiphon shows its ineffectiveness in transporting heat. On the other hand, the 1-Mesh and 2-Mesh layer heat pipe showed their independency of gravity and showed the best performance when positioned horizontally.
ACKNOWLEDGEMENTS We acknowledge the support from NASA
NNH16ZEA001N: Electric Propulsion: Challenges and Opportunities.
REFERENCES [1] Kizito, John, and Md Monir Hossain. "Experimental study of thermal performance of a flat loop heat pipe." Frontiers in Heat Pipes (FHP) 6.1 (2015). [2] Faghri, Amir. "Heat pipes: review, opportunities and challenges." Frontiers in Heat Pipes (FHP) 5.1 (2014). [3] Cotter, T. P. Theory of heat pipes. No. LA-3246. Los Alamos Scientific Lab., Univ. of California, N. Mex., 1965. [4] Swanson, Theodore D. "Thermal control technologies for complex spacecraft." (2004). [5] Gaugler, Richard S. "Heat transfer device." U.S. Patent No. 2,350,348. 6 Jun. 1944. [6] Nemec, Patrik, Alexander Caja, and Milan Malcho. "Thermal performance measurement of heat pipe." Global journal of technology and optimization 2.1 (2011). [7] Reay, David, Ryan McGlen, and Peter Kew. Heat pipes: theory, design and applications. Butterworth-Heinemann, 2013. [8] Bejan, Adrian, and Allan D. Kraus. Heat transfer handbook. Vol. 1. John Wiley & Sons, 2003. [9] Wong, Shwin-Chung, and Yi-Huan Kao. "Visualization and performance measurement of operating mesh-wicked heat pipes." International Journal of Heat and Mass Transfer 51.17-18 (2008): 4249-4259. [10] Kempers, R., D. Ewing, and C. Y. Ching. "Effect of number of mesh layers and fluid loading on the performance of screen mesh wicked heat pipes." Applied Thermal Engineering 26.5-6 (2006): 589-595. [11] Faghri, Amir. Heat pipe science and technology. Global Digital Press, 1995.
-100
0
100
200
300
400
500
0 20 40 60 80
Nu
Q(W)
Empty 0 Degrees Thermosiphon90 Degress Thermosiphon 180 Degrees Thermosiphon0 Degrees 1 Mesh Layer 90 Degrees 1 Mesh Layer180 Degrees 1 Mesh Layer 0 Degrees 2 Mesh Layer90 Degrees 2 Mesh Layers 180 Degrees 2 Mesh Layer

UABSchoolofEngineering-MechanicalEngineering-JournaloftheECTC,Volume17 Page32
[12] Faghri, Amir, and S. Thomas. "Performance characteristics of a concentric annular heat pipe: Part I—Experimental prediction and analysis of the capillary limit." Journal of heat transfer 111.4 (1989): 844-850. [13] Marcus, Bruce David. "Theory and design of variable conductance heat pipes." (1972). [14] Kozai, Hiroaki, Hideaki Imura, and Yuji Ikeda. "The permeability of screen wicks." JSME international journal. Ser. 2, Fluids engineering, heat transfer, power, combustion, thermophysical properties 34.2 (1991): 212-219.
[15] Mwaba, Misheck G., Xiao Huang, and Junjie Gu. "Influence of wick characteristics on heat pipe performance." International journal of energy research 30.7 (2006): 489-499. [16] Davis, Joseph R., ed. Copper and copper alloys. ASM international, 2001. [17] Kabir, Rifat, Kaddoura, Kamal, Patrick McCluskey, and John P. Kizito. "Investigation of a Cooling System for a Hybrid Airplane." 2018 AIAA/IEEE Electric Aircraft Technologies Symposium. 2018.