ECR Australasia—working together
70
Transcript of ECR Australasia—working together

ECR Australasia— working together for total customer satisfactionEfficient Consumer Response (ECR) is a business concept aimed at better satisfying consumer needs,
through businesses and trading partners working together.
In doing so, ECR best practice will deliver superior business results by reducing costs at all stages
throughout the supply chain, achieving efficiency and streamlined processes. ECR best practices can
deliver improved range, consumer value, sales, service and convenience offerings. This in turn will lead
to greater satisfaction of consumer needs.
ECR Australasia reflects a commitment to take costs out of the grocery supply chain and better satisfy
consumer demands through the adoption of world’s best practice. In an increasingly global food and
grocery industry and a retail environment subject to rapid change, the future for Australian and New
Zealand suppliers, retailers and wholesalers depends on increased efficiencies, reduced costs and added
value for consumers. Influences such as global sourcing, new retail formats and channels, international
retailers, competing products and services and technological innovation have all contributed to the
pressure for change.
ECR Australasia is an initiative of manufacturers, retailers and wholesalers in the Australian and New
Zealand food and grocery industry and is supported by the respective industry associations.
Launched in November 1999 and directed by a Board of nine senior industry executives, ECR Australasia
seeks to build on earlier collaborative work in the industry in Australia and New Zealand and to access
the outcomes of global ECR related activities and the Global Commerce Initiative. Access to the
outcomes of those international activities will enable ECR Australasia to take the best, adapt it to the
Australasian scene and avoid the need to reinvent the wheel.
In a supportive industry environment, ECR Australasia has a golden opportunity to achieve best practice
at least resource cost.
www.ecraustralasia.org.au
1

Acknowledgments The ECR Australasia Guide to Collaborative Loss Prevention contains industry findings, case studies and
recommendations that reflect the enthusiasm of the project team and a strong response to an industry
loss prevention survey.
The guide aims to have practical application within the operations of trading partners throughout the
Australasian food and grocery industry and provide a clear statement of the cost to, and issues facing,
our industry in the battle to reduce stock loss.
ECR Australasia thanks the following Australian and New Zealand suppliers, retailers, wholesalers and
service providers for their valuable contributions:
Project teamJohn Bower (Board Sponsor) Gillette Australia
Bruce Grant (Project Leader) Gillette Australia
David Haberland Woolworths (Aust.)
Graham Zuill Woolworths (NZ)
Judy Darling Procter and Gamble
Paul Middleton Procter and Gamble
John Gilpin Metcash
John Lowe Metcash
Rob Burdock Mayne Logistics
Nick Bedson Kodak Australia
Peter James GlaxoSmithKline
Anthony Smart Gillette Australia
Gerold Knight Coca-Cola Amatil
Neville Lord Coca-Cola Amatil
Mark Williams Brands on Show
Secretariat
Harris Boulton Australian Food and Grocery Council
Denis Phelps Australian Food and Grocery Council
ECR Australasia also particularly thanks Gillette Australia,Woolworths (Aust.) and Woolworths (NZ) for
providing a substantial amount of the procedure, process and case study information that brings the
report to real-world application, and those companies and individuals that participated in the numerous
working group meetings.
The determination of a stock loss figure in Australasia and the manner in which it is being addressed,
would not have been possible without the support of those companies who participated in the initial
project survey—thanks indeed for your efforts and information.
Finally, generous thanks are due to ECR Europe and Adrian Beck of Leicester University, England, for the
free access provided to the survey questions and the ECR Europe report Shrinkage: Introducing a
Collaborative Approach to Reducing Stock Loss in the Supply Chain.
2
Executive summary 51Introduction 112Stock loss in Australia—the cost to our industry 153The benefits of reducing stock loss 234Stock Loss Reduction Guide 25Reproduced from the 2001 ECR Europe report on shrinkage
5
Australasian case studies and tools to reduce stock loss 41The distribution centre and transport 43
The retail store 45
The external environment 53
6
Conclusions and recommendations 577Appendices 61Appendix 1: Glossary 62
Appendix 2: Loss prevention solutions 63
8
3

4

5
Executive summary1
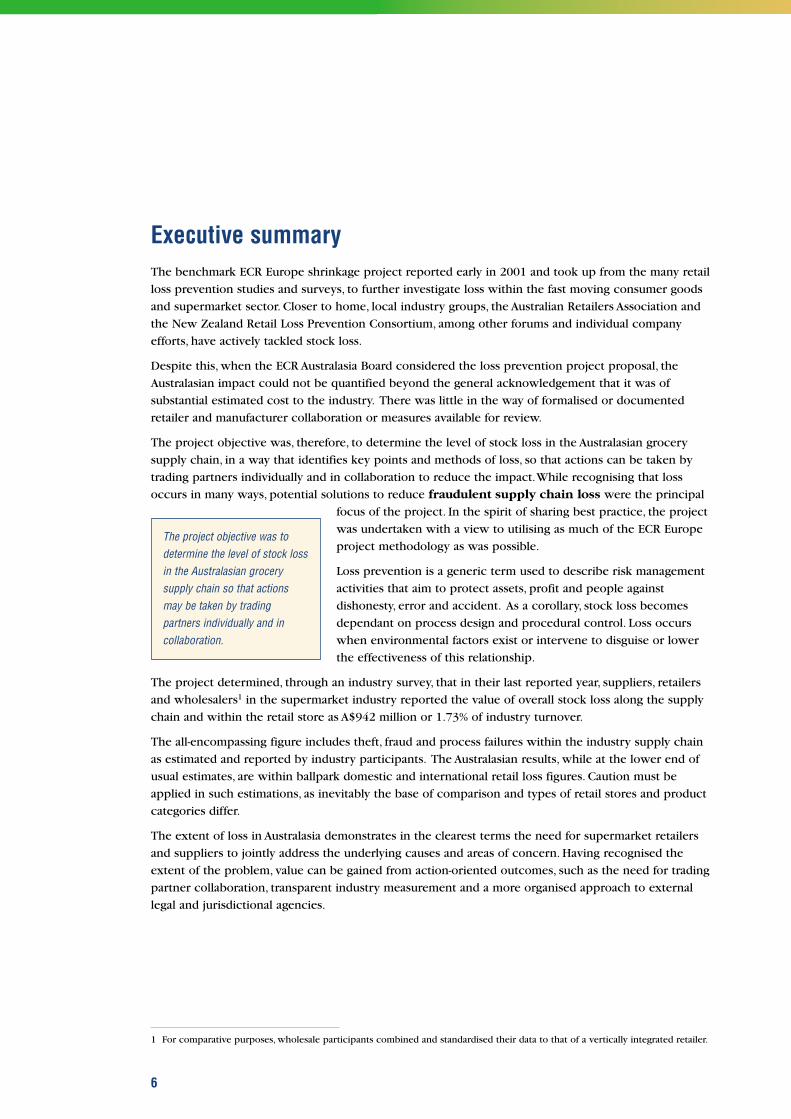
Executive summaryThe benchmark ECR Europe shrinkage project reported early in 2001 and took up from the many retail
loss prevention studies and surveys, to further investigate loss within the fast moving consumer goods
and supermarket sector. Closer to home, local industry groups, the Australian Retailers Association and
the New Zealand Retail Loss Prevention Consortium, among other forums and individual company
efforts, have actively tackled stock loss.
Despite this, when the ECR Australasia Board considered the loss prevention project proposal, the
Australasian impact could not be quantified beyond the general acknowledgement that it was of
substantial estimated cost to the industry. There was little in the way of formalised or documented
retailer and manufacturer collaboration or measures available for review.
The project objective was, therefore, to determine the level of stock loss in the Australasian grocery
supply chain, in a way that identifies key points and methods of loss, so that actions can be taken by
trading partners individually and in collaboration to reduce the impact.While recognising that loss
occurs in many ways, potential solutions to reduce fraudulent supply chain loss were the principal
focus of the project. In the spirit of sharing best practice, the project
was undertaken with a view to utilising as much of the ECR Europe
project methodology as was possible.
Loss prevention is a generic term used to describe risk management
activities that aim to protect assets, profit and people against
dishonesty, error and accident. As a corollary, stock loss becomes
dependant on process design and procedural control. Loss occurs
when environmental factors exist or intervene to disguise or lower
the effectiveness of this relationship.
The project determined, through an industry survey, that in their last reported year, suppliers, retailers
and wholesalers1 in the supermarket industry reported the value of overall stock loss along the supply
chain and within the retail store as A$942 million or 1.73% of industry turnover.
The all-encompassing figure includes theft, fraud and process failures within the industry supply chain
as estimated and reported by industry participants. The Australasian results, while at the lower end of
usual estimates, are within ballpark domestic and international retail loss figures. Caution must be
applied in such estimations, as inevitably the base of comparison and types of retail stores and product
categories differ.
The extent of loss in Australasia demonstrates in the clearest terms the need for supermarket retailers
and suppliers to jointly address the underlying causes and areas of concern. Having recognised the
extent of the problem, value can be gained from action-oriented outcomes, such as the need for trading
partner collaboration, transparent industry measurement and a more organised approach to external
legal and jurisdictional agencies.
6
1 For comparative purposes, wholesale participants combined and standardised their data to that of a vertically integrated retailer.
The project objective was todetermine the level of stock lossin the Australasian grocerysupply chain so that actionsmay be taken by tradingpartners individually and incollaboration.
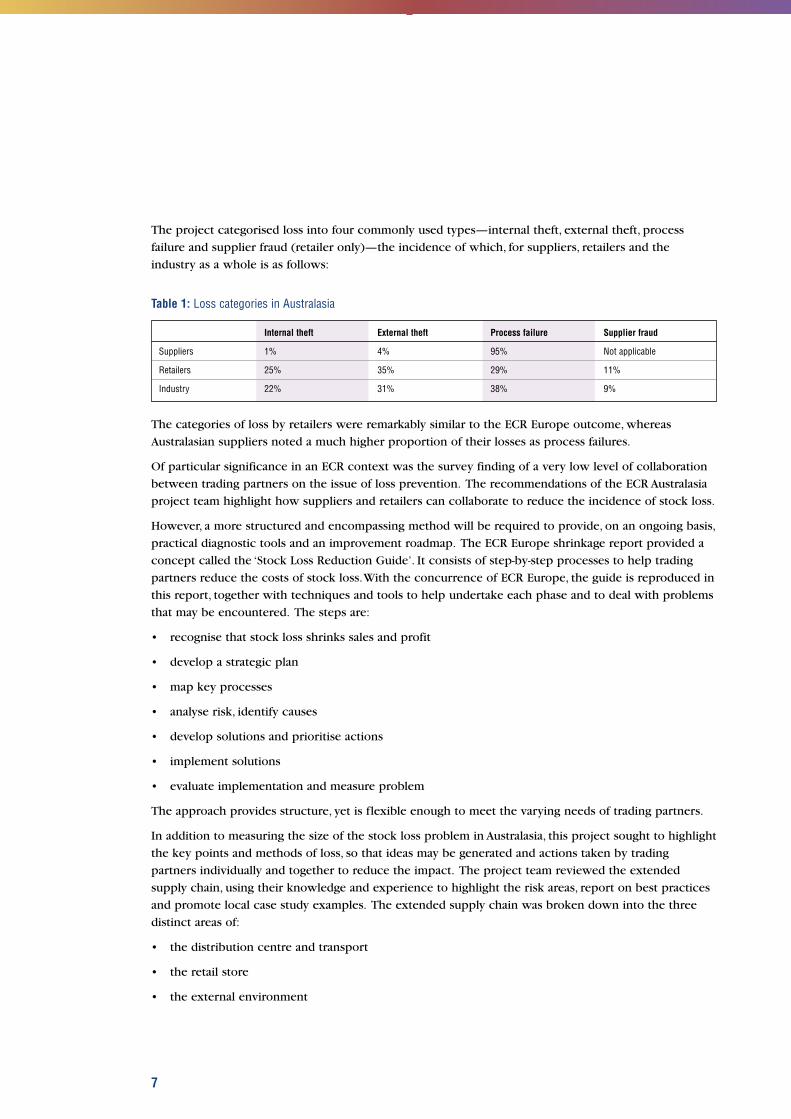
The project categorised loss into four commonly used types—internal theft, external theft, process
failure and supplier fraud (retailer only)—the incidence of which, for suppliers, retailers and the
industry as a whole is as follows:
Table 1: Loss categories in Australasia
Internal theft External theft Process failure Supplier fraud
Suppliers 1% 4% 95% Not applicable
Retailers 25% 35% 29% 11%
Industry 22% 31% 38% 9%
The categories of loss by retailers were remarkably similar to the ECR Europe outcome, whereas
Australasian suppliers noted a much higher proportion of their losses as process failures.
Of particular significance in an ECR context was the survey finding of a very low level of collaboration
between trading partners on the issue of loss prevention. The recommendations of the ECR Australasia
project team highlight how suppliers and retailers can collaborate to reduce the incidence of stock loss.
However, a more structured and encompassing method will be required to provide, on an ongoing basis,
practical diagnostic tools and an improvement roadmap. The ECR Europe shrinkage report provided a
concept called the ‘Stock Loss Reduction Guide’. It consists of step-by-step processes to help trading
partners reduce the costs of stock loss.With the concurrence of ECR Europe, the guide is reproduced in
this report, together with techniques and tools to help undertake each phase and to deal with problems
that may be encountered. The steps are:
• recognise that stock loss shrinks sales and profit
• develop a strategic plan
• map key processes
• analyse risk, identify causes
• develop solutions and prioritise actions
• implement solutions
• evaluate implementation and measure problem
The approach provides structure, yet is flexible enough to meet the varying needs of trading partners.
In addition to measuring the size of the stock loss problem in Australasia, this project sought to highlight
the key points and methods of loss, so that ideas may be generated and actions taken by trading
partners individually and together to reduce the impact. The project team reviewed the extended
supply chain, using their knowledge and experience to highlight the risk areas, report on best practices
and promote local case study examples. The extended supply chain was broken down into the three
distinct areas of:
• the distribution centre and transport
• the retail store
• the external environment
7
The distribution centre and transport processes are quite different to many of those within the retail
store.Within the modern, centralised distribution centre and the typical transport process, a consistent
and thorough audit trail follows any stock movement, and is backed by regular automated and physical
checks on stock holdings. Relatively few people come into contact with the vast volume of product that
moves through the supply chain. As such, professional thieves and ongoing collusion were rated as far
less of a problem in distribution centres than regular staff theft or supplier fraud.Within such a tightly
controlled environment, loss was reported as being at greatest risk more explicitly at points of control
change or product handover and through product use-by date expiry.
The retailer industry survey highlighted in excess of 95% of their loss as arising at store level, some
A$800 million of stock loss in their latest year. In-store risks are accepted as being within two broad
categories—goods receival and merchandise on display, with quite different tactics used to minimise
loss. Retailers noted the greater importance and often seniority being accorded the stockroom manager
in recent times.
Solutions that retailers and suppliers are using and/or trialling in-store to achieve increased availability
and visibility of product and reduce loss include:
• improved security merchandising aids
• packaging design
• store design and aisle layout
• loss prevention operatives
• electronic article surveillance (EAS)
• trading partner collaboration
While collaboration between individual trading partners can be used to address issues arising with the
trading relationship, root causes and broader scale efforts to reduce intentional illegal stock loss lie
outside the traditional retailer-supplier supply chain. Project participants were able to identify elements
of the community that need to be included in a holistic loss prevention strategy and have highlighted
some of the areas that require new or increased efforts by industry. In Australasia, formal industry bodies
and associations afford some coordination, along with other specific bodies that have been instituted to
tackle stock loss.
Managing the external environment is one of the most challenging aspects of loss prevention facing the
supermarket sector and retail industry.While in-store and supply chain measures, both physical and
process based, can be constantly improved upon, it is tantamount to ‘placing the ambulance at the
bottom of the cliff’—in attempting to deal with loss after the event, rather than reducing the motivation
for it to occur in the first instance. This report reinforces the need for an integrated and industry-wide
effort to support the efforts being made by individual companies
throughout the extended supply chain.
In providing a quantifiable estimate of the impact of stock loss on the
supermarket industry in Australasia, ECR Australasia has identified an
understanding of where and how that loss occurs. This should serve
as a call to trading partners to review the manner in which they are
addressing loss prevention and to establish whether the sum of two
halves will be greater as a whole, in attempting to reduce the total
cost of stock loss. The cost of the status quo is the enormous, and
growing figure of A$942 million dollars per year to Australasian
supermarkets and their suppliers.
8
While collaboration betweenindividual trading partners canbe used to address issuesarising within the tradingpartnership, root causes andbroader scale efforts to reduceintentional illegal stock loss lieoutside the traditionalretailer–supplier supply chain.

RecommendationsTo provide impetus to the established efforts in addressing stock loss, ECR Australasia recommends that
the following actions be taken:
• improve loss prevention collaboration at multiple industry levels, such as between
— industry working groups
— trading partners
— functional areas of individual companies
• improve measurement reporting and visibility of stock loss
• renew industry efforts to engage with law enforcement agencies
• renew industry efforts to implement model retail theft legislation in jurisdictions in Australia and
New Zealand
• improve collaboration in the introduction of broad-scale loss prevention technologies
9

10

11
Introduction2
IntroductionThe all-encompassing issue of loss prevention is today as topical as ever in the retail industry.Within the
ECR community, the initial and benchmark ECR Europe shrinkage project report was undertaken during
2000 and reported at the ECR Europe conference early in 2001. Closer to home, a 1998 Australian
industry forum, the Grocery Industry Shrinkage Project, studied stock loss in the supermarket sector,
while on a more general retail front, the New Zealand Centre for Retail Research and Studies conducted
a retail theft study in 1999. Industry groups, the Australian Retailers Association and the New Zealand
Retail Loss Prevention Consortium, amongst other forums and individual company efforts, have also
maintained an active stance on this issue.
Notwithstanding the above activity and the other regular and numerous international studies that have
been completed on the topic, when the loss prevention project proposal was considered, the
Australasian impact could only be acknowledged as being of substantial estimated cost to the industry,
with little in the way of formalised retailer-manufacturer collaboration or measures available for review.
The project objective therefore became to determine the level of stock loss in the Australasian grocery
supply chain, in a way that identifies key points and methods of loss, so actions can be taken by trading
partners, individually and in collaboration, to reduce the impact.Whilst recognising that loss occurs in
many ways, potential solutions to reduce fraudulent supply chain loss was determined as the
principal focus of the project.
The project undertook to use as much of the 2001 ECR Europe shrinkage project methodology as was
possible, thus reducing the ECR Australasia project time and taking advantage of the findings and
outcomes of the already completed study. Links with the industry and the ECR Europe project team led
to the sharing of the European industry survey, enabling an immediate head start by the ECR Australasia
project team. The survey tool was modified to reflect the specific circumstances of the Australian and
New Zealand supermarket supplier and retailer sector, although otherwise was left intact, making the
outcomes directly comparable.
These European links and permissions have also enabled the ECR
Australasia project report to include a full reproduction of a ‘Stock
Loss Reduction Guide’, from the European report, and it sits alongside
analysis of the situation in Australasia and recommendations by the
ECR Australasia project team.
The project sought an understanding of the size of the issue and the
key loss prevention focus areas of industry participants. It assessed
industry solutions which aimed to maintain the integrity of the supply
chain from manufacturer through to retail store, allowed continued
display and sale of high value and or market leading products in-store, and recognised the mutual
interests of wholesalers, retailers and affected manufacturers. It did not set out to review or recommend
any particular technology.
The project report seeks to use the findings to raise industry awareness of the issue, and, somewhat
unfortunately, the headline figure of loss will inevitably ensure this is the case. Much more important are
the findings of current practices and priorities and the recommendations that emanate from them—
these will be the tools that reduce stock loss in the future.
12
The project undertook to use asmuch of the ECR Europe projectmethodology as was possible,thus reducing the ECRAustralasia project time andtaking advantage of the findingsand outcomes …

The project findings and recommendations touch all facets of our industry trading relationships as well
as the internal practices of both trading partners. There are also significant points made with regard to
our industry’s dealings with the external environment, such as the engagement of law enforcement
agencies and the requirement for, and enforcement of, appropriate legislation.
The most compelling outcome, however, will be recognition of the shared responsibility for loss
prevention. As with all circumstances where there is an ongoing business partnership, accountability
and ownership varies at different points along the relationship. The most successful relationships will
respect and take account of the needs of their trading partners. Both parties will ultimately benefit from
such an ECR approach, as their joint efforts satisfy the needs of the consumer, and reward the trading
partners with improved business results.
13

14

15
Stock loss in Australasia—the cost to our industry
3
Stock loss in Australasia—the cost to our industry
Market background‘Loss prevention’ is a generic term used to describe risk management activities that aim to protect
assets, profit and people against dishonesty, error and accident. As a corollary, stock loss becomes a
function of process design and procedural control. Loss occurs when environmental factors exist or
intervene to disguise or lower the effectiveness of this relationship.
This study by ECR Australasia, the first of its kind to specifically review loss prevention in suppliers and
supermarket retailers in Australasia, provides intriguing insights into the cost, industry views and priority
solutions associated with stock loss. The financial costs may be difficult to specifically calculate,
however they are quantifiable. An additional and less quantifiable
effect is the consumer dissatisfaction as a result of stock loss,
caused by product unavailability or closed or secure merchandising
practices, which counter industry and ECR goals of serving the
consumer better.
The Australasian supermarket sector has annual retail sales of
approximately A$54 billion.2 Supermarkets and grocery stores are the
single largest retail sector in Australia and New Zealand, comprising approximately 40% of retail sales in
Australia and approximately 30% of retail sales in New Zealand.3 Supplier turnover, based on industry
estimates, is approximately A$38 billion.
Respondents to the project survey comprised just under half of the supermarket turnover and
approximately one-quarter of all supplier turnover, with results scaled-up to full industry value. In high-risk
product categories, supplier respondents made up a significantly greater category share. Both Australian and
New Zealand operating companies were represented in the supplier and retailer industry surveys.
The cost of stock lossThe headline results of the industry survey conducted as a component of this project are startling if,
unfortunately, not surprising. The survey findings show that, in their last reported year, suppliers,
retailers and wholesalers 4 in the supermarket industry reported the value of overall stock loss along the
supply chain and into the retail store, as accounting for 1.73% of industry turnover or A$942 million.
Significant additional costs are also incurred in preventing stock loss.
The results quantify the sheer size and magnitude of stock loss within our local industry sector and
particularly so when they are broken down—A$2.6 million per day;A$107,000 per hour;A$1800 per
minute;A$30 per second! This all-encompassing figure includes theft, fraud and process failures5 within
the industry supply chain as estimated and reported by industry participants. The results are at the lower
end of ballpark domestic and international retail loss figures, as shown in Table 2. Caution is needed when
comparing such studies as it is common, and is apparent in these examples, to have varying project
scopes and even methods of measurement, restricting comparative value to an indicative figure only.
16
Loss prevention describes riskmanagement activities that aimto protect assets, profit andpeople against dishonesty, error and accident.
2 Source:Australian Bureau of Statistics, Statistics New Zealand, Full Year 2001.
3 Source:Australian Bureau of Statistics, Statistics New Zealand, Full Year 2001.
4 For comparative purposes, wholesale participants combined and standardised their data to that of a vertically integrated retailer.
5 See Glossary for full definition.
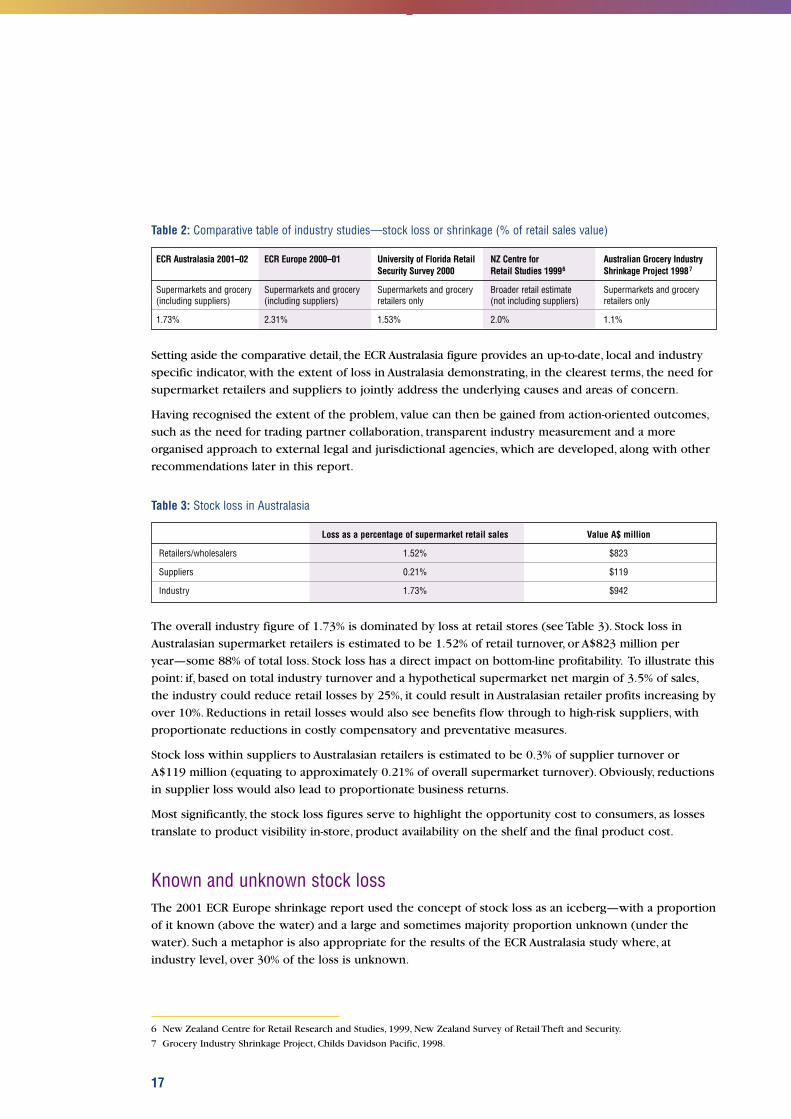
Table 2: Comparative table of industry studies—stock loss or shrinkage (% of retail sales value)
ECR Australasia 2001–02 ECR Europe 2000–01 University of Florida Retail NZ Centre for Australian Grocery IndustrySecurity Survey 2000 Retail Studies 19996 Shrinkage Project 19987
Supermarkets and grocery Supermarkets and grocery Supermarkets and grocery Broader retail estimate Supermarkets and grocery(including suppliers) (including suppliers) retailers only (not including suppliers) retailers only
1.73% 2.31% 1.53% 2.0% 1.1%
Setting aside the comparative detail, the ECR Australasia figure provides an up-to-date, local and industry
specific indicator, with the extent of loss in Australasia demonstrating, in the clearest terms, the need for
supermarket retailers and suppliers to jointly address the underlying causes and areas of concern.
Having recognised the extent of the problem, value can then be gained from action-oriented outcomes,
such as the need for trading partner collaboration, transparent industry measurement and a more
organised approach to external legal and jurisdictional agencies, which are developed, along with other
recommendations later in this report.
Table 3: Stock loss in Australasia
Loss as a percentage of supermarket retail sales Value A$ million
Retailers/wholesalers 1.52% $823
Suppliers 0.21% $119
Industry 1.73% $942
The overall industry figure of 1.73% is dominated by loss at retail stores (see Table 3). Stock loss in
Australasian supermarket retailers is estimated to be 1.52% of retail turnover, or A$823 million per
year—some 88% of total loss. Stock loss has a direct impact on bottom-line profitability. To illustrate this
point: if, based on total industry turnover and a hypothetical supermarket net margin of 3.5% of sales,
the industry could reduce retail losses by 25%, it could result in Australasian retailer profits increasing by
over 10%. Reductions in retail losses would also see benefits flow through to high-risk suppliers, with
proportionate reductions in costly compensatory and preventative measures.
Stock loss within suppliers to Australasian retailers is estimated to be 0.3% of supplier turnover or
A$119 million (equating to approximately 0.21% of overall supermarket turnover). Obviously, reductions
in supplier loss would also lead to proportionate business returns.
Most significantly, the stock loss figures serve to highlight the opportunity cost to consumers, as losses
translate to product visibility in-store, product availability on the shelf and the final product cost.
Known and unknown stock lossThe 2001 ECR Europe shrinkage report used the concept of stock loss as an iceberg—with a proportion
of it known (above the water) and a large and sometimes majority proportion unknown (under the
water). Such a metaphor is also appropriate for the results of the ECR Australasia study where, at
industry level, over 30% of the loss is unknown.
17
6 New Zealand Centre for Retail Research and Studies, 1999, New Zealand Survey of Retail Theft and Security.
7 Grocery Industry Shrinkage Project, Childs Davidson Pacific, 1998.
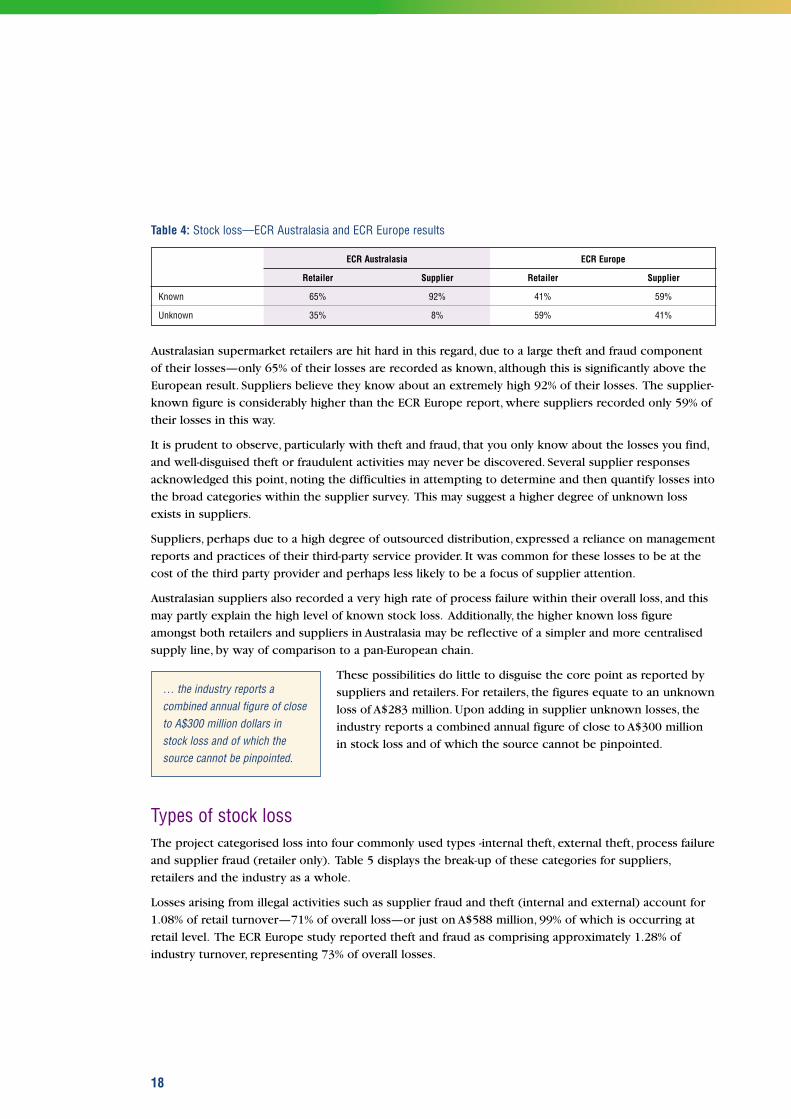
Table 4: Stock loss—ECR Australasia and ECR Europe results
ECR Australasia ECR Europe
Retailer Supplier Retailer Supplier
Known 65% 92% 41% 59%
Unknown 35% 8% 59% 41%
Australasian supermarket retailers are hit hard in this regard, due to a large theft and fraud component
of their losses—only 65% of their losses are recorded as known, although this is significantly above the
European result. Suppliers believe they know about an extremely high 92% of their losses. The supplier-
known figure is considerably higher than the ECR Europe report, where suppliers recorded only 59% of
their losses in this way.
It is prudent to observe, particularly with theft and fraud, that you only know about the losses you find,
and well-disguised theft or fraudulent activities may never be discovered. Several supplier responses
acknowledged this point, noting the difficulties in attempting to determine and then quantify losses into
the broad categories within the supplier survey. This may suggest a higher degree of unknown loss
exists in suppliers.
Suppliers, perhaps due to a high degree of outsourced distribution, expressed a reliance on management
reports and practices of their third-party service provider. It was common for these losses to be at the
cost of the third party provider and perhaps less likely to be a focus of supplier attention.
Australasian suppliers also recorded a very high rate of process failure within their overall loss, and this
may partly explain the high level of known stock loss. Additionally, the higher known loss figure
amongst both retailers and suppliers in Australasia may be reflective of a simpler and more centralised
supply line, by way of comparison to a pan-European chain.
These possibilities do little to disguise the core point as reported by
suppliers and retailers. For retailers, the figures equate to an unknown
loss of A$283 million. Upon adding in supplier unknown losses, the
industry reports a combined annual figure of close to A$300 million
in stock loss and of which the source cannot be pinpointed.
Types of stock lossThe project categorised loss into four commonly used types -internal theft, external theft, process failure
and supplier fraud (retailer only). Table 5 displays the break-up of these categories for suppliers,
retailers and the industry as a whole.
Losses arising from illegal activities such as supplier fraud and theft (internal and external) account for
1.08% of retail turnover—71% of overall loss—or just on A$588 million, 99% of which is occurring at
retail level. The ECR Europe study reported theft and fraud as comprising approximately 1.28% of
industry turnover, representing 73% of overall losses.
18
… the industry reports acombined annual figure of closeto A$300 million dollars instock loss and of which thesource cannot be pinpointed.
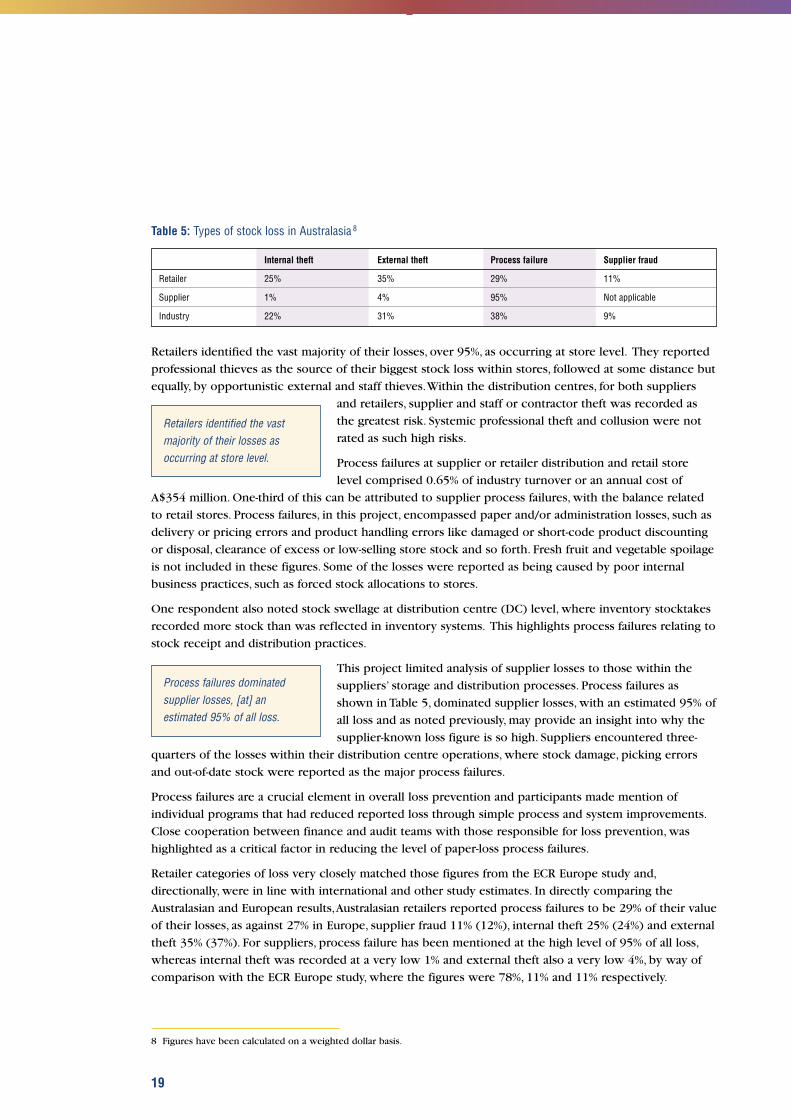
Table 5: Types of stock loss in Australasia 8
Internal theft External theft Process failure Supplier fraud
Retailer 25% 35% 29% 11%
Supplier 1% 4% 95% Not applicable
Industry 22% 31% 38% 9%
Retailers identified the vast majority of their losses, over 95%, as occurring at store level. They reported
professional thieves as the source of their biggest stock loss within stores, followed at some distance but
equally, by opportunistic external and staff thieves.Within the distribution centres, for both suppliers
and retailers, supplier and staff or contractor theft was recorded as
the greatest risk. Systemic professional theft and collusion were not
rated as such high risks.
Process failures at supplier or retailer distribution and retail store
level comprised 0.65% of industry turnover or an annual cost of
A$354 million. One-third of this can be attributed to supplier process failures, with the balance related
to retail stores. Process failures, in this project, encompassed paper and/or administration losses, such as
delivery or pricing errors and product handling errors like damaged or short-code product discounting
or disposal, clearance of excess or low-selling store stock and so forth. Fresh fruit and vegetable spoilage
is not included in these figures. Some of the losses were reported as being caused by poor internal
business practices, such as forced stock allocations to stores.
One respondent also noted stock swellage at distribution centre (DC) level, where inventory stocktakes
recorded more stock than was reflected in inventory systems. This highlights process failures relating to
stock receipt and distribution practices.
This project limited analysis of supplier losses to those within the
suppliers’ storage and distribution processes. Process failures as
shown in Table 5, dominated supplier losses, with an estimated 95% of
all loss and as noted previously, may provide an insight into why the
supplier-known loss figure is so high. Suppliers encountered three-
quarters of the losses within their distribution centre operations, where stock damage, picking errors
and out-of-date stock were reported as the major process failures.
Process failures are a crucial element in overall loss prevention and participants made mention of
individual programs that had reduced reported loss through simple process and system improvements.
Close cooperation between finance and audit teams with those responsible for loss prevention, was
highlighted as a critical factor in reducing the level of paper-loss process failures.
Retailer categories of loss very closely matched those figures from the ECR Europe study and,
directionally, were in line with international and other study estimates. In directly comparing the
Australasian and European results,Australasian retailers reported process failures to be 29% of their value
of their losses, as against 27% in Europe, supplier fraud 11% (12%), internal theft 25% (24%) and external
theft 35% (37%). For suppliers, process failure has been mentioned at the high level of 95% of all loss,
whereas internal theft was recorded at a very low 1% and external theft also a very low 4%, by way of
comparison with the ECR Europe study, where the figures were 78%, 11% and 11% respectively.
19
Retailers identified the vastmajority of their losses asoccurring at store level.
8 Figures have been calculated on a weighted dollar basis.
Process failures dominatedsupplier losses, [at] anestimated 95% of all loss.
Supplier variations in stock lossThe industry stock loss survey revealed significant sectoral differences between product macro-
categories and the methods of stock loss. Amongst suppliers, where the total loss was rather low—
0.21% of industry retail value, there was significant variation between those companies that could be
classified as high risk and those of low risk. There was just as distinct a difference in what type of loss
most commonly affected a supplier company. Retailers had no such obvious differences, with all
participants recording loss figures close to the overall retail figure. It was acknowledged, however, that
independent operators often had lower loss figures than chain-based stores. This feedback was
anecdotal and was not corroborated by the results received in the
industry survey.
The first obvious supplier difference is between food and non-food
companies. Food companies had a much higher proportionate loss
through process failures—most notably stock going out of date—with
little reported loss through theft. Overall, food companies reported a
higher stock loss figure than did non-food companies.
Non-food companies again exhibited a dichotomy of results. Those with higher loss figures were most
vulnerable to theft (typically, risk product categories were within personal care and electrical groups)
and those with lower figures identified most problems through process failures.
Typically, higher risk companies, both food and non-food, had an upper range of loss of around 2% of
sales, whereas low risk non-food companies recorded essentially negligible loss.
Activities to reduce the risksMost companies conducted at least two stocktakes or inventory counts in stores and supplier and
retailer distribution centres each year. Most companies also noted that regular cycle counts were used to
supplement formal stock takes. It was quite common for high-risk items to be subject to extra
protection measures, such as increased frequency of count, secure locations and procedural controls.
Retailers reported spending most of their in-store loss prevention expenditure on physical deterrent
measures, such as cash protection equipment, closed circuit television and alarm systems, ahead of the
actual cost of loss prevention and/or audit teams. Expenditure on electronic tagging systems was low
overall, however there was a distinct country-based difference in approach to these systems (high in
Australia, low in New Zealand). Analysis of electronic-point-of-sale (EPOS) data and automated stock
ordering systems was generally not widely used by retailers as a tool to reduce stock loss.
Suppliers reported devoting a high percentage of their loss prevention expenditure at manufacturing
sites on anti-contamination equipment, with the objective of preserving product integrity and reducing
process failures.
In distribution centres, expenditure was skewed toward external security measures, like shutters, fences
and contracted security staff, although procedural controls, such as checking stock deliveries, perpetual
inventory systems, pallet configuration checks and regular cycle counting (particularly with vulnerable
lines) were reported with a high level of use. Approximately one-half of supplier respondents used
sealed deliveries or pallet security, although this is most likely higher than true industry usage, due to
the nature of the companies that responded to the survey. In addition, pallet weighing was used by
around 20% of supplier respondents.
20
The industry stock loss surveyrevealed significant sectoraldifferences between productmacro-categories and themethods of stock loss.
It would appear the modern, centralised distribution systems used by most suppliers, retailers and
wholesalers provide a high level of procedural controls and physical security measures that minimise
the opportunity for stock losses. Losses were seen to arise where these controls were not followed or
were deliberately and fraudulently abused.
The linkage of personal key performance indicators (KPIs) with loss prevention was seen quite
differently amongst the industry respondents.Within retailers, outside of the security or loss prevention
department, only store operations personnel were unanimously noted as having loss prevention as an
integral part of their KPIs. The next most common were retail
distribution centres (RDCs) to store supply chain management and
the Board of Directors. Half of the responding retailers included
reducing stock loss as a KPI for buying and/or trading personnel.
Outside of those involved in supplier logistics and supply chain
management, the use of stock loss or loss prevention as an integral
part of performance measure was limited to factory operations and DC management. Few suppliers
noted any other department as having KPIs linked to loss prevention.
The methodology employed to record losses is quite different amongst retailers, with no clear
systematic process for particular types of losses evident. Most companies used a mixture of recording
practices (paper and computer); some companies keep no records; and there was one example of totally
computerised record keeping. A similar pattern existed within suppliers, where there was no consistent
approach to recording stock loss, whether it arose through DC operations or goods in transit. If any
consistent approach could be identified, it was that process failures were the most common type of loss
systematically recorded via computer-based systems, whereas theft of goods in transit was most likely to
not be recorded, or be recorded on paper-based systems only.
Improvements in recording and measuring loss and, where appropriate, sharing the information with
trading partners are obvious measures to identify and reduce the incidence of product loss.
The need to work togetherOf particular significance, in an ECR context, was the survey finding of a very low level of collaboration
between supplier and retailer trading partners on the issue of loss prevention—all respondents
recording a negative or occasional/ad hoc response to the question of working with their trading
partners.While most retailers said they worked reasonably regularly with other retailer groups, police
(although with little satisfaction expressed) and security equipment suppliers and consultants, a much
lower response was received in terms of working with
manufacturers—either individually or in joint industry activities.
Suppliers provide a similar contrast. In relation to loss prevention,
nearly 90% of suppliers noted their organisation’s regular or frequent
involvement with third-party logistics providers.While about two-
thirds said they were working with retailers to reduce stock loss,
nearly all recorded this contact as being occasional, ad hoc or as required. Beyond even this low level of
contact, involvement levels and frequency dropped away substantially. On a positive note, one high-risk
company noted the existence of company resources that are allocated to working directly with retailers
to reduce loss.
21
Modern, centralised distributionsystems provide a high level ofprocedural controls and physicalsecurity measures
Supplier and retailerparticipants reported a very lowlevel of collaboration betweentrading partners.
Internal company barriers also appear to exist in tackling stock loss.Whereas loss prevention
departments within retailers were seen as responsible for loss prevention and generally had regular or
high levels of involvement with associated departments, such as retail operations and RDC to stores
processes, participants predominantly recorded having only occasional involvement with the
buying/trading group. Similarly, logistics and operations within suppliers tended to own loss prevention,
however recorded only occasional contact with the departments responsible for marketing and product
design or sales/trade marketing and category management.
When it comes to planning or implementing possible loss prevention solutions involving a trading
partner, this lack of regular and coordinated engagement both internally and externally is likely to be
an impediment.
Plans and preferences for the futureIndustry members, in describing individual company plans and the priorities for engagement with their
trading partners, highlighted a mixture of preventative and reactive activities.
Reducing store-based losses through theft resistant packaging and anti-sweep shelf merchandising
practices were high priority requests of suppliers from retailers. Several retailers also mentioned EAS as
an activity being trialled or considered for implementation and therefore source tagging for EAS
equipment was an upcoming priority. Reinforcing the poor reported collaboration, retailers made only
minor mention of initiatives to educate or provide greater awareness of loss prevention to suppliers or
broader external agencies.
Suppliers noted they would like three broad areas of action from their retailer trading partners, namely
the receival process of goods (at DC and in-store), the rotation of goods (at DC and in-store—shelf life)
and in the merchandise display and security practices in-store. Suppliers also sought process-based
improvements to reduce leakage points along the supply chain and to provide confidence in allowing
open merchandising of high-risk items.
Future supplier initiatives were most commonly related to special or tamperproof packaging and sealing
of deliveries, and in actions that would reduce process failures. Completing somewhat of a mismatch in
supplier and retailer objectives, EAS source tagging was noted by very few respondents as an initiative
to be introduced in the next year.
SummaryThe survey results provide a valuable insight into the size of the stock loss problem in Australasian
supermarkets, the causes of stock loss and the way trading partners are working to reduce the problem,
both within their own organisations and in working together.
It has highlighted significant challenges in minimising the problems that are sucking nearly A$1 billion
per year from the supermarket sector. The results and challenges translate to clear messages on the
need for trading partners to improve the manner in which they are working together along the supply
chain. The clear differences in the future initiatives reported by supermarket suppliers and retailers are
a pointer to the size of the opportunity for a greater partnership in loss prevention.
22

23
The benefits of reducing stock loss4
The benefits of reducing stock lossThe headline results of the ECR Australasia loss prevention project survey highlight the sheer
significance of the reduction opportunity for suppliers and retailers—A$942 million per year being lost
to theft, fraud and process failures.
This project report began by reminding us that ECR is about working together to serve the consumer
better. The survey results have provided an insight into the ways and means that this may occur between
retailer and supplier trading partners. Effective loss prevention strategies will also serve the consumer.
The understanding of consumer demand, stimulated by openly merchandised, visible and available
product, is keenly sought after and can be leveraged to drive the complete supply chain. Consumer
demand can be severely compromised by significant product loss in the supply chain. The benefits of
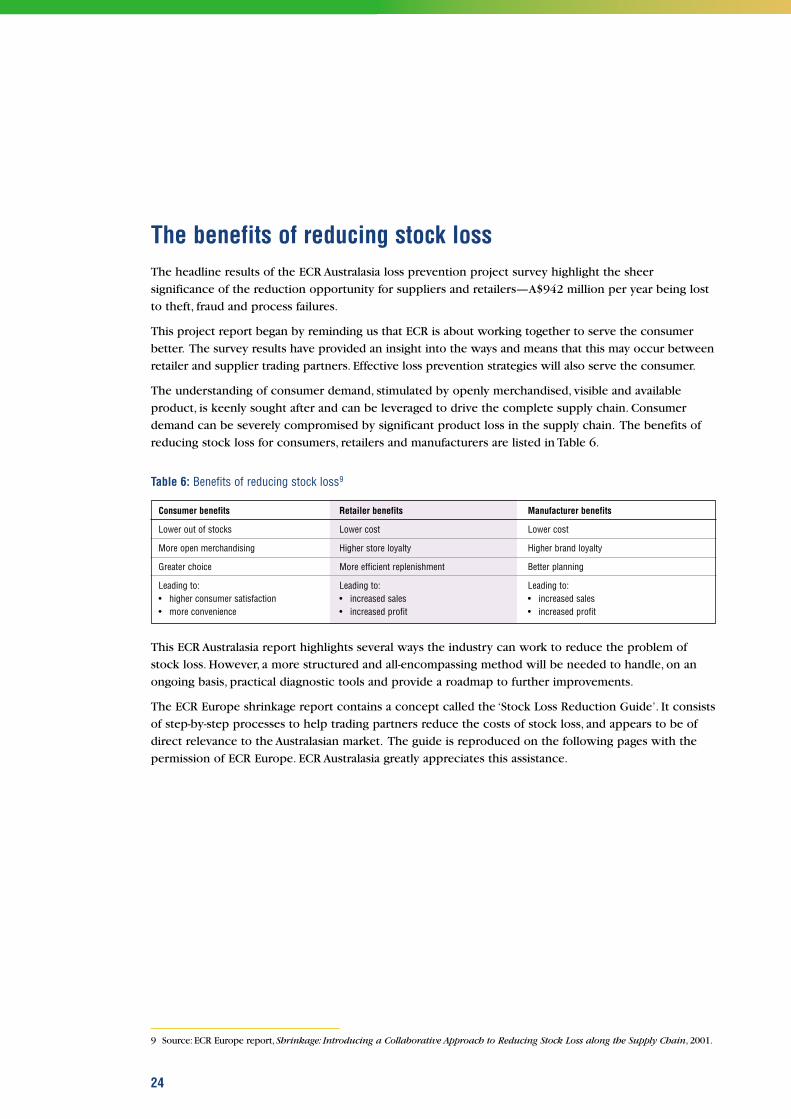
reducing stock loss for consumers, retailers and manufacturers are listed in Table 6.
Table 6: Benefits of reducing stock loss9
Consumer benefits Retailer benefits Manufacturer benefits
Lower out of stocks Lower cost Lower cost
More open merchandising Higher store loyalty Higher brand loyalty
Greater choice More efficient replenishment Better planning
Leading to: Leading to: Leading to:• higher consumer satisfaction • increased sales • increased sales• more convenience • increased profit • increased profit
This ECR Australasia report highlights several ways the industry can work to reduce the problem of
stock loss. However, a more structured and all-encompassing method will be needed to handle, on an
ongoing basis, practical diagnostic tools and provide a roadmap to further improvements.
The ECR Europe shrinkage report contains a concept called the ‘Stock Loss Reduction Guide’. It consists
of step-by-step processes to help trading partners reduce the costs of stock loss, and appears to be of
direct relevance to the Australasian market. The guide is reproduced on the following pages with the
permission of ECR Europe. ECR Australasia greatly appreciates this assistance.
24
9 Source: ECR Europe report, Shrinkage: Introducing a Collaborative Approach to Reducing Stock Loss along the Supply Chain, 2001.

25
Stock Loss Reduction GuideReproduced from the 2001 ECR Europe report on shrinkage.
5
Stock Loss Reduction GuideThe FMCG sector is a highly complex competitive business, with retailers often stocking in excess of
20,000 SKUs and manufacturers managing pan-European supply networks that handle multi-million
numbers of cases of product each year. In addition, companies have a plethora of systems, procedures,
policies and practices in place to move products from the point of manufacture to the point of sale.
Throughout this process there is a multitude of opportunities for products to be either lost, broken,
stolen, eaten, under priced or to go out of date. The challenge is minimising these risks. In theory, the
concept of stock loss reduction is simple. It can be described in terms of the three following steps:
• make stock highly visible so that loss is immediately noticed;
• quickly identify the cause of the loss; and
• implement preventative solutions to resolve the cause of the loss and prevent reoccurrence.
In practice, whilst this concept is simple to describe, its implementation is not. Difficulties in
implementation arise for a wide number of reasons. Not least is the complexity of the sector, the
absence of reliable data on the extent and nature of the problem, and a lack of cooperation both within
companies and between companies in the supply chain to develop shared solutions. But the difficulties
also stem from the lack of a ‘road map’ for undertaking stock loss reduction projects.
For this reason, the key output from the ECR Europe shrinkage project is the ‘Stock Loss Reduction
Guide’ presented here. The guide acts like a manual, describing the overall activities that need to be
undertaken in order to reduce stock loss. This guide consists of a general approach made up of the
steps a company needs to follow, together with techniques and tools to help undertake each phase and
to deal with problems that may be encountered. The general approach that forms the heart of the guide
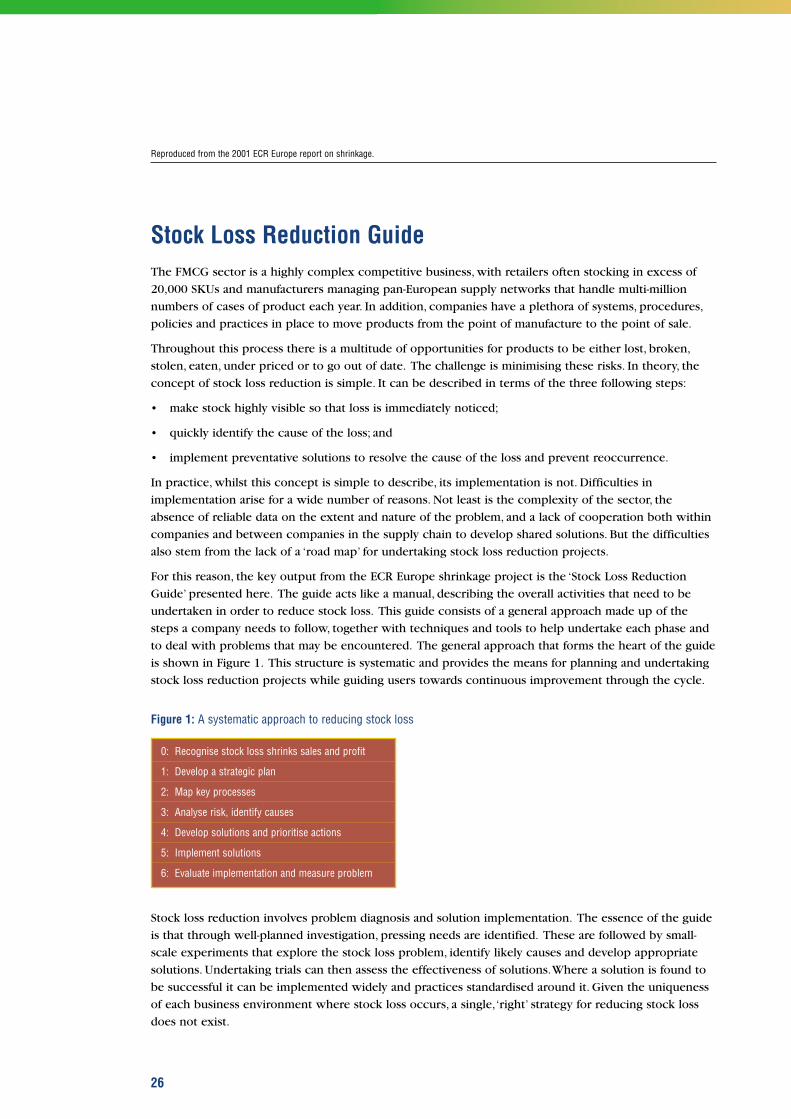
is shown in Figure 1. This structure is systematic and provides the means for planning and undertaking
stock loss reduction projects while guiding users towards continuous improvement through the cycle.
Figure 1: A systematic approach to reducing stock loss
Stock loss reduction involves problem diagnosis and solution implementation. The essence of the guide
is that through well-planned investigation, pressing needs are identified. These are followed by small-
scale experiments that explore the stock loss problem, identify likely causes and develop appropriate
solutions. Undertaking trials can then assess the effectiveness of solutions.Where a solution is found to
be successful it can be implemented widely and practices standardised around it. Given the uniqueness
of each business environment where stock loss occurs, a single,‘right’ strategy for reducing stock loss
does not exist.
26
Reproduced from the 2001 ECR Europe report on shrinkage.
0: Recognise stock loss shrinks sales and profit
1: Develop a strategic plan
2: Map key processes
3: Analyse risk, identify causes
4: Develop solutions and prioritise actions
5: Implement solutions
6: Evaluate implementation and measure problem
Whilst this guide provides a basic structure for practitioners, the approach needs to be tailored to match
prevailing circumstances in order for it to be effective. Knowing the scope for variation, what does and
does not work and the reasons why, comes with learning through experience. It is therefore important
to recognise that reducing stock loss is a long-term and ongoing learning process.
Therefore, success comes from using the systematic approach to building the capability to identify and
understand the causes of shrinkage and reinforce practices that reduce loss. The approach described in
this guide provides a means for involving all company employees in stock loss reduction.
Widespread involvement provides knowledge of current practices, such as stock control, and helps build
commitment that allow changes to be implemented. This involvement stretches from the creation of
radical visions for the supply process, analysis of the current process and its performance through to
process redesign, implementation and review.
To help undertake the steps of the general approach, a number of techniques and tools are recommended.
These have been chosen to aid communication and understanding. This list is not comprehensive and
practitioners should introduce their own tools where they find them to be more useful.
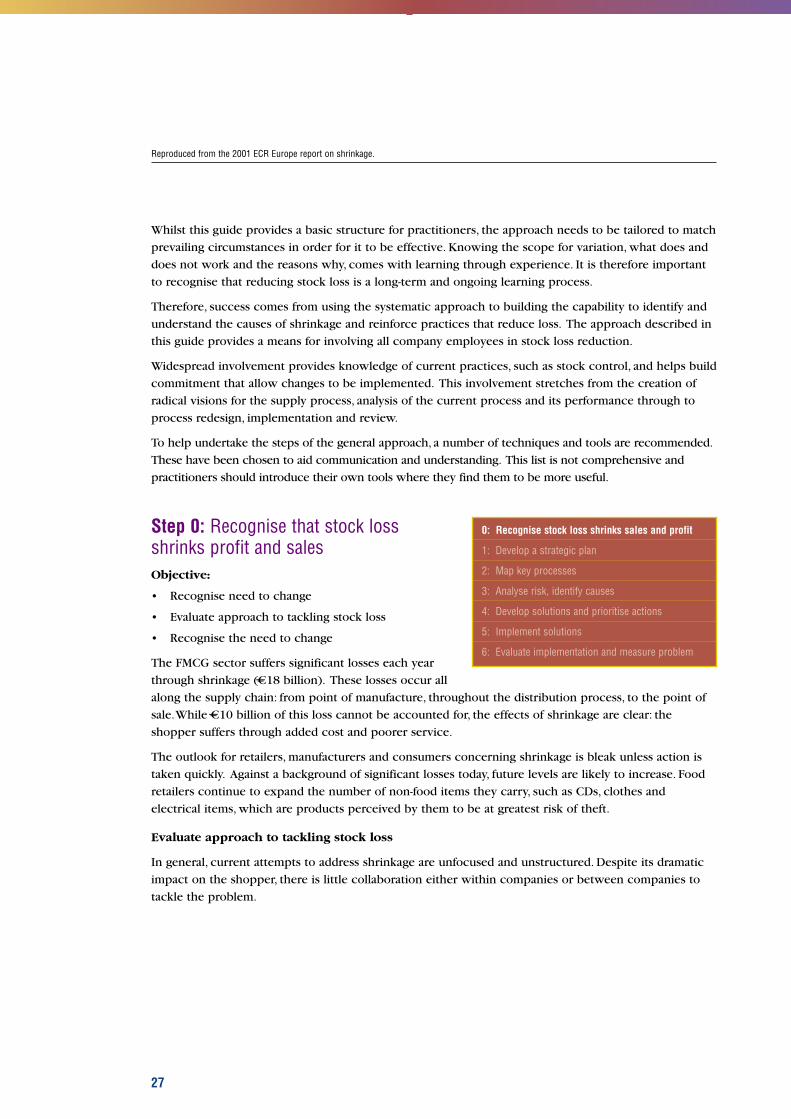
Step 0: Recognise that stock lossshrinks profit and salesObjective:
• Recognise need to change
• Evaluate approach to tackling stock loss
• Recognise the need to change
The FMCG sector suffers significant losses each year
through shrinkage (C—–18 billion). These losses occur all
along the supply chain: from point of manufacture, throughout the distribution process, to the point of
sale.While C—–10 billion of this loss cannot be accounted for, the effects of shrinkage are clear: the
shopper suffers through added cost and poorer service.
The outlook for retailers, manufacturers and consumers concerning shrinkage is bleak unless action is
taken quickly. Against a background of significant losses today, future levels are likely to increase. Food
retailers continue to expand the number of non-food items they carry, such as CDs, clothes and
electrical items, which are products perceived by them to be at greatest risk of theft.
Evaluate approach to tackling stock loss
In general, current attempts to address shrinkage are unfocused and unstructured. Despite its dramatic
impact on the shopper, there is little collaboration either within companies or between companies to
tackle the problem.
27
Reproduced from the 2001 ECR Europe report on shrinkage.
0: Recognise stock loss shrinks sales and profit
1: Develop a strategic plan
2: Map key processes
3: Analyse risk, identify causes
4: Develop solutions and prioritise actions
5: Implement solutions
6: Evaluate implementation and measure problem

Table 7: Conceptual approaches to stock loss reduction
Ad hoc First steps Systematic practices Strategic policy deployment
Philosophy Shrinkage is not an Reactive firefighting with Emphasis on detection Strategically led systemicidentified issue. emphasis on detection. and prevention. approach.
Accountability Nobody is accountable Accountability lies primarily Specialist security/loss All departments have stock for shrinkage. with the store manager. prevention and audit loss accountability and are
departments. measured against their targeas frequently as sales.
Responsibility Shrinkage not seen as a Board sees stock loss as a Specialist security/loss Board reviews stock loss priority therefore nobody ‘cost of doing business’. prevention and audit quarterly. Head of stock losstakes responsibility for it. Responsibility for stock departments but not reports to Board. All
loss is not taken centrally, responsible to the Board. departments have responsibilitybut by local operatives. for stock loss and producing
quarterly reports on it.
Culture Staff not used. Some effort made to use Staff receives ongoing All staff carefully screenedstaff through raising training to tackle shrinkage. and then seen as the mainawareness and encouraging Methods adopted to screen defence against crime. Staff honesty. new staff. used as the main resource
for better prevention.
Current practices are characterised by a heavy reliance upon reactive strategies that are only triggered
when a particular problem becomes intolerable. Such knee-jerk and insular reactions not only fail to
resolve the causes of loss, but they can also have a detrimental effect upon the profitability of a
company. For instance, adopting ‘defensive merchandising’ can cause problems with replenishment and
availability. Hence, the need to wake-up to a different approach.
To help companies review their current stock loss reduction strategy,Tables 7 and 8 can be used as a
benchmarking tool, both in terms of gauging the conceptual approach adopted and the practices
presently employed. This ‘look in the mirror’ is an important step in recognising how a company
compares against best practice, as well as identifying the gap between what is presently done and what
needs to be achieved in the future.
28
Reproduced from the 2001 ECR Europe report on shrinkage.
RatingCategory
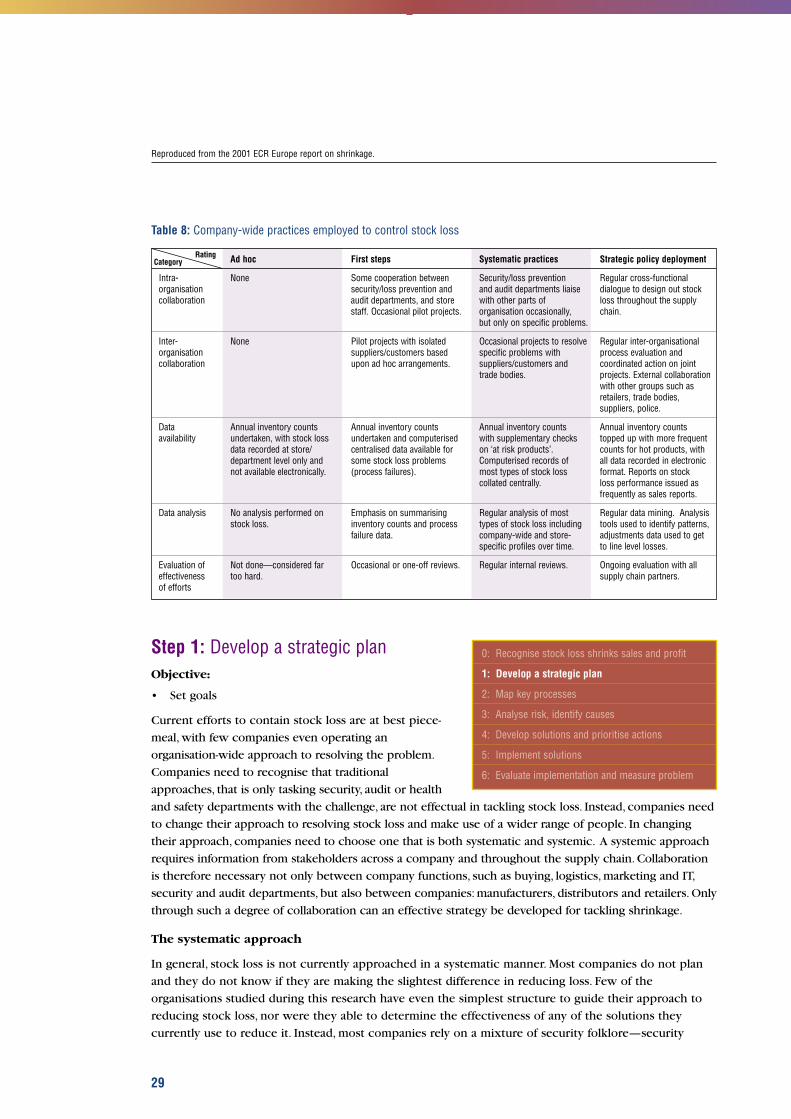
Table 8: Company-wide practices employed to control stock loss
Ad hoc First steps Systematic practices Strategic policy deployment
Intra- None Some cooperation between Security/loss prevention Regular cross-functionalorganisation security/loss prevention and and audit departments liaise dialogue to design out stockcollaboration audit departments, and store with other parts of loss throughout the supply
staff. Occasional pilot projects. organisation occasionally, chain.but only on specific problems.
Inter- None Pilot projects with isolated Occasional projects to resolve Regular inter-organisationalorganisation suppliers/customers based specific problems with process evaluation andcollaboration upon ad hoc arrangements. suppliers/customers and coordinated action on joint
trade bodies. projects. External collaborationwith other groups such asretailers, trade bodies,suppliers, police.
Data Annual inventory counts Annual inventory counts Annual inventory counts Annual inventory countsavailability undertaken, with stock loss undertaken and computerised with supplementary checks topped up with more frequent
data recorded at store/ centralised data available for on ‘at risk products’. counts for hot products, withdepartment level only and some stock loss problems Computerised records of all data recorded in electronic not available electronically. (process failures). most types of stock loss format. Reports on stock
collated centrally. loss performance issued asfrequently as sales reports.
Data analysis No analysis performed on Emphasis on summarising Regular analysis of most Regular data mining. Analysis stock loss. inventory counts and process types of stock loss including tools used to identify patterns,
failure data. company-wide and store- adjustments data used to getspecific profiles over time. to line level losses.
Evaluation of Not done—considered far Occasional or one-off reviews. Regular internal reviews. Ongoing evaluation with alleffectiveness too hard. supply chain partners.of efforts
Step 1: Develop a strategic planObjective:
• Set goals
Current efforts to contain stock loss are at best piece-
meal, with few companies even operating an
organisation-wide approach to resolving the problem.
Companies need to recognise that traditional
approaches, that is only tasking security, audit or health
and safety departments with the challenge, are not effectual in tackling stock loss. Instead, companies need
to change their approach to resolving stock loss and make use of a wider range of people. In changing
their approach, companies need to choose one that is both systematic and systemic. A systemic approach
requires information from stakeholders across a company and throughout the supply chain. Collaboration
is therefore necessary not only between company functions, such as buying, logistics, marketing and IT,
security and audit departments, but also between companies: manufacturers, distributors and retailers. Only
through such a degree of collaboration can an effective strategy be developed for tackling shrinkage.
The systematic approach
In general, stock loss is not currently approached in a systematic manner. Most companies do not plan
and they do not know if they are making the slightest difference in reducing loss. Few of the
organisations studied during this research have even the simplest structure to guide their approach to
reducing stock loss, nor were they able to determine the effectiveness of any of the solutions they
currently use to reduce it. Instead, most companies rely on a mixture of security folklore—security
29
Reproduced from the 2001 ECR Europe report on shrinkage.
RatingCategory
0: Recognise stock loss shrinks sales and profit
1: Develop a strategic plan
2: Map key processes
3: Analyse risk, identify causes
4: Develop solutions and prioritise actions
5: Implement solutions
6: Evaluate implementation and measure problem
guards are a good thing—and a fixation with the ‘latest’ technological solutions.Whilst technological
advancements may lead to new solutions that make inherent sense, the problems they solve are rarely
quantified so the effectiveness of new equipment is often only justified anecdotally and over short
periods of time.
In order to break away from the culture of half-truths and anecdotes, a systematic approach provides the
way for a company to quantify and prioritise its problems, to analyse the causes of these problems and
to direct its available resources to the most cost effective solutions. Finally, the true effectiveness of
these solutions needs to be determined after their implementation and this information then used to
guide future investment.
The first step in the systematic approach to stock loss reduction is planning. Planning is based upon clear,
realistic, attainable objectives with criteria for knowing when these objectives are met. This requires the
project team responsible for delivering reductions to have answers to the following questions:
• What is the supply chain process to be improved
• When does the supply process to be improved start and finish
• What are the goals of the stock loss reduction activity
• When is the date by which some benefits must be felt
• What are the attributes of the ideal supply process
• What are the constraints to improvement
• What are the stock loss threats faced by the company
The answers to these questions guide the project team’s activities towards achieving their goals. Starting the
project in this way is especially important in cross-functional projects where the effectiveness and efficiency
with which project resources are used dramatically improves with upfront investment in planning.
An organisation undertaking a stock loss reduction project will benefit from knowing how its approach
to shrinkage stands in comparison to best practice. This can be determined by making an assessment
against the conceptual approach that a company applies to its stock loss efforts and the practices used
to control loss.
The systemic approach
Effective stock loss reduction requires companies to be systemic by identifying, for the supply chain as a
whole, where problems occur and can best be resolved. Such work requires collaboration along supply
chains between suppliers, distributors and retailers as well as across the FMCG sector as a whole. Only
when internal and external problems are considered together can comprehensive analysis be undertaken
to deliver early, tangible results. Research demonstrates that efforts to reduce stock loss today are not
systemic. Companies are simply not taking advantage of the opportunities to share expertise with either
their competitors or suppliers, or indeed internally. The first phase of this ECR Europe shrinkage project
found that whilst 70% of retailers are working individually with other retailers, only one-half of them are
working in representative groups of retailers to ensure that sector-wide solutions are investigated and
shared. The picture is different in the manufacturing sector, where only 15% of companies are working
with other manufacturers to reduce stock loss and less than two-fifths of companies are working in joint
groups looking at issues of shrinkage.Whilst this paints a picture of low cross-sector collaboration,
cooperation between retailers and manufacturers is even more concerning. Only one-half of all retailers
and manufacturers are working together to tackle stock loss. This graphically demonstrates that problems
affecting the whole of the supply chain are not being addressed in a systemic manner.
30
Reproduced from the 2001 ECR Europe report on shrinkage.
Step 2: Map key processes and measure problemObjectives:
• Performance measure
• Process map
Reducing stock loss begins with a rigorous diagnosis of
the problem. This diagnosis starts by understanding the
nature of the losses and then identifying their causes.
Understanding the current operational system and processes is also the first step in gaining widespread
recognition of the problem and establishing the need to change within an organisation. The act of
creating a business process model that identifies the source of stock loss can develop the critical
momentum required to change existing behaviour. Security-led approaches to reduce stock loss tend to
be based upon better detection of theft. A process-led approach applies process analysis to the stock
loss problem and emphasises prevention. Traditional security strategies can therefore be supplemented
by better understanding of the replenishment supply process. Process mapping and measurement
provide the mechanisms to do this. Preventing system and procedural losses also reduces loss from theft
by removing the opportunity to abuse deficient systems.
Process mapping
Documenting an existing process helps individuals view their work from a process perspective. Often,
existing ways of working have never been described or even viewed as processes.Without the ability to
communicate the need for improvement from this perspective, those who do not view their current
activities in process terms are not likely to readily adopt revolutionary solutions. Process mapping is a
technique used to detail business processes that focuses on the important elements that influence
behaviour, allowing the business to be viewed at a glance. Mapping and measuring a process establishes
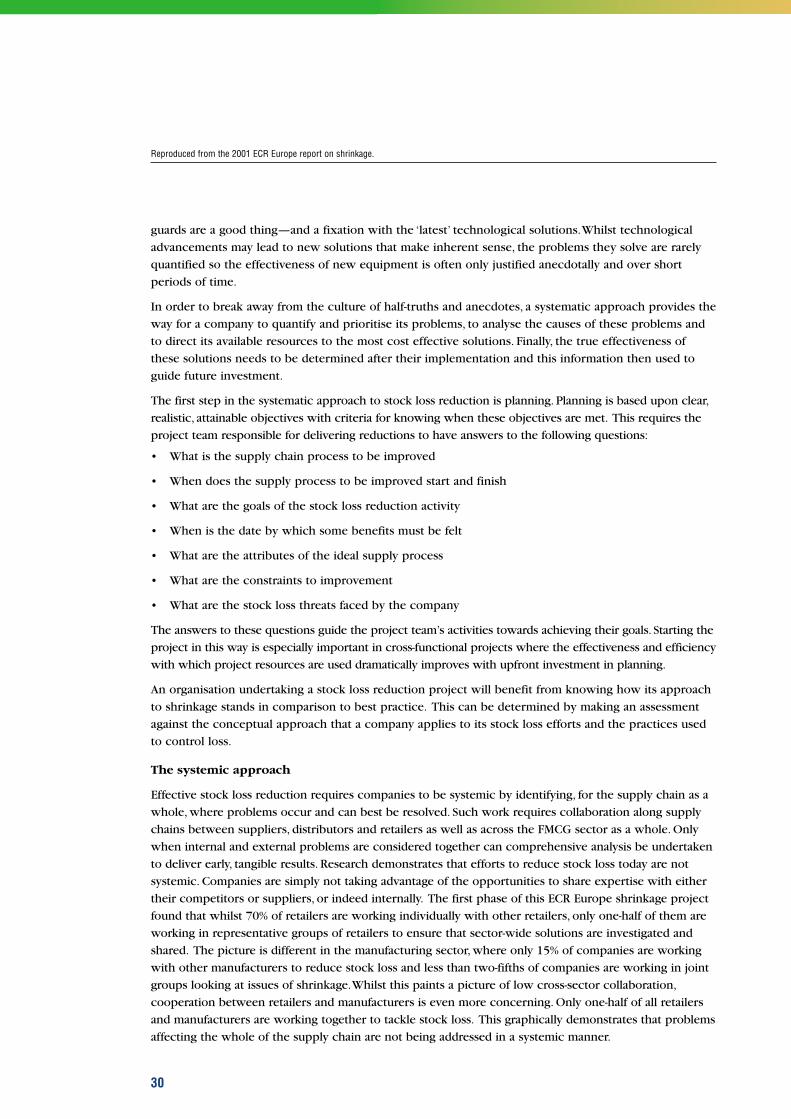
the performance base-line that enables the effectiveness of solutions to be measured. An example of a
top-level supply chain is depicted in Figure 2. This diagram shows two supply chains from Gillette in
the UK to two of their customers, ICA in Sweden and Tesco in Hungary.
31
Reproduced from the 2001 ECR Europe report on shrinkage.
0: Recognise stock loss shrinks sales and profit
1: Develop a strategic plan
2: Map key processes
3: Analyse risk, identify causes
4: Develop solutions and prioritise actions
5: Implement solutions
6: Evaluate implementation and measure problem
Distribution Node
Store
ICA store, Sweden
ICA DC, Sweden Gillette Pack Centre, UKGillette DC, Denmark
Gillette DC, HungaryTesco DC, Hungary
Tesco store, Hungary
Figure 2: Gillette supply chains to ICA,Sweden and Tesco, Hungary
Whilst Figure 2 gives an understanding of the total supply chain, it provides few details. In order to
show more in-depth information, a more rigorous process map is required.
Simple flow charting techniques are often the most appropriate technique to use when process
mapping for the first time. Process maps are developed by physically following products as they pass
along the supply chain. This involves visiting each site that the products pass through and documenting
the steps involved in receiving, storing and dispatching them.
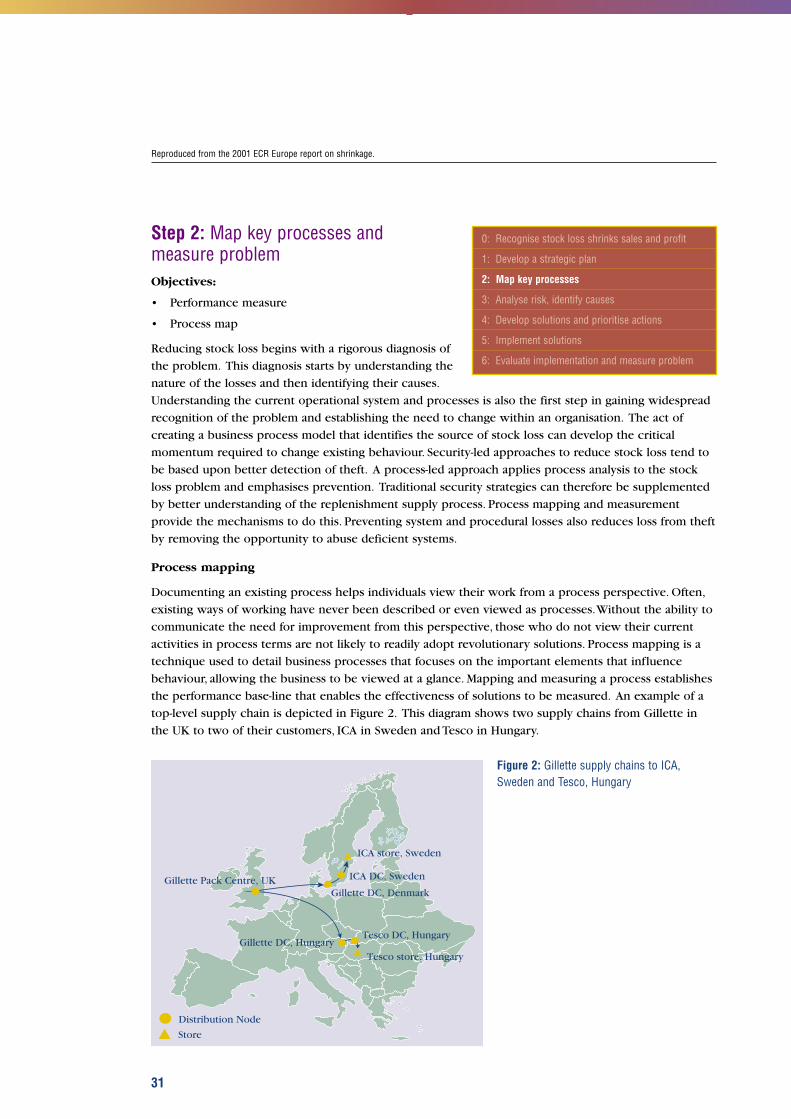
Figure 3 is an example of a process map showing the flow of products through a distribution centre.
This gives an overview of the steps involved in receiving, storing and dispatching goods; therefore it
provides a higher level of detail.
Even when the flow chart does not provide a complete or totally accurate model of a process it is still
able to promote a process-orientated approach to improvements and to communicate understanding.
Figure 3: Distribution centre product flow chart
Hot products
Processes and systems usually contain a wide range of product items. Rather than map all the various
routes taken by all the different items it is appropriate in the initial cycle of analysis to focus on ‘hot
products’. Following the path of these products through the supply chain illustrates general features of
the process and exposes major problems inherent within it.
‘Hot products’ is a concept that many retailers and manufacturers are familiar with, and generally refers to
those products most attractive to thieves. If retailers and manufacturers were to gain a better idea of what
makes a product ‘hot’, then this could, by reducing the levels of the theft element within stock loss, help
dramatically reduce levels of shrinkage within the whole supply chain. Crime prevention specialists are
beginning to acknowledge that preventative methods must not be spread too thinly and should be
32
Reproduced from the 2001 ECR Europe report on shrinkage.
Receive goods
Inbound holding
Check
Holding
Warehouse
Pick
Pack
Check
Dispatch
directed towards areas that will produce the greatest benefit. In the FMCG sector, this means concentrating
activities on the products that are most at risk of theft. The hot products concept offers a framework of
factors that affect the likelihood of a product being taken by shop thieves or members of staff.
Hot products are those that are ‘CRAVED’ by thieves, and possess the following characteristics:
• Concealable • Valuable
• Removable • Enjoyable
• Available • Disposable
At the moment, the list of hot products a retailer may stock or a manufacturer produce are usually based
upon perceptions of the security department, as methods are not always in place to analyse the true
nature of stock loss. As shown earlier, retailers can only identify 41% of their losses and manufacturers
are aware of 59% of the losses they suffer. However, evidence from the ECR Europe survey finds that
non-food products are perceived to be most at risk of theft, particularly; tobacco goods, videos, CDs,
DVDs, beers, wines and spirits, health and beauty products and electrical goods. These items
increasingly feature within FMCG stores, so the need to control their loss may be the trigger for retailers
and their suppliers to work collaboratively to deal with this problem.While the concept of hot products
refers mainly to items that are stolen, lessons learnt from closely monitoring their progress throughout
the entire supply chain may have more generalised benefits for improving the processes used to move
these, and all other products.
Measuring the problem
It was found that currently within the FMCG sector, most retailers keep records of supplier fraud and
process failures, but few keep computerised records of internal and external theft, either at a company
or store level. Manufacturers were found to keep computerised records of process failures, but few
recorded any form of theft on a computerised system. The majority kept either no record whatsoever
or only paper files. It is only through the use of computerised databases that trends can be identified
and a more information-led strategic approach can be adopted to deal with all the elements that
account for shrinkage.
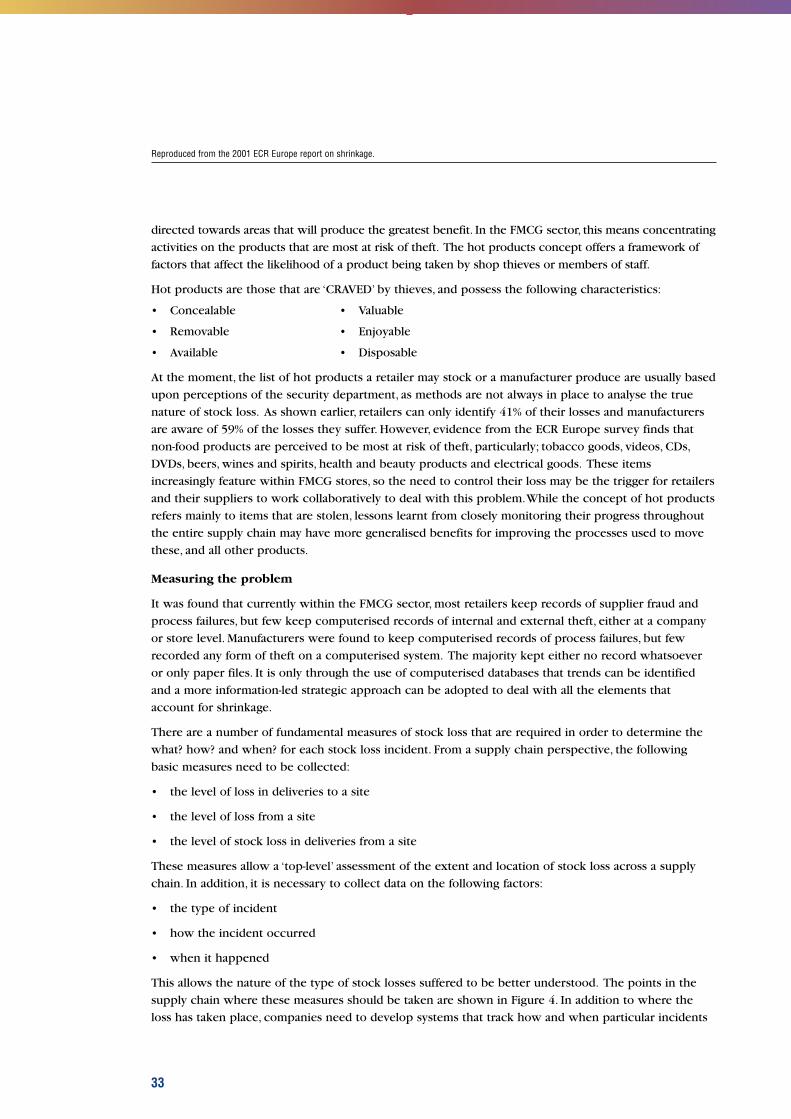
There are a number of fundamental measures of stock loss that are required in order to determine the
what? how? and when? for each stock loss incident. From a supply chain perspective, the following
basic measures need to be collected:
• the level of loss in deliveries to a site
• the level of loss from a site
• the level of stock loss in deliveries from a site
These measures allow a ‘top-level’ assessment of the extent and location of stock loss across a supply
chain. In addition, it is necessary to collect data on the following factors:
• the type of incident
• how the incident occurred
• when it happened
This allows the nature of the type of stock losses suffered to be better understood. The points in the
supply chain where these measures should be taken are shown in Figure 4. In addition to where the
loss has taken place, companies need to develop systems that track how and when particular incidents
33
Reproduced from the 2001 ECR Europe report on shrinkage.
occur, and they need to do this for all types of stock loss. Companies need to develop an approach that
is systematic and part of an ongoing process for collecting and collating timely and useful information
that describes patterns, trends and information on stock loss throughout the supply chain—from first
delivery to final checkout.
Figure 4: Points of measurement across the FMCG supply chain
Step 3: Analyse risk, identify causes and prioritise actions Objectives:
• Understand process structure and flow
• Identify most significant causes of loss
Having mapped and measured the current operation,
this data should be analysed to understand and describe
exactly what is wrong. Having understood this, the
causes of problems can be identified.
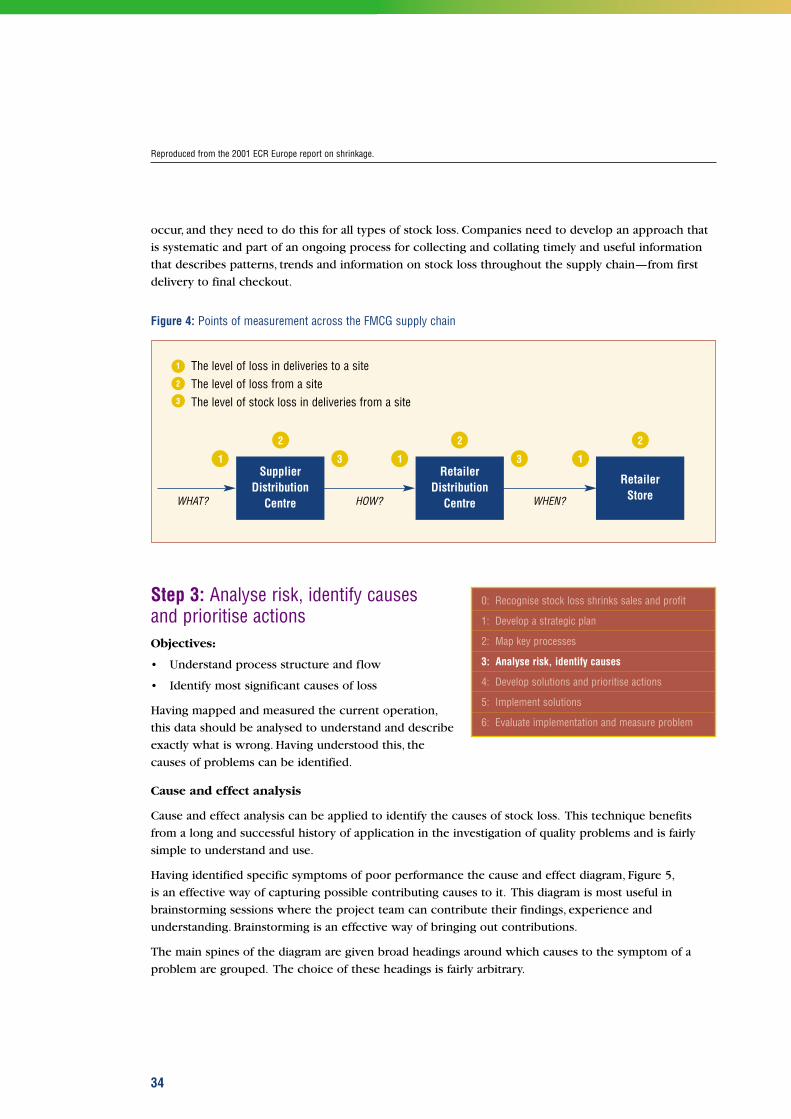
Cause and effect analysis
Cause and effect analysis can be applied to identify the causes of stock loss. This technique benefits
from a long and successful history of application in the investigation of quality problems and is fairly
simple to understand and use.
Having identified specific symptoms of poor performance the cause and effect diagram, Figure 5,
is an effective way of capturing possible contributing causes to it. This diagram is most useful in
brainstorming sessions where the project team can contribute their findings, experience and
understanding. Brainstorming is an effective way of bringing out contributions.
The main spines of the diagram are given broad headings around which causes to the symptom of a
problem are grouped. The choice of these headings is fairly arbitrary.
34
Reproduced from the 2001 ECR Europe report on shrinkage.
0: Recognise stock loss shrinks sales and profit
1: Develop a strategic plan
2: Map key processes
3: Analyse risk, identify causes
4: Develop solutions and prioritise actions
5: Implement solutions
6: Evaluate implementation and measure problem
SupplierDistribution
Centre
1 3
2
RetailerDistribution
Centre
1 3
2
Retailer Store
1
2
The level of loss in deliveries to a siteThe level of loss from a siteThe level of stock loss in deliveries from a site
1
2
3
HOW? WHEN?WHAT?
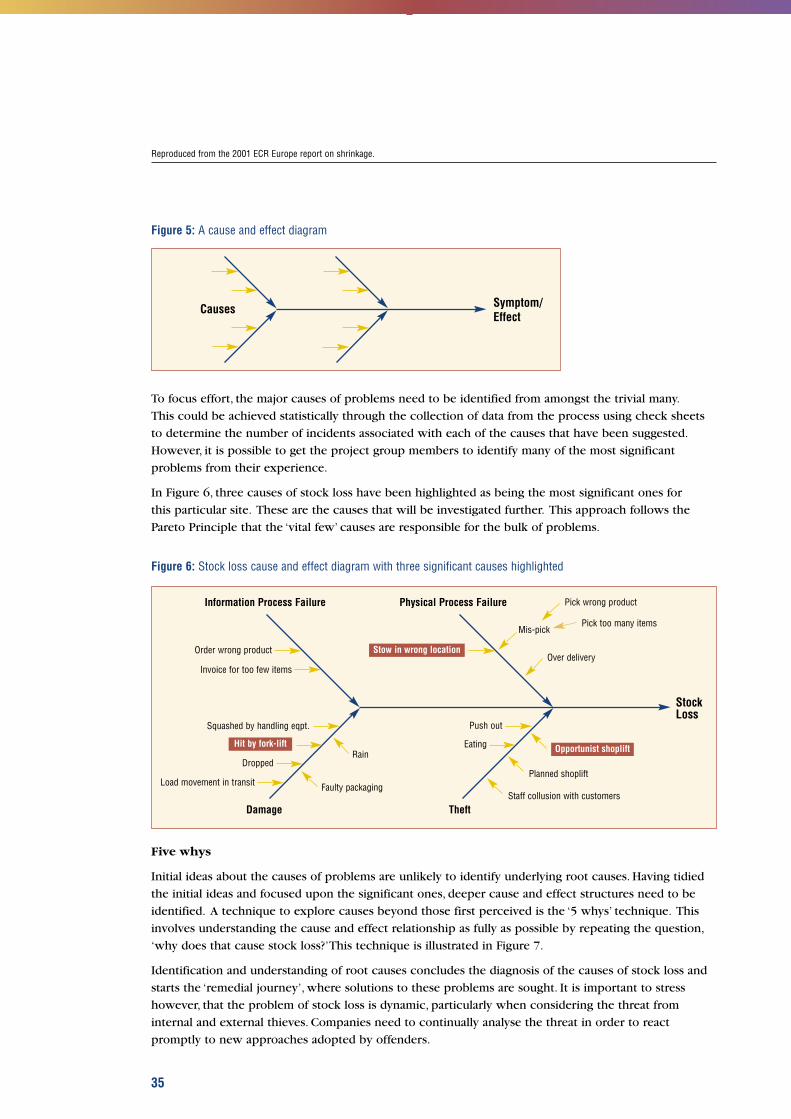
Figure 5: A cause and effect diagram
To focus effort, the major causes of problems need to be identified from amongst the trivial many.
This could be achieved statistically through the collection of data from the process using check sheets
to determine the number of incidents associated with each of the causes that have been suggested.
However, it is possible to get the project group members to identify many of the most significant
problems from their experience.
In Figure 6, three causes of stock loss have been highlighted as being the most significant ones for
this particular site. These are the causes that will be investigated further. This approach follows the
Pareto Principle that the ‘vital few’ causes are responsible for the bulk of problems.
Figure 6: Stock loss cause and effect diagram with three significant causes highlighted
Five whys
Initial ideas about the causes of problems are unlikely to identify underlying root causes. Having tidied
the initial ideas and focused upon the significant ones, deeper cause and effect structures need to be
identified. A technique to explore causes beyond those first perceived is the ‘5 whys’ technique. This
involves understanding the cause and effect relationship as fully as possible by repeating the question,
‘why does that cause stock loss?’This technique is illustrated in Figure 7.
Identification and understanding of root causes concludes the diagnosis of the causes of stock loss and
starts the ‘remedial journey’, where solutions to these problems are sought. It is important to stress
however, that the problem of stock loss is dynamic, particularly when considering the threat from
internal and external thieves. Companies need to continually analyse the threat in order to react
promptly to new approaches adopted by offenders.
35
Reproduced from the 2001 ECR Europe report on shrinkage.
Causes Symptom/Effect
StockLoss
Order wrong product
Invoice for too few items
Squashed by handling eqpt.
Dropped
Load movement in transit
Rain
Faulty packagingStaff collusion with customers
Planned shoplift
Opportunist shopliftHit by fork-lift
Stow in wrong location
Information Process Failure Physical Process Failure Pick wrong product
Pick too many items
Over delivery
Mis-pick
Damage Theft
Push out
Eating
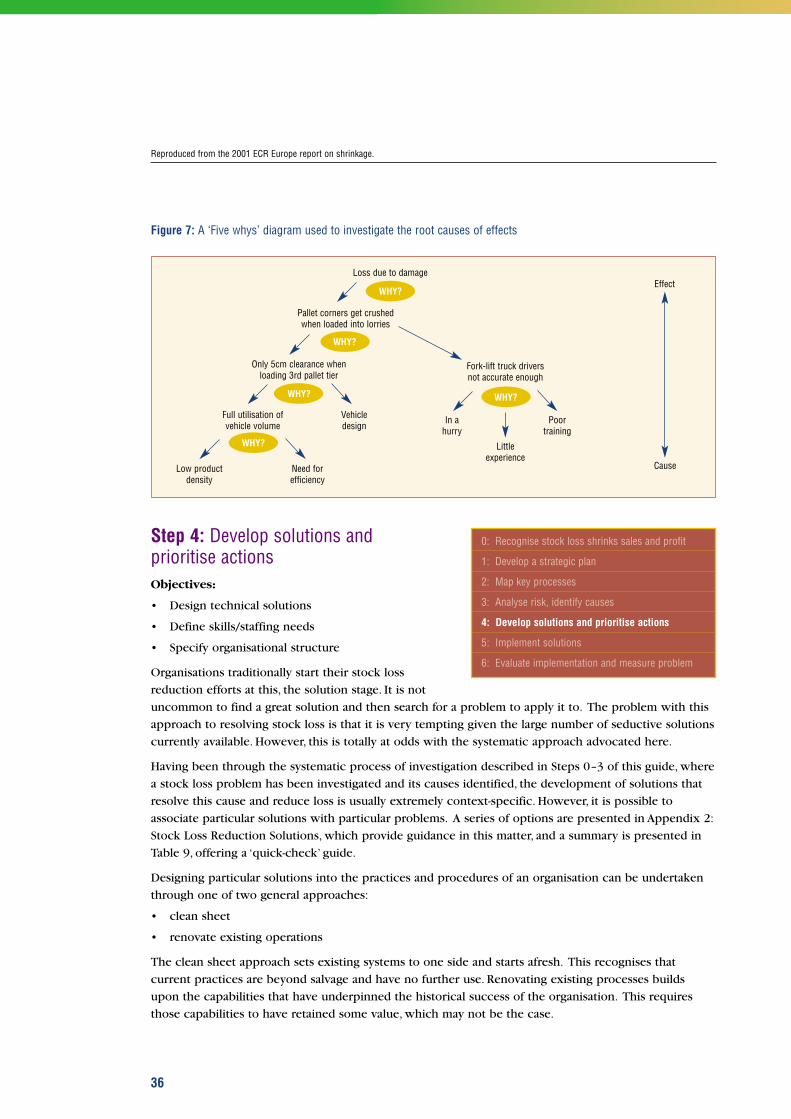
Figure 7: A ‘Five whys’ diagram used to investigate the root causes of effects
Step 4: Develop solutions and prioritise actionsObjectives:
• Design technical solutions
• Define skills/staffing needs
• Specify organisational structure
Organisations traditionally start their stock loss
reduction efforts at this, the solution stage. It is not
uncommon to find a great solution and then search for a problem to apply it to. The problem with this
approach to resolving stock loss is that it is very tempting given the large number of seductive solutions
currently available. However, this is totally at odds with the systematic approach advocated here.
Having been through the systematic process of investigation described in Steps 0–3 of this guide, where
a stock loss problem has been investigated and its causes identified, the development of solutions that
resolve this cause and reduce loss is usually extremely context-specific. However, it is possible to
associate particular solutions with particular problems. A series of options are presented in Appendix 2:
Stock Loss Reduction Solutions, which provide guidance in this matter, and a summary is presented in
Table 9, offering a ‘quick-check’ guide.
Designing particular solutions into the practices and procedures of an organisation can be undertaken
through one of two general approaches:
• clean sheet
• renovate existing operations
The clean sheet approach sets existing systems to one side and starts afresh. This recognises that
current practices are beyond salvage and have no further use. Renovating existing processes builds
upon the capabilities that have underpinned the historical success of the organisation. This requires
those capabilities to have retained some value, which may not be the case.
36
Reproduced from the 2001 ECR Europe report on shrinkage.
0: Recognise stock loss shrinks sales and profit
1: Develop a strategic plan
2: Map key processes
3: Analyse risk, identify causes
4: Develop solutions and prioritise actions
5: Implement solutions
6: Evaluate implementation and measure problem
Loss due to damage
WHY?
WHY?
WHY?
WHY?
Low productdensity
Need forefficiency
Full utilisation ofvehicle volume
Vehicledesign
Only 5cm clearance whenloading 3rd pallet tier
Pallet corners get crushedwhen loaded into lorries
Fork-lift truck driversnot accurate enough
Poortraining
Littleexperience
In ahurry
Cause
Effect
WHY?
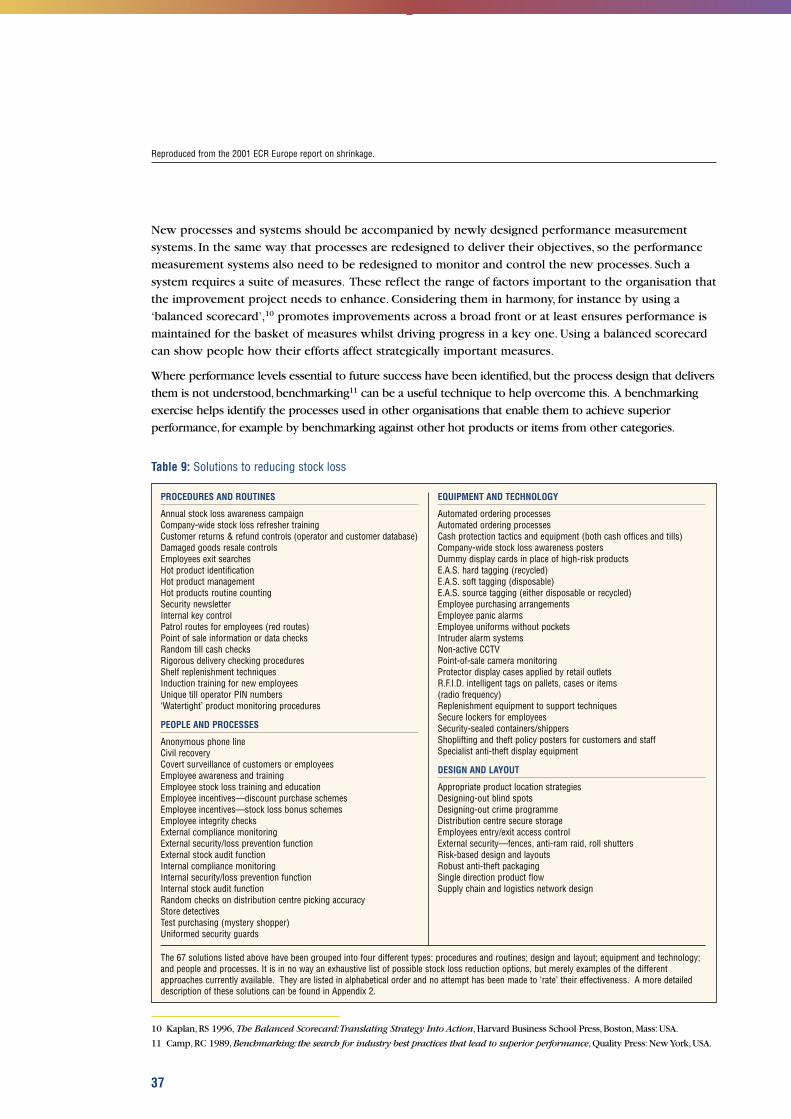
New processes and systems should be accompanied by newly designed performance measurement
systems. In the same way that processes are redesigned to deliver their objectives, so the performance
measurement systems also need to be redesigned to monitor and control the new processes. Such a
system requires a suite of measures. These reflect the range of factors important to the organisation that
the improvement project needs to enhance. Considering them in harmony, for instance by using a
‘balanced scorecard’,10 promotes improvements across a broad front or at least ensures performance is
maintained for the basket of measures whilst driving progress in a key one. Using a balanced scorecard
can show people how their efforts affect strategically important measures.
Where performance levels essential to future success have been identified,but the process design that delivers
them is not understood,benchmarking11 can be a useful technique to help overcome this. A benchmarking
exercise helps identify the processes used in other organisations that enable them to achieve superior
performance, for example by benchmarking against other hot products or items from other categories.
Table 9: Solutions to reducing stock loss
37
Reproduced from the 2001 ECR Europe report on shrinkage.
PROCEDURES AND ROUTINES
Annual stock loss awareness campaignCompany-wide stock loss refresher trainingCustomer returns & refund controls (operator and customer database)Damaged goods resale controlsEmployees exit searchesHot product identificationHot product managementHot products routine countingSecurity newsletterInternal key controlPatrol routes for employees (red routes)Point of sale information or data checksRandom till cash checksRigorous delivery checking proceduresShelf replenishment techniquesInduction training for new employeesUnique till operator PIN numbers‘Watertight’ product monitoring procedures
PEOPLE AND PROCESSES
Anonymous phone lineCivil recoveryCovert surveillance of customers or employeesEmployee awareness and trainingEmployee stock loss training and educationEmployee incentives—discount purchase schemesEmployee incentives—stock loss bonus schemesEmployee integrity checksExternal compliance monitoringExternal security/loss prevention functionExternal stock audit functionInternal compliance monitoringInternal security/loss prevention functionInternal stock audit functionRandom checks on distribution centre picking accuracyStore detectivesTest purchasing (mystery shopper)Uniformed security guards
EQUIPMENT AND TECHNOLOGY
Automated ordering processesAutomated ordering processesCash protection tactics and equipment (both cash offices and tills)Company-wide stock loss awareness postersDummy display cards in place of high-risk productsE.A.S. hard tagging (recycled)E.A.S. soft tagging (disposable)E.A.S. source tagging (either disposable or recycled)Employee purchasing arrangementsEmployee panic alarmsEmployee uniforms without pocketsIntruder alarm systemsNon-active CCTVPoint-of-sale camera monitoringProtector display cases applied by retail outletsR.F.I.D. intelligent tags on pallets, cases or items(radio frequency)Replenishment equipment to support techniquesSecure lockers for employeesSecurity-sealed containers/shippersShoplifting and theft policy posters for customers and staffSpecialist anti-theft display equipment
DESIGN AND LAYOUT
Appropriate product location strategiesDesigning-out blind spotsDesigning-out crime programmeDistribution centre secure storageEmployees entry/exit access controlExternal security—fences, anti-ram raid, roll shuttersRisk-based design and layoutsRobust anti-theft packagingSingle direction product flowSupply chain and logistics network design
The 67 solutions listed above have been grouped into four different types: procedures and routines; design and layout; equipment and technology;and people and processes. It is in no way an exhaustive list of possible stock loss reduction options, but merely examples of the differentapproaches currently available. They are listed in alphabetical order and no attempt has been made to ‘rate’ their effectiveness. A more detaileddescription of these solutions can be found in Appendix 2.
10 Kaplan,RS 1996, The Balanced Scorecard:Translating Strategy Into Action,Harvard Business School Press,Boston,Mass:USA.
11 Camp,RC 1989,Benchmarking: the search for industry best practices that lead to superior performance,Quality Press:New York,USA.
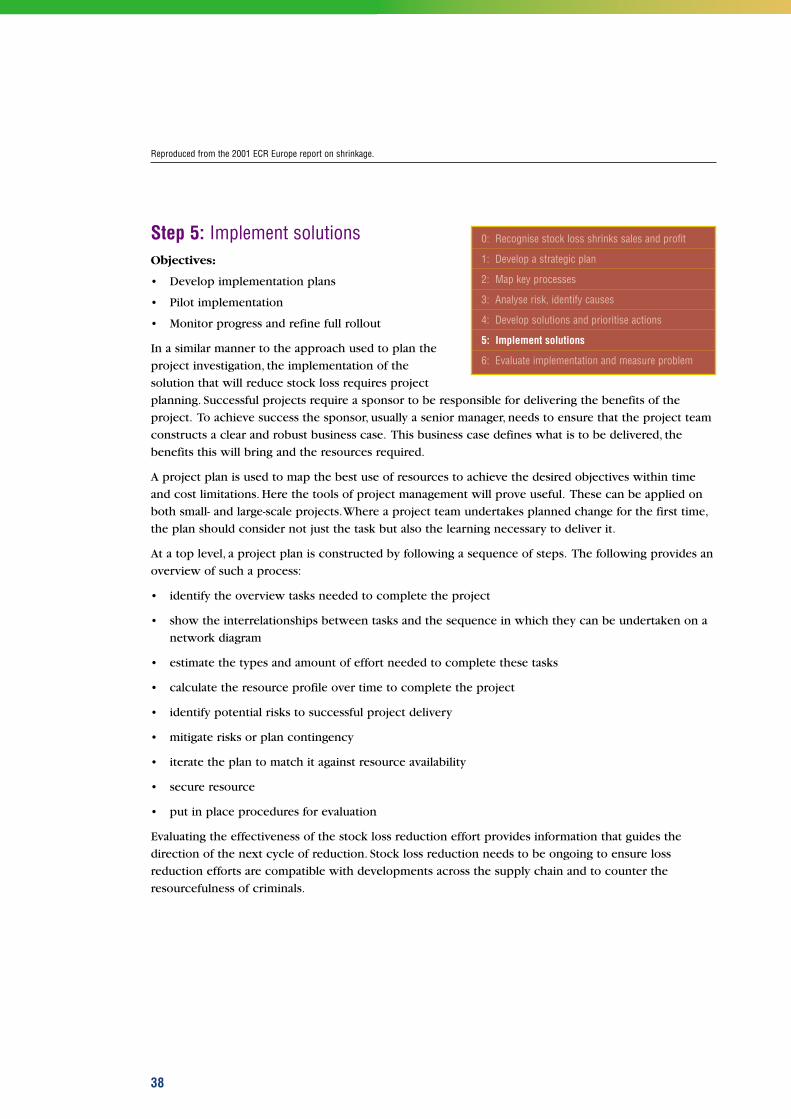
Step 5: Implement solutionsObjectives:
• Develop implementation plans
• Pilot implementation
• Monitor progress and refine full rollout
In a similar manner to the approach used to plan the
project investigation, the implementation of the
solution that will reduce stock loss requires project
planning. Successful projects require a sponsor to be responsible for delivering the benefits of the
project. To achieve success the sponsor, usually a senior manager, needs to ensure that the project team
constructs a clear and robust business case. This business case defines what is to be delivered, the
benefits this will bring and the resources required.
A project plan is used to map the best use of resources to achieve the desired objectives within time
and cost limitations. Here the tools of project management will prove useful. These can be applied on
both small- and large-scale projects.Where a project team undertakes planned change for the first time,
the plan should consider not just the task but also the learning necessary to deliver it.
At a top level, a project plan is constructed by following a sequence of steps. The following provides an
overview of such a process:
• identify the overview tasks needed to complete the project
• show the interrelationships between tasks and the sequence in which they can be undertaken on a
network diagram
• estimate the types and amount of effort needed to complete these tasks
• calculate the resource profile over time to complete the project
• identify potential risks to successful project delivery
• mitigate risks or plan contingency
• iterate the plan to match it against resource availability
• secure resource
• put in place procedures for evaluation
Evaluating the effectiveness of the stock loss reduction effort provides information that guides the
direction of the next cycle of reduction. Stock loss reduction needs to be ongoing to ensure loss
reduction efforts are compatible with developments across the supply chain and to counter the
resourcefulness of criminals.
38
Reproduced from the 2001 ECR Europe report on shrinkage.
0: Recognise stock loss shrinks sales and profit
1: Develop a strategic plan
2: Map key processes
3: Analyse risk, identify causes
4: Develop solutions and prioritise actions
5: Implement solutions
6: Evaluate implementation and measure problem
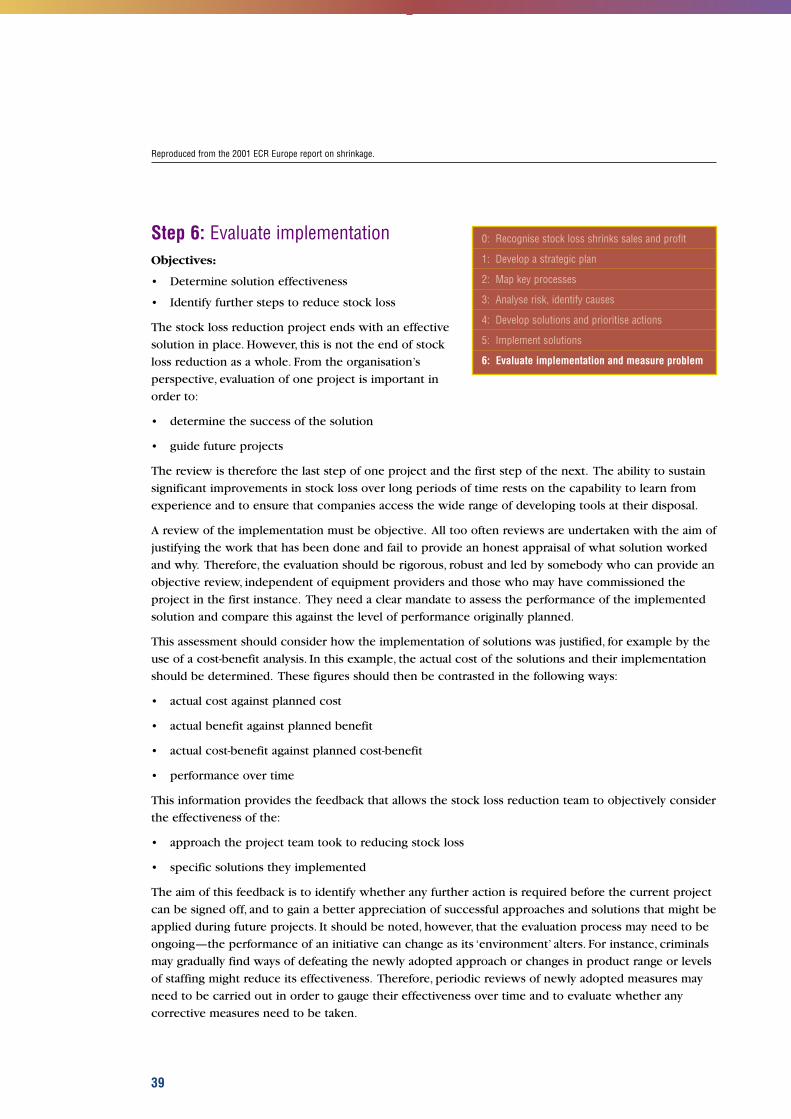
Step 6: Evaluate implementationObjectives:
• Determine solution effectiveness
• Identify further steps to reduce stock loss
The stock loss reduction project ends with an effective
solution in place. However, this is not the end of stock
loss reduction as a whole. From the organisation’s
perspective, evaluation of one project is important in
order to:
• determine the success of the solution
• guide future projects
The review is therefore the last step of one project and the first step of the next. The ability to sustain
significant improvements in stock loss over long periods of time rests on the capability to learn from
experience and to ensure that companies access the wide range of developing tools at their disposal.
A review of the implementation must be objective. All too often reviews are undertaken with the aim of
justifying the work that has been done and fail to provide an honest appraisal of what solution worked
and why. Therefore, the evaluation should be rigorous, robust and led by somebody who can provide an
objective review, independent of equipment providers and those who may have commissioned the
project in the first instance. They need a clear mandate to assess the performance of the implemented
solution and compare this against the level of performance originally planned.
This assessment should consider how the implementation of solutions was justified, for example by the
use of a cost-benefit analysis. In this example, the actual cost of the solutions and their implementation
should be determined. These figures should then be contrasted in the following ways:
• actual cost against planned cost
• actual benefit against planned benefit
• actual cost-benefit against planned cost-benefit
• performance over time
This information provides the feedback that allows the stock loss reduction team to objectively consider
the effectiveness of the:
• approach the project team took to reducing stock loss
• specific solutions they implemented
The aim of this feedback is to identify whether any further action is required before the current project
can be signed off, and to gain a better appreciation of successful approaches and solutions that might be
applied during future projects. It should be noted, however, that the evaluation process may need to be
ongoing—the performance of an initiative can change as its ‘environment’ alters. For instance, criminals
may gradually find ways of defeating the newly adopted approach or changes in product range or levels
of staffing might reduce its effectiveness. Therefore, periodic reviews of newly adopted measures may
need to be carried out in order to gauge their effectiveness over time and to evaluate whether any
corrective measures need to be taken.
39
Reproduced from the 2001 ECR Europe report on shrinkage.
0: Recognise stock loss shrinks sales and profit
1: Develop a strategic plan
2: Map key processes
3: Analyse risk, identify causes
4: Develop solutions and prioritise actions
5: Implement solutions
6: Evaluate implementation and measure problem

40
41
Australasian case studies and tools to reduce stock loss
6

Australasian case studies and tools to reduce stock lossIn addition to assessing the size of the problem, the loss prevention
project seeks to highlight the points in the supply chain at which
stock loss occurs and the methods and root causes of the loss, so
ideas may be generated and actions taken by trading partners
individually and together to reduce its incidence.While recognising
loss also occurs through process failures, and the industry survey
confirmed this component to be just under 40% of all loss, the focus
is on reducing theft and fraud.
ECR Australasia reviewed the joint extended supply chain, to highlight
the risk areas and report on best practice and local case study
examples. The extended supply chain was broken down into three distinct areas:
• the distribution centre and transport
• the retail store
• the external environment
The distribution centre and transport does not distinguish between supplier or retail ownership,
believing the core processes to be the same. The retail store, as reported throughout this study, is the
highest risk area for stock loss. It is where tightly controlled processes and procedural controls come
into contact with an unpredictable variable—the consumer—and, in doing so, relaxes many stock loss
controls to allow the consumer to see the products and make their
product choice. The external environment includes the interface
with legislative and law enforcement bodies to provide and enforce
suitable deterrents and programs that will minimise stock loss.
As defined earlier in this report, loss prevention is a collective term
for activities put in place to protect company assets (physical and
human) and profitability.
Effective loss prevention is said to begin with the application of, and
adherence to, company policies and procedures.
While supplier survey respondents did not report the significant
existence of separate loss prevention departments, those responsible
for loss prevention within suppliers, reported widespread use of
procedural and physical environmental security measures common to
retailer operations. Missing were those activities associated with retail
stores and investigative loss prevention resources.
A very large retailer (supermarket or other retail) may have loss
prevention operations that resemble mini police departments, with
criminologists, analysts, physical security, warehouse security, transport
security, investigative personnel, and covert and overt operatives.12 The
Australasian retailers that responded to the industry survey identified
many of these elements as a part of their loss prevention activities.
42
Loss prevention is a mindset which:• fosters awareness and
adherence to policies andprocedures
• is built on ethical standards• supports positive behaviour
to eliminate loss and waste(Source: Woolworths NZ)
12 The Investigator publication,“Profit Making or Profit Taking”, October–December 2000, Denny Van-Maanenberg.
Global positioning systems(GPS), an emerging lossprevention tool The scheduling of transport anddelivery runs is kept to tightlymapped routes and timetables,to manage transport efficiencyand health and safety goals.Theft often relies on thirdparties and non-authorisedstock movement. This is notalways with those involved inthe distribution of goods. Forhighly valuable or disposableitems, goods in transit areattractive targets for unrelatedcriminal third parties. GPS arebecoming increasingly used asa management, safety andinvestigative tool in transportand distribution.
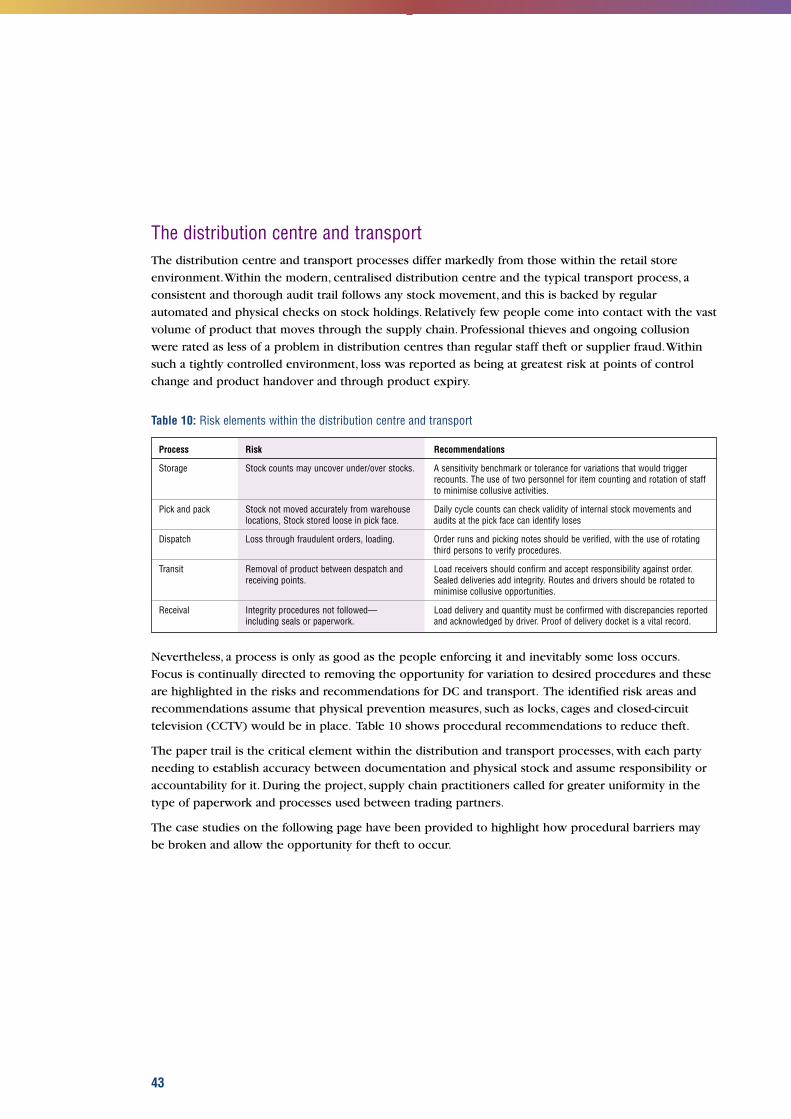
The distribution centre and transportThe distribution centre and transport processes differ markedly from those within the retail store
environment.Within the modern, centralised distribution centre and the typical transport process, a
consistent and thorough audit trail follows any stock movement, and this is backed by regular
automated and physical checks on stock holdings. Relatively few people come into contact with the vast
volume of product that moves through the supply chain. Professional thieves and ongoing collusion
were rated as less of a problem in distribution centres than regular staff theft or supplier fraud.Within
such a tightly controlled environment, loss was reported as being at greatest risk at points of control
change and product handover and through product expiry.
Table 10: Risk elements within the distribution centre and transport
Process Risk Recommendations
Storage Stock counts may uncover under/over stocks. A sensitivity benchmark or tolerance for variations that would triggerrecounts. The use of two personnel for item counting and rotation of staffto minimise collusive activities.
Pick and pack Stock not moved accurately from warehouse Daily cycle counts can check validity of internal stock movements andlocations, Stock stored loose in pick face. audits at the pick face can identify loses
Dispatch Loss through fraudulent orders, loading. Order runs and picking notes should be verified, with the use of rotatingthird persons to verify procedures.
Transit Removal of product between despatch and Load receivers should confirm and accept responsibility against order.receiving points. Sealed deliveries add integrity. Routes and drivers should be rotated to
minimise collusive opportunities.
Receival Integrity procedures not followed— Load delivery and quantity must be confirmed with discrepancies reportedincluding seals or paperwork. and acknowledged by driver. Proof of delivery docket is a vital record.
Nevertheless, a process is only as good as the people enforcing it and inevitably some loss occurs.
Focus is continually directed to removing the opportunity for variation to desired procedures and these
are highlighted in the risks and recommendations for DC and transport. The identified risk areas and
recommendations assume that physical prevention measures, such as locks, cages and closed-circuit
television (CCTV) would be in place. Table 10 shows procedural recommendations to reduce theft.
The paper trail is the critical element within the distribution and transport processes, with each party
needing to establish accuracy between documentation and physical stock and assume responsibility or
accountability for it. During the project, supply chain practitioners called for greater uniformity in the
type of paperwork and processes used between trading partners.
The case studies on the following page have been provided to highlight how procedural barriers may
be broken and allow the opportunity for theft to occur.
43

44
Case study oneCollusion between the various parties in the supply chain provides the framework for the theft cycle. In combatingcollusion there is a need for the companies concerned to take a collaborative approach to identifying the perpetrators,reviewing processes and practices, and developing strategies to manage, mitigate or eliminate the risks. This requiresclose cooperation between company security and investigation teams, internal audit departments and, where necessary,law enforcement. By adopting a systematic, structured and planned approach, the group can review and target thepertinent risk areas within the supply chain. In this example, a transport driver was identified as moving illicit palletloads of product from a distribution centre to a receiver who would then on-sell the stolen product.
The theft involved collusion between the driver and the distribution shipping staff. The latter had responsibility fordirecting the loading of the truck and in conjunction with the driver, verifying the accuracy of the load. This was the finalcheck with the site security performing no independent verification to ensure the legitimacy of the load. For thesereasons, there was very little risk that the movement of the additional stock would be detected.
The key internal factors contributing to this situation were the lack of independence in the checking process; and anegligible asset protection role being performed by the security officers at the perimeter gate; combined with thepotential collusion with the security officers. The major external factor was the demand that existed for illegally sourcedmaterials and this demand drove the offenders to manipulate the processes for their own gain. Ensuring that all parties,including the receiver, are arrested as part of any police investigations and that cost recovery strategies are taken againstthe perpetrators can reduce the ‘black market’ demand.
Case study twoCustomers can contribute to creating an environment conducive to theft by failing to take adequate accountability for theproduct they receive. Inattention during the delivery process, or a misplaced trust in some deliverers can contribute tothe activity of ‘skimming’, which is the short supply of products to the customer. For example, a transport driver wasidentified as regularly supplying stolen product to a third party receiver. Investigations ruled out theft from thedistribution site and, while under surveillance, it was noted that the driver was delivering sizeable quantities of productto the third party. These products were being removed from the orders of high volume customers. The investigationresulted in the arrest of both the driver and the customer, with the latter admitting he had received product of similarquantities on a weekly basis for a period of 12 months after being initially approached by the driver.
In a separate incident, an uncommon, high-value item was offered to shopkeepers in a regional centre by a deliverydriver. A process review indicated that only one customer in the area received this specific product type and that thelikely scenario was theft from the customer by the driver. This was confirmed after the customer indicated that hisgoods receipting process involved providing the delivery driver with the key to his warehouse, that was located off-siteas he trusted him to accurately and honestly deliver his stock. The driver identified and exploited this process weaknessat an unknown cost to the customer.
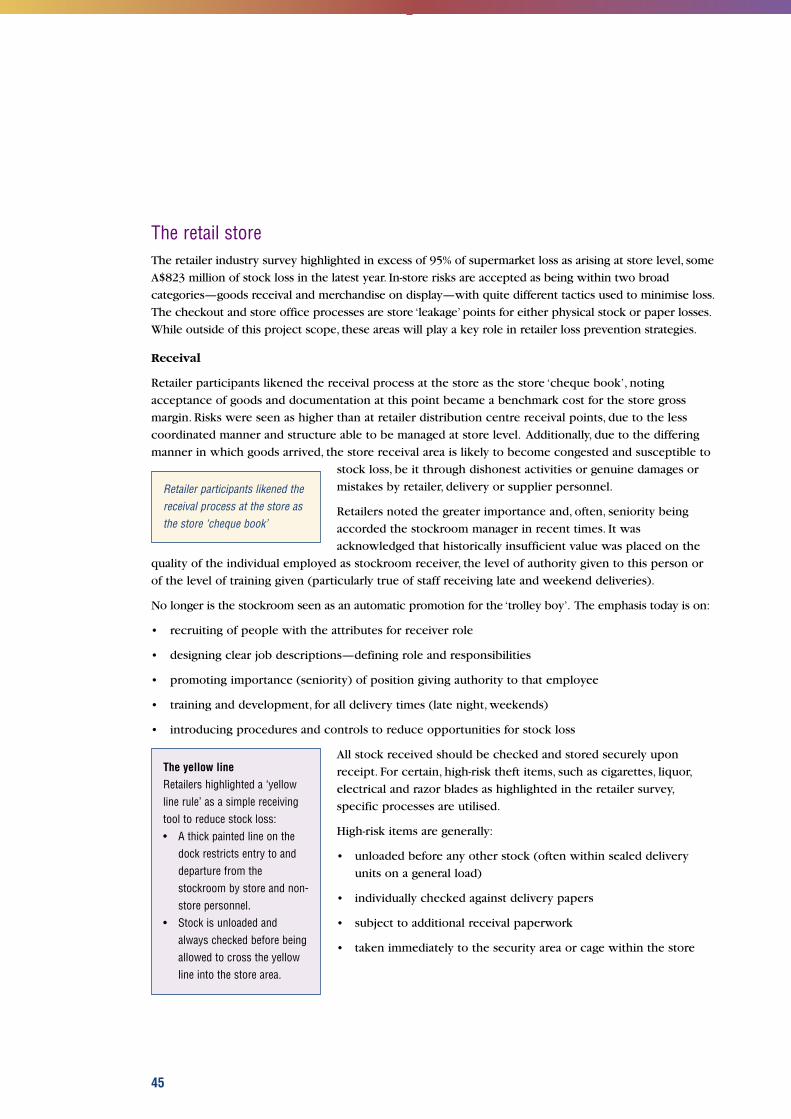
The retail storeThe retailer industry survey highlighted in excess of 95% of supermarket loss as arising at store level, some
A$823 million of stock loss in the latest year. In-store risks are accepted as being within two broad
categories—goods receival and merchandise on display—with quite different tactics used to minimise loss.
The checkout and store office processes are store ‘leakage’ points for either physical stock or paper losses.
While outside of this project scope, these areas will play a key role in retailer loss prevention strategies.
Receival
Retailer participants likened the receival process at the store as the store ‘cheque book’, noting
acceptance of goods and documentation at this point became a benchmark cost for the store gross
margin. Risks were seen as higher than at retailer distribution centre receival points, due to the less
coordinated manner and structure able to be managed at store level. Additionally, due to the differing
manner in which goods arrived, the store receival area is likely to become congested and susceptible to
stock loss, be it through dishonest activities or genuine damages or
mistakes by retailer, delivery or supplier personnel.
Retailers noted the greater importance and, often, seniority being
accorded the stockroom manager in recent times. It was
acknowledged that historically insufficient value was placed on the
quality of the individual employed as stockroom receiver, the level of authority given to this person or
of the level of training given (particularly true of staff receiving late and weekend deliveries).
No longer is the stockroom seen as an automatic promotion for the ‘trolley boy’. The emphasis today is on:
• recruiting of people with the attributes for receiver role
• designing clear job descriptions—defining role and responsibilities
• promoting importance (seniority) of position giving authority to that employee
• training and development, for all delivery times (late night, weekends)
• introducing procedures and controls to reduce opportunities for stock loss
All stock received should be checked and stored securely upon
receipt. For certain, high-risk theft items, such as cigarettes, liquor,
electrical and razor blades as highlighted in the retailer survey,
specific processes are utilised.
High-risk items are generally:
• unloaded before any other stock (often within sealed delivery
units on a general load)
• individually checked against delivery papers
• subject to additional receival paperwork
• taken immediately to the security area or cage within the store
45
Retailer participants likened thereceival process at the store asthe store ‘cheque book’
The yellow line Retailers highlighted a ‘yellowline rule’ as a simple receivingtool to reduce stock loss:• A thick painted line on the
dock restricts entry to anddeparture from thestockroom by store and non-store personnel.
• Stock is unloaded andalways checked before beingallowed to cross the yellowline into the store area.
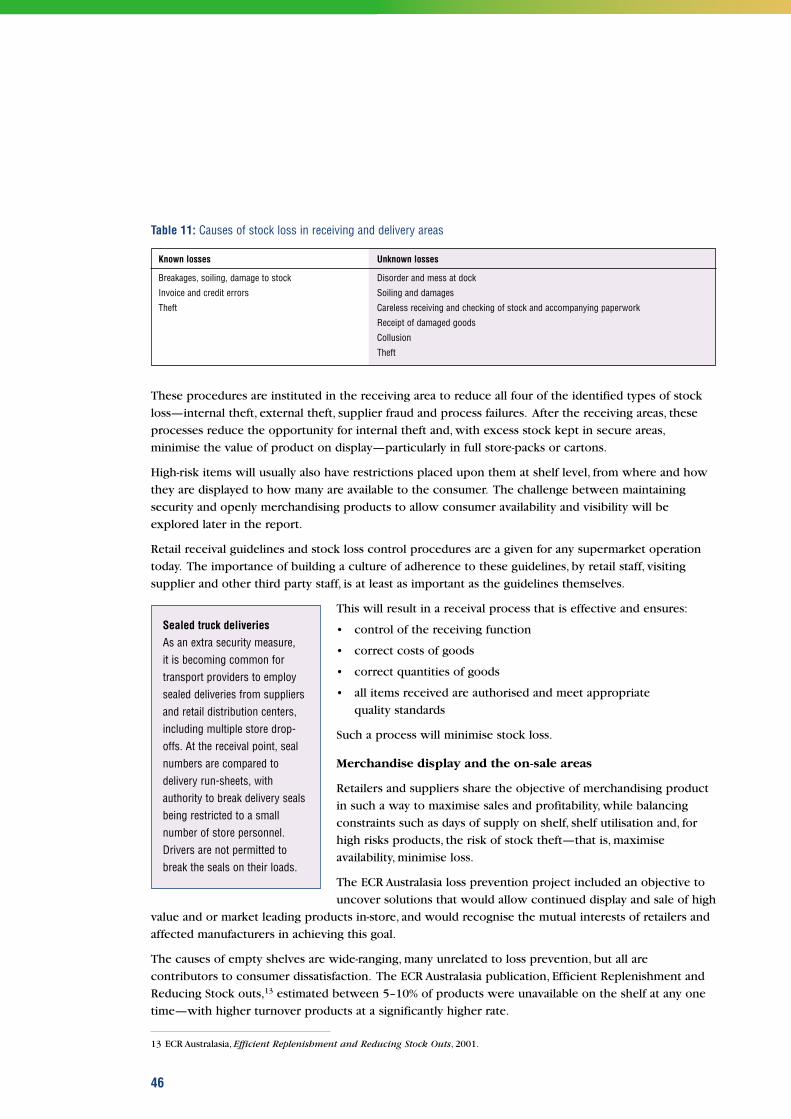
Table 11: Causes of stock loss in receiving and delivery areas
Known losses Unknown losses
Breakages, soiling, damage to stock Disorder and mess at dock
Invoice and credit errors Soiling and damages
Theft Careless receiving and checking of stock and accompanying paperwork
Receipt of damaged goods
Collusion
Theft
These procedures are instituted in the receiving area to reduce all four of the identified types of stock
loss—internal theft, external theft, supplier fraud and process failures. After the receiving areas, these
processes reduce the opportunity for internal theft and, with excess stock kept in secure areas,
minimise the value of product on display—particularly in full store-packs or cartons.
High-risk items will usually also have restrictions placed upon them at shelf level, from where and how
they are displayed to how many are available to the consumer. The challenge between maintaining
security and openly merchandising products to allow consumer availability and visibility will be
explored later in the report.
Retail receival guidelines and stock loss control procedures are a given for any supermarket operation
today. The importance of building a culture of adherence to these guidelines, by retail staff, visiting
supplier and other third party staff, is at least as important as the guidelines themselves.
This will result in a receival process that is effective and ensures:
• control of the receiving function
• correct costs of goods
• correct quantities of goods
• all items received are authorised and meet appropriate
quality standards
Such a process will minimise stock loss.
Merchandise display and the on-sale areas
Retailers and suppliers share the objective of merchandising product
in such a way to maximise sales and profitability, while balancing
constraints such as days of supply on shelf, shelf utilisation and, for
high risks products, the risk of stock theft—that is, maximise
availability, minimise loss.
The ECR Australasia loss prevention project included an objective to
uncover solutions that would allow continued display and sale of high
value and or market leading products in-store, and would recognise the mutual interests of retailers and
affected manufacturers in achieving this goal.
The causes of empty shelves are wide-ranging, many unrelated to loss prevention, but all are
contributors to consumer dissatisfaction. The ECR Australasia publication, Efficient Replenishment and
Reducing Stock outs,13 estimated between 5–10% of products were unavailable on the shelf at any one
time—with higher turnover products at a significantly higher rate.
46
Sealed truck deliveries As an extra security measure, it is becoming common fortransport providers to employsealed deliveries from suppliersand retail distribution centers,including multiple store drop-offs. At the receival point, sealnumbers are compared todelivery run-sheets, withauthority to break delivery sealsbeing restricted to a smallnumber of store personnel.Drivers are not permitted tobreak the seals on their loads.
13 ECR Australasia, Efficient Replenishment and Reducing Stock Outs, 2001.
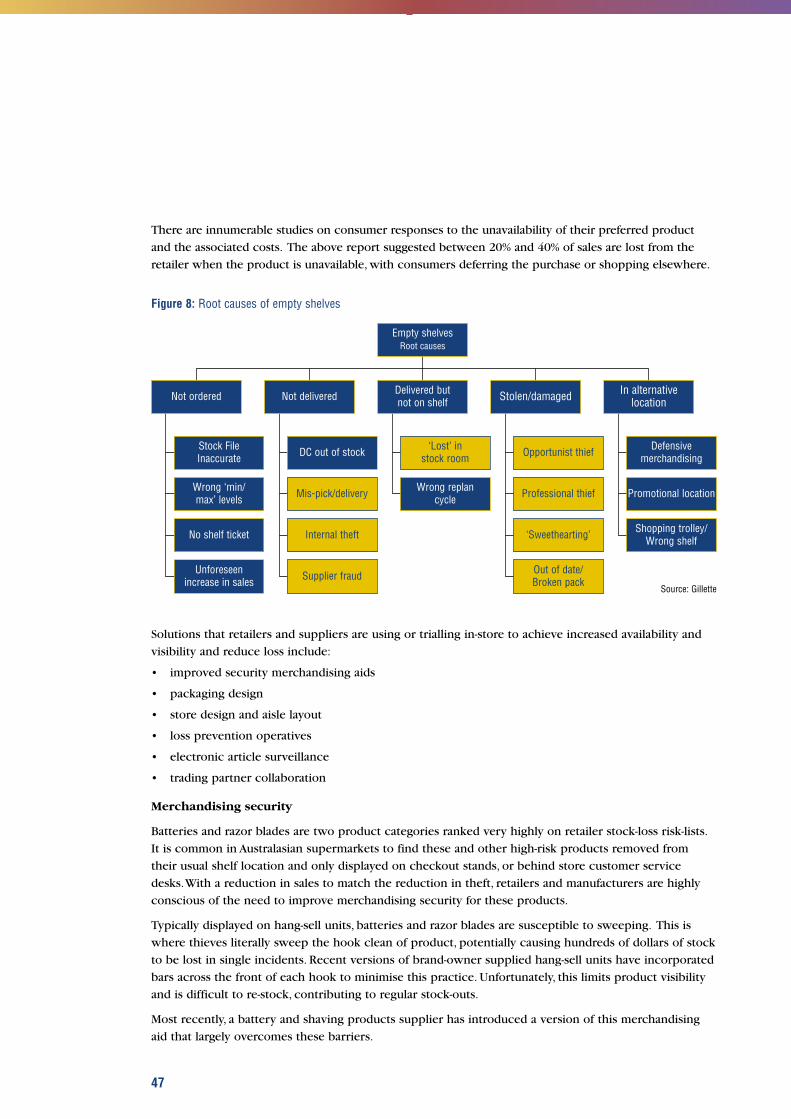
There are innumerable studies on consumer responses to the unavailability of their preferred product
and the associated costs. The above report suggested between 20% and 40% of sales are lost from the
retailer when the product is unavailable, with consumers deferring the purchase or shopping elsewhere.
Figure 8: Root causes of empty shelves
Solutions that retailers and suppliers are using or trialling in-store to achieve increased availability and
visibility and reduce loss include:
• improved security merchandising aids
• packaging design
• store design and aisle layout
• loss prevention operatives
• electronic article surveillance
• trading partner collaboration
Merchandising security
Batteries and razor blades are two product categories ranked very highly on retailer stock-loss risk-lists.
It is common in Australasian supermarkets to find these and other high-risk products removed from
their usual shelf location and only displayed on checkout stands, or behind store customer service
desks.With a reduction in sales to match the reduction in theft, retailers and manufacturers are highly
conscious of the need to improve merchandising security for these products.
Typically displayed on hang-sell units, batteries and razor blades are susceptible to sweeping. This is
where thieves literally sweep the hook clean of product, potentially causing hundreds of dollars of stock
to be lost in single incidents. Recent versions of brand-owner supplied hang-sell units have incorporated
bars across the front of each hook to minimise this practice. Unfortunately, this limits product visibility
and is difficult to re-stock, contributing to regular stock-outs.
Most recently, a battery and shaving products supplier has introduced a version of this merchandising
aid that largely overcomes these barriers.
47
Empty shelvesRoot causes
Not ordered Not delivered Delivered butnot on shelf Stolen/damaged In alternative
location
Stock File Inaccurate DC out of stock ‘Lost’ in
stock room Opportunist thief Defensivemerchandising
Mis-pick/delivery Wrong replan cycle Professional thief Promotional location
Internal theft ‘Sweethearting’ Shopping trolley/Wrong shelf
Unforeseen increase in sales Supplier fraud Out of date/
Broken packSource: Gillette
Wrong ‘min/max’ levels
No shelf ticket
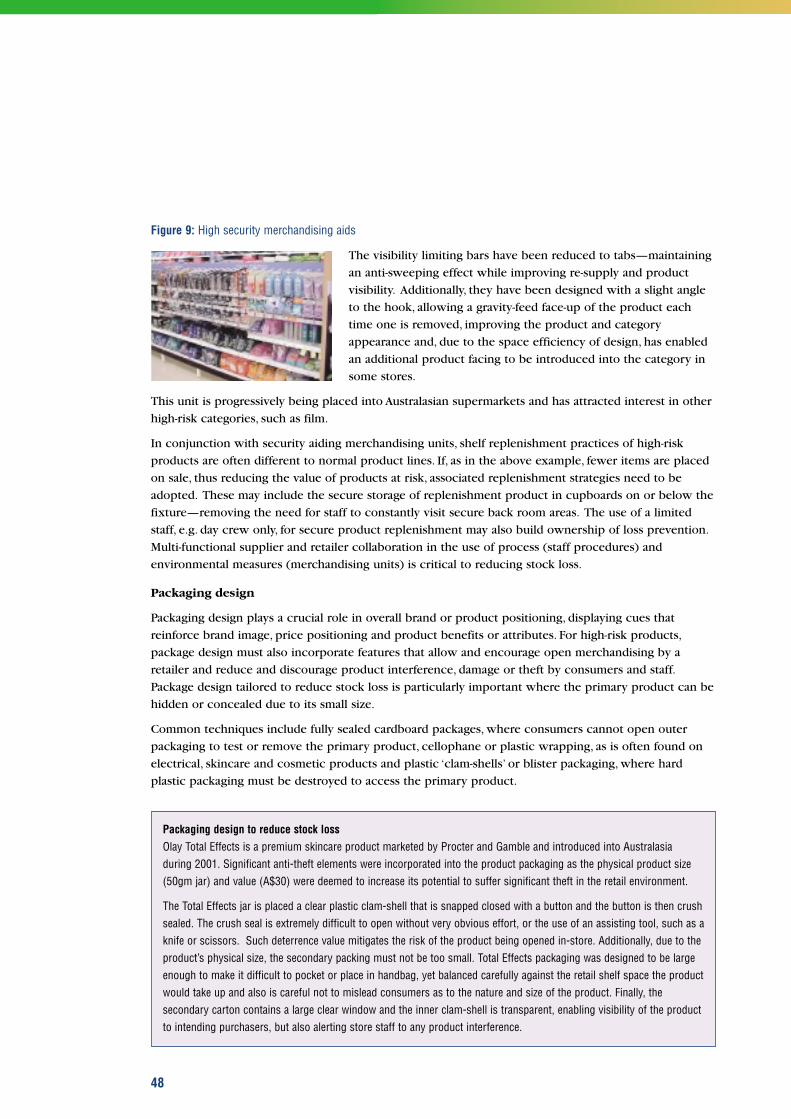
Figure 9: High security merchandising aids
The visibility limiting bars have been reduced to tabs—maintaining
an anti-sweeping effect while improving re-supply and product
visibility. Additionally, they have been designed with a slight angle
to the hook, allowing a gravity-feed face-up of the product each
time one is removed, improving the product and category
appearance and, due to the space efficiency of design, has enabled
an additional product facing to be introduced into the category in
some stores.
This unit is progressively being placed into Australasian supermarkets and has attracted interest in other
high-risk categories, such as film.
In conjunction with security aiding merchandising units, shelf replenishment practices of high-risk
products are often different to normal product lines. If, as in the above example, fewer items are placed
on sale, thus reducing the value of products at risk, associated replenishment strategies need to be
adopted. These may include the secure storage of replenishment product in cupboards on or below the
fixture—removing the need for staff to constantly visit secure back room areas. The use of a limited
staff, e.g. day crew only, for secure product replenishment may also build ownership of loss prevention.
Multi-functional supplier and retailer collaboration in the use of process (staff procedures) and
environmental measures (merchandising units) is critical to reducing stock loss.
Packaging design
Packaging design plays a crucial role in overall brand or product positioning, displaying cues that
reinforce brand image, price positioning and product benefits or attributes. For high-risk products,
package design must also incorporate features that allow and encourage open merchandising by a
retailer and reduce and discourage product interference, damage or theft by consumers and staff.
Package design tailored to reduce stock loss is particularly important where the primary product can be
hidden or concealed due to its small size.
Common techniques include fully sealed cardboard packages, where consumers cannot open outer
packaging to test or remove the primary product, cellophane or plastic wrapping, as is often found on
electrical, skincare and cosmetic products and plastic ‘clam-shells’ or blister packaging, where hard
plastic packaging must be destroyed to access the primary product.
48
Packaging design to reduce stock loss Olay Total Effects is a premium skincare product marketed by Procter and Gamble and introduced into Australasiaduring 2001. Significant anti-theft elements were incorporated into the product packaging as the physical product size(50gm jar) and value (A$30) were deemed to increase its potential to suffer significant theft in the retail environment.
The Total Effects jar is placed a clear plastic clam-shell that is snapped closed with a button and the button is then crushsealed. The crush seal is extremely difficult to open without very obvious effort, or the use of an assisting tool, such as aknife or scissors. Such deterrence value mitigates the risk of the product being opened in-store. Additionally, due to theproduct’s physical size, the secondary packing must not be too small. Total Effects packaging was designed to be largeenough to make it difficult to pocket or place in handbag, yet balanced carefully against the retail shelf space the productwould take up and also is careful not to mislead consumers as to the nature and size of the product. Finally, thesecondary carton contains a large clear window and the inner clam-shell is transparent, enabling visibility of the productto intending purchasers, but also alerting store staff to any product interference.

Store design and aisle layout
Store design and layout have an impact on all elements of loss prevention. Retailers noted regular
interaction between store design and loss prevention departments, most particularly with new stores
and refurbishments.
A standard set of physical security measures are applied in
any store design, including fire safety, shutters, exit barriers,
alarms and CCTV systems. Not so obvious are measures
such as the location of staff rooms or common areas. Some
store designs incorporate such facilities forward of the
checkout, so staff members have little reason to carry bags
or product into or away from the sales area, thus reducing
temptation and opportunity for staff theft.
The in-store aisle location for products are also well
planned. High-risk categories for theft are planned to be
located in well-shopped, high traffic areas, for example near
fresh fruit and vegetables or delicatessen areas, or in
proximity to or line-of-sight of regularly staffed areas, such
as service desks and checkouts.Within Australasia, at least
one supermarket group uses aisles that run across
(east/west) the store behind the checkout areas, as opposed
to the traditional up and down (north/south) orientation.
While an integral part of the overall store traffic design, this also allows the display of high-risk items
very close to checkout and service areas.
These design characteristics are intended to remove the sense of anonymity afforded thieves within a
store, thus deterring store theft.
Loss prevention operatives
A core part of retail loss prevention is the use of covert and overt security and loss prevention
operatives. Through highly structured and tailored programs based on loss statistics, retail stores have a
regular presence of officers patrolling the shop floor.
Loss prevention officers have the responsibility to observe and detain suspected shop theft offenders
and conduct procedures associated with Police reporting.
Electronic article surveillance (EAS)
Supermarkets today carry many more high-value and premium consumer products, from personal care
items to consumer electronics, than ever before. Sadly, crime statistics within today’s society are also
affecting retail outlets more than ever before. As these changes have taken place and technology has
improved, EAS as a loss prevention tool is more commonly being used in supermarkets, having
previously been associated with department, mass discount and specialty retail stores.
An EAS system would usually comprise:
• an electronic tag that is placed on identified risk products
• a reading or sensor mechanism—usually placed at store exit areas
• a disabling mechanism—usually within checkouts or point-of-sale scanners
49
Loss prevention through in-store locationA project participant highlighted a casewhere batteries were located in an aisledisplay at the rear of the store, adjacent tothe meat unit—a highly staffed area.However, twice a range of batteries (valuedat between $750 and $1000) was stolen. Itwas found that, although the store hadextended trading hours until midnight, at8pm the butchery section closed and thearea was not staffed. Having become awareof the problem, the batteries were re-locatedto the front of the aisle within view of theservice desk. No further significant losses ofbatteries have occurred in the store.
Tags that pass through the reading mechanism and are not disabled (such as on stolen products) would
usually trigger an alarm or notification signal. EAS systems can use hard-tags, like those often found on
clothing, or soft-tags, which look much like a paper-thin label. EAS systems in particular target internal
and external theft, where goods are removed from the store via reader- or sensor-protected exits. The
use of hidden or disguised tags placed within product packaging
during the manufacturing process, known as source tagging, is a
preferred method of applying tags for most retailers using EAS.
EAS source tagging is often seen as a more effective method of
protecting high-risk items, due to the ability to hide or disguise tags
within product packaging and the efficiency of application during the
manufacturing process. The benefit can be reduced where products
have complex or international supply chains requiring local product re-work, where source tagging for
selected customers results in multiple variations (tagged/non-tagged) of the same product or through
the creation of manufacturing inefficiencies (e.g. line-speed). These complexities add to product cost
over the cost of the actual EAS tag.
EAS proponents stress that only a small proportion of all supermarket products are identified as high-
risk loss items and are a preferred EAS (and source tagged) candidate. Proponents believe there are
benefits for both suppliers and retailers of high-risk merchandise where EAS systems are installed, such
as reduced stock loss, confidence in open merchandising, increased consumer interaction with product
leading to increased impulse sales and profits and reduced retail staff involvement in product selection.
They believe that, where source tagging is involved, the overall benefits outweigh the costs.
Others comment, however, that other methods of stock loss, including losses not taken through primary
store exits (or done so in grab-and-run incidents) are not addressed by current EAS, and that technology
failings and costs reduce the benefits of EAS systems. Concerns are raised that the identified ripple
effect of EAS will inevitably shift theft to other products, and subsequently increase the range of
products sought for EAS source tagging, or to other stores, simply shifting the problem.
Where EAS has been used in Australian supermarkets in the past, the respective technologies chosen
have not been aligned across users, thereby limiting the efforts of those who believed source tagging
could be achieved at a cross-industry level. Recent industry consolidation and any increased adoption of
like EAS technology within supermarkets may change this position. In New Zealand, no major
supermarket group has broadly adopted EAS, although project participants confirm it is a loss
prevention tool continually reviewed, and it is present in closely related retail environments.
In Australian supermarkets, EAS has a disjointed history. ECR Australasia made a conscious decision at the
project outset not to allow this single element of the many loss prevention measures to distract from
the overall project goal of identifying loss prevention solutions.
If Australasian supermarkets and other mass-market consumer product retailers do emerge with a clear,
consistent and reliable EAS technology, logic would suggest retailers and suppliers should establish a
common and consistent framework for its implementation. This does not suggest industry solutions can
be applied in a blanket fashion—circumstances will differ and decisions will need to be negotiated on a
case-by-case basis between trading partners.
EAS has been discussed here purely relating to in-store usage. This is by no means the sole use of EAS
technology relevant to the supermarket industry, and specifically with the radio frequency EAS method.
Further up the supply chain, radio frequency technology is used extensively as a tool in stock
management. For example, in warehouse customer or store order picking, and as an emerging
application, being embedded in pallets or outer packaging of shipping units.
50
EAS systems in particular targetinternal and external theft,where goods are removed fromthe store via reader- or sensor-protected exits.
A more futuristic solution is being funded through many supermarket industry players, including
suppliers, retailers and service and technology providers at the Auto-ID Center, headquartered at the
Massachusetts Institute of Technology and with branches at Cambridge University, England and more
recently at the University of Adelaide.
The Auto-ID Center has a vision of a global system of identifying objects, from time of manufacture to
the time of recycling, using low-cost radio-frequency identification (RFID) tags.14 The tags will have the
ability to communicate with readers that may be located in warehouses, trucks, pallets, on supermarket
shelves or even with a home microwave.
Considerable development work remains to be done and the tags (or miniature computer chips) and
associated readers remain too expensive for widespread application. However, a trial commenced in late
2001 to verify the real-world application of the tags to the grocery supply chain.
The Auto-ID Center anticipates that the new technology, which can
be thought of as an interactive replacement of the current barcode,
may be commercially viable from 2005 and would have a
revolutionary effect on grocery supply chain visibility, including
loss prevention.
Collaboration
The industry survey confirmed that trading partner collaboration has been a missing component of
many loss prevention efforts. It highlighted that, where the low to occasional interaction between
trading partners did occur, it was often on a silo basis, with a single or narrow objective in mind, such as
methods to reduce loss on a particular SKU or range of products. Project participants were unable to
identify consistent and coordinated efforts between differing departments within trading partners to
reduce stock loss as part of an overall category strategy or plan.
Ideally, the risk of stock loss, balanced with the ideal category display dynamics, will be factored into the
category management—particularly shelf positioning—and store layout processes. For example,
relocation to front-of-store or front-of-aisle may mean the category remains available and visible to
genuine purchasers, while reducing theft opportunity. This may be considered in conjunction with a
review of the receival, stock storage and shelf replenishment processes of the product, the use of higher
security merchandising aids, well positioned CCTV cameras and EAS tagged products.
51
The Auto-ID Center has a visionof a global system of identifyingobjects, from time of manufactureto the time of recycling
Category driven in-store loss preventionWoolworths New Zealand is a major supermarket operator in New Zealand. As an emerging element of their lossprevention program, the loss prevention department regularly supplies category buyers with loss statistics that arecompiled as a component of the civil recovery program and other quantitative record keeping activities. The categorybuyers are using these statistics jointly with affected suppliers to develop and implement category and store-specificaisle and shelf layouts that consider the identified risks. A growing trend in the Woolworths New Zealand health andbeauty categories is use of reduced-height island shelf units, providing a more leisurely and enjoyable shoppingexperience. The location, orientation and shelf layout of these units reflects stock loss risk management. High-risk items,such as razors, cosmetics and skin creams and hair colourants, are located toward the front of the store, face theservice counter, are higher on the shelf unit and have direct CCTV coverage.
14 Source:Auto-ID Center website, www.autoidcenter.org.
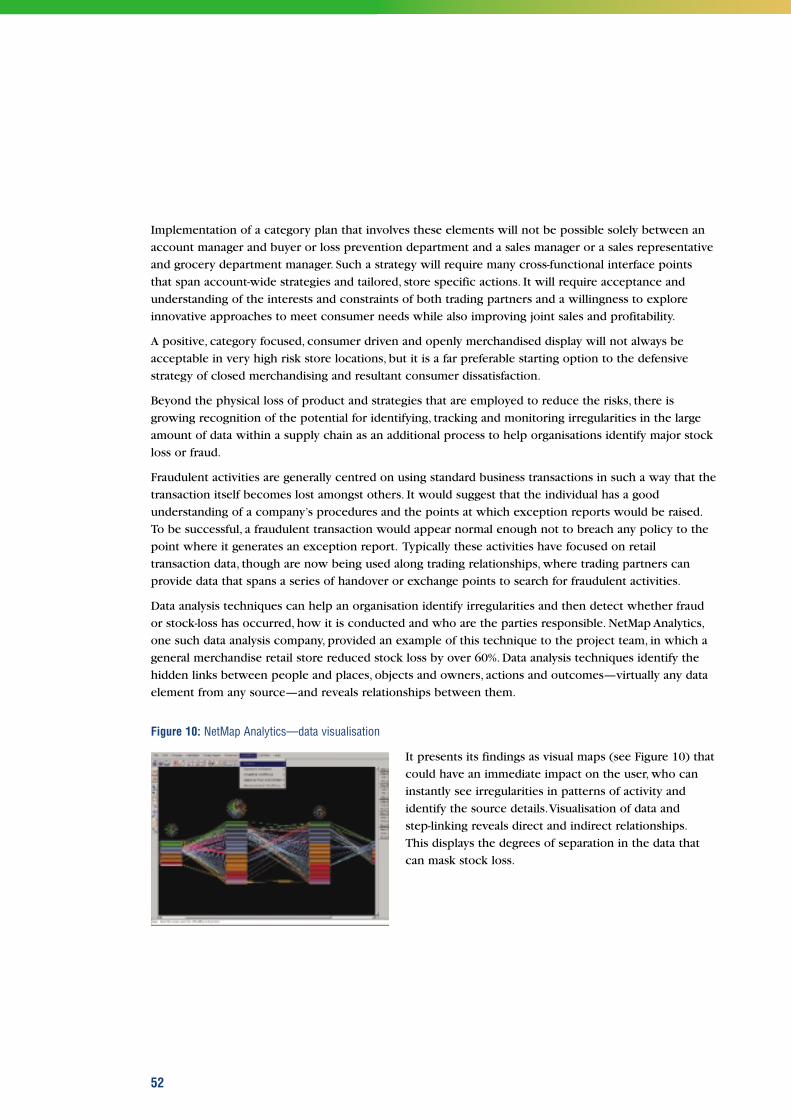
Implementation of a category plan that involves these elements will not be possible solely between an
account manager and buyer or loss prevention department and a sales manager or a sales representative
and grocery department manager. Such a strategy will require many cross-functional interface points
that span account-wide strategies and tailored, store specific actions. It will require acceptance and
understanding of the interests and constraints of both trading partners and a willingness to explore
innovative approaches to meet consumer needs while also improving joint sales and profitability.
A positive, category focused, consumer driven and openly merchandised display will not always be
acceptable in very high risk store locations, but it is a far preferable starting option to the defensive
strategy of closed merchandising and resultant consumer dissatisfaction.
Beyond the physical loss of product and strategies that are employed to reduce the risks, there is
growing recognition of the potential for identifying, tracking and monitoring irregularities in the large
amount of data within a supply chain as an additional process to help organisations identify major stock
loss or fraud.
Fraudulent activities are generally centred on using standard business transactions in such a way that the
transaction itself becomes lost amongst others. It would suggest that the individual has a good
understanding of a company’s procedures and the points at which exception reports would be raised.
To be successful, a fraudulent transaction would appear normal enough not to breach any policy to the
point where it generates an exception report. Typically these activities have focused on retail
transaction data, though are now being used along trading relationships, where trading partners can
provide data that spans a series of handover or exchange points to search for fraudulent activities.
Data analysis techniques can help an organisation identify irregularities and then detect whether fraud
or stock-loss has occurred, how it is conducted and who are the parties responsible. NetMap Analytics,
one such data analysis company, provided an example of this technique to the project team, in which a
general merchandise retail store reduced stock loss by over 60%. Data analysis techniques identify the
hidden links between people and places, objects and owners, actions and outcomes—virtually any data
element from any source—and reveals relationships between them.
Figure 10: NetMap Analytics—data visualisation
It presents its findings as visual maps (see Figure 10) that
could have an immediate impact on the user, who can
instantly see irregularities in patterns of activity and
identify the source details.Visualisation of data and
step-linking reveals direct and indirect relationships.
This displays the degrees of separation in the data that
can mask stock loss.
52
The external environmentWhile collaboration between individual trading partners can be used to address issues that are arising
within the trading relationship, root causes and broader scale efforts to reduce intentional illegal stock
loss often lie outside of the traditional retailer and supplier supply chain.
Project participants identified other elements of the community that needed to be included in a holistic
loss prevention strategy and have highlighted some of the areas that require new or increased efforts by
industry. The industry survey highlighted professional thieves as a major source of concern and in-store
theft and loss prevention specialists within the project team emphasised the need to work
collaboratively and externally to reduce industry-wide loss.
The activities of professional shop thieves constitute a threat that requires the industry to proactively
address external factors that have a direct bearing on stock loss at various points along the supply
chain. Removing the demand for stolen product, by breaking such organised criminal operations, is a
key to lowering stock loss through denial of supply and consequent elimination of demand.
Investigations into activities of this sort may or may not be undertaken by industry’s own resources.
The nature of the evidence collected will dictate the nature and level of police support. Suppliers and
retailers need to be aware that there is an increasing expectation by Police that detailed internal
investigations into these criminal activities will be conducted in such a way that is admissible in court
and that Police may handle a smaller component of the whole investigation. This requires investigating
teams to be suitably skilled to ensure evidence is collected in the appropriate way.
There may be scope for industry guidelines to be drawn up, on the basis of recent industry and Police
experience, to facilitate the most effective cooperation between industry and Police. Similar guidelines
exist in Australia for managing product contamination and extortion.
In some instances, and with a clear understanding of Police requirements, the decision may be made
that the evidence does not meet the criminal burden of proof. However, incidents should still be reported
to police in order to allow them to understand the nature and scale of issues facing the industry.
53
Reselling—a case for industry action
A New Zealand exampleOn the basis of industry information and cooperation, New Zealand Police apprehended and prosecuted professionalcriminals through a very successful operation at a weekend market. A large amount of health and beauty and electricalproduct was on display for sale at extremely cheap prices, in most cases well below cost. The majority of the producthad been store or security stamped by originating retailers and there were obvious signs of attempts to erase theseidentifying marks. The market vendor could not provide proof of purchase or ownership. The value of stock recoveredwas in the tens of thousands of dollars.
An Australian exampleThe work of covert loss prevention staff and subsequent apprehension of a known shop thief resulted in investigatingpolice raiding an address which was set-up as a small supermarket—down to a stack of plastic baskets to take whileyou did your ‘shopping’. Rooms in the house were fitted with supermarket shelving. Each shelf was faced-up verysimilar to a normal supermarket. The masterminds would place regular orders with shop stealers to fill specific stocklines. In excess of two hundred thousand dollars worth of stock was recovered, which was identified to have come frommultiple retail groups.
Police are becoming more businesses focused and provide their resources where the need exists.
If matters are not reported, Police are unlikely to have an accurate appreciation of the impact of
product theft on the industry.
Such an approach may well be better handled on an industry basis, with losses not likely to have come
from a single source. In Australasia, existing industry bodies and associations afford some coordination,
while specific bodies have also been established to tackle stock loss.
The New Zealand Retail Loss Prevention Consortium, for example, was established during 2000, with
representatives from major retail organisations in New Zealand and the Police Commissioner’s office.
The consortium aims to take a wide-ranging crime prevention approach in order to reduce their
individual exposure to the costs of retail crime.
As depicted in the Figure 11 tree-diagram, the consortium has targeted relevant bodies outside the retail
sector, in an effort to deal with the factors that are responsible for theft from the participants’ stores.
It has done so through the involvement of the New Zealand Police at national and regional levels, an
industry level approach with security contractors, a coordinated approach to government for legislative
change and the ability to better use joint resources for investigations and information sharing.
Longer-term efforts are being put into promoting retail loss prevention activities, using media where
necessary, and developing education programs. The consortium has prioritised the development and
implementation of an improved reporting mechanism to the New Zealand Police.
The consortium has implemented a retail civil recovery program and
is actively promoting the concept and gaining support from other
retail organisations. Civil recovery is a process allowing a retailer to
use civil law to reclaim directly from an offender its costs and losses
that arise from a retail theft occurrence. Retail civil recovery is used
in conjunction with any appropriate criminal law (that is, stealing)
usually through a letter of demand for costs and, if this is not
successful, through a civil court action.
Retail civil recovery in New Zealand is based on a similar program from the United Kingdom. Its
purpose is to deter offenders, by applying financial penalty in addition to any criminal penalty. This is
particularly relevant, as a high proportion of shop thieves are only cautioned or warned by the legal
system. Furthermore, it provides some, albeit limited, financial recompense to retailers where none is
available now. For Loss Prevention Officers, a single apprehension for suspected shop theft may take
several hours to process.
In Australia, the Australian Retailers Association is pursuing the introduction of a retail civil recovery
program. The other types of activity embraced by the New Zealand Retail Loss Prevention Consortium
are supported, if not actively undertaken, by retailers in Australia, with similar desires to improve Police
liaison and develop specific legislation to deal with retail based crime—both of which are hindered by
the state-by-state approach necessary in Australia.
Managing the external environment is one of the most challenging aspects of loss prevention facing the
retail and supermarket industry.While in-store and supply chain measures, both physical and process
based, can be constantly improved on, it is tantamount to ‘placing the ambulance at the bottom of the
cliff’—in attempting to deal with loss after the event, rather than reducing the motivation for it to occur
in the first place. This report reinforces the need for an integrated and industry-wide external effort to
support the efforts being undertaken by individual companies throughout the extended supply chain.
54
Retail civil recovery is a processallowing a retailer to use civillaw to reclaim directly from anoffender costs and losses thatarise from a retail theftoccurrence.
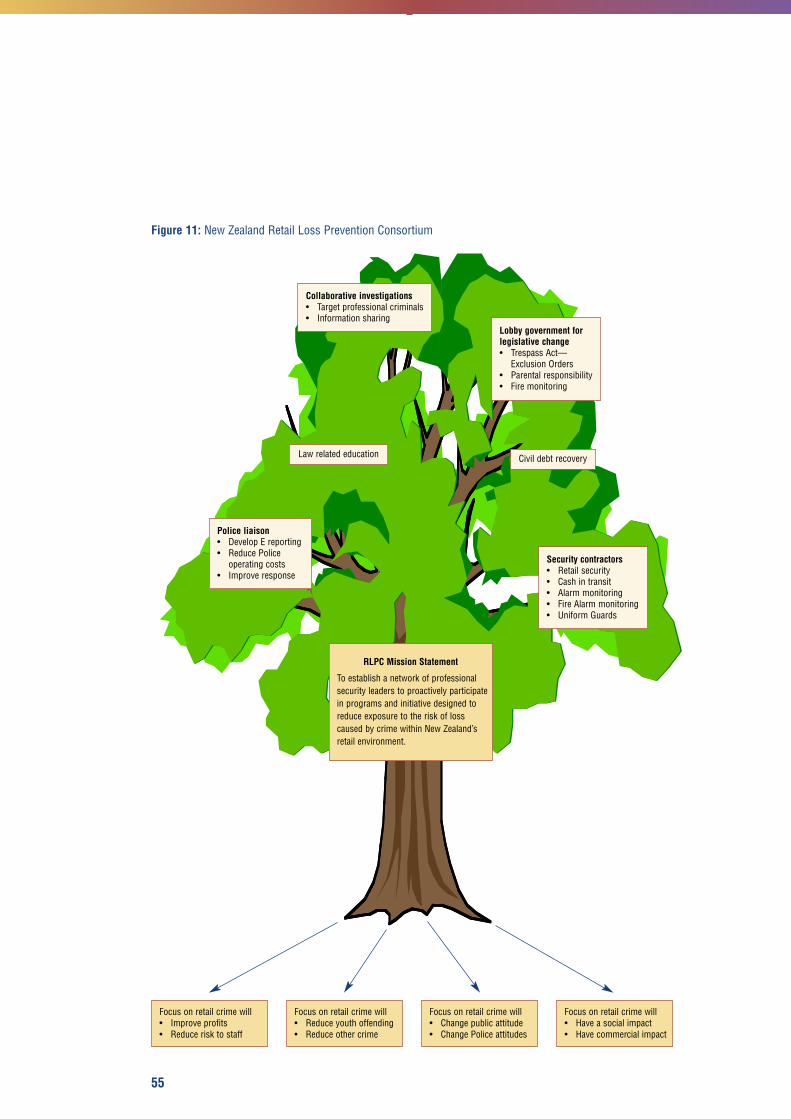
Figure 11: New Zealand Retail Loss Prevention Consortium
55
Collaborative investigations• Target professional criminals• Information sharing
Lobby government forlegislative change• Trespass Act—
Exclusion Orders• Parental responsibility• Fire monitoring
Civil debt recoveryLaw related education
Security contractors• Retail security• Cash in transit• Alarm monitoring• Fire Alarm monitoring• Uniform Guards
Police liaison• Develop E reporting• Reduce Police
operating costs• Improve response
RLPC Mission Statement
To establish a network of professionalsecurity leaders to proactively participatein programs and initiative designed toreduce exposure to the risk of losscaused by crime within New Zealand’sretail environment.
Focus on retail crime will• Improve profits• Reduce risk to staff
Focus on retail crime will• Reduce youth offending• Reduce other crime
Focus on retail crime will• Change public attitude• Change Police attitudes
Focus on retail crime will• Have a social impact• Have commercial impact

56

57
Conclusions and recommendations7
Conclusions and recommendationsThe ECR Australasia loss prevention project has been able to provide, for the first time, a quantifiable
estimate of the impact of stock loss on the supermarket industry in Australasia and an understanding of
where and how that loss occurs between trading partners.
While this is a significant and worthwhile achievement, the uncovering of the cost should only serve as
a call to trading partners to review the manner in which each party is addressing loss prevention and to
establish how they can collaboratively reduce the cost of stock loss to the industry. The cost of the
status quo is the enormous, and growing, figure of A$942 million per year to Australasian supermarkets
and their suppliers.
ECR Australasia has identified five actions to improve the supermarket industry approach to loss
prevention and recommends them for priority implementation. The recommendations are made on an
Australasian basis while recognising they may have greater or lesser applicability within Australian or
New Zealand retail environments.
ECR Australasia recommends that the following actions be taken:
1. Improve loss prevention collaboration across the industry, between trading partners andwithin companies
Retailers and high-risk supplier companies have significant programs in place to address loss
prevention. The findings of the project however, sustain the belief that these efforts can be further
supported through greater industry level, trading partner and intra-company collaboration.
Subsequent recommendations include the need for law enforcement engagement, legislative change
and industry agreement on loss prevention technology implementation protocols. These actions
may be best served at retailer and supplier industry representative levels.
Collaboration between trading partners was reported in the industry survey at low levels,
particularly in coordinating cross-functional trading partner strategies. Suppliers and retailers need to
review their approach, including intra-company processes, to develop the most effective joint
approach to loss prevention. There are a large number of strategies centred on processes and
procedures that if adopted, through supplier-retailer collaboration, will help address stock loss. Most
can be easily implemented and at a low cost, with the key to success a shared vision and a rigorous
and disciplined approach in execution.
Improved collaborative efforts should not be restricted to fraudulent loss, as there is commonality in
the method of loss and hence improvement areas for both supplier and retailer within process
failures. Areas such as product distribution, handover and receival points, standard documentation
and audit trails and effective management of product shelf-life are common areas of opportunity
for improvement.
58
2. Improve measurement reporting and visibility of stock loss
Realisation of the sizeable proportion and enormous cost of unknown stock loss, close to
A$300 million per year, was a significant outcome of the project. Given the nature of supermarket
retailing, it is not surprising that the majority of stock loss occurs at the retail end of the supply line.
However, the extraordinarily low estimate of unknown loss by suppliers—only 8% of all losses—and
the significant difference between it and the 41% unknown loss reported by European suppliers,
provides some food for thought as to the accuracy of supplier data and the effectiveness of process
controls. The methods of stock loss reporting, by both suppliers and retailers, which rely heavily on
document-based processes, and which themselves may lead to non-reporting of unknown stock loss,
may generate substantial inaccuracies or gaps in available data.
3. Renew industry efforts to engage with law enforcement agencies
A loss prevention approach that fails to include law enforcement agencies lacks a crucial piece of
external orientation. The project team expressed concern and frustration at its inability to arrive at a
sustainable and efficient method of incidence reporting, response and longer-term strategic
engagement with enforcement agencies to address retail crime. The industry needs to renew efforts
to develop appropriate links with enforcement jurisdictions to highlight the magnitude and
seriousness of retail crime and to develop education and awareness campaigns to support
apprehension programs. Collaboration with suppliers and retailers in other industry sectors should
also be sought to reinforce the significant cost of stock theft to society.
4. Renew industry efforts to implement model retail theft legislation in jurisdictions inAustralia and New Zealand
The perception of retail crime as victimless and without subsequent consequence is sustained by
the absence of specific legislation and penalties for the offence. Model legislation has been drawn up
by the Australian Retailers Association Loss Prevention Sub-committee and been presented to
Australian Attorney’s-General, so far without successful adoption. ECR Australasia believes a renewed
and concerted approach to having the legislation implemented in Australia and New Zealand to be a
fundamental plank on which to build industry attempts to reduce stock loss.
5. Improve collaboration on the introduction of loss prevention technologies
It is clear, in Australia at least, that EAS is a loss prevention tool that is likely to increase penetration
in supermarkets.While maintaining a conscious decision not to recommend any particular loss
prevention technology, ECR Australasia believes that adoption of agreed industry standards or
protocols, for both technologies and affected products, on the basis of agreed cost-benefit analysis, is
essential to avoid the introduction of unnecessary costs throughout the supply chain. The final
decision to implement particular solutions, and on what commercial basis as always, will remain the
privilege of trading partners.
59

60

61
Appendices8
Appendix 1: Glossary Balanced Scorecard: A technique for structuring performance measurement that considers the
perspectives of shareholders, customers, internal processes and the creation of future value.
Distribution Centres, DC: Supply centres that are used and/or managed (but not necessarily owned)
by manufacturers and constitute an integral part of their distribution network.
External Theft: The unauthorised taking of goods or cash from a store at any time of the day or night
by customers or other non-company employees. This includes incidents of shoplifting, fraudulent return
of goods, till snatches and burglary (breaking into and entering a store whilst it is closed).
Hot Products: Particular items or types of product that have been identified by retailers to be
especially at risk from theft. Such products are easily concealed and often have special procedures and
security policies associated with them to provide additional protection and reduce losses.
Internal Theft: The unauthorised taking of goods or cash from a store at any time of the day or night
by staff employed by the company (including contract staff, for instance third party security staff or
maintenance workers). This includes staff theft, collusion between customers and staff, employees
eating stock, till shortages and the deliberate manipulation of prices.
Known Stock Loss: A calculable total where there is some form of record of the loss, for instance,
paper or computerised records of incidents such as theft or the disposal of goods that are out of date.
Percentage of Stock Loss: Total value of stock loss at retail value (including taxes) as a percentage of
total sales. For manufacturers, this excluded losses incurred as part of the manufacturing process.
Process Failures: Losses due to operating procedures within the organisation including products which
have become out of date, or have been reduced in price; incorrect pricing; product identification errors;
incorrect stock counting; products which have been damaged; scanning errors; and errors in deliveries to
the stores (e.g. short deliveries due to errors in picking and dispatch from distribution centres).
Retail Distribution Centres, RDC: Supply centers which are used and or managed (but not
necessarily owned) by retailers and constitute an integral part of their logistical network.
Shrinkage: Losses due to a combination of supplier fraud, process failures, internal theft and external
theft. See also Percentage of Stock Loss.
Stock Loss: see shrinkage.
Supplier Fraud: Losses due to suppliers or their agents deliberately delivering less goods than what
you are eventually charged for by them. This includes vendor and contractor fraud but does not include
discrepancies in the goods supplied from company DCs.
Unknown Stock Loss: A calculable total but where there is no record of how, where or when the
losses occurred within an organisation.
62

Appendix 2: Loss prevention solutionsDetailed below are 67 solutions grouped into four different types: procedures and routines; design and
layout; equipment and technology; and people and processes. It is in no way an exhaustive list of possible
stock loss reduction options, but merely some examples of the different approaches currently available.
They are listed in alphabetical order and no attempt has been made to ‘rate’ their effectiveness.
Procedures and routinesAnnual stock loss awareness campaign: Create themes, activities and performance measures to
engage every part of the organisation. This could include awareness of current performance, risks and
prevention procedures. Often supported by departmental action teams to gain feedback.
Company-wide stock loss refresher training: Scheduled training that covers every employee within
a reasonable time frame. It uses the most relevant materials based upon recent stock loss performance,
responsibilities, industry ‘best practices’ and specialist loss prevention techniques.
Customer returns and refund controls (operator and customer database): Sets maximum values
for refunds without supervision, develops over-rider facilities procedures, management ‘halos’ to ensure
that high value, hot product or high abuse items are tracked, e.g. clothes, videos, CDs etc.
Damaged goods resale controls: Procedures that make it less attractive for employees to
deliberately damage ‘premium goods’ to enable them to be bought later at a reduced price or to get
them free of charge.
Employees exit searches: Using a precise record of shift patterns allowing management or security
teams to carry out employee searches either by a random, arbitrary or targeted schedule.
Hot product identification: Hot products vary by outlet, location, time of year and demographics.
Once identified, various approaches can be considered to reduce their loss, e.g. delivery checking,
shelf replenishment techniques, use of special storage, display location and equipment and regular
counting routines.
Hot product management: A unique set of procedures and guidelines, which aim to control the risks
associated with these groups of products. Because varying degrees of risk occur throughout the
replenishment cycle, checkpoints should be invoked at all key stages of the supply chain process.
Hot products routine counting: Used to identify levels of loss, timing of loss and if possible whether
the loss occurred on the sales floor, in the storeroom or in transit. Frequency of count should be weekly
minimum and hourly maximum. Counting may deter theft as the products receive more regular
attention and therefore thieves will be prone to more surveillance.
Induction training for new employees: Use the captive and influential opportunity during induction
to enlighten new employees to issues of stock loss prevention, including areas and products at risk,
common theft techniques and the organisation’s policy on prosecutions. Should also be supported by
brochures, videos and memory aids.
Internal key control: Logging systems to determine whom, when and why particular areas, such as
‘hot product’ secure lock-ups, are opened and secured after each activity.
63

Patrol routes for employees (red routes): Standard or set routes through storage and sales floors
areas that all employees are required to use. Enables vulnerable stock areas to be more carefully
monitored.
Point-of-sale information or data checks: Point-of-sale audits against targeted personnel based upon
suspicion, anecdote or concerns about an individual’s honesty. Could also cover internal and or external
collusion.
Random till cash checks: Random, arbitrary or targeted cash checks to detect mid-shift or end of shift
under-ringing and cash abuse/theft.
Rigorous delivery checking procedures: Clear and detailed procedures covering all types of
delivery checks for internal and external suppliers of stock. This should include detailed levels of claims
for shortages, timescales and validation processes for claims. This can include special procedure for
high-risk products.
Security newsletter: Regular communication alerting employees at all levels about loss prevention
techniques and up-to-date information on fraud and theft trends and cash and stock controls. Depending
on sensitivities and civil rights, examples of external and or internal theft and vigilance awards for
employees can be highlighted.
Shelf replenishment techniques: A range of techniques to reduce the risk of internal or external
theft by regulating the flow of goods onto the shelves. Examples include a maximum of one day’s sales
on shelf, loose stock secured between replenishment cycles, stock secured between cycles and
replenishment cycles increased for high-risk lines.
Unique till operator PIN numbers: A unique electronic operator number that enables transaction
monitoring and an audit trail at operator level to be determined. It can also enable other electronic
tracking devices, such as CCTV, to be used to investigate individual operators.
‘Watertight’ product monitoring procedures: Used to identify skilled theft of high-risk products.
CCTV cameras monitor the shelf stock of high-risk products. The quantity of shelf stock is checked
twice a day, morning and afternoon, by a hand count. The number of items taken from the shelf is
compared against EPOS data. If a loss is found to have occurred then the CCTV tape is reviewed to
identify likely culprits. Files are kept on these people and evidence collected over time on their
behaviour patterns until enough is known to act to stop them.
Design and layoutAppropriate product location strategies: This approach locates high-risk products in an area of high
visibility and control during storage and in the sales area.
Designing-out blind spots: This involves improving the physical layout of a facility, for example
through better lighting, improving the positioning of CCTV cameras and giving better line-of-sight
visibility to members of staff from their work locations.
Designing-out crime program: Using up-to-date techniques to ensure that thieves cannot loiter
undetected, cannot steal large quantities of high-risk products easily, and cannot conceal themselves
internally or externally in any part of the building. A range of equipment, e.g. one-way entrance/exit
gates, low-level fixtures, CCTV, anti-theft display equipment and robust packaging, should support
this approach.
64
Distribution centre secure storage: These solutions consist of isolated distribution centres or
sections within a distribution centre designed to handle high-risk product groups with uniquely
rigorous receiving, picking, access control and despatch processes.
Employee entry/exit access control: A unique entrance and exit facility for employees to ensure that
arrivals and departures can always be monitored. This area will include a place where either
management or security employees can perform discreet searches.
External security—fences, anti-ram raid, roll shutters: A range of defensive approaches
designed to ensure that exterior and out-of-business-hours breaches are made more difficult and do not
go undetected.
Risk-based design and layout: In place of a one-size-fits-all approach to store design, this approach
considers risk profiling or modelling of each unit based on their specific levels of risk of stock loss. This
method makes use of records of internal and external theft, insurance risk (industry data), historical
stock loss performance, local demographic data, rates of staff turnover, trading hours and cash losses to
develop an accurate picture of the risks associated with a particular site.
Robust anti-theft packaging: The use by manufacturers of extra strong and robust packaging.
Includes design concepts such as ‘too large to fit in the average pocket’ packaging.
Single-direction product flow: A one-way process that does not have any ability to reverse the
movement of stock for any reason. Quantities are designed to always fit into the despatch, delivery and
replenishment requirement of a recipient, without fail.
Supply chain and logistics network design: Consideration of a range of specific secure delivery
methods that could include, cross docking, unique hot product delivery processes, third party
consolidation and delivery service for hot products, central distribution high-risk product routine check
points throughout the network and unit item picking in a controlled environment.
Equipment and technologyActive CCTV: Either black-and-white or preferably colour systems that operate during working or
trading hours and record incidents throughout the key areas of the building.
Automated ordering processes: Computer based ordering processes usually either sale based or sales
trend based. May include manual intervention capability to adjust final order quantities.
Cash protection tactics and equipment: (both cash offices and tills):A wide range of equipment and
approaches are available including cash drawer covers to prevent till snatches, cumbersome metal till
cash pick up units, maximum values between till pick ups, heavily supervised/guarded pick ups and
timed ‘dead locks’ on safes.
Company-wide stock loss awareness posters: Use the most appropriate and relevant themes.
Position in key employees areas, changing rooms, main corridors and stairways, employee restaurants,
department notice boards, to capture the attention of full-time and part-time employees. It is important
to be creative and rotate themes in order to stimulate interest and sustain attention.
Dummy display cards in place of high-risk products: Professional replicas of product with signage
explaining clearly to customers how and where this product can be obtained and paid for.
65
EAS hard tagging (recycled): Radio Frequency,Acosta Magnetic or Electro Magnetic tags placed on
high-risk products by employees to raise alarm if products are removed and not purchased. Usually
disarmed or identified at point of sale and used extensively on clothing.
EAS soft tagging (disposable): Radio Frequency,Acosta Magnetic or Electro Magnetic tags placed on
high-risk products by employees to raise alarm if products are removed and not purchased. Usually
disarmed or identified at point of sale. Can sometimes cause problems with systems in other locations if
‘deactivated’ products are taken there.
EAS source tagging (either disposable or recycled): Radio Frequency,Acosta Magnetic or Electro
Magnetic tags placed on high-risk products by manufacturers, to raise alarm if products are removed and
not purchased. Usually disarmed or identified at point of sale.
Employee purchasing arrangements: Facilities that make monitoring of staff purchases and benefits
easier to track. It often requires heavy investment to create an exclusive or unique facility for staff.
Employee panic alarms: Alarm buttons strategically placed and often connected to the local police
station to reduce the risk of personal injury, armed robbery as well as the theft of cash and goods.
Employee uniforms without pockets: Reduces the opportunity for staff to conceal either cash or
stock while at work.
Intruder alarm systems: Make use of passive beams, infrared or wire-based anti-breach burglary
alarms. Can be used to control stock security either during operating hours or secure buildings when
closed to the public.
Non-active CCTV: Dummy cameras that look as if they are real but have no facilities for enabling
monitoring or recording of incidents.
Point-of-sale camera monitoring: Cameras targeted on till operators and used in conjunction with a
computerised till monitoring system that tracks ‘unusual’ incidents such as till drawer open for more
than an acceptable amount of time, consistently low transaction values etc.
Protector display cases applied by retail outlets: Robust product containers that are applied in the
retail outlet to protect products such as CDs, music tapes and videos. Usually removed at the point of
sale with special equipment.
RFID intelligent tags on pallets, cases or items (radio frequency): Tags that can track the correct
stock despatch to the right outlet. Usually focused on high-risk product groups but could extend to all
products over time.
Replenishment equipment to support techniques: Specialist equipment for high-risk products,
which allows secure storage for loose hot products before, during and between replenishment cycles
and operator shifts.
Secure lockers for employees: An employee facility to ensure that personal possessions or money are
not accessible during business hours for employees; always maintaining a management prerogative to
search if suspicion exists.
Security-sealed containers/shippers: Specially designed secure containers for hot products moving
from supplier to distribution centres, and between distribution centres to outlets. These range from hot
sealed opaque bags to lockable/sealed boxes or containers.
66
Shoplifting and theft policy posters for customers and staff: Signs distributed around any stock
areas, both for employees and customers, clearly stating the policy to arrest, prosecute or detain anyone
suspected or caught in possession of unpaid goods.
Specialist anti-theft display equipment: Restrictors on the level of fill and/or restrictors to reduce
removal of more than a single product per customer. Also includes lockable display units, dummy
display units and customer service dispensing only systems.
People and processesAnonymous phone line: Constantly manned or answer phone-based hot line, which enables
employees to report any known internal theft or incidents of collusion that they are aware of, but would
prefer not to be identified for fear of reprisals. This could also extend to external events that are known
about and reported by customers in high-risk locations.
Civil recovery: A process that takes theft-related offences beyond standard police prosecution and
utilises civil law to recover the costs of stolen property from the offender (both customers and
employees).
Covert surveillance of customers or employees: Use of CCTV or trained personal to observe
suspected employees without them knowing it is taking place.
Employee awareness and training: A wide-ranging program, which can help to change
organisational culture if sponsored by senior management. Makes use of internal and external specialists
to enlighten, facilitate and help create change within the organisation. It is important to identify the
intended outcomes and to measure them accordingly.
Employee incentives—discount purchase schemes: These are schemes which encourage
employees to buy products from the company at discounted prices, and act as an alternative to stealing
product during working hours. Some schemes are only valid after a certain minimum number of months
of employment.
Employee incentives—stock loss bonus schemes: A range of schemes to encourage employees to
improve stock loss performance. Industry examples range from percentage of annual savings shared
with employees to developing and rewarding key performance indicators such as degree of compliance
with procedures, cost controls and sales performance.
Employee integrity checks: Pre-employment screening to ensure no relevant previous criminal
record exists.
Employee stock loss training and education: Continuous structured programs facilitated by a range
of internal and external specialists, which may include, security, loss prevention, stock management,
customer service, manufacturers, police and consultants.
External compliance monitoring: External staff contracted to measure key process adherence to
existing stock loss prevention procedures. They can also provide industry standards, best practice and
up-to-date thinking on new procedures.
External security/loss prevention function: External staff contracted to measure security
procedure adherence on cash, stock, alarms, key holder controls, and perform risk assessments.
They can also provide industry standards, best practice and up-to-date thinking on security issues.
67
External stock audit function: External staff contracted to count stock on a regular basis either
through entire inventories across all processes or alternatively more focused counting on high-risk
products in high-risk outlets. Used to produce performance results in a consistent format enabling
comparisons over time to be made.
Internal compliance monitoring: Staff employed to measure key process adherence to existing
stock loss prevention procedures. Unless they are specialists it is unlikely that they can provide or
compare results with industry standards. Their performance can be enhanced if they are able to report
directly to senior management.
Internal security/loss prevention function: Staff employed to measure security procedure
adherence on cash, stock, alarms, key holder controls, asset risk assessment. Unless they are specialists, it
is unlikely that they can provide industry standards. Research shows that such a function has a greater
impact if it reports directly to senior management.
Internal stock audit function: Staff used to count stock on a regular basis either through entire
inventories across all processes or alternatively more focused counting on high-risk products in high-risk
outlets. Used to produce performance results in a consistent format enabling comparisons over time to
be made.
Random checks on distribution centre picking accuracy: Internal or external agencies who carry
out load checks prior to despatch to identify picking errors. Usually focused on high risk product groups.
Store detectives: Plain-clothed security operatives employed to detect or deter would-be shop thieves.
Test purchasing ‘mystery shopper’: Customer decoys who take a normal or targeted shopping load
through suspected or regular employee to check accuracy of transaction, cash handling and
observational skills of checkout operators.
Uniformed security guards: Either contracted from a specialist company or trained as a member of
the organisation. Used as a visible deterrent to would-be offenders and often positioned near at-risk
products. Also employed to reassure staff who may feel vulnerable to crime, especially violent crime.
68
ECR Australasia are the owners of the copyright of the contents of this publication
(excluding Stock Loss Reduction Guide—printed with kind permission of ECR Europe).