
Economic reports and outlooks - Québec City CMA, 2014-2015
28
ECONOMIC REPORT AND OUTLOOKS Québec City CMA 2014 2015
-
Upload
quebec-international -
Category
Economy & Finance
-
view
140 -
download
1
Transcript of Economic reports and outlooks - Québec City CMA, 2014-2015

Economic REpoRt and outlooks
Québec City CMA
2014 2015

quebecinternational.ca
ÎLE D’ORLÉANSQUÉBEC
BOISCHATEL
L’ANGE-GARDIEN
LAC-BEAUPORT
SAINTE-BRIGITTE-DE-LAVAL
CHÂTEAU-RICHER
SAINT-AUGUSTIN-DE-DESMAURES
L'ANCIENNE-LORETTE
STE-CATHERINE-DE-LA-JACQUES-CARTIER
NEUVILLE
SAINT-GABRIEL-DE-VALCARTIER
STONEHAM-ET-TEWKESBURY
LAC-ST-JOSEPH
LÉVIS
SAINT-LAMBERT-DE-LAUZON
BEAUMONT
SAINT-HENRI
QuébEc city cEnsus mEtRopolitan aREa

1
tablE of contEntsMethodology . . . . . . . . . . . . . . . . . . . . . . . . . . . . . . . . . . . . . . . . . . . . . . . . . . . . . . . . . . . . . .2
Note to readers . . . . . . . . . . . . . . . . . . . . . . . . . . . . . . . . . . . . . . . . . . . . . . . . . . . . . . . . . . . .2
Summary . . . . . . . . . . . . . . . . . . . . . . . . . . . . . . . . . . . . . . . . . . . . . . . . . . . . . . . . . . . . . . . . . .3
Economic growth . . . . . . . . . . . . . . . . . . . . . . . . . . . . . . . . . . . . . . . . . . . . . . . . . . . . . . . . . .4
Purchasing power . . . . . . . . . . . . . . . . . . . . . . . . . . . . . . . . . . . . . . . . . . . . . . . . . . . . . . . . . .6
Labour market . . . . . . . . . . . . . . . . . . . . . . . . . . . . . . . . . . . . . . . . . . . . . . . . . . . . . . . . . . . . .8
Non-residential investment . . . . . . . . . . . . . . . . . . . . . . . . . . . . . . . . . . . . . . . . . . . . . . . . . 10
Housing market . . . . . . . . . . . . . . . . . . . . . . . . . . . . . . . . . . . . . . . . . . . . . . . . . . . . . . . . . . . 12
Demographics . . . . . . . . . . . . . . . . . . . . . . . . . . . . . . . . . . . . . . . . . . . . . . . . . . . . . . . . . . . . 14
Tourism . . . . . . . . . . . . . . . . . . . . . . . . . . . . . . . . . . . . . . . . . . . . . . . . . . . . . . . . . . . . . . . . . . 16
Appendix 1Principal economic indicators of the Québec City CMA . . . . . . . . . . . . . . . . . . . . . . . . . . . . . . . . . . . . .18
Appendix 2List of major non-residential private investment projects underway and announced in the Québec CMA . . . . . . . . . . . . . . . . . . . . . . . . . . . . . . . . . . . . . . . . . . . . 20List of major non-residential public investment projects underway and announced in the Québec CMA . . . . . . . . . . . . . . . . . . . . . . . . . . . . . . . . . . . . . . . . . . . . .21
Appendix 3List of the major private sector employees by activity in the Québec City CMA . . . .22
Glossary . . . . . . . . . . . . . . . . . . . . . . . . . . . . . . . . . . . . . . . . . . . . . . . . . . . . . . . . . . . . . . . . . 24
Economic REpoRt and outlooks
Québec City CMA
2014 2015

mEthodologyThis study, entitled Economic Report and Outlooks for the Québec City Census Metropolitan Area - 2014-2015, was conducted by Québec International . In addition to addressing key economic indicators for assessing regional performance, it takes an objective look at the results achieved in 2014 and those expected in 2015 . Changes in a number of regional economic variables are also compared with those of seven other metropolitan areas in Canada: Montréal, Toronto, Ottawa, Winnipeg, Calgary, Edmonton and Vancouver .
These benchmark regions were selected because, together with Québec City, they form the eight largest metropolitan areas in Canada and because they have diversified economies comparable to that of the Québec City Census Metropolitan Area (CMA) .
Seven key indicators were selected for this analysis: economic growth, purchasing power, labour market, non-residential investment, housing market, demographics and tourism . Major projects underway in Québec City, major employers in the region as well as historical data on the economic indicators analyzed can be found in the appendix . This study is based on statistical data published by recognized organizations . Some indicators were processed and analyzed in order to establish forecasts for 2015 .
notE to REadERsThis study was produced by Québec International’s Department of Economic Studies and Strategic Monitoring . This team of professionals is responsible for ensuring the availability of high-quality economic information . To that end, they monitor changes in the economic and business environment at the regional, national and international levels and conduct various types of research and analysis in order to identify opportunities, guide development strategies and define actions to be taken in support of regional economic growth .
The information in this study is based on the information available as at April 2015 .

Economic REpoRt and outlooks
Québec City CMA
2014 2015
3
In 2014, the economic performance of the Québec City CMA met expectations. The key indicators studied showed growth exceeding that of 2013 and owing to major capital investment projects, a gradual recovery for the manufacturing sector, growing household income and population growth. By its strong performance, the Québec City CMA has positioned itself as one of the most vibrant regions not only in Québec, but also in Canada. Last year’s advances will prove to be an important lever for stimulating economic expansion in Québec City throughout 2015.
Among the indicators that stood out, real gross domestic product (GDP) showed an increase of 1 .7% in 2014, generating a total of $34G . This performance was accompanied by 5,200 new jobs – the most important creation of jobs in all of Québec . The services sector and the recovery of the manufacturing sector, stimulated by the recovery of the American economy, supported this economic growth and the labour market . The outlook for the Québec City region is also positive in terms of personal income (+ 3 .4%) and productivity (+ 0 .4%), while non-residential investments ($1 .1G) nearly reached the record high established in 2013 ($1 .2G) .
In 2014, the economic vitality of the Québec City metropolitan area decreased the impact of certain restrictions on performance . Budgetary restraint at all levels of government, continued increases in competition from abroad and the slump in the residential market also garnered attention . Moreover, while the population is growing, it is also increasingly ageing . This is problematic for the region which must expand the work force if it is to offset the impact of retirement and sustain economic growth . The Québec City CMA’s unemployment rate, which settled at 5 .3% in 2014, continues to put great pressure on the labour market . The scarcity of available labour is a very real problem, especially among people aged 25-54 for whom the unemployment rate was 4 .3% last year .
The region’s performance in 2014 along with its constant efforts to improve the resiliency of the economy should be driving factors for 2015 . Private and public investment have already been announced . Improvement of institutional, industrial and commercial infrastructure as well as that of transportation will help diversify the region’s economic base and increase its appeal to foreign investors . An improvement in the global economic outlook and a competitive currency are factors that favour the development of foreign markets and the turnaround of the manufacturing sector .
In short, the efforts deployed in the Québec City CMA in 2014 should carry on into 2015 . This economic drive will help support efforts to expand the region’s economic base and should prove to be an asset capable of creating jobs, stimulating investment, developing businesses and improving household finances . It will allow the City of Québec to maintain its position as the economic leader among Canada’s metropolitan areas .
summaRy

1
4
Economic gRowthThe Québec City metropolitan area – the eighth largest in Canada – generated a real GDP of $34G in 2014, an increase of 1.7% over the previous year. Like Canada’s other large metropolitan areas, the region maintained an expansionist rhythm and recorded growth exceeding that of 2013 (+ 1.2%). In Québec City, the steadiness of employment (+ 5.2%), non-residential investment ($1.1G) and improvement of manufacturing conditions contributed to this growth.
Manufacturing GDP recorded a 2 .6% increase in the Québec City area between 2013 and 2014, thus ending seven consecutive years of decline . The revival of the American economy, in conjunction with the weaker Canadian dollar, allowed manufacturers to bolster their order books and to develop new foreign markets; this upward trend will continue into 2015 . The services sector, backed by all of its components, recorded an annual growth of 1 .8% . By backing the expansion of production services1 and consumer services2, the area demonstrated resilience, and this, despite the context of budget restraint that public institutions faced . The current year will be no different . Just like the other Canadian CMAs, in 2014, the Québec City CMA experienced a drop of 3 .3% in its construction industry . The area was affected by a downturn in the residential market and by fewer new major non-residential projects . For 2015, renewed investment in major residential, institutional, commercial and road construction projects will allow the construction industry to turnaround .
The economic performance of 2014 has had a positive impact on productivity3 . The real GDP to jobs ratio was $78,527 ($76,866 in Québec), an annual increase of 0 .4% (+ 1 .7% in Québec) . Construction and services productivity rose by 3 .8% and 1%, respectively, while manufacturing productivity continued to slowdown, falling by 7% . Québec City’s relatively lower productivity compared to that of other major Canadian cities may be, in part, due to the prolonged slump in the manufacturing sector .
The Québec City CMA also recorded a 0 .9% increase in GDP per capita between 2013 and 2014 (the same as the province), for a total of $42,540 ($38,001 in Québec) . To this end, it is worth noting that for the past ten years growth in this area was the highest in the province, standing at 10% (+ 5 .6% in Québec) . Thanks to this performance, Québec City ranks fourth in Canada after Winnipeg (+ 12 .1%), Vancouver (+ 12 .6%) and Edmonton (+ 18 .9%) .
Thanks to its diversity and vitality, the Québec City CMA ensured that it remained one of the most performing areas in Canada for 2014 . This performance will also prove to be an asset as 2015 kicks off . Notably, real GDP should increase by 2% and, thus, attain the average growth rate recorded over the past ten years .
1 Production services include professional, scientific and technical services as well as those pertaining to finance, insurance, real-estate, public administration, transportation and storage .
2 Consumer services include commercial, information, cultural and recreation, accommodation, and restaurant services in addition to other services .
3 Labour productivity is real GDP divided by the number of hours worked . This ratio indicates the value of goods and services produced for each hour worked . However, the concept of hours worked is not available for census metropolitan areas . To get around this problem, we used the number of jobs in each area to calculate the value of the goods and services produced by each worker .
Phot
o cr
edit
: : Lu
c A
ntoi
ne C
outu
rier

2014 2015
Economic REpoRt and outlooks
Québec City CMA
Eco
no
mic
g
Ro
wth
5
Phot
o cr
edit
: : Lu
c A
ntoi
ne C
outu
rier
Real gdp: profile of the 8 major canadian cmas
Real GDP GDP per worker GDP per capita
2014 2013-2014 variation 2014 2013-2014 variation 2014 2013-2014 variation M$ % $ % $ %
Québec 34,016.6 1.7 78.527 0.4 42.540 0.9
Toronto 304,176 .8 2 .9 98 .531 3 .0 50 .230 1 .3
Montréal 166,488 .2 2 .2 82 .449 2 .7 41 .342 1 .1
Vancouver 118,422 .2 3 .7 92 .774 1 .4 47 .939 2 .4
Calgary 116,065 .7 4 .4 145 .159 1 .7 82 .508 0 .7
Edmonton 88,874 .4 5 .4 119 .354 3 .0 66 .909 2 .0
Ottawa 63,971 .4 0 .6 90 .556 (1 .2) 48 .532 (0 .5)
Winnipeg 34,852 .8 2 .1 84 .877 2 .3 44 .532 0 .5
Sources: Conference Board of Canada, Statistics Canada and Québec International
growth in gdp per capita and per worker, Québec cma
Sources: Conference Board of Canada, Statistics Canada and Québec International
2010
43,000
42,500
42,000
41,500
41,000
40,500
40,000
79,000
78,500
78,000
77,500
77,000
76,500
76,000
$
GDP per capita ( l ) GDP per worker ( r )
$
2011 2012 2013 2014

6
puRchasing powERavERagE salaRyAccording to a recent update from the Conference Board of Canada, a worker in the Québec City CMA earned an average salary of $42,442 in 2014 ($40,878 in Québec) . This represents an increase of 2 .5% from 2013 (+2 .1% in Québec), which was favoured by the increase in the number and the diversity of jobs, especially where skilled jobs are concerned . In 2015 and in the years to come, wage increments should remain above 2% based on the positive growth outlook and on the ongoing need for labour .
pERsonal disposablE incomEThe Conference Board of Canada reported that personal disposable income (PDI) per capita amounted to $31,032 in 2014 ($27,298 in Québec), an annual increase of 3 .4% (+ 1 .8% in Québec) . The area ranked first in Québec, beating out Montréal ($28,578) . The rise in employment earnings and in government transfers will put upward pressure on PDI, a trend that will continue throughout 2015 .
inflation RatEIn 2014, inflation remained low in the Québec City CMA, reaching only 1 .3% compared to 1 .4% in the province of Québec and 2% in Canada . The upward pressure on consumer prices remained well-controlled, in particular, due to decreasing energy costs . The increase in the inflation rate, which was less than those in average salary and PDI per capita, favours a gain in the purchasing power of consumers in the region . This situation is expected to persist in 2015 .
REtail salEsIn 2014, retail sales set a record high of $13 .8G, an annual increase of 4% (+ 2 .4 in Québec) . Consumption benefited from the steadiness of employment, the boost in earnings and the low inflation rate . The arrival and expansion of new retail chains in the Québec City area as well as the modernization of existing infrastructure should favour retail sales in 2015 .
bankRuptciEsThe Québec City CMA counted 1,895 bankruptcies in 2014, 103 less than in 2013 (- 5 .2%) . To this end, 1,748 individuals filed for bankruptcy, 119 less than in 2013 (- 6 .4%) . More jobs, the low inflation rate and favourable interest rates contributed to improving the financial health of consumers . In terms of businesses, Québec City counted 147 corporate bankruptcy filings in 2014, 16 more than in 2013 (+ 12 .2%) . Innovative capability and the development of markets are assets to improving the financial performance of businesses in the area . However, conjunctural and structural constraints persist . This constitutes the fourth decrease in total bankruptcies in five years; it is, therefore, likely that the area will follow this downward trend in 2015 .
2Ph
oto
cred
it: :
Yve
s Te
ssie
r, Ta
ssim
a

2014 2015
Economic REpoRt and outlooks
Québec City CMA
7
Phot
o cr
edit
: : Y
ves
Tess
ier,
Tass
ima
profile of the purchasing power of the 8 major canadian cmas, 2014
PDI per capita Average salary Inflation rate
$ Variation (%) $ Variation (%) % 2014 2013-2014 2014 2013-2014 2014
Québec 31,032 3.4 42,442 2.5 1.3
Calgary 43,781 1 .9 69,824 3 .4 3 .0
Edmonton 38,097 2 .3 61,337 3 .3 2 .2
Ottawa 33,700 1 .6 49,249 1 .6 2 .0
Vancouver 32,710 2 .9 45,239 2 .9 1 .1
Toronto 32,012 2 .9 50,389 2 .7 2 .5
Winnipeg 29,835 1 .3 43,049 2 .6 1 .9
Montréal 28,578 3 .0 42,994 2 .7 1 .5
Sources: Conference Board of Canada and Québec International
Retail sales, Québec city cma
2010
12,144
12,497
12,704
13,272
13,79914,000
13,500
13,000
12,500
12,000
11,500
11,000
10,500
10,000
7
6
5
4
3
2
1
0
M$
Retail sales (left) Annual variation (right)
%
2011 2012 2013 2014
Sources: Conference Board of Canada and Québec International
puR
ch
asi
ng
pow
ER

8
3In 2014, the Québec City CMA proved to have the most performing labour market in the province of Québec. The area accounted for the greatest number of new jobs (5,200) compared to 2013, bringing the total number of jobs to a record high of 433,700. It also recorded the lowest unemployment rate (5.3%) and the highest employment rate (65.2%). These results put Québec City in fifth place for job creation and in third place for rates of unemployment and employment among the eight largest metropolitan areas in Canada.
The services sector – the region’s economic powerhouse – added 3,000 new jobs in 2014 . In particular, consumer services (commerce, tourism, etc .) and public services (education, health, etc .) contributed to these new jobs . Moreover, the performance of these services offset the stagnation in production services (professional, scientific and technical, insurance services, etc .) . In 2015, the favourable outlook for services related to information technology, the medical field, insurance, administration, engineering and tourism will create excellent conditions for job seekers . The need for labour should thus continue to ease concerns over rigorous fiscal measures and over the closure of certain major retail chains .
In 2014, the manufacturing sector accounted for 31,300 jobs in Québec City – 2,900 more than in 2013 . The steadiness of most of the sector’s components was such that the manufacturing of durable goods accounted for 72% of all new manufacturing jobs last year . As for the manufacturing of non-durable goods, its growth was limited to hiring in the food processing industry . The expansion of the American economy, the development of new export markets and the launch of new value-added manufactured goods will continue to favour hiring in 2015 .
The construction industry employed 23,000 workers in 2014 – 1,700 less than in 2013 . The slowdown in the residential market and the completion of several major non-residential projects slowed the creation of jobs . However, the number of construction jobs in 2014 was almost double what was reported in the census ten years ago . In 2015, the pre-lease and pre-sale periods for several major projects will be drawing to a close and the ensuing start-ups, expected in the second half of the year, could create favourable conditions for job seekers .
The economic diversification that has taken place in the region, over the past few years has created conditions that favour the labour market . However, the lack of available and qualified potential applicants is of significant concern for employers . The situation is particularly apparent in the 25-54 age group, which represents 61% of all jobs . In 2014, this group recorded unemployment and employment rates of 4 .3% and 87 .4%, respectively . While enviable, when combined with the moderate growth of the active population, these rates hamper businesses that wish to expand . According to the Léger survey on the confidence of entrepreneurs, 83% of business leaders claim to be facing a recruitment challenge . Foreign recruitment seems to offer a solution to the problem . For instance, international recruitment campaigns helped attract around 1,200 skilled foreign workers to Québec City between 2008 and 2014 .
labouR maRkEt

Economic REpoRt and outlooks
Québec City CMA
2014 2015
9
lab
ou
R m
aR
kEt
Employment market profile of the 8 major canadian cmas
Employment (‘000) Variation (%) Unemployment rate Employment rate 2014 2013-2014 2010-2014 15-64 years 25-54 years 15-64 years 25-54 years
Québec 433 .7 1 .2 4 .3 5 .3 4 .3 65 .2 87 .4
Toronto 3,087 .4 (0 .2) 7 .2 8 .0 6 .6 61 .5 79 .5
Montréal 2,019 .5 (0 .5) 3 .5 8 .2 7 .2 60 .7 80 .2
Vancouver 1,276 .3 2 .3 6 .3 5 .8 5 .1 60 .9 80 .0
Calgary 1,146 .8 3 .7 13 .7 5 .0 4 .2 69 .7 84 .0
Edmonton 744 .8 2 .3 16 .5 5 .1 4 .3 69 .3 83 .8
Ottawa 707 .0 1 .8 3 .0 6 .7 5 .3 65 .1 83 .6
Winnipeg 410 .8 (0 .2) 3 .2 5 .8 4 .7 63 .9 83 .9
Sources : Statistics Canada and Québec International
Employment variation by activity sector, Québec city cma
130
120
110
100
90
80
702010 2011 2012 2013 2014
+19 %+13 %
+9 %
+0.6 %(3 %)
(22 %)
Index 2010=100
Production servicesConsumption servicesGovernment servicesDurable goodsNon-durable goodsConstruction
Sources: Statistics Canada and Québec International
10
non-REsidEntial invEstmEnt 4
10
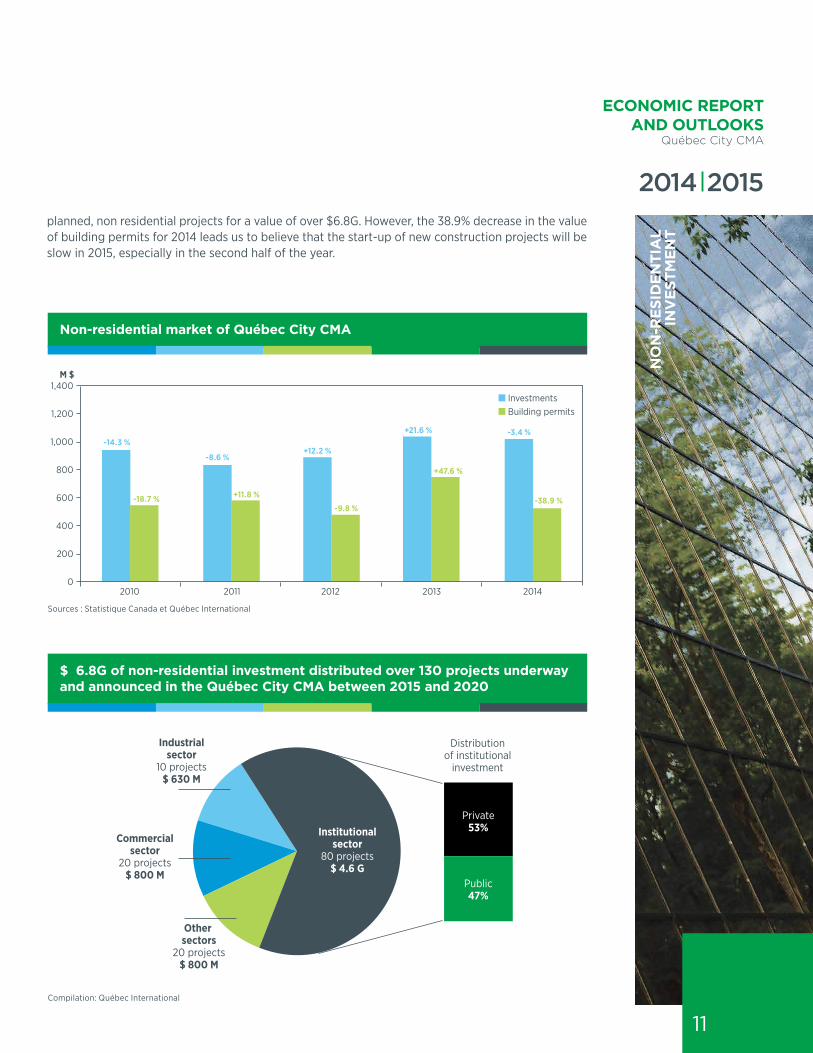
According to Statistics Canada, $1.1G was invested in the non-residential sector of the Québec City CMA in 2014. In fact, investment in the region, which posted an annual decrease of 3.4% ($38.7M), nearly tied the 2013 record. The completion of several major projects seems to have had a moderating effect on the area’s performance, while the province and the country recorded an annual increase of almost 1%. Despite this, the region represented 10.9% and 2.2% of total non-residential capital expenditures in Québec and Canada, respectively. Thus, maintaining its position as the second most important area in Québec (after Montréal) and the eighth most important in Canada.
The commercial sector invested $846M in Québec City last year . Despite an annual decline of 2 .9%, several projects stood out; namely, the Carrefour St-Romuald, the commercial revitalization of downtown Lévis and the arrival of several community services (pharmacies, grocery stores, etc .) . For 2015, several major shopping malls (Galeries de la Capitale, Place Ste-Foy, etc .) are looking to modernize their infrastructures, which should offset the recently announced closure of a handful of large retailers . The area’s role as an important commercial hub for the east of Québec constitutes another investment-promoting factor . In this regard, there are currently some twenty-odd major projects announced or underway, totaling an estimated $800M .
Meanwhile, the institutional market generated expenditures of $181M in 2014, an increase of 2 .8% over 2013 . Last year, work on around ten construction sites came to a close, adding over a million square feet of office space . This upward trend should continue given that the region’s vacancy rate was the lowest in Canada (6 .8%) during the fourth quarter of 2014 . A number of projects in Lebourgneuf, Sainte-Foy and Lévis are at the start-up phase or the last phase of the pre-lease process . Work has also continued on the new amphitheatre as well as on research centres, educational and health institutions, and transportation infrastructure . Finally, two major projects will garner much attention over the next decade . Groupe Dallaire plans to invest close to $600M in their Le Phare complex, while the health sector intends to invest in the university medical center of Québec (CHU de Québec) following talks on the future of the Hôtel-Dieu de Québec and the Hôpital de l’Enfant-Jésus . In all, the Québec City area has around 80 current, or planned, institutional projects for a value of $4 .6G .
Last year, the industrial sector invested $85M in capital . Despite an annual performance decrease of 18%, the region has succeeded in attaining a performance level equal to that of its ten-year average . While the modernization of existing infrastructure remains a concern, investment in this area will improve production processes and reduce production costs . There are presently ten-odd major projects, valued at $630M, announced or underway in the Québec City area . In the future, the expansion of the St-Augustin industrial park and the construction of another industrial park, the Espace d’innovation Michelet, should lead to the construction of new industrial buildings .
The diversity of these projects should stimulate non residential investment in Québec City . Moreover, other projects to improve road infrastructure, public transport networks and energy facilities – which are beyond the scope of this report – are already underway or have been announced . To sum up, the Québec City area has around 130 current, or
2014 2015
Economic REpoRt and outlooks
Québec City CMA
11
no
n-R
Esid
Enti
al
inv
Estm
Ent
planned, non residential projects for a value of over $6 .8G . However, the 38 .9% decrease in the value of building permits for 2014 leads us to believe that the start-up of new construction projects will be slow in 2015, especially in the second half of the year .
non-residential market of Québec city cma
$ 6.8g of non-residential investment distributed over 130 projects underway and announced in the Québec city cma between 2015 and 2020
20132012
-14.3 %
-8.6 %
-3.4 %
-38.9 %-9.8 %
-18.7 %
+12.2 %
+21.6 %
+11.8 %
+47.6 %
2011
M $
Building permitsInvestments
2010
1,400
1,200
1,000
800
600
400
200
02014
Sources : Statistique Canada et Québec International
Compilation: Québec International
Private53%
Distributionof institutional
investment
Industrialsector
10 projects$ 630 M
Commercialsector
20 projects$ 800 M
Other sectors
20 projects$ 800 M
Public47%
Institutionalsector
80 projects$ 4.6 G

12
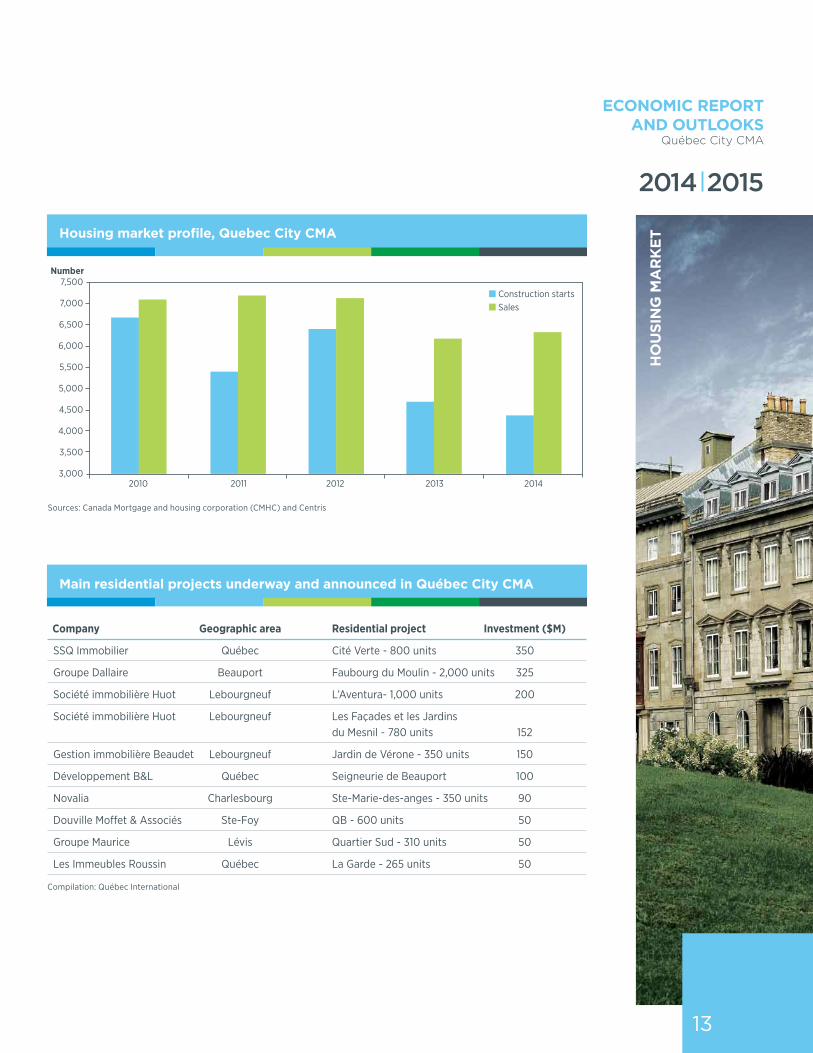
5The housing market in the Québec City CMA showed a certain stability in 2014. Construction starts decreased slightly, sales of existing properties improved somewhat and the average price of homes increased at the same rate as inflation. Potential buyer interest remained strong in light of the region’s good economic performance. However, the growing number of new and existing properties for sale and the diversity of these properties limits the number of new construction projects and lengthens the amount of time required to sell.
The construction industry has gradually begun to slowdown . Last year, the metropolitan area’s total housing stock increased by 4,449 new units – 231 fewer than in 2013 . As we expected, residential construction benefited from good employment levels, favourable tax credits and household formation . However, the dwindling number of new homes for sale and the increasing number of existing properties for sale have slowed new project starts, especially for rental and single-family dwellings .
In 2014, 2,843 new apartments and 887 single-family houses were built in the region; that’s 226 and 74 fewer units, respectively, than in 2013 . The rising vacancy rate (3 .1% in October) seems to be pushing the rental market under the annual 3,000-unit mark . Meanwhile, the slump in single-family house sales continued for a fourth consecutive year . To this effect, single-family houses totaled only 20% of all new construction starts last year compared to 44% ten years ago . Duplexes and townhouses continued to garner the interest of young families seeking to purchase an affordable property . In 2014, 729 new units were built – 79 more than in 2013 .
Finally, the number of major projects in the Québec City CMA suggests that construction starts will continue to hover around the 4,000-unit mark in 2015 . There are also a hundred-odd projects underway or announced, totalling over $3 .5G that would potentially add 8,000 new units to the area over the next few years . It should be noted that this does not include the two big projects recently announced by Group Dallaire in Sainte-Foy (Le Phare) and in Beauport (Sœur de la Charité) which could add over 3,000 units .
For its part, the resale market recorded 6,472 transactions in 2014 – 199 more than in 2013 . The favourable economic outlook, the increase in listings and the moderate jump in prices has had a positive effect on all components . There were 4,489 transactions for single-family houses, 1,485 for condominiums and 490 for plexes . These numbers represent annual increases of 2%, 3% and 12%, respectively . With regard to transaction prices, the average increased by only 2% for single-family houses, settling at $245,000 . The average price of a condominium was $198,500 while it was $287,500 for a plex, down 1% and 4%, respectively .
In the coming years, the resale market is expected to record between 6,500 and 7,000 transactions annually . The region will benefit particularly from an increase in new listings . A rise in the offer will also curb rising transaction prices, which are expected to stabilize around the 1% mark and, therefore, should not contribute to household mortgage burden .
housing maRkEt
Economic REpoRt and outlooks
Québec City CMA
2014 2015
ho
usi
ng
ma
Rk
Et
13
housing market profile, Quebec city cma
main residential projects underway and announced in Québec city cma
Company Geographic area Residential project Investment ($M)
SSQ Immobilier Québec Cité Verte - 800 units 350
Groupe Dallaire Beauport Faubourg du Moulin - 2,000 units 325
Société immobilière Huot Lebourgneuf L’Aventura- 1,000 units 200
Société immobilière Huot Lebourgneuf Les Façades et les Jardins du Mesnil - 780 units 152
Gestion immobilière Beaudet Lebourgneuf Jardin de Vérone - 350 units 150
Développement B&L Québec Seigneurie de Beauport 100
Novalia Charlesbourg Ste-Marie-des-anges - 350 units 90
Douville Moffet & Associés Ste-Foy QB - 600 units 50
Groupe Maurice Lévis Quartier Sud - 310 units 50
Les Immeubles Roussin Québec La Garde - 265 units 50
Compilation: Québec International
201320122011
Number
SalesConstruction starts
2010
7,500
7,000
6,500
6,000
5,500
5,000
4,500
4,000
3,500
3,0002014
Sources: Canada Mortgage and housing corporation (CMHC) and Centris

In 2014, 799,632 people lived in the Québec City CMA. This corresponds to an annual growth rate of 0.8% between 2013 and 2014 – a rate similar to that of the province of Québec. Accounting for 9.7% of Québec’s population and 2.25% of Canada’s population, the CMA is the second most important metropolitan area in Québec and the seventh in the country. Between 2004 and 2014, the region’s population increased by 11.4%, while that of Québec grew by 9%. The Institut de la statistique du Québec (ISQ) predicts that the CMA’s population will grow by 7.3% over the next decade (7.7% for Québec). The ISQ’s demographic forecast also suggests that the growth rate for the region will follow a downward trend, remaining above 1% by 2036.According to the most recent data, the Québec City CMA registered 8,432 births in 2013 . The reference scenario set by the ISQ predicts that the number of births each year will remain above the 8,000 mark for the next decade . The creation of new families, the quality of life in the region and the level of consumer confidence will continue to support the birth rate in the long term .
Furthermore, the Québec City CMA also displays a favorable outcome with regards to immigration . In keeping with the trend observed over the past three years, the region, welcomed over 3,000 foreign immigrants in 2013-2014 . The region’s sustained economic growth, increasing need for skilled labour and quality of life will ensure that it continues to remain attractive in the eyes of international immigrants . In this regard, the ISQ predicts that the CMA will maintain this power of attraction over the next 20 years .
It should be noted that international immigrants who settle in the Québec City CMA are more skilled than those who settle elsewhere in the province . In fact, 71% of them have a post-secondary diploma (61 .7% in Québec), of which 39 .1% hold a university degree (30 .9% in Québec) . Moreover, at both the regional and the provincial levels, these immigrants are significantly more educated than the rest of the population . Despite this, the unemployment rate remains higher for immigrants than for the total population: 3 .7% higher in the Québec City CMA and 4% higher in Québec . This situation confirms that there is still much to be done in terms of improving how immigrants are integrated into the community and how businesses tap into this potential labour pool .
Finally, analysis of the distribution of the population by age group confirms that the region is facing an ageing population . According to the ISQ, this situation will remain the same over the next ten years . Thus, the 15 to 24 age group (representing youth potentially ready to enter the workforce) will continue to shrink from 12 .1% of the population in 2014 to 9 .8% in 2024 . Likewise, the demographic weight of the 25 to 39 age group and the 40 to 54 age group will continue to decline from 21 .1% to 19 .5% and from 20 .1% to 19 .2%, respectively . Conversely, the demographic weight of the 55 to 64 and the 65 and over age groups will continue to increase . This situation is expected to persist until 2024 . These findings highlight the importance of maintaining efforts to find new labour pools – especially abroad – as a means of meeting the growing needs of businesses .
dEmogRaphics
14
6

Economic REpoRt and outlooks
Québec City CMA
2014 2015
dém
og
Ra
phic
s
15
Educated immigrants and integrated labor market in Québec
Québec City CMA Province of Québec Immigrants Total Immigrants Total
Unemployment rate 8 .1% 4 .4% 11 .2% 7 .2%
Employment rate 62 .5% 64 .4% 55 .4% 59 .9%
University diploma 39 .1% 22 .4% 30 .9% 18 .5%
Post-secondary diploma 71 .8% 63 .6% 61 .7% 56 .0%
No diploma 13 .1% 15 .2% 19 .9% 22 .0%
Average employment income $34,236 $39,124 $35,363 $36,352
Source: Statistics Canada, National Household Survey (2011)
demographic weight per age category in the Quebec cma
%30
25
20
15
10
5
0
2004
0-14
15.5%
13.1%
20.8%
24.9%
12.4%13.3%
14.4%
9.8%
19.5% 19.2%
23.4%
12.7%
15-24 25-39 40-54 55-64 65 and +
2014 2024
14.4%
12.1%
21.1%20.1%
14.3%
17.9%
Source: Institut de la statistique du Québec
The Québec City area is a tourist destination of regional, national and international renown. However, competition in the tourism market is fierce and several factors, especially those related to the state of the economy, influence the region’s overall performance as a tourist destination. In 2014, the composite index of tourism activity rose by 0.9 of a percentage point, reaching 100.9. Although modest, this increase was based on several increasing components, including those related to accommodation, shopping, passenger traffic at the airport and the number of cruise passengers. Other components, however, fell during this period, moderating the increase of the index.
In 2014, the sites and attractions index as well as the restaurant index recorded slight dips of 0 .9 and 1 .9 percentage points, respectively . This decline was offset by, among others, a rise in the shopping index by 5 percentage points compared to 2013 which helped sustain the upward trend that began in 2012 .
With respect to accommodation, the hotel occupancy index increased from 100 in 2013 to 102 .7 in 2014 . The improvement in the performance of the lodging industry was also reflected in the hotel occupancy rate, which was at 61 .7% in 2014, against 58 .2% in 2013 .
Moreover, the Jean-Lesage International Airport had an excellent year . There were 1,574,699 travellers that transited through the airport, an increase of 6 .7% from 2013 . Consequently, the annual airport index rose by 7 .7 percentage points . The majority of passengers travelled to a destination within the province (54 .7%) . This category of passengers recorded the highest growth rate (15 .4%) since 2013 . This steady increase in passenger traffic is, therefore, in keeping with the airport’s objective to pass the two million passenger mark by 2020 . As such, the terminal expansion project is ongoing . Once completed it will allow the airport to welcome more travellers and to better meet client needs .
Likewise, the Port of Québec was exceedingly busy in 2014: 180,836 passengers visited Québec City by cruise ship . This represents a growth rate of 11 .6% from 2013, which was already a record-breaking year . The constant increase in the number of embarkation/disembarkation operations handled by the Port of Québec makes it the most important port on the St . Lawrence River in terms of visits from international cruises in 2014 . Plans to update both the Paquet wharf and the current north shore terminal will ensure that operations are managed in a more efficient and productive manner in the coming years .
Other investment projects that are already underway or that have been announced will stimulate the Québec City area’s tourism offering in 2015 . Examples of such investments to attract more visitors to the region are the creation of a new station for the tourist train on the Charlevoix to Sainte-Anne-de-Beaupré circuit and the Parc de la Chute-Montmorency enhancement project . Moreover, the depreciation of the Canadian dollar and the dip in oil prices could have a beneficial effect on the number of travellers that choose to visit Québec City in 2015 .
touRism
16
7Ph
oto
cred
it: C
laud
el H
uot

17
tou
Ris
m
2014 2015
Economic REpoRt and outlooks
Québec City CMA
Phot
o cr
edit
: Cla
udel
Huo
t
tourism indicators for the Québec city area
2013 2014 Index Index
Composite index of tourism activity 100 100 .9
Hotel occupancy index 100 102 .7
Site/attraction visit index 100 99 .1
Shop visits index 100 105
Restaurant occupancy index 100 98 .1
Jean-Lesage international airport use index 100 107 .7
Hotel occupancy rate (%) 58 .2% 61 .7%
Source: Québec City Tourism

pRincipal Economic indicatoRs of thE QuébEc city cma
2004 2011 2012 2013 2014 2015f
Real GDP (millions of $) 27,778 .4 32,555 .2 33,070 .5 33,454 .0 34,016 .6 34,823 .2
Annual change (%) 3 .0 2 .0 1 .6 1 .2 1 .7 2 .8
Real GDP per capita ($) 38,682 .7 41,908 .2 42,115 .8 42,159 .0 42,540 .4 43,178 .0
Annual change (%) 2 .2 0 .7 0 .5 0 .1 1 .0 1 .5
Disposable income per capita 20,737 25,702 26,576 26,809 27,297 28,033
Annual change (%) 3 .4 3 .0 3 .4 0 .9 1 .8 2 .7
Average wage ($) 32,633 38,498 39,626 40,032 40,877 n/a
Annual change (%) 3 .0 4 .2 2 .9 1 .0 2 .1 n/a
Population 718,110 776,821 785,227 793,519 799,632 805,164
Annual change (%) 0 .8 1 .3 1 .1 0 .8 0 .8 0 .8
Labour market Labour force 388,900 448,900 452,000 449,800 457,900 461,563 Annual change (%) -0 .3 2 .5 0 .7 -0 .5 1 .8 0 .8 Number of jobs 366,500 425,200 429,100 428,500 433,700 438,200 Annual change (%) 0 .9 2 .3 1 .0 -0 .1 1 .2 1 .0 Job creation 3,200 9,500 3,900 600 5,200 4,500 Manufacturing 33,400 32,200 27,600 28,400 31,300 n/a Food processing 6,100 4,100 6,100 5,100 6,200 n/a Chemicals 1,900 2,200 1,900 2,000 n/a n/a Rubber/plastic products n/a 3,100 n/a 1,600 1,500 n/a Metal products 1,800 3,000 3,400 3,100 2,000 n/a Transporation equipment
and machinery 4,700 4,400 2,500 4,500 3,500 n/a Computer, electronic
and electrical products n/a 2,100 n/a n/a 2,800 n/a Construction 13,500 26,600 23,100 25,000 23,300 n/a Services 313,600 362,500 374,600 370,700 373,700 n/a Public utilities 117,200 133,800 146,700 145,800 146,400 n/a Financial, insurance and real estate 23,400 36,600 34,400 31,600 31,600 n/a Professional, scientific
and technical services 22,300 34,600 38,800 38,300 37,300 n/a Wholesale and retail trade 58,900 61,800 59,100 61,600 61,600 n/a Transportation and storage 17,200 14,600 16,600 18,400 14,400 n/a Accomodation and food services 25,700 35,100 31,500 28,100 34,300 n/a Unemployment rate (%) 5 .4 5 .3 5 .0 4 .7 5 .3 5 .1 Participation rate (%) 66 .0 69 .2 68 .9 68 .0 68 .8 69 Employrment rate (%) 62 .2 65 .5 65 .4 64 .8 65 .2 65 .3
appEndix 1
18
2014 2015
Economic REpoRt and outlooks
Québec City CMA
19
app
End
ix
2004 2011 2012 2013 2014 2015f
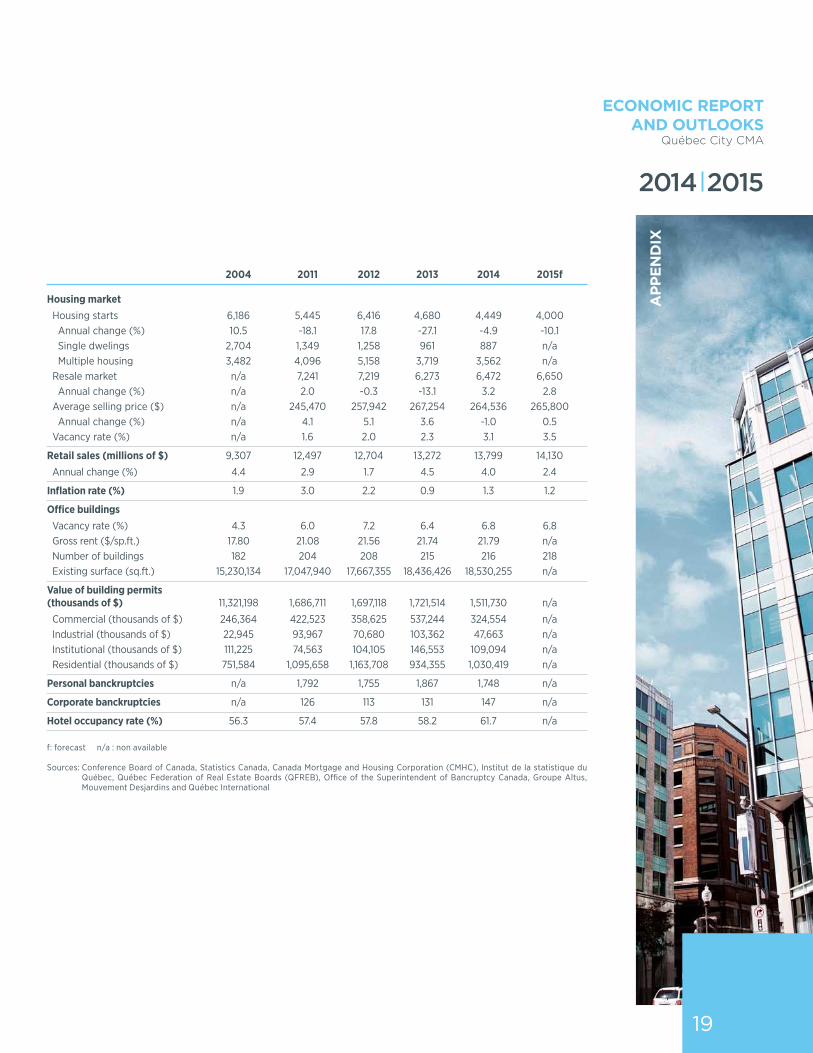
Housing market Housing starts 6,186 5,445 6,416 4,680 4,449 4,000 Annual change (%) 10 .5 -18 .1 17 .8 -27 .1 -4 .9 -10 .1 Single dwelings 2,704 1,349 1,258 961 887 n/a Multiple housing 3,482 4,096 5,158 3,719 3,562 n/a Resale market n/a 7,241 7,219 6,273 6,472 6,650 Annual change (%) n/a 2 .0 -0 .3 -13 .1 3 .2 2 .8 Average selling price ($) n/a 245,470 257,942 267,254 264,536 265,800 Annual change (%) n/a 4 .1 5 .1 3 .6 -1 .0 0 .5 Vacancy rate (%) n/a 1 .6 2 .0 2 .3 3 .1 3 .5
Retail sales (millions of $) 9,307 12,497 12,704 13,272 13,799 14,130
Annual change (%) 4 .4 2 .9 1 .7 4 .5 4 .0 2 .4
Inflation rate (%) 1 .9 3 .0 2 .2 0 .9 1 .3 1 .2
Office buildings Vacancy rate (%) 4 .3 6 .0 7 .2 6 .4 6 .8 6 .8 Gross rent ($/sp .ft .) 17 .80 21 .08 21 .56 21 .74 21 .79 n/a Number of buildings 182 204 208 215 216 218 Existing surface (sq .ft .) 15,230,134 17,047,940 17,667,355 18,436,426 18,530,255 n/a
Value of building permits (thousands of $) 11,321,198 1,686,711 1,697,118 1,721,514 1,511,730 n/a
Commercial (thousands of $) 246,364 422,523 358,625 537,244 324,554 n/a Industrial (thousands of $) 22,945 93,967 70,680 103,362 47,663 n/a Institutional (thousands of $) 111,225 74,563 104,105 146,553 109,094 n/a Residential (thousands of $) 751,584 1,095,658 1,163,708 934,355 1,030,419 n/a
Personal banckruptcies n/a 1,792 1,755 1,867 1,748 n/a
Corporate banckruptcies n/a 126 113 131 147 n/a
Hotel occupancy rate (%) 56 .3 57 .4 57 .8 58 .2 61 .7 n/a
f: forecast n/a : non available
Sources: Conference Board of Canada, Statistics Canada, Canada Mortgage and Housing Corporation (CMHC), Institut de la statistique du Québec, Québec Federation of Real Estate Boards (QFREB), Office of the Superintendent of Bancruptcy Canada, Groupe Altus, Mouvement Desjardins and Québec International

list of majoR non-REsidEntial pRivatE invEstmEnt pRojEcts undERway and announcEd in thE QuébEc cma
Investment Company Geographic Activity Project ($M) area sector
600 Groupe Dallaire Sainte-Foy Offices and Construction of the commercial building complex Le Phare
500 Port de Québec Québec Transport Modernization of port facilities
400 Société immobilière Lévis Commercial Construction of the Maestri Terra commercial complex Carrefour Saint-Romuald
225 Québec City Québec Transport Modernization Jean-Lesage of airport facilities International Airport
160 Groupe Dallaire Sainte-Foy Offices and Construction of the commercial building complex Espace Ozone
150 Oxford Lebourgneuf Commercial Modernization of the Galeries de la Capitale shopping center
50 Ivanhoé Cambridge Sainte-Foy Commercial Modernization of the Place Ste-Foy shopping center
36 GSK Québec Industrial Modernization of the production facilities
35 Asentri Québec ICT Construction of a computer data center
28 Ubisoft Québec ICT Construction of 100 new workstations
25 Oxford Lebourgneuf Commercial Modernization of the Galeries de la Capitale shopping center
20 ABB Québec Industrial Contruction of new facilities
16 Honco Lévis Entertainment Construction of a sports complex
12 Groupe Dallaire Québec Offices and Construction of a mixed commercial complex - Phase 1
12 Construction CSB Lévis Commercial Construction of the lace Deschamps complex
appEndix 2
20

2014 2015
Economic REpoRt and outlooks
Québec City CMA
21
app
End
ix
list of majoR non-REsidEntial public invEstmEnt pRojEcts undERway and announcEd in thE QuébEc cma
Investment Company Geographic Activity Project ($M) area sector
400 Ministère Québec Transport Expansion of the des Transport Henri-IV highway du Québec
400 City of Québec Québec Culture and Construction of a entertainment multi-purpose arena
130 CSST Québec Health Modernization of the offices
104 Gouvernement Québec Culture Reconstruction of the armoury of Canada
103 Musée national Québec Culture Enlargement of the museum des beaux-arts du Québec
60 Québec Heart and Québec Health Enlargement of the Lung Institute research center (5 phases)
56 City of Québec Québec Culture and Modernization of the entertainment Gabrielle Roy library
50 National Assembly Québec Public services Modernization of the facilities of Québec
39 RAMQ Québec Insurance Modernization of the offices
32 City of St-Augustin St-Augustin Entertainment Construction of a sports complex
25 City of Québec Beauport Entertainment Construction of a soccer stadium
21 City of Québec Québec Health Construction of a R&D complex
20 City of Lévis Lévis Transport Revitalization of the Lévis ferry area
17 Musée de Québec Culture Modernization of the museum la civilisation
17 Société des Lévis Transport Revitalization of the Lévis Traversiers ferry area du Québec
Source : Indicateur des projets au Québec and Commission de la Construction du Québec

ICT Number of employees
CGI 1,000 - 2,400
Fujitsu Conseil 1,000 - 2,400
Artefact Informatique 300 - 499
G .D .G . Informatique et gestion inc 300 - 499
Acceo 100 - 299
Telecommunications Number of employees
HS Télécom 300 - 499
Télus Québec 100 - 299
Signalisation Ver-Mac 100 - 299
Siemens Canada Ltée less than 100
Orizon Mobile less than 100
Electronics Number of employees
Olympus NDT Canada 300 - 499
Lab-Volt Ltée 300 - 499
Gecko Alliance 100 - 299
Éclairage Contraste ML inc . 100 - 299
M2S Électronique 100 - 299
Optics and photonics Number of employees
Exfo Ingénierie Électro-Optique 500 - 699
ABB Analytical inc . 100 - 299
Creaform inc . 100 - 299
Teraxion inc . 100 - 299
Infodev Electronic Designers International less than 100
Software Number of employees
Oracle Taleo Canada 300 - 499
Microflex 2001 L .L .C . 100 - 299
Innovmetric Logiciels less than 100
Korem less than 100
C .T .R .L . Informatique less than 100
Web development Number of employees
Nurun inc . 100 - 299
GP3 Groupe Conseil inc . 100 - 299
Ellicom less than 100
Tink less than 100
IXMédia less than 100
Digital arts Number of employees
Valéa Productions less than 100
Libéo less than 100
EX MACHINA less than 100
Télémag Québec less than 100
ABUZIVE MUSIC INC . less than 100
Gaming Number of employees
Frima Studio 300 - 499
Beenox inc . 300 - 499
Ubisoft 100 - 299
Sarbakan less than 100
Studio Élément less than 100
Biopharmaceutical Number of employees
GlaxoSmithKline Biotechnologicals Amérique du Nord 700 - 999
Inventiv Health Clinical 300 - 499
BD Diagnostics-GeneOhm 300 - 499
Medicago 100 - 299
Endoceutics less than 100
Insurance Number of employees
Desjardins Sécurité Financière 4,000 - 5,400
Industrielle Alliance, Assurance et Services Financiers inc . 1,000 - 2,400
Capitale Assurances et Gestion du Patrimoine inc . 1,000 - 2,400
SSQ Assurances générales 700 - 999
Groupe Promutuel 700 - 999
appEndix 3
22
list of thE majoR pRivatE sEctoR EmployEEs by activity in thE QuébEc city cma

23
Medical technologies Number of employees
Corporation Steris Canada 300 - 499
Savard Ortho Confort 100 - 299
Orthofab less than 100
Omegachem inc . less than 100
Cosmetic and natural Number of health products employees
Atrium Innovations inc . 100 - 299
Épiderma less than 100
Heliolab less than 100
Homeodel inc . less than 100
Immanence Intégrale Dermo Correction less than 100
Food processing Number of employees
Biscuits Leclerc ltée 500 - 699
Frito Lay Canada 300 - 499
Alex Coulombe ltée 300 - 499
Aliments Martel inc . 100 - 299
Agropur Coopérative 100 - 299
Wood products Number of employees
Préverco inc . 100 - 299
Teknion Concept 100 - 299
Concept Avanti less than 100
Produits Forestiers Résolu less than 100
Prestolam inc . less than 100
Rubber, plastic and Number of composite materials employees
PH Tech inc . 100 - 299
Novik 100 - 299
Caron et Guay 100 - 299
Bains Ultra inc . less than 100
Groupe Polyalto less than 100
Metal products Number of employees
Julien 300 - 499
Supermétal Structures inc . 300 - 499
Multiver Ltée 300 - 499
General Dynamics 100 - 299
Solaris Québec inc . 100 - 299
Transport material and machinery Number of employees
Davie 700 - 999
Groupe Environnemental Labrie inc . 500 - 699
Premier Tech ltée 100 - 299
S . Huot inc . 100 - 299
Wajax Systèmes de puissance 100 - 299
Energy and environment Number of employees
Gaz Métro 1,000 - 2,400
Ultramar ltée 500 - 699
Gaudreau Environnement inc . 100-299
Services Matrec inc . (Division Québec) 100-299
G .L .R . inc . 100-299
Finances Number of employees
Fédération des Caisses Desjardins du Québec 6,000 - 7,400
Banque Nationale du Canada 700 - 999
Banque Royale 100 - 299
Banque Laurentienne 100 - 299
CIBC 100 - 299
Accommodations Number of employees
Fairmont le Château Frontenac 1,000 - 2,400
Hôtel Palace Royal 1,000 - 2,400
RCR 700 - 999
Village Vacances Valcartier 500 - 699
Camp de Jour Keno 500 - 699
Restauration Number of employees
Mc Donald’s 1,000 - 2,400
Restaurant Normandin 1,000 - 2,400
Rôtisserie Saint-Hubert 700 - 999
Tim Hortons 500 - 699
Ashton (Chez) 500 - 699
app
End
ix
glossaRy
Economic REpoRt and outlooks
Québec City CMA
2014 2015
24
dEmogRaphicsNatural growthChanges in population numbers due to net births/deaths .
Census metropolitan area (CMA)Area formed by one or more neighbouring municipalities located around a major urban centre . To constitute a CMA, the urban centre must have a population of at least 100,000 . To constitute a census agglomeration, the urban centre must have a population of at least 10,000 .
Net migrationThe difference between the number of persons moving into an area and the number of persons leaving in a given year . This concept does not take into account nationality .
labouR maRkEtUnemployedPersons who are available to work, have no paid employment and are actively looking for a job .
EmployedIncludes all people who did any work for pay or profit as well as those who have a job and are absent from work .
Replacement indexThe ratio of the expected number of young people entering the labour market (aged 20 to 29) to the expected number of workers retiring (aged 55 to 64), multiplied by 100 .
Active (working) populationCivilian population aged 15 years old and higher, not living in an institution and or on a reserve, either employed or unemployed .
Working-age populationCivilian population aged 15 to 64 .
Average salaryThe average wage/salary earned by full-time workers (more than 30 hours/week) in a normal working year .
Participation rateActive population expressed as a percentage of the total population aged 15 years and older .
Unemployment rateNumber of unemployed expressed as a percentage of the active population .
Employment rateNumber of active workers expressed as a percentage of the total population aged 15 years and older .
EconomicsBankruptcyThe state of being or becoming bankrupt .
Gross domestic product (GDP)The total unduplicated value of the goods and services produced in an economic area (such as a region) during a given period, regardless of the ownership (foreign/domestic) of the production factors . GDP at basic prices corresponds to the GDP calculated at market prices, less tax deductions applicable to goods, plus consumer subsidies .
Personal disposable incomePersonal income less direct personal income taxes, social insurance contributions and other current transfers to public administrations .
Inflation rateLoss of a currency’s buying power that results in a generalized and lasting increase in prices .
invEstmEnts and building pERmitsCapital investmentsCapital expenditures related to new construction projects and major improvements to existing buildings, in addition to purchases of new machinery and equipment . These expenditures do not include purchases of land or used machinery or equipment (unless imported) .
Public-sector investmentsCapital expenditures made by publicly-owned companies and governments at the federal, provincial and local levels .
Building permitsBuilding permits correspond to those issued by municipalities for the construction of new buildings or the undertaking of improvements .
Value of building permitsThe value of planned building projects in the non-residential and residential sectors .

25
housing maRkEtCondominiumA legal structure under which the ownership of immovable property is divided among various co-owners .
Rental housingResidential dwellings or buildings available for rent .
PlexRental housing consisting of two to five dwellings .
Single-family houseSelf-contained dwelling entirely detached from all other dwellings or buildings .
Construction startsNumber of new residential units in a given geographical region for which construction began during the reference year .
Average selling priceAverage value of all sales during a given period .
Re-salesNumber of sales during a given period .
Vacancy rateNumber of all apartments and townhouses that are vacant and available for rent expressed as a percentage .
touRismHotel occupancy rateRatio of the number of occupied hotel rooms to the number of available hotel rooms in a given area .
othER
Durable goodGood that is not destroyed during use and that has a relatively long life span .
Non-durable goodConsumer good that disappears or is destroyed upon its first use . In almost all circumstances, the good depreciates rapidly and/or is subject to changing trends .
Manufacturing sectorThis sector is comprised of establishments primarily engaged in the chemical, mechanical or physical transformation of materials or substances into new products .
Public servicesConsolidation of general interest services that are provided by private and government-owned corporations as well as the government and education, health and social services .
Main abbreviationsn/a: not available F: forecast R: revised data $: dollars M: million G: billion
glo
ssa
Ry
quebecinternational.ca
In order to fulfil its various roles, Québec International is reliant on financial support from the Government of Québec, Economic Development Canada and the City of Québec, as well as from a vast network of public and private partners .


![CartemotoneigeSagLac2014-15 [Unlocked by ] sentier lac st-jean.pdf · 6.6 trans-quÉbec 83 trans-quÉbec 93 trans-quÉbec 93 trans-quÉbec 93 trans-quÉbec 93 trans-quÉbec 93 trans-quÉbec](https://static.fdocuments.us/doc/165x107/5b2cb5eb7f8b9ac06e8b5a01/cartemotoneigesaglac2014-15-unlocked-by-sentier-lac-st-jeanpdf-66-trans-quebec.jpg)


