Economic Impact Study of the South Dundas … Impact Study of the South Dundas Township Fibre...
64
Economic Impact Study of the South Dundas Township Fibre Network Prepared for: Department of Trade and Industry, United Kingdom Prepared by: Strategic Networks Group Submitted: June 27, 2003 Strategic Networks Group 261 Cooper Street, Suite 1109, Ottawa, Ontario, Canada, K2P 0G3 Tel: + 613.277.2588, E-mail: [email protected] , Web: www.sngroup.com
Transcript of Economic Impact Study of the South Dundas … Impact Study of the South Dundas Township Fibre...

Economic Impact Study of the South Dundas Township Fibre Network
Prepared for: Department of Trade and Industry, United Kingdom Prepared by: Strategic Networks Group Submitted: June 27, 2003
Strategic Networks Group
261 Cooper Street, Suite 1109, Ottawa, Ontario, Canada, K2P 0G3 Tel: + 613.277.2588, E-mail: [email protected], Web: www.sngroup.com

Economic Impact Study of the South Dundas Township Fibre Network p. 2 / 64
Strategic Networks Group, 2003 June 27, 2003 www.sngroup.com
Executive Summary
The Department of Trade and Industry, United Kingdom, engaged Strategic Networks Group (SNG) in March 2003 to prepare a case study on the economic impacts of broadband to the Internet. Specifically, the study assessed the economic impacts of a fibre network and the return on investment to the Township of South Dundas (Ontario, Canada), the community which invested in that network. This study does not attempt to make a case for widespread public provision of broadband, instead it analyses the impacts of an investment in one community. The Township of South Dundas invested $750,000 CAD in 2000 to build a fibre optic network. The goal of this investment was to provide broadband connectivity to South Dundas and promote local economic development. To conduct an economic impact study of the South Dundas fibre network, SNG collected data from the network subscribers, identified the direct effects to those organizations, and assessed those impacts on the local economy. The building of the network commenced in June of 2000 and it was officially launched June 14, 2001. Building the network cost $750,000. Monthly operations and maintenance costs the township $10,935. To date the total investment by the township stands at $1.3 million. As of April 2003, 24 businesses and organizations were connected to the fibre network. The connection cost to these organizations, and thus the direct income of the network, averaged about $2200 per organization with a monthly fee ranging from $119 to $711 depending on bandwidth and priority. The purpose of this study was to assess the impact and the return on investment of the fibre network. It was understood, when the decision was made to implement the fibre network, that the project itself would not generate sufficient revenue to justify such a large investment for a small semi-rural community. The idea was that economic improvements brought on by the project would provide that justification. Economic improvements or impacts are defined as measurable benefits that can be directly or indirectly attributed to implementation of the fibre network. In April 2003, businesses and organizations in South Dundas were surveyed about changes (economic effects) they had experienced within the last twelve months. A survey was sent, or a telephone call was made, to every business in the township with 10 or more employees. A sample of smaller organizations were also surveyed. A response rate of 75% was achieved. Respondents who indicated changes to their business on the survey, were then interviewed by SDEDC and SNG for the purpose of qualifying their responses and determining the potential relationship of these changes to the fibre project in particular or their use of the Internet in general. Specifically, an effort was made to establish the extent to which new jobs, expansion of commercial facilities, increased revenues or decreased costs were directly attributable to the fibre network.

Economic Impact Study of the South Dundas Township Fibre Network p. 3 / 64
Strategic Networks Group, 2003 June 27, 2003 www.sngroup.com
To ensure this study met the objectives of the SDEDC and the Township of South Dundas, economic effects were attributed to the existence of the fibre network only if respondents deemed that without the network the change would not have occurred. That is to say, the network was a necessary condition for the change. Primary Findings Between June 2001 and April 2003, the following economic effects can be directly attributed to the fibre network in South Dundas.
• 62.5 new jobs • $2.8 million in commercial / industrial expansion • $140,000 in increased revenues and decreased costs
These numbers were then entered into an Input-Output (I-O) model which estimated the direct, indirect and induced impacts that these effects would have on the local, regional and provincial economy. The I-O model indicated that, over the next two to four years, these effects would have the following impacts:
• $25.22 million increase in GDP for Dundas County and $7.87 million increase for the Province of Ontario
• 207 person years of employment for Dundas County and 64 for the rest of Ontario
• $3.5 million increase in provincial tax revenues and $4.5 million increase in federal tax revenues.
These results can be viewed as a return on the $1.3 million investment made to date by the Township of South Dundas. Secondary Findings Additional findings, outside the scope of work of this study, suggest that there is a correlation between the use of broadband technology and job growth.
• 19 out of 38 (50.0%) businesses with broadband access to the Internet experienced job growth. This number includes 24 organizations using the fibre network, 13 of which (54.2%) experienced job growth.
• 10 out of 37 (27.0%) businesses with dial-up access to the Internet experienced job growth.
• 1 out of 18 (5.6%) businesses with no Internet access experienced job growth. The data suggests that there is a strong link between job growth and broadband access to the Internet in South Dundas. A causal link could not established due to the limited nature of this study though the correlation appears to hold across industry sectors and organization size.

Economic Impact Study of the South Dundas Township Fibre Network p. 4 / 64
Strategic Networks Group, 2003 June 27, 2003 www.sngroup.com
Table of Contents
1 OBJECTIVE 5
2 BACKGROUND 5
2.1 ECONOMIC IMPACTS OF BROADBAND 6
3 METHODOLOGY 8
3.1 SCOPE OF WORK 8 3.2 METHODOLOGY 8
4 STUDY RESULTS 10
4.1 DATA COLLECTION ACTIVITIES 10 4.2 SURVEY RESULTS – OVERVIEW 11 4.3 PRIMARY FINDINGS 12 4.3.1 EFFECTS ON EMPLOYMENT 12 4.3.2 EFFECTS ON COMMERCIAL / INDUSTRIAL EXPANSION 13 4.3.3 EFFECTS ON REVENUES AND COSTS 13 4.3.4 SUMMARY 14 4.4 SECONDARY FINDINGS 14 4.4.1 OVERALL EFFECTS OF BROADBAND ON EMPLOYMENT 14 4.4.2 CONTROLLING BY INDUSTRY SECTOR 16 4.4.3 CONTROLLING BY NUMBER OF EMPLOYEES 19 4.5 COMPARATIVE ANALYSIS WITH OTHER COMMUNITIES 21 4.6 RELATIVE COSTS OF BROADBAND 23
5 ECONOMIC IMPACTS 25
5.1 INPUT-OUTPUT MODELING 25 5.1.1 DATA QUALITY 26 5.1.2 ACCURACY OF RESULTS 26 5.2 IMPACTS OF THE SOUTH DUNDAS FIBRE NETWORK 27 APPENDIX ONE: ECONOMIC IMPACT SIMULATION RESULTS FOR THE SOUTH DUNDAS FIBRE
NETWORK APPENDIX TWO: SOUTH DUNDAS BUSINESS DIRECTORY APPENDIX THREE: SOUTH DUNDAS, AN OVERVIEW AND SYSTEM DESCRIPTION APPENDIX FOUR: STATISTICAL DATA APPENDIX FIVE: COMMENTS FROM BUSINESSES AND ORGANIZATIONS IN SOUTH DUNDAS
Acknowlegements Strategic Networks Group would like to thank the South Dundas Economic Development Commission, Canada, for helping in the field research and the Department of Trade and Industry, United Kingdom, for their funding to explore further the impacts of broadband.

Economic Impact Study of the South Dundas Township Fibre Network p. 5 / 64
Strategic Networks Group, 2003 June 27, 2003 www.sngroup.com
1 Objective The Department of Trade and Industry, United Kingdom, engaged Strategic Networks Group (SNG) in March 2003 to prepare a case study on the economic impacts of broadband access to the Internet. Specifically, the study assessed the economic impacts of a fibre network and the return on investment to the Township of South Dundas (Ontario, Canada), the community which invested in that network. This study does not attempt to make a case for widespread public provision of broadband, instead it analyses the impacts of an investment in one community. The Township of South Dundas invested $750,000 in 2000 to build a fibre network.1 The goal of this investment was to provide broadband connectivity to South Dundas and promote local economic development. To conduct an economic impact study of the South Dundas fibre network, SNG collected data from the network subscribers, identified the direct effects to those organizations, and assessed those impacts on the local economy. The following report describes the nature of the project and its key findings.
2 Background The Township of South Dundas, located approximately one hour south of Ottawa, Canada, has a population of approximately 11,000 and is comprised of a number of rural or semi-rural villages. The economy is largely based on manufacturing and construction with significant agriculture, retail, and service sectors. Throughout the 1990’s the economy, in particular the manufacturing sector, was in decline, resulting in a loss of over 600 jobs for the Township in the ten years prior to 2000. An effort was made by the township to investigate a number of means to stimulate the local economy. One of the proposals was to develop a broadband network to enable the community to connect with new markets, i.e. national and international economies. A Communications Committee was established and eventually a decision was made by the Township to invest in a fibre network. The building of this network commenced in June of 2000 and it was officially launched June 14, 2001. Building the network cost $750,000. Monthly operations and maintenance costs the township $10,935. (for more information see Appendix Three – South Dundas, An Overview and System Description). The network currently has one Internet Service Provider, connecting to the MCI Internet backbone in Ottawa. The fibre was hung on local utility poles in the villages of Morrisburg (pop. 2,400) and Iroquois (pop. 1,200). Wireless service was chosen to extend the network to Williamsburg (pop. 800). The fibre layout covered most of the commercial, industrial and community service users in Morrisburg, Iroquois and Williamsburg. The network access bandwidth over fibre is 10Mbps, full duplex and 4.5 Mbps simplex for wireless. The network has sufficient capacity so that the township can provide for its anticipated and future needs. Efforts are underway to extend the network to the rural areas of the township.
1 Note all monetary figures reported here are in Canadian Dollars ($1CAD = £ 0.45 UKP)

Economic Impact Study of the South Dundas Township Fibre Network p. 6 / 64
Strategic Networks Group, 2003 June 27, 2003 www.sngroup.com
As of April 2003, 24 businesses and organizations were connected to the fibre network. Subscribers include small to medium sized manufacturing, transportation and service firms as well as municipal government and branch plants of large multinational corporations. The connection cost to these organizations averaged about $2200 with an ongoing monthly fee ranging from $119 to $711 depending on bandwidth and priority. 2.1 Economic Impacts of Broadband One of the key issues with regards to broadband networks is sustainability. These networks require a substantial investment both to install and to maintain. An ongoing problem is how to determine whether or not such an investment is justified. In general, the revenue generated by the network itself, in terms of subscriber fees, etc., will not be sufficient to justify the capital expenditures required. However, these networks can have a significant impact on the economy of the local community and the surrounding area. By conducting an economic impact study, it is possible to capture a more complete picture on the effects of a network. Developing a more comprehensive understanding of the network’s value, enables informed decisions to be made about investing in broadband and building a sustainable network. There are a variety of economic impacts of any information technology network which may be examined. In the case of broadband networks, these include the ability to make use of applications requiring high-bandwith connectivity. Examples of broadband applications include on-line product training for retail sales staff and certification courses for insurance agents.
These are just two examples of benefits to businesses, benefits which would not have been realized without the existence of a broadband network. A standard return on investment (ROI) calculation does not provide an adequate picture of the benefits from investing in broadband infrastructure. The COIN broadband network, in the example below, illustrates a case where the benefits of the network went far beyond those that would have been captured in a standard ROI calculation. The system would not have been sustainable as a private investment based solely on revenues generated from network user fees. The various levels of government made the investment because they took a larger view – they looked at the economic impacts from the network.
“The Internet (and the speed of the fibre optic network) has increased the efficiency of communications with the head office in Toronto. Our on-line product training is more efficient. This leads to better informed sales and service staff, which leads to more satisfied customers and, hopefully, in turn, to increased sales…..It is a spin-off effect.”– Canadian Tire Store, South Dundas, Ontario Training costs are significantly reduced – training trips to Ottawa or Toronto cost $250/pp per day (avg $30/hr salary) in lost productivity plus expenses (mileage, meals, accommodation). Internet based training, for the equivalent in course work would require 3 hours in front of a computer ($90/pp of lost productivity). An out of town seminar leader requires $3000/day plus expenses (for 2 days). Equivalent sessions over video conferencing cost $250/hr for 6 hours [a savings of over $4500, annually]. – Brister Group, South Dundas, Ontario

Economic Impact Study of the South Dundas Township Fibre Network p. 7 / 64
Strategic Networks Group, 2003 June 27, 2003 www.sngroup.com
If broadband, as with other investments, is to be justified economically, a sound business case needs to be made. This case would require capturing the full economic impacts, which in turn requires in-depth analysis and assessment that go beyond network revenue models. The sustainability of these networks hinges on the cost savings and new revenues generated by applications that require broadband connectivity. It is these economic impacts that SNG measured for South Dundas. A broadband network functions much like other infrastructure, such as roads. It allows certain activities to occur which would otherwise not take place. These can include new business opportunities, improved service and an increased ability to control costs.2 For example, a firm can access new markets and realize an increase in revenues through using the system. While it is not possible to demonstrate that the network caused all the observed economic impact, the evidence indicates that it was a significant factor leading to the overall growth. In the case of South Dundas, the fibre network has created an environment that allows businesses to compete nationally and internationally while operating in a semi-rural community. Businesses have moved to the township from outside the region because it offered high-grade broadband connectivity in addition to meeting other infrastructure requirements. The investment in a fibre network has also demonstrated that South Dundas is looking to the future and has invested in that future. The use of the marketing slogan “South Dundas is open for business” has been effective in drawing attention to the community, using the fibre network as proof that it is committed to ensuring its future and being a place where people can choose to live and work. In summary, in order to fully understand the impact that a broadband network has on a community, a whole range of factors must be considered. It is possible to measure some
2 Social benefits, such as citizens having better access to government online services, can also be realized, but are outside the scope of this study.
Example: The County of Oxford Integrated Network (COIN) in southwestern Ontario, Canada, cost $2.9M of regional, provincial and federal government funding to build in 1988. The network connects County offices, 8 Municipal offices and libraries (1 County and 2 Municipal libraries) with transfer speeds of 10 Mbps. In using this network, one of the local municipal governments, serving a community of 15,000, was able to save $2.1 million in operational costs between September 1999 and December 2002. This was based on costs of $1.3 million from the implementation of a strategic technology plan that involved restructuring and the implementation of information technology. These cost savings have allowed the town to reduce municipal taxes by 2% in 2000 and have a 0% increase in 2001. In 2002, the town increased the average tax rate by 1.2%, however this is significantly lower than neighbouring municipalities, which increased tax rates by 4.5 – 5%. In the words of the Mayor and Chief Administrative Officer, this would not have been possible had it not been for broadband. “Town of Tillsonburg: Economic Impact Case Study” prepared for the Town of Tillsonburg and Industry Canada, INS Consulting, January 2003.

Economic Impact Study of the South Dundas Township Fibre Network p. 8 / 64
Strategic Networks Group, 2003 June 27, 2003 www.sngroup.com
of these and estimate others – this will be discussed in the following sections. SNG has developed a methodology that captures these economic impacts, thereby providing critical measures that help build a more complete picture of the return on investment to the community / region. These measures, taken with the revenues generated from broadband network user fees, provide a more comprehensive picture of the network’s impacts. Using reliable estimates of economic impacts for different investment options, communities / regions can make more informed decisions. They can also focus on initiatives that will offer the greatest return on investment for community economic development initiatives. By identifying affected groups, tracking and assessing effects, and estimating economic impacts, community and business leaders can have the information they need to decide what type of infrastructure is needed in the community and where budgets should be spent. This report presents findings and economic analysis for one such community. 3 Methodology 3.1 Scope of Work The goal of this study was to assess the impact and the return on investment of the broadband network for the Township of South Dundas. It was understood, when the decision was made to build the fibre network, that the project itself would not generate sufficient revenue to justify such a large investment for a small semi-rural community. The idea was that economic improvements brought on by the project would provide that justification. Economic improvements or impacts are defined as measurable benefits that can be directly or indirectly attributed to use of the fibre network. The scope of work for SNG (with assistance from the South Dundas Economic Development Commission) was to:
• develop survey criteria • formulate a survey instrument • collect data from the local business community, including network subscribers • identify and assess the changes to those organizations • compile information on the direct effects in the local economy • assess the economic impacts of the direct effects
3.2 Methodology To carry out this study, SNG developed a survey instrument to collect data on economic effects that businesses and organizations in South Dundas Township had experienced due to the use of the Internet and the South Dundas fibre network. The survey instrument was designed to collect data using key metrics that could be readily collected and verified in Canada and the United Kingdom. The data collected by SNG included:
Economic Impact Study of the South Dundas Township Fibre Network p. 9 / 64
Strategic Networks Group, 2003 June 27, 2003 www.sngroup.com
• new jobs (job categories based on Standard Industrial Classification codes) • expansion of commercial / industrial facilities (new real estate development,
installation of new production machinery, etc.) The information gathered from the surveys and interviews was fused with data provided by the South Dundas Economic Development Commission (SDEDC) in April 2003. For quality control and quality assurance purposes, interviews were conducted with respondents and key stakeholders in South Dundas, including the SDEDC and the local Chamber of Commerce. The interviews were used to verify and qualify the collected data and to categorize changes to businesses and organizations into three groups:
Category 1 – Changes Attributable to South Dundas Fibre Network • new business or expanded business because of the fibre network
Category 2 – Changes due to Internet Connectivity • existing business taking advantage of the Internet to drive cost savings and
efficiencies
Category 3 – Changes due to Local Economic Growth • new business or expanded business because of increased local economic
activity A database was developed and summary tables were constructed with the data to categorize changes to businesses and organizations. SNG used these tools to identify effects from connectivity to the Internet and attribute those effects to broadband and the South Dundas fibre network. Using SNG’s methodology, data from Category 1 was used to assess economic impacts by conducting an Input-Output Model simulation for South Dundas. Data from Category 2 was used to assess the effects from using the Internet, and Category 3 was used to capture any additional effects that were identified, but could not be attributed to either Category 1 or 2. Analyzing the data in this way allowed SNG to identify economic trends for South Dundas attributable to the use of the Internet and broadband technology. The Input-Output (I-O) model3 used by SNG is based on national, provincial and regional models of the Canadian economy using current Statistics Canada data and I-O tables. SNG uses these tools within a broader macroeconomic impact model that can be applied to communities or regions. This allows broadband investments, i.e. the South 3 An Input-Output (I-O) model mathematically portrays the transactions necessary among various industries as these industries provide goods and services for consumers, businesses, and government. Input-output analysis is used to identify the linkages in the economy by representing the interrelationships between products. The I-O approach is based on the idea that any transaction is both a purchase and a sale, depending on the point of view of the participant. These models can also be developed to give the full, economy-wide impacts of the final demand (business sales) of various industries on earnings, employment, and taxes. I-O Models are useful for uncovering situations where one product indirectly supplies another. For example, automobile producers use steel, glass, rubber, and plastic products to produce automobiles. Outputs from one industry become inputs to another. Therefore, when one purchases a car, one affects the demand for glass, plastic, steel, etc.

Economic Impact Study of the South Dundas Township Fibre Network p. 10 / 64
Strategic Networks Group, 2003 June 27, 2003 www.sngroup.com
Dundas Fibre Network, to be assessed in terms of economic impacts at a community / regional level in terms of increases in sales, increases in jobs and increases in the community’s tax base. The following section describes the results of implementing this methodology and highlights from the findings. 4 Study Results 4.1 Data Collection Activities April 2003 In April 2003, businesses and organizations in South Dundas were surveyed about changes (economic effects) they had experienced within the last twelve months. SDEDC’s business directory was deemed the most complete and comprehensive source of information on the businesses and organizations in South Dundas. This database contained contact information, the number of employees, and the business type and a survey was delivered, faxed or e-mailed to all of them by the SDEDC. SNG then contacted any businesses with 10 or more employees, which had not been sent a survey (due to insufficient contact information, i.e. no fax number or e-mail address, etc.) in order to conduct an interview over the telephone. This ensured that an attempt was made to survey every business in the township with 10 or more employees (there are 64 such employers). As part of the survey, businesses were asked to confirm and/or correct the data in the business registry, thereby increasing the accuracy of that data source. Respondents who indicated changes to their business on the survey, were then interviewed by SDEDC and SNG in order to qualify their responses, and to determine the potential relationship these changes had with the fibre project in particular or the use if the Internet in general. Specifically, an effort was made to establish to what extent new jobs, expansion of commercial facilities, increased revenues or decreased costs were directly attributable to the broadband network. Due to the complex nature of economic development, it is sometimes difficult to pinpoint direct causes of economic trends. To ensure this study met the objectives of the SDEDC and the Township of South Dundas, economic effects were attributed to the existence of the fibre network only if respondents deemed that without the network the change would not have occurred. That is to say, the network was a necessary condition for the change.
Example: a local trucking firm had a fleet of trucks servicing the delivery markets of Ottawa and Toronto. However with its dial-up connection to the Internet, it could not access dispatch sites quickly enough to obtain return loads. Consequently the many empty returns had a severe cost impact on operations. Within two months of installing a direct fibre connection, the owner announced in public that he had been able to book enough returns in that period to pay for his connection and service for the remainder of the year.
Indirect effects were a little harder to gauge, but there are examples where there was a tangible or intangible impact as a result of the implementation of broadband in South Dundas. An example of a tangible but seemingly indirect effect is an improvement in operations or efficiency of an office or plant using broadband applications, i.e. the time saved using Web based payroll processing instead of manually calculating payroll

Economic Impact Study of the South Dundas Township Fibre Network p. 11 / 64
Strategic Networks Group, 2003 June 27, 2003 www.sngroup.com
remittances and issuing cheques. A case of an intangible and indirect effect is the professional image created when businesses are able to interface with clients and suppliers using high bandwidth communications.
Example: a national retail store placed their new facility in South Dundas, not because it provided the best demographic in the eastern Ontario area, but, in the words of management, because it represented the best business decision for them, based on locating to a Municipality that was clearly interested in its future and investing in its own improvement. The anticipated growth based on the provision of a high-class communications service in South Dundas was the rationale for this firm. This store was followed in short order by another national brand store.
Data collected during the survey was examined by the SDEDC and SNG and then assigned to one of three categories (see Section 3.2 above). Category 1 data is of key importance because businesses and organizations themselves identified causal links, not just correlations, between the South Dundas fibre network and economic growth – that is, new jobs and commercial / industrial expansion they have attributed to the fibre network. Category 2 data is of interest because it suggests correlations between Internet usage and economic growth. The firms that are using broadband are benefiting in ways that are difficult to attribute directly to the network, but measurable in one form or another. Category 3 level data was noted in passing, but the key analysis focused on direct and indirect effects, i.e. Category 1 and Category 2 (see Appendix Four, Table 4.2 for details). 4.2 Survey Results – Overview Surveys were distributed to all 64 businesses in the Township with 10 or more employees as well as to another 60 businesses and organizations for which e-mail or fax contact information was available through the SDEDC. In total, 124 out of the 366 business and organizations in the Township were reached for the survey. Of these, 93 completed and returned the survey for a response rate of 75%. A response rate of 75% is considered very high for this type of survey. This high response rate was attributed to a number of factors: a cover letter included by the SDEDC stressing the importance of the exercise; follow-up telephone calls by SNG; and, design of the survey for ease of completion – the survey was one page long and required 10 to 15 minutes to complete. Economic impact questions in the survey included: number of jobs created in the last 12 months, expansion of commercial / industrial facilities, increases in business and reduction in costs. Survey responses noting a change in business over the last 12 months were qualified by SNG during follow-up phone interviews. Of the 93 respondents, 75 (80.6%) noted that they had some form of Internet access, which they used for business purposes. This rate of use may not be representative of the business community as a whole and may over-represent the number of businesses that use the Internet. In the process of following up with businesses that had not initially responded to the survey, a number of people suggested that they had not returned the survey because they did not use the Internet for business purposes. This suggests that

Economic Impact Study of the South Dundas Township Fibre Network p. 12 / 64
Strategic Networks Group, 2003 June 27, 2003 www.sngroup.com
that the percentage of businesses that use the Internet may be lower among those who did not respond than among those who responded. In addition, our findings indicate that larger (in terms of the number of employees) organizations are more likely to use the Internet for business purposes. Therefore, concentrating on businesses and organizations with 10 or more employees may also have lead to an over-representation of businesses that use the Internet. 4.3 Primary Findings As stated above, the purpose of this study was to determine the impact that the South Dundas fibre network has had on the local and regional economy. As such, the information gathered from the 24 subscribers to the network is of particular importance. Of these:
• 13 (54.2%) had experienced job growth during the previous 12 months • 4 (16.7%) had expanded their commercial or industrial facilities • 19 (79.2%) reported an increase in business or a decrease in costs due to
their use of the fibre network 4.3.1 Effects on Employment The I-O model used by SNG can measure and quantify the impact that new jobs have on the local economy. It was decided that a conservative approach to the numbers was necessary for fear of exaggerating the impact that the Internet in general, or the fibre network in particular, will have on the economy. Therefore, only jobs that could be directly attributed to the network were included in the I-O simulation. Thus, only the Category 1 jobs, due to their clear and direct connection to the fibre network were entered into the model. Category 1 jobs∗ were (see Appendix Four, Table 4.2 for details):
• Manufacturing: 16 jobs • Transportation: 6 jobs • Communication: 2 jobs (part-time 10 hr/wk)
In addition to the jobs noted above, 40 jobs were added from firms that are on record as having located in South Dundas primarily because of the broadband project.4 These positions were broken down as follows:
• Manufacturing: 30 jobs • Finance & Insurance: 6 jobs • Communication: 4 jobs
∗ Due to issues of confidentiality, businesses and organizations have been left grouped according to industry sectors. 4 See Economic Impact Report: South Dundas Township Fibre Network, October 2002

Economic Impact Study of the South Dundas Township Fibre Network p. 13 / 64
Strategic Networks Group, 2003 June 27, 2003 www.sngroup.com
In total, between June 2001 and April 2003, 62 new full-time jobs and 2 new part-time jobs could be directly attributed to the fibre network. These new jobs were entered into the I-O model (see section 5.0). These jobs are termed “new” because they were new to the region. The data was collected from the businesses themselves and thus we were forced to rely on their assessment of where the job came from. It is difficult in some cases to determine whether the job was in itself new, or rather one that shifted into the township from outside. For example, a trucking company saw its business increase due to an improved ability to capture loads on the return run from Ottawa or Toronto. Those loads may have existed before and one would assume that, had the South Dundas firm not captured the business, someone else would have – where the competing firm would have been based and those jobs created is difficult to assess. On the other hand, these loads may have been part of an expansion in the trucking industry. In this case, the firm in South Dundas was able to win these new loads and associated jobs because they were more competitive. In either scenario, South Dundas benefited with a net increase in jobs. Determining exactly where all of the new jobs came from in relation to a provincial or national context would require a more in-depth analysis and additional data collection that was outside the scope of this study. However, it should be noted that 4 of the full-time positions and the 2 part–time positions were created to build and maintain the network. In addition, the respondents stated that at least 38 of the other jobs would exist in the United States if it had not been for the fibre network. 4.3.2 Effects on Commercial / Industrial Expansion Another measurable factor indicating growth in the local economy is the change in the expansion of commercial and industrial facilities, as well as residential housing starts. Firms that experienced such growth, and stated that it would not have occurred without the fibre network, noted:
• $2.5 million plant expansion of a manufacturing facility • $275,000 for construction of a new office building • $6,600 for rental of office space
Thus the total value of commercial / industrial expansion attributable directly to the fibre network is approximately $2.8 million.∗ This figure was also entered into the I-O model (see section 5.0). 4.3.3 Effects on Revenues and Costs The final category of information that the I-O model takes into account is changes in revenues and costs. Businesses and organizations can experience increased revenues or decreased costs due to use of broadband technology. If the resultant funds are invested back into the economy, this increases economic activity of the region as whole. Survey respondents noted the following increased revenues and decreased costs, occurring within the last 12 months, which could be directly attributed to the fibre network:

Economic Impact Study of the South Dundas Township Fibre Network p. 14 / 64
Strategic Networks Group, 2003 June 27, 2003 www.sngroup.com
• $25,000 increase in provincial funding • $40,000 reduced overhead • $75,000 increase in operational productivity
These numbers combine with the new jobs and the expansion of commercial / industrial facility figures to complete the input data for the I-O model. 4.3.4 Summary Between June 2001 and April 2003, the following economic effects can be directly attributed to the fibre network in South Dundas. These figures have been entered by SNG into an I-O model and the results can be found in Section 5.0.
• 62.5 new jobs – this includes 2 part-time jobs being collapsed to their 0.5 full-time equivalents (FTE)
• $2.8 million in commercial / industrial expansion • $140,000 in increased revenue and decreased costs
4.4 Secondary Findings The purpose of this study was to determine the economic impacts of the fibre network in South Dundas. However, in an effort to capture other economic impacts and be more thorough, other businesses and organizations in the Township were surveyed rather than just the subscribers to the network. This section outlines some of the findings which emerged from those surveys. 4.4.1 Overall Effects of Broadband on Employment The April 2003 survey focussed on job increases that had been experienced during the previous 12 months. The emphasis on job creation was due to a number of factors, including that new jobs clearly represent growth in an organization, it is an easily measurable and quantifiable statistic and it is an issue which businesses are more inclined to disclose and discuss (as opposed to increases in revenue, for example). During the 12 months leading up to the survey 241 new jobs were created. Findings from the April 2003 survey were combined with numbers from an earlier study5. Between June 2001 and April 2003 a total of 717 new jobs were identified as having been created in South Dundas Township. Given the decline of the job base during the 1990s (600 jobs lost in South Dundas in the 10 years prior to 2000), this can be considered a very positive and dramatic change.6 The majority of those 717 new jobs (495 or 69.0%) were in the Manufacturing, Retail, and Accommodation, Food & Beverage sectors. Figures 1and 2 use the data collected in the April 2003 survey to highlight the relationship between use of the Internet by businesses and the job growth they experienced between May 2002 and April 2003 (see Appendix Four, Table 4.3 for data).
5 See Economic Impact Report: South Dundas Township Fibre Network, October 2002 6 South Dundas faced a decline in population in the 10 years prior to 2000 and its unemployment rate in 2001 was higher than the provincial average. See Appendix Four for details.

Economic Impact Study of the South Dundas Township Fibre Network p. 15 / 64
Strategic Networks Group, 2003 June 27, 2003 www.sngroup.com
The figures illustrate a correlation between the use of broadband technology and job growth.
05
10152025303540
Num
ber o
f O
rgan
izat
ions
BroadbandAccess
Dial-up Access No InternetAccess
Type of Internet Access
(Figure 1)Organizations Reporting New Jobs by Type of Internet
Access
Organizations thatResponded
OrganizationsReporting NewJobs
Figure 1 compares the number of organizations participating in the survey, broken down by the type of Internet access they reported, with the number in each category that reported new jobs. As can be seen, a higher percentage of businesses and organizations with broadband Internet access reported job growth than those with dial-up or no Internet access. Statistical tests are sometimes used to determine whether data correlations are statistically significant. For correlations between job growth and level of Internet access (i.e. Figure 1 data) the Chi-square test was used and the findings were found to be statistically significant at the 10% confidence level. As Figure 1 illustrates:
• 19 out of 38 (50.0%) businesses with broadband access∗ to the Internet experienced job growth. This number includes 24 organizations using the fibre network, 13 of which (54.2%) experienced job growth.
• 10 out of 37 (27.0%) businesses with dial-up access to the Internet experienced job growth.
• 1 out of 18 (5.6%) businesses with no Internet access experienced job growth.
∗ Due to difficulties with discrepancies between Internet Service Providers (ISPs) serving South Dundas, potential and actual download speeds, broadband access is defined in these findings as Cable, High Speed, Fibre Optic or Wireless connections to the Internet.
Economic Impact Study of the South Dundas Township Fibre Network p. 16 / 64
Strategic Networks Group, 2003 June 27, 2003 www.sngroup.com
0.00%
10.00%
20.00%
30.00%
40.00%
50.00%
60.00%
70.00%
Broadband Dial-up No InternetType of Internet Access
(Figure 2)Type of Internet Access for Organizations with New Jobs
Fibre
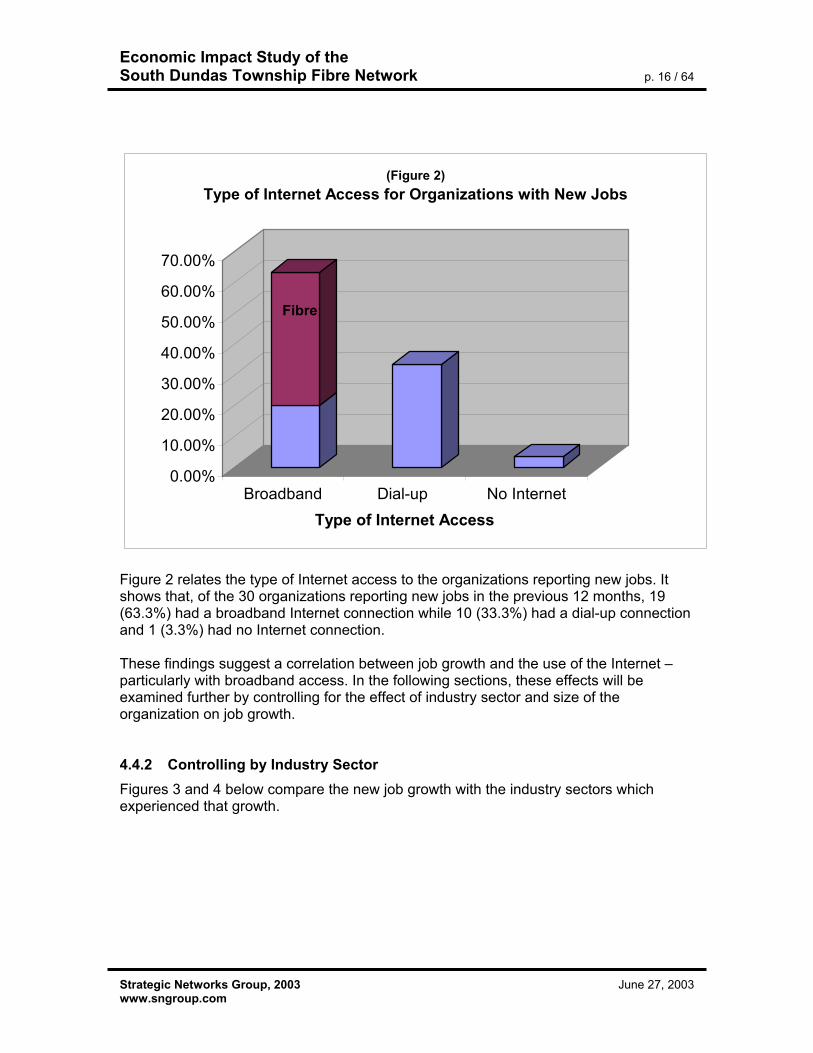
Figure 2 relates the type of Internet access to the organizations reporting new jobs. It shows that, of the 30 organizations reporting new jobs in the previous 12 months, 19 (63.3%) had a broadband Internet connection while 10 (33.3%) had a dial-up connection and 1 (3.3%) had no Internet connection. These findings suggest a correlation between job growth and the use of the Internet – particularly with broadband access. In the following sections, these effects will be examined further by controlling for the effect of industry sector and size of the organization on job growth. 4.4.2 Controlling by Industry Sector Figures 3 and 4 below compare the new job growth with the industry sectors which experienced that growth.

Economic Impact Study of the South Dundas Township Fibre Network p. 17 / 64
Strategic Networks Group, 2003 June 27, 2003 www.sngroup.com
(Figure 3)Firms Reporting New Jobs by Industry Sector
0 2 4 6 8 10 12 14 16 18 20
Transportation
Retail Trade
Real Estate & Insurance Agents
Other Services
Mining, Quarrying & Oil Wells
Manufacturing
Health & Social Services
Government Services
Finance & Insurance
Educational Services
Construction
Communication & Other Utilities
Business Services
Agriculture & Related Services
Accommodation, Food & Beverages
Indu
stry
Sec
tor
Number of Organizations
Organizationsthat responded
Organizationsreporting newjobs
Figure 3 compares the number of organizations that participated in the survey, broken down by industry sector, and the number that reported new jobs. Four sectors in particular showed a high percentage of organizations experiencing job growth:
• Accommodation, Food & Beverages • Finance and Insurance • Manufacturing • Transportation
Between 50% and 100% of the respondents in these four sectors experienced job growth in the previous 12 months (see Appendix Four, Table 4.3 for details). The 217 new jobs in these four sectors account for 90.0% of the total 241 new jobs created for that period.

Economic Impact Study of the South Dundas Township Fibre Network p. 18 / 64
Strategic Networks Group, 2003 June 27, 2003 www.sngroup.com
( Figure 4)% Jobs Growth by Industry Sector
19.6%
7.7%
0.6%
13.0%
3.3%
15.3%
2.2% 3.0% 2.4%5.3%
0.0%
5.0%
10.0%
15.0%
20.0%
25.0%A
ccom
mod
atio
n,Fo
od &
Bev
erag
es
Com
mun
icat
ion
& O
ther
Util
ities
Edu
catio
nal
Ser
vice
s
Fina
nce
&In
sura
nce
Hea
lth &
Soc
ial
Ser
vice
s
Man
ufac
turin
g
Oth
er S
ervi
ces
Rea
l Est
ate
&In
sura
nce
Age
nts
Ret
ail T
rade
Tran
spor
tatio
n
Figure 4 illustrates the percentage increase of employment by sector for each of the industry sectors that experienced job growth. For example, there were 240 employees in the Accommodation, Food & Beverage sector as of April 2002. During the following 12 months, this sector saw an increase of 47 new jobs to a new total of 287. The 47 jobs represent a 19.6% increase in the number of employees. The Manufacturing sector, as the biggest employer in the township (35.5%), is of particular interest. All of the respondents in this sector (12 or 66.7% of the total number of manufacturers in the region) indicated use of the Internet and 9 of the 12 (75.0%) have broadband access (8 of which, or 44.4% of the total number of manufacturing firms, use the fibre network). In total, 9 of the 12 (75.0%) experienced increases in the number of jobs at their organization and these account for 154 of the 241 (63.9%) of the new jobs in the region. Summarizing, these findings suggest that a wide variety of industry sectors experienced job growth between May 2002 and April 2003. The size of the increase varied from sector to sector with the Accommodation, Food & Beverage and the Manufacturing sectors experiencing the largest growth.

Economic Impact Study of the South Dundas Township Fibre Network p. 19 / 64
Strategic Networks Group, 2003 June 27, 2003 www.sngroup.com
4.4.3 Controlling by Number of Employees Figures 5, 6 and 7 break down Internet access and job growth by the size of the organization. Organizations were categorized in four groups:
• Fewer than 20 employees • Between 20 and 49 employees • Between 50 and 99 employees • 100 employees or more
As can be seen in Figure 5 below, the larger an organization, the greater the likelihood that they used the Internet for business purposes. All respondents with 50 or more employees used the Internet. In addition, the use of broadband is particularly high amongst organizations with between 20 and 99 employees.7
(Figure 5)Type of Internet Access by Size of Organization
0
10
20
30
40
50
60
70
<20 20 - 49 50 - 99 100+
Number of Employees
Num
ber o
f Org
aniz
atio
ns
No Internet AccessDial-up AccessBroadband Access
For organizations with fewer than 20 employees, 76.7% had Internet access (29.7% with broadband). 84.2% of those with 20 – 49 employees used the Internet (68.4% broadband) and 100% of organizations with 50 or more employees had access (71.4% of 50 – 99 and 33.3% of 100+ used broadband).
7 See Section 4.2 for note about over-representation of Internet users.

Economic Impact Study of the South Dundas Township Fibre Network p. 20 / 64
Strategic Networks Group, 2003 June 27, 2003 www.sngroup.com
It can be argued that organization size is the determining factor for job growth, rather than broadband access to the Internet. That is to say, larger organizations are more likely to experience job growth and, as well, are more likely to have broadband Internet access. However, Figure 6 illustrates that the correlation between broadband Internet access and job growth holds when controlling for the number of employees.
(Figure 6)
Organizations within Internet Access Type Reporting New Jobs
27%
7%
58%
42%
29%
0%0%
10%
20%30%40%50%
60%70%
BroadbandAccess
Dial-up Access No InternetAccess
Type of Internet Access
% o
f Org
aniz
atio
ns
Repo
rting
New
Job
s
Fewer than 20employees
20 employees ormore
Of organizations with <20 employees:
• 42% of the 19 organizations with broadband had new jobs • 27% of the 30 organizations with dial-up access had new jobs • 7% of the 15 organizations with no internet access had new jobs\
Of organizations with 20 employees or more: • 58% of the 19 organizations with broadband access had new jobs • 28% of the 7 organizations with dial-up access had new jobs • 0% of the 3 organizations with no Internet access had new jobs

Economic Impact Study of the South Dundas Township Fibre Network p. 21 / 64
Strategic Networks Group, 2003 June 27, 2003 www.sngroup.com
7.6%
14.4%
30.7%
9.9%
0.0%5.0%
10.0%15.0%20.0%25.0%30.0%35.0%
< 20 20 - 49 50 - 99 100+
Number of Employees
(Figure 7)% Job Growth by Size of Organization
The above graph (Figure 7) indicates the percentage of job growth relative to total employment in the four size categories of organizations. For example, as of April 2002, there were 493 employees working for organizations with between 20 and 49 employees. By April 2003 there were an additional 71 employees working for this size of business. This represents an increase of 14.4%. As Figure 7 indicates, growth has been experienced in all size categories, most significantly with organizations that had 50 to 99 employees. In summary, controlling by industry sector and number of employees has shown that job growth in South Dundas has occurred in a wide range of industry sectors for all sizes of firms. Certain sectors and certain sizes of organizations have realized more growth than others, but overall growth has been relatively broad-based. These new jobs have reversed the overall trend of job losses experienced by South Dundas (600 jobs lost in the 10 years previous to 2000). There are of course other factors which may account for the job growth experienced by the Township of South Dundas between May 2002 and April 2003. In order to establish any form of causality, additional data and indicators that were not within the scope of this study would be needed. The data in this study does, however, suggest some interesting correlations between broadband access to the Internet and job growth, correlations which may merit further investigation. 4.5 Comparative Analysis with Other Communities An effort was made to benchmark the effects in South Dundas with other similar communities in the region that did not build a broadband network. Within a regional context, the townships of North Dundas, Leeds and Thousand Islands, and South Stormont are comparable to South Dundas in terms of:
Economic Impact Study of the South Dundas Township Fibre Network p. 22 / 64
Strategic Networks Group, 2003 June 27, 2003 www.sngroup.com
• population size and change between 1996 and 2001 • labour force participation and unemployment rates • employment by industry sector (see Appendix Four – Table 4.1)
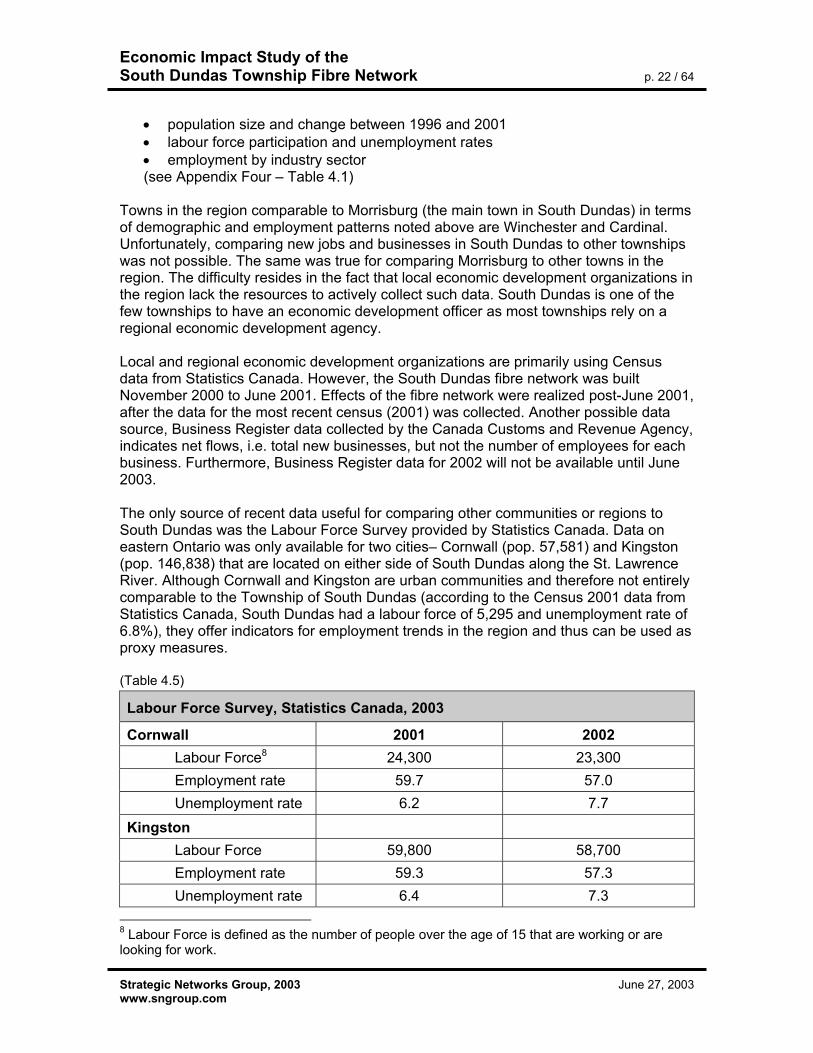
Towns in the region comparable to Morrisburg (the main town in South Dundas) in terms of demographic and employment patterns noted above are Winchester and Cardinal. Unfortunately, comparing new jobs and businesses in South Dundas to other townships was not possible. The same was true for comparing Morrisburg to other towns in the region. The difficulty resides in the fact that local economic development organizations in the region lack the resources to actively collect such data. South Dundas is one of the few townships to have an economic development officer as most townships rely on a regional economic development agency. Local and regional economic development organizations are primarily using Census data from Statistics Canada. However, the South Dundas fibre network was built November 2000 to June 2001. Effects of the fibre network were realized post-June 2001, after the data for the most recent census (2001) was collected. Another possible data source, Business Register data collected by the Canada Customs and Revenue Agency, indicates net flows, i.e. total new businesses, but not the number of employees for each business. Furthermore, Business Register data for 2002 will not be available until June 2003. The only source of recent data useful for comparing other communities or regions to South Dundas was the Labour Force Survey provided by Statistics Canada. Data on eastern Ontario was only available for two cities– Cornwall (pop. 57,581) and Kingston (pop. 146,838) that are located on either side of South Dundas along the St. Lawrence River. Although Cornwall and Kingston are urban communities and therefore not entirely comparable to the Township of South Dundas (according to the Census 2001 data from Statistics Canada, South Dundas had a labour force of 5,295 and unemployment rate of 6.8%), they offer indicators for employment trends in the region and thus can be used as proxy measures. (Table 4.5)
Labour Force Survey, Statistics Canada, 2003
Cornwall 2001 2002 Labour Force8 24,300 23,300 Employment rate 59.7 57.0 Unemployment rate 6.2 7.7
Kingston Labour Force 59,800 58,700 Employment rate 59.3 57.3 Unemployment rate 6.4 7.3
8 Labour Force is defined as the number of people over the age of 15 that are working or are looking for work.

Economic Impact Study of the South Dundas Township Fibre Network p. 23 / 64
Strategic Networks Group, 2003 June 27, 2003 www.sngroup.com
Both Cornwall and Kingston experienced falling employment between 2001 and 2002. This reflects stable or moderately declining employment and economic activity for eastern Ontario during this period. In contrast to the regional trend, South Dundas experienced a net increase of 717 new jobs between June 2001 and April 2003 of which 476 were between June 2001 and April 2002, periods during which, Cornwall and Kingston show a falling labour force (Table 4.5). Historically, the trend for Canada is that growth in employment is expected to be greater in cities rather than rural areas. Given that the general expectation is for urban areas have higher rates of growth than rural areas, the positive employment growth for South Dundas is even more significant. Small to medium enterprises (20 to 100 employees) in South Dundas had a net expansion of employment since the building of the fibre network. South Dundas has experienced significant growth in several industry sectors over the last two years. As has been shown above, there is a correlation between broadband and local economic growth in South Dundas and in certain cases a causal relationship was identified. Other communities in the same region have not experienced growth similar to that experienced by South Dundas and in some instances have declined. One significant difference between South Dundas and its regional neighbours is the presence of a high-grade broadband network. A commitment to the future, the ability to use Internet applications requiring a high bandwidth and a willingness to adopt new business processes are key ingredients which can lead to economic growth. The investment by the municipal government in South Dundas in a fibre network has demonstrated a commitment to the future and a willingness to provide key infrastructure. Broadband access to the Internet has enabled businesses and organizations in South Dundas to realize cost savings, productivity gains and new revenues. Other economic factors being equal, the fibre network in South Dundas has created opportunities for growth. The direct effects identified in this study confirm this growth. 4.6 Relative Costs of Broadband Increasingly, broadband is considered by businesses to be necessary infrastructure, similar to roads and utilities. The capital expenditures and ongoing maintenance costs of the fibre investment in South Dundas may seem significant, but they need to be weighed against other infrastructure costs. Table 4.6a shows the initial capital costs, network upgrades, maintenance and revenues for the South Dundas fibre network.

Economic Impact Study of the South Dundas Township Fibre Network p. 24 / 64
Strategic Networks Group, 2003 June 27, 2003 www.sngroup.com
(Table 4.6a)
Fibre Network Costs & Revenues in South Dundas Source: Township of South Dundas, 2003
2000 2001 2002 Total Capital $533,162 $221,000 $191,139 $945,301
Operations/ Maintenance
$174,015 $174,754 $348,769
Less: Revenues $5,690 $13,174 $18,864
Net Cost $533,162 $389,325 $352,719 $1,275,206 Although the South Dundas investment in fibre may be a significant capital expenditure, it should be noted that one mile of paved county road is about the same cost as the initial capital cost ($750,000) of the South Dundas Broadband Community System. With respect to ongoing costs, Table 4.6b shows the annual operations costs of municipal infrastructure for ratepayers in South Dundas. (Table 4.6b)
Infrastructure Costs in South Dundas – Current Operations Source: Township of South Dundas, 2003
Taxes Per $100,000 Assessment
Residential Commercial Industrial
Fire $53.02 $81.53 $99.50
Roads $386.50 $594.35 $725.41
Waste $68.45 $105.26 $128.48
Recreation $91.42 $140.67 $171.58
Fibre Network $24.03 $36.95 $45.09 As exhibited above, waste disposal is almost 4 times more expensive and roads are 16 times more expensive than the fibre network to the municipality. Considering the benefits (i.e. direct effects) that South Dundas has realized – and continues to realize – from the fibre network, the ongoing costs of maintaining the fibre network are relatively low as compared to the costs of other municipal infrastructure and services. Apart from the relative costs of infrastructure, the total costs to date for the South Dundas fibre network ($1.3 million) should be considered in the context of the economic benefits identified in Sections 4 and 5.

Economic Impact Study of the South Dundas Township Fibre Network p. 25 / 64
Strategic Networks Group, 2003 June 27, 2003 www.sngroup.com
5 Economic Impacts As noted above, SNG has developed a macroeconomic impact model specifically to determine key measurable impacts to areas such as GDP, employment and tax revenues at a local / regional level. 5.1 Input-Output Modeling The economic impacts for this study have been estimated using an Input-Output model based on Statistics Canada Input-Output tables. The model is based on 1996 data (or earlier) and aggregates commodities into 476 groups and industry into 167 groups. The Input tables tell us how much of each commodity or commodities (out of a maximum total of 476) are used by each industry to produce its final product. For example, the table tells us that the automobile industry in Ontario uses automotive parts and accessories, engines, etc. to assemble a vehicle. Dividing the inputs of a given industry by the total amount of inputs gives us the Technology Matrix. This matrix will tell us not only that the automotive industry is using automotive parts and accessories, and engines, but also that these two items represent about 45% and 13% respectively of the purchases of that industry. The Output table tells us which industry produces a given commodity. For example, the Motor Vehicle industry produces cars while the Shipbuilding industry makes the freighters and fishing vessels. When the commodity lines are divided by the line total, it gives us the Market Share matrix which tells us that, for example, the Motor Vehicle industry has a 100% market share (i.e. no other industry produces automobiles in Canada) for automobiles made and purchased in Canada. An economic impact simulation is started by entering the initial expenditures (such as salaries paid by industries to their employees, rent, etc.) into the impact model. The model first extracts retail, wholesale, indirect taxes (excise, sales tax, etc.), gas distribution and transportation margins and reallocates them to the retail trade, wholesale trade, government tax revenues and transportation industries. Import coefficients are applied to the remaining dollar amounts to leak out of the province expenditures that are NOT produced in the province. For example, expenditures to purchase delivery trucks manufactured in Germany or in Japan would be leaked out of Ontario. Conversely, salary expenditures and expenditures on most services such as the mechanics repairing a vehicle would stay in the province as this is a commodity (repair service) performed in the province. There are leakages from the local expenditures due to imports from other countries, taxation and savings. The dollars remaining in the province are allocated to the industries that produce the commodities purchased for the expenditure (the information about each industry and each of the commodities they produce is provided by the Market Share matrix). In turn, those industries will consume other commodities used to produce their commodities (or products). For example, if a new salesperson requires a new automobile, the expenditure for that automobile requires the automobile producer to use steel, glass, rubber, and plastic products to produce that automobile. Therefore the automobile producer also has expenditures when it must purchase components, for example car seats, to assemble a car purchased for the salesperson. And so, a purchase of a

Economic Impact Study of the South Dundas Township Fibre Network p. 26 / 64
Strategic Networks Group, 2003 June 27, 2003 www.sngroup.com
commodity instigates a series of buyer-seller relationships at each level of the supply chain. The information about the commodities used by each industry in their production process (and in which proportion or percentage) is provided by the Technology matrix. The I-O Model mirrors the supply chain relationships in terms of the flow of commodities between industries and demonstrates the effects that changing one factor has on the system as a whole. The model continues to iterate until there is no money left, i.e. imports, taxes and savings are the main leakages which will eventually reduce to zero the amount of money spent initially by the businesses and their employees. Then the model stops and the total impacts by industry are added up from all iterations. The statistic generated by the Input-Output model is called the Gross Production (sales) by industry. Employment by industry is calculated by extracting the salary content of each industry (from the Gross Production) and dividing it by the average annual salary for that industry. The Gross Domestic Product (GDP) is calculated by extracting from the Gross Production by industry the so-called “Primary input” components: indirect taxes (for example GST), subsidies, salaries and benefits for employees, profits and depreciation for the private sector. Extraction of both the salaries used to calculate employment and the GDP components is based on coefficients contained in the Technology matrix (calculated from the Input table provided by Statistics Canada). The tax revenues are calculated by using taxation coefficients derived from Canadian Customs and Revenue Agency (CCRA) publications about federal and provincial tax revenues by province. The taxation coefficients are applied to salaries and profits. Tables on indirect taxes by industry from Statistics Canada are used to allocate indirect taxes between both senior levels of governments. 5.1.1 Data Quality Models developed by SNG use only official Statistics Canada data. All the input-output coefficients, the data series used to estimate the econometric modules and the rest of the data such as salaries, etc come from either regular publications (including Provincial Accounts) or Census databases. 5.1.2 Accuracy of Results The economic impact figures are based on an I-O Model that accurately describes the structure of the Canadian economy for each of the ten provinces. These detailed models group commodities into 476 categories and industries into 167 categories. The impact effects are also categorized by province. Of the economic results estimated by the I-O simulation, 80% will be realized in the first two years (i.e. by April 2005) and 100% within four years (i.e. April 2007). As the original investment expenditures (i.e. the direct effects) make their way through the local and regional economies, they are depleted by a number of factors, of which the three most important are:

Economic Impact Study of the South Dundas Township Fibre Network p. 27 / 64
Strategic Networks Group, 2003 June 27, 2003 www.sngroup.com
• imports from other countries • taxation • savings
5.2 Impacts of the South Dundas Fibre Network The economic impacts arising from South Dundas fibre network result from the variety of transactions that can be attributed to this infrastructure and its ongoing operation and use. The association can be as direct as the payroll transaction between the company installing / maintaining the infrastructure and their employees, or much less direct, as with a transaction between a consumer and vendor through broadband enabled technologies and applications. The effects from the South Dundas fibre network have been categorized in the following way for the I-O simulation:
• Direct effects – direct expenditures or sales associated with the fibre network (i.e. Category One in Section 3.2)
• Indirect effects – purchases of goods and services using the Internet, but not directly attributable to the South Dundas fibre network
• Induced effects – spending of wages and salaries received by workers because of the increased economic activity in the community
Data from the direct effects were entered into the I-O model and the results are presented below. As these I-O results are a simulation of the local economy, it should be noted that they estimate some of the Category 2 and 3 impacts identified in Section 4.4.1. The results presented below are the economic impacts estimated from the I-O simulation using Statistics Canada data and I-O tables for the entire County of Dundas – this includes the Townships of South and North Dundas. Breakdowns for South Dundas are not available so the I-O simulation was run at the county level. (See Appendix One for the data generated by the I-O model). (Table 5.2a)
Results from Input-Output Model
Increase in Sales ($millions)
Dundas County Rest of Ontario
Direct $16.42
Indirect $5.70 $6.42
Induced $3.10 $1.45
Total $25.22 $7.87

Economic Impact Study of the South Dundas Township Fibre Network p. 28 / 64
Strategic Networks Group, 2003 June 27, 2003 www.sngroup.com
The increase in Direct Expenditures associated with the South Dundas fibre network to Dundas County has been estimated at $16.42 million (see Table 1.1 in Appendix One). This includes the new jobs (see Section 4.3.1 above), commercial and industrial expansion (see Section 4.3.2 above) and effects on revenues and costs (see Section 4.3.3 above). There are additional expenditures associated with the new jobs and expansion of facilities in terms of operating expenditures, supplementary labour income, overhead, etc. For instance, a firm that hired new truck drivers had increased expenditures on salaries and increased expenditures on new trucks, truck maintenance, repair services and on fuel. Each of the businesses and organizations in South Dundas that reported an impact from the introduction of the fibre network has such associated expenditures that needed to be factored into the I-O simulation, which brought the total Direct Expenditures to $16.42 million. The majority of these expenditures occur within Dundas County and the province of Ontario and support a variety of sectors that supply the users of the South Dundas fibre network services. The $16.42 million in Direct Expenditures generates the equivalent of $5.7 million in indirect expenditures on related goods and services in Dundas County and an additional $6.42 million for the rest of the Province of Ontario. (Appendix One, Table 1.1) $14.47 million is realized in induced Gross Domestic Product for Dundas County (Appendix One, Table 1.2). This represents the impacts generated by the workers spending their increased personal income (essentially wages and salaries), realized from Direct and Indirect Expenditures, in Dundas County. Initial expenditures are reduced at each round of expenditures by savings, imports (i.e. purchase of items produced in other countries Canada), taxes and leakages outside of Ontario (to other provinces) and leakage outside of Dundas County (to other counties in Ontario). Using accepted industry standard leakage rates, actual increased spending in Dundas County from Induced effects is estimated to be $1.5 million. Applying a multiplier9 of 1.1 to this increase in spending from Induced Effects generates the equivalent of $1.6 million of additional spin-off spending. The total increase in induced spending in Dundas County is therefore estimated to be $3.1 million. Carrying out a similar calculation for the Rest of Ontario, the total increase in induced spending is estimated to be $1.45 million. The direct, indirect and induced spending in turn generate the following impacts for Dundas County and the province of Ontario (see Appendix One, Table 1.3):
9 A multiplier of 1.1 is applied in rural Canada for this type of region to the local Induced Effects and this is used to quantify the additional benefits to the community from the increase in local spending.

Economic Impact Study of the South Dundas Township Fibre Network p. 29 / 64
Strategic Networks Group, 2003 June 27, 2003 www.sngroup.com
(Table 5.2b)
Results from Input-Output Model
Increase in Employment (person years)
Dundas County Rest of Ontario
Direct 79.0
Indirect 48.2 33.7
Induced 80.0 29.8
Total 207.2 63.5
Increase in Gross Domestic Product10 ($millions)
Dundas County Rest of Ontario
Direct & Indirect $11.68 $1.61
Induced $4.31 $3.70
Total $16.00 $5.29
Increase in Tax Revenues ($millions)
Provincial Federal
Direct & Indirect $1.67 $1.70
Induced $1.80 $2.80
Total $3.47 $4.50
See Appendix One – Economic Impact Simulation Results for South Dundas Fibre Network for additional details. The above impacts stem from an investment of $1.3 million to date. The capital and operational costs incurred to date should be compared to the findings in Section 4.3 (e.g. 62.5 new jobs and $2.8 million in commercial/industrial expansion directly attributable to the fibre network) and the economic impacts (i.e. direct, indirect and induced effects) identified in Table 5.2. The conclusions drawn from these figures depend on the preferred level of analysis in considering these economic impacts – county versus provincial, direct effects to fibre network subscribers versus direct, indirect and induced impacts. For example:
• direct impacts to fibre network subscribers – 62.5 jobs and $2.8 million in commercial / industrial expansion, or,
10 Value-added component extracted from Gross Production and Government Tax Revenues referring to wages, salaries, net income of unincorporated businesses, corporate profit and indirect taxes.

Economic Impact Study of the South Dundas Township Fibre Network p. 30 / 64
Strategic Networks Group, 2003 June 27, 2003 www.sngroup.com
• direct impacts to the community - $16.42 million in increased sales and 79 person years of employment, or,
• total direct, induced and induced effects to the community - $25.22 million in
increased sales, 207 person years of employment, etc. Conclusion Regardless of the level of analysis used in looking at the economic impacts in South Dundas, the data suggests that there is a strong link between job growth and broadband access to the Internet. A causal link could not established due to the limited nature of this study though the correlation appears to hold across industry sectors and organization size. Furthermore, the growth in South Dundas is a reversal of the 600 jobs lost in the township over the previous 10 years and contrasts with the lack of similar growth in the rest of the region. These economic impacts are the true measure of the fibre network’s value to South Dundas.

Economic Impact Study of the South Dundas Township Fibre Network p. 31 / 64
Strategic Networks Group, 2003 June 27, 2003 www.sngroup.com
Appendix One
Economic Impact Simulation Results For South Dundas Fibre Network

Economic Impact Study of the South Dundas Township Fibre Network p. 32 / 64
Strategic Networks Group, 2003 June 27, 2003 www.sngroup.com
Table 1.1 ECONOMIC IMPACT OF FIBRE NETWORK IN SOUTH DUNDAS, ONTARIO - DIRECT AND INDUCED IMPACTS IMPACT BY COUNTY OPEN SIMULATION DIRECT AND INDIRECT IMPACTS GROSS PRODUCTION (SALES) $MILLIONS Algoma Brant Bruce Cochrane Dundas Co. Durham Essex Hamilton Peel RM Toronto Others ONT. AGRICULTURE $0.00 $0.00 $0.00 $0.00 $0.04 $0.00 $0.00 $0.00 $0.00 $0.00 $0.00 $0.04FORESTRY $0.00 $0.00 $0.00 $0.00 $0.00 $0.00 $0.00 $0.00 $0.00 $0.00 $0.00 $0.00FISHING $0.01 $0.00 $0.00 $0.00 $0.03 $0.00 $0.02 $0.00 $0.00 $0.00 $0.03 $0.09OIL, MINES $0.10 $0.00 $0.00 $0.12 $0.00 $0.00 $0.01 $0.00 $0.00 $0.01 $0.08 $0.33MANUFACTUR. $0.16 $0.19 $0.06 $0.11 $11.27 $0.56 $0.54 $0.20 $0.11 $0.31 $0.99 $14.51CONSTRUCTION $0.00 $0.00 $0.00 $0.00 $2.96 $0.00 $0.00 $0.00 $0.00 $0.00 $0.00 $2.96TRANSPORT. $0.04 $0.02 $0.02 $0.04 $1.19 $0.07 $0.10 $0.03 $0.04 $0.07 $0.22 $1.84COMMUNICAT. $0.00 $0.00 $0.02 $0.00 $1.22 $0.01 $0.01 $0.00 $0.00 $0.01 $0.02 $1.29ELECT., UTILIT. $0.00 $0.00 $0.01 $0.00 $0.53 $0.01 $0.00 $0.00 $0.00 $0.01 $0.01 $0.57WHOLESALE TR $0.01 $0.02 $0.01 $0.01 $0.57 $0.03 $0.05 $0.01 $0.02 $0.05 $0.11 $0.90RETAIL TRADE $0.00 $0.00 $0.00 $0.00 $0.30 $0.00 $0.00 $0.00 $0.00 $0.00 $0.00 $0.31FINANCIAL $0.01 $0.01 $0.01 $0.01 $2.09 $0.05 $0.06 $0.02 $0.01 $0.11 $0.15 $2.54SERVICES $0.01 $0.01 $0.01 $0.01 $1.08 $0.03 $0.04 $0.01 $0.01 $0.03 $0.11 $1.37TRANSP. $0.01 $0.01 $0.01 $0.01 $0.20 $0.03 $0.03 $0.01 $0.01 $0.02 $0.07 $0.42OPERATING $0.03 $0.02 $0.01 $0.02 $0.37 $0.06 $0.06 $0.02 $0.02 $0.05 $0.13 $0.78TRAVEL $0.02 $0.01 $0.01 $0.02 $0.26 $0.04 $0.04 $0.01 $0.01 $0.03 $0.09 $0.55OWNER OCCUP. $0.00 $0.00 $0.00 $0.00 $0.00 $0.00 $0.00 $0.00 $0.00 $0.00 $0.00 $0.00ROYALTIES $0.00 $0.00 $0.00 $0.00 $0.02 $0.00 $0.00 $0.00 $0.00 $0.00 $0.01 $0.04 TOTAL $0.42 $0.29 $0.17 $0.37 $22.12 $0.90 $0.97 $0.33 $0.24 $0.71 $2.02 $28.54DIRECT EXPENDITURES ARE $16.42 MILLIONS. Total Indirect Expenditures $5.70 $12.12(Total – Direct) EMPLOYMENT, PERSON-YEARS Algoma Brant Bruce Cochrane Dundas Co. Durham Essex Hamilton Peel RM Toronto Others ONT. AGRICULTURE 0.0 0.0 0.0 0.0 0.1 0.0 0.0 0.0 0.0 0.0 0.0 0.1FORESTRY 0.0 0.0 0.0 0.0 0.0 0.0 0.0 0.0 0.0 0.0 0.0 0.0FISHING 0.0 0.0 0.0 0.0 0.2 0.0 0.1 0.0 0.0 0.0 0.2 0.5OIL, MINES 0.3 0.0 0.0 0.4 0.0 0.0 0.0 0.0 0.0 0.0 0.3 1.1MANUFACTUR. 0.8 0.9 0.3 0.5 49.7 2.6 2.5 0.9 0.5 1.5 4.6 64.9CONSTRUCTION 0.0 0.0 0.0 0.0 18.8 0.0 0.0 0.0 0.0 0.0 0.0 18.8TRANSPORT. 0.3 0.1 0.1 0.3 7.3 0.5 0.6 0.2 0.3 0.5 1.5 11.7COMMUNICAT. 0.0 0.0 0.2 0.0 8.5 0.1 0.1 0.0 0.0 0.1 0.2 9.3ELECT., UTILIT. 0.0 0.0 0.0 0.0 1.3 0.0 0.0 0.0 0.0 0.0 0.0 1.4WHOLESALE TR 0.1 0.2 0.1 0.1 6.7 0.4 0.5 0.2 0.3 0.6 1.3 10.6RETAIL TRADE 0.0 0.0 0.0 0.0 6.8 0.0 0.0 0.0 0.0 0.0 0.1 7.0FINANCIAL 0.1 0.1 0.1 0.1 12.1 0.4 0.5 0.2 0.1 0.9 1.2 15.6SERVICES 0.2 0.1 0.1 0.2 15.7 0.5 0.6 0.2 0.1 0.5 1.6 19.9 TOTAL 1.9 1.5 1.0 1.7 127.2 4.5 5.1 1.7 1.3 4.1 10.9 160.9DIRECT EMPLOYMENT IS 79.4 PERSON-YEARS

Economic Impact Study of the South Dundas Township Fibre Network p. 33 / 64
Strategic Networks Group, 2003 June 27, 2003 www.sngroup.com
GROSS DOMESTIC PRODUCT, $MILLIONS Algoma Brant Bruce Cochrane Dundas Co. Durham Essex Hamilton Peel RM Toronto Others ONT. TOTAL $0.10 $0.07 $0.04 $0.09 $11.68 $0.22 $0.24 $0.08 $0.06 $0.18 $0.50 $13.29 GOVERNMENT TAX REVENUES, $MILLIONS Algoma Brant Bruce Cochrane Dundas Co. Durham Essex Hamilton Peel RM Toronto Others TOTALFEDERAL $0.02 $0.01 $0.01 $0.02 $1.37 $0.05 $0.05 $0.02 $0.01 $0.04 $0.10 $1.70PROVINCIAL $0.02 $0.01 $0.01 $0.02 $1.35 $0.04 $0.05 $0.02 $0.01 $0.04 $0.10 $1.67TOTAL $0.04 $0.03 $0.02 $0.04 $2.72 $0.09 $0.10 $0.03 $0.02 $0.07 $0.20 $3.37 Table 1.2 ECONOMIC IMPACT OF FIBRE NETWORK IN SOUTH DUNDAS, ONTARIO - INDUCED IMPACTS IMPACT BY COUNTY CLOSED SIMULATION INDUCED IMPACTS GROSS PRODUCTION (SALES) $MILLIONS Algoma Brant Bruce Cochrane Dundas Co. Durham Essex Hamilton Peel RM Toronto Others ONT. AGRICULTURE $0.00 $0.00 $0.01 $0.00 $0.35 $0.00 $0.01 $0.00 $0.00 $0.00 $0.03 $0.40FORESTRY $0.00 $0.00 $0.00 $0.00 $0.00 $0.00 $0.00 $0.00 $0.00 $0.00 $0.00 $0.00FISHING $0.00 $0.00 $0.00 $0.00 $0.01 $0.00 $0.01 $0.00 $0.00 $0.00 $0.01 $0.03OIL, MINES $0.02 $0.00 $0.00 $0.02 $0.00 $0.00 $0.00 $0.00 $0.00 $0.00 $0.01 $0.06MANUFACTUR. $0.13 $0.15 $0.05 $0.08 $0.63 $0.44 $0.43 $0.16 $0.09 $0.25 $0.78 $3.20CONSTRUCTION $0.00 $0.00 $0.00 $0.00 $0.98 $0.00 $0.00 $0.00 $0.00 $0.00 $0.00 $0.98TRANSPORT. $0.02 $0.01 $0.01 $0.02 $0.08 $0.03 $0.04 $0.01 $0.02 $0.03 $0.09 $0.36COMMUNICAT. $0.00 $0.00 $0.02 $0.00 $0.32 $0.01 $0.01 $0.00 $0.00 $0.01 $0.02 $0.38ELECT., UTILIT. $0.00 $0.00 $0.01 $0.00 $0.40 $0.00 $0.00 $0.00 $0.00 $0.00 $0.01 $0.43WHOLESALE TR $0.01 $0.01 $0.01 $0.01 $0.32 $0.02 $0.03 $0.01 $0.01 $0.03 $0.06 $0.51RETAIL TRADE $0.00 $0.00 $0.00 $0.00 $1.30 $0.01 $0.01 $0.00 $0.00 $0.00 $0.02 $1.34FINANCIAL $0.01 $0.01 $0.01 $0.01 $0.80 $0.05 $0.06 $0.02 $0.01 $0.11 $0.16 $1.26SERVICES $0.02 $0.01 $0.01 $0.01 $1.30 $0.04 $0.05 $0.02 $0.01 $0.04 $0.13 $1.64TRANSP. $0.00 $0.00 $0.00 $0.00 $0.09 $0.00 $0.00 $0.00 $0.00 $0.00 $0.01 $0.11OPERATING $0.00 $0.00 $0.00 $0.00 $0.18 $0.01 $0.01 $0.00 $0.00 $0.01 $0.02 $0.22TRAVEL $0.00 $0.00 $0.00 $0.00 $0.19 $0.01 $0.01 $0.00 $0.00 $0.01 $0.03 $0.28OWNER OCCUP. $0.02 $0.01 $0.01 $0.01 $0.32 $0.04 $0.04 $0.01 $0.01 $0.03 $0.09 $0.59ROYALTIES $0.00 $0.00 $0.00 $0.00 $0.01 $0.00 $0.00 $0.00 $0.00 $0.00 $0.00 $0.01HOUSEHOLDS $0.15 $0.10 $0.08 $0.13 $7.20 $0.32 $0.36 $0.12 $0.09 $0.28 $0.76 $9.58 TOTAL $0.38 $0.33 $0.21 $0.32 $14.47 $0.99 $1.06 $0.36 $0.25 $0.81 $2.22 $21.39

Economic Impact Study of the South Dundas Township Fibre Network p. 34 / 64
Strategic Networks Group, 2003 June 27, 2003 www.sngroup.com
EMPLOYMENT, PERSON-YEARS Algoma Brant Bruce Cochrane Dundas Co. Durham Essex Hamilton Peel RM Toronto Others ONT. AGRICULTURE 0.0 0.0 0.0 0.0 0.6 0.0 0.0 0.0 0.0 0.0 0.0 0.7FORESTRY 0.0 0.0 0.0 0.0 0.0 0.0 0.0 0.0 0.0 0.0 0.0 0.0FISHING 0.0 0.0 0.0 0.0 0.1 0.0 0.0 0.0 0.0 0.0 0.1 0.2OIL, MINES 0.1 0.0 0.0 0.1 0.0 0.0 0.0 0.0 0.0 0.0 0.0 0.2MANUFACTUR. 0.6 0.7 0.2 0.4 3.1 2.2 2.1 0.8 0.4 1.2 3.8 15.6CONSTRUCTION 0.0 0.0 0.0 0.0 6.0 0.0 0.0 0.0 0.0 0.0 0.0 6.0TRANSPORT. 0.2 0.1 0.1 0.2 0.8 0.3 0.4 0.1 0.2 0.3 0.9 3.4COMMUNICAT. 0.0 0.0 0.2 0.0 3.4 0.1 0.1 0.0 0.0 0.1 0.2 4.1ELECT., UTILIT. 0.0 0.0 0.0 0.0 1.1 0.0 0.0 0.0 0.0 0.0 0.0 1.2WHOLESALE TR 0.1 0.1 0.1 0.1 3.8 0.2 0.3 0.1 0.2 0.3 0.7 6.0RETAIL TRADE 0.0 0.0 0.0 0.0 28.9 0.1 0.1 0.0 0.0 0.1 0.3 29.8FINANCIAL 0.1 0.1 0.1 0.1 5.9 0.4 0.5 0.1 0.1 0.8 1.1 9.3SERVICES 0.3 0.2 0.2 0.3 26.3 0.8 1.1 0.3 0.2 0.8 2.7 33.3 TOTAL 1.5 1.3 1.0 1.2 80.0 4.1 4.6 1.5 1.1 3.7 9.9 109.8 GROSS DOMESTIC PRODUCT, $MILLIONS Algoma Brant Bruce Cochrane Dundas Co. Durham Essex Hamilton Peel RM Toronto Others ONT. TOTAL $0.22 $0.16 $0.13 $0.20 $4.31 $0.49 $0.55 $0.18 $0.14 $0.45 $1.20 $8.01 GOVERNMENT TAX REVENUES, $MILLIONS Algoma Brant Bruce Cochrane Dundas Co. Durham Essex Hamilton Peel RM Toronto Others TOTALFEDERAL $0.05 $0.03 $0.03 $0.04 $2.01 $0.10 $0.12 $0.04 $0.03 $0.10 $0.26 $2.80PROVINCIAL $0.03 $0.02 $0.02 $0.03 $1.26 $0.07 $0.08 $0.03 $0.02 $0.07 $0.18 $1.80TOTAL $0.08 $0.06 $0.05 $0.07 $3.27 $0.18 $0.20 $0.06 $0.05 $0.16 $0.44 $4.61

Economic Impact Study of the South Dundas Township Fibre Network p. 35 / 64
Strategic Networks Group, 2003 June 27, 2003 www.sngroup.com
Table 1.3 ECONOMIC IMPACT OF FIBRE NETWORK IN SOUTH DUNDAS, ONTARIO - TOTAL IMPACTS IMPACT BY COUNTY TOTAL IMPACTS GROSS PRODUCTION (SALES) $MILLIONS Algoma Brant Bruce Cochrane Dundas Co. Durham Essex Hamilton Peel RM Toronto Others ONT. AGRICULTURE $0.00 $0.00 $0.01 $0.00 $0.39 $0.01 $0.01 $0.00 $0.00 $0.00 $0.03 $0.44FORESTRY $0.00 $0.00 $0.00 $0.00 $0.00 $0.00 $0.00 $0.00 $0.00 $0.00 $0.00 $0.00FISHING $0.01 $0.00 $0.00 $0.00 $0.04 $0.00 $0.02 $0.00 $0.00 $0.00 $0.04 $0.12OIL, MINES $0.12 $0.00 $0.00 $0.15 $0.00 $0.00 $0.01 $0.00 $0.00 $0.01 $0.09 $0.39MANUFACTUR. $0.29 $0.34 $0.11 $0.19 $11.91 $1.00 $0.97 $0.36 $0.20 $0.56 $1.77 $17.71CONSTRUCTION $0.00 $0.00 $0.00 $0.00 $3.94 $0.00 $0.00 $0.00 $0.00 $0.00 $0.00 $3.94TRANSPORT. $0.06 $0.02 $0.03 $0.06 $1.28 $0.10 $0.14 $0.04 $0.06 $0.10 $0.32 $2.20COMMUNICAT. $0.00 $0.00 $0.03 $0.00 $1.54 $0.02 $0.01 $0.00 $0.00 $0.02 $0.03 $1.67ELECT., UTILIT. $0.00 $0.00 $0.02 $0.00 $0.92 $0.01 $0.01 $0.00 $0.00 $0.01 $0.02 $1.00WHOLESALE TR $0.02 $0.02 $0.02 $0.02 $0.89 $0.05 $0.07 $0.02 $0.04 $0.08 $0.17 $1.41RETAIL TRADE $0.00 $0.00 $0.00 $0.00 $1.60 $0.01 $0.01 $0.00 $0.00 $0.01 $0.02 $1.65FINANCIAL $0.03 $0.03 $0.02 $0.03 $2.89 $0.10 $0.12 $0.04 $0.02 $0.22 $0.31 $3.80SERVICES $0.03 $0.02 $0.02 $0.03 $2.38 $0.07 $0.10 $0.03 $0.01 $0.08 $0.24 $3.01TRANSP. $0.01 $0.01 $0.01 $0.01 $0.29 $0.03 $0.04 $0.01 $0.01 $0.03 $0.08 $0.53OPERATING $0.03 $0.02 $0.01 $0.02 $0.54 $0.07 $0.07 $0.02 $0.02 $0.05 $0.15 $1.00TRAVEL $0.02 $0.02 $0.01 $0.02 $0.45 $0.05 $0.06 $0.02 $0.01 $0.04 $0.12 $0.83OWNER OCCUP. $0.02 $0.01 $0.01 $0.01 $0.32 $0.04 $0.04 $0.01 $0.01 $0.03 $0.09 $0.59ROYALTIES $0.00 $0.00 $0.00 $0.00 $0.03 $0.00 $0.00 $0.00 $0.00 $0.00 $0.01 $0.05HOUSEHOLDS $0.15 $0.10 $0.08 $0.13 $7.20 $0.32 $0.36 $0.12 $0.09 $0.28 $0.76 $9.58 TOTAL $0.79 $0.62 $0.38 $0.68 $36.59 $1.89 $2.04 $0.68 $0.49 $1.53 $4.23 $49.92 EMPLOYMENT, PERSON-YEARS Algoma Brant Bruce Cochrane Dundas Co. Durham Essex Hamilton Peel RM Toronto Others ONT. AGRICULTURE 0.0 0.0 0.0 0.0 0.7 0.0 0.0 0.0 0.0 0.0 0.1 0.8FORESTRY 0.0 0.0 0.0 0.0 0.0 0.0 0.0 0.0 0.0 0.0 0.0 0.0FISHING 0.1 0.0 0.0 0.0 0.2 0.0 0.1 0.0 0.0 0.0 0.2 0.7OIL, MINES 0.4 0.0 0.0 0.5 0.0 0.0 0.0 0.0 0.0 0.0 0.3 1.3MANUFACTUR. 1.4 1.6 0.5 0.9 52.8 4.8 4.6 1.7 1.0 2.7 8.4 80.5CONSTRUCTION 0.0 0.0 0.0 0.0 24.8 0.0 0.0 0.0 0.0 0.0 0.0 24.8TRANSPORT. 0.4 0.2 0.2 0.5 8.1 0.7 1.0 0.3 0.5 0.8 2.4 15.1COMMUNICAT. 0.0 0.0 0.4 0.0 11.9 0.2 0.1 0.0 0.0 0.2 0.4 13.4ELECT., UTILIT. 0.0 0.0 0.1 0.0 2.4 0.0 0.0 0.0 0.0 0.0 0.1 2.6WHOLESALE TR 0.2 0.3 0.2 0.2 10.5 0.6 0.9 0.3 0.5 1.0 2.0 16.6RETAIL TRADE 0.1 0.0 0.0 0.1 35.7 0.1 0.2 0.0 0.0 0.1 0.4 36.8FINANCIAL 0.2 0.2 0.2 0.2 18.0 0.7 0.9 0.3 0.2 1.7 2.3 24.9SERVICES 0.5 0.4 0.4 0.5 42.0 1.3 1.7 0.5 0.3 1.4 4.2 53.2 TOTAL 3.4 2.8 2.0 2.9 207.2 8.6 9.7 3.2 2.4 7.8 20.9 270.7

Economic Impact Study of the South Dundas Township Fibre Network p. 36 / 64
Strategic Networks Group, 2003 June 27, 2003 www.sngroup.com
GROSS DOMESTIC PRODUCT, $MILLIONS Algoma Brant Bruce Cochrane Dundas Co. Durham Essex Hamilton Peel RM Toronto Others ONT. TOTAL $0.32 $0.23 $0.17 $0.29 $16.00 $0.71 $0.79 $0.26 $0.20 $0.63 $1.70 $21.29 GOVERNMENT TAX REVENUES, $MILLIONS Algoma Brant Bruce Cochrane Dundas Co. Durham Essex Hamilton Peel RM Toronto Others TOTALFEDERAL $0.07 $0.05 $0.04 $0.06 $3.38 $0.15 $0.17 $0.05 $0.04 $0.13 $0.36 $4.50PROVINCIAL $0.05 $0.04 $0.03 $0.05 $2.61 $0.12 $0.13 $0.04 $0.03 $0.10 $0.28 $3.47TOTAL $0.12 $0.09 $0.06 $0.11 $5.99 $0.27 $0.30 $0.10 $0.07 $0.23 $0.64 $7.98

Economic Impact Study of the South Dundas Township Fibre Network p. 37 / 64
Strategic Networks Group, 2003 June 27, 2003 www.sngroup.com
Appendix Two
South Dundas Business Directory

Economic Impact Study of the South Dundas Township Fibre Network p. 38 / 64
Strategic Networks Group, 2003 June 27, 2003 www.sngroup.com
South Dundas Business Directory (as provided by the South Dundas Economic Development Commission April 2003)
Name of Organization Type of Business Over 100 Employees Cruickshank Construction Ltd. Construction Ontario Provincial Police (O.P.P.) Government Services Ross Video Manufacturing SDS Kerr/Beavers Dental Manufacturing St. Lawrence Corp. Manufacturing 50 to 99 Employees Craig Packaging Ltd. Fibre Manufacturing Harland Veinotte Fibre Transportation & Storage Hunt Builders Ltd. Fibre Manufacturing Mike's Valu-mart Retail Trade Quality Manufacturing Fibre Manufacturing Seaway District High School Educational Services SMSI Travel Centre - KFC/Tim Horton's East Accommodation, Food and Beverages Whitteker Bus Lines Ltd. Transportation & Storage 20 to 49 Employees Brown Foundry Ltd. Manufacturing Canadian Tire Assoc. Store Fibre Retail Trade Dundas Bus Lines & Dundas Tours Transportation & Storage Dundas County Community Living Fibre Health and Social Services Eckel Industries of Canada Ltd. Fibre Manufacturing Frank Ault Excavating Ltd. Construction Giant Tiger Retail Trade Iroquois Enterprises Manufacturing Iroquois Fire Department Other Services Iroquois Public School Educational Services KBD Transportation Fibre Transportation & Storage McIntosh Country Inn & Conf. Centre Fibre Accommodation, Food and Beverages Morrisburg Public School Educational Services Park Lane Senior Support Centre Health and Social Services RohMax Canada Fibre Manufacturing S&F Food Town Retail Trade Scott's Kentucky Fried Chicken/Tim Horton's West Accommodation, Food and Beverages St. Lawrence Medical Centre - Ottawa Health and Social Services Swank Construction Construction The Hartford Retirement Centre Health and Social Services Tim Horton's Fibre Accommodation, Food and Beverages Township of South Dundas Fibre Government Services Upper Canada Motor Sales Ltd. Fibre Retail Trade Upper Canada Playhouse Other Services Xenopus Inc. Fibre Manufacturing

Economic Impact Study of the South Dundas Township Fibre Network p. 39 / 64
Strategic Networks Group, 2003 June 27, 2003 www.sngroup.com
Under 20 Employees 121-3553 Ontario Inc. O.A. Strader Motor Sales Retail Trade 750 Truck Stop Retail Trade A&J Snowplowing Retail Trade A.J. Bowers Ltd Fibre Construction A-31 Auto Sales Retail Trade Aikman Trailer Sales Retail Trade Alexander Real Estate Appraising Real Estate Operator & Insurance Agents Allan Bell & Assoc. Finance Allan Black Construction Ltd. Construction Altima Morrisburg Dental Centre Health and Social AMW & Associates Finance and Insurance Anderson's Strings & Things Retail Trade Andy's Home Renovations Construction Angus Palm Fibre Manufacturing Aquarius Pools & Spas Retail Trade Arlor Haven Campsite Accommodation, Food and Beverages Arthur Thom Electric Ltd. Construction At Your Service Finance and Insurance B&H Masonry Construction B.A.R.B. Consulting Inc. Other Services Baldwin Mowing & Plowing Construction Bank of Montreal - County Rd. Finance and Insurance Bank of Montreal - Main St. Finance and Insurance Bank of Nova Scotia Finance and Insurance Barkley's Apple Orchard Agriculture & Related Services Beaupre Jewellers Retail Trade Becker's Milk Co. Retail Trade Biba Retail Trade Black Lumber Co. Ltd. Retail Trade Black's TV & Appliances Retail Trade Blakely & Barclay Chartered Accountants Finance and Insurance Blossom Time Beauty Shop Other Services Blue Heron Bleu B&B Accommodation, Food and Beverages Bo's Barber Shop Other Services Breakaway Accommodation, Food and Beverages Brent's Towing & Repair Retail Trade Brian VanHoof Construction Contruction Brinston General Store Retail Trade Brister Group Fibre Real Estate Operator & Insurance Agents Buster's Backhoe Service Construction C&B International Development Other Services C&L Feeds Agriculture & Related Services C.F. Gleeson & Assoc. Ltd. Other Services Canada Post Corp. – Iroquois Government Services Canada Post Corp. – Morrisburg Government Services Candy's Hair Salon & Barber Shop Other Services Carfman Refurbishers Construction

Economic Impact Study of the South Dundas Township Fibre Network p. 40 / 64
Strategic Networks Group, 2003 June 27, 2003 www.sngroup.com
Carl's Dry-Wall Construction Carman House Museum Other Services Caroline's Consulting Other Services Casselman's Insurance Real Estate Operator & Insurance Agents Casselman's Taxi Service Transportation & Storage Cauvier's Tent & Canvas Repairs Retail Trade Cedar Glen Golf Course Other Services Cheryl's Hair Studio Other Services Chieftan Publishing Co. Manufacturing Chinook Group Ltd. Fibre Manufacturing Classic Cuts Other Services Coldwell Banker Coburn Realty Fibre Real Estate Operator & Insurance Agents Cook's Corner Retail Trade Co-operators Insurance Real Estate Operator & Insurance Agents Cooper's Sport Trophy, Engraving & Embroidery Retail Trade Country Lane Diner Accommodation, Food and Beverages Country Style Donuts Accommodation, Food and Beverages Craig's Electric Construction Crawford's Meat Shoppe Retail Trade Crowder Monuments & Vaults Retail Trade D&S Manufacturing Construction D.L. Shaver Equipment Other Services Dentz Orchards & Berry Farm Agriculture & Related Services Dixon's Corners Public School Educational Services Doran Bay Resort Accommodation, Food and Beverages Doug Byers Furniture & Appliances Ltd. Retail Trade Doug's Golden Eagle Welding Construction Dr. K.Y. Diu Health and Social Services Dr. Karen Salaj Health and Social Services Dr. L.P. Schnurr Health and Social Services Dr. Steven's Office Health and Social Services Dundas County Hospice Health and Social Services Dundas Land Registry Office Government Services Dundas-Agri Systems inc. Retail Trade Eastern Engines Retail Trade Eastern Ontario EquineWeb OASEC Ltd. Other Services Eastern Ontario Millwright Inc. Manufacturing Ecowater Systems Retail Trade Edgerton-Baker Fuels Construction Edie's House of Fashion Retail Trade Electrolux Sales & Service Retail Trade Elisabeth's Llama Ranch Accommodation, Food and Beverages Elma Public School Educational Services Ever Spa Farms Agriculture & Related Services Farm Mutual Financial Services Inc. Finance and Insurance Fireball Performance Automatics Inc. Retail Trade Flagg Creek Country Store Retail Trade Fred Hill Insurance Real Estate Operator & Insurance Agents Fred's Farm Supplies Agriculture & Related Services

Economic Impact Study of the South Dundas Township Fibre Network p. 41 / 64
Strategic Networks Group, 2003 June 27, 2003 www.sngroup.com
G&A Auto Sales & Service Retail Trade Gallop Canal Iroquois Landing Marina Other Services Gary's Automotive Retail Trade Gibson Electric Construction Gilmer Pharmacy Ltd. Retail Trade Glen Becker Nursery & Garden Centre Retail Trade Glen McDonnell Construction Ltd. Construction Gorell, Grenkie, Leroy & Remillard Business Services Grant Quarries Mining Gregor's Place Accommodation, Food and Beverages GWB Enterprises Manufacturing H&I Country Supply Agriculture & Related Services Hal's Barber Shop Other Services Harber's Masonry & Flame Centre Construction Hartley's Sport Shop Retail Trade Hat's Special Occasions Catering & Breakaway Fries Accommodation, Food and Beverages Helen Laurin's Hair Studio Other Services Heuvel Construction & Masonry Construction Hill's Mobile Village Real Estate Operator & Insurance Agents IPC Investment Corp. Finance and Insurance Iroquois Golf Course Other Services Iroquois Marine Services Other Services Iroquois Motel Accommodation, Food and Beverages Ivan's Cement Ploors Placing & Finishing Construction J&J Construction Construction J&S Convenience Store Retail Trade Jacques E. Asselin Real Estate Ltd. Real Estate Operator & Insurance Agents Jiggers Dining Lounge Accommodation, Food and Beverages Jim's Performance Plus Ltd. Retail Trade Joe's New & Used Discount Store Retail Trade John Allison Real Estate Real Estate Operator & Insurance Agents Jug City Convenience Store Retail Trade Karla Langevin, Reg. Massage Therapist Other Services Kelly's Cut and Style Other Services Kelly's Village Laundromat Other Services Ken PacPherson & Cathy Dykstra Construction King Plumbing & Heating Construction Liquor Control Board of Ontario – Iroquois Retail Trade Liquor Control Board of Ontario – Morrisburg Retail Trade Lee & Co. Interior Design Consultants Other Services Lee's Tavern Dining Lounge Accommodation, Food and Beverages Lise's Hair Salon Other Services Lloyd McMillan Equipment Ltd. Construction LMS Motor Sales & Service Retail Trade Locke's Rental's & Welding Other Services Lockview Giftshop Retail Trade Lou's Pantry Retail Trade Lucky Dollar Retail Trade Lyn-Kel Electrical Contractors Construction

Economic Impact Study of the South Dundas Township Fibre Network p. 42 / 64
Strategic Networks Group, 2003 June 27, 2003 www.sngroup.com
MacDonald Small Engine Repair Retail Trade MacEwen Gas Station/Country Style Donuts Retail Trade Mac's Convenience Store Retail Trade Marsden & McLaughlin Funeral Homes Ltd. - Beach Av Other Services Marsden & McLaughlin Funeral Homes Ltd. - County R Other Services McCooeye Financial Services Finance and Insurance McField's Nursery Agriculture & Related Services McGillis Home Hardware Retail Trade McHaffie's Auction Hall & Flea Market Retail Trade McInnis, MacEwan, & Horner Business Services Meals on Wheels Health and Social Services Melody's Variety Retail Trade Merkley Painting & Carpentry Construction Micro-Pro II Communication & Other Utilities Milano's Accommodation, Food and Beverages Morrisburg & District Co-operative Preschool Educational Services Morrisburg Animal Hospital Agriculture & Related Services Morrisburg AutoPro Retail Trade Morrisburg Building Centre Retail Trade Morrisburg Golf Club Other Services Morrisburg Leader Ltd. Manufacturing Morrisburg License Bureau Government Services Morrisburg Plumbing Centre Retail Trade MR Enterprise Construction Murphy's Sales & Service Retail Trade Mustard's Variety Ltd. Retail Trade Neil's Butcher Block Retail Trade Nelly Leighteizer, Tax Preparation Finance and Insurance New Centennial Restaurant & Nest Dining Lounge Accommodation, Food and Beverages Nick's Garden Centre Retail Trade Nick's Sports Bar Accommodation, Food and Beverages Nikken Other Services Odyssey Consulting, Lymphedema Therapy Other Services OFSC District 1 Snowmobile Assoc Fibre Other Services Old Authors Farm Retail Trade Ontario Court of Justice, Morrisburg Court Government Services Order Desk: MDG Kingston Inc. Retail Trade Pap's Service Station Retail Trade Parcoll Products Ltd. Retail Trade Park Drive Villa Health and Social Services Parker Funeral Home Ltd. Other Services Parker Professional Painting Canada Construction Pashell Ltd. Retail Trade Pastry Deluxe Accommodation, Food and Beverages Pier 31 Retail Trade Pinkus Tire & Battery Kingdom Ltd. Retail Trade Pizza Pizza Accommodation, Food and Beverages Plante Farm Equipment Agriculture & Related Services Pokey's Place Retail Trade

Economic Impact Study of the South Dundas Township Fibre Network p. 43 / 64
Strategic Networks Group, 2003 June 27, 2003 www.sngroup.com
Prehistoric World Other Services Prophet Technologies Inc. Fibre Communication & Other Utilities Prunner's Auto Care Retail Trade R.S. Allison & Sons Ltd. Agriculture & Related Services Raw Metalics Construction Richard McKee Painting & Wallpapering Construction Rideau St. Lawrence Utilities (Morrisburg Office) Fibre Communication & Other Utilities Rise 'N Shine Restaurant Accommodation, Food and Beverages Riverside Motel Accommodation, Food and Beverages Ro Broek Gardens Retail Trade Robert Jordan Construction Construction Robinson Landscaping Construction Roger's Small Engine Repair Retail Trade Ron's Renovation's & Roofing Construction Rooney Feeds Ltd. Agriculture & Related Services Rose Forest Farm and Garden Agriculture & Related Services Roy Hope, Snow and Lawn Maintenance Construction Royal Bank Finance and Insurance SanMar Pool Other Services Sears Catalogue Inc. Retail Trade Seaway Gallery Retail Trade Seaway Valley Pharmacy Retail Trade Shaklee Independent Distributor Other Services Skippy's Painting Construction Smyth's Apple Orchard Agriculture & Related Services Something Unique Construction South Dundas Economic Development Comm. Fibre Government Services South Dundas Networks Fibre Communication & Other Utilities St. Cecilia's Catholic School Educational Services St. Lawrence Inn Accommodation, Food and Beverages St. Mary's Catholic School Educational Services Stephenson Furniture & Antiques Retail Trade Stewarts Painting & Cleaning Construction Stillmeadow Limousin Other Services STS Construction Construction Styles TV & Appliance Service Retail Trade Subway Accommodation, Food and Beverages T.R. Leger Alternative School Educational Services Testerink Construction Ltd. Construction The Bargain Shop Retail Trade The Beer Store Retail Trade The Hair Studio Family Hair Care & Tanning Salon Other Services The Nook/Sears Catalogue Retail Trade The Pit Accommodation, Food and Beverages The Village Antiques & Tea Room B&B Accommodation, Food and Beverages The Village Green Flower & Gift Shop Retail Trade Thom Realty Limited Real Estate Operator & Insurance Agents Thom Travel Agency Retail Trade Thompson Sales Inc. Retail Trade

Economic Impact Study of the South Dundas Township Fibre Network p. 44 / 64
Strategic Networks Group, 2003 June 27, 2003 www.sngroup.com
Thompson Tim-Br Mart Retail Trade Thoughts of Country Retail Trade Tibben Equipment Ltd. Agriculture & Related Services Timmy's Place Retail Trade Timothy Christian School Educational Services Toonders Landscape Construction Transcanada Pipeline Communication & Other Utilities Tri-County Welding Construction Triple B Structures Ltd. Construction Triple T Quick Shop Retail Trade Upper Canada B&B Accommodation, Food and Beverages Upper Canada Campground Other Services Upper Canada Carriers Inc. Transportation & Storage Upper Canada Chiropractic Centre Health and Social Services Upper Canada Golf Course Other Services Upper Canada Greenhouses Agriculture & Related Services Uptown Girl Unisex Salon Other Services Verhoeven Egg Farm Agriculture & Related Services Victor Brooks & Son Inc. Other Services Village Lawn & Gardener/Village Movers Other Services Village Stylists Ltd. Other Services W.J. Shearing & Assoc. Other Services Weeacre Kennel Reg. Other Services Weegar Auto Repairs Retail Trade Whitteker's Meat Market Retail Trade Williamsburg Garage Retail Trade Williamsburg Wood & Garden Manufacturing Wilson's Apple Orchard Agriculture & Related Services Yesterday's Boutique/Watson's General Store Retail Trade Information on number of employees not available Archer Auto Recycling Inc. Retail Trade Bank of Montreal - Plaza Dr. Finance and Insurance Biemond's B&B Accommodation, Food and Beverages Byer's Limousine Service Transportation & Storage Chrysler Farm Manor Accommodation, Food and Beverages Crysler Park Beach - Parks of St. Lawrence Accommodation, Food and Beverages Crysler Park Marina Other Services D.I.A.M.O.N.D.S. Conservation Land Trust Other Services Dapper Dogs & Pretty Kitties Other Services Delage's House of Gifts Retail Trade Duke's North West Meats Retail Trade Dutch Touch Hairstyling Other Services Eastern Independent Telecom Ltd. Other Services Esthetics by Becky Other Services Ewekids Farm Agriculture & Related Services Fawcett Bros. Construction Flo's Chip Wagon Accommodation, Food and Beverages Galop Canal B&B Accommodation, Food and Beverages

Economic Impact Study of the South Dundas Township Fibre Network p. 45 / 64
Strategic Networks Group, 2003 June 27, 2003 www.sngroup.com
Global Sport Vacations Other Services Gloria Foot Real Estate Broker Real Estate Operator & Insurance Agents Great Shakes Accommodation, Food and Beverages Guy Fuels Ltd. Retail Trade HV Rentals Ltd. Other Services Iroquois & District Soccer Other Services Iroquois Campground Accommodation, Food and Beverages Janie Strader Finance and Insurance Keystone Masonry Construction Krown Rust Control System Retail Trade Les Traductions - Pierre LeBlanc - Translation Other Services Lockmaster's House Tearoom Accommodation, Food and Beverages Made with Love Morrisburg & District Lions Club Other Services Mr. Mozzarella Accommodation, Food and Beverages Neil's Radio & TV Retail Trade Parkway Matel Accommodation, Food and Beverages Pro Steam Carpet & Upholstery Cleaning Retail Trade Riverside-Cedar Park Other Services Roofworks Construction St. Lawrence B&B Accommodation, Food and Beverages St. Lawrence Medical Clinic - County Health and Social Services St. Lawrence Seaway Interpretative Centre Other Services Stephen Merkley Drywall Ltd. Construction Sure Water Retail Trade The "Inn" by the Park B&B Accommodation, Food and Beverages This & That Retail Trade Tiny Paws Kennell Other Services Tommy's Complete Automotive Retail Trade Tri-County Tire Retail Trade Twin Peaks Sanitary Svc. Construction U-FAB Boats Retail Trade Universal Terminals Inc. Retail Trade Upper Canada Migratory Bird Sanctuary Other Services Upper Canada Village Other Services William D. Guse Farrier Agriculture & Related Services Williamsburg Pump Supply & Service Retail Trade Williamsburg Truck & Trailer Service Transportation & Storage Total Number of Businesses 366 Total Number of Fibre Subscribers 24

Economic Impact Study of the South Dundas Township Fibre Network p. 46 / 64
Strategic Networks Group, 2003 June 27, 2003 www.sngroup.com
Appendix Three
South Dundas, An Overview and System Description

Economic Impact Study of the South Dundas Township Fibre Network p. 47 / 64
Strategic Networks Group, 2003 June 27, 2003 www.sngroup.com
South Dundas, An overview and System Description
1.1 THE DILEMMA During the last decade of the twentieth century, the Township of South Dundas experienced a loss of employment opportunities, especially in the manufacturing sector, as a result of the changing economies in Canada, and in Eastern Ontario in particular. In addition, the municipality had not been able to attract jobs associated with the high technology or communications sector, nor the related high-tech support activities, such as engineering, assembly, component manufacturing or software development, experienced in other centres. Situated on the north shore of the St. Lawrence River between Prescott and Cornwall, close to major national and international transport routes, South Dundas rates highly in commercial attractiveness in terms of facilities, infrastructure, low taxes, pleasant environment and the quality-of-life. Yet in spite of this, there was a net job loss of about 600 positions over the decade prior to 2000. Research suggested the key difference between South Dundas and the more successful urban areas was the lack of reasonably priced high-bandwidth communications in general and Internet access in particular. 1.2 THE OPTIONS Services, then and now, for broadband communications in South Dundas were limited and-or expensive. A T-Carrier service, at the moment, is limited to T1 in Morrisburg, and a shared cable modem connection, again, is limited to the township’s residential urban areas, not businesses. Other access options such as consumer satellite and wireless providers were, and still are, poor broadband candidates due to cost and performance issues. It was found that most small-to-medium businesses would only reluctantly use wireless systems due to these and other concerns, such as security. Large, branch-plant, companies informed us they would not use wireless systems period. To get the high capacity system needed in South Dundas as the desired economic stimulus engine, the municipality found the only solution was to build its own system. It was decided that waiting or doing nothing would simply continue the declining state of economic health in the community. 1.3 THE RESEARCH 1.3.1 The Planning In June of 2000, the South Dundas Power Utility Commission, in cooperation with the Municipality and the Economic Development Commission, initiated a project to investigate the problem of the regional economy. The findings were worrisome and familiar to most rural municipalities:
• Federal and provincial governments were withdrawing as resource partners. Amalgamation and restructuring left communities cash short.

Economic Impact Study of the South Dundas Township Fibre Network p. 48 / 64
Strategic Networks Group, 2003 June 27, 2003 www.sngroup.com
• There were continuing job and payroll losses. • Emergence of a knowledge-based economy in rural areas was non-existent.
In fact, rural Canada was, and is, being depopulated. It was clear to South Dundas that the survival of its small municipalities was at stake, so it decided to act, using entirely its own resources. Once the decision was made, the project was fast-tracked. The Township formed a Committee-of-Council staffed by Municipal, PUC and local business members and empowered it to act. Key start-up issues and questions to be answered included:
• If the decline keeps up, what then? • Can we do a broadband project? • If so, is it a good idea? • Who can do build and operate the system? • Who will own it? • How can the expense be justified to ratepayers?
A revisit of the Township’s strategic plan was needed. In the past, communications and knowledge-based issues were not addressed in the Township’s Strategic Planning, even though, when asked, most felt it was an extremely important factor in the development and economics of the community. This oversight was corrected, and the Township undertook studies to see what could be done. 1.3.2 The Inspiration The results of a review of existing capabilities were very clear. Existing (legacy) providers, Telco and Cable companies, had limited plant and equipment and no desire to invest in rural areas where the short-term return on investment (ROI) was low or non-existent. Newer bandwidth suppliers had limited resources and performance issues. However, some of the township businesses canvassed had an immediate need and wanted more than dial-up or cable connectivity although the numbers given were not enough to warrant a standard business case. One of the Township business leaders, Roy Brister, of Brister Insurance Group, had successfully established a broadband network connecting rural offices in South Dundas and the surrounding townships. This success provided the Township with the belief that it too could build a system. 1.3.3 The Vision Thus inspired, the South Dundas Communications Committee (SDCC) and the Economic Development Commission (SDEDC) proceeded on two fronts. The SDCC commissioned a study to determine the scope and the coverage of the system to be built. The SDEDC endeavoured to assess the economic impact. The fibre project had the following key assumptions and guidelines:
• Based on input from Economic Development authorities, connectivity groups and provincial and federal government sources, there was an evolving opinion that a community can influence its economic development by securing appropriate high bandwidth access for services and business within the community.

Economic Impact Study of the South Dundas Township Fibre Network p. 49 / 64
Strategic Networks Group, 2003 June 27, 2003 www.sngroup.com
• To obtain high-tech communication jobs and to promote local competition, a community would be well served to develop its own solution, i.e., provide the digital roadways over which multiple service providers can provide services to all clients on a level playing field.
• To realize the gains, the proposed project must address most, if not all, the
municipal, commercial and industrial areas of the community. This can be done in a phased approach, of defined scope, to allow the project to proceed in a step-wise fashion as funding permits.
• To save procurement cost, the project would be presented as a list of component
parts, allowing for a simple and cost effective Request-for-Quotation (RFQ) process rather than the much more expensive Request-for-Proposal (RFP). A RFP would require the development of additional and expensive system and sub-system specifications.
It soon became clear to the members of the Township’s Communications Committee that all aspects of a communications delivery system would have be built, including, delivery media (outside plant), switching and routing (inside plant) and the establishment of an Internet Point of Presence (POP) within the community. Services providers would have to be found and services established within the community. The leadership quickly realized that these considerable assets would be of strategic value, not only to the Township, but also to surrounding communities as well.
1.3.4 The SDCC Infrastructure Study Commissioned in late June 2000, the Infrastructure Study, contracted to APT Prophet Technologies Inc. (@ProphetTech), involved a review of the Township of South Dundas with the following goals:
• Assess the types and locations of potential users of the system. • Identify the current utility assets, (poles, etc.), needed for the project. • Propose a system design and layout of communication routes. • Provide an initial vendor search and costing. • Develop a scope and go-forward plan.
The essential premise was that all business communications activity, external to clients and suppliers, as well as internal to branch plants, would eventually migrate to the Internet to save cost. The key benefit being, the Internet is free, with the only cost, the connection to it. Thus the Township set about to build a future-proof, broadband on-ramp to the digital highway, the World Wide Web. System design focused on delivery of proven technology with a long useful life and expansion potential, to allow for both new developments within the community as well as increased performance. Single-mode, fibre-optic cable was the overwhelming choice for the municipality as it is for all the major carriers of high bandwidth communications. The
South Dundas would not only promote cooperation with these surrounding rural municipalities, but would ensure the system was designed with this in mind. Cost savings to other communities would mean additional revenue for the new system.

Economic Impact Study of the South Dundas Township Fibre Network p. 50 / 64
Strategic Networks Group, 2003 June 27, 2003 www.sngroup.com
fibre technology represents the lion-share of project cost, and has a useful life in excess of twenty years. Given the small distances to be covered, it is anticipated that life expectancy could be well over thirty years. The electronics would be modularized to facilitate change as technological or performance improvements became necessary. The research was essentially a preliminary development phase to identify factors such as who, where, what and how much. Initially the project called for a smaller fibre system in Morrisburg only, with the build-out in Iroquois and Williamsburg reserved for a future expansion. However with the concern over the impending merger or sale of South Dundas Hydro and the need to support the commercial establishments in Iroquois, the decision was taken to complete and interconnect both communities. Further follow-on decisions were taken to connect Williamsburg and investigate the provision of wireless services to the rural areas. Project phases involved the acquisition and installation of the fibre-optic cable, components, and electronics and broadband wireless equipment. The evolved plan covered all urban areas of the municipality where key services and businesses are located. In addition, a sufficient number of optical circuits were allocated to service current and anticipated future needs. The system concept called for a number of judiciously placed Junction Boxes to ensure interconnection with customers is as easy and as inexpensive as possible. Clients who wished an immediate connection were to be accommodated during the installation phase. The finalized plan called for fibre-optic cable within the urban areas of the Township, with follow-on plans to provide connectivity to the rural farming areas. The system must provide broadband virtual private networks (VPN) and high-speed Internet access for municipal facilities, emergency and public services, businesses and industrial spaces. It was envisaged that, where practical and affordable, the community fibre project would provide coverage to all of the industrial, business and commercial areas of the community. While initial focus was on the urban areas, the plan would eventually include connection to residential and rural users. A survey of potential users, completed in June of 2000, indicated that of 171 businesses located within the urban areas of Morrisburg and Iroquois, an estimated 52 could immediately benefit from broadband services. Further research into available, affordable technology indicated that only fibre optic cable could provide the desired level of service with sufficient capacity to handle the anticipated future growth in both users and bandwidth supplied to each. Also, it was quickly learned that only the fibre-optic media would impress key information users that the Township was serious. A system plan was developed to provide a sufficient number of fibre circuits to meet this requirement, first for Morrisburg and then for Iroquois and Williamsburg. Project construction costs were extracted from a vendor survey using the Request-for-Quotation (RFQ) process. Vendors and components were selected using a best-value-for-expenditure in order to produce a high quality system in keeping with the needs of the municipality, government services and the corporate business community. While best value was the main criteria, vendor capabilities, experience and interest in the project were also considered.

Economic Impact Study of the South Dundas Township Fibre Network p. 51 / 64
Strategic Networks Group, 2003 June 27, 2003 www.sngroup.com
A study report detailed the project, from the initial surveys of the commercial and industrial base, the location of assets that may be of use to the project, concept design and vendor solicitations to the construction and rollout of the system. 1.4 THE SOLUTION The new network would be based on fibre-optic cable in the urban commercial and industrial areas of Morrisburg and Iroquois. After the June 23rd go-ahead, the project was fast-tracked and work commenced in July 2000 with the first delivery of materials, the fibre-optic cable, arriving on the July 9th. When complete, February 2001, the system consisted of fibre to the Curb (FTTH) system installed on existing utility poles. To minimize client connection cost, the fibre was terminated with junction boxes located close as possible to the users. In addition, Morrisburg, the western sector, Iroquois, the southern sector and Williamsburg, the northern sector, all had a trial wireless service using available surplus equipment. In Morrisburg, the fibre bundles terminated at a “Central Office”, located in the middle of the North-South and East-West routes and close to the Bell Canada Central Office, the connection point of choice for most commercial users. A small secure brick building, 12’ x 10’, was built to house the network electronics there. In Iroquois the CO was located in the Community Centre, again very close to the Bell Canada facility. In Williamsburg, switching equipment is located at the town office. A 45 Mbps, full duplex, wireless system was deployed to interconnect Morrisburg, Iroquois and Williamsburg. The Morrisburg segment commenced trials in February 2001. It was quickly realized that the NorTel Passport 8600 series switch would not be adequate. A key system requirement was the need to control bandwidth in both directions to each individual client. In this way a range of service levels could be offered to satisfy a range of client requirements, small to large, so very important in a rural community. Extreme Networks provided equipment for trials, after which, these switches were selected. The system was considered to be fully operational by June of 2001. 1.5 THE JUSTIFICATION Like any project that requires public funds, the communications project required some form of justification. Initial funding came from PUC reserves, with the remainder from the Municipality. The SDCC and @ProphetTech investigated and brainstormed the means to supply the business rational. Four key areas, capital investment, the expected client growth rate, start-up vice break-even phases, and the Operation and Maintenance (O&M) costs, had to be considered.
To meet the criteria of a lower cost service, with the expected growth rate of clients, no real payback on the capital could be expected. Therefore the SDCC adopted the position that the rational for this investment, like with other municipal systems, was to provide the infrastructure needed for the community. It was noted that servicing an industrial lot or building a road did not suffer the ‘business plan syndrome’ so prevalent in the communications industry, so the Township did not take that path. Instead it formulated a
No matter from which direction the problem was viewed, the capital investment could not be justified by normal business returns.

Economic Impact Study of the South Dundas Township Fibre Network p. 52 / 64
Strategic Networks Group, 2003 June 27, 2003 www.sngroup.com
plan to promote growth in the community by promoting the community as a ‘fibre-optic connected community’.
The SDCC looked into a simple rationalization of the importance of jobs to the local economy. Experts informed the community that it could be shown that the value of a job to its economy could be anywhere from 3 to 6 times the value of the annual salary of that job, based on factors such as the type of job, location and other community parameters. The SDCC took the conservative factor of three and calculated that 100 new jobs, with an average annual salary of $25K, would yield a value to the local economy of at least $7.5 million. Thus an investment of about $750K would yield an economic increase of up to ten fold, a very handsome ROI, given the accompanying increases in retail sales, real estate and assessments. SDEDC set-up monitoring programs to track the changes in economic position, and as it turns out, this estimate was quite modest. Start-up and sustainability were other issues that the community faced. What products could be offered and how soon could the system reach a state of self-sufficiency? This had to be addressed, with O&M costs, to determine the target cost baseline. The business survey indicated that of 171 businesses located within the target area, 52 could immediately benefit from broadband services and might connect within the start-up period, now set at two years. Also the range of clients had to be addressed. The first issue was the Start-up, and two problems were noted. One, cable-modem service would attract some lower-end clients where services could be provided and, two, the range of client type, from Small Office – Home Office (SOHO) to corporate branch plant was substantial. Upon review, the first problem, additional services provided by the telco and cable companies, was not considered to be a problem at all. The additional choice and competition was deemed to be good. It was quickly noted that these new services would be primarily beneficial to the residential community, as the offerings were deemed to be somewhat limited for an information-based Business and for Industry. One thing was certain; without investment in the community, South Dundas would not have attracted the existing carriers.
The second problem was solved by technology. In consultation with the system builders and the local ISP, it was noted that Gigabit Ethernet Switching had several advantages; first it spoke to client systems without any protocol translation, so hook-up costs were minimized; and secondly, the built-in features of priority and duplex bandwidth rate-shaping allowed for a differentiation of product offered, and thus potential for differences in pricing. With a responsive ISP and GigE Switching, the community could field a system that was affordable to all levels of business, a significant achievement. The next issue was sustainability. The first part of this solution was to establish the Operation and Maintenance (O&M) cost. This was accomplished, for an initial period of
An investment in broadband will get you one system, or maybe more, for the price of one, but non-investment will get you nothing.
The real justification for the investment would be jobs, jobs, and jobs….

Economic Impact Study of the South Dundas Township Fibre Network p. 53 / 64
Strategic Networks Group, 2003 June 27, 2003 www.sngroup.com
three years, by selecting the builders, @ProphetTech, to define a system O&M statement of work and cost. The work scope, detailing activities and person costs, including an agreement, was completed and in place by November 2000. The second part of the sustainability issue was to set a series of loop charges that did not over burden the ISP or clients with overly high costs. It would be counter-productive to have high loop fees in the start-up operational phase, where a fast hook-up rate is very desirable. Pre-booking the clients was not possible, as reasonably shrewd rural clients need demonstrable performance. Loop costs were established and the Community moved ahead with operational communications system that would reach full sustainability with the connection of 160 clients distributed across the range of fees. To meet this, it was recognized that the system would need to be expanded to cover the whole township where approximately 250 additional businesses and over 500 farms reside. In the meantime, the community picked up the tab, anticipating that in the future, system expansion already being planned, the high quality of services offered, and the general move by business to the Internet, would deliver the needed connections. 1.6 THE OPERATION & RESULTS To ensure it was not burdened with operational details and concerns, the Township contracted @ProphetTech to operate and maintain the new South Dundas Community Network in November of 2000. The work involved the set-up of a Network Operations Centre (NOC) and periodic monitoring, physical inspection and maintenance of the fibre and wireless systems as well as the system switches. Additional duties included support to service providers and clients. The SDCC requested @ProphetTech to establish an ISP operation when it became clear that other external suppliers would not set up an operation within the township. To get the most of the realizable benefits, the Township mandated that first new jobs to be created by the system, the system operator and service suppliers, must have an office in the community and be connected directly to the system. Initial ISP operations commenced in February 2001, with a connection to WorldCom’s global network through a Bell dedicated T-carrier circuit. While thought to be small by outsiders, this circuit proved to be most adequate for the current requirement and its reasonable cost met a key sustainability requirement. The broadband fibre and wireless circuits connected directly to the Bell exchange produced comfort and satisfaction with the largest of clients.
ECONOMIC RESULTS: • Retail Sales, an increase $16.7 million. • Employment, 145 person-years (directly attributable to the project). • Tax revenue, increases of $2.2M Federal & $1.6M Provincial in
assessments. (See Economic Impact Report: South Dundas Township Fibre Network, Oct. 2002)

Economic Impact Study of the South Dundas Township Fibre Network p. 54 / 64
Strategic Networks Group, 2003 June 27, 2003 www.sngroup.com
By summer 2002 the total job growth had reached 537, indicating that the project has been able to, and is continuing to, stimulate growth. The Township has attracted a range of new enterprises including retail, manufacturing, small call centre, and a regional insurance office, in addition to those already within the municipality. At the time of writing, the South Dundas Community Network has been operating for about 18 months and includes clients in the following sectors:
• Real Estate and Insurance • Retail Trade • Manufacturing • Construction • Transportation & Storage • Accommodation, Food & Beverages • Government Services • Health and Social Services • Communication and Other Utilities

Economic Impact Study of the South Dundas Township Fibre Network p. 55 / 64
Strategic Networks Group, 2003 June 27, 2003 www.sngroup.com
Appendix Four
Statistical Data for South Dundas

Economic Impact Study of the South Dundas Township Fibre Network p. 56 / 64
Strategic Networks Group, 2003 June 27, 2003 www.sngroup.com
Table 4.1 Comparative Statistics for South Dundas and Eastern Ontario Source - Statistics Canada: 2001 Community Profiles Townships Towns / Villages Ontario
South Leeds & South North Dundas 1,000 Islands Stormont Dundas Morrisburg Cardinal Winchester
Land area (square km) 519.99 606.91 447.45 503.18 6.27 2.29 2.40 907,655.59 Population in 2001 10,783 9,069 11,941 11,014 2,568 1,739 2,427 11,410,046 Population in 1996 10,900 9,177 11,584 11,064 2,538 1,777 2,334 10,753,573 Earnings All persons with earnings (counts) 5,485 5,085 6,450 6,275 585 750 1265 6,319,535 Average earnings (all persons with earnings ($)) 27,376 29,451 32,935 28,601 27,427 28,446 27,330 35,185 Worked full year, full time (counts) 2,905 2,650 3,630 3,510 575 390 630 3,480,670 Average earnings (worked full year, full time ($)) 36,703 40,410 43,100 37,903 39,352 37,630 39,357 47,247 Labour Force Indicators Participation rate 62.8 64.4 67.5 71.5 56.8 50.4 62.0 67.3 Unemployment rate 6.8 6.8 5.3 4.5 8.9 5.1 4.3 6.1 Industry Total - Experienced labour force 5,295 4,715 6,205 6,045 1,150 670 1,155 5,992,765 Agriculture and other resource-based industries 485 260 280 885 35 15 50 191,020 Manufacturing and construction industries 1,570 1,385 1,860 940 345 230 135 1,316,580 Wholesale and retail trade 645 605 735 920 225 105 250 950,730 Finance and real estate 125 160 200 290 20 15 55 401,445 Health and education 570 610 1,270 980 125 70 275 902,990 Business services 840 650 920 955 180 120 185 1,145,910 Other services 1,055 1,045 940 1,080 220 125 210 1,084,090

Economic Impact Study of the South Dundas Township Fibre Network p. 57 / 64
Strategic Networks Group, 2003 June 27, 2003 www.sngroup.com
Table 4.2 Number of New Jobs by Category (South Dundas, May 2002 - April 2003)
Category 1 Industry New Jobs F/T P/T Seasonal Manufacturing 16 Transportation 6 Communication & Other Utilities 2 Total 22 2 0 Category 2 Industry New Jobs F/T P/T SeasonalFibre Manufacturing 84 3 10 Accommodation, Food & Beverages 36 10 Health & Social Services 4 Retail Trade 4 2 Other Services 1 Subtotal 125 9 20 Broadband Manufacturing 10 10 Finance and Insurance 4 1 Retail Trade 1 Subtotal 15 11 0 Dial-up Manufacturing 3 Finance and Insurance 1 Transportation 4 Accommodation, Food & Beverages 1 Real Estate Operators and Insurance Agents 1 Subtotal 4 1 5 Total 144 21 25 Category 3 Industry New Jobs F/T P/T Seasonal Education 1 Manufacturing 18 Retail Trade 3 2 Other Services 3 Total 21 3 3 Grand Total 187 26 28

Economic Impact Study of the South Dundas Township Fibre Network p. 58 / 64
Strategic Networks Group, 2003 June 27, 2003 www.sngroup.com
Table 4.3 Survey Data: Type of Internet Access & New Jobs
Broadband
Sector Respondents with Broadband Access
Respondents with Broadband Access & New
Jobs % Accommodation, Food & Beverages 2 2 100.0%Agriculture & Related Services 1 0 0.0% Business Services 1 0 0.0% Communication & Other Utilities 3 1 33.3%Construction 1 0 0.0% Educational Services 2 0 0.0% Finance & Insurance 4 4 100.0%Government Services 3 0 0.0% Health & Social Services 2 1 50.0%Manufacturing 9 7 77.8%Mining, Quarrying & Oil Wells 0 0 0.0% Other Services 2 1 50.0%Real Estate Agents & Insurance Operators 2 0 0.0% Retail Trade 4 2 50.0%Transportation 2 1 50.0% Total 38 19 50.0% Dial-up
Sector Respondents with Dial-
up Access Respondents with Dial-up
Access & New Jobs % Accommodation, Food & Beverages 1 1 100.0%Agriculture & Related Services 3 0 0.0% Business Services 1 0 0.0% Communication & Other Utilities 1 0 0.0% Construction 5 0 0.0% Educational Services 3 1 33.3%Finance & Insurance 1 1 100.0%Government Services 0 0 0.0% Health & Social Services 1 0 0.0% Manufacturing 3 2 66.7%Mining, Quarrying & Oil Wells 0 0 0.0% Other Services 6 1 16.7%Real Estate Agents & Insurance Operators 3 1 33.3%Retail Trade 7 2 28.6%Transportation 2 1 50.0% Total 37 10 27.0%

Economic Impact Study of the South Dundas Township Fibre Network p. 59 / 64
Strategic Networks Group, 2003 June 27, 2003 www.sngroup.com
No Internet Access
Sector Respondents with No
Internet Access Respondents with No
Internet Access & New Jobs % Accommodation, Food & Beverages 0 0 0.0% Agriculture & Related Services 2 0 0.0% Business Services 0 0 0.0% Communication & Other Utilities 0 0 0.0% Construction 1 0 0.0% Educational Services 0 0 0.0% Finance & Insurance 1 0 0.0% Government Services 0 0 0.0% Health & Social Services 3 0 0.0% Manufacturing 0 0 0.0% Mining, Quarrying & Oil Wells 0 0 0.0% Other Services 2 0 0.0% Real Estate Agents & Insurance Operators 1 0 0.0% Retail Trade 8 1 25.0%Transportation 0 0 0.0% Total 18 1 5.6% Fibre Network
Sector Respondents with
Fibre Access Respondents with Fibre
Access & New Jobs % Accommodation, Food & Beverages 2 2 100.0%Agriculture & Related Services 0 0 0.0% Business Services 0 0 0.0% Communication & Other Utilities 3 1 33.3%Construction 1 0 0.0% Educational Services 0 0 0.0% Finance & Insurance 0 0 0.0% Government Services 2 0 0.0% Health & Social Services 1 1 100.0%Manufacturing 8 6 75.0%Mining, Quarrying & Oil Wells 0 0 0.0% Other Services 1 1 100.0%Real Estate Agents & Insurance Operators 2 0 0.0% Retail Trade 2 1 50.0%Transportation 2 1 50.0% Total 24 13 54.2%

Economic Impact Study of the South Dundas Township Fibre Network p. 60 / 64
Strategic Networks Group, 2003 June 27, 2003 www.sngroup.com
Table 4.4 Survey Results - Response Rate by Industry Sector
Sector Surveys Sent Responded Response Rate Accommodation, Food & Beverages 6 3 50.0% Agriculture & Related Services 9 6 66.7% Business Services 2 2 100.0% Communication & Other Utilities 4 4 100.0% Construction 10 7 70.0% Educational Services 8 5 62.5% Finance & Insurance 7 6 85.7% Government Services 3 3 100.0% Health & Social Services 7 6 85.7% Manufacturing 16 12 75.0% Mining, Quarrying & Oil Wells 1 0 0.0% Other Services 13 10 76.9% Real Estate Agents & Insurance Operators 6 6 100.0% Retail Trade 28 19 67.9% Transportation 4 4 100.0% Total 124 93 75.0%

Economic Impact Study of the South Dundas Township Fibre Network p. 61 / 64
Strategic Networks Group, 2003 June 27, 2003 www.sngroup.com
Appendix Five
Comments from Businesses and Organizations in South Dundas

Economic Impact Study of the South Dundas Township Fibre Network p. 62 / 64
Strategic Networks Group, 2003 June 27, 2003 www.sngroup.com
Comments from Businesses and Organizations in South Dundas The following are comments made by survey respondents either on their survey form or during a telephone call with SNG. Quotes were attributed to a particular organization only when permission to do so was received. “Our sales office [8 employees] would not exist in Canada if it was not for broadband. It would be based in the United States.” - Xenopus Inc., Manufacturing firm “In this business, the man with the faster modem wins. [However,] I am concerned about the high costs of fibre optic maintenance.” - Transportation firm “People need to understand the Internet and its uses better.” - Manufacturing firm “The dial-up connection [to another school] is too slow and so we never use the Internet.” – Educational organization “The Internet (and the speed of the fibre optic network) has increased the efficiency of communications with the head office in Toronto. Our on-line product training is more efficient. This leads to better informed sales and service staff, which leads to more satisfied customers and, hopefully, in turn, to increased sales…..It is a spin-off effect.” “Our average sales per customer is 5-7% higher than any other Canadian Tire Store” – Canadian Tire Associate Store, Retail trade firm “We need the Internet to compete. That is the way the industry is going. If you don’t have it, you are dead in the water.” – Real estate firm “The impacts of the Internet are not important enough to warrant the investment in high speed.” – Agricultural supply firm “The Internet allows me to compete with larger competitors.” – Transportation firm “My business relies on the Internet. Without it, I would just be doing general repairs…. It allows me to do what I love.” – Retail trade firm “The use of email has reduced our long-distance telephone charges significantly…. The time spent on the phone or waiting to speak to people on the phone has been reduced by perhaps 75%.” – Social services organization “The 2 jobs in Morrisburg would not have existed without the existence of the fibre optic network.” – Angus Palm, Manufacturing firm

Economic Impact Study of the South Dundas Township Fibre Network p. 63 / 64
Strategic Networks Group, 2003 June 27, 2003 www.sngroup.com
“When entering permit applications previously, with a dial-up connection, the process took between 8-10 minutes per permit. With the broadband it was reduced to 1 minute 20 seconds per permit.” – Ontario Federation of Snowmobile Clubs “Using the Internet has significantly reduced the amount of time required for communications with other branches and suppliers. Would have had difficulties realizing our level of growth without the broadband.” – Hunt Builders Ltd., Manufacturing firm “Education is a major problem. Businesses don’t understand the potential benefits [of high speed access to the Internet].” – Brister Group, Insurance firm “We estimate a $40,000 saving (2% of total overhead) in terms of efficiency and productivity, especially as it relates to communication. Training costs are significantly reduced – training trips to Ottawa or Toronto cost $250/pp per day (avg $30/hr salary) in lost productivity plus expenses (mileage, meals, accommodation). Internet based training, for the equivalent in course work would require 3 hours in front of a computer ($90/pp of lost productivity). An out of town seminar leader requires $3000/day plus expenses (for 2 days). Equivalent sessions over video conferencing cost $250/hr for 6 hours [saving of over $4500, annually].” – Brister Group, Insurance firm

Economic Impact Study of the South Dundas Township Fibre Network p. 64 / 64
Strategic Networks Group, 2003 June 27, 2003 www.sngroup.com
TTHHIISS PPAAGGEE IISS IINNTTEENNTTIIOONNAALLLLYY BBLLAANNKK