Economic Compass: China: Growing Pains for a Growing Power
16
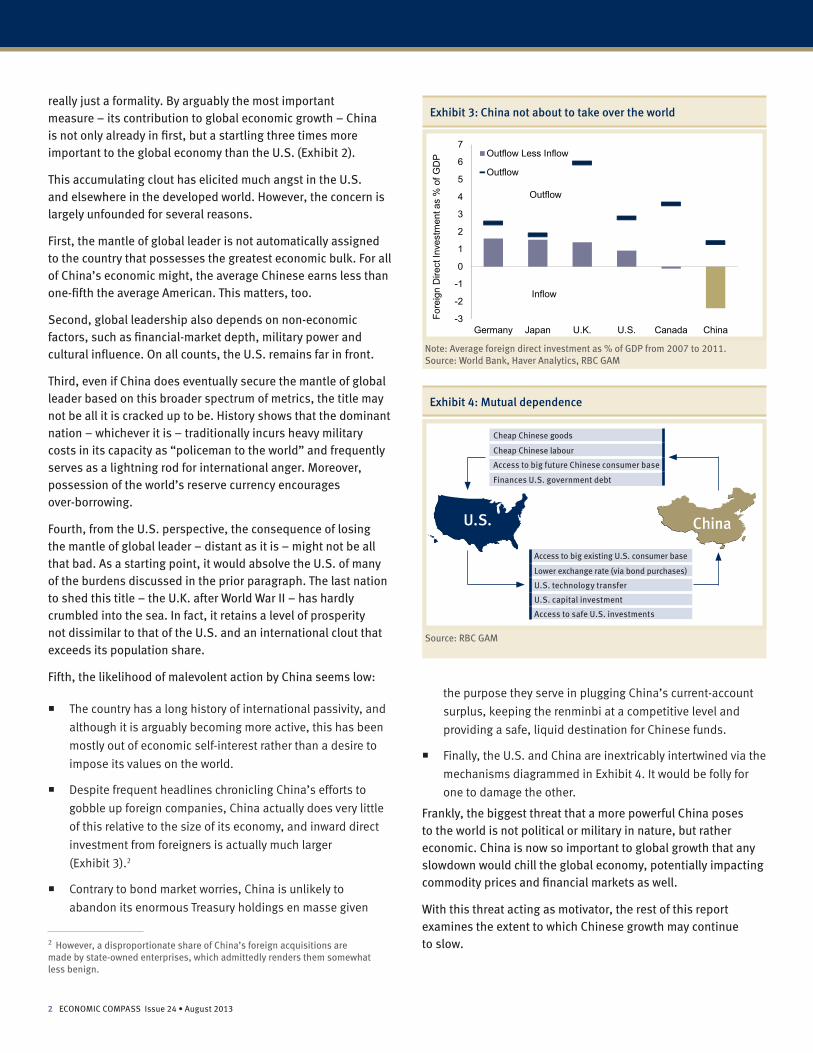
Historic drivers Brisk export growth Rapid credit growth Fading drivers Superior competitiveness Demographics Strong capital investment Steady drivers Urbanization Regulatory reform Convergence effect New drivers Consumption growth Threats Middle-income trap Note: GDP based upon PPP weights. Source: IMF, Haver Analytics, RBC GAM CHINA: GROWING PAINS FOR A GROWING POWER China’s economy has sparkled for three decades, rising from a bit player to a starring role on the global stage. This raises two sets of issues. First, how important has China now become to the world? Second, can China keep up its searing growth rate? The short answer to the first question is that China is already the world’s most important economy by some measures, though it lags substantially in its overall geopolitical clout. Worries of malevolent behaviour resulting from this newfound status are mostly unfounded. The real global risk is simply that China’s growth stumbles. With this in mind, we then investigate what enables China’s rapid economic growth (Exhibit 1). We reflect on the historic contributions of export growth and credit growth; on fading contributions from competitiveness, capital investment and demographics; on steady contributions from urbanization, the convergence effect and regulatory reform; on the threat posed by the looming middle-income trap; and on the opportunity presented by a growing consumer base. Weighing the cumulative effect of these diverse influences, China is unlikely to prove capable of replicating past heroics. To the contrary, a continued deceleration in economic growth is likely, to an annual rate of 4.5% to 7.5% per year over the next decade. China’s growing clout The Chinese economy is now the world’s second largest, contributing 15% of global output and plausibly on track to pass the U.S. by 2018. 1 But this eventual feather in China’s cap is 1 This calculation uses the purchasing power parity (PPP) exchange rate, which captures the relative volume of production in one country versus the other. The alternative – using the current exchange rate – would arrive at a somewhat smaller GDP figure. HIGHLIGHTS China’s economy has sparkled for three decades, rising from a bit player to the world’s most important growth engine. Alas, growth is now waning as prior export- and credit-driven eras end. Other key supports are also fading (though not entirely gone), including superior competitiveness and heavy capital investment. Fortunately, some important drivers remain unbowed, including the benefits of urbanization, economic convergence and regulatory reform. Economic rebalancing toward a consumer-led growth model is a promising future avenue. Altogether, the next decade should see materially reduced GDP growth in the range of 4.5% to 7.5% per year. Economic Compass Global Perspectives for Investors ISSUE 24 • AUGUST 2013 Exhibit 1: China’s economic drivers Exhibit 2: China is the new engine for global growth 0 4 8 12 16 20 24 28 32 1985 1988 1991 1994 1997 2000 2003 2006 2009 2012 Share of Global GDP Growth (%) China U.S. China now accounts for 31% of global growth Eric Lascelles Chief Economist RBC Global Asset Management Inc. Source: RBC GAM
Transcript of Economic Compass: China: Growing Pains for a Growing Power
Historic drivers � Brisk export growth � Rapid credit growth
Fading drivers � Superior competitiveness � Demographics
� Strong capital investment
Steady drivers � Urbanization � Regulatory reform
� Convergence effect
New drivers � Consumption growth
Threats � Middle-income trap
Note: GDP based upon PPP weights. Source: IMF, Haver Analytics, RBC GAM
CHINA: GROWING PAINS FOR A GROWING POWER
China’s economy has sparkled for three decades, rising from a bit player to a starring role on the global stage. This raises two sets of issues. First, how important has China now become to the world? Second, can China keep up its searing growth rate?
The short answer to the first question is that China is already the world’s most important economy by some measures, though it lags substantially in its overall geopolitical clout. Worries of malevolent behaviour resulting from this newfound status are mostly unfounded. The real global risk is simply that China’s growth stumbles.
With this in mind, we then investigate what enables China’s rapid economic growth (Exhibit 1). We reflect on the historic contributions of export growth and credit growth; on fading contributions from competitiveness, capital investment and demographics; on steady contributions from urbanization, the convergence effect and regulatory reform; on the threat posed by the looming middle-income trap; and on the opportunity presented by a growing consumer base.
Weighing the cumulative effect of these diverse influences, China is unlikely to prove capable of replicating past heroics. To the contrary, a continued deceleration in economic growth is likely, to an annual rate of 4.5% to 7.5% per year over the next decade.
China’s growing cloutThe Chinese economy is now the world’s second largest, contributing 15% of global output and plausibly on track to pass the U.S. by 2018.1 But this eventual feather in China’s cap is
1 This calculation uses the purchasing power parity (PPP) exchange rate, which captures the relative volume of production in one country versus the other. The alternative – using the current exchange rate – would arrive at a somewhat smaller GDP figure.
HIGHLIGHTS � China’s economy has sparkled for three decades, rising from a bit player to the world’s most important growth engine.
� Alas, growth is now waning as prior export- and credit-driven eras end. � Other key supports are also fading (though not entirely gone), including superior competitiveness and heavy capital investment.
� Fortunately, some important drivers remain unbowed, including the benefits of urbanization, economic convergence and regulatory reform. Economic rebalancing toward a consumer-led growth model is a promising future avenue.
� Altogether, the next decade should see materially reduced GDP growth in the range of 4.5% to 7.5% per year.
Economic Compass
Global Perspectives for Investors
ISSUE 24 • AUGUST 2013
Exhibit 1: China’s economic drivers
Exhibit 2: China is the new engine for global growth
0
4
8
12
16
20
24
28
32
1985 1988 1991 1994 1997 2000 2003 2006 2009 2012
Sha
re o
f Glo
bal G
DP
Gro
wth
(%)
ChinaU.S.
China now accounts for 31% of global growth
Eric Lascelles Chief EconomistRBC Global Asset Management Inc.
Source: RBC GAM
2 ECONOMIC COMPASS Issue 24 • August 2013
Note: Average foreign direct investment as % of GDP from 2007 to 2011.Source: World Bank, Haver Analytics, RBC GAM
Exhibit 4: Mutual dependence
Source: RBC GAM
-3
-2
-1
0
1
2
3
4
5
6
7
Germany Japan U.K. U.S. Canada China
Fore
ign
Dire
ct In
vest
men
t as
% o
f GD
P Outflow Less Inflow
Outflow
Inflow
Outflow
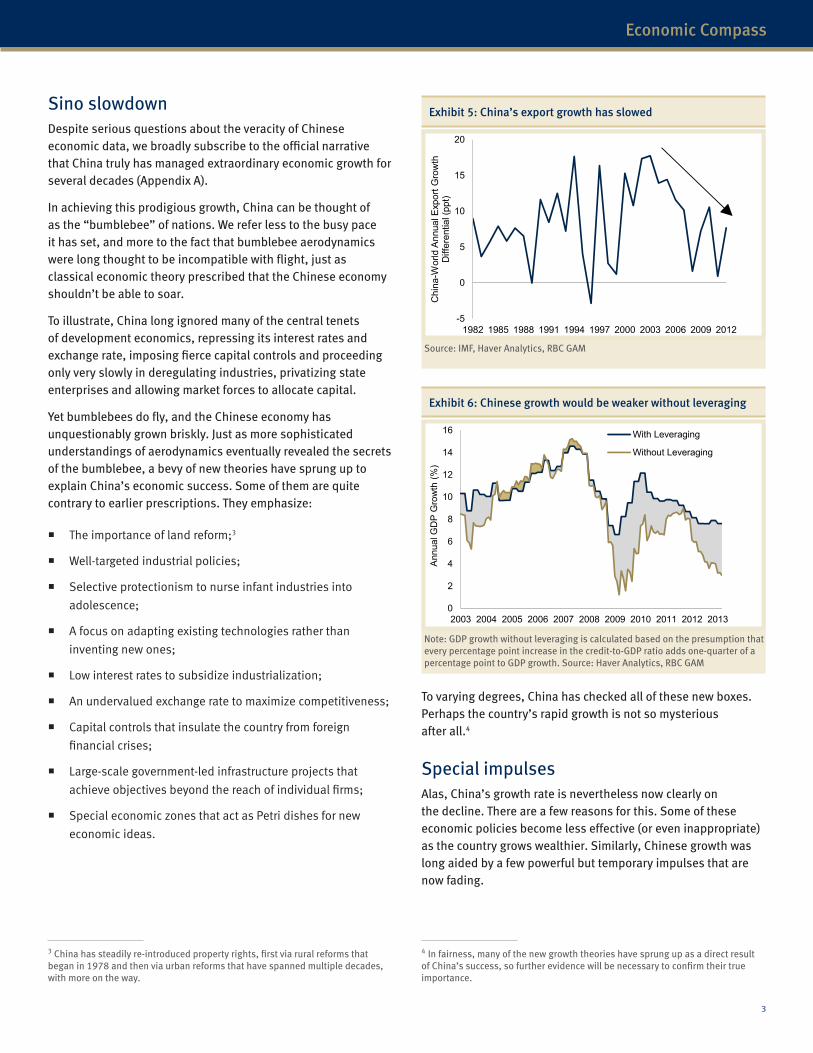
really just a formality. By arguably the most important measure – its contribution to global economic growth – China is not only already in first, but a startling three times more important to the global economy than the U.S. (Exhibit 2).
This accumulating clout has elicited much angst in the U.S. and elsewhere in the developed world. However, the concern is largely unfounded for several reasons.
First, the mantle of global leader is not automatically assigned to the country that possesses the greatest economic bulk. For all of China’s economic might, the average Chinese earns less than one-fifth the average American. This matters, too.
Second, global leadership also depends on non-economic factors, such as financial-market depth, military power and cultural influence. On all counts, the U.S. remains far in front.
Third, even if China does eventually secure the mantle of global leader based on this broader spectrum of metrics, the title may not be all it is cracked up to be. History shows that the dominant nation – whichever it is – traditionally incurs heavy military costs in its capacity as “policeman to the world” and frequently serves as a lightning rod for international anger. Moreover, possession of the world’s reserve currency encourages over-borrowing.
Fourth, from the U.S. perspective, the consequence of losing the mantle of global leader – distant as it is – might not be all that bad. As a starting point, it would absolve the U.S. of many of the burdens discussed in the prior paragraph. The last nation to shed this title – the U.K. after World War II – has hardly crumbled into the sea. In fact, it retains a level of prosperity not dissimilar to that of the U.S. and an international clout that exceeds its population share.
Fifth, the likelihood of malevolent action by China seems low:
� The country has a long history of international passivity, and
although it is arguably becoming more active, this has been
mostly out of economic self-interest rather than a desire to
impose its values on the world.
� Despite frequent headlines chronicling China’s efforts to
gobble up foreign companies, China actually does very little
of this relative to the size of its economy, and inward direct
investment from foreigners is actually much larger
(Exhibit 3).2
� Contrary to bond market worries, China is unlikely to
abandon its enormous Treasury holdings en masse given
2 However, a disproportionate share of China’s foreign acquisitions are made by state-owned enterprises, which admittedly renders them somewhat less benign.
Exhibit 3: China not about to take over the world
the purpose they serve in plugging China’s current-account
surplus, keeping the renminbi at a competitive level and
providing a safe, liquid destination for Chinese funds.
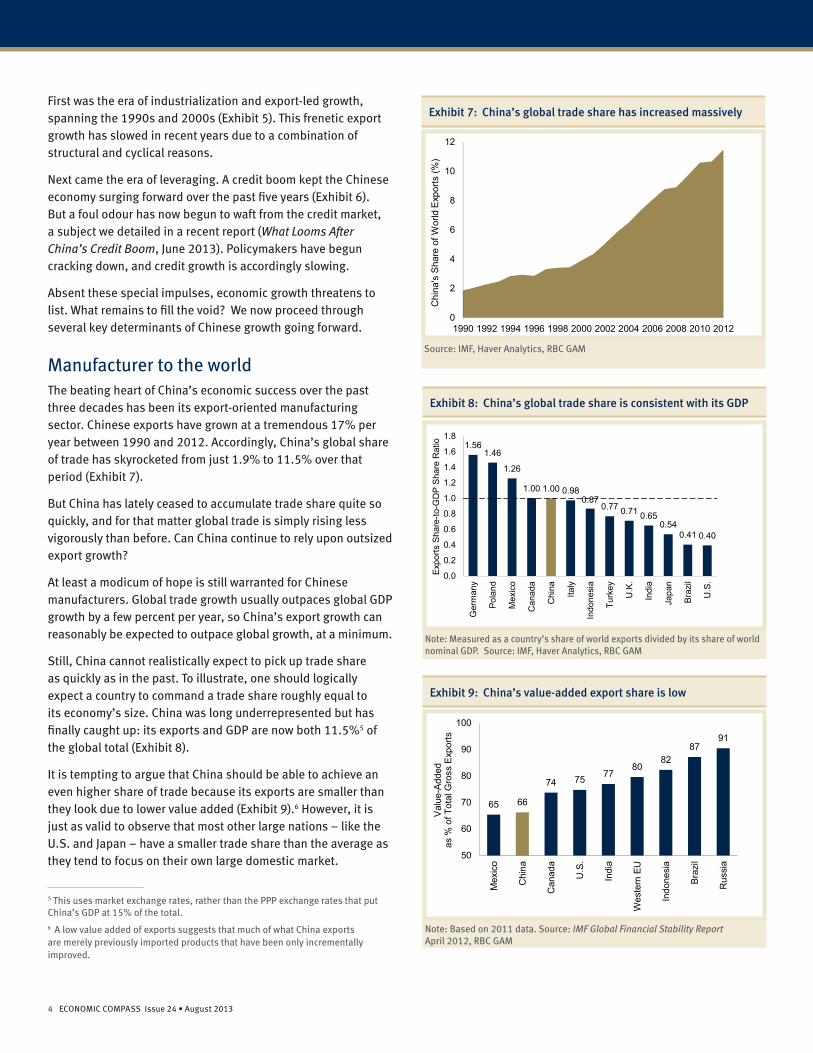
� Finally, the U.S. and China are inextricably intertwined via the
mechanisms diagrammed in Exhibit 4. It would be folly for
one to damage the other.
Frankly, the biggest threat that a more powerful China poses to the world is not political or military in nature, but rather economic. China is now so important to global growth that any slowdown would chill the global economy, potentially impacting commodity prices and financial markets as well.
With this threat acting as motivator, the rest of this report examines the extent to which Chinese growth may continue to slow.
Cheap Chinese goods
Cheap Chinese labour
Access to big future Chinese consumer base
Finances U.S. government debt
Access to big existing U.S. consumer base
Lower exchange rate (via bond purchases)
U.S. technology transfer
U.S. capital investment
Access to safe U.S. investments
U.S. China
3
Economic Compass
Note: GDP growth without leveraging is calculated based on the presumption that every percentage point increase in the credit-to-GDP ratio adds one-quarter of a percentage point to GDP growth. Source: Haver Analytics, RBC GAM
Sino slowdownDespite serious questions about the veracity of Chinese economic data, we broadly subscribe to the official narrative that China truly has managed extraordinary economic growth for several decades (Appendix A).
In achieving this prodigious growth, China can be thought of as the “bumblebee” of nations. We refer less to the busy pace it has set, and more to the fact that bumblebee aerodynamics were long thought to be incompatible with flight, just as classical economic theory prescribed that the Chinese economy shouldn’t be able to soar.
To illustrate, China long ignored many of the central tenets of development economics, repressing its interest rates and exchange rate, imposing fierce capital controls and proceeding only very slowly in deregulating industries, privatizing state enterprises and allowing market forces to allocate capital.
Yet bumblebees do fly, and the Chinese economy has unquestionably grown briskly. Just as more sophisticated understandings of aerodynamics eventually revealed the secrets of the bumblebee, a bevy of new theories have sprung up to explain China’s economic success. Some of them are quite contrary to earlier prescriptions. They emphasize:
� The importance of land reform;3
� Well-targeted industrial policies;
� Selective protectionism to nurse infant industries into
adolescence;
� A focus on adapting existing technologies rather than
inventing new ones;
� Low interest rates to subsidize industrialization;
� An undervalued exchange rate to maximize competitiveness;
� Capital controls that insulate the country from foreign
financial crises;
� Large-scale government-led infrastructure projects that
achieve objectives beyond the reach of individual firms;
� Special economic zones that act as Petri dishes for new
economic ideas.
3 China has steadily re-introduced property rights, first via rural reforms that began in 1978 and then via urban reforms that have spanned multiple decades, with more on the way.
-5
0
5
10
15
20
1982 1985 1988 1991 1994 1997 2000 2003 2006 2009 2012
Chi
na-W
orld
Ann
ual E
xpor
t Gro
wth
D
iffer
entia
l (pp
t)
Exhibit 5: China’s export growth has slowed
0
2
4
6
8
10
12
14
16
2003 2004 2005 2006 2007 2008 2009 2010 2011 2012 2013
Ann
ual G
DP
Gro
wth
(%)
With Leveraging
Without Leveraging
Exhibit 6: Chinese growth would be weaker without leveraging
Source: IMF, Haver Analytics, RBC GAM
To varying degrees, China has checked all of these new boxes. Perhaps the country’s rapid growth is not so mysterious after all.4
Special impulsesAlas, China’s growth rate is nevertheless now clearly on the decline. There are a few reasons for this. Some of these economic policies become less effective (or even inappropriate) as the country grows wealthier. Similarly, Chinese growth was long aided by a few powerful but temporary impulses that are now fading.
4 In fairness, many of the new growth theories have sprung up as a direct result of China’s success, so further evidence will be necessary to confirm their true importance.
4 ECONOMIC COMPASS Issue 24 • August 2013
Note: Measured as a country’s share of world exports divided by its share of world nominal GDP. Source: IMF, Haver Analytics, RBC GAM
Note: Based on 2011 data. Source: IMF Global Financial Stability Report April 2012, RBC GAM
Source: IMF, Haver Analytics, RBC GAM
Exhibit 9: China’s value-added export share is low
First was the era of industrialization and export-led growth, spanning the 1990s and 2000s (Exhibit 5). This frenetic export growth has slowed in recent years due to a combination of structural and cyclical reasons.
Next came the era of leveraging. A credit boom kept the Chinese economy surging forward over the past five years (Exhibit 6). But a foul odour has now begun to waft from the credit market, a subject we detailed in a recent report (What Looms After China’s Credit Boom, June 2013). Policymakers have begun cracking down, and credit growth is accordingly slowing.
Absent these special impulses, economic growth threatens to list. What remains to fill the void? We now proceed through several key determinants of Chinese growth going forward.
Manufacturer to the worldThe beating heart of China’s economic success over the past three decades has been its export-oriented manufacturing sector. Chinese exports have grown at a tremendous 17% per year between 1990 and 2012. Accordingly, China’s global share of trade has skyrocketed from just 1.9% to 11.5% over that period (Exhibit 7).
But China has lately ceased to accumulate trade share quite so quickly, and for that matter global trade is simply rising less vigorously than before. Can China continue to rely upon outsized export growth?
At least a modicum of hope is still warranted for Chinese manufacturers. Global trade growth usually outpaces global GDP growth by a few percent per year, so China’s export growth can reasonably be expected to outpace global growth, at a minimum.
Still, China cannot realistically expect to pick up trade share as quickly as in the past. To illustrate, one should logically expect a country to command a trade share roughly equal to its economy’s size. China was long underrepresented but has finally caught up: its exports and GDP are now both 11.5%5 of the global total (Exhibit 8).
It is tempting to argue that China should be able to achieve an even higher share of trade because its exports are smaller than they look due to lower value added (Exhibit 9).6 However, it is just as valid to observe that most other large nations – like the U.S. and Japan – have a smaller trade share than the average as they tend to focus on their own large domestic market.
5 This uses market exchange rates, rather than the PPP exchange rates that put China’s GDP at 15% of the total. 6 A low value added of exports suggests that much of what China exports are merely previously imported products that have been only incrementally improved.
65 66
74 75 7780
8287
91
50
60
70
80
90
100
Mex
ico
Chi
na
Can
ada
U.S
.
Indi
a
Wes
tern
EU
Indo
nesi
a
Braz
il
Rus
sia
Val
ue-A
dded
as
% o
f Tot
al G
ross
Exp
orts
0
2
4
6
8
10
12
1990 1992 1994 1996 1998 2000 2002 2004 2006 2008 2010 2012
Chi
na's
Sha
re o
f Wor
ld E
xpor
ts (%
)
Exhibit 7: China’s global trade share has increased massively
Exhibit 8: China’s global trade share is consistent with its GDP
1.561.46
1.26
1.00 1.00 0.980.87
0.77 0.71 0.650.54
0.41 0.40
0.0
0.2
0.4
0.6
0.8
1.0
1.2
1.4
1.6
1.8
Ger
man
y
Pola
nd
Mex
ico
Can
ada
Chi
na
Italy
Indo
nesi
a
Turk
ey
U.K
.
Indi
a
Japa
n
Braz
il
U.S
.
Expo
rts S
hare
-to-G
DP
Sha
re R
atio
5
Economic Compass
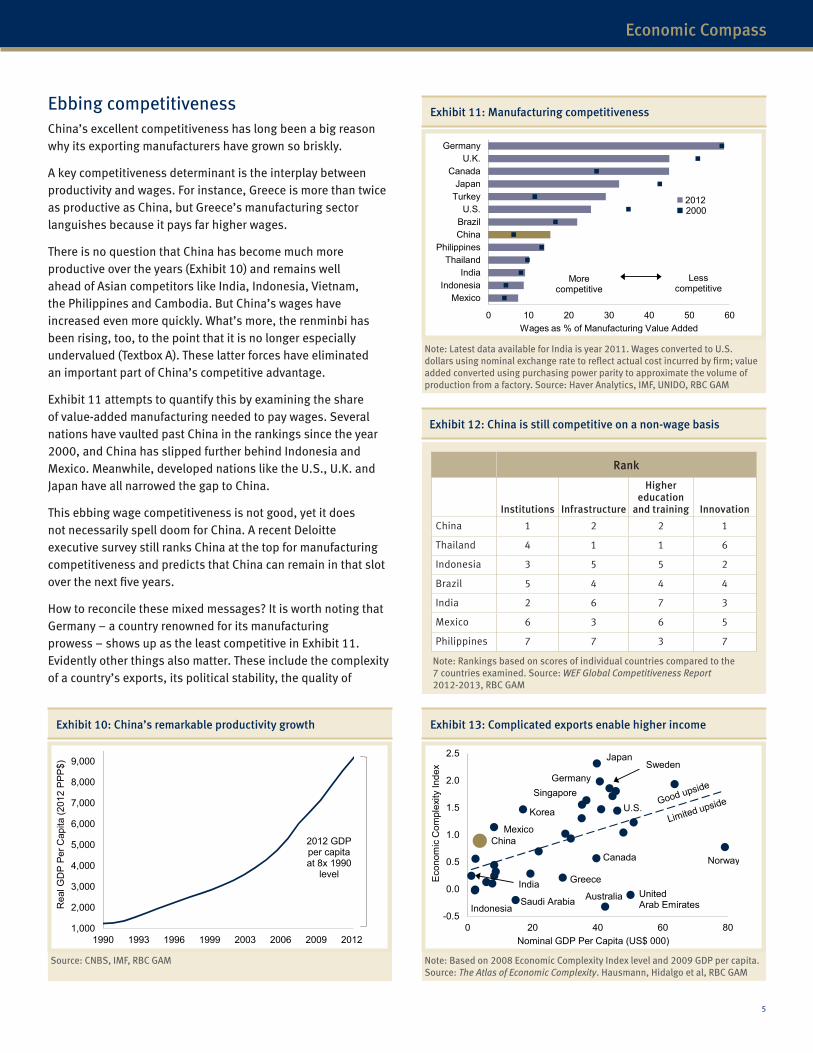
Note: Latest data available for India is year 2011. Wages converted to U.S. dollars using nominal exchange rate to reflect actual cost incurred by firm; value added converted using purchasing power parity to approximate the volume of production from a factory. Source: Haver Analytics, IMF, UNIDO, RBC GAM
Ebbing competitivenessChina’s excellent competitiveness has long been a big reason why its exporting manufacturers have grown so briskly.
A key competitiveness determinant is the interplay between productivity and wages. For instance, Greece is more than twice as productive as China, but Greece’s manufacturing sector languishes because it pays far higher wages.
There is no question that China has become much more productive over the years (Exhibit 10) and remains well ahead of Asian competitors like India, Indonesia, Vietnam, the Philippines and Cambodia. But China’s wages have increased even more quickly. What’s more, the renminbi has been rising, too, to the point that it is no longer especially undervalued (Textbox A). These latter forces have eliminated an important part of China’s competitive advantage.
Exhibit 11 attempts to quantify this by examining the share of value-added manufacturing needed to pay wages. Several nations have vaulted past China in the rankings since the year 2000, and China has slipped further behind Indonesia and Mexico. Meanwhile, developed nations like the U.S., U.K. and Japan have all narrowed the gap to China.
This ebbing wage competitiveness is not good, yet it does not necessarily spell doom for China. A recent Deloitte executive survey still ranks China at the top for manufacturing competitiveness and predicts that China can remain in that slot over the next five years.
How to reconcile these mixed messages? It is worth noting that Germany – a country renowned for its manufacturing prowess – shows up as the least competitive in Exhibit 11. Evidently other things also matter. These include the complexity of a country’s exports, its political stability, the quality of
1,000
2,000
3,000
4,000
5,000
6,000
7,000
8,000
9,000
1990 1993 1996 1999 2003 2006 2009 2012
Rea
l GD
P Pe
r Cap
ita (2
012
PPP
$)
2012 GDP per capita at 8x 1990
level
Exhibit 10: China’s remarkable productivity growth
Source: CNBS, IMF, RBC GAM
0 10 20 30 40 50 60
MexicoIndonesia
IndiaThailand
PhilippinesChinaBrazilU.S.
TurkeyJapan
CanadaU.K.
Germany
Wages as % of Manufacturing Value Added
More competitive
Lesscompetitive
2012 2000
Exhibit 11: Manufacturing competitiveness
Exhibit 12: China is still competitive on a non-wage basis
Rank
Institutions Infrastructure
Higher education
and training Innovation
China 1 2 2 1
Thailand 4 1 1 6
Indonesia 3 5 5 2
Brazil 5 4 4 4
India 2 6 7 3
Mexico 6 3 6 5
Philippines 7 7 3 7
Note: Rankings based on scores of individual countries compared to the 7 countries examined. Source: WEF Global Competitiveness Report 2012-2013, RBC GAM
Note: Based on 2008 Economic Complexity Index level and 2009 GDP per capita.Source: The Atlas of Economic Complexity. Hausmann, Hidalgo et al, RBC GAM
Singapore
China
India
Indonesia-0.5
0.0
0.5
1.0
1.5
2.0
2.5
0 20 40 60 80
Eco
nom
ic C
ompl
exity
Inde
x
Nominal GDP Per Capita (US$ 000)
Japan
GermanySweden
Norway
United Arab Emirates
Australia
Greece
Saudi Arabia
Mexico
Korea U.S.
Canada
Exhibit 13: Complicated exports enable higher income
6 ECONOMIC COMPASS Issue 24 • August 2013
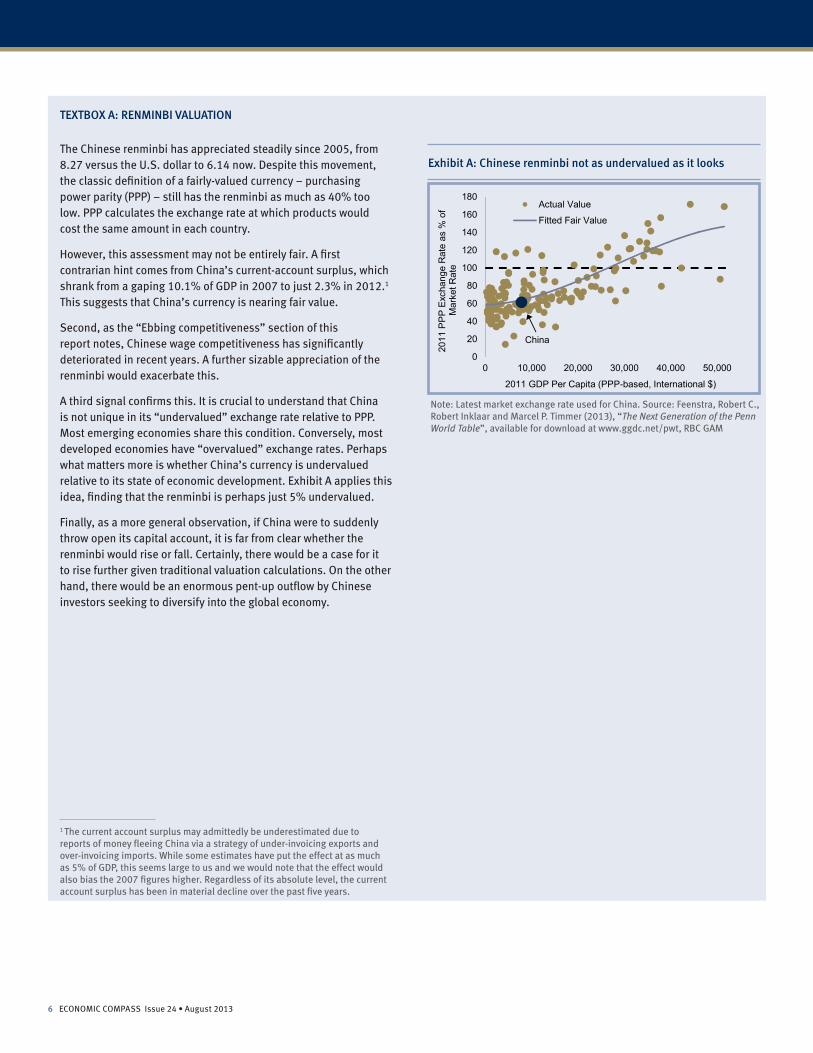
The Chinese renminbi has appreciated steadily since 2005, from 8.27 versus the U.S. dollar to 6.14 now. Despite this movement, the classic definition of a fairly-valued currency – purchasing power parity (PPP) – still has the renminbi as much as 40% too low. PPP calculates the exchange rate at which products would cost the same amount in each country.
However, this assessment may not be entirely fair. A first contrarian hint comes from China’s current-account surplus, which shrank from a gaping 10.1% of GDP in 2007 to just 2.3% in 2012.1 This suggests that China’s currency is nearing fair value.
Second, as the “Ebbing competitiveness” section of this report notes, Chinese wage competitiveness has significantly deteriorated in recent years. A further sizable appreciation of the renminbi would exacerbate this.
A third signal confirms this. It is crucial to understand that China is not unique in its “undervalued” exchange rate relative to PPP. Most emerging economies share this condition. Conversely, most developed economies have “overvalued” exchange rates. Perhaps what matters more is whether China’s currency is undervalued relative to its state of economic development. Exhibit A applies this idea, finding that the renminbi is perhaps just 5% undervalued.
Finally, as a more general observation, if China were to suddenly throw open its capital account, it is far from clear whether the renminbi would rise or fall. Certainly, there would be a case for it to rise further given traditional valuation calculations. On the other hand, there would be an enormous pent-up outflow by Chinese investors seeking to diversify into the global economy.
1 The current account surplus may admittedly be underestimated due to reports of money fleeing China via a strategy of under-invoicing exports and over-invoicing imports. While some estimates have put the effect at as much as 5% of GDP, this seems large to us and we would note that the effect would also bias the 2007 figures higher. Regardless of its absolute level, the current account surplus has been in material decline over the past five years.
TEXTBOX A: RENMINBI VALUATION
0
20
40
60
80
100
120
140
160
180
0 10,000 20,000 30,000 40,000 50,000
2011
PP
P E
xcha
nge
Rat
e as
% o
f M
arke
t Rat
e
2011 GDP Per Capita (PPP-based, International $)
Actual Value
Fitted Fair Value
China
Exhibit A: Chinese renminbi not as undervalued as it looks
Note: Latest market exchange rate used for China. Source: Feenstra, Robert C., Robert Inklaar and Marcel P. Timmer (2013), “The Next Generation of the Penn World Table”, available for download at www.ggdc.net/pwt, RBC GAM
7
Economic Compass
Source: China National Bureau of Statistics, Haver Analytics, RBC GAM
its public institutions, the state of public infrastructure, the pervasiveness of red tape, the level of innovation, the quality of education, the cost of capital, the cost of energy, clustering effects, economies of scale and the advantage of incumbency.
Several of these considerations redeem German competitiveness, and they also suggest that Chinese competitiveness is not as poor relative to its emerging-market peers as it first looks (Exhibit 12).
Let us run through the list. China has a high level of export complexity relative to its income level, suggesting a good diversity and quality of manufactured products (Exhibit 13).
China has also been politically stable for decades, has well regarded public institutions by emerging-market standards and – crucially – ample public infrastructure with good quality ports, highways, railways and utilities. Reflecting this, China fares quite well on the World Bank’s Logistics Performance Index, easily outpacing Brazil, India, Mexico and Indonesia.
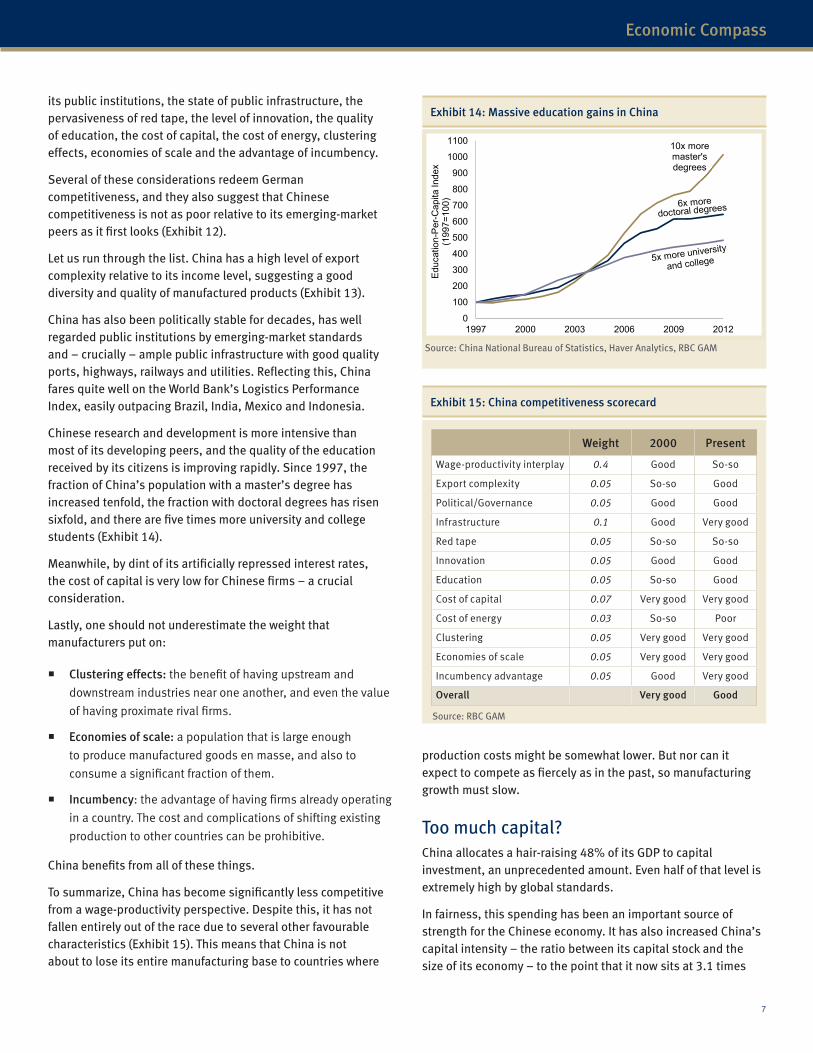
Chinese research and development is more intensive than most of its developing peers, and the quality of the education received by its citizens is improving rapidly. Since 1997, the fraction of China’s population with a master’s degree has increased tenfold, the fraction with doctoral degrees has risen sixfold, and there are five times more university and college students (Exhibit 14).
Meanwhile, by dint of its artificially repressed interest rates, the cost of capital is very low for Chinese firms – a crucial consideration.
Lastly, one should not underestimate the weight that manufacturers put on:
� Clustering effects: the benefit of having upstream and
downstream industries near one another, and even the value
of having proximate rival firms.
� Economies of scale: a population that is large enough
to produce manufactured goods en masse, and also to
consume a significant fraction of them.
� Incumbency: the advantage of having firms already operating
in a country. The cost and complications of shifting existing
production to other countries can be prohibitive.
China benefits from all of these things.
To summarize, China has become significantly less competitive from a wage-productivity perspective. Despite this, it has not fallen entirely out of the race due to several other favourable characteristics (Exhibit 15). This means that China is not about to lose its entire manufacturing base to countries where
0
100
200
300
400
500
600
700
800
900
1000
1100
1997 2000 2003 2006 2009 2012
Educ
atio
n-P
er-C
apita
Inde
x (1
997=
100)
10x more master's degrees
Exhibit 14: Massive education gains in China
Exhibit 15: China competitiveness scorecard
Weight 2000 Present
Wage-productivity interplay 0.4 Good So-so
Export complexity 0.05 So-so Good
Political/Governance 0.05 Good Good
Infrastructure 0.1 Good Very good
Red tape 0.05 So-so So-so
Innovation 0.05 Good Good
Education 0.05 So-so Good
Cost of capital 0.07 Very good Very good
Cost of energy 0.03 So-so Poor
Clustering 0.05 Very good Very good
Economies of scale 0.05 Very good Very good
Incumbency advantage 0.05 Good Very good
Overall Very good Good
Source: RBC GAM
production costs might be somewhat lower. But nor can it expect to compete as fiercely as in the past, so manufacturing growth must slow.
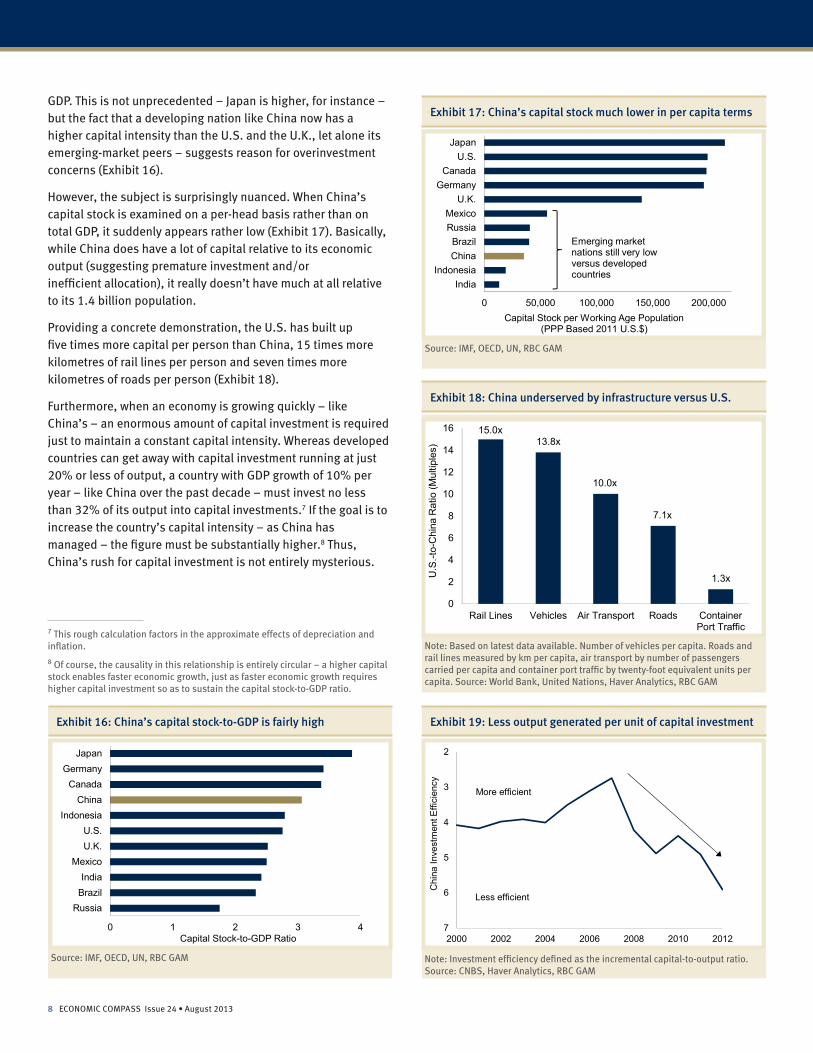
Too much capital?China allocates a hair-raising 48% of its GDP to capital investment, an unprecedented amount. Even half of that level is extremely high by global standards.
In fairness, this spending has been an important source of strength for the Chinese economy. It has also increased China’s capital intensity – the ratio between its capital stock and the size of its economy – to the point that it now sits at 3.1 times
8 ECONOMIC COMPASS Issue 24 • August 2013
Note: Based on latest data available. Number of vehicles per capita. Roads and rail lines measured by km per capita, air transport by number of passengers carried per capita and container port traffic by twenty-foot equivalent units per capita. Source: World Bank, United Nations, Haver Analytics, RBC GAM
Source: IMF, OECD, UN, RBC GAM
GDP. This is not unprecedented – Japan is higher, for instance – but the fact that a developing nation like China now has a higher capital intensity than the U.S. and the U.K., let alone its emerging-market peers – suggests reason for overinvestment concerns (Exhibit 16).
However, the subject is surprisingly nuanced. When China’s capital stock is examined on a per-head basis rather than on total GDP, it suddenly appears rather low (Exhibit 17). Basically, while China does have a lot of capital relative to its economic output (suggesting premature investment and/or inefficient allocation), it really doesn’t have much at all relative to its 1.4 billion population.
Providing a concrete demonstration, the U.S. has built up five times more capital per person than China, 15 times more kilometres of rail lines per person and seven times more kilometres of roads per person (Exhibit 18).
Furthermore, when an economy is growing quickly – like China’s – an enormous amount of capital investment is required just to maintain a constant capital intensity. Whereas developed countries can get away with capital investment running at just 20% or less of output, a country with GDP growth of 10% per year – like China over the past decade – must invest no less than 32% of its output into capital investments.7 If the goal is to increase the country’s capital intensity – as China has managed – the figure must be substantially higher.8 Thus, China’s rush for capital investment is not entirely mysterious.
7 This rough calculation factors in the approximate effects of depreciation and inflation.
8 Of course, the causality in this relationship is entirely circular – a higher capital stock enables faster economic growth, just as faster economic growth requires higher capital investment so as to sustain the capital stock-to-GDP ratio.
0 1 2 3 4
JapanGermany
CanadaChina
IndonesiaU.S.U.K.
MexicoIndia
BrazilRussia
Capital Stock-to-GDP Ratio
Exhibit 16: China’s capital stock-to-GDP is fairly high
0 50,000 100,000 150,000 200,000
JapanU.S.
CanadaGermany
U.K.MexicoRussiaBrazilChina
IndonesiaIndia
Capital Stock per Working Age Population(PPP Based 2011 U.S.$)
Emerging marketnations still very low versus developed countries
Exhibit 17: China’s capital stock much lower in per capita terms
Source: IMF, OECD, UN, RBC GAM
15.0x13.8x
10.0x
7.1x
1.3x
0
2
4
6
8
10
12
14
16
Rail Lines Vehicles Air Transport Roads ContainerPort Traffic
U.S
.-to-
Chi
na R
atio
(Mul
tiple
s)
Exhibit 18: China underserved by infrastructure versus U.S.
2
3
4
5
6
72000 2002 2004 2006 2008 2010 2012
Chi
na In
vest
men
t Effi
cien
cy
More efficient
Less efficient
Exhibit 19: Less output generated per unit of capital investment
Source: IMF, OECD, UN, RBC GAM Note: Investment efficiency defined as the incremental capital-to-output ratio.Source: CNBS, Haver Analytics, RBC GAM
9
Economic Compass
450
550
650
750
850
950
1050
1975 1982 1989 1996 2003 2010 2017 2024 2031 2038
Wor
king
Age
Pop
ulat
ion
(Mill
ions
)
UN Forecast
Peak
Exhibit 20: China’s working age population peaks in 2015
Source: United Nations, RBC GAM
-21.0-20.1-16.6
-8.7
2.75.97.7
10.5
24.429.0
-25
-15
-5
5
15
25
35
Ger
man
y
Japa
n
Rus
sia
Chi
na
U.K
.
Can
ada
U.S
.
Braz
il
Mex
ico
Indi
a
Pro
ject
ed W
orki
ng A
ge P
opul
atio
n G
row
th 2
013
-203
8 (%
)
Exhibit 21: China’s shrinking labour force
Source: United Nations, RBC GAM
0
20
40
60
80
100
420 4,200 42,000
Urb
an P
opul
atio
n (%
of T
otal
)
GDP Per Capita (PPP-based, 2012 International $)
China 1990
China 2000
China 2012
90,000
Exhibit 22: Urbanization driving growth in China
Note: Based on 2012 data for 167 countries. GDP per capita in log scale.Source: OECD, World Bank, Haver Analytics, RBC GAM
This helps to explain China’s focus on capital investment, but it doesn’t get around the fact that China has probably still overinvested. It is clear that China’s investment efficiency has declined markedly in recent years as the state struggles to find productive uses for its investments (Exhibit 19). Stories of ghost towns and empty shopping malls provide extreme examples of this malinvestment.
Meanwhile, as decelerating credit growth slows the economy, there will be fewer sources of capital and also less need for it. In short, capital investment represents another tailwind that is ceasing to blow quite so strongly.
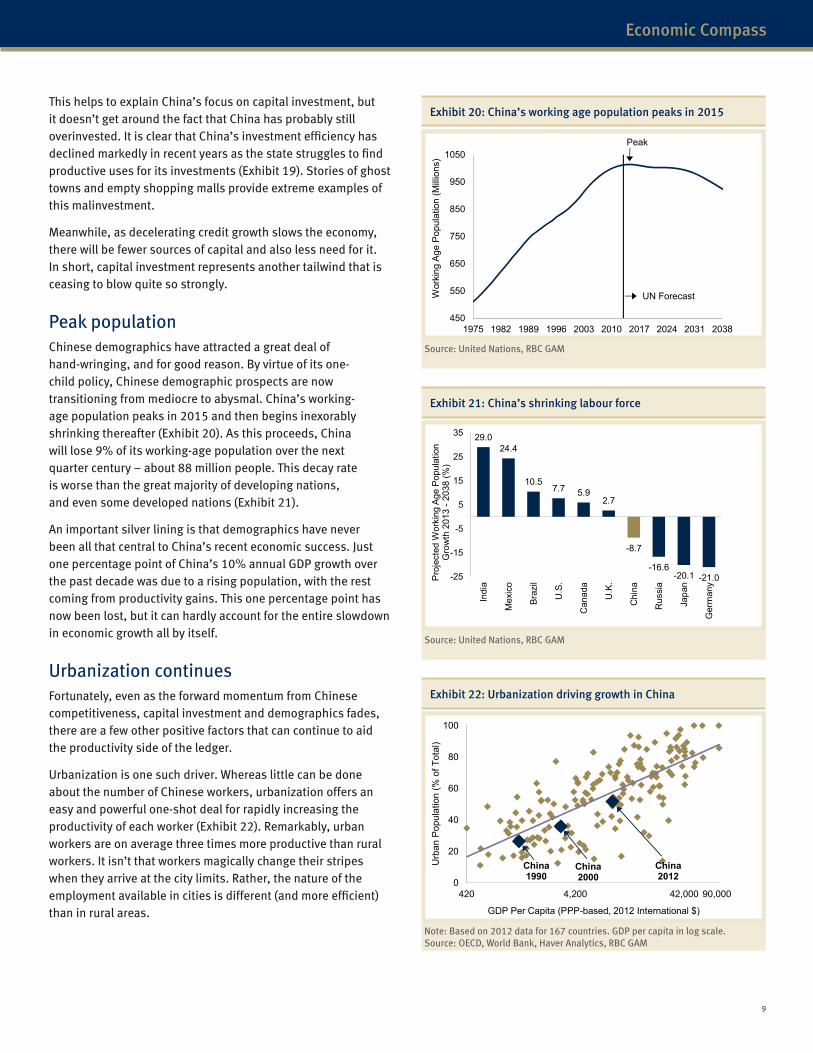
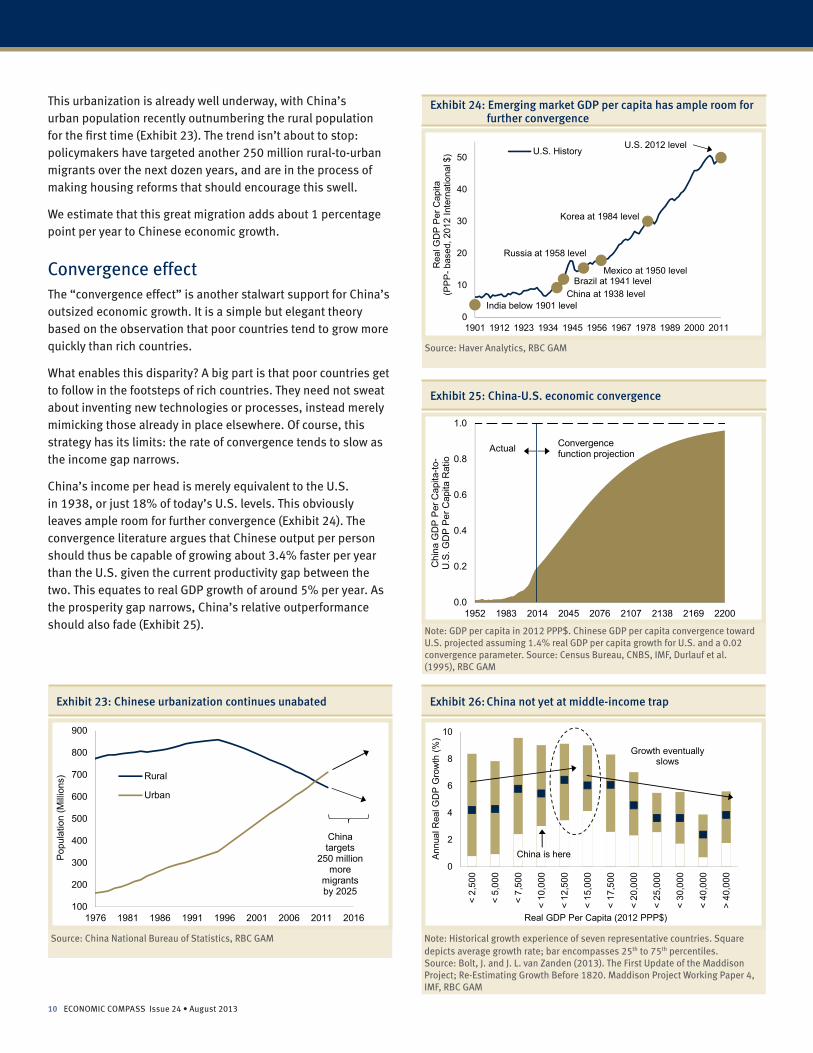
Peak populationChinese demographics have attracted a great deal of hand-wringing, and for good reason. By virtue of its one-child policy, Chinese demographic prospects are now transitioning from mediocre to abysmal. China’s working-age population peaks in 2015 and then begins inexorably shrinking thereafter (Exhibit 20). As this proceeds, China will lose 9% of its working-age population over the next quarter century – about 88 million people. This decay rate is worse than the great majority of developing nations, and even some developed nations (Exhibit 21).
An important silver lining is that demographics have never been all that central to China’s recent economic success. Just one percentage point of China’s 10% annual GDP growth over the past decade was due to a rising population, with the rest coming from productivity gains. This one percentage point has now been lost, but it can hardly account for the entire slowdown in economic growth all by itself.
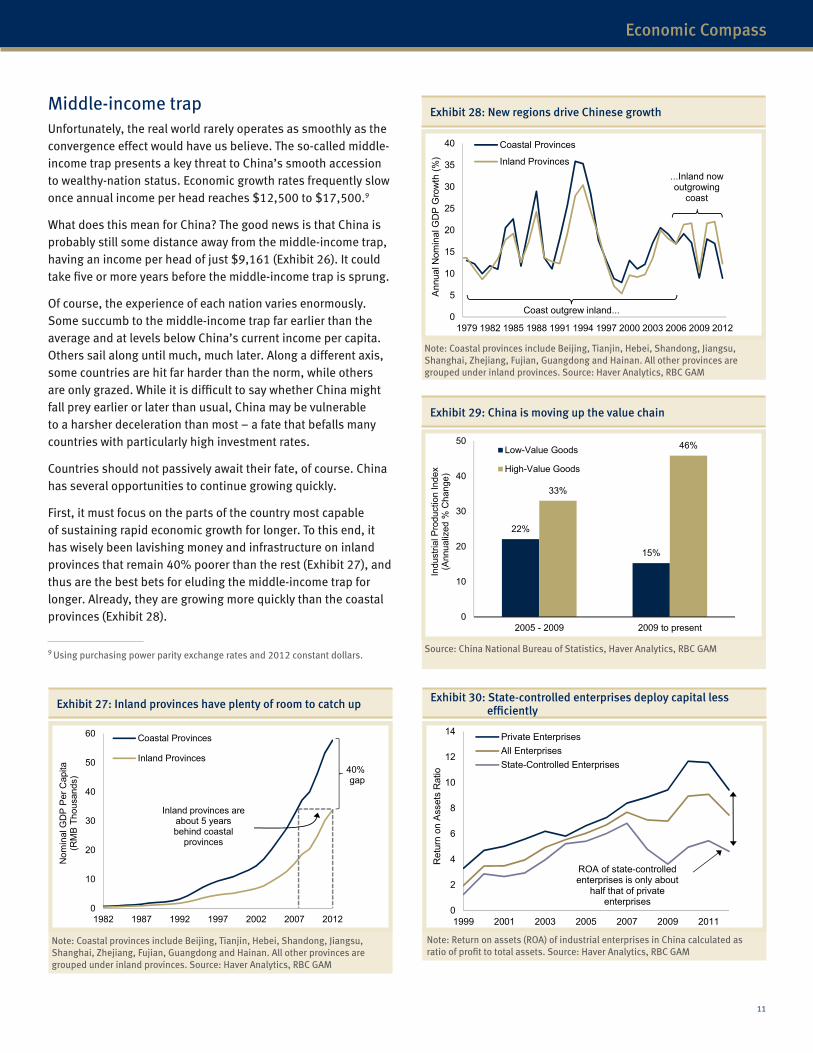
Urbanization continuesFortunately, even as the forward momentum from Chinese competitiveness, capital investment and demographics fades, there are a few other positive factors that can continue to aid the productivity side of the ledger.
Urbanization is one such driver. Whereas little can be done about the number of Chinese workers, urbanization offers an easy and powerful one-shot deal for rapidly increasing the productivity of each worker (Exhibit 22). Remarkably, urban workers are on average three times more productive than rural workers. It isn’t that workers magically change their stripes when they arrive at the city limits. Rather, the nature of the employment available in cities is different (and more efficient) than in rural areas.
10 ECONOMIC COMPASS Issue 24 • August 2013
Note: Historical growth experience of seven representative countries. Square depicts average growth rate; bar encompasses 25th to 75th percentiles. Source: Bolt, J. and J. L. van Zanden (2013). The First Update of the Maddison Project; Re-Estimating Growth Before 1820. Maddison Project Working Paper 4, IMF, RBC GAM
Source: Haver Analytics, RBC GAM
Note: GDP per capita in 2012 PPP$. Chinese GDP per capita convergence toward U.S. projected assuming 1.4% real GDP per capita growth for U.S. and a 0.02 convergence parameter. Source: Census Bureau, CNBS, IMF, Durlauf et al. (1995), RBC GAM
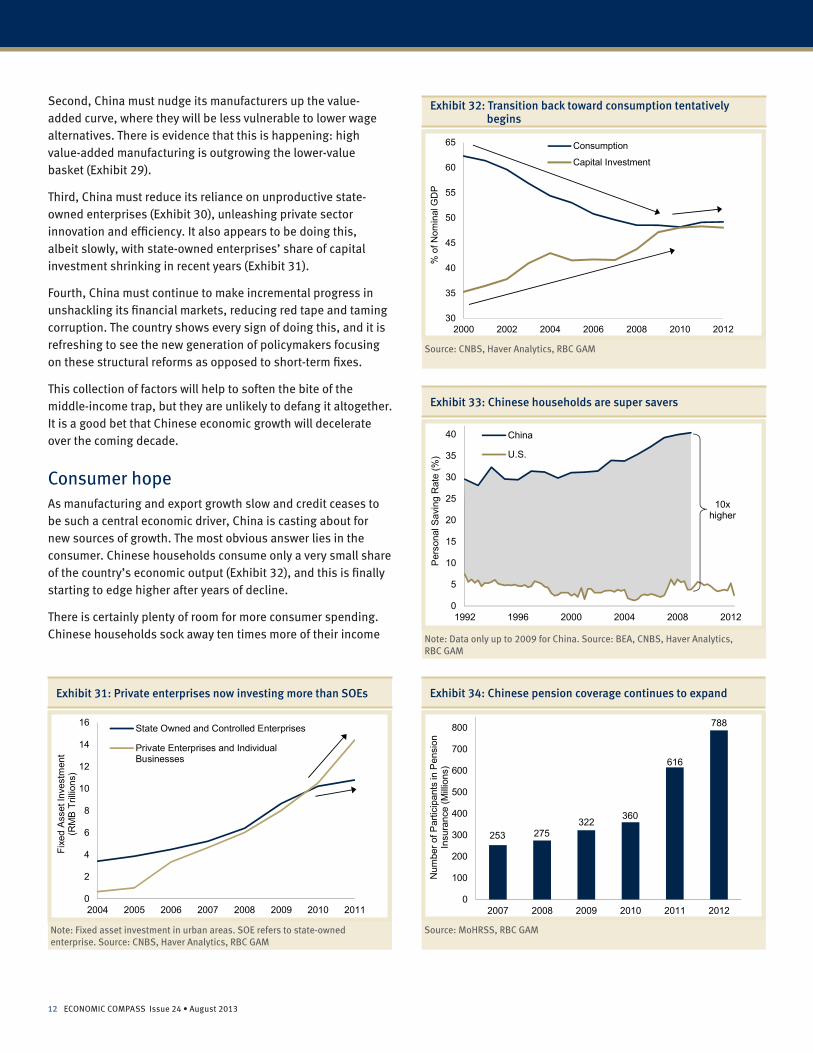
This urbanization is already well underway, with China’s urban population recently outnumbering the rural population for the first time (Exhibit 23). The trend isn’t about to stop: policymakers have targeted another 250 million rural-to-urban migrants over the next dozen years, and are in the process of making housing reforms that should encourage this swell.
We estimate that this great migration adds about 1 percentage point per year to Chinese economic growth.
Convergence effectThe “convergence effect” is another stalwart support for China’s outsized economic growth. It is a simple but elegant theory based on the observation that poor countries tend to grow more quickly than rich countries.
What enables this disparity? A big part is that poor countries get to follow in the footsteps of rich countries. They need not sweat about inventing new technologies or processes, instead merely mimicking those already in place elsewhere. Of course, this strategy has its limits: the rate of convergence tends to slow as the income gap narrows.
China’s income per head is merely equivalent to the U.S. in 1938, or just 18% of today’s U.S. levels. This obviously leaves ample room for further convergence (Exhibit 24). The convergence literature argues that Chinese output per person should thus be capable of growing about 3.4% faster per year than the U.S. given the current productivity gap between the two. This equates to real GDP growth of around 5% per year. As the prosperity gap narrows, China’s relative outperformance should also fade (Exhibit 25).
100
200
300
400
500
600
700
800
900
1976 1981 1986 1991 1996 2001 2006 2011 2016
Popu
latio
n (M
illio
ns) Rural
Urban
China targets
250 million more
migrants by 2025
Exhibit 23: Chinese urbanization continues unabated
Source: China National Bureau of Statistics, RBC GAM
0
10
20
30
40
50
1901 1912 1923 1934 1945 1956 1967 1978 1989 2000 2011
Rea
l GD
P Pe
r Cap
ita(P
PP-b
ased
, 201
2 In
tern
atio
nal $
) U.S. History
India below 1901 level
Korea at 1984 level
Russia at 1958 level
Mexico at 1950 levelBrazil at 1941 level
China at 1938 level
U.S. 2012 level
Exhibit 24: Emerging market GDP per capita has ample room for further convergence
0.0
0.2
0.4
0.6
0.8
1.0
1952 1983 2014 2045 2076 2107 2138 2169 2200
Chi
na G
DP
Per
Cap
ita-to
-U
.S. G
DP
Per
Cap
ita R
atio
Actual Convergence function projection
Exhibit 25: China-U.S. economic convergence
0
2
4
6
8
10
< 2,
500
< 5,
000
< 7,
500
< 10
,000
< 12
,500
< 15
,000
< 17
,500
< 20
,000
< 25
,000
< 30
,000
< 40
,000
> 40
,000
Ann
ual R
eal G
DP
Gro
wth
(%)
Real GDP Per Capita (2012 PPP$)
China is here
Growth eventually slows
Exhibit 26: China not yet at middle-income trap
Source: Haver Analytics, RBC GAM
11
Economic Compass
Note: Coastal provinces include Beijing, Tianjin, Hebei, Shandong, Jiangsu, Shanghai, Zhejiang, Fujian, Guangdong and Hainan. All other provinces are grouped under inland provinces. Source: Haver Analytics, RBC GAM
Middle-income trapUnfortunately, the real world rarely operates as smoothly as the convergence effect would have us believe. The so-called middle-income trap presents a key threat to China’s smooth accession to wealthy-nation status. Economic growth rates frequently slow once annual income per head reaches $12,500 to $17,500.9
What does this mean for China? The good news is that China is probably still some distance away from the middle-income trap, having an income per head of just $9,161 (Exhibit 26). It could take five or more years before the middle-income trap is sprung.
Of course, the experience of each nation varies enormously. Some succumb to the middle-income trap far earlier than the average and at levels below China’s current income per capita. Others sail along until much, much later. Along a different axis, some countries are hit far harder than the norm, while others are only grazed. While it is difficult to say whether China might fall prey earlier or later than usual, China may be vulnerable to a harsher deceleration than most – a fate that befalls many countries with particularly high investment rates.
Countries should not passively await their fate, of course. China has several opportunities to continue growing quickly.
First, it must focus on the parts of the country most capable of sustaining rapid economic growth for longer. To this end, it has wisely been lavishing money and infrastructure on inland provinces that remain 40% poorer than the rest (Exhibit 27), and thus are the best bets for eluding the middle-income trap for longer. Already, they are growing more quickly than the coastal provinces (Exhibit 28).
9 Using purchasing power parity exchange rates and 2012 constant dollars.
0
10
20
30
40
50
60
1982 1987 1992 1997 2002 2007 2012
Nom
inal
GD
P Pe
r Cap
ita(R
MB
Tho
usan
ds)
Coastal Provinces
Inland Provinces
Inland provinces are about 5 years behind coastal
provinces
40% gap
Exhibit 27: Inland provinces have plenty of room to catch up
0
5
10
15
20
25
30
35
40
1979 1982 1985 1988 1991 1994 1997 2000 2003 2006 2009 2012
Ann
ual N
omin
al G
DP
Gro
wth
(%)
Coastal Provinces
Inland Provinces...Inland now outgrowing
coast
Coast outgrew inland...
Exhibit 28: New regions drive Chinese growth
22%
15%
33%
46%
0
10
20
30
40
50
2005 - 2009 2009 to present
Indu
stria
l Pro
duct
ion
Inde
x(A
nnua
lized
% C
hang
e)Low-Value Goods
High-Value Goods
Exhibit 29: China is moving up the value chain
Source: China National Bureau of Statistics, Haver Analytics, RBC GAM
Note: Coastal provinces include Beijing, Tianjin, Hebei, Shandong, Jiangsu, Shanghai, Zhejiang, Fujian, Guangdong and Hainan. All other provinces are grouped under inland provinces. Source: Haver Analytics, RBC GAM
0
2
4
6
8
10
12
14
1999 2001 2003 2005 2007 2009 2011
Ret
urn
on A
sset
s R
atio
Private EnterprisesAll EnterprisesState-Controlled Enterprises
ROA of state-controlledenterprises is only about
half that of private enterprises
Exhibit 30: State-controlled enterprises deploy capital less efficiently
Note: Return on assets (ROA) of industrial enterprises in China calculated as ratio of profit to total assets. Source: Haver Analytics, RBC GAM
12 ECONOMIC COMPASS Issue 24 • August 2013
Second, China must nudge its manufacturers up the value-added curve, where they will be less vulnerable to lower wage alternatives. There is evidence that this is happening: high value-added manufacturing is outgrowing the lower-value basket (Exhibit 29).
Third, China must reduce its reliance on unproductive state-owned enterprises (Exhibit 30), unleashing private sector innovation and efficiency. It also appears to be doing this, albeit slowly, with state-owned enterprises’ share of capital investment shrinking in recent years (Exhibit 31).
Fourth, China must continue to make incremental progress in unshackling its financial markets, reducing red tape and taming corruption. The country shows every sign of doing this, and it is refreshing to see the new generation of policymakers focusing on these structural reforms as opposed to short-term fixes.
This collection of factors will help to soften the bite of the middle-income trap, but they are unlikely to defang it altogether. It is a good bet that Chinese economic growth will decelerate over the coming decade.
Consumer hopeAs manufacturing and export growth slow and credit ceases to be such a central economic driver, China is casting about for new sources of growth. The most obvious answer lies in the consumer. Chinese households consume only a very small share of the country’s economic output (Exhibit 32), and this is finally starting to edge higher after years of decline.
There is certainly plenty of room for more consumer spending. Chinese households sock away ten times more of their income
0
2
4
6
8
10
12
14
16
2004 2005 2006 2007 2008 2009 2010 2011
Fixe
d A
sset
Inve
stm
ent
(RM
B T
rillio
ns)
State Owned and Controlled Enterprises
Private Enterprises and IndividualBusinesses
Exhibit 31: Private enterprises now investing more than SOEs
Note: Fixed asset investment in urban areas. SOE refers to state-owned enterprise. Source: CNBS, Haver Analytics, RBC GAM
30
35
40
45
50
55
60
65
2000 2002 2004 2006 2008 2010 2012
% o
f Nom
inal
GD
P
Consumption
Capital Investment
Exhibit 32: Transition back toward consumption tentatively begins
Source: CNBS, Haver Analytics, RBC GAM
0
5
10
15
20
25
30
35
40
1992 1996 2000 2004 2008 2012
Per
sona
l Sav
ing
Rat
e (%
)China
U.S.
10x higher
Exhibit 33: Chinese households are super savers
Note: Data only up to 2009 for China. Source: BEA, CNBS, Haver Analytics, RBC GAM
Source: MoHRSS, RBC GAM
253 275322
360
616
788
0
100
200
300
400
500
600
700
800
2007 2008 2009 2010 2011 2012
Num
ber o
f Par
ticip
ants
in P
ensi
on
Insu
ranc
e (M
illio
ns)
Exhibit 34: Chinese pension coverage continues to expand
13
Economic Compass
than do American consumers (Exhibit 33). This excessive saving has proved enduring so far, but we see several catalysts for a coming change.
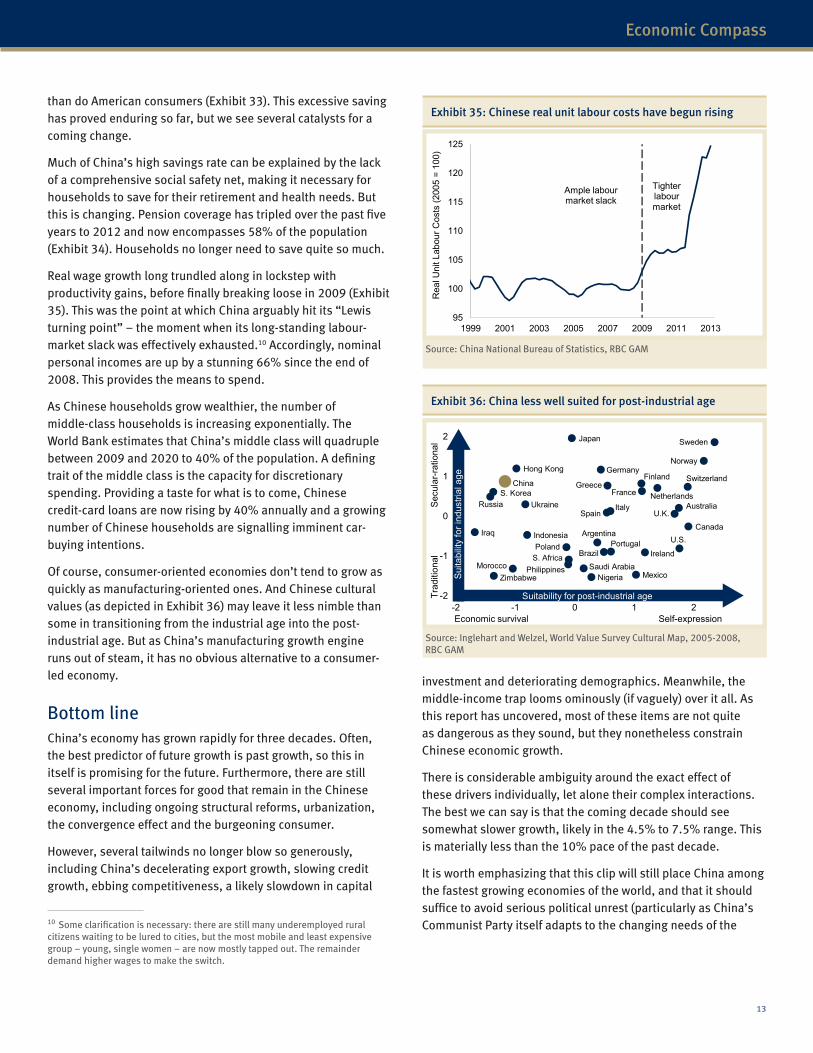
Much of China’s high savings rate can be explained by the lack of a comprehensive social safety net, making it necessary for households to save for their retirement and health needs. But this is changing. Pension coverage has tripled over the past five years to 2012 and now encompasses 58% of the population (Exhibit 34). Households no longer need to save quite so much.
Real wage growth long trundled along in lockstep with productivity gains, before finally breaking loose in 2009 (Exhibit 35). This was the point at which China arguably hit its “Lewis turning point” – the moment when its long-standing labour-market slack was effectively exhausted.10 Accordingly, nominal personal incomes are up by a stunning 66% since the end of 2008. This provides the means to spend.
As Chinese households grow wealthier, the number of middle-class households is increasing exponentially. The World Bank estimates that China’s middle class will quadruple between 2009 and 2020 to 40% of the population. A defining trait of the middle class is the capacity for discretionary spending. Providing a taste for what is to come, Chinese credit-card loans are now rising by 40% annually and a growing number of Chinese households are signalling imminent car-buying intentions.
Of course, consumer-oriented economies don’t tend to grow as quickly as manufacturing-oriented ones. And Chinese cultural values (as depicted in Exhibit 36) may leave it less nimble than some in transitioning from the industrial age into the post-industrial age. But as China’s manufacturing growth engine runs out of steam, it has no obvious alternative to a consumer-led economy.
Bottom lineChina’s economy has grown rapidly for three decades. Often, the best predictor of future growth is past growth, so this in itself is promising for the future. Furthermore, there are still several important forces for good that remain in the Chinese economy, including ongoing structural reforms, urbanization, the convergence effect and the burgeoning consumer.
However, several tailwinds no longer blow so generously, including China’s decelerating export growth, slowing credit growth, ebbing competitiveness, a likely slowdown in capital
10 Some clarification is necessary: there are still many underemployed rural citizens waiting to be lured to cities, but the most mobile and least expensive group – young, single women – are now mostly tapped out. The remainder demand higher wages to make the switch.
95
100
105
110
115
120
125
1999 2001 2003 2005 2007 2009 2011 2013
Rea
l Uni
t Lab
our C
osts
(200
5 =
100)
Ample labour market slack
Tighter labour market
Exhibit 35: Chinese real unit labour costs have begun rising
Source: China National Bureau of Statistics, RBC GAM
Argentina
Australia
Brazil
U.K.
Canada
ChinaFinland
FranceGreece
Hong Kong
IndonesiaIraq
Ireland
Italy
Japan
MexicoMorocco
Netherlands
Nigeria
Norway
Philippines
Poland Portugal
Russia
S. Africa
S. Korea
Saudi Arabia
Spain
Sweden
Switzerland
Ukraine
U.S.
Germany
Zimbabwe
-2
-1
0
1
2
-2 -1 0 1 2Economic survival
Secu
lar-r
atio
nal
Trad
ition
al
Suita
bilit
y fo
r ind
ustri
al a
ge
Suitability for post-industrial age
Self-expression
Exhibit 36: China less well suited for post-industrial age
Source: Inglehart and Welzel, World Value Survey Cultural Map, 2005-2008, RBC GAM
investment and deteriorating demographics. Meanwhile, the middle-income trap looms ominously (if vaguely) over it all. As this report has uncovered, most of these items are not quite as dangerous as they sound, but they nonetheless constrain Chinese economic growth.
There is considerable ambiguity around the exact effect of these drivers individually, let alone their complex interactions. The best we can say is that the coming decade should see somewhat slower growth, likely in the 4.5% to 7.5% range. This is materially less than the 10% pace of the past decade.
It is worth emphasizing that this clip will still place China among the fastest growing economies of the world, and that it should suffice to avoid serious political unrest (particularly as China’s Communist Party itself adapts to the changing needs of the
14 ECONOMIC COMPASS Issue 24 • August 2013
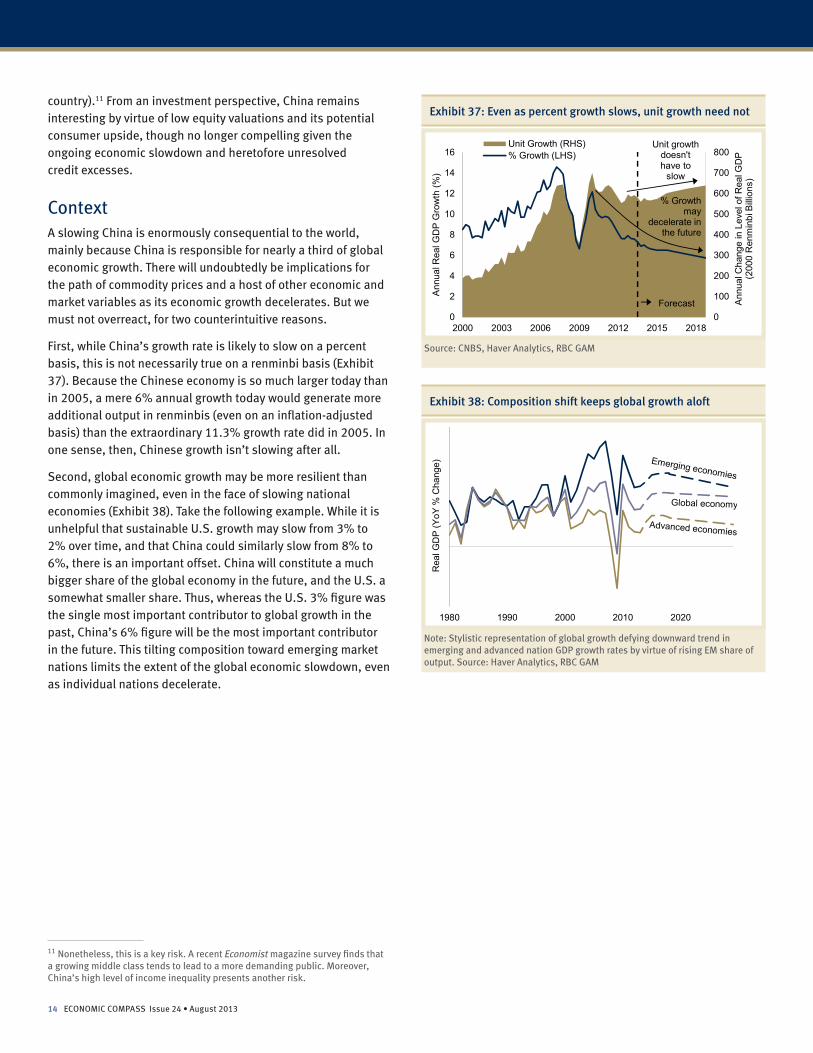
Note: Stylistic representation of global growth defying downward trend in emerging and advanced nation GDP growth rates by virtue of rising EM share of output. Source: Haver Analytics, RBC GAM
country).11 From an investment perspective, China remains interesting by virtue of low equity valuations and its potential consumer upside, though no longer compelling given the ongoing economic slowdown and heretofore unresolved credit excesses.
ContextA slowing China is enormously consequential to the world, mainly because China is responsible for nearly a third of global economic growth. There will undoubtedly be implications for the path of commodity prices and a host of other economic and market variables as its economic growth decelerates. But we must not overreact, for two counterintuitive reasons.
First, while China’s growth rate is likely to slow on a percent basis, this is not necessarily true on a renminbi basis (Exhibit 37). Because the Chinese economy is so much larger today than in 2005, a mere 6% annual growth today would generate more additional output in renminbis (even on an inflation-adjusted basis) than the extraordinary 11.3% growth rate did in 2005. In one sense, then, Chinese growth isn’t slowing after all.
Second, global economic growth may be more resilient than commonly imagined, even in the face of slowing national economies (Exhibit 38). Take the following example. While it is unhelpful that sustainable U.S. growth may slow from 3% to 2% over time, and that China could similarly slow from 8% to 6%, there is an important offset. China will constitute a much bigger share of the global economy in the future, and the U.S. a somewhat smaller share. Thus, whereas the U.S. 3% figure was the single most important contributor to global growth in the past, China’s 6% figure will be the most important contributor in the future. This tilting composition toward emerging market nations limits the extent of the global economic slowdown, even as individual nations decelerate.
11 Nonetheless, this is a key risk. A recent Economist magazine survey finds that a growing middle class tends to lead to a more demanding public. Moreover, China’s high level of income inequality presents another risk.
0
100
200
300
400
500
600
700
800
0
2
4
6
8
10
12
14
16
2000 2003 2006 2009 2012 2015 2018
Ann
ual C
hang
e in
Lev
el o
f Rea
l GD
P(2
000
Ren
min
bi B
illion
s)
Ann
ual R
eal G
DP
Gro
wth
(%)
Unit Growth (RHS)% Growth (LHS)
% Growth may
decelerate in the future
Unit growth doesn't have to
slow
Forecast
Exhibit 37: Even as percent growth slows, unit growth need not
Source: CNBS, Haver Analytics, RBC GAM
1980 1990 2000 2010 2020
Rea
l GD
P (Y
oY %
Cha
nge)
Exhibit 38: Composition shift keeps global growth aloft

15
Economic Compass
APPENDIX A: ARE CHINESE GROWTH STATISTICS TRUSTWORTHY?
-3
-2
-1
0
1
2
3
4
5
6
7
8
9
10
11
12
13
14
15
1995 1997 1999 2001 2003 2005 2007 2009 2011 2013
Eco
nom
ic A
ctiv
ity In
dex
(Sta
ndar
d D
evia
tions
from
His
toric
al N
orm
)
Chi
na G
DP
Gro
wth
(YoY
% C
hang
e)
GDP Growth (LHS)
Economic Activity Index(RHS)
Exhibit A: Chinese growth trends are mostly real
Note: Index constructed using sixteen proxies for real economic activity. Source: Bloomberg, Haver Analytics, RBC GAM
0.520.54
0.670.690.70
0.790.770.77
0.881.04
1.141.201.24
1.651.84
1.91
AustraliaFrance
CanadaU.S.
SpainU.K.Italy
ChinaGermany
IndiaJapanBrazil
MexicoKorea
IndonesiaRussia
Standard Deviation of Quarterly GDP Growth Rate,1998-2012
Chinese growth is curiously smooth for an EM nation
Exhibit B: Curiously smooth economic growth
Source: NFIB Small Business Economic Survey, RBC GAM
It is worth asking whether Chinese economic data is trustworthy,
given the economy’s seeming ability to levitate while others tumble,
combined with recent revelations about a few instances of exaggerated
trade numbers and provincial figures that impossibly sum to more than
the national total.
Fortunately, assessing China’s economy is relatively straight-forward
when contrasted to Cold War-era efforts to gauge the state of the
Soviet economy – for which no official statistics were published, on-
the-ground estimation of data by western sources was impossible,
product quality was a mystery and prices were meaningless.
We break the data quality question into three pieces.
First, when China reports that its economy is getting better or worse,
is anything actually changing? The short answer is “yes.” We built an
alternative Chinese economic activity index based on 16 proxies for
economic activity such as electricity usage and port statistics. The
resulting series is strikingly similar to the official GDP numbers, with
the exception of a curious divergence in 2005 to 2007 (Exhibit A). Up
truly is up, and down is down.
Second, could China have substantially exaggerated its economic
growth rate since the year 2000? Probably not. One way to demonstrate
this is by looking at the absolute rate of overall Chinese growth versus
export growth. We can (most of the time) trust Chinese export numbers
since they are corroborated by trading partners. Officially, China’s
export share rose from 21% to 26% of GDP between 2000 and 2011. If
Chinese real GDP was growing only half as quickly as reported through
that period, exports would have skyrocketed from 21% to 45% of GDP.
That isn’t plausible, as it is completely out of step with the experience
of other emerging market nations over that period.
In addition to the trade numbers, it is also difficult to stretch the truth
about consumption now that there are so many western retailers
operating in China. On the income side of the ledger, it is easy
enough to gauge true personal-income levels based on the salary costs
of Western firms. These checks limit the extent to which GDP can be
systematically exaggerated.
Third, could China be smoothing the amplitude of its economic cycle,
boosting weak quarters and tempering strong quarters? This certainly
could be the case. The volatility of Chinese quarterly GDP growth
is curiously smooth for a developing nation, suggesting (though
hardly confirming) some manipulation (Exhibit B). Fortunately, this is
inconsequential for our purposes, as we are looking at the trend growth
rate over multiple years, not quarter-to-quarter variation.
This report has been provided by RBC Global Asset Management Inc. (RBC GAM Inc.) for informational purposes only and may not be reproduced, distributed or published without the written consent of RBC GAM Inc. In the United States, this report is provided by RBC Global Asset Management (U.S.) Inc., a federally registered investment adviser founded in 1983. RBC Global Asset Management (RBC GAM) is the asset management division of Royal Bank of Canada (RBC) which includes RBC Global Asset Management Inc., RBC Global Asset Management (U.S.) Inc., RBC Alternative Asset Management Inc., and BlueBay Asset Management LLP, which are separate, but affiliated corporate entities.
This report is not intended to provide legal, accounting, tax, investment, financial or other advice and such information should not be relied upon for providing such advice. RBC GAM takes reasonable steps to provide up-to-date, accurate and reliable information, and believes the information to be so when printed. Due to the possibility of human and mechanical error as well as other factors, including but not limited to technical or other inaccuracies or typographical errors or omissions, RBC GAM is not responsible for any errors or omissions contained herein. RBC GAM reserves the right at any time and without notice to change, amend or cease publication of the information.
Any investment and economic outlook information contained in this report has been compiled by RBC GAM from various sources. Information obtained from third parties is believed to be reliable, but no representation or warranty, express or implied, is made by RBC GAM, its affiliates or any other person as to its accuracy, completeness or correctness. RBC GAM and its affiliates assume no responsibility for any errors or omissions.
All opinions and estimates contained in this report constitute our judgment as of the indicated date of the information, are subject to change without notice and are provided in good faith but without legal responsibility. To the full extent permitted by law, neither RBC GAM nor any of its affiliates nor any other person accepts any liability whatsoever for any direct or consequential loss arising from any use of the outlook information contained herein. Interest rates and market conditions are subject to change.
A Note on Forward-Looking StatementsThis report may contain forward-looking statements about future performance, strategies or prospects, and possible future action. The words “may,” “could,” “should,” “would,” “suspect,” “outlook,” “believe,” “plan,” “anticipate,” “estimate,” “expect,” “intend,” “forecast,” “objective” and similar expressions are intended to identify forward-looking statements. Forward-looking statements are not guarantees of future performance. Forward-looking statements involve inherent risks and uncertainties about general economic factors, so it is possible that predictions, forecasts, projections and other forward-looking statements will not be achieved. We caution you not to place undue reliance on these statements as a number of important factors could cause actual events or results to differ materially from those expressed or implied in any forward-looking statement made. These factors include, but are not limited to, general economic, political and market factors in Canada, the United States and internationally, interest and foreign exchange rates, global equity and capital markets, business competition, technological changes, changes in laws and regulations, judicial or regulatory judgments, legal proceedings and catastrophic events. The above list of important factors that may affect future results is not exhaustive. Before making any investment decisions, we encourage you to consider these and other factors carefully. All opinions contained in forward-looking statements are subject to change without notice and are provided in good faith but without legal responsibility.
®/TM Trademark(s) of Royal Bank of Canada. Used under licence. © RBC Global Asset Management Inc. 2013.