Economic - Banco de Portugal · challenges inherent to the ageing population must be overcome,...
122
Transcript of Economic - Banco de Portugal · challenges inherent to the ageing population must be overcome,...


Economic developments in Portuguese-speaking African countries and Timor-Leste2016|2017
Lisbon, 2017 • www.bportugal.pt

Economic developments in Portuguese-speaking African countries and Timor-Leste • Banco de Portugal Rua do Comércio,
148 | 1100-150 Lisboa • www.bportugal.pt • Edition International Relations Department • Design and printing
Communication Directorate | Image and Graphic Design Unit • ISSN 2182-3189 (online)

Contents
1. International environment | 7
1.1. Recent developments and outlook | 9
2. Economic developments in Portuguese-speaking African countries and Timor-Leste | 11
2.1. Angola | 14
2.2. Cabo Verde | 29
2.3. Guiné-Bissau | 45
2.4. Mozambique | 59
2.5. São Tomé e Príncipe | 75
2.6. Timor-Leste | 91
3. Portugal’s economic and financial relations with Portuguese-speaking African countries and Timor-Leste | 105


5
ForewordWith the goal of contributing to a better understanding of the current economic conditions in the Portuguese-speaking African countries and Timor-Leste, Banco de Portugal has released the publication Economic Developments In Portuguese-speaking African Countries and Timor-Leste since 1994, through which it presents key macroeconomic data for each economy and information on its economic and financial relations with Portugal.
Except for the 'International environment' chapter, the texts presented here were prepared on the basis of information received up to the end of July
2017, which in some cases may be subsequently revised, as it corresponds to estimates or preliminary data.
The cooperation of various entities contacted for the necessary data was key to the preparation of this report, as is always the case. These include the central banks of Angola, Cabo Verde, Mozambique, São Tomé and Príncipe and Timor-Leste and the national branch of the Central Bank of West African States in Guinea-Bissau.
October 2017


1.International environment


9
1.1. Recent developments and outlook World economic performance in the first half of 2017 justifies expectations of an upward revision of growth in 2017 and 2018.
Despite these signs of economic activity picking up again, many of the advanced economies continue to show low inflation, low productivity growth and an ageing population. The emerging and developing economies still face difficulties in returning to growth in per capita income and in adapting to the low-price environment for the commodities they export.
This adaptation is especially relevant given that international commodity prices continued their downward trend in the most recent months of 2017, most notably for oil, natural gas and some agricultural goods. These price reductions seem to be linked to higher than expected production or export levels by the United States and other global producers.
Along with the decreasing prices of important commodities, a set of factors contributed to a global low-inflation environment. For the advanced economies, these factors relate to falling unemployment being reflected weakly in increasing wages and to low productivity
growth. For the case of the emerging and developing economies, the general trend has been determined by the economic conjuncture in some of the major economies. This includes the price shock on foodstuffs in India and the economic slack accumulated during the recession in Brazil. South Africa and Russia are part of the falling inflation trend.
The resumption of capital flows towards the emerging economies showed signs of consolidation in the first half of 2017. The increase in capital flowing to the Chinese economy and the global recovery in portfolio investments are likely to have played a key role in that consolidation.
In the first half of 2017, growth in advanced economies has recovered more strongly than expected. For growth not to slow down as these economies approach their potential output, challenges inherent to the ageing population must be overcome, productivity growth must be revitalised and the working population's employability must be promoted. Expectations about a fiscal stimulus in the United States have not been confirmed, due to which moderate normalisation of US monetary policy is predicted.
Chart 1.1 • Real GDPAnnual percent change | Selected economies
Chart 1.2 • Inflation Year-on-year percent changes of the CPI | Selected economies
-5.0 0.0 5.0 10.0
World
Advanced economies
United States
Euro area
Japan
Emerging and developing economies
Emerging and developing Asia
Latin America and the Caribbean
Sub-saharan Africa
2015 2016 2017
0.0 5.0 10.0 15.0
World
Advanced economies
United States
Euro area
Japan
Emerging and developing economies
Emerging and developing Asia
Latin America and the Caribbean
Sub-saharan Africa
2015 2016 2017
Source: IMF, World Economic Outlook Database, July 2017.
International environment

BANCO DE PORTUGAL • Economic Developments in Portuguese-speaking African Countries and Timor-Leste • 2016 | 201710
In 2017, the emerging and developing economies as a whole have shown a slight increase in their growth rate.
This is the situation namely for emerging and developing Asia. The expansionary fiscal policy and the structural reforms under way in China resulted in a good performance in the first half of 2017. However, concern may intensify over the accumulation of debt. Symmetrically, the Indian economy should see its 2017 performance disrupted by tax and monetary reform with a potential positive impact over the medium term, but generating costs over the short term.
In Latin America and the Caribbean, the recovery should be particularly sharp in 2017. Similarly to the region as a whole, the outlook is favourable for Brazil and Argentina to transition from negative to positive growth rates, while growth in the Mexican economy is showing signs of slowing down.
After the slowdown in 2016 in Sub-Saharan Africa, growth is expected to accelerate in 2017, with a recovery in Nigeria – supported by rallying oil production and a solid performance from the agricultural sector – and strong growth prospects among fuel-importing countries.
After slowing down for years, international trade is showing signs of acceleration in 2017. Over the last few decades, trading has been an important driver of productivity growth. In a context where promoting economic growth faces structural challenges in advanced economies and where there is little room for fiscal stimulus in many emerging and developing economies, trade openness becomes one of the main instruments still available for creating a new structural and sustainable growth momentum.
Chart 1.3 • External current account Percentage of GDP | Selected economies
Chart 1.4 • Fiscal balance Percentage of GDP | Selected economies
-10.0 -5.0 0.0 5.0
Advanced economies
United States
Euro area
Japan
Emerging and developing economies
Emerging and developing Asia
Latin America and the Caribbean
Sub-saharan Africa
2015 2016 2017
-8.0 -6.0 -4.0 -2.0 0.0
Advanced economies
United States
Euro area
Japan
Emerging and developing economies
Emerging and developing Asia
Latin America and the Caribbean
Sub-Saharan Africa
2015 2016 2017
Source:IMF, World Economic Outlook Database, July 2017.

2.Economic developments in Portuguese- speaking African countries and Timor-Leste2.1. Angola
2.2. Cabo Verde
2.3. Guiné-Bissau
2.4. Mozambique
2.5. São Tomé e Príncipe
2.6. Timor-Leste


2.1. AngolaArea: 1,246,700 Km2
Capital city: Luanda
Population: 28.8 million (2016; source: UN)
Currency: Kwanza (AOA)
Unfavourable developments in the international oil price continued to stifle the Angolan economy during 2016. The economic slowdown continued, with no output growth in 2016. Inflationary pressures intensified over the last year, largely as a result of the depreciation of the kwanza. The economy showed deficits in the public and external accounts despite the contraction in imports of goods and services and in current expenditures.

BANCO DE PORTUGAL • Economic Developments in Portuguese-speaking African Countries and Timor-Leste • 2016 | 201714
The stabilisation of the international oil price at around USD 50 per barrel, significantly below the prices of 2011 to mid 2014, when they exceeded USD 100, continued to stifle the economy in Angola during 2016. The economy's high dependence on the oil sector, which accounted for around 40% of GDP in the years before the current shock, exposes economic performance strongly to that commodity's price, as was the case in 2008-2009.
The slowdown that began in 2014 has continued, with no output growth in 2016. The oil sector only grew by 0.8%, which compares to 6.4% in 2015. The non-oil economy performed negatively (-0.4%), with the industrial, construction and services sectors continuing to adjust to a context of lower private consumption and public investment. The difficulty in accessing foreign currencies led to declines in the supply of imported inputs used in the manufacturing process, considerably limiting the scope for import substitution. Projections for 2017 suggest economic growth of 1.3%, driven by the increase in public spending and an improvement in the terms of trade.
The ongoing deterioration of economic conditions placed the kwanza under strong downward pressure, with the currency falling 41% against the US dollar and 28% against the euro between July 2014 and April 2016, when the Angolan authorities repegged the exchange rate to the US dollar, after it had been abandoned in the second half of 2014. However, despite the gradual devaluation of the official exchange rate up to April 2016, it has continued to differ significantly from the parallel market exchange rate, with a spread estimated at 190% in November 2016 by the International Monetary Fund (IMF).
The combined effect of the kwanza's devaluation, the increase in fuel prices – following the removal of the energy subsidies – and the accommodative monetary conditions in the first half of 2016, have contributed to a sharp acceleration in the inflationary pace, with inflation reaching 41.9% in 2016, from 14.3% in 2015. The inflation rate has shown signs of slowing down in the first half of 2017, falling 10 percentage points versus the first half of 2016, driven in part by the stabilisation of the exchange rate against the US dollar (the kwanza's peg to the dollar had already been decisive in the economy's nominal stabilisation process from mid-2011).
The Angolan economy had twin deficits, for the third year in succession. The external current account improved in 2016, but stayed negative (-4.3% of GDP). Crude oil exports, which represent around 90% of total exports, fell again in 2016 (-17.9% on 2015), now accounting for less than half of the value exported in 2014. This decline in value of external sales led to a necessary adjustment in goods and services imports, which fell by 30% in 2016. In parallel, capital inflows into Angola during 2016 (worth 0.3% of GDP) proved insufficient to finance the current account deficit, leaving the remainder (4% of GDP) to be covered by official foreign exchange reserves. A new deterioration is expected in the external accounts in 2017, with a current account deficit projected of 6.1% of GDP.
Another of the main transmission mechanisms of the oil price shock to the Angolan economy came via the public finances, whose equilibrium depends heavily on the collection of taxes related to the oil industry (despite their share of total public revenue falling sharply, they nevertheless accounted for nearly half the total in 2016). For the third year in succession, the fiscal balance was negative in the year in review (-4.1% of GDP, deteriorating 0.8 percentage points from 2015). The 21.1% decline in oil revenue was the main factor explaining the fiscal position's deterioration in 2016, despite the containment of current expenditures. The State's General Budget for 2017 projects a new intensification in the deficit, expected to come to 5.7% of GDP.
The rising trend of public debt continued in 2016, reaching 71.9% of GDP at the end of the year (6.4 percentage points higher than in 2015), according to the IMF's most recent data. External debt has followed this trend, with a 7.2 percentage point estimated increase, bringing total external debt to 42.6% of GDP.
Repercussions of the economic slowdown have also spread to the financial system. The level of non-performing loans continues to increase, reaching 13.1% of total credit at the end of 2016, largely reflecting the corporate sector's greater difficulties in servicing its debt. Solvency levels among the financial institutions have also shown a gradual deterioration, with five banks having insufficient capital in September 2016. Developments in the solvency ratios may

15
however not yet fully reflect the deterioration in asset quality, given that certain loan restructuring operations have been extended to non-viable companies (source: IMF). Despite these less positive developments, the sector's profitability has recovered since 2014 and the dollarisation level in the banking system seems to have stabilised more recently at around 30% of assets and liabilities.
The external competitiveness gains achieved in 2015, in real terms, were reversed in 2016, as a result of the significant spreads between Angola's inflation and that of its main trading partners. Despite the 14.4% fall in the nominal effective exchange rate index (EERI), which was due to the depreciation of the kwanza against the currencies
of Angola's main trading partners, the real EERI appreciated 19.1% in 2016, particularly from April, when the price of the kwanza stabilised against the US dollar.
Broad money expanded in 2016 at a pace near that of the last few years (expansion of 14.1%). However, the main liquidity expansion/contraction factors changed compared to the year before, with credit to the economy falling and general government financing becoming one of the key drivers of broad money expansion. The increased value in kwanzas of the foreign exchange reserves, despite the reduction in their US dollar value, was the main liquidity expansion factor in 2016.
Table 2.1 • Main economic indicators2013 2014 2015 2016 2017
Est. Est. Est. Est. Proj.
Real GDP (annual % change) 6.8 4.8 3.0 0.0 1.3
7.7 7.5 14.3 41.9 15.8
13.2 16.2 11.8 14.1 –
6.7 -3.0 -10.0 -4.3 -6.1
0.3 -6.6 -3.3 -4.1 -5.7
22.6 28.4 35.3 42.6 –
Inflation (year-on-year % change)
Broad money (annual % change)
Current account (% of GDP)
Fiscal balance (% of GDP)
External public debt (% of GDP)
Sources (for the subsequent charts also): Banco Nacional de Angola, Ministry of Finance of Angola, European Central Bank, International Monetary Fund and Organisation for Economic Co-operation and Development.
Angola

BANCO DE PORTUGAL • Economic Developments in Portuguese-speaking African Countries and Timor-Leste • 2016 | 201716
Chart 2.1 • Real GDP Annual % change
Chart 2.2 • Inflation Annual % change in the CPI
2.43.4 3.9
5.2
6.8
4.8
3.0
0.01.3
0
2
4
6
8
10
2009 2010 2011 2012 2013 2014 2015(est.)
2016(est.)
2017(proj.)
0
10
20
30
40
50
2009 2010 2011 2012 2013 2014 2015 2016 2017Year-on-year % change Average % change
The stabilisation of the oil price at levels considerably below those of 2014 continues to stifle economic activity in Angola.
The upward trend of inflation intensified in 2016, reflecting the devaluation of the kwanza, increased fuel prices and accommodative monetary conditions in the first half of the year. By the end of 2016, inflation reached its highest level for a decade.
Chart 2.3 • External accounts % of GDP, average oil price per barrel in USD
Chart 2.4 • External public debt and foreign exchange reserves USD billions
-40
0
40
80
120
-20%
0%
20%
40%
60%
2009 2011 2013 2015(est.)
2017(proj.)
Trade balance Current accountOverall balance Avg. oil price per barrel (Brent)
0
10
20
30
40
50
2009 2010 2011 2012 2013 2014(est.)
2015(est.)
2016(est.)
Total external debt Gross foreign exchange reservesTotal external debt (% of GDP)
The external deficit fell by more than half in 2016, with imports falling in a context of increased difficulty in accessing foreign currencies. Although the impact of the oil price shock had been greater in 2015, the average price per barrel of Angolan oil fell 19% in 2016.
External debt has continued to increase, reaching 43% of GDP. The level of foreign exchange reserves stabilised, largely as a result of the decision by the authorities to allow the kwanza to devalue.
Chart 2.5 • Crude oil exportsDestinations as a percentage, total in USD billions
Chart 2.6 • Goods imports Origins as a percentage, total in USD millions
0
15
30
45
60
75
0%
20%
40%
60%
80%
100%
2009 2010 2011 2012 2013 2014 2015
China United States IndiaCanada Other Total
0
10
20
30
0%
20%
40%
60%
80%
100%
2009 2010 2011 2012 2013 2014 2015Portugal China United StatesBelgium Other Total
The geographical distribution of exports has remained relatively stable. External sales of crude oil, the main source of foreign currency, fell 17.9% in 2016, totalling USD 25.8 billion.
China replaced Portugal as the main supplier of goods in 2015. The value of imports of goods fell again in 2016, now representing half the value of the goods acquired from abroad in 2014.

17
Chart 2.7 • Public revenue % of GDP
Chart 2.8 • Public expenditure % of GDP
0
10
20
30
40
50
2009 2011 2013 2015(est.)
2017(budg.)
Oil revenue Other tax revenue Non-tax revenue
0
10
20
30
40
50
2009 2011 2013 2015(est.)
2017(budg.)
Compensation of employees Goods and services Interest Transfers Investment
Public revenue fell 8.7% in 2016, driven above all by the 21.1% fall in oil revenue. This component now accounts for less than half of total public revenue.
Public expenditure continued to fall in 2016, mainly due to the falling trend in goods and services spending. Offsetting this was the increase in interest charges on public debt, equating to 2.9% of GDP in 2016.
Chart 2.9 • Public accounts % of GDP
Chart 2.10 • Financial stability indicators
-10-505
101520
2009 2011 2013 2015(est.)
2017(budg.)
Current balance Overall balance
-5%5%
15%25%35%
Capital adequacy
Tier 1 ratio
Non-performingloans to total
credit
NLP net of provisions(% core capital)
Return on equity
Return on assets
2012 2014 2016
The public finances closed the 2016 financial year in negative territory for the third year in succession, with the deficit as a percentage of GDP increasing by 0.8 percentage points. The State's General Budget for 2017 projects a new intensification in the public deficit.
The challenging economic and financial context the country faces is reflected in the deterioration of the financial stability indicators, with certain financial institutions requiring recapitalisations.
Chart 2.11 • Liquidity expansion/contraction factors Changes in % of initial stock of broad money
Chart 2.12 • Effective exchange rateIndexes: 100 = 2000, monthly averages
-40-200
20406080
2009 2010 2011 2012 2013 2014 2015 2016(est.)
2017(May)
(Net) foreign assets (Net) claims on gen. gov.Credit to the economy Other (net) domestic assetsBroad money
225
250
275
300
325
350
5
7
9
11
13
2009 2010 2011 2012 2013 2014 2015 2016 2017Nominal index (left-hand scale) Real index (right-hand scale)
(appreciation: +; depreciation: -).
Broad money expanded in 2016 at a pace near that of the last few years. The increased value in the foreign exchange reserves (expressed in kwanzas) and increased credit to the Government were the main liquidity expansion factors in 2016.
Despite the devaluation of the kwanza in 2016, the spiking general price level resulted in the Angolan economy losing external competitiveness significantly, in real terms.
Angola

BANCO DE PORTUGAL • Economic Developments in Portuguese-speaking African Countries and Timor-Leste • 2016 | 201718
Table 2.2 • Economic indicators
2012 2013 2014 2015 2016 2017
Est. Est. Est. Est. Proj. Est. Proj. Est.
Output and pricesNominal GDP AOA billions 11,011 12,056 12,462 12,323 13,786 15,729 20,072 –
89.7 94.0 95.3 92.4 – 86.8 – –
115.4 124.9 126.7 102.7 81.5 96.1 121.0 –
5.2 6.8 4.8 3.0 1.3 0.0 1.3 –
4.5 -1.1 -2.6 6.4 – 0.8 1.5 –
5.5 10.9 8.2 1.6 – -0.4 1.3 –
9.0 7.7 7.5 14.3 [11.0-13.0] 41.9 15.8 31.9 June
10.3 8.8 7.3 10.3 – 32.4 – 37.8 June
45.9 40.2 35.3 27.3 25.5 19.5 18.3 –
37.3 30.1 23.8 15.4 12.3 9.5 8.4 –
39.3 39.9 41.9 30.6 31.2 23.6 24.0 –
28.9 28.5 29.4 24.6 25.2 19.1 19.0 –
10.4 11.4 12.5 6.0 5.9 4.5 5.0 –
6.6 0.3 -6.6 -3.3 -5.7 -4.1 -5.7 –
9.2 3.0 -2.4 -2.2 -5.7 -4.1 -5.7 –
8.2 -1.2 -1.1 15.8 – 11.3 – -14.8 May
23.9 10.5 0.7 17.7 – -0.9 – -1.9 May
5.7 13.2 16.2 11.8 – 14.1 – -3.4 May
15.3 15.1 17.4 15.4 – 15.8 – 15.7 May
3.8 3.9 4.4 5.2 – 5.2 – 6.2 May
2.4 2.3 2.1 2.5 – 2.1 – 2.2 May
18.3 19.5 19.8 19.8 – 19.2 – –
6.8 9.8 11.7 11.6 – 13.1 – –
12.5 10.9 4.9 12.9 – 15.6 – –
5.6 -3.2 -12.5 -43.4 -15.3 -16.9 14.3 –
4.4 7.3 8.8 -29.1 -5.5 -30.0 25.2 –
41.0 33.5 24.1 12.2 9.5 14.0 11.6 –
12.0 6.7 -3.0 -10.0 -14.9 -4.3 -6.1 –
32.2 32.2 27.9 24.4 – 24.4 – 21.6 May
17.6 21.2 27.0 32.7 – 37.0 – –
22.6 28.2 35.9 36.3 – 40.9 – –
19.6 22.6 28.4 35.3 – 42.6 – –
122.7 128.2 130.7 133.3 – – – –
95.4 96.5 98.3 120.0 – 163.7 – 165.9 June
-0.9 -2.4 -2.0 -21.0 – -14.4 – -2.3 June
4.6 2.1 3.7 -11.3 – 19.1 – 9.6 June
EUR billions
USD billions
Real GDP Annual % change
Oil sector Annual % change
Other sectors Annual % change
Inflation (CPI-Luanda) Year-on-year % changeAverage annual % change
Public finances
Total revenue % of GDP
Oil revenue % of GDP
Total expenditure % of GDP
Current expenditure % of GDP
Capital expenditure % of GDP
Overall balance (commitment basis) % of GDP
Overall balance (cash basis) % of GDP
Money and credit
Net foreign assets Annual % change
Credit to the economy Annual % change
Broad money (M3) Annual % change
Interest rates
Credit in national currency(a) (180 d) Annual rate
Deposits in national currency (180 d)
Annual rate
Deposits in foreign currency (180 d) Annual rate
Financial stability
Capital adequacy Percentage
Non-performing loans/total loans % of total loans
Return on equity Percentage
Balance of paymentsExports (current USD) Annual % change
Imports (current USD) Annual % change
Trade balance % of GDP
Current account % of GDP
Foreign reserves (gross) USD billions
External public debtTotal external public debt EUR billions
USD billions
% of GDP
Exchange rates
Bilateral rate EUR/AOA Average rate
Bilateral rate USD/AOA Average rate
Nominal EERI [appreciation: +](b) Annual % change
Real EERI [appreciation: +](b) Annual % change
Sources: Banco Nacional de Angola, Ministry of Finance of Angola, European Central Bank, International Monetary Fund, Organisation for Economic Co-operation and Development and Banco de Portugal calculations.Notes: (a) Credit granted to enterprises. (b) Effective exchange rate index (EERI), calculated on the basis of exchange rates applied to the currencies of the four major trading partners over the 2010/14 period.

19
Table 2.3 • Gross domestic productCurrent prices, AOA billions
2012 2013 20142015 2016 2017
Est. Proj. Est. Proj.
Agriculture 776 1,195 1,410 1,623 1,871 – –
27 30 38 47 48 – –
89 95 81 121 146 – –
5,160 5,018 4,414 2,958 3,283 – –
752 884 1,012 1,132 1,324 – –
947 1,109 1,267 1,499 1,673 – –
14 20 25 29 41 – –
2,428 2,813 3,215 3,755 4,147 – –
819 892 1,001 1,157 1,253 – –
11,011 12,056 12,462 12,323 13,786 15,729 20,072
89.7 94.0 95.3 92.4 – 86.8 –
115.4 124.9 126.7 102.7 81.5 96.1 121.0
12.6 9.5 3.4 -1.1 11.9 27.6 27.6
5.2 6.8 4.8 3.0 1.3 0.0 1.3
4.5 -1.1 -2.6 6.4 – 0.8 1.5
5.5 10.9 8.2 1.6 – -0.4 1.3
Fishing and related products
Diamonds and other
Oil
Manufacturing
Construction
Energy
Market services
Other
Gross domestic product (market prices)
Memo items:
Nominal GDPmp (EUR billions)
Nominal GDPmp (USD billions)
Nominal GDPmp (AOA, annual % change)
Real GDP (annual % change)
Oil sector
Other sectors
Sources: Banco Nacional de Angola, International Monetary Fund and Banco de Portugal calculations.
Angola

BANCO DE PORTUGAL • Economic Developments in Portuguese-speaking African Countries and Timor-Leste • 2016 | 201720
Table 2.4 • Consumer price indexPer cent
Monthly change Cumulative change Year-on-year change Average change
[1] [2] [3] [4]
2003 December2004 December2005 December
2006 December
2007 December
2008 December
2009 December
2010 December
2011 December
2012 December
2013 December
2014 December
2015 December
2016 December
2015 January
February
March
April
May
June
July
August
September
October
November
December
December (proj.)
2016 January
February
March
April
May
June
July
August
September
October
November
December
December (proj.)
2017 January
February
March
April
May
June
December (proj.)
Sources: Banco Nacional de Angola, International Monetary Fund and Banco de Portugal calculations.Notes: [1] month (n) / month (n-1); [2] month (n) / previous December; [3] month (n) / month (n) of the previous year; [4] last 12 months / previous 12 months.
– 76.6 76.6 98.2– 31.0 31.0 43.5
– 18.5 18.5 23.0
– 12.2 12.2 13.3
– 11.7 11.7 12.2
– 13.2 13.2 12.5
– 14.0 14.0 13.7
– 15.3 15.3 14.5
– 11.4 11.4 13.5
– 9.0 9.0 10.3
– 7.7 7.7 8.8
– 7.5 7.5 7.3
– 14.3 14.3 10.3
– 41.9 41.9 32.4
0.7 0.7 7.4 7.2
0.8 1.5 7.7 7.3
0.6 2.1 7.9 7.3
0.9 3.0 8.2 7.4
1.2 4.2 8.9 7.6
1.3 5.5 9.6 7.8
1.3 7.0 10.4 8.1
1.1 8.2 11.0 8.4
1.2 9.5 11.7 8.8
1.4 11.0 12.4 9.2
1.3 12.5 13.3 9.7
1.6 14.3 14.3 10.3
– – 9.0 –
3.4 3.4 17.3 11.1
3.3 6.8 20.3 12.2
3.4 10.5 23.6 13.5
3.1 13.9 26.4 15.0
3.5 17.9 29.2 16.8
3.3 21.7 31.8 18.7
4.0 26.7 35.3 20.8
3.3 30.8 38.2 23.1
2.1 33.6 39.4 25.4
1.8 36.0 40.0 27.8
2.1 38.9 41.1 30.1
2.2 41.9 41.9 32.4
– – [11.0-13.0] –
2.3 2.3 40.4 34.3
2.6 4.9 39.4 35.8
2.2 7.3 37.8 37.0
2.0 9.4 36.3 37.7
1.8 11.4 34.1 38.0
1.6 13.1 31.9 37.8
– – 15.8 –

21
Table 2.5 • Balance of paymentsUSD millions
2012 2013 2014 20152016 2017
Proj. Est. Proj.
Current account 13,853 8,348 -3,748 -10,273 -12,130 -4,101 -7,428
47,376 41,903 30,590 12,488 7,738 13,433 13,986
71,093 68,247 59,170 33,181 27,550 27,466 31,580
69,716 66,902 57,642 31,895 25,864 26,210 30,220
68,871 65,611 56,364 31,394 – 25,784 29,725
1,159 1,167 1,335 1,066 – 1,058 1,132
218 177 193 220 – 198 228
-23,717 -26,344 -28,580 -20,693 -19,811 -14,033 -17,594
-31,761 -31,430 -32,126 -21,928 -18,906 -16,763 -20,441
-21,339 -21,530 -23,276 -16,020 -14,430 -11,390 -14,550
780 1,316 1,681 1,256 1,621 1,156 1,139
-22,119 -22,846 -24,958 -17,276 -16,051 -12,546 -15,689
-4,595 -4,924 -5,628 -4,204 – – –
-6,230 -5,049 -6,673 -3,107 – – –
-8,908 -9,265 -10,050 -7,185 – – –
-10,422 -9,900 -8,850 -5,908 -4,476 -5,373 -5,891
-662 -1,090 -1,066 -1,287 -988 – –
-9,722 -9,331 -7,850 -4,292 -3,621 – –
-1,762 -2,124 -2,211 -834 -963 -771 -973
-8,885 -8,203 -486 6,908 6,511 252 4,4281 0 2 6 0 0 0
-9,639 -13,164 -2,331 8,235 7,121 -3,362 641
753 4,961 1,844 -1,334 -611 3,614 3,787
-462 199 336 354 0 0 0
4,506 344 -3,896 -3,010 -5,619 -3,850 -3,000
-4,506 -344 3,896 3,010 – 3,850 3,000
-4,505 -344 -3,896 3,010 – 3,850 3,000
-1 0 0 0 – 0 0
0 0 0 0 – 0 0
41.0 33.5 24.1 12.2 9.5 14.0 11.6
12.0 6.7 -3.0 -10.0 -14.9 -4.3 -6.1
Trade balance
Exports (f.o.b.)
Oil sector
of which: Crude oil
Diamonds
Other
Imports (f.o.b.)
Services and income
Services (net)
Credit
Debit
of which: Transportation and travel
Construction
Technical assistance
Income (net)
of which: Interest on public debt
Dividends and profits
Current transfers (net)
Capital and financial accountsCapital transfers (net)
Foreign direct investment (net)
Other net capital
Errors and omissions
Overall balance
FinancingChange in official reserves (increase: - )
Exceptional financing(a)
Financing gap
Memo items:
Trade balance (% of GDP)
Current account (% of GDP)
Sources: Banco Nacional de Angola, Ministry of Finance of Angola, International Monetary Fund and Banco de Portugal calculations.Notes: (a) Mainly, change in arrears and debt forgiveness or rescheduling .
Angola

BANCO DE PORTUGAL • Economic Developments in Portuguese-speaking African Countries and Timor-Leste • 2016 | 201722
Table 2.6 • Goods exportsProducts, USD millions | Destinations, % of total
2010 2011 2012 2013 20142015 2016 2010
a 2015
Est. Est. Est.
Total exports
Crude oilRefined oil products and gas
Diamonds
Other
Exports by destination(a)
Canada
China
France
India
Portugal
South Africa
Taiwan
United States
Other
Sources: Banco Nacional de Angola, International Monetary Fund and Banco de Portugal calculations.Note: (a) Crude oil exports only.
Table 2.7 • Goods importsProducts, USD millions | Origins, % of total
2010 2011 2012 2013 20142015 2016 2010
a 2015
Est. Est. Est.
Total imports 16,667 20,228 23,717 26,344 28,580 20,693 14,033 –
16,667 20,228 23,717 26,344 28,587 20,052 – –
7.3 6.0 6.7 5.5 6.0 6.6 – 6.3
5.1 4.2 4.4 4.3 4.4 4.0 – 4.4
8.5 7.6 9.2 10.1 12.2 14.3 – 10.4
14.5 15.4 16.4 16.4 15.3 13.1 – 15.3
4.0 3.8 3.8 3.7 3.6 3.8 – 3.8
5.1 2.9 2.4 3.4 4.0 3.2 – 3.5
7.4 8.2 5.5 4.7 6.8 6.5 – 6.4
48.1 52.0 51.7 51.8 47.7 48.6 – 50.0
of which: SNA(a)
Imports by originBelgium
Brazil
China
Portugal
South Africa
United Kingdom
United States
Other
Sources: Banco Nacional de Angola, International Monetary Fund and Banco de Portugal calculations.Note: (a) Data from the National Customs Service of Angola.
50,595 67,310 71,093 68,247 59,170 33,181 27,466 –
48,629 64,539 68,871 65,611 56,364 31,394 25,784 –
722 1,052 845 1,291 1,278 501 426 –
976 1,205 1,159 1,167 1,335 1,066 1,058 –
267 514 218 177 193 220 198 –
5.8 8.7 5.0 5.0 4.6 3.3 – 5.6
42.8 37.7 49.6 48.3 48.5 44.8 – 45.4
3.7 3.2 1.6 2.0 3.5 5.0 – 2.9
10.1 10.7 10.1 10.3 8.3 8.5 – 9.8
1.8 2.4 2.5 4.7 3.4 3.8 – 3.1
3.1 2.6 4.2 2.7 3.4 4.3 – 3.3
4.8 8.2 6.1 5.3 4.6 4.5 – 5.8
18.1 15.9 8.7 7.0 3.5 3.1 – 9.7
9.8 10.6 12.2 14.6 20.1 22.7 – 14.3

23
Table 2.8 • External public debt and foreign exchange reservesUSD millions
2012 2013 20142015 2016
Est. Est.
1. Net foreign assets 32,937 31,941 30,191 26,386 23,952
32,166 32,231 27,948 24,420 24,438
22,583 28,178 35,933 36,279 40,900
13,786 18,143 26,474 26,612 –
12,813 16,590 24,005 23,345 –
974 1,553 2,470 3,267 –
6978 8,433 7,788 7,906 –
1,813 1,598 1,666 1,756 –
6 4 4 4 –
28.5 25.6 23.8 25.7 24.9
27.9 25.8 22.1 23.8 25.4
19.6 22.6 28.4 35.3 42.6
of which: Foreign exchange reserves (gross)
2. External public debt (including arrears)
Commercial
Banking
Enterprises
Official bilateral
Official multilateral
Fees
Memo items:
Net foreign assets (% of GDP)
Gross foreign exchange reserves (% of GDP)
Total external debt (% of GDP)
Sources: Banco Nacional de Angola, International Monetary Fund and Banco de Portugal calculations.
Angola

BANCO DE PORTUGAL • Economic Developments in Portuguese-speaking African Countries and Timor-Leste • 2016 | 201724
Table 2.9 • Government operationsAOA billions
2012 2013 20142015 2016 2017
Est. Budg. Est. l.e.(a) Budg.
1. Total revenue 5,054 4,849 4,403 3,367 3,515 3,075 87.5 3,6684,826 4,602 4,098 3,042 3,235 2,762 85.4 3,404
4,103 3,630 2,970 1,898 1,690 1,498 88.7 1,695
723 972 1,128 1,144 1,545 1,264 81.8 1,709
226 245 303 324 279 312 111.7 264
2 2 2 1 0 1 – 0
4,329 4,816 5,222 3,774 4,296 3,718 86.6 4,8083,184 3,437 3,667 3,038 3,480 3,009 86.5 3,813
1,031 1,155 1,319 1,390 1,497 1,496 99.9 1,614
1,297 1,228 1,248 787 995 510 51.2 1,035
105 99 150 249 307 463 150.7 484
68 59 88 143 152 186 122.1 262
37 40 62 106 155 277 178.7 222
752 955 950 612 680 540 79.4 680
1,145 1,379 1,555 736 816 709 86.9 995
725 32 -819 -407 -781 -643–
-1,140
289 324 517 138 0 0 – 0289 324 – – 0 – – 0
0 0 – – 0 – – 0
1,014 356 -302 -269 -781 -644 – -1,140
-1,014 -356 302 269 781 644 – 1,140218 183 438 241 1,059 653 – 990
384 380 732 579 1,518 1,400 – 1,564
-166 -197 -294 -338 -459 -747 – -575
-1,231 -539 -136 29 -278 -9 – 150
-432 -597 – – – – – –
-800 58 – – – – – –
6.6 0.3 -6.6 -3.3 -5.7 -4.1 – -5.7
Tax revenue
Oil revenue
Non-oil revenue
Non-tax revenue
Grants
2. Total expenditureCurrent expenditure
Compensation of employees
Goods and services
Debt interest
Domestic
External
Transfers and subsidies
Capital expenditure
3. Overall balance (commitment basis) [ 1. - 2. ]
4. Change in arrears (net)Domestic(b)
External interest
5. Overall balance (cash basis) [ 3. + 4. ]
6. FinancingExternal financing (net)
Disbursements
Amortisation
Domestic financing (net)
Bank financing
Non-bank financing (incl. errors and omissions)
Memo item:
Overall balance, commitment basis (% of GDP)
Sources: Banco Nacional de Angola, Ministry of Finance of Angola, International Monetary Fund and Banco de Portugal calculations.Notes: (a) Level of budget execution (%). (b) Net of changes in arrears to suppliers (expenditure) and changes in Sonangol's arrears to the Treasury (revenue).

25
Table 2.10 • Monetary surveyAOA billions
2012 2013 2014 20152016 2016/2015 2017 May 2017/2016
Est. [1] [2] May [1] [2]
Net foreign assets
USD billions
Banco Nacional de Angola
Net international reserves
Gross reserves
USD billions
Short-term liabilities
Other foreign assets (net)
Commercial banks
Net domestic assetsDomestic credit (net)
Claims on general government (net)Credit to the economy
Other domestic assets (net)
Total assets
Broad money (M3)
Money and quasi-money (M2)
Money
Currency in circulation
Demand deposits
in national currency
in foreign currency
Quasi-money
Time deposits in national currencyTime deposits in foreign currency
Other financial instruments
Sources: Banco Nacional de Angola, International Monetary Fund and Banco de Portugal calculations.Notes: [1] Percentage changes from the end of the previous year. [2] Changes in % of initial stock of broad money (liquidity expansion/contraction factors)..
3,155 3,116 3,082 3,570 3,974 11.3 7.1 3,385 -14.8 -9.0
33 32 30 26 24 -9.2 – 20 -14.8 –
3,017 3,097 2,889 3,361 3,637 8.2 4.8 3,070 -15.6 -8.7
2,954 3,041 2,788 3,284 3,550 8.1 4.7 2,991 -15.8 -8.6
3,081 3,145 2,853 3,304 4,054 22.7 13.1 3,579 -11.7 -7.3
32 32 28 24 24 0.1 – 22 -11.7 –
-127 -103 -66 -21 -504 – -8.5 -589 16.7 -1.3
63 56 102 78 87 12.0 0.2 80 -8.3 -0.1
138 19 193 209 337 60.8 2.2 314 -6.6 -0.3
728 1,280 2,028 2,141 2,545 18.8 7.1 2,915 14.6 5.7
1,705 2,260 3,016 3,821 4,520 18.3 12.2 4,939 9.3 6.4
-943 -666 69 352 1,083 207.9 12.8 1,567 44.7 7.4
2,648 2,926 2,947 3,469 3,437 -0.9 -0.6 3,372 -1.9 -1.0
-977 -980 -988 -1,680 -1,975 17.6 -5.2 -2,024 2.5 -0.8
3,883 4,397 5,110 5,712 6,519 14.1 – 6,300 -3.4 –
3,883 4,397 5,110 5,712 6,519 14.1 – 6,300 -3.4 –
3,749 4,395 5,103 5,704 6,516 14.2 – 6,297 -3.4 –
2,272 2,585 3,097 3,420 3,845 12.4 – 3,608 -6.2 –
244 276 340 381 386 1.4 – 345 -10.8 –
2,028 2,309 2,757 3,039 3,459 13.8 – 3,264 -5.6 –
1,062 1,470 1,905 2,264 2,576 13.8 – 2,428 -5.7 –
966 839 852 775 883 13.9 – 835 -5.4 –
1,477 1,810 2,007 2,284 2,671 16.9 – 2,689 0.7 –
721 902 1,167 1,258 1,553 23.5 – 1,553 -0.0 –
756 908 840 1,026 1,118 9.0 – 1,136 1.6 –
134 2 7 8 4 -53.4 – 3 -12.7 –
Angola

BANCO DE PORTUGAL • Economic Developments in Portuguese-speaking African Countries and Timor-Leste • 2016 | 201726
Table 2.11 • Interest ratesAnnual rates, per cent
2012 2013 2014 2015 2016 2017
Dec. Dec. Dec. Dec. Mar. Jun. Sep. Dec. Mar. May
Deposits
(in national currency)
Demand deposits 0.0 0.0 0.0 0.0 0.0 0.0 0.0 0.0 0.0 0.0
3.1 3.5 3.5 5.0 5.1 5.4 5.6 6.8 6.0 6.4
3.8 3.9 4.4 5.2 5.0 4.8 5.0 5.2 5.2 6.1
4.8 5.8 4.5 3.9 3.8 4.1 4.0 3.9 3.9 3.9
6.7 4.9 5.2 4.6 5.0 5.0 5.1 4.8 4.9 5.0
0.0 0.0 0.0 0.0 0.0 0.0 0.0 0.0 0.0 0.0
1.8 2.0 1.9 2.3 2.0 2.0 2.0 2.0 2.1 2.1
2.4 2.3 2.1 2.5 2.4 2.3 2.4 2.1 2.1 2.2
2.8 2.8 2.6 3.1 3.1 2.9 3.2 2.9 2.9 2.9
3.5 5.0 2.6 4.6 4.8 4.9 4.9 4.8 4.9 4.8
15.3 15.0 17.3 15.4 15.6 15.8 15.8 15.8 15.4 15.6
14.3 13.8 13.8 15.2 15.2 15.1 15.1 19.7 15.3 15.6
15.0 13.1 13.6 14.8 14.0 14.6 14.9 15.1 15.4 16.4
8.9 11.8 11.4 10.0 16.2 16.6 20.0 0.0 9.9 6.7
11.5 12.1 10.6 13.0 – – 11.6 8.4 6.7 6.7
11.3 9.8 10.0 9.8 8.4 7.9 8.5 8.7 9.0 8.8
20.0 10.3 9.8 15.0 15.0 16.0 20.0 20.0 20.0 20.0
10.2 9.2 9.0 11.0 14.0 16.0 16.0 16.0 16.0 16.0
11.5 10.3 9.8 12.5 16.0 20.0 20.0 20.0 20.0 20.0
1.5 0.8 1.8 0.0 2.3 2.3 7.3 0.0 0.0 0.0
6.2 4.7 6.1 11.3 11.0 13.9 14.5 23.4 23.7 22.4
9.0 7.7 7.5 14.3 23.6 31.8 39.4 41.9 37.8 34.1
Time deposits
Up to 90 days
91-180 days
181-365 days
Over 1 year
(in foreign currency)
Demand deposits
Time deposits
Up to 90 days
91-180 days
181-365 days
Over 1 year
Credit (to enterprises)
(in national currency)
Up to 180 days
181-365 days
Over 1 year
(in foreign currency)
Up to 180 days
181-365 days
Over 1 year
BNA intervention rates
Rediscount
Reference rate
Standing facilities
Liquidity provision facility
Overnight deposit facility
LUIBOR(a) overnight
Memo item:Inflation (y-o-y % change)
Source: Banco Nacional de Angola.Notes: (a) Luanda Interbank Offered Rate (weighted average rate of liquidity-providing operations without collateral, applied by banks in the interbank money market).

27
Table 2.12 • Financial stability indicatorsPer cent
2012 2013 2014 2015 2016
Dec. Dec. Dec. Dec. Dec.
SolvencyCapital adequacy
Tier 1 ratio
Credit risk
Non-performing loans to total loans
Non-performing loans net of provisions (% of core capital)
Credit in foreign currency (% of total credit)
Profitability
Return on equity
Return on assets
Liquidity risk
Loan-to-deposit ratio
Liquid assets/total assets
Foreign currency-denominated liabilities/total liabilities
Sources: Banco Nacional de Angola and International Monetary Fund.
18.3 19.5 19.8 19.8 19.2
13.6 14.3 13.9 13.8 14.3
6.8 9.8 11.7 11.6 13.1
11.6 22.3 32.8 19.6 27.4
42.7 37.8 27.4 30.8 29.5
12.5 10.9 4.9 12.9 15.6
1.6 1.4 0.6 1.7 2.2
65.5 63.3 59.9 59.0 51.6
26.3 30.1 33.9 39.7 46.3
50.7 43.0 33.1 33.5 34.4
Angola

BANCO DE PORTUGAL • Economic Developments in Portuguese-speaking African Countries and Timor-Leste • 2016 | 201728
Table 2.13 • Exchange ratesAverage rates
EERI(a) Index: 100 = 2000
EUR/AOA USD/AOA Nominal Real
2003200420052006200720082009201020112012201320142015
2016
2015 JanuaryFebruaryMarchAprilMayJuneJulyAugustSeptemberOctoberNovemberDecember
2016 JanuaryFebruaryMarchAprilMayJuneJulyAugustSeptemberOctoberNovemberDecember
2017 JanuaryFebruaryMarchAprilMayJune
Sources: Banco Nacional de Angola, European Central Bank, Organisation for Economic Co-operation and Development and Banco de Portugal calculations.Note: (a) Effective exchange rate index, calculated on the basis of official exchange rates applied to the currencies of the four main trading partners over the 2010/14 period. An increase/decrease in the EERI (nominal or real) corresponds to an appreciation/depreciation of the kwanza.
86.1 74.3 13.3 133.7104.3 83.4 11.9 165.4108.4 87.2 11.3 189.3101.2 80.4 12.1 222.7105.4 76.7 12.0 238.7110.8 75.0 11.6 245.3111.2 79.6 11.1 264.6121.3 92.0 9.6 252.2130.6 93.8 9.1 256.7122.7 95.4 9.0 272.3128.2 96.5 8.8 281.8130.7 98.3 8.7 292.0
133.3 120.0 7.4 270.1
– 163.7 5.7 267.3
121.4 103.6 8.4 292.8119.4 105.2 8.4 291.8116.2 107.1 8.3 289.5117.6 109.0 8.1 286.4122.5 109.7 8.0 287.0132.2 117.5 7.5 270.3137.3 124.7 7.1 258.6139.8 125.8 7.1 262.7148.5 131.8 6.8 253.1152.1 135.3 6.6 249.9145.6 135.3 6.7 255.2147.2 135.3 6.7 261.2169.2 155.6 5.9 237.2175.3 157.6 5.8 238.7178.1 159.4 5.7 241.7183.3 164.2 5.5 241.7
– 165.9 5.5 249.0– 165.9 5.6 258.8– 165.9 5.6 271.4– 165.9 5.6 279.0– 165.9 5.6 284.0– 165.9 5.6 291.0– 165.9 5.7 301.5– 165.9 5.8 311.0– 165.9 5.8 315.2– 165.9 5.7 322.1– 165.9 5.7 329.0– 165.9 5.7 333.9– 165.9 5.7 338.1– 165.9 5.6 340.8

2.2. Cabo Verde Área: 4,033 Km2
Capital city: Praia
Population: 531 thousand (2016; source: Cabo Verde National Institute of Statistics)
Currency: CV Escudo (CVE)
Domestic demand dynamics and the good performance of tourism and foreign direct investment led to an acceleration in economic growth in Cabo Verde in 2016. The ensuing sound tax collection and lower costs arising from the public investment programme resulted in a decline in the fiscal deficit, but failed to prevent the further increase in public debt. The current account deficit fell, due to the ongoing increase in both exports of services and private transfers. Foreign direct investment inflows, disbursements of foreign public loans and the unwinding of investments abroad funded the current deficit and facilitated an expansion in foreign exchange reserves. Due to the inflow of reserves and moderate inflation, the central bank was able to maintain an accommodative monetary policy in 2016, in order to foster credit to the economy.

BANCO DE PORTUGAL • Economic Developments in Portuguese-speaking African Countries and Timor-Leste • 2016 | 201730
In 2016 there was an acceleration in economic growth in Cabo Verde, to 3.8% (1.0% in 2015), furthered by buoyant domestic demand (mainly consumption but also investment) and the sound performance of tourism revenue and foreign direct investment.
The increase in private transfers, including emigrants’ remittances, together with the ongoing recovery in tourism demand (particularly from Italy, the United Kingdom and France), led to a reduction in the current account deficit, to 3.9% of GDP (4.6% in 2015). This improvement also benefited from a decrease in the income account deficit by virtue of the increase in inflows partly driven by remuneration of non-resident employees. The acceleration in economic activity boosted imports of both consumer and capital goods, which resulted in the worsening of the trade balance.
The current account deficit was funded by foreign direct investment inflows, disbursements of foreign public loans and the unwinding of investments abroad by the banking and non-banking sectors. Currency inflows also strengthened foreign exchange reserves, by EUR 88 million, rising to 6.9 months of goods and services imports, thus helping support the exchange rate peg with the euro in place since 1998.
The increase in foreign exchange reserves was accompanied by higher net domestic credit, combining increases chiefly in credit to the non-financial private sector, households and general government. As such, broad money accelerated in 2016, growing by 8.4% from 2015, as reflected mainly by the collection of CVE-denominated deposits (mostly, demand deposits but also time deposits) and emigrants’ deposits (albeit at a slower pace than before).
Price levels continued on a downward path in 2016, reflecting external price developments (mostly, oil products and products from euro area countries), greater domestic production of fresh produce and a reduction in the VAT rate (reversal of the 2015 tax increase in aid of Chã das Caldeiras). Inflation remained at negative levels throughout 2016, standing at -1.4% and
0.3% in December, in average and year-on-year terms respectively.
Against a background of well-performing reserves and controlled inflation, Banco de Cabo Verde (BCV) maintained its accommodative monetary policy over the year. The banking sector lowered some of its rates, which, given the persistent excess liquidity and low financial investment rates, has hampered the sector’s profitability, in a context of still high non-performing loans. Impaired loans accounted for 15.5% of total credit at the end of 2016, which, however, is down from 16.5% at the end of 2015.
Economic acceleration boosted tax collection, more specifically personal income tax (which also impacts on small and medium-sized enterprises), VAT and the tax on international transactions. Despite a continued increase in current expenditure, the sound performance of tax revenue helped to contain the fiscal deficit, at 3.6% of GDP (4.6% in 2015), which was also helped by the decrease in spending in the public investment programme. The results of the legislative elections in 2016 and the ensuing change of the ruling party caused significant delays in the implementation of a public investment programme that was already being phased down.
Albeit lower, the General government’s financing needs, which also include those resulting from financial asset operations (more specifically, loans used for on-lending), were mostly covered by domestic resources, with some contribution from external resources. Public debt proceeded on an upward path, with its share in GDP increasing to 129% at the end of 2016 (the external component dropped to 97% while the domestic component increased to 32%).
2017 should be characterised by economic growth similar to 2016, with projections pointing at a real GDP rise of 3.9%, largely on the back of investment and private consumption. Reflecting the expansion in imports, the current account deficit is expected to deteriorate, rising to 6.7% of GDP. However, the increase in foreign direct investment should be enough to continue to push reserves upwards, although reducing the coverage of goods and services imports.

31
In spite of the expected recovery in the public investment programme and the increase in current expenditure, the sound collection of taxes and projected inflows of grants should reduce the fiscal deficit to 3.4% of GDP.
The first months of 2017 have matched projections, as evidenced by an increase in the current account deficit and fiscal deficit improvements. Exceptions were mostly related to the non-resumption of the public investment programme, which contributed to a positive fiscal balance in the first quarter, and the decrease in foreign exchange reserves (by EUR 12 million, up to March).
Although back in positive territory, subdued inflation made it possible for BCV to introduce changes to monetary policy instruments in June, with a view to making them more effective: (i) marked reduction in rates on its main instruments (by 2 p.p. in its key, liquidity provision and rediscount rates – which moved down to 1.5%, 4.5% and 5.5% respectively; and by 0.15 p.p. in its liquidity absorption facility, to 0.1%); (ii) absorption of excess liquidity; (iii) removal of both the exemption on reserve requirements and the ceiling on its liquidity provision facility;
(iv) implementation of tender procedures for fixed-rate monetary regularisation securities (Portuguese acronym: TRM). With these measures, BCV has sought to stimulate financing for viable investment projects and, consequently, economic activity, which should be enhanced by the effective implementation of structural economic policy measures.
The sharper slowdown in the economies of its main trading partners, more specifically in the European Union, and the possible increase in global protectionism (and potential price increase in imports) are the more substantial external risks to Cabo Verde’s economy in 2017.
At domestic level, it is particularly important to monitor the costs and effects of recent changes to monetary policy instruments. Particular attention should also be paid to budgetary control, public debt management and financial stability. Under the latter, a resolution measure was applied to a small institution in March 2017, and part of its business was purchased by the second largest bank in Cabo Verde.
Table 2.14 • Main economic indicators
2014 2015 2016 2017
Est. Proj.
Real GDP (annual % change) 0.6 1.0 3.8 3.9
-0.4 -0.5 -0.3 1.2
7.3 5.9 8.4 5.5
-9.1 -4.6 -3.9 -6.7
5.4 6.4 6.9 7.0
-7.6 -4.6 -3.6 -3.4
115.9 126.0 129.0 –
Inflation (year-on-year % change)
Broad money (annual % change)
Current account (% of GDP)
Official reserves (months of imports)
Fiscal balance (% of GDP)
Public debt, excluding TCMF(a) (% of GDP)
Sources: (for the subsequent charts also): International Monetary Fund, Banco de Cabo Verde, Ministry of Finance (Cabo Verde) and Cabo Verde National Institute of Statistics.Note: (a) Títulos Consolidados de Mobilização Financeira (consolidated financial mobilisation securities), covered by the resources of an offshore Trust Fund.
Cabo Verde

BANCO DE PORTUGAL • Economic Developments in Portuguese-speaking African Countries and Timor-Leste • 2016 | 201732
Chart 2.13 • Real GDP Annual % change
Chart 2.14 • Inflation Annual % change in the CPI
-1.3
1.5
4.0
1.1 0.8 0.61.0
3.8 3.9
-2
-1
0
1
2
3
4
5
2009 2010 2011 2012 2013 2014 2015 2016(est.)
2017(proj.)
-4
-2
0
2
4
6
8
2009 2010 2011 2012 2013 2014 2015 2016 2017
Year-on-year % change Average % change
Following a number of years of weak growth, economic activity accelerated in 2016, owing to buoyancy mostly in consumption but also investment and to the performance of tourism revenue and foreign direct investment.
Throughout 2016 Cabo Verde posted negative inflation rates, chiefly reflecting the import component, particularly oil products, but also domestic factors such as the greater production of fresh produce.
Chart 2.15 • External accounts % of GDP
Chart 2.16 • Foreign exchange reserves Months of goods and services imports
-50
-40
-30
-20
-10
0
10
2009 2010 2011 2012 2013 2014 2015 2016(est.)
2017(proj.)
Trade balance Current account Overall balance
0
1
2
3
4
5
6
7
8
2009 2010 2011 2012 2013 2014 2015 2016 2017(proj.)
Total net foreign assets Net foreign assets - BCV
Despite an increase in imports due to economic acceleration, the current account improved in 2016, reflecting increasing private transfers, including emigrants’ remittances, and continued recovery in demand from tourism.
In 2016 foreign exchange reserves proceeded on an upward path, covering nearly 7 months of goods and services imports, driven by foreign direct investment inflows, disbursements of foreign public loans and unwinding of investments abroad by the banking and non-banking sectors.
Chart 2.17 • Goods exports Destinations as a %, total in USD millions
Chart 2.18 • Goods imports Origins as a %, total in USD millions
0
50
100
150
200
250
300
0%
20%
40%
60%
80%
100%
2009 2010 2011 2012 2013 2014 2015 2016
Other France El SalvadorSpain Portugal Total
0
200
400
600
800
1,000
1,200
0%
20%
40%
60%
80%
100%
2009 2010 2011 2012 2013 2014 2015 2016
Other Brazil NetherlandsSpain Portugal Total
In 2016 the Iberian Peninsula continued to be the main market for Cabo Verde’s exports, particularly Spain (mostly sea products). Portugal partly recovered its share in the total, thus interrupting the gradual fall that started in 2008.
Since 1998 Portuguese products have accounted for approximately half of Cabo Verde’s imports. The geographical structure of imports has remained relatively stable, with the Netherlands and Spain taking on around 25% of the total since 2002.

33
Chart 2.19 • Public accounts % of GDP
Chart 2.20 • Public debt % of GDP
-20
-16
-12
-8
-4
0
2009 2010 2011 2012 2013 2014 2015 2016(est.)
2017(budget)
Current balance Overall balance excl. grantsOverall balance
0
20
40
60
80
100
120
140
2009 2010 2011 2012 2013 2014 2015 2016(est.)
Mar-17(est.)
External - Multilateral External - BilateralDomestic (excl. TCMF) Domestic - TCMF
In 2016 the fiscal deficit continued to follow the downward trend that started in 2013, after the expanded public investment programme (launched as a response to the international crisis) had come to an end.
In addition to the need to fund fiscal deficits (although declining), it is also necessary to cover financial asset operations (more specifically, loans used for on-lending) and, consequently, public debt is still on the rise, although the external component is mostly concessional.
Chart 2.21 • Public revenue and expenditure % of GDP
Chart 2.22 • Financial stability indicators
-40-30-20-100
10203040
2009 2010 2011 2012 2013 2014 2015 2016(est.)
2017(budget)
Exp: Invest. Prog. Exp: Other current Exp: InterestExp: Subs.+Tr.+Soc. ben. Exp: Goods and serv. Exp: PersonnelRev: Grants Rev: Transf. f/ SOE Rev: Other currentRec: Social sec. Rev: Taxes
Expe
nditu
reRe
venu
e
0%
10%
20%
30%Capital adequacy
Liquid assets(% of total assets)
ROE
ROA
Non-performingloans
(% of total loans)
Provisions(% of total loans)
2012 2014 2016
The reduction of the public investment programme was accompanied by sound tax collection, which made it possible to cut the fiscal deficit in 2016. However, the pressure from current expenditure has kept total expenditure close to 30% of GDP.
Against a background of growing banking activity, the banking system’s liquidity and solvency increased in 2016. However, profitability is still restricted by the limited options for investing funds and the still high (although declining) non-performing loan levels.
Chart 2.23 • Liquidity expansion/contraction factors Changes in % of initial stock of broad money
Chart 2.24 • Effective exchange rateIndexes 100 = 2000, monthly averages
-10
-5
0
5
10
15
2009 2010 2011 2012 2013 2014 2015 2016(est.)
2017(proj.)
External position Net claims on gen. gov.Credit to the economy Other net assetsBroad money
96
97
98
99
100
101
102
103
104
105
2009 2010 2011 2012 2013 2014 2015 2016 2017
Nominal index Real index
(appreciation: +; depreciation: -)
Broad money growth accelerated in 2016, chiefly reflecting the improvement of the system’s net external position, as has been the case since 2013. Also, credit to the economy has grown, particularly loans to enterprises and to households for consumption.
In 2016 Cabo Verde’s escudo depreciated, in nominal effective terms, reflecting the Brazilian real’s appreciation against the euro. The escudo’s depreciation was exacerbated in real terms by the inflation differential vis-à-vis the other trading partners – Portugal, Spain and the Netherlands.
Cabo Verde
BANCO DE PORTUGAL • Economic Developments in Portuguese-speaking African Countries and Timor-Leste • 2016 | 201734
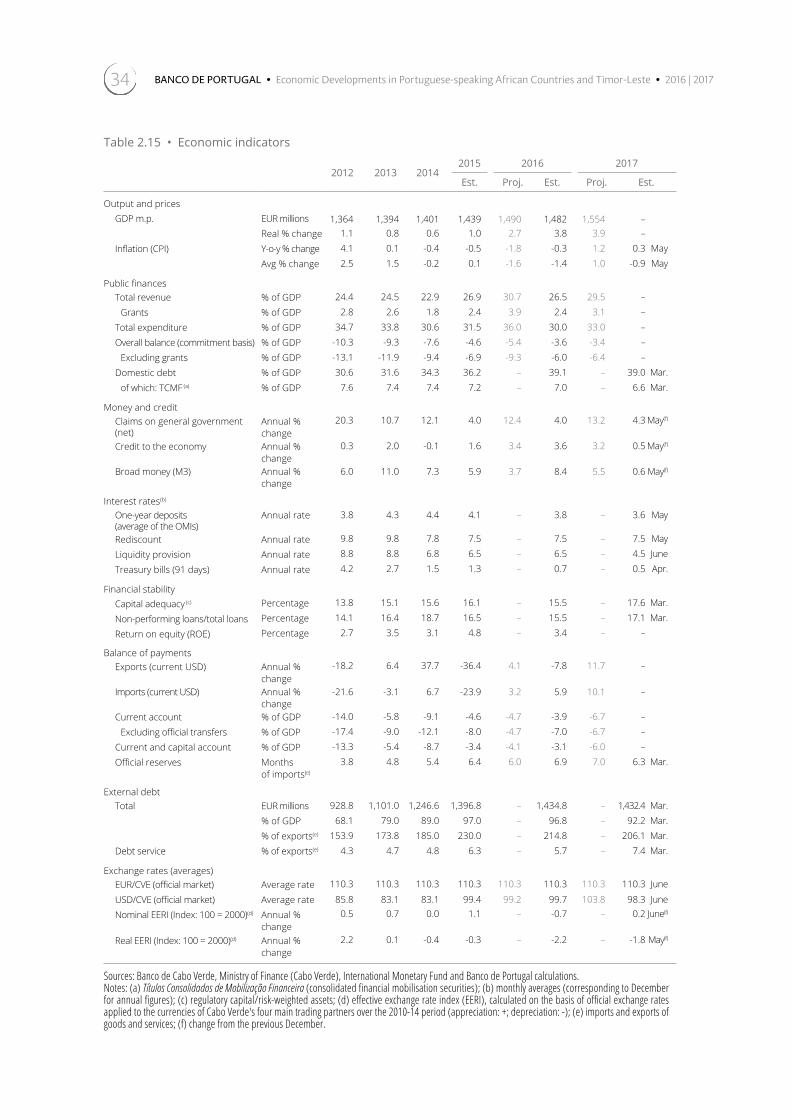
Table 2.15 • Economic indicators
2012 2013 2014 2015 2016 2017
Est. Proj. Est. Proj. Est.
Output and pricesGDP m.p. EUR millions
Real % changeInflation (CPI) Y-o-y % change
Avg % change
Public financesTotal revenue % of GDP
Grants % of GDPTotal expenditure % of GDPOverall balance (commitment basis) % of GDP
Excluding grants % of GDPDomestic debt % of GDP
of which: TCMF (a) % of GDP
Money and creditClaims on general government (net)
Annual % change
Credit to the economy Annual % change
Broad money (M3) Annual % change
Interest rates(b)
One-year deposits (average of the OMIs)
Annual rate
Rediscount Annual rateLiquidity provision Annual rateTreasury bills (91 days) Annual rate
Financial stabilityCapital adequacy (c) Percentage
Non-performing loans/total loans Percentage
Return on equity (ROE) Percentage
Balance of paymentsExports (current USD) Annual %
changeImports (current USD) Annual %
changeCurrent account % of GDP
Excluding official transfers % of GDPCurrent and capital account % of GDPOfficial reserves Months
of imports(e)
External debtTotal EUR millions
% of GDP% of exports(e)
Debt service % of exports(e)
Exchange rates (averages)EUR/CVE (official market) Average rateUSD/CVE (official market) Average rateNominal EERI (Index: 100 = 2000)(d) Annual %
changeReal EERI (Index: 100 = 2000)(d) Annual %
change
Sources: Banco de Cabo Verde, Ministry of Finance (Cabo Verde), International Monetary Fund and Banco de Portugal calculations.Notes: (a) Títulos Consolidados de Mobilização Financeira (consolidated financial mobilisation securities); (b) monthly averages (corresponding to December for annual figures); (c) regulatory capital/risk-weighted assets; (d) effective exchange rate index (EERI), calculated on the basis of official exchange rates applied to the currencies of Cabo Verde's four main trading partners over the 2010-14 period (appreciation: +; depreciation: -); (e) imports and exports of goods and services; (f) change from the previous December.
1,364 1,394 1,401 1,439 1,490 1,482 1,554 – 1.1 0.8 0.6 1.0 2.7 3.8 3.9 – 4.1 0.1 -0.4 -0.5 -1.8 -0.3 1.2 0.3 May2.5 1.5 -0.2 0.1 -1.6 -1.4 1.0 -0.9 May
24.4 24.5 22.9 26.9 30.7 26.5 29.5 – 2.8 2.6 1.8 2.4 3.9 2.4 3.1 –
34.7 33.8 30.6 31.5 36.0 30.0 33.0 – -10.3 -9.3 -7.6 -4.6 -5.4 -3.6 -3.4 – -13.1 -11.9 -9.4 -6.9 -9.3 -6.0 -6.4 – 30.6 31.6 34.3 36.2 – 39.1 – 39.0 Mar.
7.6 7.4 7.4 7.2 – 7.0 – 6.6 Mar.
20.3 10.7 12.1 4.0 12.4 4.0 13.2 4.3 May(f)
0.3 2.0 -0.1 1.6 3.4 3.6 3.2 0.5 May(f)
6.0 11.0 7.3 5.9 3.7 8.4 5.5 0.6 May(f)
3.8 4.3 4.4 4.1 – 3.8 – 3.6 May
9.8 9.8 7.8 7.5 – 7.5 – 7.5 May8.8 8.8 6.8 6.5 – 6.5 – 4.5 June4.2 2.7 1.5 1.3 – 0.7 – 0.5 Apr.
13.8 15.1 15.6 16.1 – 15.5 – 17.6 Mar.14.1 16.4 18.7 16.5 – 15.5 – 17.1 Mar.
2.7 3.5 3.1 4.8 – 3.4 – –
-18.2 6.4 37.7 -36.4 4.1 -7.8 11.7 –
-21.6 -3.1 6.7 -23.9 3.2 5.9 10.1 –
-14.0 -5.8 -9.1 -4.6 -4.7 -3.9 -6.7 – -17.4 -9.0 -12.1 -8.0 -4.7 -7.0 -6.7 – -13.3 -5.4 -8.7 -3.4 -4.1 -3.1 -6.0 –
3.8 4.8 5.4 6.4 6.0 6.9 7.0 6.3 Mar.
928.8 1,101.0 1,246.6 1,396.8 – 1,434.8 – 1,432.4 Mar.68.1 79.0 89.0 97.0 – 96.8 – 92.2 Mar.
153.9 173.8 185.0 230.0 – 214.8 – 206.1 Mar.4.3 4.7 4.8 6.3 – 5.7 – 7.4 Mar.
110.3 110.3 110.3 110.3 110.3 110.3 110.3 110.3 June
85.8 83.1 83.1 99.4 99.2 99.7 103.8 98.3 June0.5 0.7 0.0 1.1 – -0.7 – 0.2 June(f)
2.2 0.1 -0.4 -0.3 – -2.2 – -1.8 May(f)

35
Table 2.16 • Gross domestic productCurrent prices, CVE millions
2010 2011 2012 2013 2014 2015 2016 2017
Est. Est. Proj.
Primary sectorAgriculture, livestock and forestry
Fishing and aquaculture
Mining and quarrying
Secondary sector
Manufactured products
Electricity, gas, water
Construction
Tertiary sector
Whole. & retail trade; repair of motor vehicles
Accommodation and food service activities
Transportation and storage
Telecommunications and mail
Financial services
Real estate and other services
Corporate services
Public administration
Gross value added
Taxes and subsidies on products
Gross domestic product (m.p.)
Consumption
Public
Private
Investment
Gross fixed capital formation
Public
Private
Changes in inventories
Domestic demand
Exports of goods and services
Overall demand
Imports of goods and services
Memo items:
Gross domestic savings
Nominal GDPmp (EUR millions)
Nominal GDPmp (USD millions)
GDP deflator (annual % change)
Nominal GDP (annual % change)
Real GDP (annual % change)
Sources: Cabo Verde National Institute of Statistics, Banco de Cabo Verde, International Monetary Fund and Banco de Portugal calculations.
11,780 12,215 13,249 13,322 13,089 14,432 14,370 – 9,705 10,598 11,659 11,393 10,946 12,005 12,662 –
1,367 1,005 1,040 1,334 1,433 1,872 1,162 –
708 612 550 595 710 556 545 –
24,440 25,668 25,018 26,330 28,212 28,192 27,927 –
7,528 8,054 8,547 8,916 9,862 10,389 11,514 –
1,939 2,158 3,268 3,999 4,071 5,234 4,648 –
14,973 15,456 13,203 13,415 14,278 12,569 11,765 –
84,749 89,645 93,463 95,045 94,563 96,043 99,731 –
17,609 19,002 18,785 17,278 17,720 16,179 16,020 –
14,781 14,038 13,300 14,664 13,105 14,999 15,129 –
4,792 5,896 8,651 9,065 8,221 7,260 7,886 –
6,254 6,246 6,330 6,130 6,122 6,013 5,554 –
5,120 5,077 5,238 5,377 5,986 6,138 6,758 –
14,604 14,696 15,885 15,897 15,948 16,210 16,654 –
2,570 3,176 3,392 3,489 2,951 4,057 4,354 –
19,019 21,514 21,882 23,144 24,510 25,188 27,375 –
120,969 127,528 131,730 134,697 135,865 138,667 142,028 –
17,598 20,400 18,622 19,026 18,571 20,032 21,354 –
138,567 147,928 150,352 153,723 154,436 158,699 163,381 171,311
112,863 120,269 123,620 127,167 128,676 133,410 141,910 –
25,536 27,401 25,963 26,837 28,496 29,918 33,680 –
87,327 92,868 97,657 100,330 100,180 103,491 108,231 –
66,024 70,277 55,920 48,622 57,148 47,906 52,217 –
62,625 69,128 52,844 46,337 53,317 45,681 52,578 –
23,935 19,236 22,320 18,451 11,125 11,635 8,443 –
38,690 49,892 30,524 27,886 42,192 34,045 44,135 –
3,399 1,149 3,076 2,285 3,831 2,225 –361 –
178,887 190,546 179,540 175,789 185,824 181,316 194,127 –
45,271 52,541 60,790 62,246 62,332 71,268 73,660 –
224,158 243,087 240,330 238,035 248,156 252,583 267,787 –
85,591 95,159 89,978 84,312 93,720 93,884 104,406 –
25,704 27,659 26,732 26,556 25,760 25,289 21,471 –
1,257 1,342 1,364 1,394 1,401 1,439 1,482 1,554
1,664 1,866 1,752 1,850 1,859 1,597 1,639 1,650
0.5 2.7 0.6 1.4 –0.1 1.7 –0.8 0.9
2.0 6.8 1.6 2.2 0.5 2.8 3.0 4.9
1.5 4.0 1.1 0.8 0.6 1.0 3.8 3.9
Cabo Verde

BANCO DE PORTUGAL • Economic Developments in Portuguese-speaking African Countries and Timor-Leste • 2016 | 201736
Table 2.17 • Consumer price indexPercentages
Monthly change Year-on-year change Average change
[1] [2] [3]
2003 December
2004 December
2005 December
2006 December
2007 December
2008 December
2009 December
2010 December
2011 December
2012 December
2013 December
2014 December
2015 December
2016 December
2015 January
February
March
April
May
June
July
August
September
October
November
December
December (proj.)
2016 January
February
March
April
May
June
July
August
September
October
November
December
December (proj.)
2017 January
February
March
April
May
December (proj.)
Sources: Banco de Cabo Verde and Banco de Portugal calculations.Notes: [1] month (n) / month (n-1); [2] month (n) / month (n) of the previous year; [3] last 12 months / 12 previous months.
– -2.3 1.2 – 0.6 -1.9
– 1.8 0.4
– 5.8 4.8
– 4.0 4.4
– 6.7 6.8
– -0.4 1.0
– 3.4 2.1
– 3.6 4.5
– 4.1 2.5
– 0.1 1.5
– -0.4 -0.2
– -0.5 0.1
– -0.3 -1.4
0.2 0.1 -0.2
-0.4 -0.2 -0.3
-0.4 -0.2 -0.4
-0.3 0.3 -0.3
0.2 0.3 -0.3
0.0 0.3 -0.2
0.3 0.3 -0.2
0.1 0.3 -0.1
0.3 0.6 0.0
-0.1 0.4 0.1
-0.2 -0.2 0.1
-0.2 -0.5 0.1
– 2.0 1.5
-0.5 -1.2 0.0
-0.5 -1.3 -0.1
-0.3 -1.2 -0.1
0.0 -0.9 -0.2
0.1 -1.0 -0.4
-1.3 -2.3 -0.6
0.2 -2.3 -0.8
0.6 -1.8 -1.0
0.1 -2.1 -1.2
0.7 -1.3 -1.3
-0.1 -1.3 -1.4
0.8 -0.3 -1.4
– -1.8 -1.6
-0.7 -0.4 -1.3
0.3 0.3 -1.2
-0.2 0.5 -1.1
-0.3 0.3 -1.0
0.2 0.3 -0.9
– 1.2 1.0

37
Table 2.18 • Balance of paymentsCVE millions
2013 20142015 2016 2017
Est. Proj. Q I Est. Proj. Q I
1. Current accountTrade
Exports (f.o.b.)(a)
Imports (f.o.b.)
Services (net)
Exports
of which: Transport
Tourism
Imports
of which: Transport
Tourism
Income (net)
Exports
of which: Income f/ the TF(b) (prev. year)
Imports
of which: Interest on sched. public debt
Current transfers
Official transfers
Private transfers
of which: Emigrant remittances
2. Capital and financial accountCapital account
Capital transfers
Financial account
Direct investment
Portfolio investment
Other transactions
of which: Disburs. of loans to gen. gov.
Scheduled amortisation
3. Errors and omissions
4. Overall balance: (1)+(2)+(3)
5. FinancingChange in official reserves (increase: - ) Exceptional financing
of which: Drawings from ACC Facility(c)
Reimb. of ACC Facility(c)
Change in arrears (increase: +)
6. Financing GAP(d): (4)+(5)
Memo items:
Current account (% of GDP)
Current and capital account (% of GDP) Official reserves (in months of imports)(e)
Sources: Banco de Cabo Verde, International Monetary Fund and Banco de Portugal calculations.Notes: (a) Includes sales of fuel to ships and re-exports; (b) offshore fund (Trust Fund) to support the conversion of domestic debt; (c) Exchange Rate Cooperation Agreement (Acordo de Cooperação Cambial) between Portugal and Cabo Verde; (d) net borrowing (-)/net lending (+); (e) net foreign assets of BCV and imports of goods and services in the year.
-8,898 -14,025 -7,292 -7,683 124 -6,367 -11,495 -1,099-51,533 -50,277 -48,871 -50,297 -10,899 -54,113 -59,345 -17,579
15,283 21,044 16,024 16,681 4,008 14,813 16,548 3,844
-66,816 -71,322 -64,894 -66,977 -14,907 -68,926 -75,893 -21,422
25,207 21,904 22,086 22,813 6,172 23,367 26,405 10,283
54,551 53,241 50,940 52,447 15,017 58,847 60,083 19,271
11,235 9,526 9,478 – 2,563 10,397 – 3,456
33,325 32,121 33,182 35,372 9,748 34,877 36,759 12,288
-29,344 -31,337 -28,855 -29,634 -8,845 -35,480 -33,678 -8,988
-7,020 -7,842 -7,602 – -2,008 -8,726 – -2,234
-3,728 -2,692 -2,325 – -1,438 -5,812 – -1,328
-5,367 -7,692 -5,751 -6,365 -2,227 -5,634 -5,965 -1,496
1,151 1,165 1,254 – 421 2,361 – 588
373 373 414 267 0 267 – 0
-6,518 -8,857 -7,006 – -2,648 -7,995 – -2,084
-1,438 -1,518 -1,734 -1,771 -458 -1,662 -2,031 -495
22,795 22,039 25,244 26,165 7,079 30,013 27,410 7,692
4,948 4,664 5,395 – 989 4,998 – 1,939
17,847 17,375 19,850 – 6,089 25,015 – 5,753
14,441 16,158 19,679 19,144 4,916 20,503 – 4,727
14,619 19,390 13,251 9,857 -540 14,189 10,149 3,291
533 659 1,884 908 133 1,316 1,200 411
533 659 1,884 908 133 1,316 1,200 411
14,085 18,731 11,367 8,949 -673 12,873 8,949 2,880
4,627 10,557 9,359 10,506 2,900 10,862 10,506 3,712
-2,281 -2,001 -2,089 -416 -1,004 -4,024 -416 -1,023
11,739 10,175 4,098 -1,141 -2,569 6,035 -1,141 191
19,391 -18,911 13,074 – 665 5,819 – 588
-1,823 -2,036 -2,484 – -811 -2,553 – -1,071
-117 2,481 -2,436 0 332 1,328 4,581 -3,536
5,604 7,845 3,524 2,173 -83 9,150 3,235 -1,344-5,604 -7,845 -3,524 -2,173 83 -9,150 -3,235 1,344
-5,604 -7,845 -3,524 -2,173 83 -9,150 -3,235 1,344
0 0 0 – 0 0 – 0
0 0 0 – 0 0 – 0
0 0 0 – 0 0 – 0
0 0 0 – 0 0 – 0
0 0 0 0 0 0 0 0
-5.8 -9.1 -4.6 -4.7 – -3.9 -6.7 –
-5.4 -8.7 -3.4 -4.1 – -3.1 -6.0 –
4.8 5.4 6.4 6.0 6.1 6.9 7.0 6.3
Cabo Verde
BANCO DE PORTUGAL • Economic Developments in Portuguese-speaking African Countries and Timor-Leste • 2016 | 201738
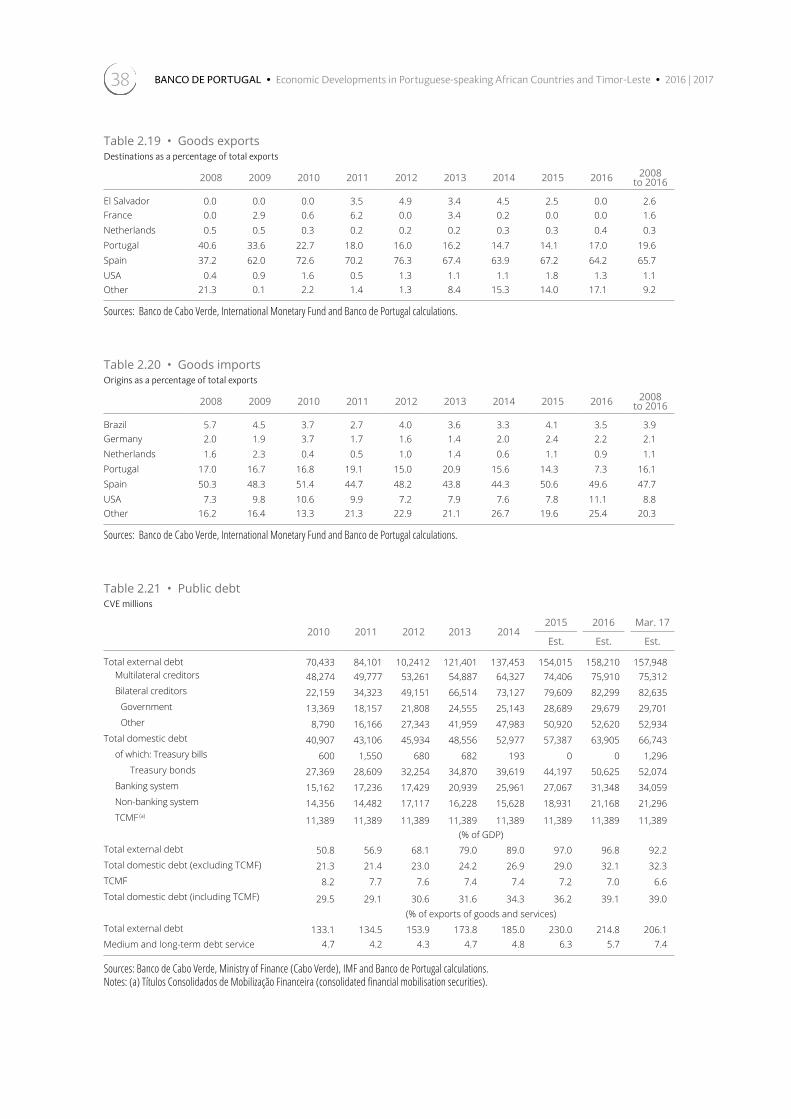
Table 2.19 • Goods exportsDestinations as a percentage of total exports
2008 2009 2010 2011 2012 2013 2014 2015 2016 2008 to 2016
El Salvador 0.0 0.0 0.0 3.5 4.9 3.4 4.5 2.5 0.0 2.6 0.0 2.9 0.6 6.2 0.0 3.4 0.2 0.0 0.0 1.6 0.5 0.5 0.3 0.2 0.2 0.2 0.3 0.3 0.4 0.3
40.6 33.6 22.7 18.0 16.0 16.2 14.7 14.1 17.0 19.6 37.2 62.0 72.6 70.2 76.3 67.4 63.9 67.2 64.2 65.7
0.4 0.9 1.6 0.5 1.3 1.1 1.1 1.8 1.3 1.1 21.3 0.1 2.2 1.4 1.3 8.4 15.3 14.0 17.1 9.2
FranceNetherlandsPortugalSpainUSAOther
Sources: Banco de Cabo Verde, International Monetary Fund and Banco de Portugal calculations.
Table 2.20 • Goods importsOrigins as a percentage of total exports
2008 2009 2010 2011 2012 2013 2014 2015 2016 2008 to 2016
Brazil 5.7 4.5 3.7 2.7 4.0 3.6 3.3 4.1 3.5 3.9 2.0 1.9 3.7 1.7 1.6 1.4 2.0 2.4 2.2 2.1 1.6 2.3 0.4 0.5 1.0 1.4 0.6 1.1 0.9 1.1
17.0 16.7 16.8 19.1 15.0 20.9 15.6 14.3 7.3 16.1 50.3 48.3 51.4 44.7 48.2 43.8 44.3 50.6 49.6 47.7
7.3 9.8 10.6 9.9 7.2 7.9 7.6 7.8 11.1 8.8 16.2 16.4 13.3 21.3 22.9 21.1 26.7 19.6 25.4 20.3
GermanyNetherlandsPortugalSpainUSAOther
Sources: Banco de Cabo Verde, International Monetary Fund and Banco de Portugal calculations.
Table 2.21 • Public debtCVE millions
2010 2011 2012 2013 2014 2015 2016 Mar. 17
Est. Est. Est.
Total external debtMultilateral creditors
Bilateral creditors
Government
Other
Total domestic debt
of which: Treasury bills
Treasury bonds
Banking system
Non-banking system
TCMF (a)
(% of GDP)Total external debt
Total domestic debt (excluding TCMF)
TCMF
Total domestic debt (including TCMF)
(% of exports of goods and services)Total external debt 133.1 134.5 153.9 173.8 185.0 230.0 214.8 206.1
4.7 4.2 4.3 4.7 4.8 6.3 5.7 7.4 Medium and long-term debt service
Sources: Banco de Cabo Verde, Ministry of Finance (Cabo Verde), IMF and Banco de Portugal calculations.Notes: (a) Títulos Consolidados de Mobilização Financeira (consolidated financial mobilisation securities).
70,433 84,101 10,2412 121,401 137,453 154,015 158,210 157,948 48,274 49,777 53,261 54,887 64,327 74,406 75,910 75,312
22,159 34,323 49,151 66,514 73,127 79,609 82,299 82,635
13,369 18,157 21,808 24,555 25,143 28,689 29,679 29,701
8,790 16,166 27,343 41,959 47,983 50,920 52,620 52,934
40,907 43,106 45,934 48,556 52,977 57,387 63,905 66,743
600 1,550 680 682 193 0 0 1,296
27,369 28,609 32,254 34,870 39,619 44,197 50,625 52,074
15,162 17,236 17,429 20,939 25,961 27,067 31,348 34,059
14,356 14,482 17,117 16,228 15,628 18,931 21,168 21,296
11,389 11,389 11,389 11,389 11,389 11,389 11,389 11,389
50.8 56.9 68.1 79.0 89.0 97.0 96.8 92.2
21.3 21.4 23.0 24.2 26.9 29.0 32.1 32.3
8.2 7.7 7.6 7.4 7.4 7.2 7.0 6.6
29.5 29.1 30.6 31.6 34.3 36.2 39.1 39.0

39
Table 2.22 • Government operationsCVE millions
2013 2014 2015 2016 2017
Budg. Q 1 Est. l.e.(a) Budg. Q 1 l.e.(a)
1. Total revenue1.1. Current revenue
TaxesIncome taxesTaxes on goods and services
of which: VATTaxes on international trans.Other taxes
Social contributionsTransfers (Public Administration)Other revenue
1.2. Grants1.3. Transf. f/ state owned entrep.(b)
2. Total expenditure2.1. Current expenditure(c)
of which: From invest. projectsCompensation of employeesGoods and services Interest and other charges
of which: Domestic debtExternal debt
SubsidiesTransfersSocial benefitsOther expenditure
of wich: Scholarships2.2. Investment programme
3. Non-financial assets: (3.1-3.2)3.1. Purchase of non-financial assets3.2. Sale of non-financial assets
4. Current balance: (1.1-2.1)
5. Overall balance excl. grants: (1-2-3-1.2)
6. Overall balance (commitment basis): (1-2-3)
7. Financing7.1. Financial assets
Loan repay. to state ow. enterp.Loans to state owned enterprisesShares and other equityOther financial assets
7.2. Financial liabilitiesExternal (net)
DisbursementsAmortisation
Domestic (net)Banking systemOther
8. Financing gap/discrepancy(e): (6+7)
Sources: Banco de Cabo Verde, Ministry of Finance (Cabo Verde), IMF and Banco de Portugal calculations.Notes: (a) Level of budget execution (%); (b) Share of capital expenditure of state-owned enterprises (usually to finance infrastructures related to the activities of these enterprises); (c) Includes values to settle in 2015; (d) Net borrowing (+)/net lending (-).
37,716 35,327 42,677 50,355 9,929 43,220 85.8 50,538 11,711 23.233,692 32,540 38,916 44,023 9,497 39,359 89.4 45,304 10,081 22.328099 27060 30,516 34,938 8,025 32,304 92.5 37,407 8,505 22.78,596 7,747 9,669 10,504 2,584 10,078 95.9 11,590 2,396 20.7
13,136 12,870 14,047 16,456 3,764 14,941 90.8 17,475 4,302 24.610,522 10,170 11,293 13,015 3,024 11,986 92.1 13,784 3,479 25.2
5,700 5,754 6,082 7,154 1,562 6,813 95.2 7,637 1,671 21.9668 688 719 824 115 472 57.3 705 136 19.3
43 56 46 208 13 56 27 59 15 24.90 0 197 0 4 94 – 273 1 0
5,550 5,424 8,157 8,877 1,454 6,906 77.8 7,564 1,560 20.64,024 2,787 3,761 6,332 432 3,861 61.0 5,234 1,630 31.1
0 0 0 0 0 0 – 0 0 –
51,982 47,240 50,024 59,139 10,602 49,060 83.0 56,535 10,974 19.435,436 37,549 41,068 49,614 9,946 44,147 89.0 48931 10,385 21.2
4,471 5,498 6,735 9,790 1,287 6,758 69.0 8,314 822 9.916,601 17,175 17,530 20,380 4,597 18,347 90.0 20,817 4,478 21.5
5,064 5,747 7,433 9,811 1,234 6,806 69.4 9,124 889 9.73,383 3,444 4,134 4,261 980 4,223 99.1 4,709 1,108 23.51,878 1,910 2,374 2,415 522 2,455 101.7 2,590 593 22.91,438 1,518 1,724 1,750 458 1,748 99.9 2,005 495 24.7
101 107 161 246 38 160 65.1 233 35 15.24,075 4,389 4,755 6,265 1,242 4,904 78.3 5,973 1,022 17.14,150 4,348 4,735 5,102 1,233 5,148 100.9 5,458 1,298 23.82,062 2,339 2,320 3,549 392 3,137 88.4 2,617 493 18.9
568 598 579 591 126 591 100.0 639 121 19.016,546 9,691 8,956 9,524 656 4,912 51.6 7,605 589 7.7
55 -150 -118 149 0 122 81.8 -205 -159 77.568 160 166 285 13 160 56.3 278 4 1.414 310 284 135 13 38 28.2 483 163 33.7
-1,744 -5,009 -2,152 -5,591 -449 -4,788 – -3,627 -304 –
-18,345 -14,550 -10,991 -15,265 -1,106 -9,823 – -11,027 -733 –
-14,321 -11,763 -7,229 -8,933 -674 -5,962 – -5,793 897 –
14,321 11,763 7,229 8,933 -1,499 5,962 – 5,793 495 – -6,311 -5,036 -5,092 -7,185 -417 -4,801 – -6,683 -339 –
128 129 273 267 135 313 – 303 8 – -5,629 -5,037 -3,929 -5,859 -178 -3,632 – -5,960 -382 –
-810 -101 -1,457 -2,000 -390 -1,510 – -1,108 0 – 0 -28 21 407 16 28 – 82 36 –
20,632 16,799 12,321 16,117 -1,082 10,763 – 12,475 833 – 19,692 15,605 10,579 11,273 -291 3,204 – 8,198 -618 – 21,515 17,641 13,011 14,190 519 5,819 – 11,882 453 – -1,823 -2,036 -2,432 -2,918 -811 -2,614 – -3,684 -1,071 –
940 1,194 1,742 4,844 -791 7,558 – 4,277 1,451 – 2,350 4,062 147 4,501 -2,354 1,190 – 4,061 1,323 –
-1,409 -2,868 1,595 343 1,564 6,368 – 216 128 – 0 0 0 0 -2,173 0 – 0 1,391 –
Cabo Verde

BANCO DE PORTUGAL • Economic Developments in Portuguese-speaking African Countries and Timor-Leste • 2016 | 201740
Tabl
e 2.
23 •
Mon
etar
y su
rvey
CVE
mill
ions
2012
2013
20
1420
1520
15 /
2014
2016
20
16 /
2015
2017
20
17p
/ 201
620
17
Est.
[1]
[2]
Prog
. Es
t. [1
] [2
] Pr
og.
[1]
[2]
Mar
.(b)
Exte
rnal
pos
ition
Fore
ign
asse
ts (n
et)
Banc
o de
Cab
o Ve
rde
Net
fore
ign
asse
ts
Oth
er a
sset
s (n
et)
Com
mer
cial
ban
ksM
ediu
m a
nd lo
ng-te
rm
liabi
litie
sD
omes
tic a
sset
s (n
et)
Tota
l dom
estic
cre
dit
Net
cla
ims
on g
ener
al
gove
rnm
ent
of w
hich
: on
Cent
ral g
ov.
inve
st. i
n TC
MF(a
)
Cred
it to
the
econ
omy
Stat
e-ow
ned
ente
rpris
es
Priv
ate
sect
or
Cred
it to
NM
FI
Oth
er it
ems
(net
)
Tota
l ass
ets
Broa
d m
oney
Base
mon
ey
Curr
ency
in c
ircul
atio
nD
eman
d de
posi
ts in
nat
iona
l cu
rren
cyQ
uasi
-mon
ey
Tota
l lia
bilit
ies
Sour
ces:
Banc
o de C
abo V
erde
, Inter
natio
nal M
oneta
ry Fu
nd an
d Ban
co de
Portu
gal c
alcula
tions
.No
tes:(a
) Offs
hore
fund
(Tru
st Fu
nd) t
o sup
port
the co
nver
sion o
f dom
estic
deb
t by i
ssuing
Títul
os Co
nsoli
dado
s de M
obiliz
ação
Fina
nceir
a (co
nsoli
dated
finan
cial m
obilis
ation
secu
rities
); (b
) Mar
ch 20
17 fig
ures
inclu
de d
ata fr
om N
ovo B
anco
SA.
(subje
ct to
a res
olutio
n mea
sure
on M
arch
8), to
be re
vised
whe
n the
aquir
ing ba
nk (C
ECV)
publi
shes
upda
ted in
forma
tion o
n its
oper
ation
s.[1
] Cha
nge f
rom
the en
d of th
e pre
vious
year
; [2]
chan
ge fr
om br
oad m
oney
at th
e end
of th
e pre
vious
year
(liqu
idity
expa
nsion
/con
tracti
on fa
ctors)
.
26,9
5836
,168
44,0
6149
,950
13.4
4.0
48,8
0159
,264
18.6
6.0
61,1
103.
11.
158
,193
28,3
1238
,101
46,0
3851
,915
12.8
4.0
– 60
,936
17.4
5.8
– –
–59
,810
32,8
6138
,360
46,4
6150
,079
7.8
2.5
–59
,773
19.4
6.3
––
–57
,996
32,7
7838
,280
46,3
7149
,998
7.8
2.5
48,4
3659
,692
19.4
6.3
63,4
766.
32.
357
,914
8380
9181
-10.
5-0
.0–
810.
00.
0–
––
81
-4,5
50-2
59-4
231,
836
-533
.81.
5–
1,16
3-3
6.7
-0.4
––
–1,
814
-1,3
54-1
,933
-1,9
77-1
,966
-0.6
0.0
–-1
,672
-14.
90.
2–
––
-1,6
17
95,6
3399
,912
101,
944
104,
637
2.6
1.8
111,
580
108,
245
3.4
2.3
115,
621
6.8
4.4
110,
284
116,
452
120,
795
123,
782
126,
413
2.1
1.8
133,
372
131,
083
3.7
3.0
138,
357
5.5
4.3
132,
911
22,8
5125
,285
28,3
5729
,494
4.0
0.8
33,1
4230
,685
4.0
0.8
34,7
4613
.22.
432
,008
12,1
8614
,362
17,4
3617
,387
-0.3
-0.0
–21
,598
24.2
2.7
––
–23
,444
11,1
9211
,192
11,1
9211
,192
0.0
0.0
–11
,192
0.0
0.0
––
–11
,192
93,6
0195
,510
95,4
2596
,919
1.6
1.0
100,
229
100,
398
3.6
2.3
103,
611
3.2
1.9
100,
903
824
865
840
3,15
327
5.4
1.6
–3,
344
6.1
0.1
––
– 3,
476
92,7
7794
,645
94,5
8593
,766
-0.9
-0.6
–97
,055
3.5
2.1
––
–97
,427
00
00
– –
00
– –
0–
–0
-20,
820
-20,
883
-21,
838
-21,
776
0.3
0.0
-21,
791
-22,
838
-4.9
-0.7
-22,
736
0.4
0.1
-22,
627
122,
590
136,
080
146,
005
154,
586
5.9
- 16
0,38
216
7,51
08.
4-
176,
731
5.5
- 16
8,47
7
122,
590
136,
080
146,
005
154,
586
5.9
5.9
160,
382
167,
510
8.4
8.4
176,
731
5.5
5.5
168,
477
32,5
7438
,427
45,7
7846
,749
2.1
0.7
–56
,433
20.7
6.3
––
–55
,658
7,88
68,
216
8,70
78,
967
3.0
0.2
–9,
207
2.7
0.2
––
–7,
429
33,1
8739
,566
45,4
6747
,503
4.5
1.4
–54
,309
14.3
4.4
––
–57
,220
81,5
1788
,298
91,8
3198
,116
6.8
4.3
–10
3,99
36.
03.
8–
––
103,
828
122,
590
136,
080
146,
005
154,
586
5.9
–16
0,38
216
7,51
08.
4–
176,
731
5.5
–16
8,47
7

41
Table 2.24 • Interest ratesAnnual rates, per cent
2011 2012 2013 2014 2015 2016 2017
Dec. Dec. Dec. Dec. Dec. Mar. Jun. Sep. Dec. Mar. May Jun.
Lending rates7-30 days
31-90 days
91-180 days
181 days-1year
1-2 years
2-5 years
5-10 years
Over 10 years
Overdraft
Deposit rates
Residents
7-30 days
31-90 days
91-180 days
181 days-1 year
1-2 years
Non-residents
7-30 days
31-90 days
91-180 days
181 days-1 year
1-2 years
Emigrants
7-30 days
31-90 days
91-180 days
181 days-1 year
1-2 years
Reference rates
BCV instruments
Rediscount
Liquidity provision
Liquidity absorption
TRM (14 days)
Treasury bills
91 days
182 days
364 days
Memo item:
Inflation (y-o-y % change)
Sources: Banco de Cabo Verde and Banco de Portugal calculations.Notes: Lending and deposit rates shown refer to effective interest rates by calculating average rates weighted by the amounts of credit/investments regarding lending/deposit operations applied to residents, non-residents and emigrants.
9.3 11.5 12.5 11.9 10.2 10.0 11.8 11.8 10.4 11.1 11.1 –
9.4 11.7 11.3 10.5 11.0 7.3 6.4 9.7 9.4 8.9 10.9 –
9.0 10.1 11.2 11.3 10.7 9.5 10.0 9.5 9.3 9.9 8.9 –
9.5 9.3 9.0 8.5 9.5 9.6 8.7 8.1 7.9 7.7 8.0 –
10.1 10.0 10.4 11.5 9.6 9.5 9.7 10.0 10.3 10.5 9.9 –
10.1 10.2 10.5 10.9 10.5 10.6 10.7 10.5 10.4 10.4 10.4 –
9.6 9.5 9.5 9.9 9.6 9.7 9.3 9.3 9.2 9.4 9.4 –
9.2 8.8 8.9 8.8 8.5 8.6 8.6 8.6 8.6 8.6 8.6 –
16.3 16.3 17.9 16.2 15.2 16.0 17.2 16.7 17.1 17.4 17.8 –
2.9 3.3 4.4 2.6 2.1 2.1 2.1 2.2 2.1 1.4 1.4 –
3.4 4.1 4.3 2.9 2.8 2.7 2.5 2.5 2.5 2.5 2.3 –
4.0 4.1 4.2 3.5 3.5 3.3 3.4 3.3 3.2 2.6 2.6 –
4.2 3.8 4.3 4.4 4.1 4.0 3.8 3.8 3.8 3.7 3.6 –
4.7 4.9 4.9 4.7 4.6 4.2 4.2 4.1 4.1 4.0 3.9 –
3.0 2.1 4.0 2.6 2.2 1.8 1.0 1.0 1.9 0.3 0.3 –
3.1 4.1 3.7 2.2 1.9 1.8 1.5 1.3 1.4 1.0 1.3 –
3.8 3.8 3.8 2.7 3.1 2.8 2.7 2.0 2.0 1.7 1.4 –
4.0 3.4 4.1 3.9 3.7 3.8 3.7 3.6 3.4 3.1 3.0 –
4.7 5.1 4.8 4.7 4.6 4.5 4.4 4.2 4.1 3.9 3.7 –
3.5 1.8 4.3 2.6 2.1 2.0 2.0 2.0 2.0 1.4 1.4 –
3.5 5.6 4.5 3.1 3.0 2.9 3.1 2.8 2.8 2.6 2.6 –
4.2 4.0 4.3 4.0 3.7 3.5 3.4 3.4 3.4 3.1 3.0 –
4.2 3.7 4.2 4.2 4.1 4.1 4.0 4.0 4.0 3.9 3.8 –
5.0 5.5 5.4 5.0 4.7 4.5 4.5 4.3 4.2 4.0 3.9 –
7.5 9.8 9.8 7.8 7.5 7.5 7.5 7.5 7.5 7.5 7.5 5,5
7.3 8.8 8.8 6.8 6.5 6.5 6.5 6.5 6.5 6.5 6.5 4,5
1.8 3.3 1.0 0.5 0.3 0.3 0.3 0.3 0.3 0.3 0.3 0,1
4.3 5.8 – 0.6 0.3 0.3 0.3 0.3 0.3 0.3 0.3 –
4.1 – – – – – – – – – – –
4.2 – – – – 0.6 – – – – – –
– 4.5 – – – – – – – – – –
3.6 4.1 0.1 -0.4 -0.5 -1.2 –2.3 -2.1 -0.3 0.5 0.3 –
Cabo Verde

BANCO DE PORTUGAL • Economic Developments in Portuguese-speaking African Countries and Timor-Leste • 2016 | 201742
Table 2.25 • Financial stability indicatorsPer cent
2012 2013 2014 2015 20162017
Mar.
Solvency
Capital adequacy(a)
Tier1/risk-weighted assets
Asset quality(b)
Non-performing loans/total loans
Impairment/non-performing loans
Provisions/non-performing loans
Return
Return on equity (ROE)
Return on assets (ROA)
Interest margin/gross income
Non-interest expenses/gross income
Liquidity(c)
Liquid assets/total assets
Liquid assets/short-term liabilities
Other indicators
General government deposits/total deposits
Emigrant deposits/total deposits
Private sector credit/total deposits
Personnel costs/operating costs
Interest spread, 1 to 2 years (asset – liability)
Interest spread, 1 to 2 years (emigrant deposits – euro area deposits)
Sources: Banco de Cabo Verde and Banco de Portugal calculations.Notes: (a) Regulatory capital/risk-weighted assets; (b) in accordance with IFRS/IAS definitions; (c) liquid assets include cash-in-vault and marketable securities, and short-term liabilities include demand deposits.
13.8 15.1 15.6 16.1 15.5 17.6 13.5 13.7 14.4 14.8 15.5 16.4
14.1 16.4 18.7 16.5 15.5 17.1 53.7 51.6 48.8 54.4 58.3 54.2 53.5 53.9 52.4 59.5 60.5 55.8
2.7 3.5 3.1 4.8 3.4 –0.2 0.3 0.2 0.4 0.2 –
75.5 75.3 71.8 73.1 76.7 77.2 68.3 68.4 72.5 66.9 67.7 66.8
15.0 21.2 19.9 21.9 24.0 23.4 21.1 27.9 24.4 26.8 29.0 27.9
9.7 11.4 13.5 12.6 14.5 15.3 37.1 33.4 32.9 33.3 32.1 32.1 79.1 67.5 61.5 59.5 55.6 54.3 56.1 55.3 54.8 56.6 58.9 61.5
5.2 5.5 6.8 5.0 6.2 6.5
2.9 3.8 4.2 4.1 4.0 3.4

43
Table 2.26 • Exchange ratesAverage rates
EERI(a)
Index: 100 = 2000
USD/CVE Nominal Real
20032004
2005
2006
2007
2008
2009
2010
2011
2012
2013
2014
2015
2016
2015 January
February
March
April
May
June
July
August
September
October
November
December
2016 January
February
March
April
May
June
July
August
September
October
November
December
2017 January
February
March
April
May
June
Sources: Banco de Cabo Verde and Banco de Portugal calculations.Notes: (a) Effective exchange rate index (EERI), calculated on the basis of official exchange rates applied to the currencies of Cabo Verde's four main trading partners over the 2010-14 period (appreciation: +; depreciation: -).
97.8 103.1 98.1
88.7 103.3 94.1
88.6 102.4 91.4
87.9 102.0 93.7
80.6 101.9 95.6
75.3 101.9 99.2
79.4 102.1 100.5
83.3 101.4 100.3
79.3 101.4 101.3
85.8 101.7 101.5
83.1 102.2 102.3
83.1 102.6 102.3
99.4 103.3 102.3
99.7 103.5 100.4
94.6 102.5 104.1
97.1 102.7 103.7
101.6 103.0 102.0
102.5 102.8 101.1
98.8 103.0 101.0
98.4 103.1 101.1
100.2 103.2 101.8
99.1 103.6 102.7
98.3 104.1 103.1
98.1 104.1 102.8
102.5 103.7 102.5
101.5 103.9 102.7
101.6 104.1 103.4
99.5 104.1 103.1
99.5 103.8 101.0
97.3 103.7 100.5
97.4 103.7 100.2
98.2 103.5 98.7
99.6 103.3 99.0
98.3 103.2 99.6
98.4 103.3 99.4
99.9 103.1 99.5
102.1 103.2 99.8
104.6 103.2 100.4
104.0 103.0 100.0
103.5 102.9 100.2
103.1 102.9 99.0
103.0 102.9 98.0
99.9 103.2 98.6
98.3 103.3 –
Cabo Verde

2.3. Guinea-BissauArea: 36,125 Km2
Capital: Bissau
Population: 1.8 million (2016; source: UN)
Currency: CFA franc (XOF)
The economic recovery in Guinea-Bissau continued in 2016, despite the ongoing political uncertainty in the country. The production of cashew nuts reached record highs, benefiting from an increase in their international price. The external accounts and public finances deteriorated, in both cases mainly owing to a reduction in grants from development partners. Despite remaining in positive territory, inflation has been slowing down since the second half of 2016. The IMF adjustment programme resumed, following the reversal of the bank bailouts that occurred in 2015. The financial system still faces significant challenges.
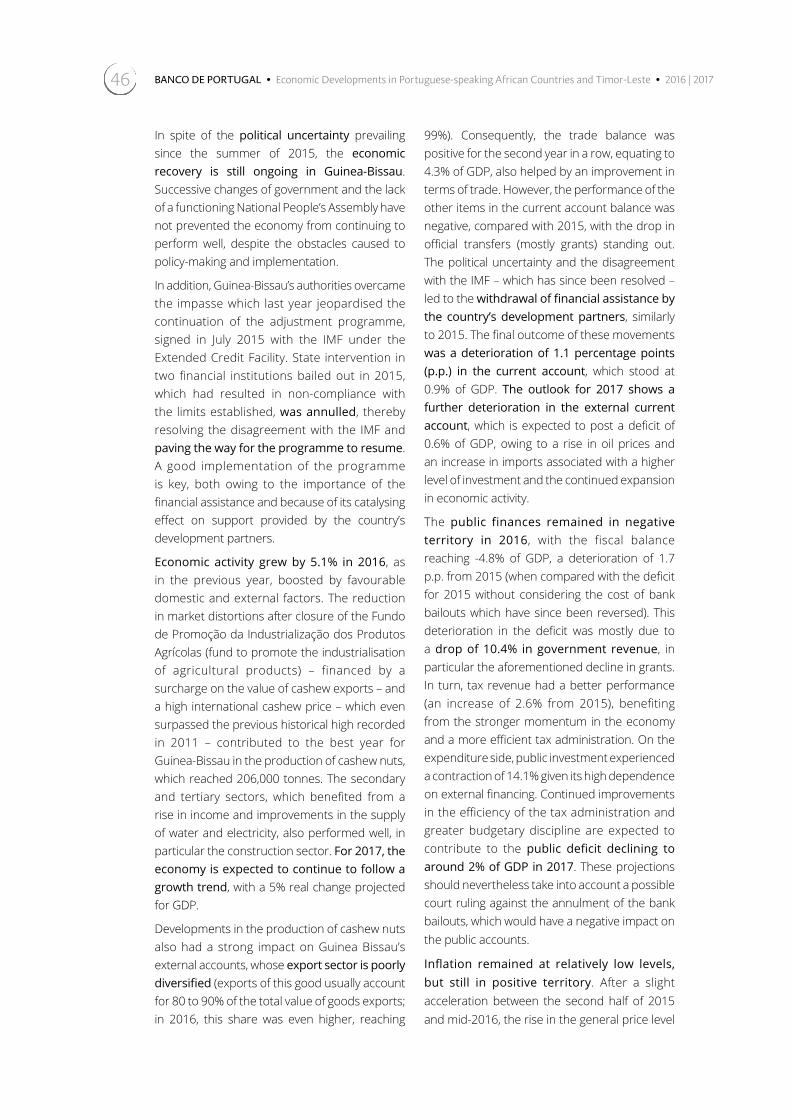
BANCO DE PORTUGAL • Economic Developments in Portuguese-speaking African Countries and Timor-Leste • 2016 | 201746
In spite of the political uncertainty prevailing since the summer of 2015, the economic recovery is still ongoing in Guinea-Bissau. Successive changes of government and the lack of a functioning National People’s Assembly have not prevented the economy from continuing to perform well, despite the obstacles caused to policy-making and implementation.
In addition, Guinea-Bissau’s authorities overcame the impasse which last year jeopardised the continuation of the adjustment programme, signed in July 2015 with the IMF under the Extended Credit Facility. State intervention in two financial institutions bailed out in 2015, which had resulted in non-compliance with the limits established, was annulled, thereby resolving the disagreement with the IMF and paving the way for the programme to resume. A good implementation of the programme is key, both owing to the importance of the financial assistance and because of its catalysing effect on support provided by the country’s development partners.
Economic activity grew by 5.1% in 2016, as in the previous year, boosted by favourable domestic and external factors. The reduction in market distortions after closure of the Fundo de Promoção da Industrialização dos Produtos Agrícolas (fund to promote the industrialisation of agricultural products) – financed by a surcharge on the value of cashew exports – and a high international cashew price – which even surpassed the previous historical high recorded in 2011 – contributed to the best year for Guinea-Bissau in the production of cashew nuts, which reached 206,000 tonnes. The secondary and tertiary sectors, which benefited from a rise in income and improvements in the supply of water and electricity, also performed well, in particular the construction sector. For 2017, the economy is expected to continue to follow a growth trend, with a 5% real change projected for GDP.
Developments in the production of cashew nuts also had a strong impact on Guinea Bissau’s external accounts, whose export sector is poorly diversified (exports of this good usually account for 80 to 90% of the total value of goods exports; in 2016, this share was even higher, reaching
99%). Consequently, the trade balance was positive for the second year in a row, equating to 4.3% of GDP, also helped by an improvement in terms of trade. However, the performance of the other items in the current account balance was negative, compared with 2015, with the drop in official transfers (mostly grants) standing out. The political uncertainty and the disagreement with the IMF – which has since been resolved – led to the withdrawal of financial assistance by the country’s development partners, similarly to 2015. The final outcome of these movements was a deterioration of 1.1 percentage points (p.p.) in the current account, which stood at 0.9% of GDP. The outlook for 2017 shows a further deterioration in the external current account, which is expected to post a deficit of 0.6% of GDP, owing to a rise in oil prices and an increase in imports associated with a higher level of investment and the continued expansion in economic activity.
The public finances remained in negative territory in 2016, with the fiscal balance reaching -4.8% of GDP, a deterioration of 1.7 p.p. from 2015 (when compared with the deficit for 2015 without considering the cost of bank bailouts which have since been reversed). This deterioration in the deficit was mostly due to a drop of 10.4% in government revenue, in particular the aforementioned decline in grants. In turn, tax revenue had a better performance (an increase of 2.6% from 2015), benefiting from the stronger momentum in the economy and a more efficient tax administration. On the expenditure side, public investment experienced a contraction of 14.1% given its high dependence on external financing. Continued improvements in the efficiency of the tax administration and greater budgetary discipline are expected to contribute to the public deficit declining to around 2% of GDP in 2017. These projections should nevertheless take into account a possible court ruling against the annulment of the bank bailouts, which would have a negative impact on the public accounts.
Inflation remained at relatively low levels, but still in positive territory. After a slight acceleration between the second half of 2015 and mid-2016, the rise in the general price level

47
was considerably more subdued, despite the continued and robust economic recovery. The year-on-year inflation rate in 2016 stood at 1.6% (0.9 p.p. points less than in 2015), compared with 3% in July of the same year, the highest level in more than four years. This slowdown in inflation in 2016 is in contrast to the behaviour observed in the previous year, when the year-on-year inflation rate increased by 2.5 p.p.. The short-term outlook for developments in prices points to a slight increase in inflation, to close to 2%, reflecting expectations of a small recovery in international oil prices.
Guinea-Bissau’s financial system still faces considerable challenges. With the reversal of the two bank bailouts that occurred in 2015, non-performing loans returned to high levels, standing at 19.4% at the end of the first quarter of 2017. In addition, the two institutions in question put in place significant provisions, which markedly reduced their solvency ratios. This led to a need to increase own funds, which
is not guaranteed in one of the institutions. Bank profitability remains low, with return on assets standing at 2.8%.
Broad money expanded further in 2016, but at a significantly slower pace than in the past few years (a change of 7.7% from 2015). The main contribution to this expansion in liquidity came from an accumulation of foreign exchange reserves by commercial banks. Considering that the economy was performing well and a regional bank started its activities in the country, the 10.5% increase in credit to the economy was modest, reflecting the lack of bankable projects.
As a result of the currency peg between the CFA franc and the euro, the behaviour of the exchange rate against the Indian rupee was crucial to developments in external competitiveness. Therefore, the depreciation against this currency resulted in a slight gain in nominal competitiveness in 2016.
Table 2.27 • Table 27 • Main economic indicators
2013 2014 2015 2016 2017
Est. Est. Proj.
Real GDP (annual % change) 3.3 1.0 5.1 5.1 5.0
-0.1 -0.1 2.4 1.6 –
14.8 29.2 25.4 7.7 5.0
-5.0 0.6 2.1 0.9 -0.6
-1.8 -2.6 -3.0 -4.8 -1.9
31.2 33.3 31.4 – –
Inflation (year-on-year % change)
Broad money (annual % change)
Current account (% of GDP)
Fiscal balance (% of GDP)
External public debt (% of GDP)
Sources (for the subsequent charts also): BCEAO National Directorate for Guinea-Bissau, Ministry of Economy and Finance of Guinea-Bissau, National Statistics Institute of Guinea-Bissau, European Central Bank and International Monetary Fund.
Guinea-Bissau
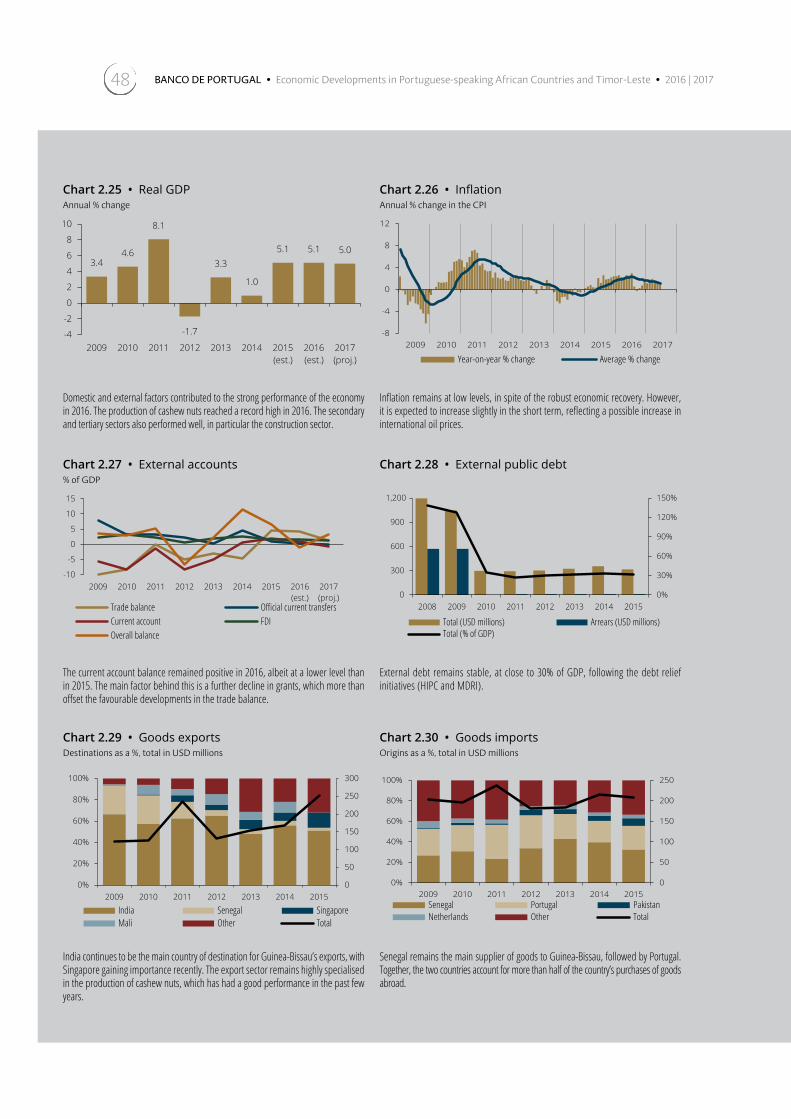
BANCO DE PORTUGAL • Economic Developments in Portuguese-speaking African Countries and Timor-Leste • 2016 | 201748
Chart 2.25 • Real GDP Annual % change
Chart 2.26 • Inflation Annual % change in the CPI
3.44.6
8.1
-1.7
3.3
1.0
5.1 5.1 5.0
-4
-2
0
2
4
6
8
10
2009 2010 2011 2012 2013 2014 2015(est.)
2016(est.)
2017(proj.)
-8
-4
0
4
8
12
2009 2010 2011 2012 2013 2014 2015 2016 2017
Year-on-year % change Average % change
Domestic and external factors contributed to the strong performance of the economy in 2016. The production of cashew nuts reached a record high in 2016. The secondary and tertiary sectors also performed well, in particular the construction sector.
Inflation remains at low levels, in spite of the robust economic recovery. However, it is expected to increase slightly in the short term, reflecting a possible increase in international oil prices.
Chart 2.27 • External accounts % of GDP
Chart 2.28 • External public debt
-10
-5
0
5
10
15
2009 2010 2011 2012 2013 2014 2015 2016(est.)
2017(proj.)
Trade balance Official current transfersCurrent account FDIOverall balance
0%
30%
60%
90%
120%
150%
0
300
600
900
1,200
2008 2009 2010 2011 2012 2013 2014 2015
Total (USD millions) Arrears (USD millions)Total (% of GDP)
The current account balance remained positive in 2016, albeit at a lower level than in 2015. The main factor behind this is a further decline in grants, which more than offset the favourable developments in the trade balance.
External debt remains stable, at close to 30% of GDP, following the debt relief initiatives (HIPC and MDRI).
Chart 2.29 • Goods exports Destinations as a %, total in USD millions
Chart 2.30 • Goods imports Origins as a %, total in USD millions
0
50
100
150
200
250
300
0%
20%
40%
60%
80%
100%
2009 2010 2011 2012 2013 2014 2015
India Senegal SingaporeMali Other Total
0
50
100
150
200
250
0%
20%
40%
60%
80%
100%
2009 2010 2011 2012 2013 2014 2015Senegal Portugal PakistanNetherlands Other Total
India continues to be the main country of destination for Guinea-Bissau’s exports, with Singapore gaining importance recently. The export sector remains highly specialised in the production of cashew nuts, which has had a good performance in the past few years.
Senegal remains the main supplier of goods to Guinea-Bissau, followed by Portugal. Together, the two countries account for more than half of the country’s purchases of goods abroad.

49
Chart 2.31 • Government revenue % of GDP
Chart 2.32 • Government expenditure % of GDP
0
10
20
30
2009 2010 2011 2012 2013 2014 2015(est.)
2016(est.)
2017(budg.)
Tax revenue Non-tax revenue Grants
05
1015202530
2009 2010 2011 2012 2013 2014 2015(est.)
2016(est.)
2017(budg.)
Compensation of employees Goods and servicesTransfers InvestmentInterest and other expend.
Tax revenue continued to benefit from the economic recovery of 2016. In turn, the performance of the other revenue components has been below expectations, to a large extent as a result of the country’s political uncertainty.
Government expenditure continues to follow a downward path, reflecting a greater cost containment effort. The contraction in external financing (in the form of grants and loans) to public investment projects explains the decline in this expenditure component.
Chart 2.33 • Public accounts % of GDP
Chart 2.34 • Financial stability indicators
-15
-10
-5
0
5
2009 2010 2011 2012 2013 2014 2015(est.)
2016(est.)
2017(budg.)
Current balance Overall balance excl. grantsOverall balance
0%
10%
20%
30%Capital adequacy
Tier 1 ratio
Non-performingloans (% of total
loans)
Provisions (% of totalcredit)
Return on equity
Return on assets
2012 2014 2016
The public deficit increased further in 2016, mostly owing to a decline in revenue. The decline in grants of 31% from 2015 was the main factor behind these developments.
Guinea-Bissau’s financial system faces serious challenges following the reversal of the State intervention in two institutions in 2015. The level of non-performing loans remains high (19.4% at the end of the first quarter of 2017) and business profitability remains low.
Chart 2.35 • Liquidity expansion/contraction factorsChanges in % of initial stock of broad money
Chart 2.36 • Effective exchange rateIndexes: 100 = 2000, monthly averages
-25
0
25
50
2009 2010 2011 2012 2013 2014 2015 2016(est.)
2017(proj.)
Net foreign assets Credit to the economyNet claims on government Other assets (net)Broad money
85
95
105
115
125
135
2009 2010 2011 2012 2013 2014 2015 2016 2017
Nominal index Real index
(appreciation: +; depreciation: -)
Broad money recorded an expansion of 7.7% in 2016, mostly as a result of an accumulation of foreign exchange reserves. In spite of the economic recovery, the expansion of credit to the economy has been modest, reflecting a lack of economically viable projects.
The slight gains in nominal and real competitiveness obtained in 2016 were both the result of an appreciation of 1.2% in the Indian rupee against the CFA franc and a stronger inflationary pace in that country.
Guinea-Bissau

BANCO DE PORTUGAL • Economic Developments in Portuguese-speaking African Countries and Timor-Leste • 2016 | 201750
Table 2.28 • Economic indicators
2012 2013 20142015 2016 2017
Est. Proj. Est. Proj. Est.
Output and pricesNominal GDP XOF billions 505.1 516.7 529.7 600.9 639.9 682.9 734.1 –
770.0 787.6 807.5 916.0 975.5 1,041.1 1,119.1 –-1.7 3.3 1.0 5.1 4.8 5.1 5.0 –1.7 -0.1 -0.1 2.4 2.5 1.6 – 0.9 Jun.2.1 0.7 -1.0 1.4 2.6 1.7 2.6 1.2 Jun.
11.5 11.4 21.7 20.8 20.7 16.4 17.3 –
13.8 13.2 24.3 23.8 22.1 21.2 19.2 –
-2.3 -1.8 -2.6 -3.0 -1.4 -4.8 -1.9 –-4.7 -5.2 -11.9 -9.7 -7.5 -8.8 -6.0 –
88.6 2.6 -28.6 422.6 – 11.2 5.5 –27.2 3.6 -20.7 13.3 – 10.5 3.6 –-6.0 14.8 29.2 25.4 – 7.7 5.0 –
4.3 4.5 3.7 3.3 – 3.5 – –9.8 9.4 9.1 8.5 – 9.1 – –
23.7 22.7 20.1 19.3 – 20.2 – –6.4 11.6 25.7 6.2 – 6.4 – –
18.0 17.9 17.5 17.5 – 16.5 – –
-41.4 20.8 11.4 63.1 -14.4 6.0 10.1 –
-19.1 2.8 22.6 19.2 1.2 8.3 13.2 –-8.4 -5.0 0.6 2.1 -1.7 0.9 -0.6 –
-10.8 -5.4 -3.9 1.0 -2.9 0.6 -0.6 –
302.7 326.0 356.7 318.6 – – – –30.6 31.2 33.3 31.4 – – – –
197.7 170.6 167.7 109.8 – – – –0.5 0.9 1.5 2.2 – – – –
656.0 656.0 656.0 656.0 – 656.0 – 656.0 Jul.
510.5 494.1 494.4 591.4 – 588.1 – 601.0 Jul.
1.3 6.3 -3.3 -2.4 – -0.4 – 1.3 Jul.
-0.5 4.5 -6.1 -2.3 – -1.0 – 0.6 Jun.
EUR millionsReal GDP Annual % changeInflation (Consumer Price Index) Year-on-year % change
Average % change
Public financesTotal revenue % of GDPTotal expenditure % of GDPOverall balance % of GDPOverall balance excl. grants % of GDP
Money and creditNet claims on government Annual % changeCredit to the economy Annual % changeBroad money (M2) Annual % change
Interest ratesDeposit, 6 months to 1 year Annual rateLending, 6 months to 1 year Annual rate
Financial stabilityCapital adequacy PercentageNon-performing loans PercentageReturn on equity Percentage
Balance of paymentsExports f.o.b. Annual % changeImports f.o.b. Annual % changeCurrent account % of GDPCurrent account excl. official transfers
% of GDP
External debtTotal stock USD millions
% of GDP% of exports(a)
Debt service % of exports(a)
Exchange ratesBilateral rate EUR/XOF (official market)
Average rate
Bilateral rate USD/XOF (official market)
Average rate
Nominal EERI (Index: 100 = 2000)(b)
Annual % change
Real EERI (Index: 100 = 2000)(b) Annual % change
Sources: BCEAO National Directorate for Guinea-Bissau, Ministry of Economy and Finance of Guinea-Bissau, National Statistics Institute of Guinea-Bissau, European Central Bank, International Monetary Fund and Banco de Portugal calculations.Notes: (a) Exports of goods and services; (b) Effective Exchange Rate Index (EERI) calculated on the basis of official exchange rates applied to the currencies of Guinea-Bissau's four main trading partners in the 2010/14 period.

51
Table 2.29 • Gross domestic productCurrent prices, billions of CFA francs
2012 2013 20142015 2016 2017
Est. Proj. Est. Proj.
Primary sector
Agriculture, forestry and fishing
Secondary sector
Agri-food
Industry(a)
Construction
Tertiary sector
Trade, restaurants and hotels
Transportation and communication
Public administration
Other services
FISIM (financial intermed. servs. indirectly measured)
Gross Domestic Product (at factor cost)
Indirect taxes and subsidies
Gross Domestic Product (at market prices)
Consumption
Public
Private
Investment
Gross fixed capital formation
Public
Private
Changes in inventories
Domestic demand
Exports of goods and services
Overall demand
Imports of goods and services
Memo items:
Gross domestic savings
Nominal GDPmp (USD millions)
GDPmp deflator (annual % change)
Nominal GDPmp (annual % change)
Real GDPmp (annual % change)
Sources: BCEAO National Directorate for Guinea-Bissau, International Monetary Fund and Banco de Portugal calculations.Note: (a) Includes electricity and water.
236.8 228.0 217.9 233.8 242.1 – –
236.8 228.0 217.9 233.8 242.1 – –
68.4 74.5 80.1 88.1 102.5 – –
55.6 59.9 62.9 69.2 79.6 – –
8.9 8.1 9.4 10.8 13.7 – –
3.8 6.5 7.8 8.0 9.2 – –
181.4 197.0 211.0 255.9 271.1 – –
95.0 111.3 115.2 155.5 163.3 – –
26.1 26.3 26.3 27.5 30.3 – –
42.6 43.4 53.1 55.7 59.6 – –
28.5 26.2 25.8 26.9 27.8 – –
-10.9 -10.2 -9.3 -9.8 -9.8 – –
486.6 499.6 509.0 577.7 615.8 – –
18.5 17.1 20.7 23.2 24.1
505.1 516.7 529.7 600.9 639.9 682.9 734.1
519.4 520.8 548.1 584.3 642.2 – –
65.8 65.5 91.9 88.6 94.7 – –
453.6 455.4 456.2 495.7 547.6 – –
37.3 34.8 39.9 39.9 47.9 – –
33.1 29.4 34.5 34.5 42.6 – –
10.5 15.8 20.5 18.7 25.7 – –
22.6 13.7 14.0 15.9 16.9 – –
4.1 5.3 5.3 5.3 5.3 – –
556.7 555.6 588.0 624.2 690.1 – –
78.2 94.4 105.2 171.6 146.9 – –
634.8 650.1 693.2 795.8 837.1 – –
129.8 133.4 163.5 194.9 197.2 – –
-14.3 -4.2 -18.4 16.6 -2.4 – –
989.3 1,045.7 1,071.4 1,016.0 1,136.0 1,155.0 1,166.0
-0.9 -0.9 1.5 -10.2 1.6 8.1 2.4
-2.5 2.3 2.5 -5.6 6.5 13.6 7.5
-1.7 3.3 1.0 5.1 4.8 5.1 5.0
Guinea-Bissau

BANCO DE PORTUGAL • Economic Developments in Portuguese-speaking African Countries and Timor-Leste • 2016 | 201752
Table 2.30 • Consumer price indexPer cent
Monthly change Cumulative change Year-on-year change Average change
[1] [2] [3] [4]
2003 December
2004 December2005 December
2006 December
2007 December
2008 December
2009 December
2010 December
2011 December
2012 December
2013 December
2014 December
2015 December
2016 December
2015 January
FebruaryMarch
April
May
June
July
August
September
October
November
December
2016 January
February
March
April
May
June
July
August
September
October
November
December
2017 January
February
March
April
May
June
Sources: BCEAO National Directorate for Guinea-Bissau, National Statistics Institute of Guinea-Bissau and Banco de Portugal calculations.Notes: [1] month (n) / month (n-1); [2] month (n) / previous December; [3] month (n) / month (n) of the previous year; [4] last 12 months / previous 12 months.
– 0.7 0.7 -5.0
– 2.9 2.9 0.9
– 0.3 0.3 3.4
– 3.2 3.2 2.0
– 9.3 9.3 4.6
– 6.6 6.6 7.9
– -4.5 -4.5 -2.4
– 5.6 5.6 2.3
– 3.4 3.4 5.0
– 1.7 1.7 2.1
– -0.1 -0.1 0.7
– -0.1 -0.1 -1.0
– 2.4 2.4 1.4
– 1.6 1.6 1.7
0.1 0.1 0.3 -1.0
-1.2 -1.1 0.5 -0.7
-0.1 -1.2 0.8 -0.5
0.4 -0.8 0.4 -0.3
0.4 -0.4 0.4 -0.2
1.0 0.6 2.1 0.2
1.1 1.7 1.2 0.3
1.6 3.3 2.6 0.6
0.2 3.5 1.8 0.8
0.0 3.5 1.9 1.0
-0.3 3.2 2.2 1.2
-0.7 2.4 2.4 1.4
0.1 0.1 2.4 1.6
-1.0 -0.9 2.6 1.8
-0.4 -1.3 2.3 1.9
0.2 -1.1 2.2 2.0
0.9 -0.2 2.6 2.2
0.9 0.7 2.5 2.2
1.6 2.2 3.0 2.4
-0.8 1.4 0.6 2.2
-0.6 0.7 -0.3 2.0
0.5 1.3 0.3 1.9
0.2 1.5 0.7 1.8
0.1 1.6 1.6 1.7
-0.3 -0.3 1.1 1.6
-0.3 -0.6 1.9 1.5
-0.3 -0.9 1.9 1.5
-0.4 -1.3 1.4 1.4
0.8 -0.5 1.3 1.3
0.5 0.0 0.9 1.2

53
Table 2.31 • Balance of paymentsBillions of CFA francs
2012 2013 2014 20152016 2017
Proj. Est. Proj.
Current accountExcluding official transfers
Trade balanceExports (f.o.b.)
of wich: Cashew nutsImports (f.o.b.)
ServicesIncomeCurrent transfers
PublicPrivate
Capital and financial accountCapital account
Capital transfersFinancial account
General government – Medium / long-term loans
of which: Disbursementsof which: Amortisation
Other assets (net)of which: Foreign direct investmentof which: Other investment – Other sectors
Errors and omissions
Overall balanceFinancing
Change in official reserves (increase: - )(a)
Debt relief
Sources: BCEAO National Directorate for Guinea-Bissau, International Monetary Fund and Banco de Portugal calculations.Note: (a) Includes the effects of exchange rate fluctuations.
-42.5 -25.8 3.1 12.4 -11.2 6.3 -4.3-54.4 -27.7 -20.5 5.9 -18.3 4.0 -4.3-25.7 -14.8 -23.9 26.9 -8.3 29.7 9.867.1 75.5 82.0 149.2 127.8 162.7 179.160.0 60.9 68.1 133.6 115.2 161.1 177.4
-92.8 -90.3 -105.9 -122.3 -136.1 -133.0 -169.3-25.9 -24.2 -34.4 -55.9 -42.0 -58.8 -48.4-16.9 -4.0 18.5 15.0 8.6 13.8 14.026.0 17.1 42.9 26.4 30.5 21.6 20.311.9 1.9 23.6 6.5 7.1 2.3 0.014.1 15.3 19.3 19.9 23.4 19.3 20.3
14.1 31.7 51.7 33.3 23.4 -9.3 27.0
15.9 15.8 27.4 35.4 28.1 27.4 30.315.9 15.8 27.4 35.4 28.1 27.4 30.3-1.8 15.9 24.3 -2.1 -4.7 -36.7 -3.37.6 12.4 10.2 9.0 11.9 10.2 14.4
7.6 12.5 13.1 10.0 13.3 13.5 15.4-0.0 -0.1 -2.9 -1.0 -1.4 -3.3 -1.0-9.3 3.5 14.1 -11.1 -16.6 -46.8 -17.73.5 9.7 12.9 10.6 13.2 10.1 8.9
-12.8 -6.2 1.2 -21.7 -30.0 -56.9 -26.6-4.8 5.0 6.1 -6.5 0.0 -3.5 0.0
-33.2 10.9 60.9 39.3 12.2 -6.4 22.6
33.2 -10.9 -60.9 -39.3 -12.2 6.4 -22.6
33.2 -10.9 -63.9 -39.3 -12.2 6.4 -22.6
0.0 0.0 3.0 0.0 0.0 0.0 0.0
Guinea-Bissau

BANCO DE PORTUGAL • Economic Developments in Portuguese-speaking African Countries and Timor-Leste • 2016 | 201754
Table 2.32 • Goods exportsBy country of destination, as a percentage of total
2010 2011 2012 2013 2014 2015 2010 to 2015
ChinaCôte d'Ivoire
India
Mali
Portugal
Senegal
Singapore
Togo
VietnamOther
Sources: BCEAO National Directorate for Guinea-Bissau and Banco de Portugal calculations.
Table 2.33 • Goods importsBy country of origin, as a percentage of total
2010 2011 2012 2013 2014 2015 2010 to 2015
Brazil 3.4 2.5 1.3 1.0 0.8 0.8 1.6
1.3 0.4 0.4 0.2 0.3 0.3 0.5
1.3 2.8 1.8 1.9 3.9 3.3 2.6
8.2 5.0 3.3 0.7 1.3 0.9 3.2
4.0 3.5 3.3 3.5 3.6 3.4 3.6
2.0 1.4 5.4 4.9 5.0 7.3 4.4
24.0 32.0 33.0 25.5 21.5 23.2 26.4
28.8 22.6 34.4 44.6 41.2 32.4 33.6
0.8 1.0 0.1 0.1 0.5 1.0 0.6
26.2 28.8 17.0 17.6 22.0 27.3 23.6
Côte d'Ivoire
France
Netherlands
Pakistan
Portugal
Senegal
Spain
Thailand
Other
Sources: BCEAO National Directorate for Guinea-Bissau and Banco de Portugal calculations.
Table 2.34 • External public debt USD millions
2011 2012 2013 2014 2015
Medium and long-term debt 292.0 301.7 325.0 355.7 317.7
113.7 135.0 152.7 183.6 173.8178.2 166.7 172.2 172.1 143.9
1.1 1.1 1.0 1.0 0.8
293.1 302.7 326.0 356.7 318.6
8.1 7.6 7.9 7.9 8.30.9 0.8 1.6 3.2 6.40.6 0.6 0.6 0.6 2.90.3 0.2 1.1 2.6 3.6
Multilateral creditorsBilateral creditors
Short-term debt
Total external debtof which: Arrears
Scheduled medium and long-term debt servicePrincipalInterest
(% of exports of goods and services)Total external debt 104.9 197.7 170.6 167.7 109.8
0.3 0.5 0.9 1.5 2.20.2 0.4 0.3 0.3 1.00.1 0.1 0.6 1.2 1.2
Scheduled medium and long-term debt servicePrincipalInterest
(% of GDP)Total external debt 27.0 30.6 31.2 33.3 31.4
Sources: BCEAO National Directorate for Guinea-Bissau, International Monetary Fund and Banco de Portugal calculations.
0.9 0.7 0.8 1.7 2.7 14.2 4.80.0 0.5 0.4 2.8 0.0 0.0 0.6
57.2 66.4 68.7 52.5 60.0 51.2 58.6
8.9 6.3 10.5 8.3 10.8 0.0 6.4
1.7 0.7 0.1 0.1 1.0 0.0 0.5
26.2 16.3 5.4 4.8 4.6 2.5 9.0
0.8 6.7 5.5 9.5 8.5 14.5 8.7
0.0 0.0 5.4 8.4 0.0 0.0 1.8
0.0 0.3 0.0 7.3 3.6 5.9 3.2
4.2 2.1 3.2 4.6 8.7 11.7 6.4

55
Table 2.35 • Government operationsBillions of CFA francs
2012 2013 20142015 2016 2017
Est. Budg. Est. l.e.(a) Proj.
1. Total revenue1.1.Current revenue
Non-tax revenue
Tax revenue
1.2. Grants
of which: Projects
of which: Budget support
2. Total expenditure 2.1. Current expenditure
Compensation of employees
Goods and services
Transfers
Scheduled debt interest
Other expenditure
2.2. Capital expenditure
Domestic financing
External financing
3. Current balance: (1.1.) - (2.1.)
4. Overall balance excl. grants: (1.) - (2.) - (1.2.)
5. Overall balance: (1.) - (2.) (commitment basis)
6. Change in arrears6.1. Domestic
6.2. External
7. Items in transit, errors and omissions
8. Overall balance: (5.) + (6.) + (7.) (cash basis)
9. Financing9.1. Domestic (net)
of which: Banking system
9.2. External (net)
of which: Disbursements
of which: Amortisation
of which: Debt relief
10. Financing gap(b)
Sources: BCEAO National Directorate for Guinea-Bissau, Ministry of Economy and Finance of Guinea-Bissau, International Monetary Fund and Banco de Portugal calculations.Notes: (a) Level of budget execution: as a percentage of budgeted amounts; (b) Net borrowing (-) / net lending (+).
58.1 58.9 115.0 125.0 132.3 112.0 84.7 127.1
46.0 41.1 65.5 84.8 93.1 84.3 90.5 97.1
7.1 5.7 21.4 22.9 24.3 20.8 85.6 28.4
38.9 35.4 44.2 61.9 68.8 63.5 92.3 68.6
12.1 17.8 49.5 40.1 39.2 27.6 70.4 30.1
3.1 13.8 26.2 34.5 27.9 27.4 98.2 30.1
9.1 4.0 23.3 5.6 11.3 0.3 2.7 0.0
69.5 68.0 128.7 143.3 141.3 144.5 102.3 141.2
62.3 49.7 89.2 93.7 90.0 102.0 113.4 93.8
25.1 24.3 32.3 31.8 34.6 34.8 100.6 34.9
12.8 9.0 11.0 16.2 – 12.0 – 15.3
12.8 12.6 14.5 18.9 17.8 28.3 159.0 28.8
0.1 0.4 2.7 4.6 3.2 5.1 161.5 3.1
11.4 3.5 28.7 22.1 34.4 21.9 63.7 11.7
7.2 18.3 39.5 49.5 51.3 42.5 82.8 47.4
0.7 0.0 0.2 4.9 – 1.6 – 2.0
6.5 18.3 39.2 44.6 – 40.9 – 45.4
-16.3 -8.6 -23.7 -8.9 3.1 -17.7 – 3.3
-23.5 -26.9 -63.1 -58.4 -48.2 -60.1 – -44.2
-11.4 -9.2 -13.7 -18.3 -9.0 -32.5 – -14.1
3.5 9.7 -1.8 -6.1 0.0 -1.5 – -4.4
3.5 9.7 -1.8 -5.2 0.0 -2.1 – -3.8
0.0 0.0 0.0 -0.9 0.0 0.6 – -0.6
-5.8 -9.9 -0.7 1.6 0.0 5.5 – 2.0
-13.7 -9.4 -16.2 -22.7 -9.0 -28.5 – -16.5
13.7 9.4 16.2 22.7 8.3 28.5 – 16.5
9.0 4.9 3.4 13.8 -3.6 19.0 – 5.1
9.0 4.9 3.4 13.8 -3.6 19.0 – 5.1
4.6 4.5 12.8 8.9 11.9 9.5 – 11.4
5.1 4.6 13.1 10.0 30.4 13.5 – 15.4
-0.5 -0.1 -3.3 -1.1 -18.5 -4.0 – -3.9
0.0 0.0 3.0 0.0 0.0 0.0 – 0.0
0.0 0.0 0.0 0.0 -0.7 0.0 – 0.0
Guinea-Bissau

BANCO DE PORTUGAL • Economic Developments in Portuguese-speaking African Countries and Timor-Leste • 2016 | 201756
Table 2.36 • Monetary surveyBillions of CFA francs
2012 2013 2014 20152016 2016/2015 2017 2017/2016
Est. [1] [2] Proj. [1] [2]
Net foreign assetsCentral Bank
Commercial banks
Total domestic credit
Net claims on government
Credit to the economy
Other assets (net)
Total assets
Broad money (M2)
Currency in circulation
Deposits
Total liabilities
Sources: BCEAO National Directorate for Guinea-Bissau, International Monetary Fund and Banco de Portugal calculations.Notes: [1] Percentage change from the end of the previous year; [2] Changes in percentage of initial stock of broad money (liquidity expansion/contraction factors).
Table 2.37 • Interest ratesAnnual rates, per cent
2012 2013 2014 2015 2016
Dec. Dec. Dec. Dec. Dec.
Deposits
4.5 4.8 4.8 4.8 4.3
4.9 4.7 4.6 4.7 4.75.1 3.7 4.3 4.2 3.64.3 4.5 3.7 3.3 3.5
4.5 4.6 4.5 3.3 3.6
2.7 5.3 4.5 3.5 5.3
3.5 5.0 – – –
– 4.3 3.6 3.5 3.7
11.6 9.7 11.5 11.1 8.7
1.4 9.9 9.5 9.1 8.0
10.0 9.9 9.5 9.5 8.8
9.8 9.4 9.1 8.5 9.1
9.5 9.1 9.3 10.1 10.6
7.9 9.0 9.4 9.8 10.6
9.6 8.7 5.9 8.7 8.4
5.5 3.1 7.6 7.8 3.0
3.0 2.5 2.5 2.5 2.5
5.0 5.0 5.0 5.0 5.0
1.7 -0.1 -0.1 2.4 1.6
Up to 1 month
1 to 3 months
3 to 6 months
6 months to 1 year
1 to 2 years
2 to 5 years
5 to 10 years
Not determined
CreditUp to 1 month
1 to 3 months
3 to 6 months
6 months to 1 year
1 to 2 years
2 to 5 years
5 to 10 years
Over 10 years
Central Bank operationsBanking system
Discount rate
Reserve ratio
Memo item:
Inflation (y-o-y % change)
Sources: BCEAO National Directorate for Guinea-Bissau and International Monetary Fund.
84.5 94.9 151.8 167.4 202.1 20.7 11.5 224.8 11.2 7.0
65.0 72.1 120.3 159.5 153.1 -4.0 -2.1 175.8 14.8 7.0
19.5 22.8 31.6 7.9 49.0 520.3 13.6 49.0 0.0 0.0
85.4 88.3 68.3 140.8 156.2 10.9 5.1 163.6 4.7 2.3
21.1 21.7 15.5 81.0 90.1 11.2 3.0 95.1 5.5 1.5
64.2 66.6 52.8 59.8 66.1 10.5 2.1 68.5 3.6 0.7
-7.1 3.8 21.3 -5.3 -31.9 – -8.8 -45.8 – -4.3
162.8 186.9 241.5 302.9 326.3 7.7 – 342.6 5.0 –
162.8 186.9 241.5 302.9 326.3 7.7 – 342.6 5.0 –
83.4 90.9 151.9 194.6 224.8 15.5 – 236 5.0 –
79.4 96.0 89.5 108.3 101.6 -6.2 – 106.6 4.9 –
162.8 186.9 241.5 302.9 326.3 7.7 – 342.6 5.0 –

57
Table 2.38 • Financial stability indicatorsPer cent
2012 2013 2014 2015 2016
Dec. Dec. Dec. Dec. Dec.
SolvencyCapital adequacy
Tier 1 ratio
Credit risk
Non-performing loans (% of total loans)
Provisions (% of total credit)
Profitability
Return on equity
Return on assets
Liquidity risk
Loan-to-deposit ratio
Deposit-to-asset ratio
Liquid assets to total assets
Sources: BCEAO National Directorate for Guinea-Bissau and International Monetary Fund.Note: Indicators for 2015 and 2016 do not yet reflect the reversal of the two bank bailouts that occurred in 2015.
23.7 22.7 20.1 19.3 20.2
22.3 23.1 21.4 13.9 –
6.4 11.6 25.7 6.2 6.4
10.7 11.6 19.0 8.9 4.2
18.0 17.9 17.5 17.5 16.5
2.6 2.9 2.9 2.9 2.8
78.9 72.5 82.0 76.5 72.4
45.9 56.2 59.2 45.7 43.3
34.3 25.2 34.0 26.8 17.0
Guinea-Bissau

BANCO DE PORTUGAL • Economic Developments in Portuguese-speaking African Countries and Timor-Leste • 2016 | 201758
Table 2.39 • Exchange ratesAverage rates
EERI(a) Index: 100 = 2000
EUR/XOF USD/XOF INR/XOF Nominal Real
20032004
2005
2006
2007
2008
2009
2010
2011
2012
2013
2014
2015
2016
2015 January
February
March
April
May
June
July
August
September
October
November
December
2016 January
February
March
April
May
June
July
August
September
October
November
December
2017 January
February
March
April
May
June
July
Sources: BCEAO National Directorate for Guinea-Bissau, European Central Bank, International Monetary Fund and Banco de Portugal calculations.Notes: (a) Effective exchange rate index (EERI), calculated on the basis of official exchange rates applied to the currencies of Guinea-Bissau's four main trading partners in the 2010/14 period. An increase/decrease in the EERI (nominal or real) corresponds to an appreciation/depreciation of the CFA franc.
656.0 581.5 12.5 109.1 99.5656.0 528.3 11.7 111.9 101.0
656.0 527.6 12.0 110.8 100.4
656.0 523.1 11.6 112.2 100.0
656.0 479.5 11.6 112.0 99.5
656.0 448.2 10.3 116.9 105.5
656.0 472.2 9.8 119.4 101.7
656.0 495.0 10.8 114.9 95.3
656.0 477.5 10.1 117.8 97.0
656.0 510.5 9.6 120.2 96.7
656.0 494.1 8.5 125.7 98.5
656.0 494.4 8.1 127.7 96.8
656.0 591.4 9.2 121.8 91.7
656.0 593.0 8.8 123.8 92.9
656.0 564.5 9.1 122.5 93.0
656.0 577.9 9.3 121.4 91.2
656.0 605.2 9.7 119.7 89.5
656.0 608.6 9.7 119.6 89.5
656.0 588.3 9.2 121.8 91.1
656.0 585.0 9.2 122.1 91.6
656.0 596.5 9.4 121.1 91.4
656.0 588.9 9.0 122.7 93.6
656.0 584.6 8.8 123.8 93.9
656.0 583.9 9.0 123.1 92.5
656.0 611.0 9.2 121.8 91.7
656.0 603.1 9.1 122.6 92.2
656.0 604.0 9.0 123.1 93.3
656.0 591.3 8.7 124.7 93.9
656.0 591.0 8.8 123.8 92.6
656.0 578.5 8.7 124.4 93.1
656.0 579.9 8.7 124.6 93.7
656.0 584.2 8.7 124.6 93.7
656.0 592.6 8.8 123.8 94.2
656.0 585.1 8.7 124.2 93.1
656.0 585.1 8.8 124.1 92.0
656.0 594.9 8.9 123.4 91.6
656.0 607.4 9.0 123.0 92.0
656.0 622.2 9.2 122.1 91.4
656.0 618.0 9.1 122.6 92.0
656.0 616.3 9.2 121.9 91.3
656.0 613.9 9.3 121.3 90.2
656.0 611.7 9.5 120.6 89.4
656.0 593.2 9.2 121.9 91.2
656.0 584.2 9.1 122.6 91.9
656.0 569.9 8.8 123.7 –

2.4. MozambiqueArea: 799,380 Km2
Capital city: Maputo
Population: 28.8 million (2016; source: UN)
Currency: Metical (MZN)
Growth slowed in Mozambique in 2016, mainly due to the fall in gross fixed capital formation. The current account deficit decreased year-on-year, as a result of tightened monetary policy, the fall in imports for large foreign investment projects and the favourable context for coal exports. Interventions by Banco de Moçambique led to an appreciation in the metical, the containment of inflation and a considerable increase in the stock of official reserves. In 2017, the central bank is expected to restate its commitment to containing inflation, while risks from public debt and fiscal policy are expected. The contractual formalisation of planned investments in gas exploitation infrastructure has opened up important positive prospects.

BANCO DE PORTUGAL • Economic Developments in Portuguese-speaking African Countries and Timor-Leste • 2016 | 201760
Economic growth in Mozambique slowed in 2016 (to 3.8%), however it is expected to accelerate in 2017 (rising to 4.7%). In 2016, financial intermediation continued to make a marked negative contribution to growth, with motor vehicle distribution and maintenance services making the largest positive contribution. On the demand side, the fact that changes in inventories were the main driver of growth reflects the economic slowdown prevailing in 2016. Despite the deceleration of growth compared to the preceding years, the Mozambican economy continues to grow at above the average rate for Sub-Saharan Africa (1.4% in 2016 and 2.6% for 2017).
Gross fixed capital formation continued to decrease sharply, falling 30% (in real terms) in 2016 (-23% in 2015), contributing more to the slowdown in GDP than any other expenditure component.
The IMF's support to the country has been suspended, following the disclosure of previously unknown public debt stocks. The recent disclosure by the Prosecutor General of the Republic of Mozambique, giving the conclusions of the audit on those debts, undertaken in the interim, was a necessary (but insufficient) condition for conversations about resumption of the Fund's support to restart. The IMF welcomed the conclusions of the audit as published, noting however that some information was yet to be provided.
The sharp depreciation of the metical – against the US dollar, the euro and the South African rand – was accompanied by a pronounced hike in the year-on-year inflation rate, from the end of 2015. This rate stabilised at around 21% in the first months of 2017.
The tightened monetary policy cycle introduced by Banco de Moçambique in October 2015, with a view to correcting the adverse conditions of the foreign exchange market, stopping further loss of reserves and containing the rise in inflation, had a strong push in October 2016, followed by an apparent suspension. The lending facility rate and the deposit rate have stabilised since the last few months of 2016.
Monetary expansion, which had accelerated to 26.1% in 2015, slowed in 2016 to 10% and was followed by monetary contraction in the first months of 2017, reflecting the objectives of the tightened policy adopted. The recent centralisation of monetary policy in the new monetary policy interest rate (MIMO) and Banco de Moçambique's strong commitment to reducing inflation won positive reactions.
The financial stability indicators show some signs of vulnerability, in terms of the fall in capitalisation levels and the banking system's loss of profitability, both showing signs of recovery in the first few months of this year, along with the increase in non-performing loans, which intensified at the start of 2017.
The monetary tightening at the end of 2016 produced an appreciation in the metical against the US dollar, which extended through the first half of 2017, resulting in an increase of 27 per cent versus September 2016.
In 2016, the combined effects of the tightened monetary policy, the continued reduction in imports for large foreign investment projects, the increase in the international coal price and the increase in coal exports by volume, contributed to the contraction of the Mozambican current account deficit by around 30%. In turn, this improvement led to the preservation of international reserves, which, nevertheless, fell to 2.3 months of imports at the end of 2016.
Despite the increase in public revenue, the State's fiscal deficit intensified in 2016, by 1.6 percentage points of GDP, approaching 2012 levels. The fiscal expansion was caused mainly by increased expenditure on employees and interest, while the removal of subsidies on wheat and fuels represented a containment measure.
The State's debt continued to grow in 2016, reaching 102% of GDP at the end of the year (compared to 73% at the end of 2015). The debt stocks revealed in 2016 represented over 150% of the overall increase of debt in that year. The external debt component, which grew by 28 percentage points of GDP, remains the main driver of this increase in public debt,

61
representing 88% of total debt at the end of 2016. The need for fiscal consolidation is one of the key messages among the conclusions of the IMF's most recent visit to Mozambique (July 2017), given the risks still posed by the high stock of debt, materialised thereafter in the Mozambican State's recent defaults.
For 2017, the pace of growth is expected to pick up again (from 3.8% to 4.7%), inflation should fall and the current account balance should improve. However, key risks remain. Aside from the vulnerabilities in the public finances, reflected for example in the deficit growth assumed in the 2017 Budget, the legal consequences of the audit report on the hidden public debt may also create instability in economic policy and more widely in the Mozambican economy. If, on the other hand,
the measures taken following that investigation do not lead to complete transparency and credibility in fiscal policy, the climate of uncertainty may intensify. A positive risk arises from the possible start of construction of natural gas exploitation infrastructure in the Rovuma basin. In June 2017, the Government and exploration companies signed the contracts allowing work to start. Although production should only start within five years, the signing of these contracts is an important signal that the project will go ahead and paves the way for investments with the potential to create further economic activity. The foreign direct investment flows may, in turn, lead to an improvement in the balance of payments.
Table 2.40 • Main economic indicators
2014 2015 2016 2017
Est. Proj.
Real GDP (anual % change) 7.4 6.6 3.8 4.7
1.1 11.1 23.7 13.5
22.2 26.1 10.1 –
-33.5 -38.6 -38.0 -34.8
3.9 3.0 2.3 2.0
-7.8 -1.9 -3.5 -9.0
48.4 73.1 101.8 106.9
Inflation (year-on-year % change)
Broad money (annual % change)
Current account (% of GDP)
Official reserves (months of imports(1))
Fiscal balance (% of GDP)Public debt (% of GDP)
Sources (for the subsequent charts also): International Monetary Fund, Banco de Moçambique, Mozambique National Planning and Budget Directorate and Mozambique National Institute of Statistics.(1) For the following year.
Mozambique

BANCO DE PORTUGAL • Economic Developments in Portuguese-speaking African Countries and Timor-Leste • 2016 | 201762
Chart 2.37 • Real GDPAnnual % change
Chart 2.38 • Inflation Annual % change in the CPI
0
2
4
6
8
10
2009 2010 2011 2012 2013 2014 2015 2016 2017(proj.)
Mozambique Sub-Saharan Africa
-5
0
5
10
15
20
25
30
2009 2010 2011 2012 2013 2014 2015 2016 2017
Year-on-year % change Average % change
Mozambique has consistently achieved a growth pace above the average for the region since 2011.
Monetary tightening and the consequent appreciation of the metical against the US dollar may have contributed to the apparent inversion in inflation at the end of 2016, interrupting the sharp rise since 2015.
Chart 2.39 • External accounts % of GDP
Chart 2.40 • Foreign exchange reserves Months of goods and services imports
-50
-40
-30
-20
-10
0
10
2009 2010 2011 2012 2013 2014 2015 2016(est.)
2017(proj.)
Trade balance Current account balanceOverall balance
0
1
2
3
4
5
6
7
8
2009 2010 2011 2012 2013 2014 2015 2016 2017(proj.)Months of total imports
Months of imports excl. large-scale proj.
In 2016, the tightened monetary policy, the continued reduction in imports associated with large foreign investment projects and the increase in coal exports contributed to the improvement of Mozam-bique's external accounts.
The improvement in the external accounts, in turn, contributed to the maintenance of international reserves, which represent an increasing share of imports, after excluding those associated to large foreign in-vestment projects.
Chart 2.41 • Goods exports Destinations as a %, total in USD millions
Chart 2.42 • Goods imports Origins as a %, total in USD millions
05001,0001,5002,0002,5003,0003,5004,0004,500
0%
20%
40%
60%
80%
100%
2009 2010 2011 2012 2013 2014 2015 2016
Other Netherlands India China South Africa Total
01,0002,0003,0004,0005,0006,0007,0008,0009,000
0%
20%
40%
60%
80%
100%
2009 2010 2011 2012 2013 2014 2015 2016
Other Singapore United Arab Emirates China South Africa Total
In 2016, India became one of the three largest Mozambican export markets, along with South Africa and the Netherlands.
South Africa and China remain the main origin markets for Mozambican imports, with the United Arab Emirates and Singapore increasing their shares in 2016.

63
Chart 2.43 • Public accounts % of GDP
Chart 2.44 • Public debt % of GDP
-15
-10
-5
0
5
10
2009 2010 2011 2012 2013 2014 2015 2016(est.)
2017(budget)
Current balance Overall balance excl. grantsOverall balance
0
50
100
150
2009 2010 2011 2012 2013 2014 2015 2016(est.)
External - Multilateral External - BilateralDomestic - Treasury bonds Domestic - Other credit
Despite the current balance remaining consistently positive from 2010, capital expenditure fluctuations continue to have a strong impact on Mozambique's public accounts.
The increase in Mozambican public debt over the last few years was reflected chiefly in the external component, which equated to almost 90% of GDP at the end of 2016.
Chart 2.45 • Public revenue and expenditure Chart 2.46 •% of GDP
Chart 2.47 • Financial stability indicators
-50-40-30-20-100
10203040
2009 2010 2011 2012 2013 2014 2015 2016(est.)
2017(budget)
Exp: Invest. Exp: Net loans Exp: OtherExp: Sched. interest Exp: Goods and serv. Exp: EmployeesRev: Grants Rev: Other taxes Rev: Non-taxRev: Cons. taxes Rev: Inc. taxes
Reve
nue
Expe
nditu
re
0%
10%
20%
30%
40%Capital adequacy
Liquid assets(% of total assets)
ROE
ROA
NPL(% of total loans)
Cred. in foreigncurrency
(% total credit)
2012 2014 2016
Developments in the fiscal deficit were driven by the public invest-ment effort, the compensation of employees and tax revenue.
In 2016, the financial stability indicators showed some signs of vulnera-bility, through the fall in capitalisation levels, the increase in non-performing loans and the banking system's loss of profitability.
Chart 2.48 • Liquidity expansion/contraction factors Changes in % of initial stock of broad money
Chart 2.49 • Effective exchange rateIndexes: 100 = 2001, monthly averages
-20-100
1020304050
2009 2010 2011 2012 2013 2014 2015 2016(est.)
2017(May)
External position Net claims on gen.l gov.Credit to the econ. Other net assetsBroad money
0
20
40
60
80
100
120
140
2009 2010 2011 2012 2013 2014 2015 2016 2017
Nominal index Real index
(appreciation: +; depreciation: -).
The tightening typifying monetary policy at the end of 2016 led to a strong slowdown of broad money in the course of that year and even to a decline in the first few months of 2017.
The developments in effective exchange rates reflect the metical's nom-inal and real appreciation from 2016, probably resulting in part from the tightened monetary policy at the end of that year.
Mozambique

BANCO DE PORTUGAL • Economic Developments in Portuguese-speaking African Countries and Timor-Leste • 2016 | 201764
Table 2.41 • Economic indicators
2012 2013 2014 2015 2016 2017
Est. Est. Est. Est. Proj. Est. Proj. Est.
Output and pricesNominal GDP EUR millions
Real GDP Annual % change
Inflation (Consumer Price Index)
Year-on-year % changeAverage % change
Public financesTotal revenue % of GDP
Total expenditure % of GDP
Overall balance % of GDP
Overall balance excluding grants % of GDP
Money and creditNet claims on general government
Annual % change
Credit to the economy Annual % change
Broad money (M3) Annual % change
Interest ratesDeposit (1-year) Annual rate
Lending (1-year) Annual rate
Financial stabilityCapital adequacy (a) Percentage
Non-performing loans(b) / total loans
Percentage
Return on equity (ROE) Percentage
Balance of paymentsGoods exports (in USD) Annual % change
Goods imports (in USD) Annual % change
Current account % of GDP
Current account excl. official transfers
% of GDP
Official reserves Months of imports(d)
Months of imports(e)
Public debt
External debt EUR millions
% of GDP
% of exports(f)
Domestic debt EUR millions
% of GDP
Exchange ratesEUR/MZM (official market) Average rate
USD/MZM (official market) Average rate
USD/MZM (parallel market) Average rate
Nominal EERI (Index: 100 = 2000)(c)
% change(g)
Real EERI (Index: 100 = 2000)(c) % change(g)
Sources: Banco de Moçambique, International Monetary Fund, Organisation for Economic Co-operation and Development, Mozambique National Planning and Budget Directorate, Mozambique National Institute of Statistics and Banco de Portugal calculations.Notes: (a) Regulatory capital/risk-weighted assets; (b) Up to 2013, the calculation of non-performing loans used a definition which did not include all impaired loans; (c) Effective exchange rate index (EERI) calculated on the basis of official exchange rates applied to the currencies of Mozambique's four main trading partners in the 2010/14 period (appreciation: +; depreciation: -); (d) Of goods and services for the following year; (e) Of goods and services, excluding large-scale projects; (f) Of goods and services; (g) Change from the previous December.
12,014 12,144 13,043 13,953 9,732 9,966 10,623 –
7.2 7.1 7.4 6.6 6.5 3.8 7.2 –
2.2 3.0 1.1 11.1 5.6 23.7 5.6 20.5 May
2.1 4.2 2.3 2.4 5.6 19.9 5.6 22.3 May
29.0 32.5 33.9 29.5 26.8 26.2 25.0 –
32.9 37.0 41.8 31.4 35.4 29.7 33.9 –
-3.8 -4.6 -7.8 -1.9 -8.7 -3.5 -9.0 –
-10.1 -10.8 -12.4 -5.0 -11.3 -5.7 -10.7 –
98.5 -16,284.0 36.6 361.6 -135.2 78.2 – -19.2 May(g)
19.9 28.7 28.3 19.3 12.9 12.6 – -6.9 May(g)
29.4 16.3 22.2 26.1 7.9 10.1 – -5.6 May(g)
11.5 9.1 9.1 9.4 – 12.7 – 17.2 May
21.4 20.3 20.8 19.1 – 28.0 – 28.6 May
17.9 16.9 15.1 17.0 – 8.8 – –
3.2 2.9 3.2 4.3 – 5.5 – –
19.6 21.0 21.6 20.4 – 10.1 – –
–
23.6 6.9 -5.0 -12.8 6.7 -2.5 – –
47.2 7.3 -6.2 -4.7 3.8 -37.5 – –
-40.8 -38.8 -33.5 -38.6 -33.1 -38.0 -34.8 –
-45.4 -45.5 -39.7 -42.1 -39.5 –
2.7 3.3 3.9 3.0 2.8 2.3 2.0 –
4.2 4.9 4.8 4.2 4.8 4.5 4.9 –
3,684 4,221 5,711 6,751 – 8,014 – –
33.1 35.9 41.9 61.4 – 89.1 – –
97.4 121.3 151.7 177.5 – 224.7 – –
611 725 894 1288 – 1145 – –
5.5 6.2 6.5 11.7 – 12.7 – –
36.1 39.7 40.8 42.4 – 69.2 – 67.9 Jun.
28.1 29.9 30.7 38.3 – 62.6 – 60.5 Jun.
29.5 31.5 32.9 42.1 – 67.3 – 63.5 Jun.
-6.2 8.0 0.7 -22.2 – -32.7 – 13.1 May
-8.7 6.7 -1.6 -16.5 – -22.1 – 16.8 May

65
Table 2.42 • Gross domestic productCurrent prices, MZM millions
2011 2012 2013 2014 2015 2016 2017
Est. Est. Proj.
Primary sector
Agriculture and livestock
Fishing
Secondary sector
Mining and quarrying
Manufacturing
Electricity and water
Construction
Tertiary sector
Trade and repairs
Restaurants and hotels
Transport and storage
Information and communication
Financial services
Real estate, renting
Public administration
Education
Healthcare and social work
Other
Gross Domestic Product (at factor costs)
Indirect taxes
Gross Domestic Product (market prices)
Consumption
Public
Private
Investment
Gross Fixed Capital Formation
Changes in inventory
Domestic demand
Exports of goods and services
Overall demand
Imports of goods and services
Memo items:
Gross domestic savings
Nominal GDPmp (USD millions)
GDPmp deflator (annual % change)Nominal GDPmp (annual % change)Real GDPmp (annual % change)
Sources: Banco de Moçambique, Mozambique National Institute of Statistics, International Monetary Fund and Banco de Portugal calculations.
100,369 109,287 116,129 120,982 135,754 155,412 –
94,128 102,491 108,734 113,213 126,251 138,821 –
8,428 13,081 15,230 23,894 30,309 42,957 –
67,760 75,492 81,860 99,790 116,236 135,777 –
8,428 13,081 15,230 23,894 30,309 42,957 –
39,299 39,413 41,591 47,821 53,917 59,806 –
12,085 13,841 16,301 17,116 18,296 18,614 –
7,948 9,158 8,737 10,960 13,714 14,399 –
183,301 210,489 239,075 262,154 286,791 336,186 –
39,123 47,427 56,305 61,523 66,501 83,545 –
10,779 9,516 10,134 10,973 12,999 13,504 –
30,339 35,746 43,075 39,781 41,274 47,196 –
13,787 15,252 16,494 17,858 19,051 19,880 –
18,113 19,812 22,442 24,459 27,436 33,754 –
26,054 28,598 31,498 31,124 34,098 36,776 –
19,324 21,662 25,271 31,291 37,462 44,381 –
25,806 31,314 33,972 42,271 46,821 56,163 –
6,137 7,624 7,922 10,497 11,296 13,593 –
-6,161 -6,461 -8,038 -7,623 -10,145 -12,605 –
351,430 395,269 437,064 482,926 538,782 627,375 –
30,262 37,853 45,169 48,851 52,895 61,838 –
381,692 433,121 482,233 531,777 591,677 689,213 793,036
365,713 427,472 478,223 510,726 558,828 687,405 –
76,137 90,282 115,101 138,592 157,807 194,588 –
289,576 337,190 363,123 372,134 401,021 492,817 –
97,969 205,222 262,667 294,406 268,182 293,999 270,140
82,232 152,145 189,791 228,937 189,089 141,505 –
15,738 53,076 72,875 65,469 79,092 152,494 –
463,683 632,694 740,890 805,132 827,010 981,404 –
127,587 140,228 146,451 177,397 190,616 239,554 –
591,270 772,922 887,341 982,529 1,017,626 1,220,958 –
209,578 339,800 405,108 450,752 425,947 531,745 –
15,978 5,649 4,010 21,051 32,849 1,808 –
13,135 15,415 16,123 17,327 15,457 11,015 11,170
3.3 5.9 3.9 2.6 4.4 12.2 10.0
10.7 13.5 11.3 10.3 11.3 16.5 15.1
7.1 7.2 7.1 7.4 6.6 3.8 4.7
Mozambique

BANCO DE PORTUGAL • Economic Developments in Portuguese-speaking African Countries and Timor-Leste • 2016 | 201766
Table 2.43 • Consumer price indexPer cent
Monthly change Year-on-year change Average change
[1] [2] [3]
2005 December
2006 December
2007 December
2008 December
2009 December
2010 December
2011 December
2012 December
2013 December
2014 December
2015 December
2016 December
2015 January
February
March
April
May
June
July
August
September
October
November
December
2016 January
February
March
April
May
June
July
August
September
October
November
December
2017 January
February
March
April
May
Sources: Banco de Moçambique, Mozambique National Institute of Statistics and Banco de Portugal calculations.Notes: [1] month (n) / month (n-1); [2] month (n) / month (n) of the previous year; [3] last 12 months / previous 12 months.
3.9 13.1 7.0
2.2 8.1 13.6
3.2 12.1 9.2
0.9 11.8 14.5
2.1 4.2 3.3
3.5 16.6 12.7
1.3 5.5 10.4
1.0 2.2 2.1
0.6 3.0 4.2
0.6 1.1 2.3
5.8 11.1 2.4
2.5 23.7 19.9
1.6 1.5 2.2
1.2 2.1 2.1
0.2 0.8 1.9
-0.6 -0.5 1.6
-0.9 -0.8 1.2
-0.4 0.1 1.0
0.1 0.7 0.9
0.0 1.8 0.9
0.1 2.4 1.0
1.7 4.1 1.2
2.0 5.7 1.6
5.8 11.1 2.4
4.8 13.8 4.5
1.0 13.1 5.3
0.3 13.4 6.1
1.4 16.1 7.3
0.3 17.7 8.7
0.8 19.1 10.2
1.2 20.4 11.7
1.8 22.2 13.4
3.3 25.9 15.3
2.4 26.3 17.1
1.9 26.4 18.8
2.5 23.7 19.9
2.2 20.6 20.4
1.3 20.9 21.1
0.9 21.6 21.7
1.1 21.3 22.1
-0.4 20.5 22.3

67
Table 2.44 • Balance of paymentsUSD millions
2012 2013 2014 2015 2016 2017
Prog. Est. Prog. Q 1
Current account -6,284 -6,253 -5,797 -5,968 -4,901 -4,191 -3,887 -718
-6,997 -7,341 -6,884 -6,508 – -4,349 – -745
-4,048 -4,357 -4,035 -4,163 -4,219 -1,405 – -371
3,856 4,123 3,916 3,413 3,643 3,328 – 977
2,190 2,196 2,440 2,057 2,069 2,413 – 824
-7,903 -8,480 -7,952 -7,577 -7,863 -4,733 – -1,348
-2,143 -1,934 -1,487 -917 -2,058 -771 – -164
-3,073 -3,259 -2,932 -2,306 -1,231 -2,841 – -310
7 -59 -202 -300 -344 -255 – -132
-40 -49 -60 -128 -101 -127 – -116
-48 -42 -46 -13 -82 -18 – -5
829 1,421 1,372 802 894 310 – 95
713 1,088 1,087 540 – 158 – 27
538 460 568 441 442 – – –
116 333 285 262 – 151 – 67
456 423 375 288 368 139 – 43
-5,541 -5,418 -5,579 -6,175 -4,901 -4,543 – -318
-5,215 -6,175 -4,902 -3,867 -3,188 -3,093 – -457
-87 22 -23 26 0 50 – 43
-373 -391 134 521 368 540 – -314
373 391 -134 -521 -368 -540 – 314
375 393 -120 -600 -335 -501 – 67
-2 -3 -14 79 -33 -39 – -10
-2 -3 -14 79 -33 -39 – -10
0 0 0 0 0 0 – 257
Excluding official transfers
Trade balance
Exports (f.o.b.)
of which: Large-scale projects
Imports (f.o.b.)
of which: Large-scale projects
Services
Balance of primary income
of which: Public debt interest (debit)(a) Dividends and interest from large-scale projects
Balance of secondary income
Central government
of which: External grants(a)
Financial & non-financial inst., households & NPISHs
Capital account
Financial account
of which: Foreign direct investment (net)
Errors and omissions
Overall account
Financing (b)
Change in official reserves
Use of credit (net)(b)
of which: Use of IMF funds (net)(b)
Exceptional financing
Sources: Banco de Moçambique, IMF and Banco de Portugal calculations.Notes: Banco de Moçambique started to report these data in line with the Sixth Edition of the IMF's Balance of Payments and International Investment Position Manual. (a) The 2015 value is an estimate. (b) Includes disbursements in Special Drawing Rights.
Mozambique

BANCO DE PORTUGAL • Economic Developments in Portuguese-speaking African Countries and Timor-Leste • 2016 | 201768
Table 2.45 • Goods exportsDestinations as a percentage of total exports
2008 2009 2010 2011 2012 2013 2014 2015 2016 2008 to 2016
South Africa 9.2 21.4 21.6 18.7 19.8 19.7 24.2 20.9 21.0 19.8 0.5 0.7 0.4 0.6 1.1 1.2 1.4 2.6 1.4 1.2 1.6 3.5 3.9 5.4 18.2 2.5 5.2 3.9 4.3 5.7 0.5 1.9 0.9 0.8 2.5 3.6 1.4 1.7 2.9 1.9 1.3 1.5 1.7 2.7 1.5 1.8 1.5 0.8 2.0 1.6 0.8 2.6 1.5 1.8 4.5 16.5 9.9 9.4 20.1 8.3
55.5 41.6 51.0 43.5 24.1 27.3 28.4 27.9 25.3 34.2 0.8 1.5 4.7 1.4 0.5 2.5 1.4 0.9 1.0 1.5 2.1 3.4 3.2 2.5 2.4 2.0 2.5 2.6 1.3 2.4 0.1 1.3 0.5 0.3 1.8 0.0 1.9 4.2 4.2 1.6
27.6 20.5 10.7 22.3 23.6 23.1 22.4 25.2 16.4 21.7
BelgiumChinaUnited StatesSpainIndiaNetherlandsPortugalZimbabweSingaporeOther
Sources: Banco de Moçambique and Banco de Portugal calculations.
Table 2.46 • Goods importsOrigins as a percentage of total imports
2008 2009 2010 2011 2012 2013 2014 2015 2016 2008 to 2016
South AfricaGermanyChinaUnited StatesUnited Arab EmiratesIndiaNetherlandsPortugalUnited KingdomSingapore
Other
Sources: Banco de Moçambique and Banco de Portugal calculations.
29.1 35.5 51.2 34.0 27.2 25.7 36.4 31.4 30.0 32.2 1.6 1.8 0.6 0.6 1.9 1.1 1.5 1.2 2.7 1.5 3.9 4.6 5.7 7.0 5.3 7.5 8.5 11.5 7.9 7.3 4.0 3.6 0.5 2.8 11.9 2.2 2.0 1.6 2.3 3.7
2.6 2.0 2.4 5.6 7.7 7.0 6.0 4.5 7.2 5.5
3.6 6.5 1.1 5.6 2.9 3.7 4.1 4.2 6.1 4.1 17.4 13.0 16.5 12.6 6.6 4.9 7.6 7.4 2.4 8.7
2.9 3.8 8.0 4.2 4.0 5.7 5.7 4.7 5.8 5.0 1.3 0.8 0.6 4.2 6.4 3.2 1.5 1.3 2.1 2.7
0.3 1.8 0.0 0.7 0.6 7.4 1.4 2.0 8.1 2.7
33.4 26.8 13.3 22.7 25.4 31.6 25.3 30.1 25.6 26.6

69
Table 2.47 • Public debtUSD millions
2010 2011 2012 2013 2014 2015 2016
Est.
External debtMultilateral creditorsBilateral creditors
Paris ClubOther countries
Domestic debtCentral Bank(a)
Other banks and financial institutions(b)
Treasury bondsOther(c)
Total public debt
External debt servicePrincipalInterest
Total public debtExternal debtDomestic debt
External debtExternal debt service
Sources: Banco de Moçambique, Mozambique National Planning and Budget Directorate and Banco de Portugal calculations.Notes: (a) Includes Government debt to reinforce the exchange rate balance; (b) Treasury bill flows only occurring in cash operations; (c) Loans related to fuel subsidies, debt of public companies and leasing operations resulting from the construction of public buildings.
3,744 4,214 4,829 5,783 7,043 7,339 8,4462,437 2,505 2,927 3,374 3,282 3,306 3,7151,307 1,709 1,902 2,409 3,761 4,033 4,731
402 667 671 754 905 1,193 1,239905 1,042 1,231 1,655 2,856 2,840 3,491550 826 800 994 1,102 1,400 1,206
88 111 101 100 95 91 475
161 204 169 281 266 475 162
146 273 355 446 568 408 298154 239 176 167 173 426 271
4,294 5,041 5,630 6,776 8,145 8,739 9,652
54 73 95 143 174 230 27430 39 57 85 99 142 15624 34 38 58 75 88 118
(% of GDP)42.4 35.7 38.6 42.0 48.4 73.1 101.8
37.0 29.8 33.1 35.9 41.9 61.4 89.15.4 5.9 5.5 6.2 6.5 11.7 12,7
(% of exports of goods and services)
125.6 109.5 97.4 121.3 151.7 177.5 224.71.8 1.9 1.9 3.0 3.7 5.6 7.3
Mozambique

BANCO DE PORTUGAL • Economic Developments in Portuguese-speaking African Countries and Timor-Leste • 2016 | 201770
Table 2.48 • Government operationsMZM billions
2012 2013 2014 2015 2016 2017
Budg. Est. l.e.(a) Budg. 1st half l.e.(a)
1. Total revenue
1.1. Current revenue
Non-tax revenue
Tax revenue
Income taxes
Consumption taxes
Taxes on international tradeOther taxes
1.2. Grants
2. Total expenditure
2.1. Current expenditure(b)
Compensation of employeesGoods and services
Transfers and subsidies
Scheduled debt interest
2.2. Capital expenditure
Domestic financing
External financing
2.3. Net lending
3. Current balance: (1.1-2.1)
4. Overall balance excl. grants: (1-2-1.2)
5. Overall balance: (1-2)
6. Financing
6.1. Domestic (net)
of which: Banking system
6.2. External (net)
Disbursements
Amortisation
Other operations
7. Financing gap
Sources: Banco de Moçambique, Mozambique National Planning and Budget Directorate, International Monetary Fund and Banco de Portugal calculations.Notes:(a) Level of budget execution, %; (b) Includes other current expenditure; (c) Net borrowing (-) / net lending (+).
125.8 156.6 180.4 174.6 183.7 180.4 98.2 200.4 89.9 44.9
98.5 126.3 156.3 155.9 165.5 165.6 100.0 186.3 85.2 45.7
14.0 18.8 21.3 26.2 21.1 27.1 128.5 32.3 13.6 42.3
84.5 107.5 135.1 129.7 144.4 138.5 95.9 154.1 71.5 46.4
36.8 49.4 63.1 57.9 65.0 64.3 98.8 69.4 36.5 52.6
36.9 44.9 56.4 54.4 60.5 56.4 93.1 66.3 25.9 39.0
7.5 9.7 11.4 12.6 13.9 12.3 88.7 15.2 5.6 37.0
3.2 3.5 4.1 4.7 4.9 5.5 111.7 3.1 3.5 113.9
27.3 30.2 24.1 18.7 18.2 14.8 81.6 14.0 4.8 33.9
142.4 178.5 222.0 185.6 243.4 204.8 84.2 272.3 109.0 40.0
83.8 95.7 118.5 117.8 143.4 141.1 98.4 156.4 73.9 47.3
41.6 49.5 59.8 64.3 70.1 77.8 111.1 77.4 40.4 52.3
14.3 18.9 26.0 22.5 24.8 23.0 92.6 27.1 9.7 35.7
18.8 18.8 21.0 22.1 22.3 23.5 105.5 23.4 14.2 60.4
4.1 4.0 5.2 7.6 15.1 16.3 107.8 26.9 9.4 35.0
53.5 72.3 87.0 64.1 91.8 50.3 54.7 103.2 24.5 23.7
24.9 34.0 45.4 42.7 44.7 23.6 52.9 50.8 15.4 30.3
28.5 38.3 41.7 21.4 47.1 26.6 56.5 52.3 9.1 17.4
5.2 10.6 16.5 3.7 8.1 13.5 166.3 12.7 10.6 83.7
14.7 30.7 37.9 38.1 22.1 24.5 – 29.9 11.2 –
-44.0 -52.2 -65.7 -29.8 -77.8 -39.2 – -86.0 -23.9 –
-16.6 -22.0 -41.6 -11.1 -59.6 -24.4 – -71.9 -19.1 –
16.6 22.0 41.6 11.1 59.6 41.3 69.3 71.9 22.7 31.5
2.6 -4.8 -5.7 29.2 21.8 15.7 72.3 21.1 6.4 30.1
5.6 -14.0 5.1 32.2 – 18.2 – – – –
14.0 26.8 47.3 -18.2 37.9 25.6 67.6 50.8 16.3 32.1
15.6 29.3 50.4 31.0 – 36.9 – – – –
-1.6 -2.5 -3.1 -7.0 – -11.4 – – – –
– – – -42.1 – – – – – –
0.0 0.0 0.0 0.0 0.0 16.9 – 0.0 3.6 –

71
Table 2.49 • Monetary surveyMZM billions
2012 2013 2014 2015 2016 2016/2015 2017 2017
Proj. Est. [1] [2] Mar. May
Net foreign assetsCentral Bank
Foreign assets
Foreign liabilities
Commercial banks
Total domestic creditNet claims on general government
Credit granted
Deposits
National currency
Foreign currency
Earmarked funds
Credit to the economy
National currency
Foreign currency
Other items (net)
Total assets
Broad money (M3)Base money
Currency in circulationDemand deposits
Quasi-money
Total liabilities
Sources: Banco de Moçambique, International Monetary Fund and Banco de Portugal calculations.Notes: [1] Percentage change from the previous period; [2] Percentage change relative to the stock of broad money at the end of the previous period (liquidity expansion/contraction factors).
Table 2.50 • Interest ratesAnnual rates, per cent
2011 2012 2013 2014 2015 2016 2017
Dec. Dec. Dec. Dec. Dec. Dec. Mar. May
Deposits Up to 180 days
181 to 365 days
1 to 2 years
Credit Up to 180 days
181 to 365 days
1 to 2 years
Reference rates
Standing liquidity provision facility
Treasury bills (91 days)
IMM, interbank transactions
Source: Banco de Moçambique.
94.4 100.0 104.8 115.3 118.1 151.5 31.4 10.9 149.9 135.4
73.1 85.7 91.5 91.8 96.0 116.8 27.3 7.5 114.0 115.7
84.2 97.1 103.6 113.7 124.3 145.2 27.7 9.4 140.3 140.0
-11.1 -11.3 -12.0 -21.9 -28.3 -28.4 29.7 -1.9 -26.3 -24.3
21.3 14.3 13.3 23.6 22.0 34.7 47.5 3.4 35.9 19.7
117.7 137.6 185.7 255.4 253.8 302.8 18.6 14.2 286.6 276.7
-0.1 -14.0 -8.9 23.3 -8.2 41.5 78.2 5.5 35.8 33.5
45.5 57.4 74.0 85.2 – 127.9 50.3 12.8 162.1 174.6
-45.5 -71.4 -82.9 -61.9 – -86.5 39.7 -7.4 -126.4 -141.1
-44.2 -69.5 -80.6 -59.0 – -81.4 38.1 -6.7 -121.1 -136.5
-1.3 -1.9 -2.3 -2.9 – -5.0 72.7 -0.6 -5.3 -4.6
-0.1 -0.1 -0.1 -0.1 – -0.5 409.0 -0.1 -0.5 -6.6
117.8 151.7 194.6 232.1 262.0 261.4 12.6 8.8 250.9 243.2
89.0 117.3 155.1 188.9 209.5 200.9 6.4 3.6 193.6 191.1
28.8 34.4 39.5 43.3 52.5 60.5 39.8 5.2 57.3 52.1
-26.1 -21.2 -26.0 -37.3 -12.0 -87.2 -134.0 -15.0 -74.0 -65.4
186.0 216.4 264.5 333.5 359.9 367.2 10.1 – 362.5 346.8
186.0 216.4 264.5 333.5 359.9 367.2 10.1 10.1 362.5 346.8
41.1 47.5 57.3 73.9 78.7 99.9 35.2 7.8 93.1 93.9
19.7 22.7 27.3 30.0 35.3 36.3 20.8 – 30.8 31.8
109.5 123.3 154.3 188.4 204.9 207.2 10.0 – 200.1 184.5
56.8 70.4 82.9 115.1 119.7 123.7 7.5 – 131.6 130.4
186.0 216.4 264.5 333.5 359.9 367.2 10.1 – 362.5 346.8
12.7 10.2 8.5 8.4 9.1 12.0 16.9 16.4
13.4 11.5 9.1 9.1 9.4 12.7 17.2 17.2
13.2 9.6 6.1 7.7 6.8 8.8 12.1 12.6
24.4 20.6 19.8 20.4 18.0 28.5 28.4 29.3
23.7 21.4 20.3 20.8 19.1 28.0 29.7 28.6
24.9 21.0 21.1 21.0 18.7 27.7 29.0 28.8
15.0 9.5 8.3 7.5 9.8 23.3 23.3 22.3
11.8 2.6 5.2 5.4 7.5 24.1 24.8 25.3
11.7 2.8 3.4 3.1 5.4 23.2 21.8 21.7
Mozambique

BANCO DE PORTUGAL • Economic Developments in Portuguese-speaking African Countries and Timor-Leste • 2016 | 201772
Table 2.51 • Financial stability indicatorsPer cent
2011 2012 2013 2014 2015 2016
Est. Est.
SolvencyCapital adequacy(a) 17.1 17.9 16.9 15.1 17.0 8.8
16.1 16.9 16.0 13.6 15.5 14.2
2.6 3.2 2.9 3.2 4.3 5.5
25.1 28.1 21.9 22.2 22.1 28.7
26.5 19.6 21.0 21.6 20.4 10.1
2.5 1.9 2.0 2.1 2.0 0.7
64.9 58.9 55.6 55.4 52.7 65.5
61.3 66.1 65.3 62.4 62.8 67.0
27.8 33.4 30.7 28.2 32.2 31.4
34.3 27.4 36.9 35.0 20.4 26.1
77.8 70.8 78.3 82.1 76.5 79.0
47.1 49.1 47.6 47.1 46.9 44.1
11.6 11.3 15.0 13.3 11.8 18.9
Tier 1/risk-weighted assets
Asset quality
Non-performing loans(b)/total loans
Loans in foreign currency / total loans
Return
Return on equity (ROE)
Return on assets (ROA)
Net interest margin/gross income
Operational costs/gross income
Liquidity
Liquid assets(c)/total assets
Other indicators
General government deposits/total deposits
Private sector credit / total deposits
Personnel costs/operating costs
Interest spread, 1-2 years (lending – deposit)
Sources: Banco de Moçambique and Banco de Portugal calculations.Notes: (a) Regulatory capital/risk-weighted assets; (b) Up to 2013, the calculation of non-performing loans used a definition which did not include all impaired loans; (c) Net assets include deposits with the parent institutions.

73
Table 2.52 • Exchange ratesAverage rates
EUR/MZM USD/MZM ZAR/MZM
EERI(a)
Index: 100 = 2001Official Open Op/Of Official Parallel Open Pa/Of Op/Of
(Of) (Op) (%) (Of) (Pa) (Op) (%) (%) Open Nom. Real
2002 21,896.4 22,370.7 2.2 23,180.4 24,281.3 23,665.4 4.7 2.1 2,373.7 95.7 106.2 26,360.4 26,874.1 1.9 23,340.9 24,248.7 23,782.3 3.9 1.9 3,187.7 77.9 92.7
27,457.0 27,782.7 1.2 22,130.9 23,165.5 22,581.3 4.7 2.0 3,523.4 73.9 96.2
28,337.5 28,576.1 0.8 22,936.3 23,614.4 23,068.4 3.0 0.6 3,617.1 71.6 96.9
32.2 31.4 -2.5 25.0 26.9 26.0 7.8 4.2 3.8 65.8 97.9
35.6 35.0 -1.5 25.6 26.6 25.8 4.2 1.1 3.7 63.7 98.5
35.7 35.5 -0.6 24.2 25.2 24.3 4.0 0.5 3.0 71.1 116.7
38.9 37.2 -4.4 26.7 29.2 27.5 9.5 3.0 3.3 64.2 104.9
45.4 43.6 -4.0 33.0 35.7 34.0 8.1 3.0 4.7 49.5 87.7
40.5 40.5 0.0 29.1 31.0 29.1 6.8 0.0 4.0 56.6 105.8
36.1 36.5 1.2 28.1 29.5 28.4 4.8 1.1 3.5 64.2 117.1
39.7 40.0 0.7 29.9 31.5 30.1 5.3 0.7 3.1 65.1 118.0
40.8 41.6 2.2 30.7 32.9 31.4 7.2 2.2 2.9 67.1 119.5
42.4 44.3 4.4 38.3 42.1 40.0 10.1 4.4 3.1 61.4 108.6
69.2 69.7 0.8 62.6 67.3 63.1 7.6 0.8 4.3 41.1 82.6
2003
2004
2005
2006(b)
2007
2008
2009
2010
2011
2012
2013
2014
2015
2016
2015 January 36.9 38.7 5.0 31.8 35.9 33.4 13.0 5.1 2.9 68.8 123.3
37.0 38.5 4.1 32.6 36.5 34.0 11.9 4.1 2.9 67.9 122.5
36.3 38.2 5.1 33.5 37.0 35.2 10.3 5.1 2.9 68.0 121.7
36.5 38.9 6.6 33.8 37.6 36.0 11.1 6.6 3.0 66.8 118.0
37.9 40.9 7.9 34.0 37.9 36.7 11.5 7.9 3.1 65.4 114.3
41.6 43.1 3.5 37.1 39.6 38.5 6.7 3.6 3.1 62.0 107.6
42.1 42.7 1.4 38.3 40.2 38.9 4.9 1.5 3.1 61.4 105.7
44.0 45.0 2.4 39.5 42.6 40.4 7.9 2.4 3.1 60.4 104.0
45.1 48.3 7.2 40.2 45.8 43.2 13.9 7.6 3.2 59.6 102.8
46.3 49.2 6.3 41.2 46.2 43.8 12.1 6.3 3.2 57.9 101.5
51.4 53.0 3.3 47.9 54.2 49.4 13.2 3.3 3.5 52.5 93.9
53.8 54.6 1.6 49.5 52.2 50.2 5.6 1.6 3.4 52.7 99.4
February
March
April
May
June
July
August
September
October
November
December
2016 January
February
March
April
May
June
July
August
September
October
November
December
2017 January
February
March
April
MayJune
Sources: Banco de Moçambique, Moçambique National Institute of Statistics, Statistics South Africa, European Central Bank, Organisation for Economic Co-operation and Development and Banco de Portugal calculations.Notes: (a) Effective exchange rate index (EERI) calculated on the basis of official exchange rates applied to the currencies of Mozambique's four main trading partners. (b) A monetary reform was carried out in July 2006, with a conversion rate of 1 to 1,000.
49.3 50.3 2.2 45.3 50.6 46.3 11.7 2.2 2.8 60.0 115.6
52.9 54.4 2.7 47.7 53.5 49.0 12.2 2.7 3.1 55.6 107.0
54.7 56.0 2.3 49.3 57.7 50.4 17.0 2.4 3.3 53.1 101.9
59.3 59.8 1.0 52.3 59.9 52.8 14.6 1.0 3.6 48.7 94.3
62.6 62.7 0.2 55.4 62.9 55.5 13.6 0.2 3.6 47.6 92.1
68.4 68.6 0.3 60.9 66.0 61.1 8.4 0.3 4.1 42.9 83.5
73.0 73.4 0.5 66.0 71.1 66.3 7.7 0.5 4.6 38.9 76.1
80.0 80.4 0.6 71.4 79.0 71.8 10.6 0.6 5.2 35.0 69.7
85.7 86.1 0.5 76.5 78.1 76.9 2.1 0.5 5.5 33.0 67.9
85.5 85.9 0.6 77.6 79.4 78.0 2.3 0.6 5.6 32.6 68.5
81.9 82.0 0.1 75.9 76.2 76.0 0.4 0.1 5.5 33.7 72.1
76.6 76.6 -0.0 72.7 73.9 72.7 1.7 -0.0 5.2 35.4 77.5
75.1 75.2 0.0 70.8 73.6 70.8 4.0 0.0 5.2 35.9 80.0
74.9 74.8 -0.2 70.4 73.5 70.3 4.4 -0.2 5.3 35.5 79.6
73.6 73.5 -0.1 68.9 69.3 68.7 0.6 -0.2 5.3 35.9 80.7
70.7 70.7 -0.0 65.9 66.5 65.9 0.9 -0.0 4.9 38.1 86.4
68.2 68.1 -0.1 61.7 62.7 61.6 1.6 -0.1 4.7 40.1 90.5 67.9 67.8 -0.05 60.4 63.5 60.4 5.06 -0.0 4.6 – –
Mozambique


2.5. São Tomé and PríncipeArea: 997 Km2
Capital city: São Tomé
População: 199.9 thousand (2016; source: World Bank)
Currency: Dobra (STD)
While positive and broadly in line with the average for the African continent, economic growth in São Tomé and Príncipe over the last two years has fallen short of expectations and did not manage to take advantage of the greater political stability in place since 2015. The financial constraints continue to form a significant obstacle to the country's development, namely due to the limitations placed on investment (both private and public). The increased growth in tourism was a positive development, while the banking sector faced structural problems arising from the small size of the Santomean economy.

BANCO DE PORTUGAL • Economic Developments in Portuguese-speaking African Countries and Timor-Leste • 2016 | 201776
Santomean economic growth accelerated slightly in 2016 versus the year before. The recent revision of the GDP estimates for the last few years revealed that the slowdown in 2015 was even sharper than initially estimated (3.8 per cent instead of 4.0 per cent); in 2016 the estimated growth rate came to 4.1 per cent, which was not enough to reduce the prevailing level of poverty significantly. Cocoa exports recovered from the fall of 2015, as did tourism which established itself as the main source of external revenue.
In 2016 prices abandoned the disinflation in place since 2008. This behaviour may be linked to the adoption (at the start of 2016) of a new market basket for the price index, providing a more faithful representation of consumption patterns and reflecting more precisely the fluctuations caused by the strong price variations among locally produced food goods, following climatic conditions, as is typical of the second quarter of each year. At the end of 2016, annual inflation (like-for-like) stood at 5.1 per cent, above the forecast of 4.0 per cent.
The weak economic activity (in tandem with the falling price of imported oil products) gave rise to a further reduction in the value of imports, due to which the current account deficit fell for the second year in succession (from 17.0 per cent to 9.4 per cent of GDP). These positive developments benefited also from an improvement in the terms of trade (higher international cocoa prices, reduced price of oil products), a situation which will not be repeated in 2017. The financial balance in 2016 was similar to the year before, despite the fall in public disbursements relating to external financing flows, which was offset by an improved performance from private flows.
Net international reserves fell from their high level of the end of 2015, with imports slated for 2017 still covered however by the foreign exchange reserves, which remained above the three-month threshold, the benchmark specified in the Economic Cooperation Agreement signed with Portugal in 2009. Despite certain fluctuations during the first half of 2017, the foreign exchange reserves presented a similar value at the end of June to that of the start
of the year, duly monitored by the Santomean authorities.
Taking into account the small scale of the private sector and the conditions arising from the foreign exchange regime in force since 2010 (the euro peg), the public finances are the key determinant of the economy's behaviour. The Santomean authorities have aimed to remain suitably prudent in terms of fiscal management, but given the inflexibility of most of the current expenditure (specifically public sector salaries) and the lack of scope to increase the tax base, public expenditure has been discretionary in nature, involving internally financed public investment, as a result of the reductions needed to maintain the main macroeconomic balances, whether internal or external.
2016 was not particularly favourable for the public finances, since, despite the goals expressed in the budget, the domestic primary deficit (the main benchmark for budgetary policy), deteriorated from 3.0 per cent to 3.1 per cent, while the goal set in the adjustment programme agreed with the IMF was 2.0 per cent. At the same time it was impossible to continue the process of settling overdue debts, the positive initiative launched in 2015.
As has been the case in previous years, the current public revenue was below budget (execution level of 82.8 per cent), which reflects a tendency to overestimate the tax authorities' operational capability. In addition to this, the value of oil products' imports fell in value, which traditionally constitute an important source of customs revenue; these revenues fell by around 18 per cent from the year before, due to which the direct tax collection effort (which increased almost 10 per cent from 2015) was not enough to offset that fall.
2016 was particularly modest in terms of external financing of public expenditure. The disbursements relating to loans from international institutions and other development partners to cover public investment projects fell from EUR 30.3 million to EUR 5.8 million. This sharp fall in external financing was offset partially by the increase in grants to projects and in direct support of the budget, which did not prevent a sharp fall in

77
execution of public investment projects, with natural consequences for the creation of conditions for improving economic and job market behaviour.
The recent diplomatic recognition of the People's Republic of China (to the detriment of Taiwan) paves the way for certain investment projects (the renovation of the airport and expansion of the port of S. Tomé) through partnerships with Chinese companies, without direct recourse to public financing. Under the agreement with the IMF, the Santomean government has undertaken to accept only concessional loans, taking into account the high level of external public debt. The local authorities are confident that the opportunities arising from the new relationship with China may be the way to launch investment projects that have been put off for decades due to financing restrictions.
Most of the loans planned for 2016 did not materialise, giving rise to a slight easing of the external public debt to GDP ratio, which fell to around 82 per cent in 2016 from close to 90 per cent in 2015.
The monetary aggregates of the Santomean economy have behaved strangely over the last two years, with broad money and net foreign assets shrinking and credit flat. This behaviour was driven largely by difficulties in the banking sector, which led to the winding up of one of the banks in August 2016, after a prolonged intervention from the central bank. The central bank has sought to act assertively in relation to the high proportion of non-performing loans, requiring that losses be recognised, adequate provisions established and own funds strengthened. The aforementioned bank was closed in an orderly fashion, without losses for most depositors and without negatively impacting public trust in the other institutions.
Pegging the exchange rate to the euro in 2010 has suited the characteristics of the Santomean economy. The fluctuations presented by the effective exchange rate index over the last two years resulted essentially from disruptions in the Angolan currency, which is among those used to set this index.
Table 2.53 • Main economic indicators
2012 2013 2014 2015 2016 2017
Est. Est. Est. Est. Proj. Est. Proj.
Real GDP (annual % change) 4.5 4.0 6.5 3.8 5.0 4.1 5.0
10.4 7.1 6.4 4.0 4.0 5.1 3.0
20.8 15.7 16.8 13.2 11.1 -4.8 24.5
-20.9 -23.4 -21.4 -17.0 -12.1 -9.4 -11.3
-10.7 -2.0 -4.1 -7.5 -11.9 -4.6 -4.6
-3.2 -2.6 -2.7 -3.0 -2.0 -3.1 -1.8
83.3 75.4 70.0 89.1 – 81.7 –
Inflation (year-on-year % change)
Broad money (annual % change)
Current and capital account (% of GDP)
Overall fiscal balance (% of GDP)
Domestic primary balance (% of GDP)
External public debt (% of GDP)
Sources (for the subsequent charts also): Banco Central de São Tomé e Príncipe, Ministry of Finance (São Tomé and Príncipe) and IMF.
São Tomé and Príncipe

BANCO DE PORTUGAL • Economic Developments in Portuguese-speaking African Countries and Timor-Leste • 2016 | 201778
Chart 2.50 • Real GDPAnnual % change
Chart 2.51 • InflationAnnual % change in the CPI
4.54.9
4.54.0
6.5
3.8
5.0
4.1
5.0
0
2
4
6
8
2010 2011 2012 2013 2014 2015 2016(proj.)
2016(est.)
2017(proj.)
0
5
10
15
20
2010 2011 2012 2013 2014 2015 2016 2017
Year-on-year % change Average % change
Economic growth in São Tomé and Príncipe again fell short of expectations, despite the good behaviour of exports and tourism. Public investment projects did not materialise, constituting the main factor of this unfavourable performance.
In 2016, the disinflation of the previous years did not continue. The price instability of certain locally produced food goods with a large weight in the market basket of consumer goods gave rise to some volatility spikes.
Chart 2.52 • Goods exports Destinations as a %, total in USD millions
Chart 2.53 • Goods imports Origins as a %, total in USD millions
0
5
10
15
20
0%
20%
40%
60%
80%
100%
2010 2011 2012 2013 2014 2015 2016
Netherlands Portugal BelgiumFrance Other Total
40
80
120
160
0%
20%
40%
60%
80%
100%
2010 2011 2012 2013 2014 2015 2016
Angola Belgium PortugalGabon Other Total
Exports (in particular cocoa) did not recover from 2015. France became the main destination market, replacing Belgium, whose share fell strongly; exports to Portugal also fell.
In 2016, the imports maintained the same level as the year before. The fall in value of oil imports was offset by increases in food goods and equipment. Portugal continues to be the main supplier.
Chart 2.54 • Balance of payments USD millions
Chart 2.55 • Public revenueSTD millions
-250-200-150-100-500
50100150
2012 2013 2014 2015 2016(fore.)
2016(est.)
2017(proj.)
Exports (goods e serv.) Imports (goods e serv.)Project grants Current account
0
1,000
2,000
3,000
2010 2011 2012 2013 2014 2015 2016(budg.)
2016(est.)
2017(budg.)
Tax revenue Other revenue Oil bonuses Grants
The positive developments in the current balance were essentially the result of the increase in exports of services (tourism). Imports maintained their level of the previous year while transfers (both official and private) fell slightly.
Customs revenue fell sharply, more than offsetting the increase in the direct tax collection. Grants (for projects and in support of the budget) increased, but public revenue overall was below expectations.

79
Chart 2.56 • Public expenditureChart 2.57 •STD billions
Chart 2.58 • Budget balance STD billions
0
700
1,400
2,100
2,800
3,500
2010 2011 2012 2013 2014 2015 2016(budg.)
2016(est.)
2017(budg.)
Investment Wages Transfers and subsidies Other current expenditure
-15
-10
-5
0
2011 2012 2013 2014 2015 2016(budg.)
2016(est.)
2017(budg.)
Overall balance (commitment basis) Domestic primary balance
The structure and amounts of the different expenditure items remained essentially unchanged from the year before. Investment expenditure is still far below the levels registered in 2011 and 2012, despite the intentions expressed in the budget.
The domestic primary deficit (the main benchmark for budgetary policy) slipped in 2016 (3.1%) versus the forecast target (2.0%), essentially due to the poor performance of customs revenues and the inability to find offsetting reductions in expenditure.
Chart 2.59 • External debtSTD millions and % of GDP
Chart 2.60 • Liq. expansion/contraction factors Changes in % of initial stock of broad money
0
50
100
150
200
250
2009 2010 2011 2012 2013 2014(est.)
2015(est.)
2016(est.)
Commercial debt Multilateral debtBilateral debt Total (as % of GDP)Arrears (as % of GDP)
-50
-25
0
25
50
75
2010 2011 2012 2013 2014 2015 2016 2017(June)
2017(proj.)
Net foreign assets Credit to the economyNet credit to central gov. Other net dom. assetsBroad money
The value of external debt fell slightly, reaching around 82% of GDP. Concessional loans did not materialise as forecast, preventing the debt ratio from increasing. The share of external debt in arrears has fallen.
The behaviour of the monetary aggregates in 2016 was restricted by the banking sector's operating conditions. The pronounced fall in net foreign assets was a reversal in the behaviour of previous years, while credit essentially stagnated.
Chart 2.61 • Financial stability indicatorsBanking system ratios
Chart 2.62 • Effective exchange rateIndex: 100 = Jan. 1999, monthly averages
-30 -20 -10 0 10 20 30 40 50 60
Capital adequacy
Return on equity
Non-performing loans
Foreign-currency denom.credit
Asset liquidity
2014 2015 2016
100
120
140
160
180
200
2009 2010 2011 2012 2013 2014 2015 2016 2017
Nominal index Real index
(appreciation: + ; depreciation - )
May
The aggregate stability indicators for the banking sector improved in 2016 due to the closure of the institution with the severest problems. However, difficulties continue over the non-performing loans situation and the near-zero profitability of most institutions.
Nominal exchange rate stability has existed since 2010. The swings observed in the EERI since mid-2015 are mainly due to a strong de-valuation in the kwanza and – in the case of the real index – strong inflation in Angola.
São Tomé and Príncipe

BANCO DE PORTUGAL • Economic Developments in Portuguese-speaking African Countries and Timor-Leste • 2016 | 201780
Table 2.54 • Economic indicators
2012 2013 2014 20152016 2017
Proj Est. Proj. Est.
Output and pricesNominal GDP STD billions
EUR millions
USD millionsReal GDP Annual % changeInflation y-o-y % change
Average % change
Public financesTotal revenue % of GDP
Current revenue % of GDP
Grants % of GDP
Total expenditure % of GDP
of which: Current expenditure % of GDP
Capital expenditure % of GDP
Domestic primary balance(a) % of GDP
Overall balance (commitment basis)
% of GDP
Overall balance (cash basis) % of GDP
Money and creditNet credit to central government Annual % change
Credit to the economy Annual % change
Broad money Annual % change
BCSTP reference interest rate Annual rate
Balance of paymentsExports f.o.b. Annual % change
Imports f.o.b. Annual % change
Trade balance % of GDP
Services balance % of GDP
Current account % of GDP
BCSTP net foreign assets EUR millions
USD millions
External public debtTotal external public debt USD millions
% of GDP
Exchange ratesExch. rate EUR / STD Average annual
rateExch. rate USD / STD Average annual
rateNominal(b) EERI (appreciation: +) Annual % change
Real(b) EERI (appreciation: +) Annual % change
Sources: Banco Central de São Tomé e Príncipe, Ministry of Finance (São Tomé and Príncipe), IMF and Banco de Portugal calculations.Notes: (a) Domestic primary balance corresponds to overall balance (commitment basis), excluding grants, oil revenue (signature bonuses and other), debt interest and capital expenditure financed by external sources. (b) Effective exchange rate index (EERI), calculated on the basis of exchange rates applied to the currencies of the main trading partners.
5,064 5,639 6,443 6,978 7,741 7,592 8,248 –
206.7 230.2 263.0 284.8 316.0 309.9 336.7 –
263.6 302.9 346.5 313.7 351.5 340.4 374.7 –
4.5 4.0 6.5 3.8 5.0 4.1 5.0 –
10.4 7.1 6.4 4.0 4.0 5.1 3.0 5.8 June
10.6 8.1 7.0 5.2 4.6 5.6 4.0 5.2 June
33.3 31.0 26.4 28.2 33.9 28.6 32.5 –
15.2 17.0 14.8 15.9 16.5 13.9 16.4 –
17.3 12.5 10.2 11.5 17.4 13.7 16.1 –
44.0 33.1 30.4 35.7 45.8 33.1 37.1 –
17.3 18.7 16.9 19.4 18.1 17.8 17.6 –
26.4 14.0 13.4 15.6 26.8 15.0 18.9 –
-3.2 -2.6 -2.7 -3.0 -2.0 -3.1 -1.8 –
-10.7 -2.0 -4.1 -7.5 -11.9 -4.6 -4.6 –
-9.0 -1.6 -4.2 -7.1 -11.9 -2.4 -4.6 –
459.1 103.3 0.8 28.2 -111.8 22.6 -10.4 31.1 June
10.5 -1.7 -1.1 3.8 7.1 6.3 5.6 1.2 June
20.8 15.7 16.8 13.2 11.1 -4.8 24.5 -6.1 June
14.0 14.0 12.0 10.0 – 10.0 – 9.0 June
37.3 -14.6 33.3 -28.5 30.1 10.6 18.4 –
2.9 15.1 12.4 -16.5 7.0 -1.4 8.5 –
-36.6 -38.2 -36.8 -34.6 -32.2 -31.0 -30.2 –
-2.5 -9.0 -3.9 -0.2 -3.1 5.4 1.3 –
-20.9 -23.4 -21.4 -17.0 -12.1 -9.4 -11.3 –
43.3 52.7 60.2 77.7 89.0 72.4 79.1 72.7 June
55.3 69.4 79.3 85.6 99.0 79.6 88.0 81.0 June
219.5 228.4 242.5 279.4 – 278.1 – 284.8 Mar.
83.3 75.4 70.0 89.1 – 81.7 – 83.7 Mar.
24,500 24,500 24,500 24,500 24,500 24,500 24,500 24,500 June
19,211 18,618 18,594 22,178 22,023 22,282 22,012 21,999 June
-1.4 0.9 0.5 0.4 – 6.9 – 0.3 June
4.5 6.8 6.0 3.0 – 5.5 – -3.2 May

81
Table 2.55 • Gross domestic productCurrent prices, STD billions
2011 2012 2013 2014 2015 2016 Est. Prov. Prov.
Primary sectorAgriculture, livestock, hunting and forestry
Fishing
Mining and quarrying
Secondary sector
Manufacturing
Electricity, gas and water
Construction
Tertiary sector
Trade
Accommodation and food
Transportation, storage and communication
Financial activities
Real estate activ., rental and serv. to enterprises
Public admin., defence and social security
Education
Health and social work
Other activities
FISIM (Financial intermed. servs. indirectly measured)Indirect taxes
Gross domestic product m.p.
Exports of goods and services
Imports of goods and services
Memo items:
GDPmp (real % change)
GDPmp (nominal % change)
Nominal GDP (EUR millions; current prices)
Nominal GDP (USD millions; current prices)
Sources: Banco Central de São Tomé e Príncipe, Ministry of Finance (São Tomé and Príncipe), and IMF.
513 570 689 751 853 869
260 287 338 345 361 299
237 267 334 388 472 549
15 16 17 18 19 21
718 748 863 1,070 973 1,212
367 355 406 417 435 533
127 120 132 128 135 142
224 273 324 525 402 537
2,997 3,372 3,901 4,476 4,987 5,317
1,257 1,340 1,532 1,687 1,778 1,870
157 144 170 233 361 415
623 612 635 719 852 847
111 121 134 148 160 173
261 268 304 370 405 459
206 407 505 569 631 676
125 205 295 378 391 427
53 51 69 80 82 92
203 223 256 291 326 357
-130 -145 -168 -197 -208 -230
278 271 304 342 374 423
4,229 5,064 5,639 6,443 6,978 7,592
512 634 912 1,646 2,004 2,255
2,563 2,761 3,256 4,267 4,137 4,195
4.9 3.1 4.8 6.5 3.8 4.1
17.7 19.7 11.4 14.3 8.3 8.8
172.6 206.7 230.2 263.0 284.8 309.9
246.5 263.6 302.9 346.5 313.7 340.4
São Tomé and Príncipe

BANCO DE PORTUGAL • Economic Developments in Portuguese-speaking African Countries and Timor-Leste • 2016 | 201782
Table 2.56 • Consumer price indexPer cent
Monthly change Cumulative change Year-on-year change Average change
[1] [2] [3] [4]
2005 December2006 December
2007 December
2008 December
2009 December
2010 December
2011 December
2012 December
2013 December
2014 December
2015 December
2016 December
2015 JanuaryFebruary
March
April
May
June
July
August
September
October
November
December
December (proj.)
2016 January
February
March
April
May
June
July
August
September
October
November
December
December (proj.)
2017 January
February
March
April
May
June
December (proj.)
Sources: Banco Central de São Tomé e Príncipe, Ministry of Finance, IMF and Banco de Portugal calculations.Notes: [1] month (n) / month (n-1); [2] month (n) / Dec. (n-1); [3] month (n) / month (n) of the previous year; [4] last 12 months / previous 12 months.
– 17.2 17.2 17.2– 24.6 24.6 23.1
– 27.6 27.6 18.5
– 24.8 24.8 32.0
– 16.1 16.1 17.0
– 12.9 12.9 13.3
– 11.9 11.9 14.3
– 10.4 10.4 10.6
– 7.1 7.1 8.1– 6.4 6.4 7.0
– 4.0 4.0 5.2
– 5.1 5.1 5.6
0.3 0.3 6.4 6.9
0.3 0.6 6.3 6.9
0.5 1.1 6.5 6.8
0.4 1.5 6.1 6.8
0.2 1.7 5.5 6.6
0.2 1.9 5.0 6.5
0.3 2.2 5.1 6.3
0.1 2.3 5.0 6.1
0.1 2.4 4.8 5.9
0.3 2.7 4.3 5.6
0.5 3.2 4.4 5.5
0.8 4.0 4.0 5.2
– – 5.2 5.8
0.8 0.8 4.5 4.9
0.2 0.9 4.4 4.8
0.8 1.7 4.7 4.6
1.6 3.4 8.1 5.0
0.5 3.9 6.2 5.0
-0.4 3.4 5.6 5.1
0.2 3.7 5.5 5.1
0.1 3.8 5.5 5.2
0.3 4.1 5.8 5.2
0.4 4.5 5.8 5.4
0.8 5.4 6.2 5.5
-0.2 5.1 5.1 5.6
– – 4.0 4.6
0.4 0.4 4.7 5.6
0.3 0.7 4.9 5.7
0.8 1.5 4.9 5.7
1.2 2.7 4.3 5.4
-0.4 2.3 3.5 5.1
1.8 4.1 5.8 5.2
– – 3.0 4.0

83
Table 2.57 • Balance of paymentsUSD millions
2012 2013 2014 2015 2016 2017
Est. Est. Proj. Est. Proj.
1. Current account
1.1. Trade balance
Exports (f.o.b.)
of which: Cocoa
Re-exports
Imports (f.o.b.)
of which: Food
Capital goods
Fuel
1.2. Services
Exports
of which: Travel and tourism
Imports
of which: Freights and insurance
1.3. Income
Credit
Debit
of which: Scheduled debt interest
1.4. Current transfers
Private transfers
of which: Emigrants' remittances
Official transfers (net)
of which: Project grants
Other transfers (incl. HICP)
2. Capital and financial account2.1. Capital account
2.2. Financial account
Foreign direct investment
of which: Oil signature bonuses
Portfolio investment (net)
Other investment (net)
Other assets
Public sector (net)
of which: Disbursements
Amortisation
Private sector (net)
Commercial banks
Short-term private capital
3. Errors and omissions
4. Overall balance (1) + (2) + (3)
5. Financing gap: (4) + (5)
Change in foreign reserves(a) (increase: -)
National Oil Account (increase: - )
Use of IMF resources (net)
Memo item:
Current account (% of GDP)
Sources: Banco Central de São Tomé e Príncipe, International Monetary Fund and Banco de Portugal calculations.Note: (a) Excludes National Oil Account flows.
-55.2 -70.9 -74.2 -53.3 -42.7 -31.9 -42.2
-96.6 -115.7 -127.4 -108.5 -113.3 -105.5 -113.1
15.1 12.9 17.2 12.3 16.0 13.6 16.1
5.3 5.4 9.2 7.8 11.4 10.4 12.0
8.8 5.9 7.0 3.3 3.4 3.2 2.9
-111.7 -128.6 -144.6 -120.8 -129.2 -119.1 -129.2
-33.5 -38.4 -42.5 -34.6 -34.2 -36.1 -34.0
-35.0 -38.5 -30.3 -27.7 -41.3 -31.2 -40.7
-27.2 -38.2 -41.1 -33.2 -23.8 -21.7 -26.1
-6.7 -27.3 -13.6 -0.7 -11.0 18.5 4.7
17.9 36.0 71.3 68.1 71.8 87.5 90.4
12.6 30.6 56.0 51.8 54.7 68.8 77.7
-24.6 -63.3 -84.9 -68.8 -82.8 -69.0 -85.7
-19.3 -18.8 -23.6 -19.6 – -19.9 –
-4.7 2.6 5.7 -0.1 1.0 2.9 -1.2
1.0 5.1 10.1 3.5 – 5.7 –
-5.7 -3.5 -4.4 -3.6 – -2.9 –
-1.9 -2.3 -2.4 -1.9 – -2.8 –
52.8 69.5 61.2 56.0 80.6 52.2 65.0
4.9 24.6 25.2 19.6 20.3 15.9 15.0
6.4 26.1 25.2 19.6 – 17.5 –
47.9 44.9 36.0 36.4 60.3 36.3 50.0
38.7 29.4 27.9 33.6 50.9 29.7 43.2
1.4 1.9 0.8 6.0 6.6 3.4 6.9
64.3 34.3 37.5 35.2 55.9 38.6 45.0
0.0 0.0 0.0 0.0 0.0 0.0 0.0
64.3 34.3 37.5 35.2 55.9 38.6 45.0
21.7 10.2 18.9 19.9 4.2 21.2 17.5
2.0 4.8 0.0 2.4 2.5 2.8 0.0
0.0 0.0 0.0 0.3 0.0 0.2 0.0
42.7 24.1 18.6 15.0 51.7 17.2 27.5
26.9 16.1 15.5 5.7 5.8 7.1 0.0
15.2 3.1 15.6 32.9 26.8 4.2 8.2
22.1 10.8 16.3 34.5 28.1 9.0 11.5
-6.9 -7.7 -0.7 -1.6 -1.3 -4.8 -3.3
0.6 5.0 -12.5 -23.7 19.0 5.9 19.3
-11.0 10.6 -17.5 -9.7 1.5 -9.0 1.8
11.7 -5.6 5.0 -14.0 17.6 14.9 17.4
-10.3 48.1 46.3 36.6 0.0 -14.3 0.0
-1.2 11.6 9.5 18.5 13.2 -7.6 2.8
1.2 -11.6 -9.5 -18.5 -13.2 7.6 -2.8
1.4 -9.1 -10.5 -18.2 -13.0 7.8 -6.1
-0.8 -3.2 2.3 -0.4 -1.2 -1.2 2.2
0.6 0.7 -1.4 0.0 1.0 1.0 1.1
-20.9 -23.4 -21.4 -17.0 -12.1 -9.4 -11.3
São Tomé and Príncipe

BANCO DE PORTUGAL • Economic Developments in Portuguese-speaking African Countries and Timor-Leste • 2016 | 201784
Table 2.58 • Goods exportsDestinations as a percentage of total exports
2008 2009 2010 2011 2012 2013 2014 2015 2016Est.
France 3.7 5.5 0.3 2.3 8.8 11.6 13.2 5.1 25.8
7.9 18.9 20.2 29.5 13.9 20.7 24.4 24.8 6.3
28.2 26.8 10.9 37.4 38.8 29.1 21.4 36.1 20.7
49.2 32.3 44.4 13.2 7.7 6.2 1.1 5.1 2.8
0.4 0.7 0.3 1.8 1.1 0.9 0.2 0.5 0.1
10.6 15.8 23.9 15.8 29.7 31.5 39.7 28.4 44.3
7.8 9.2 10.9 11.0 15.1 12.9 17.2 11.3 13.6
Belgium
Netherlands
Portugal
Gabon
Other
Total exports(a)
Sources: Banco Central de São Tomé e Príncipe, Ministry of Finance and Banco de Portugal calculations.Note: (a) In USD millions.
Table 2.59 • Goods importsOrigins as a percentage of total imports
2008 2009 2010 2011 2012 2013 2014 2015 2016Est.
Angola 22.9 14.8 12.1 9.6 21.9 24.3 27.2 24.7 17.3
1.7 1.9 1.8 1.7 3.3 1.9 1.7 1.1 1.9
0.9 1.4 2.4 2.0 1.4 1.6 2.8 3.0 5.2
0.2 0.7 5.0 2.4 0.6 0.7 0.6 0.3 1.4
3.0 2.7 5.3 2.0 2.1 1.4 2.0 1.7 1.6
0.8 4.4 1.2 2.5 1.5 1.4 0.4 2.2 2.4
0.1 0.4 0.5 0.3 0.4 0.3 0.9 0.8 0.4
61.3 56.4 60.9 58.9 55.7 59.8 58.5 56.3 57.9
9.1 17.3 10.8 20.6 13.1 8.6 5.9 9.9 11.9
92.2 83.8 96.2 115.7 119.1 128.6 144.6 118.9 119.1
Belgium
China
France
Gabon
Japan
Netherlands
Portugal
Other
Total imports(a)
Sources: Banco Central de São Tomé e Príncipe, Ministry of Finance and Banco de Portugal calculations.Note: (a) In USD millions

85
Table 2.60 • External public debt USD millions
2010 2011 20122013 2014 2015 2016
Est. Est. Est Est
1. Medium and long-term debtof which: Arrears
1.1 Multilateral debt
of which: Arrears
BADEA
AfDB/ADF
EIB
IFAD
IMF
IDA
OPEC
1.2 Bilateral official debt
of which: Arrears
1.2.1 Paris Club members
of which: Arrears
Germany
Belgium
Spain
France
Russia
1.2.2 Other official creditors
of which: Arrears
Angola
Algeria
China
Former Yugoslavia
Portugal
1.3 Commercial debt
of which: Arrears
Italian entities
MSF
Other entities
2. Short-term debtof which: Arrears
Angola
Brazil
Equatorial Guinea
Nigeria
Total external public debt [1 + 2]
of which: Arrears
Memo items:
External debt service (program.) (as % of goods and servces exports)Total external public debt (% of GDP)
Total arrears (% of GDP)
Sources: Banco Central de São Tomé e Príncipe, Ministry of Finance, IMF and Banco de Portugal calculations.
139.7 155.2 179.7 188.6 202.6 239.6 238.8
69.1 67.7 81.6 82.7 85.7 72.4 66.6
38.6 42.1 41.0 43.7 41.5 42.7 40.3
0.0 0.0 0.0 0.0 0.0 0.0 0.0
5.1 5.8 5.9 5.8 7.1 9.4 10.5
3.2 2.2 2.1 5.5 5.3 5.3 4.4
1.4 0.9 0.9 0.6 0.3 0.1 0.0
6.5 7.9 8.0 7.7 6.9 6.7 6.4
5.0 4.9 5.5 6.0 4.6 4.6 4.3
13.4 14.9 14.1 14.0 14.0 13.8 12.3
4.0 5.5 4.5 4.1 3.3 2.8 2.4
75.3 87.3 98.9 107.7 125.1 154.7 152.7
43.3 41.9 41.9 45.5 49.6 49.2 30.8
0.9 0.9 0.9 1.0 1.1 0.0 0.8
0.0 0.0 0.0 0.0 0.0 0.0 0.0
0.0 0.0 0.0 0.0 0.0 0.0 0.0
0.9 0.9 0.9 1.0 1.1 0.0 0.8
0.0 0.0 0.0 0.0 0.0 0.0 0.0
0.0 0.0 0.0 0.0 0.0 0.0 0.0
0.0 0.0 0.0 0.0 0.0 0.0 0.0
74.4 86.4 98.0 106.7 124.0 154.7 151.9
43.3 41.9 41.9 45.5 49.6 49.2 30.8
32.0 32.0 32.0 32.0 49.0 63.0 67.5
3.1 0.0 0.0 0.0 0.0 0.0 0.0
17.0 17.3 17.3 18.6 18.8 28.4 18.4
8.8 8.8 8.8 8.8 8.8 8.8 8.8
13.4 28.2 39.8 47.3 47.3 54.5 57.2
25.8 25.8 39.7 37.2 36.1 42.2 45.8
25.8 25.8 39.7 37.2 36.1 23.2 35.8
25.8 25.8 25.8 24.3 24.3 24.3 24.3
– – 7.4 6.4 5.4 5.0 4.7
– – 6.5 6.5 6.4 12.9 16.8
17.7 27.7 39.8 39.8 39.8 39.3 39.3
13.4 17.7 3.4 3.4 7.7 3.4 7.7
3.4 3.4 3.4 3.4 3.4 3.4 3.4
4.3 4.3 4.3 4.3 4.3 4.3 4.3
0.0 0.0 2.1 2.1 2.1 1.6 1.6
10.0 20.0 30.0 30.0 30.0 30.0 30.0
157.4 182.9 219.5 228.4 242.5 279.4 278.1
82.5 85.4 85.0 86.1 93.4 75.8 74.3
35.2 47.5 52.0 78.9 – – –
81.0 76.8 83.3 75.4 70.0 89.1 81.7
42.5 35.9 32.3 28.4 27.9 24.2 21.8
São Tomé and Príncipe

BANCO DE PORTUGAL • Economic Developments in Portuguese-speaking African Countries and Timor-Leste • 2016 | 201786
Table 2.61 • Government operations STD billions
2012 2013 2014 20152016 2017
Budg. Est. l.e.(a) Budg.
1. Total revenue1.1. Current revenue
Tax revenueDirect taxesIndirect taxes
of which: Customs revenueOther tax revenue
Non-tax revenue1.2. Grants
Project grantsOther grants (incl. budget support)Debt relief-related grants
1.3. Oil signature bonuses
2. Total expenditure2.1. Current expenditure
Compensation of employeesGoods and servicesSubsidies and transfersPublic debt interest Other current expenditure
2.2. Capital expenditureWith domestic financingWith external financing
2.3. HICP Initiative-related expenditure
3. Overall balance (commitment basis) [1] - [2]
4. Change in arrears [decrease: -]External arrears (interest)Domestic arrears
5. Items in transit, errors and omissions
6. Overall balance (cash basis) [3] + [4] + [5]
7. Financing7.1. Domestic financing
Net bank credit (excl. NOA(b))Non-bank financing
7.2. External financingDirect disbursements to the GSBudgetDisbursements for projectsScheduled amortisation
7.3. Transfer from/to NOA(b) [Budget inflows: +]
Memo items:Overall balance, commitment basis (% of GDP)Domestic primary balance (c) (STD billions)Domestic primary balance (c) (% of GDP)
Sources: Banco Central de São Tomé e Príncipe, Ministry of Finance, IMF and Banco de Portugal calculations.Notes: (a) Level of budget execution, per cent. (b) National Oil Account (NOA). (c) Domestic primary balance corresponds to overall balance (commitment basis), excluding grants, oil revenue (signature bonuses and other), debt interest and capital expenditure financed by external sources.
1,685 1,750 1,698 1,965 2,625 2,168 82.6 2,678771 956 951 1,107 1,276 1,056 82.8 1,350704 854 881 1,006 1,170 949 81.1 1,237222 282 300 344 406 377 92.9 436388 460 490 550 661 463 70.0 673334 398 407 455 551 371 67.3 545
93 112 92 112 104 108 103.8 12867 102 70 101 106 107 100.9 112
876 704 657 804 1,349 1,038 76.9 1,328706 509 541 610 995 891 89.5 846142 173 103 61 205 81 39.5 329
28 22 13 133 149 65 43.6 15439 90 90 53 0 74 – 0
2,226 1,864 1,961 2,488 3,544 2,516 71.0 3,058
875 1,056 1,086 1,356 1,402 1,356 96.7 1,450419 521 569 623 676 684 101.2 702198 216 158 239 240 249 103.8 251190 256 245 248 311 282 90.7 326
30 28 28 52 56 34 60.7 5239 34 86 194 118 106 89.8 119
1,336 790 865 1,087 2,074 1,140 55.0 1,56274 60 58 51 540 50 9.3 445
1,262 730 807 1,036 1,534 1,090 71.1 1,11714 17 10 45 68 19 27.9 47
-540 -114 -262 -523 -919 -348 37.9 -380
33 -22 -22 95 0 77 – 0
0 0 0 0 0 0 – 033 -22 -22 95 0 77 – 0
51 47 13 -67 0 86 – 0
-456 -89 -271 -495 -919 -185 20.1 -380
456 89 271 495 919 185 20.1 380
-86 50 -56 -71 388 150 38.7 359
-86 -71 -56 -71 0 150 – 00 121 0 0 388 0 0.0 359
558 94 282 575 478 63 13.2 -2975 0 77 20 0 32 – 0
532 159 238 742 659 143 21.7 150-49 -64 -33 -187 -181 -112 61.9 -179
-15 -56 44 -9 53 -28 -52.8 51
-10.7 -2.0 -4.1 -7.5 -11.9 -4.6 – -4.6-163 -149 -175 -209 -155 -233 – -148
-3.2 -2.6 -2.7 -3.0 -2.0 -3.1 – -1.8

87
Table 2.62 • Monetary survey STD billions
2011 2012 2013 2014 2015 2016 Dec. 16/ Dec. 15
2017 Jun 17/ Dec. 16
Dec. Dec. Dec. Dec. Dec. Proj. Dec. [A] [B] Proj. Jun. [A] [B]
1. Net foreign assets 1,263 1,630 1,648 2,230 2,527 2,836 2,105 -16.7 -14.8 2,632 2,010 -4.5 -3.5891 1,062 1,292 1,474 1,903 2,180 1,775 -6.7 -4.5 1,937 1,782 0.4 0.3
372 568 356 756 624 656 330 -47.1 -10.4 696 228 -30.9 -3.8
303 250 501 278 313 320 598 90.9 10.0 732 528 -11.8 -2.61,728 1,811 1,651 1,630 1,630 2,129 1,681 3.2 1.8 1,837 159 -90.6 -56.3
-22 -123 -250 -252 -323 38 -396 22.3 -2.5 -355 -519 31.3 -4.6
267 236 246 258 255 255 424 66.0 5.9 254 366 -13.6 -2.1
-290 -359 -496 -510 -579 -217 -819 41.6 -8.5 -610 -885 8.1 -2.4
1,750 1,934 1,902 1,882 1,953 2,091 2,077 6.3 4.3 2,193 2,102 1.2 0.9
-1,424 -1,561 -1,152 -1,352 -1,317 -1,809 -1,084 -17.7 8.2 -1,106 -1,055 -2.6 1.0
1,566 1,879 2,147 2,508 2,840 3,156 2,703 -4.8 -4.8 3,364 2,538 -6.1 -6.1177 173 187 223 247 259 259 4.7 – 275 226 -12.6 –
955 1,070 1,404 1,585 1,935 2,182 1,878 -2.9 – 2,308 1,709 -9.0 –
493 561 872 884 1,184 1,243 1,264 6.7 – 1,416 1,120 -11.3 –
462 510 532 701 751 939 615 -18.1 – 892 589 -4.2 –
434 636 556 701 658 715 567 -13.9 – 781 603 6.4 –
53 184 303 465 475 486 387 -18.5 – 548 429 10.7 –
381 452 253 236 183 229 179 -2.2 – 233 174 -2.8 –
1.1. Central bank
1.2. Commercial banks
2. Net domestic assets2.1. Net domestic credit
2.1.1. Net credit to centr. gov.
2.1.1.1. Gross loans to centr. govt.2.1.1.2. Deposits of centr. govt.
2.1.2. Credit to the economy
2.2. Other assets and liabilities (net)
3. Broad money3.1. Currency in circulation
3.2. Demand deposits
3.2.1. In national currency
3.2.2. In foreign currency
3.3. Other deposits
3.3.1. In national currency
3.3.2. In foreign currency
Sources: Banco Central de São Tomé e Príncipe, International Monetary Fund and Banco de Portugal calculations.Notes: [A] Percentage changes from the end of the previous year. [B] Percentage changes in relation to the initial stock of broad money (liquidity expansion/contraction factors).
Table 2.63 • Interest ratesAnnual rates, per cent
2011 2012 2013 2014 2015 2016 2017
Dec. Dec. Dec. Dec. Dec. Mar. Jun. Sep. Dec. Mar. Jun.
1. BCSTP reference rate
2. Lending rates2.1. Credit (91-180 days)
2.2. Credit (181 days-1 year)
2.3. Credit (over 1 year)
3. Deposit rates3.1. Deposits (up to 90 days)
3.2. a. Deposits (91 days-1 year)
3.2. b. Deposits (91-180 days)
3.2. c. Deposits (181 days-1 year)
3.3. Deposits (over 1 year)
4. Interest rate of Treasury Bills(b)
Memo item:
Inflation (year-on-year % change)
Source: Banco Central de São Tomé e Príncipe.Notes: Indicative rates (calculated on the basis of raw information provided by banks). (a) The series of deposit rates (term deposits) before and after 2012 are not comparable due to changes in classification. (b) Primary market Treasury Bill interest rate (year or quarter of issuance).
15.0 14.0 14.0 12.0 10.0 10.0 10.0 10.0 10.0 10.0 9.0
26.0 26.0 23.0 23.0 23.5 18.9 18.9 19.3 19.3 20.3 –
26.0 26.0 23.3 22.9 23.2 19.0 18.8 19.2 19.2 20.1 –
26.5 26.5 25.1 24.2 22.8 20.1 19.9 20.4 20.3 21.1 –
12.2 12.2 – – – – – – – – –
13.7 13.7 – – – – – – – – –
– – 10.0 7.6 8.0 3.9 3.8 3.9 3.8 5.8 –
– – 10.1 8.9 6.3 4.2 4.1 4.1 4.2 3.9 –
12.8 12.8 8.0 9.4 6.2 4.0 3.9 3.9 3.9 4.4 –
– – – – 6,2 3,0 – – – 3,0 –
11.9 10.4 7.1 6.4 4.0 4.7 5.6 5.8 5.1 4.9 5.8
São Tomé and Príncipe

BANCO DE PORTUGAL • Economic Developments in Portuguese-speaking African Countries and Timor-Leste • 2016 | 201788
Table 2.64 • Financial stability indicatorsPer cent
2012 2013 2014 2015 2016 2017
Dec. Dec. Dec. Dec. Mar. Jun. Sep. Dec. Mar.
Capital AdequacyTier 1 ratio 20.3 22.7 22.6 24.1 24.0 23.9 25.5 27.8 34.4
88 75 75 86 86 86 100 100 100
0 13 0 0 0 0 0 0 0
13 13 25 14 14 14 0 0 0
22.7 18.4 20.3 15.5 13.9 12.9 20.6 22.5 24.5
57.9 53.9 46.5 42.1 44.2 39.3 30.1 27.5 28.1
15.4 16.9 19.1 29.8 32.7 35.9 28.4 27.1 28.3
39.4 56.3 45.1 68.7 75.5 69.0 59.2 71.0 73.8
-0.8 -2.1 -3.1 -5.1 -1.7 -2.2 0.1 0.0 0.2
-3.2 -9.3 -15.9 -27.0 -9.5 -12.1 0.9 0.1 1.2
117.8 471.0 164.5 215.9 244.2 189.1 100.2 108.6 92.2
37.8 40.8 45.8 52.0 48.5 49.2 53.1 54.0 49.5
61.5 39.6 72.7 72.5 68.4 67.1 79.6 84.6 70.4
64.7 56.3 47.3 47.1 47.7 47.5 43.4 47.0 50.8
30.8 27.0 28.1 30.0 29.5 29.0 24.5 26.6 29.4
101.7 85.8 69.6 63.5 65.1 64.4 61.0 63.5 60.6
Percentage of banks w/ratio >= 10%
Percentage of banks w/ratio > 6% and < 10%
Percentage of banks w/ratio < 6%
Capital (net)/Assets
Asset QualityCredit in foreign currency/total credit
Non-performing loans/total loans
Liabilities/defaults
ReturnReturn on assets (ROA)
Return on equity (ROE)
Costs/returns
LiquidityLiquid assets/total assets
Liquid assets/short-term liabilities
Credit/total liabilities
Foreign currency-denominated liabilities/total liabilitiesCredit/deposits
Sources: Banco Central de São Tomé e Príncipe.

89
Table 2.65 • Exchange ratesAverage rates
EUR/STD USD/STD EERI(a)(b)
Exchange rate Annual change Exchange rate Annual change Nominal Real
2007
2008
2009
2010
2011
2012
2013
2014
2015
2016
2015 January
February
March
April
May
June
July
August
September
October
November
December
2016 January
February
March
April
May
June
July
August
September
October
November
December
2017 January
February
March
April
May
June
Sources: Banco Central de São Tomé e Príncipe and Banco de Portugal calculations. Notes: (a) Effective exchange rate index (EERI), calculated on the basis of exchange rates applied to the currencies of São Tomé and Príncipe's main trading partners; (b) An increase / decrease in the EERI (nominal or real) corresponds to an appreciation / depreciation of the STD.
18,558 18.7 13,537 8.8 134.6 103.8
21,602 16.4 14,685 8.5 116.9 113.5 22,510 4.2 16,208 10.4 112.2 124.6
24,500 8.8 18,574 14.6 105.4 127.3
24,500 0.0 17,754 -4.4 107.0 139.8 24,500 0.0 19,211 8.2 105.5 146.1
24,500 0.0 18,618 -3.1 106.5 156.1
24,500 0.0 18,594 -3.1 107.0 165.5
24,500 0.0 22,178 19.3 107.4 170.4
24,500 0.0 22,282 0.5 114.8 179.8
24,500 0.0 21,090 16.4 105.3 168.7
24,500 0.0 21,745 20.3 105.1 168.6
24,500 0.0 22,739 27.4 104.5 165.8
24,500 0.0 22,612 26.5 103.0 163.5
24,500 0.0 21,861 21.8 105.6 166.9
24,500 0.0 21,820 20.1 108.1 170.8
24,500 0.0 22,452 23.9 108.3 171.2
24,500 0.0 22,189 19.8 108.6 172.6
24,500 0.0 21,996 15.3 110.4 174.2
24,500 0.0 21,957 12.8 110.4 174.2
24,500 0.0 22,951 16.0 109.4 173.1
24,500 0.0 22,723 13.6 109.6 174.5
24,500 0.0 22,386 6.1 113.1 181.7
24,500 0.0 22,234 2.2 114.1 182.7
24,500 0.0 22,275 -2.0 114.3 180.5
24,500 0.0 21,780 -3.7 115.7 184.0
24,500 0.0 21,804 -0.3 115.7 183.0
24,500 0.0 21,980 0.7 115.5 180.4
24,500 0.0 22,301 -0.7 115.1 178.7
24,500 0.0 22,019 -0.8 115.4 179.2
24,500 0.0 22,014 0.1 115.4 178.1
24,500 0.0 22,368 1.9 115.0 177.1
24,500 0.0 22,836 -0.5 114.5 177.5
24,500 0.0 23,386 2.9 113.9 175.3
24,500 0.0 23,247 3.8 114.1 176.1
24,500 0.0 23,188 4.3 114.1 175.9
24,500 0.0 23,113 3.8 114.2 174.2 24,500 0.0 23,068 5.9 114.3 175.2
24,500 0.0 22,353 2.5 115.3 175.3
24,500 0.0 21,999 0.1 115.8 –
São Tomé and Príncipe


2.6. Timor-LesteArea: 14,954 Km2
Capital city: Dili
Population: 1.269 million (2016; source: World Bank)
Currency: US dollar (USD)
The latest estimates indicate that growth in the Timorese economy (non-oil sector) in 2016 is expected to have exceeded 5 per cent, the highest level for the past five years. In turn, revenue from the exploitation of energy resources (oil and gas) dropped even more markedly than in the previous year, which led to a current account deficit for the first time in Timor-Leste. After the negative trend observed since 2015, consumer prices stabilised at the start of 2017. The end of the appreciation of the US dollar (Timor-Leste’s official currency) against the currencies of its main trading partners is expected to have contributed to this. The value of the Petroleum Fund declined (slightly) further in 2016, as a combined result of lower oil revenue and the need to cover public expenditure.

BANCO DE PORTUGAL • Economic Developments in Portuguese-speaking African Countries and Timor-Leste • 2016 | 201792
The latest estimates on the behaviour of the Timorese economy (excluding the energy sector) indicate a stronger momentum than in previous years (a real rate of change of 5.4 per cent). Growth was still considerably lower than the high rates recorded in 2010 and 2011. However, these rates were unsustainable, as they were based on costly public investment projects and a considerable increase in social benefits. In turn, the current behaviour is due to a gradual intensification of favourable conditions for economic activity, namely in the private sector. Buoyant economic activity is crucial, given that income from the exploitation of energy resources has been declining rapidly, and it still remains unclear when the exploitation of already identified oil fields is to begin. In 2016 non-oil GDP exceeded oil and gas production (as had already been the case for the first time in 2015).
Since the last quarter of 2015, consumer prices have followed a deflationary trend, chiefly due to the behaviour of import prices, given that the currencies of the main countries of origin of Timorese imports (most notably, the Indonesian rupiah) had been depreciating against the US dollar, which is Timor-Leste’s official currency. This trend was countered by a recent (moderate) fall in the US dollar, while the price level stabilised overall since the beginning of 2017.
Since its independence (in 2002), Timor-Leste has always posted external current account surpluses, initially owing to transfers from its development partners and, from 2006 onwards, due to massive inflows of oil revenue. Timor-Leste posted a current deficit for the first time in 2016, given that this revenue declined again substantially, while income from the Petroleum Fund’s financial investments did not offset the decline in revenue. Indeed, the current environment in international financial markets is not conducive to high financial gains, although the Fund’s financial assets are increasingly sophisticated and diversified.
Foreign assets in the Petroleum Fund (approximately 9 times the size of GDP) and in foreign exchange reserves still allow the country to remain in a comfortable position in terms of its external payments, but it is crucial
that it ensures the economy is able to compete abroad, despite the difficulties arising from the small size of its economy and the lack of infrastructure (which nevertheless improved considerably in the past few years).
Timorese exports continue to be mostly composed of coffee. Although of excellent quality, Timorese coffee needs its production to be thoroughly and urgently modernised. In 2016 Canada became for the first time an important destination market for Timorese coffee, together with the United States and Germany. Goods exports grew slightly in 2016, but continue to account for only 3 per cent of imports.
Indonesia and China are the main suppliers of import goods, with the latter exceeding in 2016 other, more traditional, partners, such as Singapore, Malaysia and Vietnam. The strengthening of China as a trading partner is related to the increasing presence of Chinese economic interests in Timor-Leste, most notably in trade, restaurants and hotels. The value of imports in 2016 fell by around 15 per cent from the previous year, enhancing the decline of the previous year, due to the termination of the process of acquiring costly capital goods for the power stations that were built from 2011 to 2014.
The fall in oil revenue intensified the public account imbalance, increasingly financed by the Petroleum Fund, despite the marked growth of domestic tax revenue in 2016, as a result of a more efficient tax administration and greater momentum in local economic activity.
The preparation (and implementation) of the budget for 2017 was somewhat influenced by the fact that elections were held this year for the President of the Republic and the Parliament, with the new government expected to submit an amended budget at the start of its term of office. In any case, the infrastructure investment policy is expected to continue, more specifically investment in transport infrastructure (roads and ports), measures which are considered essential to creating the conditions for the economy’s private sector growth.
In 2016 public expenditure increased from the previous year, owing, to a large extent, to

93
the implementation of the investment projects envisaged for the Oecusse special economic zone and the road network. The execution rate in the investment component was above 100 per cent (which is uncommon), while execution in current expenditure was close to 97 per cent.
Around 80 per cent of public expenditure is financed by Petroleum Fund transfers, illustrating the dependence of public accounts on these financial reserves. The value of this Fund increased continuously up to 2014, but since then its revenue (taxes and royalties paid by oil companies and income from financial investments) have been below the amounts transferred to the Treasury (particularly in 2016). In the first half of 2017, the value of the Fund recovered somewhat (again exceeding USD 16.5 billion), owing to positive developments in income from a number of financial asset classes and a decreased need for public funding.
The value of the banking sector’s net foreign assets increased slightly in 2016 (albeit with a few intra-annual fluctuations), while credit remained practically stagnated, resulting in an increase in money supply of around 14 per cent. In the first half of 2017, a decline in foreign assets led to a contraction in broad money (around 8 per cent), despite slightly more dynamic credit (9 per cent increase).
Although small, the banking sector of Timor-Leste has continued to make substantial progress in terms of consolidating its infrastructure, most notably as regards modernising its payment system by adopting real-time electronic payment and transfer practices which are uncommon in economies at this stage of development. The recent launch of a credit guarantee initiative aims to ease constraints on the development of the banking sector’s role in supporting the economy.
The US dollar was adopted as Timor-Leste’s official currency in 2000 and continues to be its currency, as it is recognised that it has served the country’s economic interests adequately. The fact that Timor-Leste is not able to conduct monetary and exchange policy autonomously is not particularly relevant, given the structural characteristics of the economy (and the fact that the overwhelming majority of Timor-Leste’s external revenue is denominated in USD).
The country has also issued its own coins since 2003, with denominations indexed to the US dollar, an initiative which is to be strengthened soon with the introduction of the 200 centavo coin (corresponding to 2 US dollars).
Table 2.66 • Main economic indicators
2011 2012 2013 2014 2015 2016 2017
Est. Est. Proj.
Total GDP (real annual % change)
Non-oil GDP (real annual % change)
Inflation (year-on-year % change)
Broad money (rate of change)
Current account (% of non-oil GDP)
Fiscal balance (% of non-oil GDP)
Oil revenue (% of non-oil GDP)
Petroleum Fund (% of non-oil GDP)
Sources (for the subsequent charts also): Banco Central de Timor-Leste, Ministry of Finance of Timor-Leste and International Monetary Fund.Notes: (a) The inflation figure for 2017 corresponds to the year-on-year change recorded at the end of July. (b) The figure for 2017 corresponds to the figure observed in June.
11.9 4.8 -10.9 -26.0 20.9 – –
7.9 5.0 2.7 4.3 4.0 5.4 4.0
17.4 9.1 4.0 0.3 -0.7 0.1 1.0(a)
10.5 24.8 22.9 20.0 7.0 14.3 -8.4(b)
222 219 171 75 15 -31 –
233 233 168 63 7 -46 -14
326 318 234 145 80 32 52
877 944 1,066 1,130 1,010 935 927(b)
Timor-Leste

BANCO DE PORTUGAL • Economic Developments in Portuguese-speaking African Countries and Timor-Leste • 2016 | 201794
Chart 2.63 • Non-oil GDP Real annual % change
Chart 2.64 • Oil GDP USD millions
10.1
7.9
5.0
2.7
4.3 4.0
5.4
4.0
0
4
8
12
2010 2011 2012 2013 2014 2015 2016(est.)
2017(proj.)
3,104
4,6245,477
4,234
2,591
1,4961,172
0
2,000
4,000
6,000
2010 2011 2012 2013 2014 2015 2016(est.)
The pace of economic growth in Timor-Leste (non-oil sector) picked up in 2016 from the previous years. The launch of a number of public and private investment projects (infrastructure and new industrial units respectively) is expected to have contributed to this new dynamic.
As expected, the fall in the value of oil production continued, owing to the gradual depletion of the Bayu-Undan oil field. The governments of Timor-Leste and Australia are negotiating the exploitation of new offshore oil fields.
Chart 2.65 • Inflation Annual % change in the CPI
Chart 2.66 • External accounts USD millions
-5
0
5
10
15
20
2010 2011 2012 2013 2014 2015 2016 2017
Year-on-year % change Average % change
-1,000
0
1,000
2,000
3,000
4,000
2010 2011 2012 2013 2014(est.)
2015(est.)
2016(est.)
Exports (goods and serv.) Imports (goods and serv.)Oil revenue Current account balance
The recent depreciation of the US dollar against the currencies of Timor-Leste’s main trading partners (specifically, the Indonesian rupiah) is expected to have contributed to the reversal of the deflationary trend observed since the last quarter of 2015.
The fall in oil revenue (both tax revenue and income from Petroleum Fund investments) and the maintenance of a high imbalance in the goods and services account were behind an unprecedented current account deficit.
Chart 2.67 • Goods exports Destinations as a %, total in USD millions
Chart 2.68 • Goods imports Origins as a %, total in USD millions
0
5
10
15
20
25
30
35
0%
20%
40%
60%
80%
100%
2010 2011 2012 2013 2014 2015 2016
Other Indonesia SingaporeGermany USA Total
0
200
400
600
800
1,000
0%
20%
40%
60%
80%
100%
2010 2011 2012 2013 2014 2015 2016
Other Australia ChinaSingapore Indonesia Total
Timor-Leste’s exports (mostly coffee) grew slightly from the previous year, but were nevertheless below the figures observed from 2010 to 2012. Canada became an important market for Timorese coffee for the first time.
The level of imports declined again in 2016, after increasing considerably from 2011 to 2014, owing to purchases of capital goods. Indonesia has consolidated its role as the country’s largest supplier, but China’s share has increased.

95
Chart 2.69 • Public revenue Non-oil GDP, per cent
Chart 2.70 • Public expenditure Non-oil GDP, per cent
0
100
200
300
400
2011 2012 2013 2014 2015 2016(est.)
2017(budg.)
Grants Other domestic revenue Tax revenue Oil revenue
0
35
70
105
140
2011 2012 2013 2014 2015 2016(est.)
2017(budg.)
Transfers and subsidies Goods and services Wages Investment
The decline in oil revenue intensified, as observed since 2012. In turn, domestic revenue increased in absolute terms and as a percentage of (non-oil) GDP.
After the fall observed in 2015, capital expenditure increased again (particularly in the road network and the Oecusse special economic zone). Social benefits payments continue to have a very important share in the public expenditure structure.
Chart 2.71 • Petroleum fund USD millions
Chart 2.72 • Monetary aggregates USD millions
0
5,000
10,000
15,000
20,000
0
800
1,600
2,000
3,000
4,000
4,800
2011 2012 2013 2014 2015 2016(est.)
2017(budg.)Annual oil revenue
Drawings for State Budg.Value of the Fund (right-hand sc.)
0
400
800
1,200
2011 2012 2013 2014 2015 2016(est.)
2017Jun.
Broad money (M2) Net foreign assetsNet government deposits Credit to the private sector
Increased recourse to the Petroleum Fund to cover public expenditure and the decline in oil revenue and income from financial investments resulted in a virtual stagnation in the value of the Fund, following years of marked growth up to 2014.
The behaviour of foreign assets and government deposits is strongly affected by transfers between the Petroleum Fund and the Treasury account. As in 2016, there was a reduction in broad money in the first half of 2017.
Chart 2.73 • Liq. expansion/contraction factors Changes in % of initial stock of broad money
Chart 2.74 • Effective exchange rate Index: 100 = 2001, monthly averages
-150
-100
-50
0
50
100
150
200
2010 2011 2012 2013 2014 2015 2016(est.)
2017Jun.
Net foreign assets Cred. to the private sectorNet cred. to central gov. Broad money (M2)
40
60
80
100
120
2010 2011 2012 2013 2014 2015 2016 2017
Nominal index Real index
[ appreciation: + ; depreciation: - ]
Jun
In 2016 the value of foreign assets stabilised somewhat, owing to lower inflows from oil exploitation. In the first half of 2017, credit to the private sector, which had stagnated since 2013, recovered slightly.
The appreciation of the USD against the currencies of Timor-Leste’s main trading partners, which began in 2011, is expected to have stabilised, no longer hampering the competitiveness of the Timorese economy, namely against Indonesia, its main trading partner.
Timor-Leste

BANCO DE PORTUGAL • Economic Developments in Portuguese-speaking African Countries and Timor-Leste • 2016 | 201796
Table 2.67 • Economic indicators
2010 2011 2012 20132014 2015 2016 2017
Est. Est. Est. Proj.
Output and pricesTotal GDP USD millions
real annual % change
Non-oil GDP USD millions
real annual % change
% of total GDP
Inflation y-o-y % change
aver. an. % change
Public finances
Total revenue % of non-oil GDP
Domestic revenue % of non-oil GDP
Oil revenue % of non-oil GDP
Grants % of non-oil GDP
Total expenditure % of non-oil GDP
Current expenditure % of non-oil GDP
Capital expenditure % of non-oil GDP
Overall balance % of non-oil GDP
Petroleum Fund % of non-oil GDP
Money and credit
Net foreign assets(a) USD millions
rate of change(b)
months of imports
Credit to the economy (priv. s.) USD millionsrate of change(b)
Public sector net deposits USD millions
rate of change(b)
Broad money USD millions
rate of change(b)
Balance of payments
Merchandise exports (c) USD millions
Merchandise imports USD millions
Oil income (d) USD millions
Current account USD millions
% of non-oil GDP
Capital and financial account USD millions
% of non-oil GDP
Overall balance USD millions
% of non-oil GDP
Exchange rates
USD / IDR (Indonesia) average rate
USD / AUD (Australia) average rate
Nominal EERI (Index: 100 = 2001(e))
rate of change(b)
Real EERI (Index: 100 = 2001)(e) rate of change(b)
Sources: Banco Central de Timor-Leste, Ministry of Finance and General Directorate of Statistics (Timor-Leste), International Monetary Fund and Banco de Portugal calculations.Notes: (a) Does not include Petroleum Fund assets; (b) Rate of change compared with the previous December; (c) Does not include oil/gas exports; (d) Includes payments to the State by energy companies and income from Petroleum Fund investments; (e) Effective exchange rate index (EERI) calculated on the basis of the exchange rates of Timor-Leste's main trading partners. Appreciation: + / Depreciation: -.
3,972 5,685 6,724 5,636 4,054 3,102 2,867 –
-1.3 11.9 4.8 -10.9 -26.0 20.9 – –
868 1061 1247 1,402 1,463 1,606 1,695 –
10.1 7.9 5.0 2.7 4.3 4.0 5.4 4.0
21.9 18.7 18.5 24.9 36.1 51.8 59.1 –
9.2 17.4 9.1 4.0 0.3 -0.7 0.1 1.0 Jul.
6.8 13.5 11.8 8.1 0.5 0.6 -1.6 -0.1 Jul.
316 363 349 264 175 100 55 64
11 10 11 11 11 11 14 12
269 326 318 234 145 80 32 52
36 27 20 19 18 10 9 –
123 130 116 96 111 93 101 78
58 48 55 52 62 64 63 58
65 82 61 44 49 29 38 20
193 233 233 168 63 7 -46 -14
795 877 944 1,066 1,130 1,010 935 927 Jun.
622 689 1,179 1,073 757 1,015 1,092 1,027 Jun.
40.4 10.8 71.1 -9.0 -29.5 34.1 7.6 -5.9 Jun.
5.6 4.4 8.5 10.7 7.4 7.6 11.2 10.6 Jun.
110 133 160 182 192 212 208 227 Jun.
5.8 20.9 20.3 13.8 5.3 10.6 -1.9 9.1 Jun.
331 413 841 651 207 339 416 403 Jun.
60.7 24.8 103.6 -22.6 -68.2 63.6 22.7 -3.1 Jun.
295 326 407 500 600 642 734 672 Jun.
10.1 10.5 24.8 22.9 20.0 7.0 14.3 -8.4 Jun.
102 108 103 88 90 92 97 –
1,343 1,866 1,661 1,204 1,226 1,306 1,167 –
2,412 3,559 3,766 3,317 2,148 1,590 543 –
1,678 2,352 2,736 2,391 1,093 239 -528 –
193.3 221.7 219.4 170.5 74.7 14.9 -31.1 –
-1,505 -2,249 -2,320 -2,545 -1,391 -99 381 –
-173.3 -211.9 -186.0 -181.5 -95.1 -6.2 22.5 –
156 90 388 -197 -376 127 -161 –
18.0 8.5 31.1 -14.0 -25.7 7.9 -9.5 –
9,085 8,777 9,384 10,463 11,913 13,387 13,307 13,299 Jun.
1.0 0.9 0.9 1.0 1.1 1.3 1.3 1.3 Jun.
-5.3 -0.2 1.9 15.6 5.1 10.5 8.5 -2.3 Jun.
-1.0 13.1 4.9 16.4 1.3 8.1 5.1 -3.4 Jun.

97
Table 2.68 • Gross domestic productCurrent prices, USD millions
2010 2011 2012 2013 2014 2015 2016
Est. Proj.
Agriculture, fishing and forestry
Mining and quarrying
of which: Extraction of petroleum and natural gas
Manufacturing, water and electricity
Construction
Trade and services
Trade, transportation, restaurants and hotels
Information and communication
Financial activities
Real estate
Professional, scient., technical and admin.
Other services
Public administration
Taxes less subsidies (on products)
Gross domestic product (total)
Gross domestic product (non-oil)
Gross domestic product (oil sector)
Consumption
Private consumption
Public consumption
Gross investment
Gross fixed capital formation
Changes in inventories
Domestic demand
Exports of goods and services
Exports of oil goods
Exports of non-oil goods and services
Overall demand
Imports of goods and services
Discrepancy (production/expenditure perspective)
Gross domestic product (total)
Memo item:
Non-oil GDP (real % change)
Total GDP (real % change)
Non-oil GDP (% of total GDP)
Sources: General Directorate of Statistics (Timor-Leste) (2000-15 National Accounts), Banco Central de Timor-Leste and Banco de Portugal calcu-lations.
191 194 244 279 284 281 –
3,069 4,609 5,472 4,227 2,579 1,475 –
3,069 4,608 5,471 4,225 2,578 1,473 –
10 10 10 11 12 13 –
70 165 205 268 235 286 –
366 410 450 512 494 508 –
192 217 234 233 250 289 –
45 56 62 43 43 46 –
3 8 9 11 12 12 –
100 115 151 157 177 181 –
25 30 37 42 48 49 –
66 65 51 63 61 57 –
173 202 253 307 350 382 –
29 13 -4 -5 5 32 –
3,972 5,685 6,724 5,636 4,054 3,102 2,867
868 1,061 1,247 1,402 1,463 1,606 1,695
3,104 4,624 5,477 4,234 2,591 1,496 1,172
1,539 1,626 1,777 1,768 1,888 1,887 –
630 691 800 898 937 953 –
910 936 977 871 951 934 –
478 824 731 623 636 570 –
478 821 703 602 616 553 –
0 2 28 21 21 17 –
2,017 2,450 2,508 2,391 2,525 2,457 –
4,008 5,523 6,524 5,309 3,900 2,346 –
3,920 5,428 6,401 5,217 3,824 2,276 –
88 95 123 93 77 70 –
6,025 7,973 9,032 7,700 6,425 4,803 –
2,027 2,298 2,394 2,077 2,404 1,717 –
-27 10 86 13 33 17 –
3,972 5,685 6,724 5,636 4,054 3,102 2,867
12.9 7.9 5.0 2.7 4.3 4.0 5.4
-6.7 11.9 4.8 -10.9 -26.0 20.9 –
21.8 18.7 18.5 24.9 36.1 51.8 53.9
Timor-Leste

BANCO DE PORTUGAL • Economic Developments in Portuguese-speaking African Countries and Timor-Leste • 2016 | 201798
Table 2.69 • Consumer price indexPer cent
Monthly change
Cumulative change
Year-on-year change
Average change
[1] [2] [3] [4]
2002 December2003 December2004 December2005 December2006 December2007 December2008 December2009 December2010 December2011 December2012 December2013 December2014 December2015 December2016 December
2015 JanuaryFebruaryMarchAprilMayJuneJulyAugustSeptemberOctoberNovemberDecemberDecember (proj.)
2016 JanuaryFebruaryMarchAprilMayJuneJulyAugustSeptemberOctoberNovemberDecemberDecember (proj.)
2017 JanuaryFebruaryMarchAprilMayJuneJulyDecember (proj.)
Sources: Banco Central de Timor-Leste, General Directorate of Statistics (Timor-Leste), International Monetary Fund and Banco de Portugal calculations.Notes: [1] month (n) / month (n-1); [2] month (n) / Dec. (prev. year); [3] month (n) / month (n) of the previous year; [4] past 12 months / previous 12 months.
– 9.5 9.5 – 4.2 4.2 7.2 – 1.8 1.8 3.2 – 0.9 0.9 1.1 – 7.3 7.3 3.9 – 8.6 8.6 10.3 – 7.5 7.5 9.0 – 1.8 1.8 0.7 – 9.2 9.2 6.8 – 17.4 17.4 13.5 – 9.1 9.1 11.8 – 4.0 4.0 8.1 – 0.3 0.3 0.5 – -0.7 -0.7 0.6
– 0.1 0.1 -1.6
0.7 0.7 0.5 0.5 0.0 0.7 0.5 0.4 0.1 0.8 0.5 0.3
-0.1 0.7 0.3 0.2 -0.1 0.6 1.0 0.3 0.0 0.6 1.2 0.5
-0.1 0.5 0.9 0.6 -0.2 0.3 0.6 0.6 -0.1 0.2 0.4 0.6 -0.1 0.1 0.4 0.6 -0.4 -0.3 -0.1 0.6 -0.4 -0.7 -0.7 0.6
– – 1.9 1.1 0.1 0.1 -1.2 0.3
-0.6 -0.5 -1.8 0.1 0.0 -0.5 -1.9 -0.1
-0.2 -0.7 -2.0 -0.3 -0.2 -0.9 -2.1 -0.5 -0.1 -1.0 -2.2 -0.8 0.1 -0.9 -2.0 -1.1
-0.1 -1.0 -1.9 -1.3 0.3 -0.7 -1.5 -1.4
-0.1 -0.8 -1.5 -1.6 0.3 -0.5 -0.9 -1.7 0.6 0.1 0.1 -1.6 – – 3.6 1.5
-0.1 -0.1 -0.1 -1.5 -0.1 -0.2 0.4 -1.3 0.2 0.0 0.6 -1.2
-0.1 -0.1 0.7 -1.1 0.2 0.1 1.1 -0.6
-0.4 -0.3 0.8 -0.4 0.3 0.0 1.0 -0.1
– – 1.0 0.8

99
Table 2.70 • Balance of paymentsUSD millions
2010 2011 2012 2013 2014 2015 2016
Est. Est. Est.
Current account
Trade account
Exports (a)
of which: Coffee
Imports
of which: Consumer and intermediate goods
Capital goods
Services
Exports
of which: Travel
Imports
Primary income
of which: Return on financial investments
Other primary income (oil exploitation)
Secondary income (net)
Capital and financial accountCapital account
Financial account
of which: Investment of oil savings
Foreign direct investment
External debt flows
Items in transit, errors and omissions
Overall balance
FinancingChange in net foreign assets (increase: - )
Memo items:
Current account (% of non-oil GDP)
Current account (% of total GDP)
Oil income(b) (% of non-oil GDP)
Capital and financial account (% of non-oil GDP)
Sources: Banco Central de Timor-Leste, International Monetary Fund and Banco de Portugal calculations.Notes: (a) The value of revenue from oil exports is accounted for as income and therefore is not recorded as goods exports. (b) Includes oil revenue and income from Petroleum Fund financial investments.
1,678 2,352 2,736 2,391 1,093 239 -528
-280 -373 -638 -679 -749 -635 -539
27 29 33 18 15 18 20
17 12 32 17 15 17 16
-307 -402 -672 -696 -764 -653 -559
-257 -303 -506 -552 -606 -517 -443
-50 -99 -166 -144 -159 -135 -116
-961 -1,385 -920 -437 -388 -580 -532
75 79 69 70 74 74 77
31 24 21 29 35 51 58
-1,036 -1,464 -989 -508 -462 -653 -608
2,435 3,577 3,862 3,327 2,149 1,454 543
278 312 207 275 331 611 320
2,134 3,247 3,559 3,042 1,817 979 224
484 533 432 179 84 164 -1
-1,505 -2,249 -2,320 -2,545 -1,391 -99 381
31 26 23 20 -3 29 30
-1,536 -2,275 -2,343 -2,564 -1,387 -128 351
-1,509 -2,424 -2,280 -2,556 -1,385 -212 412
55 14 51 62 47 35 -7
0 0 0 6 16 25 0
-17 -13 -28 -43 -81 -13 -14
156 90 388 -197 -376 127 -161
-156 -90 -388 197 376 -127 161
-156 -90 -388 197 376 -127 161
193.3 221.7 219.4 170.5 74.7 14.9 -31.1
39.3 41.4 41.0 42.4 27.0 7.7 -18.4
277.9 335.4 302.0 236.6 146.8 99.0 32.1
-173.3 -211.9 -186.0 -181.5 -95.1 -6.2 22.5
Timor-Leste

BANCO DE PORTUGAL • Economic Developments in Portuguese-speaking African Countries and Timor-Leste • 2016 | 2017100
Table 2.71 • Goods exports(a)
Destinations as a percentage of total exports
2010 2011 2012 2013 2014 2015 2016
United States 43.2 23.3 26.1 36.3 9.8 42.9 39.0
25.3 45.1 25.4 48.0 60.9 19.5 17.6
9.0 4.2 36.0 1.7 0.1 0.1 0.6
4.2 3.7 0.9 0.0 0.2 5.1 1.2
4.3 0.9 0.6 0.9 9.1 2.3 1.6
4.1 2.3 0.3 3.4 3.0 6.2 2.6
3.7 5.4 3.8 6.4 6.2 5.6 3.2
6.1 15.1 6.9 3.2 10.8 18.3 34.3
27.1 28.7 33.3 17.7 15.5 18.0 20.0
Germany
Singapore
Indonesia
Portugal
Australia
Japan
Other
Value of exports(b)
Sources: Banco Central de Timor-Leste, General Directorate of Statistics (Timor-Leste) and Banco de Portugal calculations.Notes: (a) Excluding oil imports; (b) USD millions.
Table 2.72 • Table 72 • Goods importsTable 2.73 • Origins as a percentage of total imports
2010 2011 2012 2013 2014 2015 2016
Indonesia 32.2 28.8 22.2 26.1 28.7 30.6 30.8
15.1 6.3 6.8 9.0 22.6 18.5 11.7
7.2 17.6 6.5 5.7 7.5 10.0 19.9
1.7 4.0 7.7 11.5 6.5 7.2 2.5
4.7 2.2 4.6 5.9 6.1 6.5 6.1
8.4 4.5 3.5 2.3 3.4 3.1 2.6
3.4 1.7 3.5 1.6 2.2 1.4 1.3
2.4 1.4 1.6 1.8 5.7 1.7 1.9
1.1 2.4 1.7 1.0 3.7 2.4 2.3
23.8 30.9 41.9 35.2 13.5 18.6 21.0
307.4 401.9 672.0 696.2 764.2 652.9 559.0
Singapore
China
Malaysia
Vietnam
Australia
Japan
Portugal
Thailand
Other
Value of imports(a)
Sources: Banco Central de Timor-Leste, General Directorate of Statistics (Timor-Leste) and Banco de Portugal calculations.Note: (a) USD millions.

101
Table 2.74 • Government operationsUSD millions
2011 2012 2013 2014 20152016 2017
Budg. Est. l.e.(a) Budg.
Total revenue
Domestic revenue
Direct taxes
Indirect taxes
Other domestic revenue
Oil revenue(b)
Tax revenue from oil exploitation
Income from Petroleum Fund investments
Grants (to projects and infrastructures)
Total expenditure
Current expenditure
Compensation of employees
Expenditure on goods and services
Current transfers and subsidies
Capital expenditure
Expenditure funded by domestic resources
Expenditure funded by external grants
Overall balance
Net transfers to (+) / from (-) the Petroleum Fund
Overall balance (excl. oil revenue)
Financing
Change in treasury balances (increase: -)
Drawings from the Petroleum Fund (sust. income)Drawings from the Petroleum Fund (above sust. income)Indebtedness (disbursements)
Other (including errors and omissions)
Memo items:
Non-oil GDP (USD millions)
Overall balance (% of non-oil GDP)
Overall balance, excl. oil revenue (% of non-oil GDP)Petroleum Fund (cumulative, USD millions)
Petroleum Fund (% of non-oil GDP)
Sources: Banco Central de Timor-Leste, Ministry of Finance of Timor-Leste, International Monetary Fund and Banco de Portugal calculations.Notes: (a) Level of budget execution, per cent; (b) Includes tax revenue from gas and oil exploitation and income from Petroleum Fund financial investments.
3,854 4,351 3,698 2,555 1,612 1,908 935 49.0 1,131
109 138 151 168 170 171 231 135.2 206
28 37 40 53 53 52 66 126.8 63
51 61 64 71 66 64 79 123.6 77
30 39 46 44 50 55 54 98.2 66
3,461 3,960 3,286 2,117 1,281 1,594 543 34.1 925
3,240 3,559 3,042 1,817 979 719 224 31.1 450
221 401 245 300 302 875 320 36.5 475
284 254 260 270 161 143 160 111.6 –
1,381 1,451 1,342 1,629 1501 1,706 1,710 100.3 1,387
509 691 731 913 1023 1107 1073 96.9 1,038
112 131 142 163 170 182 174 95.7 209
254 342 392 459 425 449 434 96.7 408
143 219 197 292 428 476 465 97.7 421
872 760 611 717 467 599 637 106.4 349
– – 351 446 306 455 484 106.3 349
– – 260 270 161 143 153 106.7 –
2,473 2,900 2,356 926 111 203 -775 – -256
2,406 2,465 2,556 1,385 2 310 -823 – -154
-989 -1060 -930 -1,191 -1,170 -1,391 -1,319 – -1,181
989 1,060 930 1,191 1,170 1,391 1,319 – 1,181
-70 -478 194 443 -132 0 -77 – 0
657 654 730 632 639 545 545 – 482
399 841 0 100 640 739 821 – 597
0 22 6 16 24 107 30 – 102
4 21 0 0 0 0 0 – 0
1,061 1,247 1,402 1,463 1,606 1,480 1,695 – –
233.1 232.6 168.1 63.3 6.9 13.7 -45.7 – –
-93.2 -85.0 -66.4 -81.4 -72.9 -94.0 -77.8 – –
9,310 11,775 14,952 16,539 16,218 17,967 15,844 – –
877.5 944.3 1,066.5 1,130.5 1,009.8 1,214.0 934.8 – –
Timor-Leste

BANCO DE PORTUGAL • Economic Developments in Portuguese-speaking African Countries and Timor-Leste • 2016 | 2017102
Tabl
e 2.
75 •
Mon
etar
y su
rvey
USD
mill
ions
2010
20
11
2012
20
13
2014
20
15
2016
Dec
. 16
/ Dec
. 15
2017
Jun
17 /
Dec
. 16
Dec
.D
ec.
Dec
.D
ec.
Dec
.D
ec.
Dec
.[1
] [2
] Ju
ne[1
] [2
]
Net
fore
ign
asse
ts
Fore
ign
asse
ts
Banc
o Ce
ntra
l de
Tim
or-L
este
Com
mer
cial
ban
ks
Fore
ign
liabi
litie
s
Banc
o Ce
ntra
l de
Tim
or-L
este
Com
mer
cial
ban
ks
Net
dom
estic
ass
ets
Net
cla
ims
on g
over
nmen
t
Gro
ss lo
ans
to g
over
nmen
t
Gov
ernm
ent d
epos
its
Cred
it to
the
econ
omy
Oth
er a
sset
s (n
et)
Tota
l ass
ets
of th
e ba
nkin
g sy
stem
Broa
d m
oney
Curr
ency
in c
ircul
atio
n (c
oin)
(a)
Dem
and
depo
sits
Tim
e de
posi
ts a
nd o
ther
dep
osits
Mem
o ite
ms:
Rate
of c
hang
e in
bro
ad m
oney
Infla
tion
rate
(y-o
-y ra
te o
f cha
nge)
Petr
oleu
m F
und
asse
ts (U
SD m
illion
s)
Publ
ic n
et fo
reig
n as
sets
(c)
(in m
onth
s of
impo
rts)
Sour
ces:
Banc
o Cen
tral d
e Tim
or-Le
ste, In
terna
tiona
l Mon
etary
Fund
and B
anco
de Po
rtuga
l calc
ulatio
ns.
Notes
: [1]
Perce
ntage
chan
ges f
rom
the en
d of th
e pre
vious
year
. [2]
Chan
ges i
n % of
initia
l stoc
k of b
road
mon
ey (li
quidi
ty ex
pans
ion/c
ontra
ction
facto
rs). (
a)Th
e agg
rega
te Cu
rrenc
y in c
ircula
tion o
nly in
clude
s coin
s (ce
ntavo
s, wi
th de
nomi
natio
ns
index
ed to
the U
SD) i
ssued
by Ba
nco C
entra
l de T
imor
-Leste
, excl
uding
USD
bank
notes
, as t
hese
are n
ot lia
bilitie
s of th
e Tim
ores
e ban
king s
ystem
. (b)
Publi
c net
foreig
n asse
ts co
rresp
ond t
o the
sum
of for
eign e
xchan
ge re
serve
s and
the v
alue o
f Pe
troleu
m Fu
nd as
sets.
622
689
1,17
91,
073
757
1,01
5 1,
092
7.5
11.9
1,
027
-5.9
-8
.8
650
756
1,25
11,
091
832
1,09
9 1,
157
5.3
9.0
1,08
0 -6
.6
-10.
5
406
498
884
687
311
438
281
-35.
8 -2
4.4
281
0.1
0.0
244
259
368
404
521
661
876
32.4
33
.4
799
-8.8
-1
0.5
-28
-68
-72
-18
-75
-83
-65
-22.
2 2.
9 -5
3 -1
8.8
1.7
-12
-14
-12
-12
-11
-11
-14
34.6
-0
.6
-11
-25.
3 0.
5
-16
-53
-60
-6.1
-6
4 -7
3 -5
1 -3
0.5
3.5
-42
-16.
9 1.
2
-327
-3
62
-772
-5
72
-157
-3
74
-358
-4
.3
2.5
-355
-0
.8
0.4
-331
-4
13
-841
-6
51
-207
-3
39
-416
22
.7
-12.
0 -4
03
-3.1
1.
8
22
6 0
0 0
0 0
––
0 –
–
-353
-4
19
-841
-6
51
-207
-3
39
-416
22
.7
-12.
0 -4
03
-3.1
1.
8
110
133
160
182
192
212
208
-1.9
-0
.6
227
9.1
2.6
-105
-8
3 -9
1 -1
03
-141
-2
47
-150
-3
9.3
15.1
-1
79
19.3
-4
.0
295
326
407
500
600
642
734
14.3
–
672
-8.4
–
295
326
407
500
600
642
734
14.3
–67
2 -8
.4–
3.4
3.9
4.8
6.8
9.8
12.2
14
.5
18.9
–15
.8
9.0
–
138
163
206
273
333
386
450
16.6
–36
7 -1
8.3
–
154
160
196
221
257
245
270
10.2
–28
9 7.
2–
10.1
10
.5
24.8
22
.9
20.0
7.
0 14
.3
––
-14.
1 -8
.4
–
9.2
17.4
9.
1 4.
0 0.
3 -0
.7
0.1
––
1.0
––
6,90
49,
310
11,7
75
14,9
52
16,5
39
16,2
18
15,8
44
-1.9
–16
,505
4.
2 –
69
66
91
156
165
169
148
––
152
––

103
Table 2.76 • Exchange ratesAverage rates
EERI(a)
USD/AUD USD/IDR EUR/USD Nominal Real
20072008
2009
2010
2011
2012
2013
2014
2015
2016
2015 JanuaryFebruary
March
April
May
June
July
August
September
October
November
December
2016 January
February
March
April
May
June
July
August
September
October
November
December
2017 January
February
March
April
May
June
Sources: Banco Central de Timor-Leste, Reserve Bank of Australia, Bank Indonesia and Banco de Portugal calculations.Notes: (a) Effective exchange rate index (EERI) calculated on the basis of the currencies of Timor-Leste's main trading partners: Indonesia, Australia, Singapore, Portugal and Malaysia. Index: 2001 = 100. Index developments: appreciation: + / depreciation: - -.
1.2 9,140 1.3 71.3 70.0
1.2 9,690 1.4 71.4 71.2
1.2 10,412 1.3 75.1 73.7
1.0 9,085 1.3 67.6 68.5
0.9 8,777 1.3 63.9 70.5
0.9 9,384 1.2 66.0 78.8
1.0 10,463 1.3 71.0 90.6
1.1 11,913 1.3 77.0 95.3
1.3 13,387 1.1 86.9 105.1
1.3 13,307 1.1 94.3 110.5
1.2 12,574 1.1 82.4 100.7
1.2 12,754 1.1 83.7 102.4
1.2 13,064 1.0 85.2 104.2
1.2 12,944 1.0 84.5 103.3
1.2 13,122 1.1 84.7 102.9
1.3 13,313 1.1 86.0 104.1
1.3 13,375 1.0 87.0 104.8
1.4 13,782 1.1 89.1 107.1
1.4 14,396 1.1 91.7 110.2
1.4 13,796 1.1 89.5 107.4
1.3 13,673 1.0 89.6 107.1
1.3 13,855 1.0 89.8 106.6
1.4 13,893 1.0 95.3 113.0
1.4 13,525 1.1 97.0 113.2
1.3 13,198 1.1 93.9 110.8
1.3 13,177 1.1 94.0 112.4
1.3 13,381 1.1 94.1 110.8
1.3 13,359 1.1 94.1 110.3
1.3 13,120 1.1 92.9 108.4
1.3 13,147 1.1 92.6 107.7
1.3 13,119 1.1 92.9 108.1
1.3 13,017 1.1 93.1 108.2
1.3 13,324 1.0 95.3 110.6
1.3 13,420 1.0 96.8 112.6
1.3 13,362 1.0 96.2 111.1
1.3 13,338 1.0 95.6 110.0
1.3 13,345 1.0 95.6 110.0
1.3 13,308 1.0 97.1 112.3
1.3 13,319 1.1 95.1 110.0
1.3 13,299 1.1 94.6 108.8
Timor-Leste


Trade in goods between Portugal and Portuguese-speaking African Countries and Timor-Leste decreased in 2016, with exports and imports dropping by 24 per cent and 28 per cent respectively. Portuguese direct investment in these countries returned to negative levels in aggregate terms in 2016. The Portuguese-speaking African Countries’ official debt to Portugal continued to follow a downward path, which was intensified by the appreciation of the US dollar against the euro, thereby cutting the dollar value of commitments undertaken in the European currency.
Angola continued to be Portugal’s main counterparty among this group, accounting for the largest share of exports and imports of goods and direct investment. Mozambique has accounted for the largest stock of official debt to Portugal since 2015, although it is on a downward path.
3.Portugal’s economic and financial relations with Portuguese-speaking African Countries and Timor-Leste


107
Similarly to 2015, trade with Portuguese-speaking African Countries and Timor-Leste decreased in 2016. After increasing between 2011 and 2014, Portuguese exports of goods to these countries decreased substantially further, by 24 per cent from the previous year. Imports of goods from this group of countries dropped markedly for the third consecutive year (by 28 per cent from 2015). Due to the increase in trade between Portugal and the rest of the world, the share of the Portuguese-speaking African Countries and Timor-Leste as a destination and origin of exported and imported products by Portugal fell to 4.3 per cent and 1.5 per cent respectively (5.7 per cent and 2.0 per cent in 2015).
Angola contributed the most to the reduction in Portuguese exports to these countries, by 28 per cent. Products exported to Mozambique (-39 per cent) and Timor-Leste (-19 per cent) also fell. By group of products, falls in exports were more substantial in terms of machinery and equipment, base metals and food, mostly with Angola and Mozambique as a destination. Exports to the other countries grew by 21 per cent (Cabo Verde), 12 per cent (São Tomé and Príncipe) and 7 per cent (Guinea-Bissau).
As in previous years, the reduction in Portuguese imports of goods largely reflected the decrease in the mineral fuel component from Angola. Furthermore, imported products from Mozambique and Timor-Leste decreased, while those from other countries rose slightly.
Angola remains the most important market for Portugal’s trade with Portuguese-speaking African Countries and Timor-Leste, accounting for 94 per cent of Portuguese imports and 71 per cent of exports. Cabo Verde (12 per cent of exports) and Mozambique (10 per cent of exports and 4 per cent of imports) are far behind.
The fall in exports of goods led to a 22 per cent decline in Portugal’s trade surplus with this group of six countries, totalling EUR 1,322 million. The other current account items also moved downwards, chiefly reflecting developments in transactions with Angola and Mozambique: a decrease in the positive services account balance (by 28 per cent, due to lower exports of services) and reductions in primary income balances (by
45 per cent) and secondary income balances (by 11 per cent). The aggregate balance of bilateral current accounts with Portuguese-speaking African Countries and Timor-Leste fell by 26 per cent, to stand at EUR 2,914 million, the lowest figure since 2007. For the third time in a row, Portuguese emigrants’ remittances from these countries declined, particularly from Angola. Likewise, remittances from immigrants of Portuguese-speaking African Countries and Timor-Leste in Portugal decreased in 2016, most notably, to Cabo Verde, Angola and Mozambique.
Turning to Portuguese direct investment in Portuguese-speaking African Countries and Timor-Leste, there was some net disinvestment in 2016, as was the case in 2014. Estimates point to negative investment of EUR 36 million in that group of countries, but significantly below EUR 239 million in 2014. Portuguese net disinvestment in Portuguese-speaking African Countries and Timor-Leste was set against a background of increasing Portuguese direct investment in the rest of the world.
As has been the case since 2002, transactions with Angola have set the direction and magnitude of Portuguese investment in the group of countries under review. In 2016 Portuguese net disinvestment in Angola amounted to EUR 85 million, which contrasts with net investment of EUR 261 million in 2015. There was also net disinvestment in São Tomé and Príncipe in 2016 (similarly to 2015), but the other countries posted positive figures: Mozambique continued to be an attractive market for Portuguese investment (EUR 49 million, although less than in the previous year); EUR 4.7 million was channelled to Cabo Verde, up from the net negative figure in 2015; Timor-Leste and Guinea-Bissau remained at lower values (EUR 1.3 million and EUR 0.1 million respectively).
Net disinvestment in 2016 was chiefly due to the performance of the services and construction sectors in Angola and São Tomé and Príncipe. Portuguese disinvestment in the services sector occurred in spite of net investment in financial and insurance activities, a component of this sector. However, net investment in financial and insurance activities (which totalled EUR 80
Portugal's economic and financial relations with Portuguese-speaking African Countries and Timor-Leste

BANCO DE PORTUGAL • Economic Developments in Portuguese-speaking African Countries and Timor-Leste • 2016 | 2017108
million), most notably the amounts channelled to Mozambique and Angola, were well below the figures for 2015 (EUR 392 million).
Direct investment flows from Portuguese-speaking African Countries and Timor-Leste to Portugal were positive in net terms in 2016, totalling EUR 23 million, but remained well below the amount recorded in the previous year (EUR 176 million). Although lowering its share in the total, Angola continued to be the main investor in Portugal in 2016, accounting for 83 per cent of the total, most notably investing in the construction sector and financial and insurance activities. Notable among the other countries were Mozambique’s investment in the construction sector (EUR 3.7 million) and net disinvestment by São Tomé and Príncipe and Cabo Verde.
Continuing the trend that started in 2014, the official debt of Portuguese-speaking African Countries to Portugal declined further in 2016. The aggregate direct and Portuguese State-guaranteed debt taken on by these countries totalled USD 2,622 million at the end of 2016, a 6.5 per cent decline from 2015. The appreciation of the US dollar against the euro intensified the reduction in official debt, as has been the case since 2014, reducing the dollar value of the commitments undertaken in euros.
The decline in the total stock of official debt of this group of countries to Portugal in 2016 was once again chiefly boosted by the reduction in medium and long-term Portuguese State-guaranteed debt, although at a much slower pace than in previous years. Also contributing to this was the extension of the downward path followed by direct debt since 2009, which was only interrupted in 2012.
Similarly to 2015, of all Portuguese-speaking African Countries, debt to Portugal in 2016 increased only in São Tomé and Príncipe. The increase was due to the use of outstanding credit lines directly granted by the Portuguese State to support private sector investment and to develop the country’s energy sector.
Angola posted the most substantial reduction in the stock of official debt to Portugal in 2016, as has been the case since 2014, dropping by
15 per cent from 2015. This decrease stemmed mainly from lower guaranteed credits (-27 per cent), adding to the contractualised redemption of its direct debt due, as established in the rescheduling agreement signed in 2004 (in effect for 25 years).
Mozambique continues to post the most substantial debt to Portugal of all Portuguese-speaking African Countries, accounting for 38 per cent of the total in 2016, although falling by 3 per cent. The decrease in Mozambican debt arose from the consecutive redemptions of direct debt under the progressive cancellation agreement signed in July 2008 under the Heavily Indebted Poor Countries Initiative, the appreciation of the US dollar against the euro and the smaller volume of guaranteed debt.
Cabo Verde’s official debt to Portugal decreased further in 2016, despite new disbursements of Portuguese State-guaranteed debt under the credit line associated with social housing projects. This decline stemmed from the scheduled redemption of other credits and developments in euro against the US dollar.
As in the past few years, in 2016 there was no movement in Guinea-Bissau’s official debt to Portugal. Once again, the appreciation of the US dollar against the European currency was the only factor behind the decline in the stock of debt, given that all credits are denominated in euro.
Timor-Leste has no official debt to Portugal.

109
Chart 3.75 • Portugal's trade relations with Portuguese-speaking African Countries and Timor-Leste % of total
Chart 3.76 • Portugal's trade relations with Portuguese-speaking African Countries and Timor-Leste in 2016 EUR millions
0
2
4
6
8
10
2006 2007 2008 2009 2010 2011 2012 2013 2014 2015 2016
Exports of goods Imports of goods
The reduction in trade with Portuguese-speaking African Countries and Timor-Leste and the increase in Portugal’s international trade with the rest of the world led to a decline in the share of these countries in terms of Portuguese exports and imports.
Portugal’s trade relations with Portuguese-speaking African Countries and Timor-Leste continued to be dominated by the Angolan market, followed at a great distance by flows with Mozambique and Cabo Verde, particularly Portuguese exports of goods to both countries
Chart 3.77 • Exports of goods to Portuguese-speaking African Countries and Timor-Leste Destinations, EUR millions
Chart 3.78 • Imports of goods from Portuguese-speaking African Countries and Timor-Leste Origins, EUR millions
0
1,000
2,000
3,000
4,000
2006 2007 2008 2009 2010 2011 2012 2013 2014 2015 2016
Angola CaboVerde
Guinea--Bissau
Mozam-bique
S. Tomé andPríncipe
Timor--Leste
0
400
800
1,200
1,600
2,000
2,400
2,800
2006 2007 2008 2009 2010 2011 2012 2013 2014 2015 2016
Angola CaboVerde
Guinea--Bissau
Mozam-bique
S. Tomé andPríncipe
Timor--Leste
The high relative share of the Angolan market and the upward trend in exports to Angola seen since 2015 have played a key role in the reduction in total Portuguese goods sent to this group of countries.
Angola also accounts for a large share of Portuguese imports of goods from Portuguese-speaking African Countries and Timor-Leste, with Portugal importing mainly mineral fuels from that country (crude oil and derivatives), although on a downward path following a peak in 2013.
Chart 3.79 • Exports of goods to Portuguese-speaking African Countries and Timor-Leste in 2016 By group of products
Chart 3.80 • Imports of goods from Portuguese-speaking African Countries and Timor-Leste in 2016 By group of products
23.8%
13.7%13.2%
10.1%
7.6%
31.5%
Machinery, equipment
Agricultural
Food
Chemicals
Base metals
Other
91.4%
3.8%1.4%
3.4%
Mineral fuels
Agricultural
Machinery, equipment
Other
In 2016 Portuguese exports of goods to Portuguese-speaking African Countries and Timor-Leste fell mainly into five major groups of products: machinery and equipment, agricultural products, food, chemicals and base metals. As a whole, they accounted for 2/3 of the total.
Although lower than in previous years, imports of mineral fuels from Angola dominated Portuguese imports from this group of countries, accounting for 91 per cent of the total in 2016. They were followed at a great distance by agricultural products (Mozambique) and machinery and equipment (Angola).
Exports of goods Imports of goods
Moz.
Portugal's economic and financial relations with Portuguese-speaking African Countries and Timor-Leste
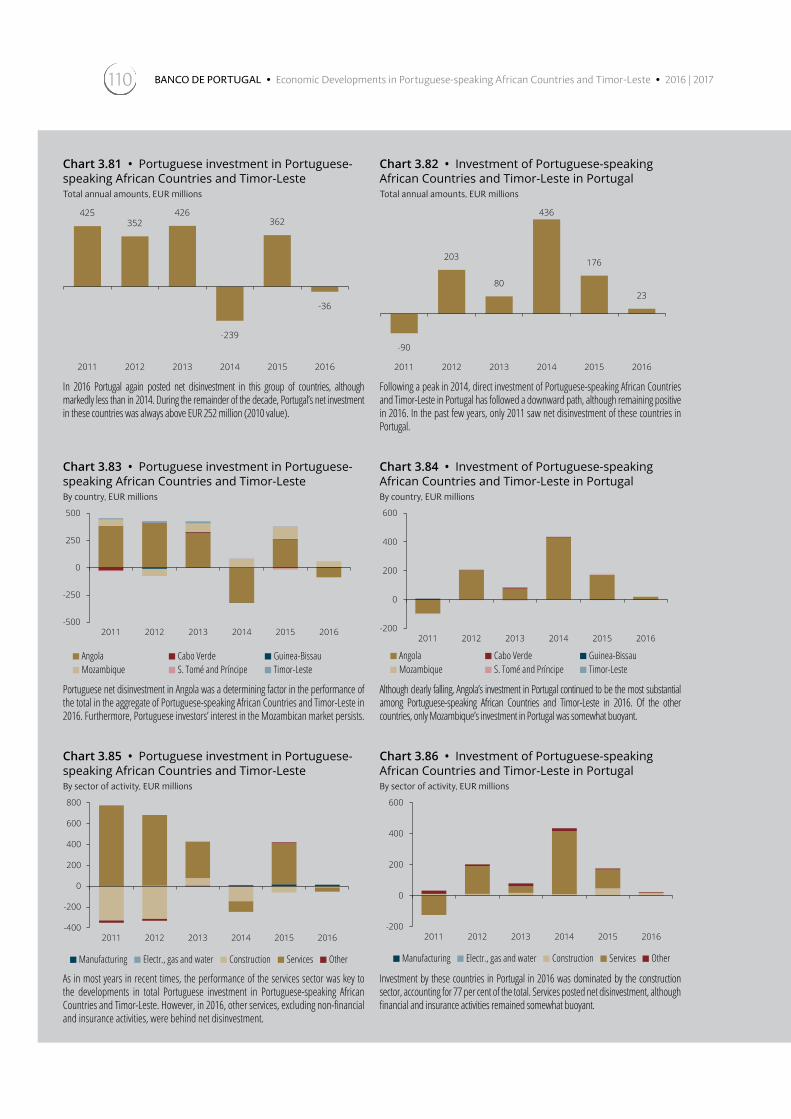
BANCO DE PORTUGAL • Economic Developments in Portuguese-speaking African Countries and Timor-Leste • 2016 | 2017110
Chart 3.81 • Portuguese investment in Portuguese-speaking African Countries and Timor-LesteTotal annual amounts, EUR millions
Chart 3.82 • Investment of Portuguese-speaking African Countries and Timor-Leste in Portugal Total annual amounts, EUR millions
425352
426
-239
362
-36
2011 2012 2013 2014 2015 2016
-90
203
80
436
176
23
2011 2012 2013 2014 2015 2016
In 2016 Portugal again posted net disinvestment in this group of countries, although markedly less than in 2014. During the remainder of the decade, Portugal’s net investment in these countries was always above EUR 252 million (2010 value).
Following a peak in 2014, direct investment of Portuguese-speaking African Countries and Timor-Leste in Portugal has followed a downward path, although remaining positive in 2016. In the past few years, only 2011 saw net disinvestment of these countries in Portugal.
Chart 3.83 • Portuguese investment in Portuguese-speaking African Countries and Timor-Leste By country, EUR millions
Chart 3.84 • Investment of Portuguese-speaking African Countries and Timor-Leste in Portugal By country, EUR millions
-500
-250
0
250
500
2011 2012 2013 2014 2015 2016
Angola Cabo Verde Guinea-BissauMozambique S. Tomé and Príncipe Timor-Leste
-200
0
200
400
600
2011 2012 2013 2014 2015 2016
Angola Cabo Verde Guinea-BissauMozambique S. Tomé and Príncipe Timor-Leste
Portuguese net disinvestment in Angola was a determining factor in the performance of the total in the aggregate of Portuguese-speaking African Countries and Timor-Leste in 2016. Furthermore, Portuguese investors’ interest in the Mozambican market persists.
Although clearly falling, Angola’s investment in Portugal continued to be the most substantial among Portuguese-speaking African Countries and Timor-Leste in 2016. Of the other countries, only Mozambique’s investment in Portugal was somewhat buoyant.
Chart 3.85 • Portuguese investment in Portuguese-speaking African Countries and Timor-Leste By sector of activity, EUR millions
Chart 3.86 • Investment of Portuguese-speaking African Countries and Timor-Leste in Portugal By sector of activity, EUR millions
-400
-200
0
200
400
600
800
2011 2012 2013 2014 2015 2016
Manufacturing Electr., gas and water Construction Services Other
-200
0
200
400
600
2011 2012 2013 2014 2015 2016
Manufacturing Electr., gas and water Construction Services Other
As in most years in recent times, the performance of the services sector was key to the developments in total Portuguese investment in Portuguese-speaking African Countries and Timor-Leste. However, in 2016, other services, excluding non-financial and insurance activities, were behind net disinvestment.
Investment by these countries in Portugal in 2016 was dominated by the construction sector, accounting for 77 per cent of the total. Services posted net disinvestment, although financial and insurance activities remained somewhat buoyant.

111
Chart 3.87 • Official debt of Portuguese-speaking African Countries to Portugal USD million
Chart 3.88 • Official debt of Angola to Portugal USD million
0
1,000
2,000
3,000
4,000
2008 2009 2010 2011 2012 2013 2014 2015 2016
Direct Guaranteed
0
500
1,000
1,500
2,000
2008 2009 2010 2011 2012 2013 2014 2015 2016
Direct Guaranteed
Aggregate official debt of Portuguese-speaking African Countries to Portugal decreased in 2016, continuing on the downward path that started in 2014. The decrease was most notable in Portuguese State-guaranteed debt, although direct debt has also declined.
In 2016 Angola’s official debt to Portugal continued on the downward path that started in 2012, combining the reduction in Portuguese State-guaranteed debt and the redemption of direct debt as established in the rescheduling agreement signed in 2004.
Chart 3.89 • Official debt of Cabo Verde to Portugal USD million
Chart 3.90 • Official debt of Guinea-Bissau to Portugal USD million
0
200
400
600
800
2008 2009 2010 2011 2012 2013 2014 2015 2016Direct Guaranteed
0
50
100
150
2008 2009 2010 2011 2012 2013 2014 2015 2016
Direct Guaranteed
As in the previous year, in 2016 Cabo Verde’s US dollar-denominated official debt to Portugal decreased. The new disbursements of euro-denominated concessional credit lines were offset by developments in the US dollar against the European currency.
The behaviour of the euro against the US dollar is the sole determining factor of changes in Guinea-Bissau’s official debt stock to Portugal. Euro-denominated credits granted to Guinea-Bissau have not changed in 2016.
Chart 3.91 • Official debt of Mozambique to Portugal USD million
Chart 3.92 • Official debt of São Tomé and Príncipe to Portugal USD million
0
500
1,000
1,500
2008 2009 2010 2011 2012 2013 2014 2015 2016Direct Guaranteed
0
20
40
60
80
100
2008 2009 2010 2011 2012 2013 2014 2015 2016
Direct Guaranteed
Since 2015 Mozambique has been the largest debtor to Portugal among these countries, despite the reduction in its official debt. The fall in 2016 reflects the lower volume of guaranteed exports, the foreign exchange effect and redemptions following the 2008 restructuring agreement.
For the second consecutive year, São Tomé and Príncipe was the only country in this group whose official debt to Portugal increased in 2016. The increase was due to the use of credit lines granted by the Portuguese State to support the private sector and develop the energy sector.
Portugal's economic and financial relations with Portuguese-speaking African Countries and Timor-Leste

BANCO DE PORTUGAL • Economic Developments in Portuguese-speaking African Countries and Timor-Leste • 2016 | 2017112
Table 3.77 • Portugal/Portuguese-speaking African Countries and Timor-Leste: Goods imports and exports (Portugal's perspective)EUR millions
Angola Cabo Verde Guinea-Bissau Mozambique S.Tomé and Príncipe Timor-Leste Total
Imp. Exp. Imp. Exp. Imp. Exp. Imp. Exp. Imp. Exp. Imp. Exp. Imp. Exp.
1998 22 368 9 118 2 16 28 61 1 17 – – 62 58010 277 10 138 0 17 39 67 4 19 – – 64 51758 371 10 170 1 28 45 69 9 19 – – 123 657
127 504 9 135 3 23 40 63 3 21 – – 182 74570 570 9 148 3 21 37 54 0 30 1 1 121 823
2 652 9 137 2 17 38 54 0 25 1 5 52 8902 671 11 140 1 18 26 55 0 24 1 1 41 909
25 803 7 149 1 24 32 65 0 22 1 1 67 1,06453 1,210 7 190 1 27 29 73 1 28 1 2 92 1,530
369 1,682 7 228 1 35 26 89 0 33 0 1 403 2,067408 2,260 9 257 1 40 34 91 0 36 1 2 452 2,687151 2,236 7 223 1 33 43 120 0 36 1 9 204 2,656563 1,901 7 262 0 43 29 149 0 43 1 7 602 2,404
1,178 2,330 10 254 0 64 42 217 0 47 1 5 1,231 2,9161,781 2,989 9 216 0 72 16 287 0 46 0 8 1,807 3,6172,632 3,113 11 202 0 70 63 328 0 50 1 7 2,707 3,7701,606 3,178 11 215 0 65 35 318 0 57 1 7 1,653 3,8391,142 2,099 11 215 0 74 38 355 0 57 2 10 1,193 2,810
810 1,503 11 259 0 79 36 215 0 64 1 8 858 2,127
199920002001200220032004200520062007200820092010201120122013201420152016
Source: Statistics Portugal.
Table 3.78 • Share of portuguese trade held by Portuguese-speaking African Countries and Timor-Leste Per cent
Angola Cabo Verde Guinea-Bissau Mozambique S.Tomé and Príncipe Timor-Leste Total
Imp. Exp. Imp. Exp. Imp. Exp. Imp. Exp. Imp. Exp. Imp. Exp. Imp. Exp.
1998 0.1 1.6 0.0 0.5 0.0 0.1 0.1 0.3 0.0 0.1 – – 0.2 2.5 0.0 1.2 0.0 0.6 0.0 0.1 0.1 0.3 0.0 0.1 – – 0.2 2.2 0.1 1.4 0.0 0.6 0.0 0.1 0.1 0.3 0.0 0.1 – – 0.3 2.4 0.3 1.8 0.0 0.5 0.0 0.1 0.1 0.2 0.0 0.1 – – 0.4 2.7 0.2 2.0 0.0 0.5 0.0 0.1 0.1 0.2 0.0 0.1 0.0 0.0 0.3 2.9 0.0 2.2 0.0 0.5 0.0 0.1 0.1 0.2 0.0 0.1 0.0 0.0 0.1 3.0 0.0 2.2 0.0 0.5 0.0 0.1 0.1 0.2 0.0 0.1 0.0 0.0 0.1 3.0 0.1 2.6 0.0 0.5 0.0 0.1 0.1 0.2 0.0 0.1 0.0 0.0 0.1 3.5 0.1 3.4 0.0 0.5 0.0 0.1 0.1 0.2 0.0 0.1 0.0 0.0 0.2 4.3 0.6 4.4 0.0 0.6 0.0 0.1 0.0 0.2 0.0 0.1 0.0 0.0 0.7 5.4 0.7 5.9 0.0 0.7 0.0 0.1 0.1 0.2 0.0 0.1 0.0 0.0 0.7 7.0 0.3 7.1 0.0 0.7 0.0 0.1 0.1 0.4 0.0 0.1 0.0 0.0 0.4 8.5 1.0 5.1 0.0 0.7 0.0 0.1 0.1 0.4 0.0 0.1 0.0 0.0 1.1 6.5 2.1 5.5 0.0 0.6 0.0 0.2 0.1 0.5 0.0 0.1 0.0 0.0 2.2 6.9 3.3 6.7 0.0 0.5 0.0 0.2 0.0 0.6 0.0 0.1 0.0 0.0 3.4 8.2 4.8 6.7 0.0 0.4 0.0 0.2 0.1 0.7 0.0 0.1 0.0 0.0 5.0 8.1 2.8 6.7 0.0 0.5 0.0 0.1 0.1 0.7 0.0 0.1 0.0 0.0 2.9 8.1 2.0 4.3 0.0 0.4 0.0 0.2 0.1 0.7 0.0 0.1 0.0 0.0 2.0 5.7 1.4 3.0 0.0 0.5 0.0 0.2 0.1 0.4 0.0 0.1 0.0 0.0 1.5 4.3
199920002001200220032004200520062007200820092010201120122013201420152016
Sources: Statistics Portugal and Banco de Portugal calculations.

113
Tabl
e 3.
79 •
Por
tuga
l/Por
tugu
ese-
spea
king
Afr
ican
Cou
ntri
es a
nd T
imor
-Les
te: E
xpor
ts b
y gr
oup
of p
rodu
cts
(Por
tuga
l's p
ersp
ectiv
e)
Em m
ilhõe
s de
EUR
2015
2016
Ango
laC.
Ver
deG
. Bis
sau
Moz
amb.
S.To
mé
Tim
or-L
.To
tal
Ango
laC.
Ver
deG
. Bis
sau
Moz
amb.
S.To
mé
Tim
or-L
.To
tal
Agric
ultu
ral
219.
531
.14.
89.
912
.00.
627
7.9
233.
133
.65.
18.
111
.70.
729
2.3
317.
529
.313
.825
.012
.81.
640
0.0
198.
633
.116
.018
.213
.51.
828
1.2
17.9
1.6
26.1
18.7
1.2
–65
.523
.62.
128
.63.
10.
90.
058
.4
180.
719
.01.
725
.33.
60.
223
0.4
168.
422
.41.
817
.44.
80.
221
4.9
108.
912
.21.
316
.52.
70.
114
1.7
87.7
14.0
1.5
9.2
2.8
0.2
115.
5
7.6
1.7
0.1
1.6
0.1
0.0
11.1
5.8
1.4
0.0
0.7
0.1
0.0
8.1
19.3
4.1
0.4
5.9
0.3
0.0
30.1
12.4
8.5
0.3
3.8
0.6
0.3
25.9
69.7
6.8
0.5
16.4
0.8
0.3
94.4
60.8
7.7
0.6
14.7
0.8
0.8
85.3
24.7
4.4
0.4
3.8
0.4
0.2
33.9
15.1
4.9
0.3
2.2
0.8
0.0
23.3
34.4
2.3
0.4
3.7
0.3
0.1
41.1
17.2
3.3
0.3
2.4
0.7
0.0
23.8
23.7
0.7
0.1
4.2
0.3
0.0
29.0
17.3
1.4
0.1
1.3
0.4
0.0
20.5
74.8
18.8
8.6
15.0
2.9
0.1
120.
351
.222
.87.
610
.22.
30.
194
.3
209.
424
.83.
147
.74.
82.
729
2.4
98.7
27.3
3.4
26.0
5.0
0.4
160.
8
522.
839
.96.
112
6.6
8.8
0.9
705.
236
0.9
48.8
6.9
74.3
13.4
2.8
507.
1
65.4
6.6
2.8
8.0
2.7
0.0
85.5
34.1
8.2
3.8
4.6
2.2
0.1
52.9
60.8
3.2
0.5
6.7
0.9
0.2
72.3
34.2
4.8
0.3
6.1
1.0
0.1
46.5
142.
18.
03.
220
.02.
83.
017
9.2
83.9
14.5
2.1
12.5
3.1
0.6
116.
7
2,09
9.1
214.
573
.735
5.1
57.5
10.1
2,80
9.9
1,50
2.8
258.
878
.621
4.9
64.1
8.2
2,12
7.4
Food
Min
eral
fuel
s
Chem
ical
s
Plas
tics,
rubb
er p
rodu
cts
Leat
her,
leat
her p
rodu
cts
Woo
d, c
ork
Pulp
, pap
er
Text
ile p
rodu
cts
Clot
hing
Foot
wea
r
Min
eral
s, o
res
Base
met
als
Mac
hine
ry, e
quip
men
t
Mot
or v
ehic
les
and
othe
r tra
nspo
rt
Opt
ical
and
pre
cisi
on in
stru
men
ts
Oth
er p
rodu
cts
Tota
l
Sour
ce: S
tatist
ics Po
rtuga
l.
Portugal's economic and financial relations with Portuguese-speaking African Countries and Timor-Leste

BANCO DE PORTUGAL • Economic Developments in Portuguese-speaking African Countries and Timor-Leste • 2016 | 2017114
Tabl
e 3.
80 •
Por
tuga
l/Por
tugu
ese-
spea
king
Afr
ican
Cou
ntri
es a
nd T
imor
-Les
te: I
mpo
rts
by g
roup
of p
rodu
cts
(Por
tuga
l's p
ersp
ectiv
e)
EUR
mill
ions
2015
2016
Ango
laC.
Ver
deG
. Bis
sau
Moz
amb.
S.To
mé
Tim
or-L
.To
tal
Ango
laC.
Ver
deG
. Bis
sau
Moz
amb.
S.To
mé
Tim
or-L
.To
tal
Agric
ultu
ral
6.5
0.4
0.0
20.5
0.0
1.7
29.1
6.8
0.0
0.0
25.0
0.0
0.8
32.7
0.2
0.2
0.0
14.7
0.0
–15
.10.
20.
5–
7.4
0.1
–8.
3
1.12
8.1
0.4
–0.
0–
–1.
128.
578
4.2
0.3
–0.
0–
–78
4.5
0.0
0.0
0.0
0.0
0.0
–0.
10.
00.
0–
0.0
–0.
00.
0
0.1
0.1
0.0
0.0
––
0.2
0.1
0.1
–0.
0–
–0.
2
0.0
––
0.0
––
0.0
0.0
0.0
–0.
0–
–0.
0
0.8
0.0
–0.
0–
–0.
82.
50.
0–
0.0
––
2.5
0.0
0.0
–0.
0–
–0.
00.
10.
00.
00.
0–
0.0
0.1
0.0
0.0
0.0
2.1
0.0
–2.
20.
00.
0–
1.8
–0.
01.
8
0.0
4.7
–0.
0–
–4.
80.
06.
10.
00.
0–
–6.
1
0.0
3.4
–0.
0–
–3.
50.
03.
4–
0.0
––
3.4
0.2
0.1
0.0
0.0
––
0.2
1.4
0.1
–0.
0–
–1.
5
0.1
0.2
0.1
0.0
0.1
–0.
50.
30.
50.
10.
40.
2–
1.5
3.1
1.1
0.0
0.1
0.0
0.0
4.4
11.1
0.2
0.1
0.8
0.0
0.0
12.2
0.7
0.1
0.0
0.1
0.0
–0.
92.
10.
10.
00.
20.
1–
2.5
2.2
0.2
0.0
0.0
0.0
–2.
50.
60.
00.
10.
10.
0–
0.8
0.3
0.0
0.0
0.0
0.0
–0.
40.
30.
00.
00.
00.
0–
0.3
1.14
2.3
10.9
0.2
37.8
0.2
1.7
1.19
3.1
809.
711
.30.
335
.90.
30.
985
8.4
Food
Min
eral
fuel
s
Chem
ical
s
Plas
tics,
rubb
er p
rodu
cts
Leat
her,
leat
her p
rodu
cts
Woo
d, c
ork
Pulp
, pap
er
Text
ile p
rodu
cts
Clot
hing
Foot
wea
r
Min
eral
s, o
res
Base
met
als
Mac
hine
ry, e
quip
men
t
Mot
or v
ehic
les
and
othe
r tra
nspo
rt
Opt
ical
and
pre
cisi
on in
stru
men
ts
Oth
er p
rodu
cts
Tota
l
Sour
ce: S
tatist
ics Po
rtuga
l.

115
Table 3.81 • Current and capital accounts with Portuguese-speaking African Countries and Timor-Leste (Portugal's perspective) EUR millions
Current account
Capital account
Goods Services
Primary income
Secondary income
BalanceExp. Imp. Bal. Total
o.w.: Travel and
tourismTotal
o.w.: Remittances
Emig. Immig.
Angola 2012 3,112.8 1,631.9 1,480.9 978.5 430.2 1,017.5 279.0 270.7 15.4 3,755.8 6.9
2013 3,269.9 2,390.9 879.0 1,076.6 458.7 638.5 333.8 304.3 18.8 2,928.0 2.7
2014 3,187.5 1,479.8 1,707.7 1,235.2 544.1 200.6 179.0 248.0 13.8 3,322.5 -0.6
2015 2,108.9 1,063.4 1,045.5 1,123.0 454.1 364.4 343.9 213.1 19.5 2,876.9 -0.1
2016 1,505.4 750.8 754.6 767.5 264.2 139.5 313.5 205.9 17.5 1,975.1 -0.5
2012 210.8 13.6 197.2 -4.5 -20.9 42.9 -10.2 2.4 14.1 225.3 3.0
2013 199.2 15.3 183.9 -2.8 -16.5 21.7 -6.7 3.4 13.1 196.1 -0.0
2014 212.7 13.3 199.4 10.7 -11.0 7.9 -14.0 3.0 12.0 204.0 0.4
2015 212.3 12.0 200.4 13.0 -11.1 10.1 -10.0 1.6 17.0 213.5 0.0
2016 256.3 14.8 241.4 34.2 0.9 13.1 -14.0 1.7 14.9 274.7 -0.1
2012 71.5 2.6 68.9 3.8 1.3 0.1 -3.9 0.2 2.5 68.9 -0.5
2013 69.8 1.4 68.4 3.0 0.7 0.6 0.3 0.5 2.6 72.3 -0.0
2014 64.9 0.3 64.7 -1.5 -0.5 -0.5 -3.4 1.6 3.4 59.3 -0.0
2015 73.7 0.2 73.5 -0.4 -1.1 6.6 -1.2 2.6 3.1 78.6 -0.5
2016 78.6 0.2 78.4 11.3 0.5 -0.2 -3.1 2.2 3.2 86.4 -0.0
2012 287.0 26.9 260.1 62.6 -2.7 108.3 5.3 5.0 8.8 436.3 -16.4
2013 327.7 68.2 259.5 71.9 10.6 88.0 -3.8 7.6 10.0 415.6 -17.2
2014 317.8 45.1 272.8 113.6 41.6 29.0 -14.7 4.6 9.5 400.6 -18.3
2015 355.0 44.6 310.4 200.1 86.5 168.6 41.4 6.2 9.8 720.4 -24.1
2016 214.9 38.7 176.2 149.3 41.7 148.4 35.4 6.1 7.9 509.3 -26.1
2012 46.1 1.7 44.4 7.4 2.9 -1.0 -1.3 0.3 1.3 49.6 -1.0
2013 50.3 1.4 48.9 1.9 -1.7 -1.5 0.3 0.7 1.0 49.6 -0.9
2014 56.6 1.3 55.2 2.1 -2.5 0.3 -1.8 0.3 1.2 55.9 -0.9
2015 57.5 0.5 56.9 -2.3 -4.3 -8.0 -0.3 0.6 1.6 46.3 -1.2
2016 64.1 0.7 63.4 -3.7 -2.7 0.9 -0.7 0.5 1.9 59.8 -1.4
2012 8.1 0.2 7.9 3.2 1.6 16.0 -5.5 0.8 0.1 21.6 -0.5
2013 7.2 0.6 6.6 3.7 1.6 8.0 0.5 0.3 0.1 18.9 -0.0
2014 7.0 0.7 6.3 6.8 -0.2 -2.8 -10.1 0.2 0.9 0.2 -0.1
2015 10.1 1.4 8.7 7.3 -0.9 0.4 -8.4 0.2 0.4 8.1 0.0
2016 8.2 0.7 7.5 9.5 -0.9 -1.1 -7.0 0.1 0.3 8.9 0.0
2012 3,736.3 1,676.9 2,059.4 1,051.1 412.4 1,183.8 263.3 279.4 42.0 4,557.6 -8.5
2013 3,924.2 2,477.8 1,446.3 1,154.4 453.3 755.4 324.4 316.9 45.7 3,680.6 -15.5
2014 3,846.5 1,540.5 2,306.0 1,367.0 571.6 234.4 135.1 257.6 40.9 4,042.5 -19.6
2015 2,817.5 1,122.1 1,695.4 1,340.8 523.1 542.1 365.4 224.4 51.4 3,943.7 -25.9
2016 2,127.5 806.0 1,321.5 968.1 303.7 300.6 324.1 216.6 45.8 2,914.3 -28.0
Cabo Verde
Guinea-Bissau
Mozambique
S. Tomé and Príncipe
Timor-Leste
Total Portuguese- speaking African Countries and Timor-Leste
Source: Banco de Portugal.
Portugal's economic and financial relations with Portuguese-speaking African Countries and Timor-Leste

BANCO DE PORTUGAL • Economic Developments in Portuguese-speaking African Countries and Timor-Leste • 2016 | 2017116
Table 3.82 • Portuguese direct investment in Portuguese-speaking African Countries and Timor-Leste By sector of activity, EUR millions
2011 2012 2013 2014 2015 2016
Angola Manufacturing -12.0 -6.9 0.2 -1.1 6.6 8.1
0.1 2.7 0.3 -4.8 1.0 0.1
-266.0 -213.7 110.2 -136.5 -21.2 -12.0
632.4 644.6 208.1 -179.6 274.6 -80.6
556.2 450.8 287.9 -179.2 261.1 32.8
29.3 -13.9 -0.6 0.0 -0.1 -0.4
383.7 412.8 318.2 -322.0 260.9 -84.8
3.6 2.7 1.8 0.0 0.3 0.4
– 0.0 0.0 0.0 0.0 0.0
-44.4 -9.5 -14.3 -10.3 -11.5 0.0
15.9 7.0 21.0 12.2 10.6 4.3
15.0 10.4 20.2 3.1 7.2 3.9
-1.4 0.9 – -1.8 -0.0 -0.0
-26.3 1.0 8.5 0.1 -0.5 4.7
1.6 0.5 0.4 -0.5 -2.1 –
– – – – – –
– -10.0 0.1 0.0 0.0 0.0
0.1 0.1 0.1 -0.0 1.3 0.0
– 0.0 0.0 – 1.3 0.0
0.0 -0.1 – – 4.6 0.1
1.7 -9.5 0.6 -0.5 3.9 0.1
6.9 7.0 4.0 9.4 13.2 5.4
1.4 0.0 0.0 0.0 0.0 -0.0
-13.6 -79.2 -28.1 6.1 -23.2 2.3
112.9 11.9 101.2 64.3 121.1 41.2
108.0 32.1 80.5 61.4 122.7 39.1
-49.7 -3.8 -0.3 0.2 1.0 0.0
57.9 -64.1 76.8 80.0 112.2 49.0
– – – 0.0 0.0 0.0
– – – – -0.0 0.2
-4.9 -1.2 3.0 1.7 -4.0 -2.4
0.6 -0.5 2.2 1.0 -11.8 -4.2
0.5 -0.3 0.5 1.0 -1.9 3.9
-0.4 -0.0 – – – –
-4.6 -1.7 5.1 2.7 -15.8 -6.3
– – – 0.0 -0.4 -0.0
– – – – – –
0.0 – 0.0 – – 0.0
12.1 13.7 16.9 0.5 1.5 1.3
11.4 13.4 16.7 0.4 1.6 0.5
0.0 0.2 – – – –
12.1 14.0 16.9 0.6 1.1 1.3
424.5 352.5 426.1 -239.1 361.8 -35.9
Electricity, gas and water
Construction
Services
of which: Financial and insurance activities
Other
Total
Cabo Verde Manufacturing
Electricity, gas and water
Construction
Services
of which: Financial and insurance activities
Other
Total
Guinea-Bissau Manufacturing
Electricity, gas and water
Construction
Services
of which: Financial and insurance activities
Other
Total
Mozambique Manufacturing
Electricity, gas and water
Construction
Services
of which: Financial and insurance activities
Other
Total
São Tomé and Príncipe
Manufacturing
Electricity, gas and water
Construction
Services
of which: Financial and insurance activities
Other
Total
Timor-Leste Manufacturing
Electricity, gas and water
Construction
Services
of which: Financial and insurance activities
Other
Total
Total Portuguese-speaking African Countries and Timor-Leste
Source: Banco de Portugal.

117
Table 3.83 • Direct investment of Portuguese-speaking African countries and Timor-Leste in Portugal By sector of activity, EUR millions
2011 2012 2013 2014 2015 2016
Angola Manufacturing 2.3 -0.4 0.0 0.9 0.0 0.1
0.1 – – – – –
8.7 12.3 16.4 6.5 43.7 14.6
-129.6 181.4 41.8 405.3 117.8 -0.2
-152.1 164.1 34.3 397.7 80.9 6.8
21.1 10.7 18.3 18.8 6.1 4.7
-97.4 204.0 76.5 431.5 167.7 19.2
– – – -0.0 – –
– – – – 0.0 0.0
1.4 0.4 4.8 3.8 1.3 -0.6
3.7 1.3 2.3 0.8 0.9 0.5
0.4 0.2 -0.2 -0.2 -0.2 0.1
0.7 0.0 – – -0.0 –
5.8 1.7 7.1 4.5 2.2 -0.1
– – – – – –
– – – – – –
– – – 0.0 -0.1 -0.0
– – – 0.0 -2.1 0.0
– – – – – –
0.0 0.1 – – 0.0 0.0
0.0 0.1 0.0 0.0 -2.2 -0.0
-0.0 -0.4 0.0 0.9 0.0 0.1
-0.0 – – – 1.5 –
– -0.5 -0.8 -0.8 2.1 3.7
-0.1 -1.3 -0.7 -0.1 2.8 0.4
– -1.6 -0.5 -0.1 2.2 0.4
-0.3 0.0 – – 0.0 –
-0.5 -2.1 -1.4 -0.0 6.4 4.2
-0.1 – – – – –
– – – – – –
– -0.1 -2.2 -0.0 -0.0 0.0
-0.0 -0.9 -0.1 – 2.7 -0.3
-0.0 – 0.1 – 2.1 0.0
-0.5 – – – 0.0 –
-0.6 -1.1 -2.3 -0.0 2.7 -0.3
– – – – – –
– – – – – –
– – – – -0.9 0.0
2.2 -0.0 -0.0 -0.0 -0.3 -0.0
2.2 – – -0.0 -0.3 –
-0.0 0.0 0.0 0.0 -0.0 0.0
2.2 0.0 -0.0 -0.0 -1.1 -0.0
-90.5 202.6 79.9 436.0 175.6 23.1
Electricity, gas and water
Construction
Services
of which: Financial and insurance activities
Other
Total
Cabo Verde Manufacturing
Electricity, gas and water
Construction
Services
of which: Financial and insurance activities
Other
Total
Guiné-Bissau Manufacturing
Electricity, gas and water
Construction
Services
of which: Financial and insurance activities
Other
Total
Moçambique Manufacturing
Electricity, gas and water
Construction
Services
of which: Financial and insurance activities
Other
Total
São Tomé e Príncipe
Manufacturing
Electricity, gas and water
Construction
Services
of which: Financial and insurance activities
Other
Total
Timor-Leste Manufacturing
Electricity, gas and water
Construction
Services
of which: Financial and insurance activities
Other
Total
Total Portuguese-speaking African Countries and Timor-Leste
Source: Banco de Portugal.
Portugal's economic and financial relations with Portuguese-speaking African Countries and Timor-Leste

BANCO DE PORTUGAL • Economic Developments in Portuguese-speaking African Countries and Timor-Leste • 2016 | 2017118
Table 3.84 • Official debt of Portuguese-speaking African Countries to PortugalUSD millions
Direct debt to the State (1) Medium and long-term State-guaranteed debt (2) Official debt (1)+(2)
Due In arrears Total Due In arrears Total Due In arrears Total
Angola
Cabo Verde
Guinea- Bissau
Mozambique
S. Tomé and Príncipe
Total Portuguese--speaking African Countries
Source: Ministry of Finance - GPEARI.
2012 586 – 586 984 – 984 1,570 – 1,570
2013 558 – 558 897 – 897 1,456 – 1,456
2014 530 – 530 672 – 672 1,203 – 1,203
2015 502 – 502 423 3 427 926 3 929
2016 475 – 475 304 8 312 778 8 787
2012 187 – 187 318 – 318 505 – 505
2013 208 – 208 451 – 451 659 – 659
2014 181 – 181 494 – 494 675 – 675
2015 160 1 160 472 – 472 632 1 632
2016 152 – 152 473 0 473 625 0 625
2012 70 60 129 – – – 70 60 129
2013 71 66 138 – – – 71 66 138
2014 61 62 123 – – – 61 62 123
2015 53 59 112 – – – 53 59 112
2016 50 61 110 – – – 50 61 110
2012 376 – 376 803 – 803 1,178 – 1,178
2013 367 – 367 878 – 878 1,245 – 1,245
2014 355 – 355 775 – 775 1,131 – 1,131
2015 341 – 341 699 – 699 1,041 – 1,041
2016 324 – 324 683 – 683 1,008 – 1,008
2012 38 – 38 37 – 37 75 – 75
2013 44 – 44 39 – 39 83 – 83
2014 43 – 43 35 – 35 78 – 78
2015 53 – 53 36 – 36 89 – 89
2016 57 0 57 35 – 35 92 0 92
2012 1,256 60 1,316 2,142 – 2,142 3,398 60 3,458
2013 1,248 66 1,315 2,265 – 2,265 3,514 66 3,580
2014 1,171 62 1,233 1,976 – 1,976 3,147 62 3,209
2015 1,110 60 1,170 1,630 3 1,633 2,740 63 2,803
2016 1,058 61 1,119 1,495 8 1,503 2,553 69 2,622


BANCO DE PORTUGAL E U R O S I S T E M A
2016 | 2017
Evolução das economias dos PALOP e de Timor-Leste