ECONOMIC ANALYSIS AND KEY PERFORMANCE INDICATORS
34
MONITORING OF THE IMPLEMENTATION OF THE COMMON REGIONAL MARKET ACTION PLAN (2021- 2024) JUNE 2021 ECONOMIC ANALYSIS AND KEY PERFORMANCE INDICATORS
Transcript of ECONOMIC ANALYSIS AND KEY PERFORMANCE INDICATORS
MONITORING OF THE IMPLEMENTATION OF THE COMMON REGIONAL MARKET ACTION PLAN (2021-2024)
JUNE 2021
ECONOMIC ANALYSIS AND KEY PERFORMANCE INDICATORS
ECONOMIC ANALYSIS AND KEY PERFORMANCE INDICATORS
FIRST INTERIM REPORT ON THE MONITORING OF THE COMMON REGIONAL MARKET ACTION PLAN (2021-2024)
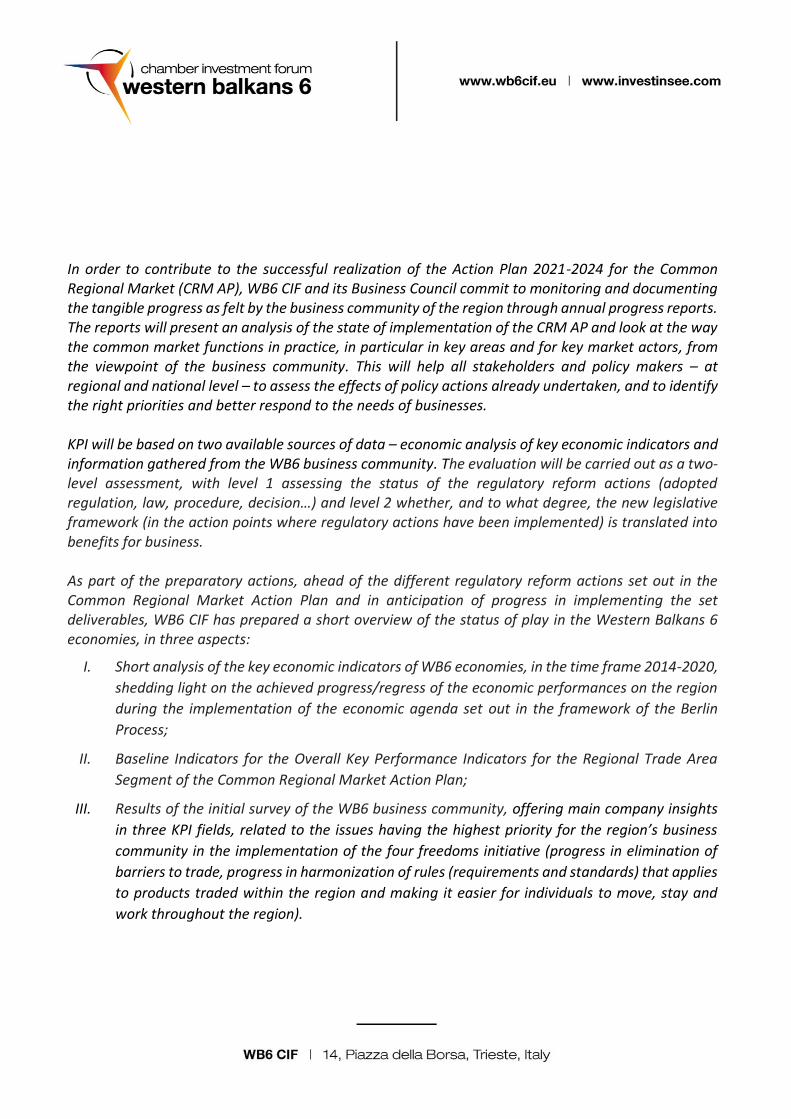
In order to contribute to the successful realization of the Action Plan 2021-2024 for the Common Regional Market (CRM AP), WB6 CIF and its Business Council commit to monitoring and documenting the tangible progress as felt by the business community of the region through annual progress reports. The reports will present an analysis of the state of implementation of the CRM AP and look at the way the common market functions in practice, in particular in key areas and for key market actors, from the viewpoint of the business community. This will help all stakeholders and policy makers – at regional and national level – to assess the effects of policy actions already undertaken, and to identify the right priorities and better respond to the needs of businesses. KPI will be based on two available sources of data – economic analysis of key economic indicators and information gathered from the WB6 business community. The evaluation will be carried out as a two-level assessment, with level 1 assessing the status of the regulatory reform actions (adopted regulation, law, procedure, decision…) and level 2 whether, and to what degree, the new legislative framework (in the action points where regulatory actions have been implemented) is translated into benefits for business. As part of the preparatory actions, ahead of the different regulatory reform actions set out in the Common Regional Market Action Plan and in anticipation of progress in implementing the set deliverables, WB6 CIF has prepared a short overview of the status of play in the Western Balkans 6 economies, in three aspects:
I. Short analysis of the key economic indicators of WB6 economies, in the time frame 2014-2020,
shedding light on the achieved progress/regress of the economic performances on the region
during the implementation of the economic agenda set out in the framework of the Berlin
Process;
II. Baseline Indicators for the Overall Key Performance Indicators for the Regional Trade Area
Segment of the Common Regional Market Action Plan;
III. Results of the initial survey of the WB6 business community, offering main company insights
in three KPI fields, related to the issues having the highest priority for the region’s business
community in the implementation of the four freedoms initiative (progress in elimination of
barriers to trade, progress in harmonization of rules (requirements and standards) that applies
to products traded within the region and making it easier for individuals to move, stay and
work throughout the region).
Table of Contents
SECTION I
WB6 Key Economic Indicators 5
Synopsis 6
Gross Domestic Product (GDP) 8
Investment (GFCF) and Foreign Direct Investment (FDI) 9
Labor market 10
Foreign trade (flows and balance) 11
Average annual growth rate EU (27) trade flows for period 2014-2020 14
Western Balkans, key changes 2014-2020 15
SECTION II
Overall Key Performance Indicators for the regional trade area segment of the CRM AP 17
SECTION III Insights from WB6 CIF Business Survey 21
KPI 2. Insights: Progress in elimination of barriers in terms of number of barriers resolved and number of (new) barriers to trade reported 23
1.1 NTM (Non-tariff measures) 23
1.2 Information and transparency (administrations and procedures) 27
KPI 3. Insights: Progress in harmonization of rules (requirements and standards) that applies to products traded within the region 30
KPI 5. Insights: Making it easier for individuals to move, stay and work 30
Statistical Annex 31
Trade 31
Sample structure 32
Methodology Notes: 34

SECTION I
THE WESTERN BALKANS 6
KEY ECONOMIC INDICATORS
2014 – 2020

Synopsis
- The Berlin Process has succeeded in moving the Western Balkans 6 region into a good direction, especially concerning regional economic cooperation.
- However, according to estimates by international financial institutions, the Western Balkans is below its economic potential, while regional foreign trade is still not satisfactorily integrated into the global value chain.
- Actual GDP growth rate of WB6 economies and the region combined could be higher 1.5 to 2 percentage points if the Western Balkans was fully integrated in terms of free movement of people, goods, services and capital.
- In the period 2014 – 2020, total population in the Western Balkans decreased by 2.1%, while the average decline was 0.4%. The region has a total population of 17.7mn, while an informal estimate shows that up to 15mn live there, as a consequence of emigration.
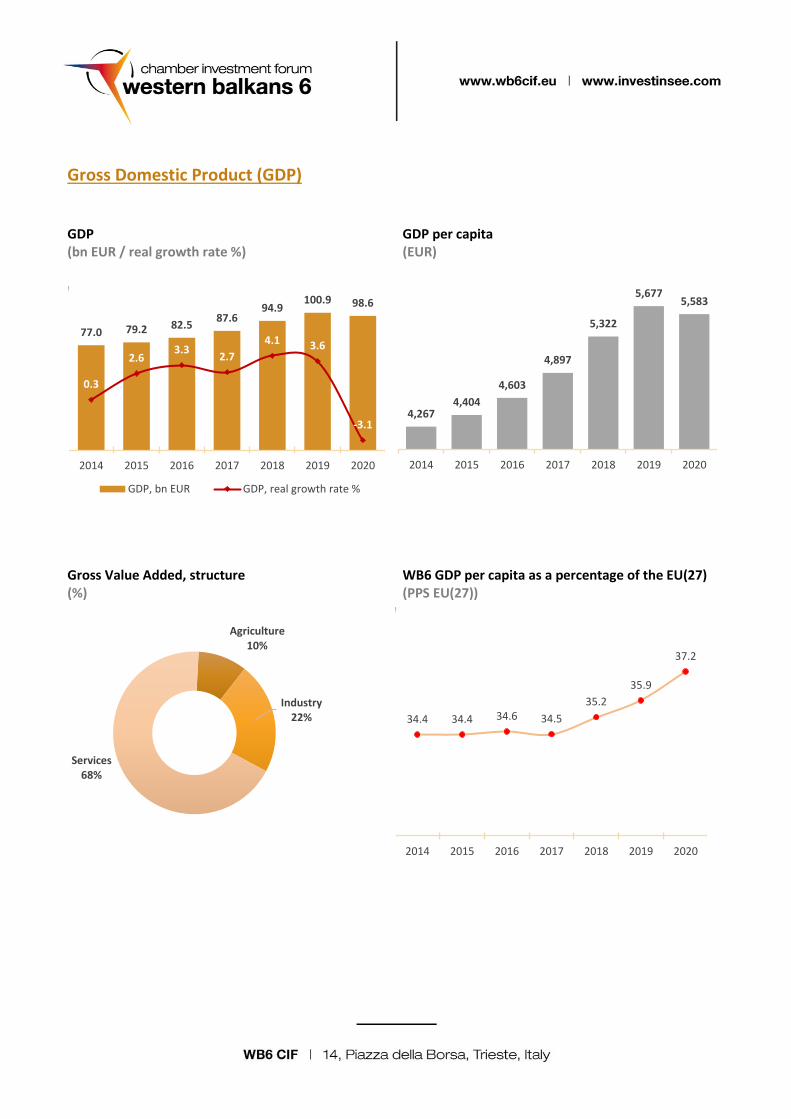
- Total regional GDP increased by 28.0% (average annual growth of 4.2%) from 2014 to 2020, which includes the decrease in GDP in 2020 due to the COVID-19 pandemic. In absolute figures, the regional GDP amounted to EUR 98.6bn compared to EUR 77.0bn in 2014. However, the region’s GDP peaked at EUR 100,9bn in 2019, prior to the pandemic.
- GDP per capita in 2020 amounted to EUR 5.583 which is a 30.8% increase compared to the beginning
of the observed period (EUR 4.267 in 2014). Average growth of this indicator was 4.6%, which is slightly higher than the average growth of total GDP (4.2%). GDP per capita (PPP) in the Western Balkans makes 35.6% of the EU 27 average.
- Composition of the Gross Value Added (GVA) of the Western Balkans region is as follows: 68% of the total GVA is generated by services, 22% by industry and 10% by agriculture.
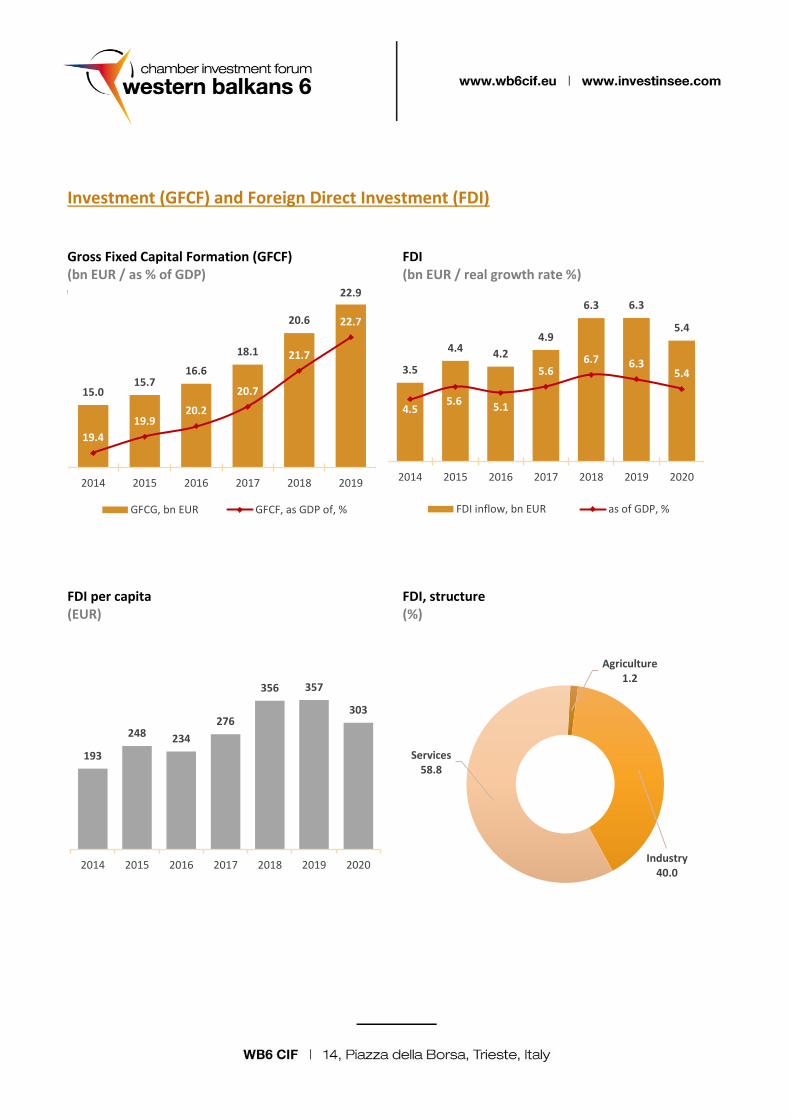
- Total inflow of FDI´s to the region amounted to EUR 35.0bn, and the largest invested value was in 2018 and 2019 (6.3 EUR bn each). In 2020 FDI´s inflow amounted to EUR 5.4bn, which was an increase of 53.4% compared to 2014. The FDI´s structure was as follows: 59% in services, 40% in industry and a symbolic investment in agriculture.
- Investment (Gross Fixed Capital Formation) has increased by 8.9% annually in the observed period. Level of GFCF as % of GDP has increased from 19.5% of GDP in 2014 to 22.7% of GDP in 2019 which is an important signal of economic growth.
- Total number of employees in 2020 was 6.7mn (21.3% higher compared to 2014), while the unemployment rate was at its historical low at 13.1% (9.3 p.p. lower than in 2014), the average gross salary was around EUR 650 (EUR 505 in 2014).
- Total trade of goods and services increased by 34.0%. The share of total export of goods and services in the GDP was 44.5% in 2020, while the total import of goods and services was 59.1%. The Western Balkans region is an open region for international trade, as Trade Openness Index was above 100% of GDP from 2015.
- In the period 2014-2020, export of goods recorded an average annual growth of 6.2%, while import of goods recorded a slightly lower growth, 3.9%. Export of services was growing 3.6% on average per year, while import of services was growing 3.9% on average per year.
- Since 2016, the deficit of trade in goods and services has recorded a slightly increasing trend.
- The main regional trading partner is the European Union (27), 60% of total trade in goods, while the intra-regional trade is about 12% (CEFTA). The trade in goods with the rest of the World was 28% of total trade.
- The main regional trading partner for export in goods is the European Union (27), where 68% of goods
were exported. The structure of export products from the region to the EU was the same each year, and just with a little variation in value of export. In 2020, the main export products to the EU were manufactured products (39% of total export) and machinery and transport equipment (30%). These two categories of commodities were the most frequent in total import from EU(27), with a share of 32% and 30%, respectively. Import from EU(27) is about 55% of total Western Balkans import.
- Intra-regional trade in the Western Balkans was the highest in 2019 (EUR 5.8bn), but due to the pandemic, in 2020 recorded a decrease by 10.0% and amounted to EUR 5.2bn.
- Main risks for economic sustainability: highly negative demographic trend, unequal regional development, tensions between leading global economic power, increase of interest rates on the international capital market as well as the increase in commodity prices, political disputes and risks, uncertainty of the EU integration process etc.
Gross Domestic Product (GDP) GDP GDP per capita (bn EUR / real growth rate %) (EUR)
Gross Value Added, structure WB6 GDP per capita as a percentage of the EU(27) (%) (PPS EU(27))
77.0 79.2 82.587.6
94.9100.9 98.6
0.3
2.63.3
2.7
4.1 3.6
-3.1
2014 2015 2016 2017 2018 2019 2020
GDP, bn EUR GDP, real growth rate %
4,2674,404
4,603
4,897
5,322
5,6775,583
2014 2015 2016 2017 2018 2019 2020
Agriculture10%
Industry22%
Services68%
34.4 34.4 34.6 34.5
35.2
35.9
37.2
2014 2015 2016 2017 2018 2019 2020
Investment (GFCF) and Foreign Direct Investment (FDI) Gross Fixed Capital Formation (GFCF) FDI (bn EUR / as % of GDP) (bn EUR / real growth rate %)
FDI per capita FDI, structure (EUR) (%)
15.015.7
16.6
18.1
20.6
22.9
19.4
19.920.2
20.7
21.7
22.7
2014 2015 2016 2017 2018 2019
GFCG, bn EUR GFCF, as GDP of, %
3.5
4.4 4.2
4.9
6.3 6.3
5.4
4.55.6
5.1
5.66.7 6.3
5.4
2014 2015 2016 2017 2018 2019 2020
FDI inflow, bn EUR as of GDP, %
193
248 234
276
356 357
303
2014 2015 2016 2017 2018 2019 2020
Agriculture1.2
Industry40.0
Services58.8
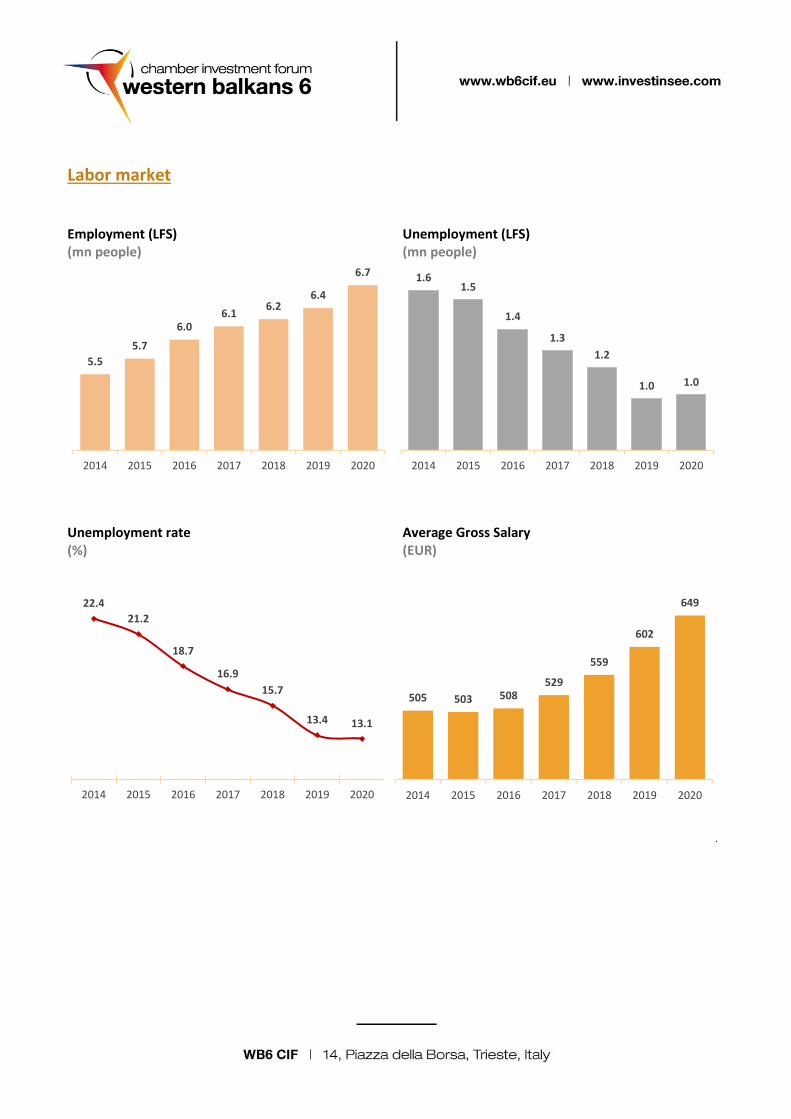
Labor market Employment (LFS) Unemployment (LFS) (mn people) (mn people)
Unemployment rate Average Gross Salary (%) (EUR)
.
5.5
5.7
6.06.1
6.26.4
6.7
2014 2015 2016 2017 2018 2019 2020
1.61.5
1.4
1.3
1.2
1.0 1.0
2014 2015 2016 2017 2018 2019 2020
22.4
21.2
18.7
16.9
15.7
13.4 13.1
2014 2015 2016 2017 2018 2019 2020
505 503 508529
559
602
649
2014 2015 2016 2017 2018 2019 2020
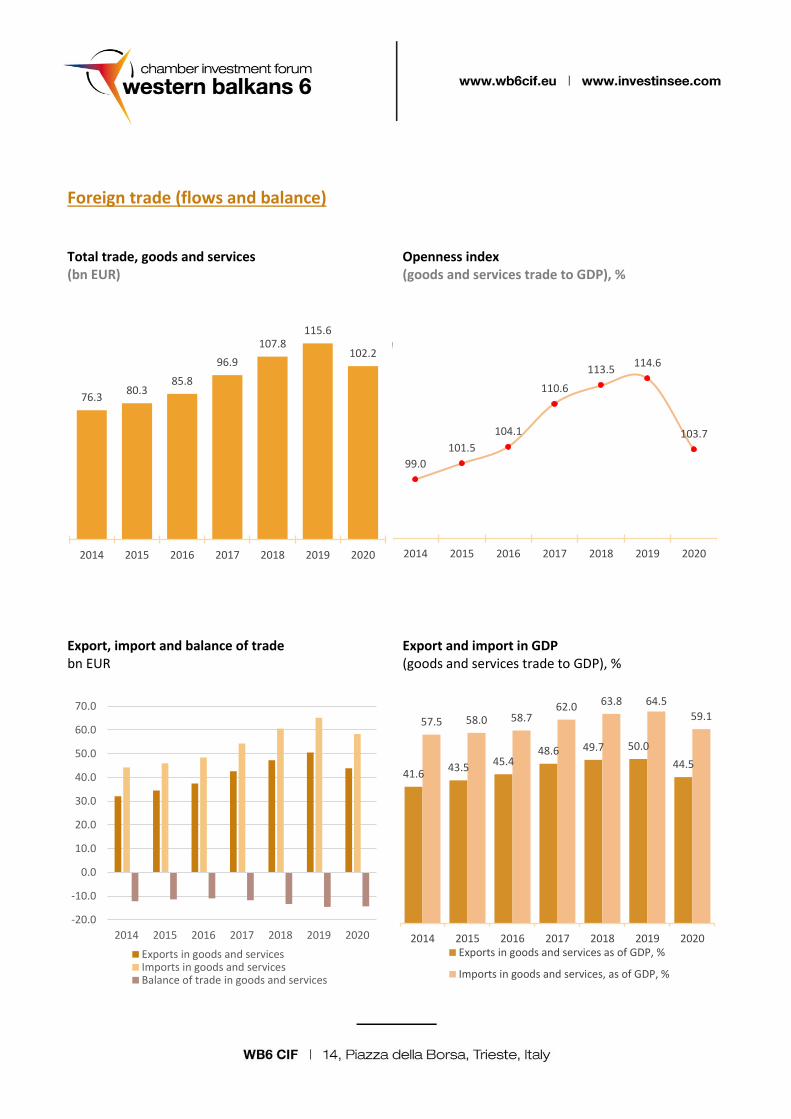
Foreign trade (flows and balance) Total trade, goods and services Openness index (bn EUR) (goods and services trade to GDP), %
Export, import and balance of trade Export and import in GDP bn EUR (goods and services trade to GDP), %
76.380.3
85.8
96.9
107.8115.6
102.2
2014 2015 2016 2017 2018 2019 2020
99.0
101.5
104.1
110.6
113.5114.6
103.7
2014 2015 2016 2017 2018 2019 2020
-20.0
-10.0
0.0
10.0
20.0
30.0
40.0
50.0
60.0
70.0
2014 2015 2016 2017 2018 2019 2020
Exports in goods and servicesImports in goods and servicesBalance of trade in goods and services
41.643.5 45.4
48.6 49.7 50.0
44.5
57.5 58.0 58.762.0 63.8 64.5
59.1
2014 2015 2016 2017 2018 2019 2020Exports in goods and services as of GDP, %
Imports in goods and services, as of GDP, %
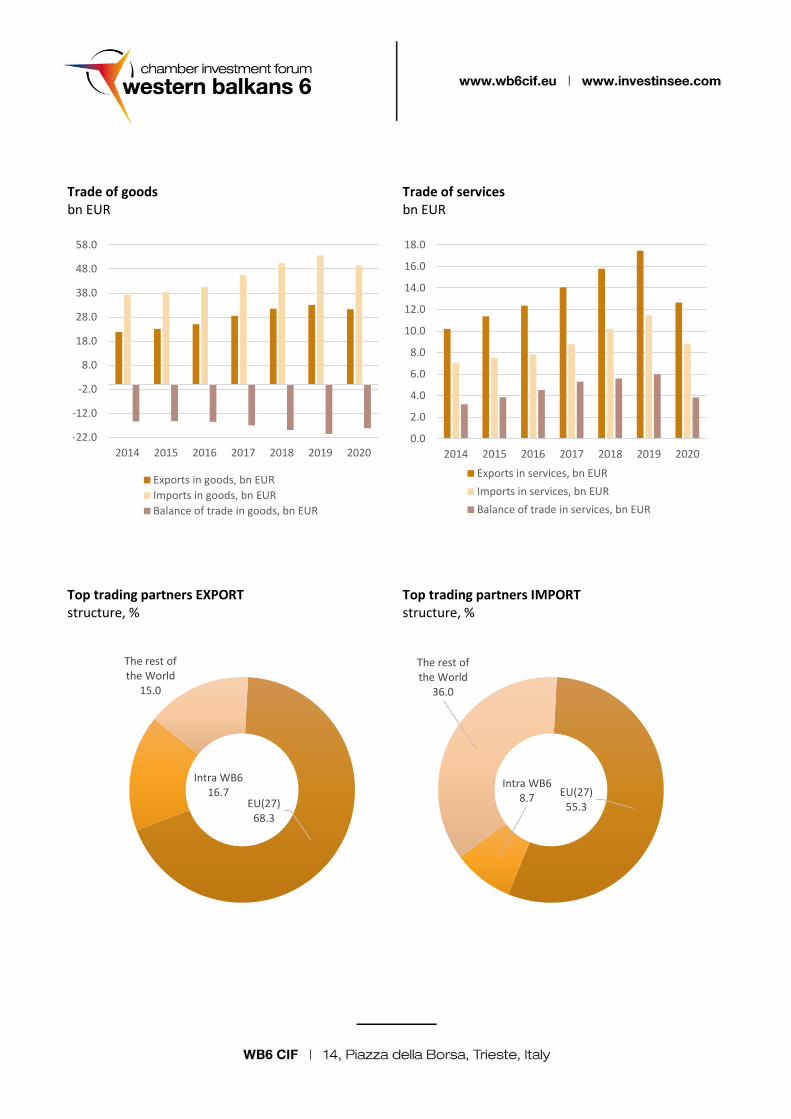
Trade of goods Trade of services bn EUR bn EUR
Top trading partners EXPORT Top trading partners IMPORT structure, % structure, %
-22.0
-12.0
-2.0
8.0
18.0
28.0
38.0
48.0
58.0
2014 2015 2016 2017 2018 2019 2020
Exports in goods, bn EUR
Imports in goods, bn EUR
Balance of trade in goods, bn EUR
0.0
2.0
4.0
6.0
8.0
10.0
12.0
14.0
16.0
18.0
2014 2015 2016 2017 2018 2019 2020
Exports in services, bn EUR
Imports in services, bn EUR
Balance of trade in services, bn EUR
EU(27)68.3
Intra WB616.7
The rest of the World
15.0
EU(27)55.3
Intra WB68.7
The rest of the World
36.0
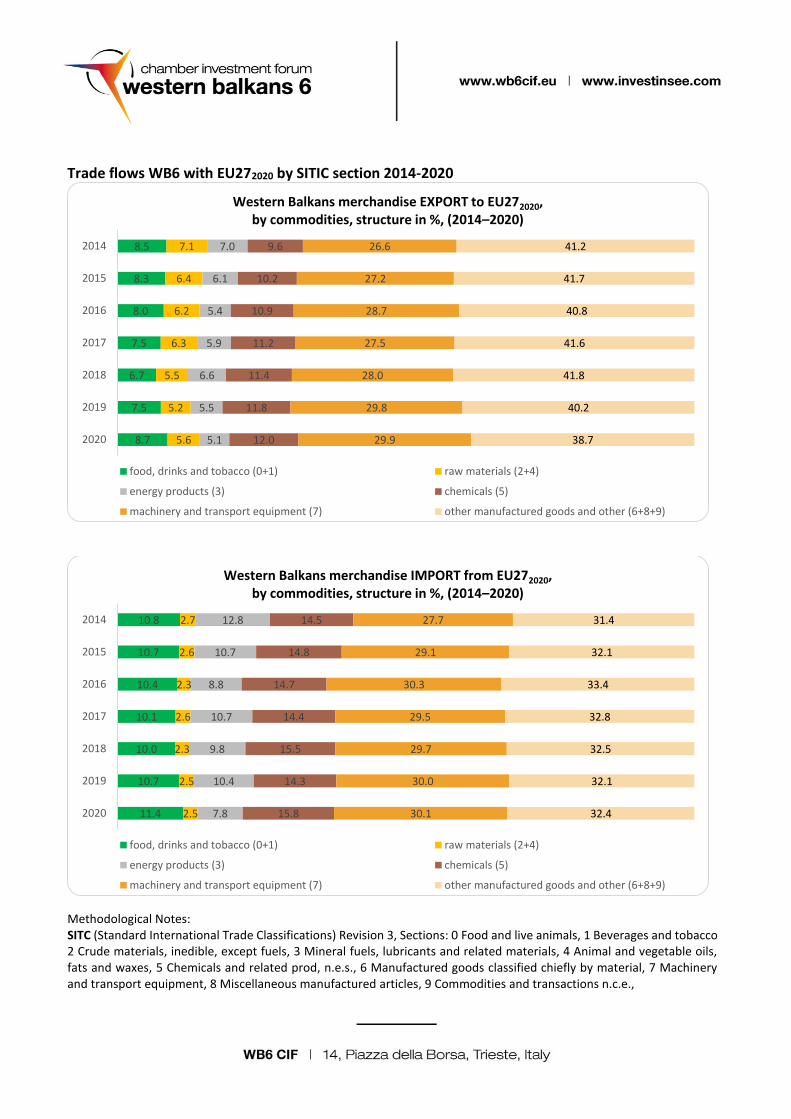
Trade flows WB6 with EU272020 by SITIC section 2014-2020
Methodological Notes: SITC (Standard International Trade Classifications) Revision 3, Sections: 0 Food and live animals, 1 Beverages and tobacco 2 Crude materials, inedible, except fuels, 3 Mineral fuels, lubricants and related materials, 4 Animal and vegetable oils, fats and waxes, 5 Chemicals and related prod, n.e.s., 6 Manufactured goods classified chiefly by material, 7 Machinery and transport equipment, 8 Miscellaneous manufactured articles, 9 Commodities and transactions n.c.e.,
8.5
8.3
8.0
7.5
6.7
7.5
8.7
7.1
6.4
6.2
6.3
5.5
5.2
5.6
7.0
6.1
5.4
5.9
6.6
5.5
5.1
9.6
10.2
10.9
11.2
11.4
11.8
12.0
26.6
27.2
28.7
27.5
28.0
29.8
29.9
41.2
41.7
40.8
41.6
41.8
40.2
38.7
2014
2015
2016
2017
2018
2019
2020
Western Balkans merchandise EXPORT to EU272020,by commodities, structure in %, (2014–2020)
food, drinks and tobacco (0+1) raw materials (2+4)
energy products (3) chemicals (5)
machinery and transport equipment (7) other manufactured goods and other (6+8+9)
10.8
10.7
10.4
10.1
10.0
10.7
11.4
2.7
2.6
2.3
2.6
2.3
2.5
2.5
12.8
10.7
8.8
10.7
9.8
10.4
7.8
14.5
14.8
14.7
14.4
15.5
14.3
15.8
27.7
29.1
30.3
29.5
29.7
30.0
30.1
31.4
32.1
33.4
32.8
32.5
32.1
32.4
2014
2015
2016
2017
2018
2019
2020
Western Balkans merchandise IMPORT from EU272020,by commodities, structure in %, (2014–2020)
food, drinks and tobacco (0+1) raw materials (2+4)
energy products (3) chemicals (5)
machinery and transport equipment (7) other manufactured goods and other (6+8+9)
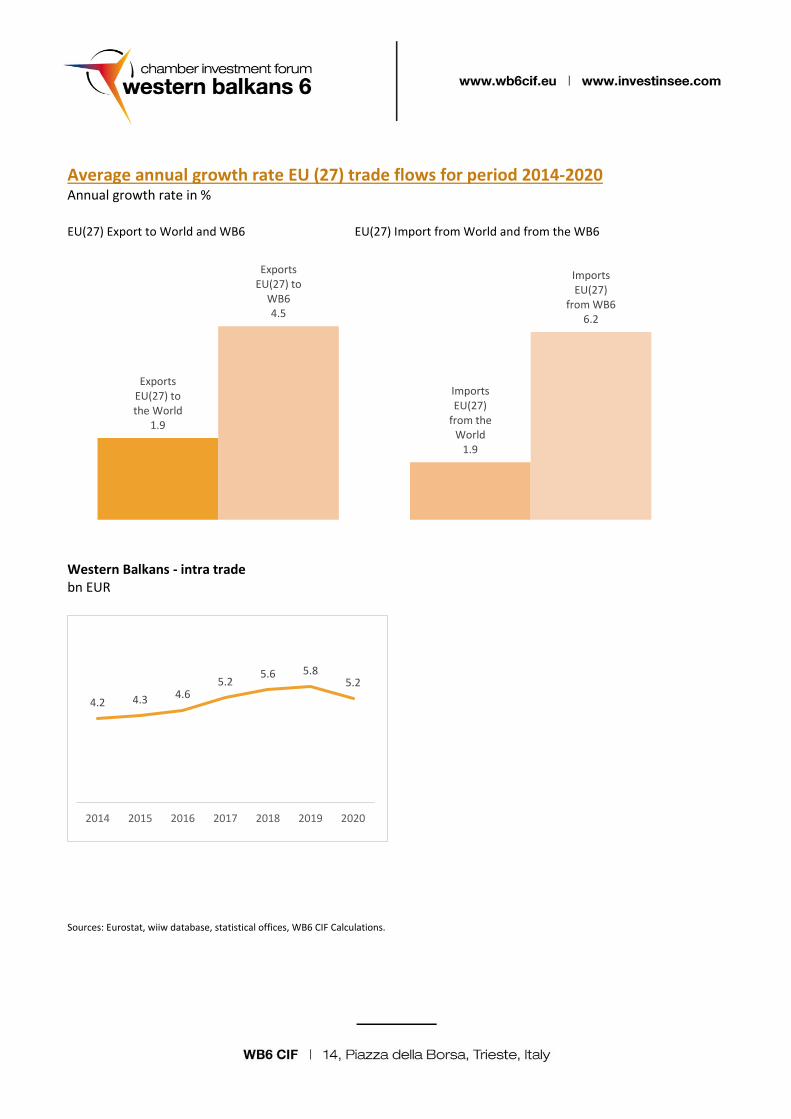
Average annual growth rate EU (27) trade flows for period 2014-2020 Annual growth rate in %
EU(27) Export to World and WB6 EU(27) Import from World and from the WB6
Western Balkans - intra trade bn EUR
Sources: Eurostat, wiiw database, statistical offices, WB6 CIF Calculations.
Exports EU(27) to the World
1.9
Exports EU(27) to
WB64.5
Imports EU(27)
from the World
1.9
Imports EU(27)
from WB66.2
4.2 4.3 4.65.2
5.6 5.85.2
2014 2015 2016 2017 2018 2019 2020
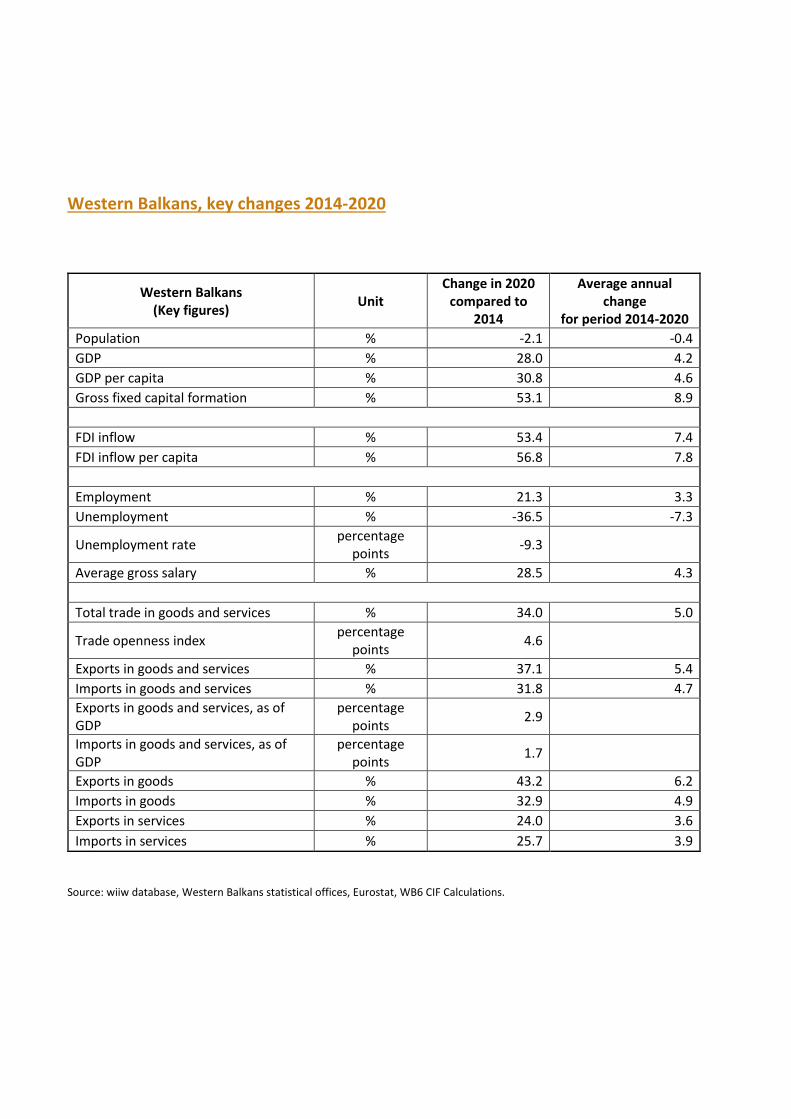
Western Balkans, key changes 2014-2020
Western Balkans (Key figures)
Unit Change in 2020
compared to 2014
Average annual change
for period 2014-2020
Population % -2.1 -0.4
GDP % 28.0 4.2
GDP per capita % 30.8 4.6
Gross fixed capital formation % 53.1 8.9
FDI inflow % 53.4 7.4
FDI inflow per capita % 56.8 7.8
Employment % 21.3 3.3
Unemployment % -36.5 -7.3
Unemployment rate percentage
points -9.3
Average gross salary % 28.5 4.3
Total trade in goods and services % 34.0 5.0
Trade openness index percentage
points 4.6
Exports in goods and services % 37.1 5.4
Imports in goods and services % 31.8 4.7
Exports in goods and services, as of GDP
percentage points
2.9
Imports in goods and services, as of GDP
percentage points
1.7
Exports in goods % 43.2 6.2
Imports in goods % 32.9 4.9
Exports in services % 24.0 3.6
Imports in services % 25.7 3.9
Source: wiiw database, Western Balkans statistical offices, Eurostat, WB6 CIF Calculations.
SECTION II
OVERALL KEY PERFORMANCE INDICATORS FOR THE REGIONAL TRADE AREA SEGMENT OF THE COMMON REGIONAL MARKET
ACTION PLAN
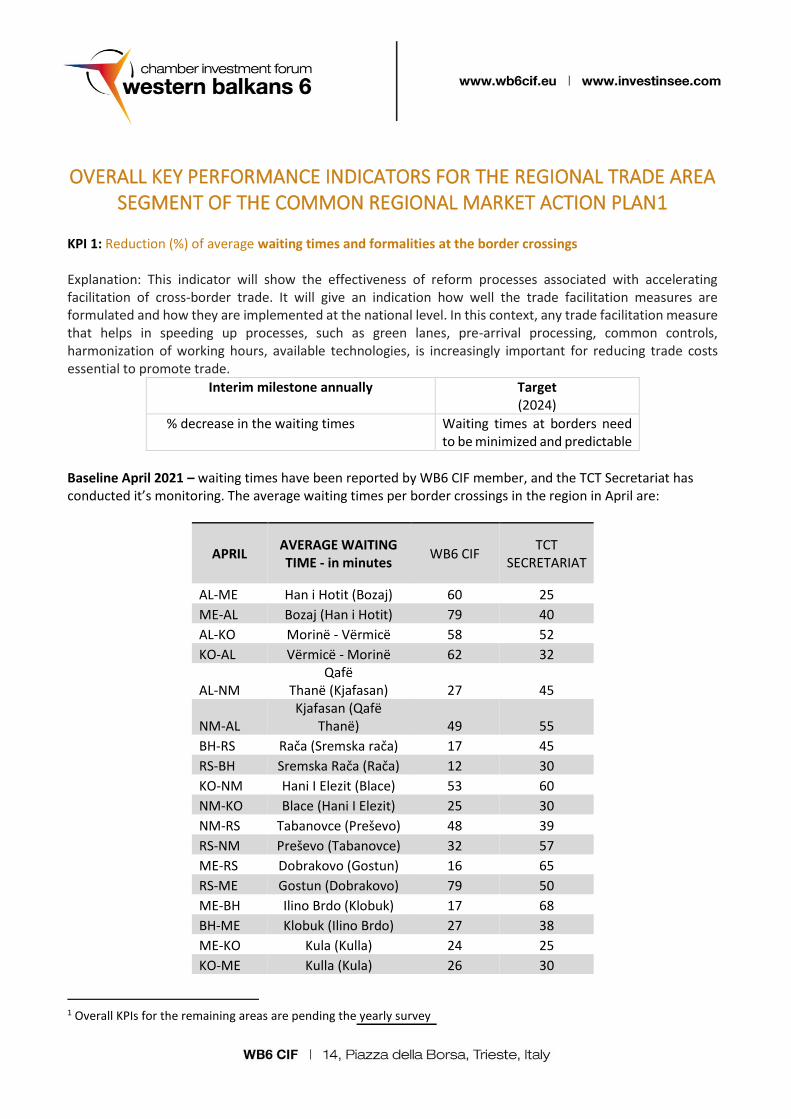
OVERALL KEY PERFORMANCE INDICATORS FOR THE REGIONAL TRADE AREA SEGMENT OF THE COMMON REGIONAL MARKET ACTION PLAN1
KPI 1: Reduction (%) of average waiting times and formalities at the border crossings Explanation: This indicator will show the effectiveness of reform processes associated with accelerating facilitation of cross-border trade. It will give an indication how well the trade facilitation measures are formulated and how they are implemented at the national level. In this context, any trade facilitation measure that helps in speeding up processes, such as green lanes, pre-arrival processing, common controls, harmonization of working hours, available technologies, is increasingly important for reducing trade costs essential to promote trade.
Interim milestone annually
Target (2024)
% decrease in the waiting times Waiting times at borders need to be minimized and predictable
Baseline April 2021 – waiting times have been reported by WB6 CIF member, and the TCT Secretariat has conducted it’s monitoring. The average waiting times per border crossings in the region in April are:
APRIL AVERAGE WAITING TIME - in minutes
WB6 CIF TCT
SECRETARIAT
AL-ME Han i Hotit (Bozaj) 60 25
ME-AL Bozaj (Han i Hotit) 79 40
AL-KO Morinë - Vërmicë 58 52
KO-AL Vërmicë - Morinë 62 32
AL-NM Qafë
Thanë (Kjafasan) 27 45
NM-AL Kjafasan (Qafë
Thanë) 49 55
BH-RS Rača (Sremska rača) 17 45
RS-BH Sremska Rača (Rača) 12 30
KO-NM Hani I Elezit (Blace) 53 60
NM-KO Blace (Hani I Elezit) 25 30
NM-RS Tabanovce (Preševo) 48 39
RS-NM Preševo (Tabanovce) 32 57
ME-RS Dobrakovo (Gostun) 16 65
RS-ME Gostun (Dobrakovo) 79 50
ME-BH Ilino Brdo (Klobuk) 17 68
BH-ME Klobuk (Ilino Brdo) 27 38
ME-KO Kula (Kulla) 24 25
KO-ME Kulla (Kula) 26 30
1 Overall KPIs for the remaining areas are pending the yearly survey

RS-KO Merdare 5 7
KO-RS Merdare 25 38
Of particular concern are the waiting times registered at the WB6-EU border crossings:
o Horgoš border crossing from Serbia to Hungary – 496 minutes (almost 8 1/2 hours) o Kelebija border crossing from Serbia to Hungary – 425 minute (7 hours). o Batrovci border crossing from Serbia to Croatia – 371 minutes o Šid border crossing from Serbia to Croatia – 270 minutes o Gradiška border crossing from B&H to Croatia – 97 minutes
KPI2: Progress in elimination of barriers: Number of barriers resolved. Number of (new) barriers to trade reported Explanation: This indicator will show the number of resolved and newly identified barriers in the region and help assessing the effectiveness of the implementation of the regional commitments. The regular reports will provide practical guides for the prioritisation and resolution of market access barriers and the improvement of the measures needed to better respond to real needs and concerns of businesses.
Interim milestone annually
Target (2024)
At least 50% of reported barriers resolved At least 80% of reported barriers resolved
Baseline is established by the preliminary survey presented in this document. KPI 3: Progress in harmonisation of rules (requirements and standards) that apply to products traded within the region Explanation: This indicator will show the extent to which operators can benefit from harmonisation of rules within the region, specifically from the mutual recognition of test results and certificates for traded products (without any additional testing or certification).
Interim milestone Target (2024)
Increase % of companies expressing satisfaction with the benefits of implemented MRAs and harmonised product requirements
Recognition of tests and certificates for traded products ensuring the free movement of goods within the region.
Baseline: There is no functioning regional MRA in effect; company sentiment is expressed in the preliminary survey presented in this document.
KPI 4: Progress in enabling companies to provide services across the region on equal terms without requirements for permanent establishment (e.g. forming and registering a local company) Explanation: This indicator will help assess the effectiveness of the proposed measures in helping companies to reap economic opportunities provided by mutual recognition of national regulations in services (establishment requirement, professional qualifications, technical standards, licenses, insurance requirements, etc.) within the region.
Interim milestone
Target (2024)
ncreased number of sectors covered by implemented MRA. Increase % of companies expressing satisfaction with conditions for the cross-border provision of services and the establishment of businesses
Service providers are able to provide services across the region on equal terms
Baseline: Decisions within the CEFTA framework laying conditions for the fulfillment of Protocol VI are pending.
There is no functioning regional MRA nor legal provisions enabling companies to provide services on equal
terms.
KPI 5: Making it easier for individuals to move, stay and work throughout the region Explanation: This indicator will show the extent to which individuals in the region can benefit from simplification of formalities for entry, movement, stay and work in the region as well as from recognition of academic qualifications and portability of social rights.
Interim milestone
Target (2024)
Increased number of sectors covered by implemented MRA. Increase % of companies expressing satisfaction with the progress in simplification of formalities conducive to labor mobility within the region
Individuals can enjoy facilitated access to the labor market, including simplified procedures and exemptions from work permits
Baseline is established by the preliminary survey presented in this document.
KPI 6: Improvement in addressing key restrictions impeding the movement of capital across the region Explanation: This indicator will demonstrate whether the proposed measures are conducive to cross-border capital transfers, cross-border investments and loans.
Interim milestone
Target (2024)
Increase % of companies expressing satisfaction with the progress in enabling
cross-border movement of capital and payments
Companies are able to invest in and own other companies in the region and raise loans within the region without discrimination
SECTION III
INSIGHTS FROM BUSINESS SURVEY WB6 CIF

Insights from Business Survey WB6 CIF2 The results of the first WB6 CIF Business Survey examine how primarily non-tariff measures (NTMs) applied by the Western Balkans trading partners affects companies in intra-regional trade. Results are based on a survey of 345 companies from across 27 economy branches, in sectors: Agriculture, Industry, Construction and Services in the WB6 chambers members (37% of companies come from the industry sector, 46 % from the services sector, 10 % are from the construction sector while 7% are from agriculture). It presents the results obtained in terms of impact on WB companies, by type of NTM, effects on companies of different sizes, particularly micro, small and medium-sized enterprises; draws conclusions on the importance of the role of the Western Balkans market and implementation work to facilitate internal trade. Survey offers main company insights in three KPI fields: KPI 2. Progress in elimination of barriers in terms of number of barriers resolved and number of (new)
barriers to trade reported. Indicator shows the number of resolved and newly identified barriers in the region
and help assessing the effectiveness of the implementation of the regional commitments. The regular reports
should provide practical guides for the prioritization and resolution of market access barriers and the
improvement of the measures needed to better respond to real needs and concerns of businesses.
KPI 3. Progress in harmonization of rules (requirements and standards) that applies to products traded
within the region. Indicator shows the extent to which operators can benefit from harmonization of rules
within the region, specifically from the mutual recognition of test results and certificates for traded products
(without any additional testing or certification).
KPI 5. Making it easier for individuals to move, stay and work throughout the region. Indicator shows the extent to which individuals in the region can benefit from simplification of formalities for entry, movement, stay and work in the region as well as from recognition of academic qualifications and portability of social rights. Key Survey results:
• 73% of interviewed companies face trading problems regarding non-tariff measures. Top 3 Non-tariff barriers are: Rules of Origin, Technical Barriers to trade, and Export related measures.
• 76% of interviewed companies face problems regarding administration and procedures. Majority of them report a lack of publicly available information, problems related to formalities connected with importation, exportation and transit, problems related to the release and clearance of goods and problems on fees and charges imposed on relation to trade, and penalties.
• 27% of interviewed companies do not face trading problems regarding non-tariff measures and 24% of them do not face problems regarding administration and procedures.
2 The survey was conducted in May 2021. Report The Business Survey Results was prepared by WB6 CIF RCEA (Regional Center for Economic Analysis).
• Companies face complex certification procedures.
• Companies think that stronger connection between customs administrations and other border agencies in the WB6 is important.
• Companies think that unique standards are important for establishment of the regional market.
• Companies face problems in obtaining work permits for employees engaged on project realization in other countries of the region.
• 70% of interviewed companies are engaged in foreign trade and around 5% of companies are interested in trading, but report barriers to trade.
1. KPI 2 Insights: Progress in elimination of barriers in terms of number of barriers resolved and number of (new) barriers to trade reported
1.1 NTM (Non-tariff measures) Key findings:
• Companies think that administrative processes are slow and take time.
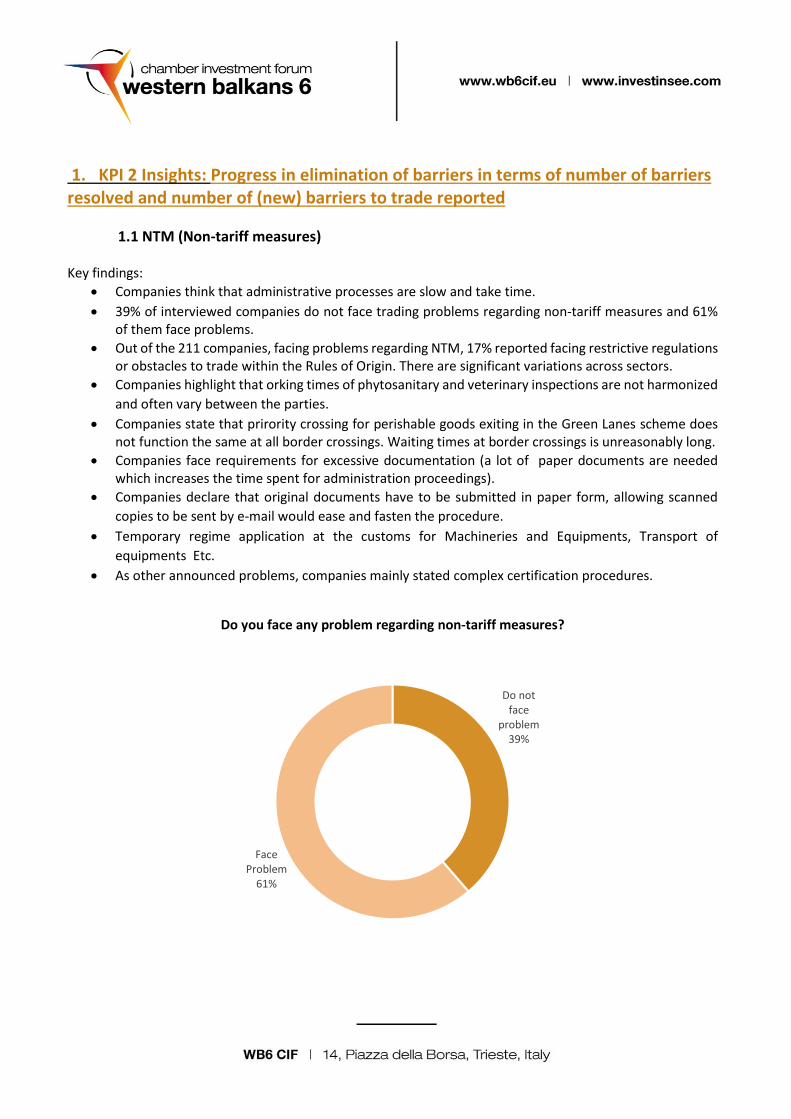
• 39% of interviewed companies do not face trading problems regarding non-tariff measures and 61% of them face problems.
• Out of the 211 companies, facing problems regarding NTM, 17% reported facing restrictive regulations or obstacles to trade within the Rules of Origin. There are significant variations across sectors.
• Companies highlight that orking times of phytosanitary and veterinary inspections are not harmonized
and often vary between the parties.
• Companies state that prirority crossing for perishable goods exiting in the Green Lanes scheme does not function the same at all border crossings. Waiting times at border crossings is unreasonably long.
• Companies face requirements for excessive documentation (a lot of paper documents are needed which increases the time spent for administration proceedings).
• Companies declare that original documents have to be submitted in paper form, allowing scanned
copies to be sent by e-mail would ease and fasten the procedure.
• Temporary regime application at the customs for Machineries and Equipments, Transport of
equipments Etc.
• As other announced problems, companies mainly stated complex certification procedures.
Do you face any problem regarding non-tariff measures?
Do not face
problem39%
Face Problem
61%
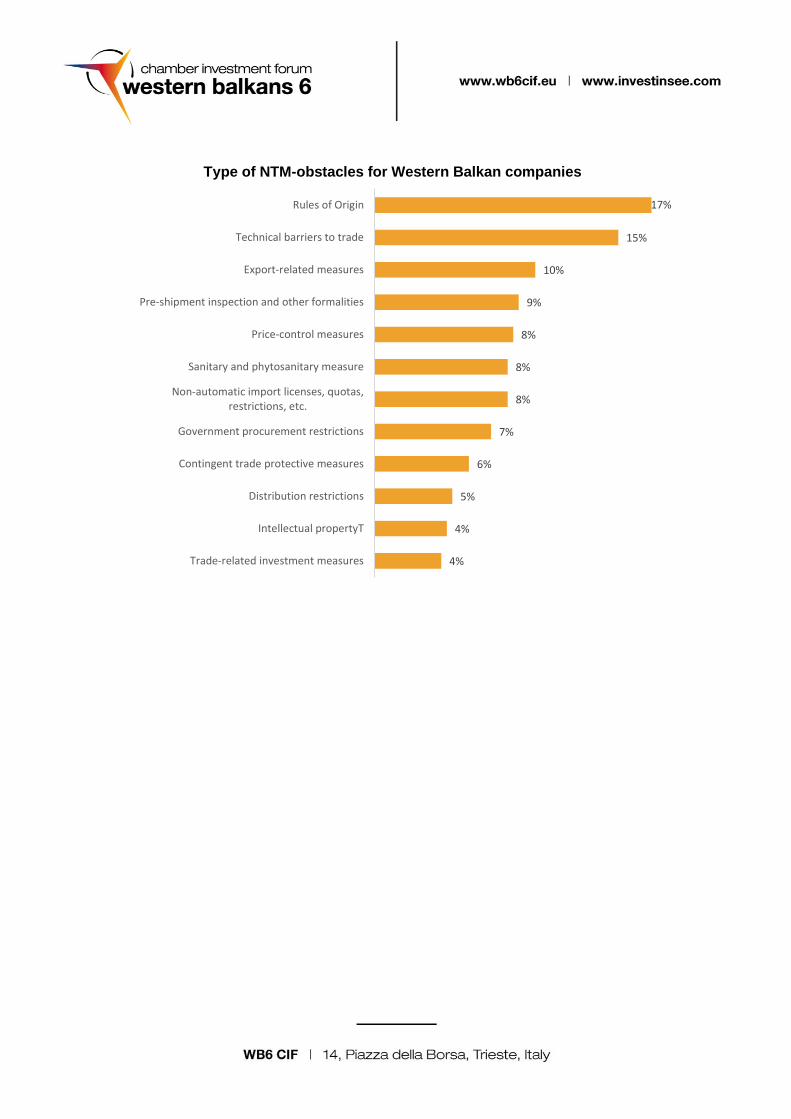
Type of NTM-obstacles for Western Balkan companies
17%
15%
10%
9%
8%
8%
8%
7%
6%
5%
4%
4%
Rules of Origin
Technical barriers to trade
Export-related measures
Pre-shipment inspection and other formalities
Price-control measures
Sanitary and phytosanitary measure
Non-automatic import licenses, quotas,restrictions, etc.
Government procurement restrictions
Contingent trade protective measures
Distribution restrictions
Intellectual propertyT
Trade-related investment measures
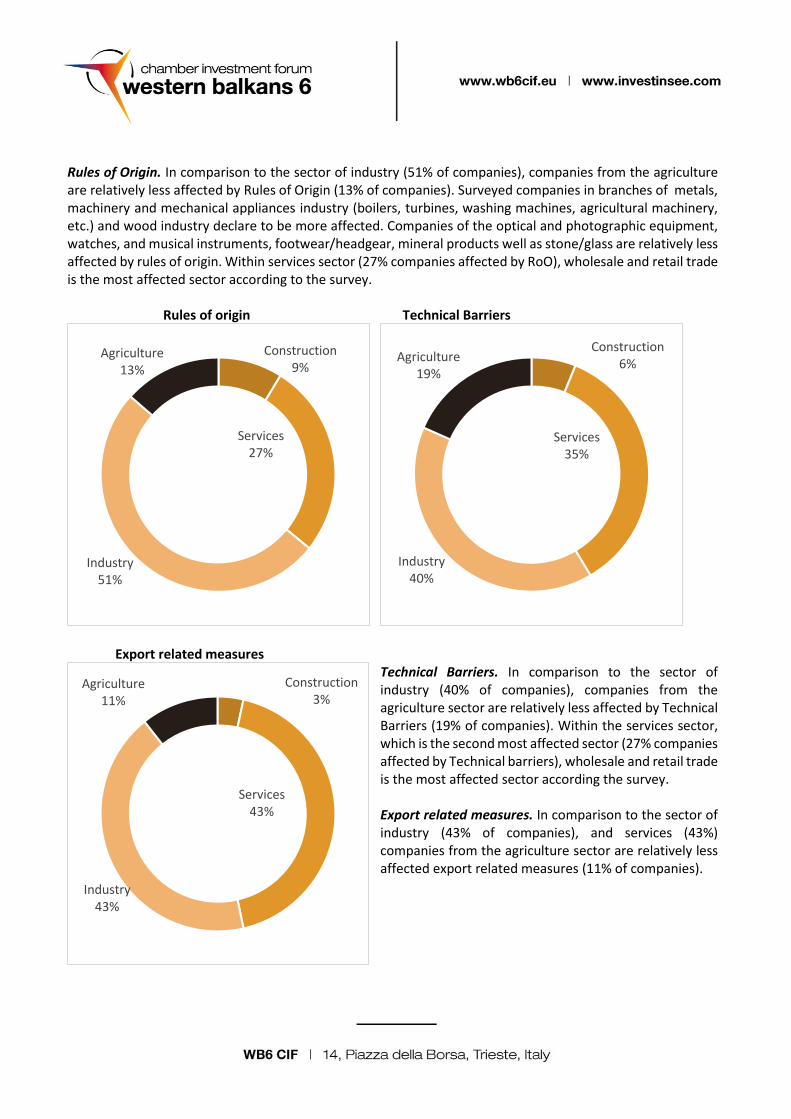
Rules of Origin. In comparison to the sector of industry (51% of companies), companies from the agriculture are relatively less affected by Rules of Origin (13% of companies). Surveyed companies in branches of metals, machinery and mechanical appliances industry (boilers, turbines, washing machines, agricultural machinery, etc.) and wood industry declare to be more affected. Companies of the optical and photographic equipment, watches, and musical instruments, footwear/headgear, mineral products well as stone/glass are relatively less affected by rules of origin. Within services sector (27% companies affected by RoO), wholesale and retail trade is the most affected sector according to the survey.
Rules of origin Technical Barriers
Export related measures
Technical Barriers. In comparison to the sector of industry (40% of companies), companies from the agriculture sector are relatively less affected by Technical Barriers (19% of companies). Within the services sector, which is the second most affected sector (27% companies affected by Technical barriers), wholesale and retail trade is the most affected sector according the survey. Export related measures. In comparison to the sector of industry (43% of companies), and services (43%) companies from the agriculture sector are relatively less affected export related measures (11% of companies).
Construction9%
Services27%
Industry51%
Agriculture13%
Construction6%
Services35%
Industry40%
Agriculture19%
Construction3%
Services43%
Industry43%
Agriculture11%
Besides previously listed barriers, WB6 companies face additional problems:
• Non-compliance with signed bilateral agreements on the recognition of phytosanitary certificates
and veterinary certificates (resulting in additional quality control by the importing country and
additional unnecessary costs - approximately 200 Euros per truck).
• Barriers on transportation among neighboring countries (and further to the EU).
• Authorisation for export that is needed in some WB6 economies.
• Obligation to acquire a national conformity assessment certificate for products that were already
tested in the EU.
• Obligation to acquire a national conformity assessment certificate even though the product has a
certificate issued in another WB6 economy.
• Intellectual Property issues.
• The defined deadline for payment of customs duties (customs and VAT) is to short, especially for
companies engaged in production.
• Content of the labels on the products only apear to be sinchronised with EU directions but are
unnecessarily more rigid (e.g. trade inspectors in some WB6 economies insist on putting the name of
the producer on the label, EU legislation does not insist on this - only the exporter and the country of
export are mandatory)
• High illetaracy rate concerning Electronic Data Interchange (EDI).
• The rate od re-sampling at the border is too high, in cases when the products have all necesarry
documents and testing results from the WB6 economy of import. High bank fees for online payments
which bring up the already high costs for the import of goods
• EU quotas, especially the quotas established due to the steel safeguards mechanism.
Some companies announced that obtaining certificates which can only be issued by specific certification bodies makes the procedure costly. Very often the time needed for receiving certificates and preparing trade procedures is lengthy making trade more difficult and costly.
1.2 Information and transparency (administrations and procedures) Key findings:
• Information and transparency represent large part of the issues highlighted. These issues include lack
of publicly available information, problems related to formalities, not adequately publicized regulative
information and related topics.
• These issues should be raised by authorities with increasing efforts to ensure jointly coordination and
exchange information related to the trade policy measures.
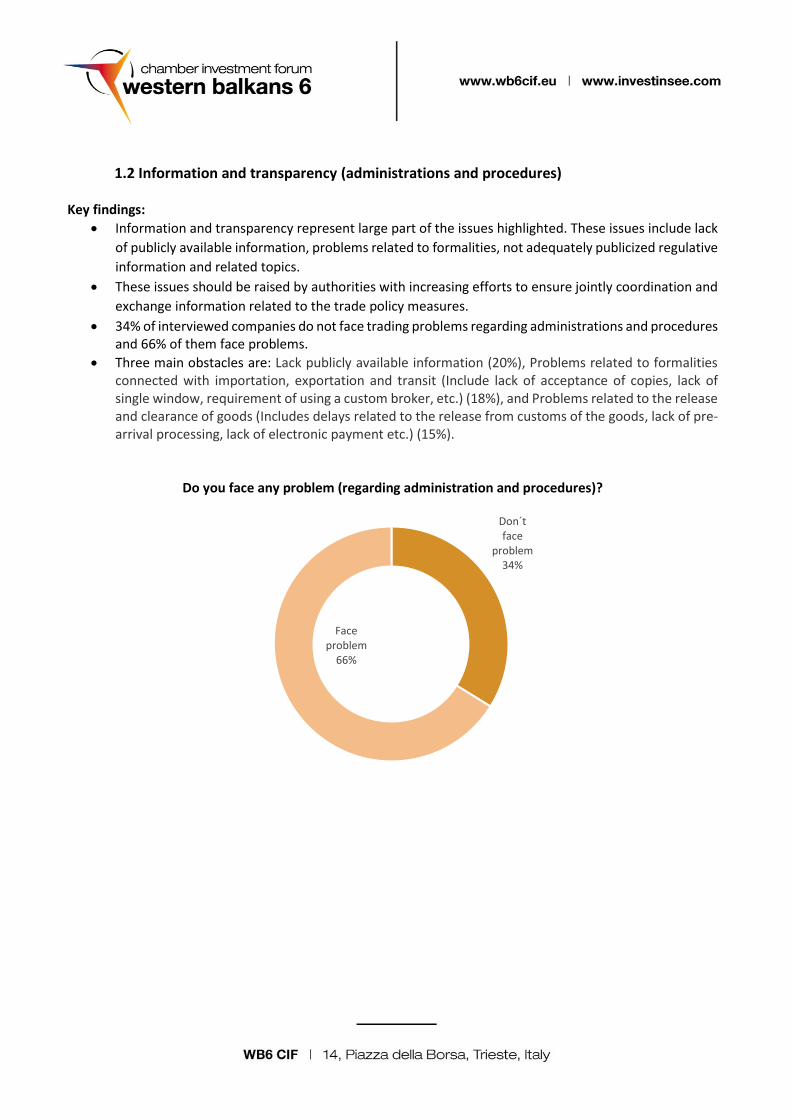
• 34% of interviewed companies do not face trading problems regarding administrations and procedures and 66% of them face problems.
• Three main obstacles are: Lack publicly available information (20%), Problems related to formalities connected with importation, exportation and transit (Include lack of acceptance of copies, lack of single window, requirement of using a custom broker, etc.) (18%), and Problems related to the release and clearance of goods (Includes delays related to the release from customs of the goods, lack of pre-arrival processing, lack of electronic payment etc.) (15%).
Do you face any problem (regarding administration and procedures)?
Don´t face
problem34%
Face problem
66%
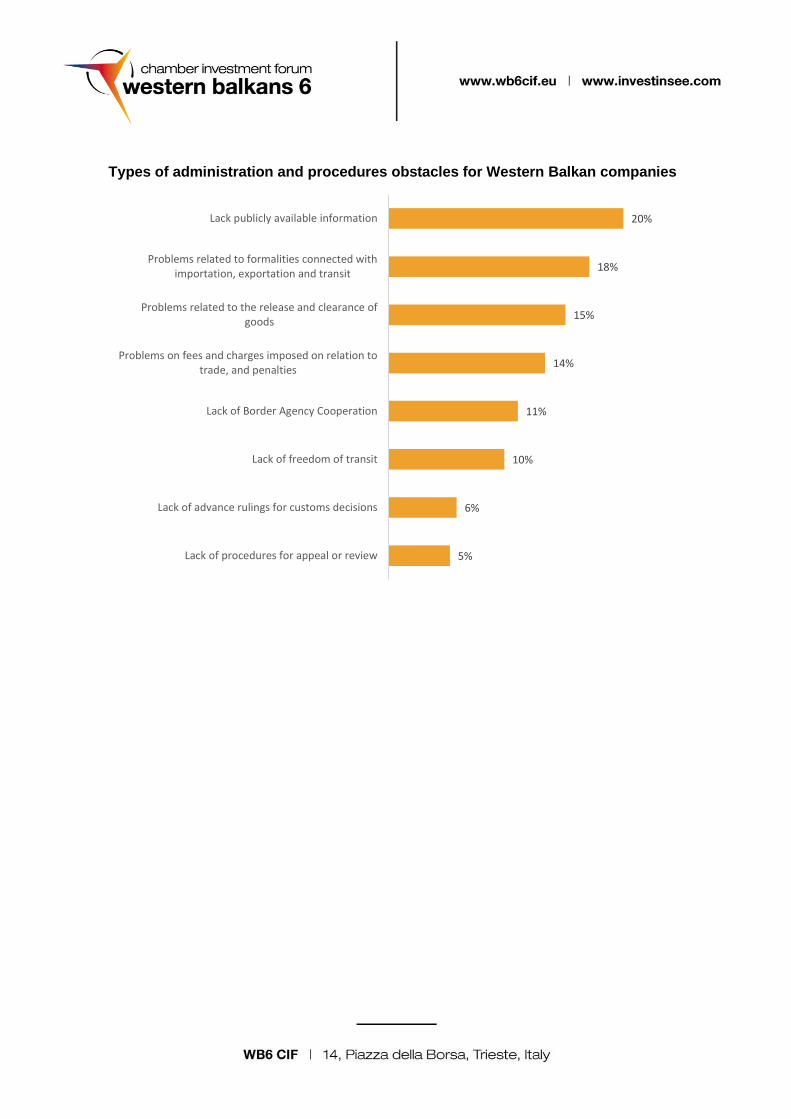
Types of administration and procedures obstacles for Western Balkan companies
20%
18%
15%
14%
11%
10%
6%
5%
Lack publicly available information
Problems related to formalities connected withimportation, exportation and transit
Problems related to the release and clearance ofgoods
Problems on fees and charges imposed on relation totrade, and penalties
Lack of Border Agency Cooperation
Lack of freedom of transit
Lack of advance rulings for customs decisions
Lack of procedures for appeal or review
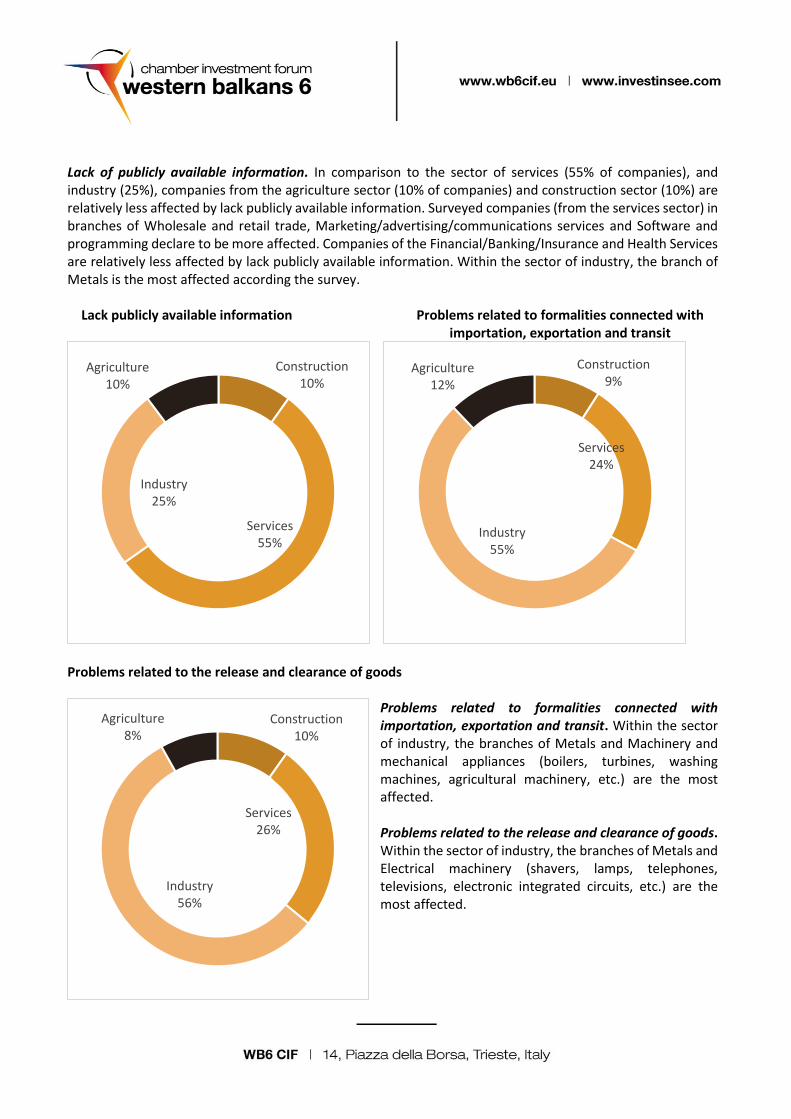
Lack of publicly available information. In comparison to the sector of services (55% of companies), and industry (25%), companies from the agriculture sector (10% of companies) and construction sector (10%) are relatively less affected by lack publicly available information. Surveyed companies (from the services sector) in branches of Wholesale and retail trade, Marketing/advertising/communications services and Software and programming declare to be more affected. Companies of the Financial/Banking/Insurance and Health Services are relatively less affected by lack publicly available information. Within the sector of industry, the branch of Metals is the most affected according the survey.
Lack publicly available information Problems related to formalities connected with importation, exportation and transit
Problems related to the release and clearance of goods
Problems related to formalities connected with importation, exportation and transit. Within the sector of industry, the branches of Metals and Machinery and mechanical appliances (boilers, turbines, washing machines, agricultural machinery, etc.) are the most affected. Problems related to the release and clearance of goods. Within the sector of industry, the branches of Metals and Electrical machinery (shavers, lamps, telephones, televisions, electronic integrated circuits, etc.) are the most affected.
Construction10%
Services55%
Industry25%
Agriculture10%
Construction9%
Services24%
Industry55%
Agriculture12%
Construction10%
Services26%
Industry56%
Agriculture8%
KPI 3. Insights: Progress in harmonization of rules (requirements and standards) that applies to products traded within the region
• Companies face problems due to lack of controlling quality of equipment and related standards
• Companies face problems in controlling technical characteristics
KPI 5. Insights: Making it easier for individuals to move, stay and work
• Problems in obtaining work permits for employees engaged on project realization in other countries
of the region.
• In the area of education there is suggestion as need decision for one institution if accredited in any of
WB6 economies to have the accreditation in all WB6 economies.
• Problems of the recognition of Western Balkans diplomas due to lach of reciprocity (with EU
countries).
• In the area of education there is suggestion for automatic recognition of diplomas issues by
accredited institutions in all WB6 economies.
• Mutual recognition of education and professional qualifications of staff
• Brain drain to the west and the longterm result of the Bologna reform process (the quality of
education is getting lower absolutely everywhere, not just here, but here you got Master-students
that don´t deserve the title student... not to mention a master-diploma).
• Poor quality eduaction for techincal occupations.
• Insufficuelntly qualified workforce.
• High tax burden – low minimum wage.
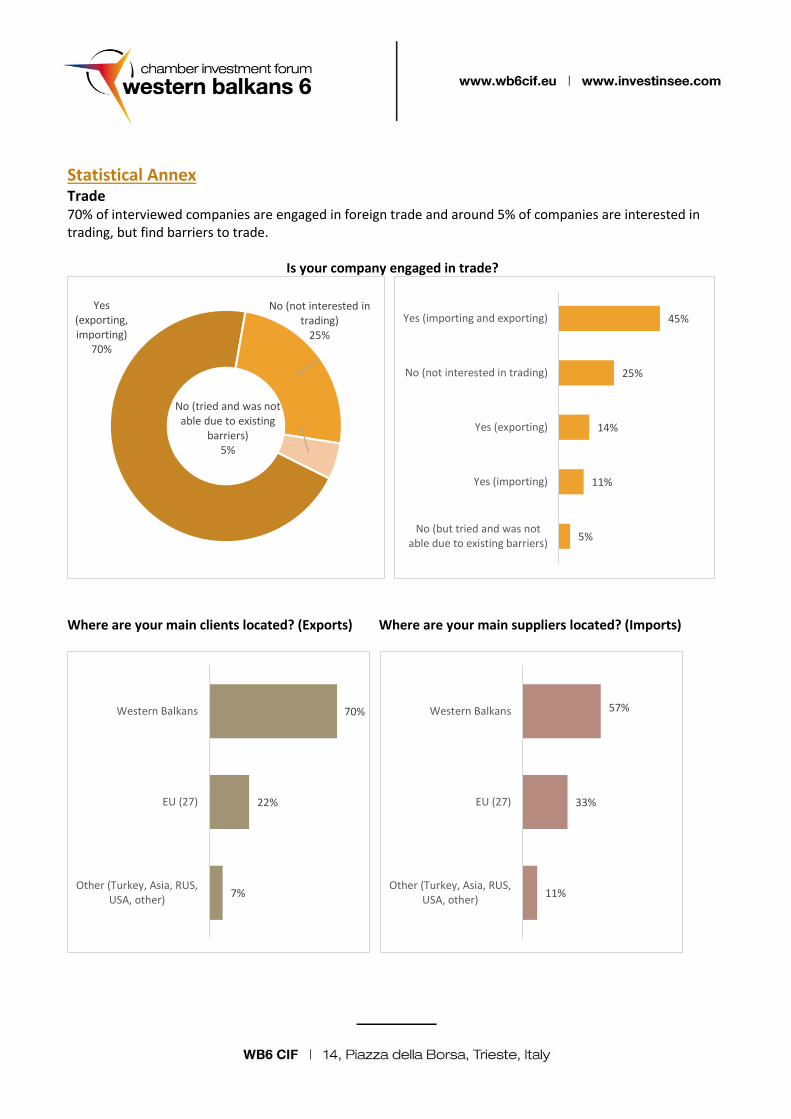
Statistical Annex Trade 70% of interviewed companies are engaged in foreign trade and around 5% of companies are interested in trading, but find barriers to trade.
Is your company engaged in trade?
Where are your main clients located? (Exports) Where are your main suppliers located? (Imports)
Yes (exporting, importing)
70%
No (not interested in trading)
25%
No (tried and was not able due to existing
barriers)5%
45%
25%
14%
11%
5%
Yes (importing and exporting)
No (not interested in trading)
Yes (exporting)
Yes (importing)
No (but tried and was notable due to existing barriers)
7%
22%
70%
Other (Turkey, Asia, RUS,USA, other)
EU (27)
Western Balkans
11%
33%
57%
Other (Turkey, Asia, RUS,USA, other)
EU (27)
Western Balkans
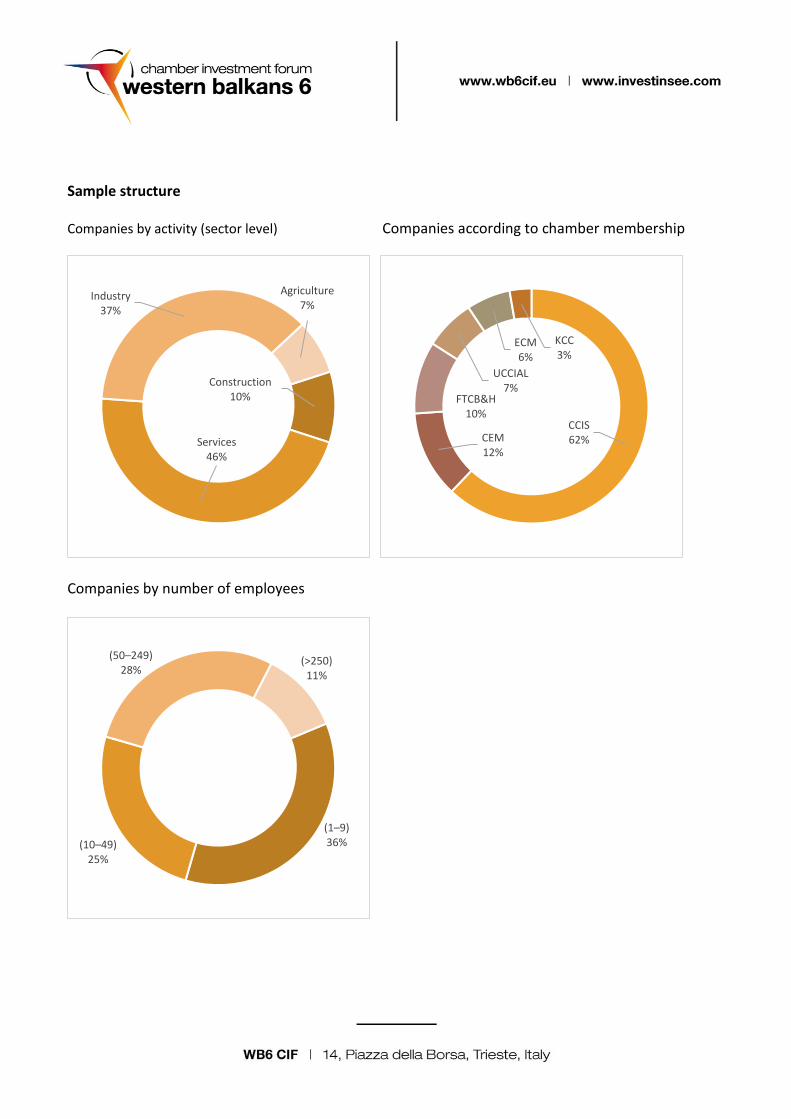
Sample structure
Companies by activity (sector level) Companies according to chamber membership
Companies by number of employees
Construction10%
Services46%
Industry37%
Agriculture7%
CCIS62%CEM
12%
FTCB&H10%
UCCIAL7%
ECM6%
KCC3%
(1–9)36%(10–49)
25%
(50–249)28%
(>250)11%
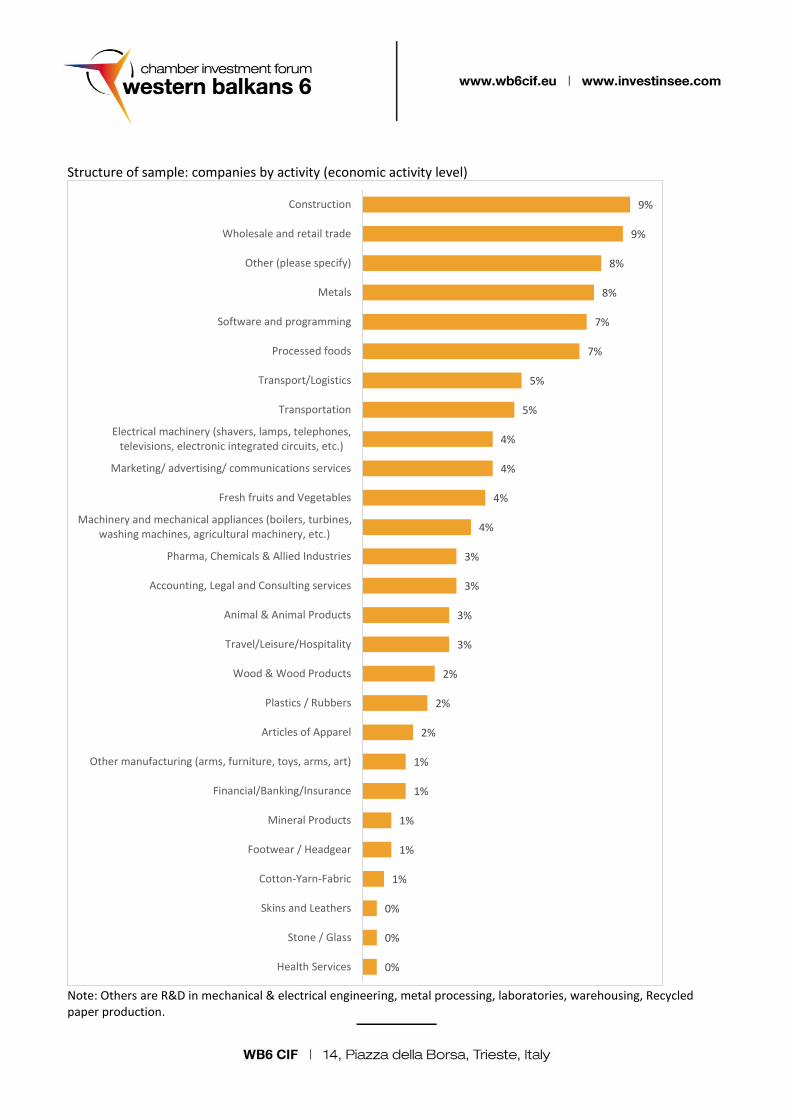
Structure of sample: companies by activity (economic activity level)
Note: Others are R&D in mechanical & electrical engineering, metal processing, laboratories, warehousing, Recycled paper production.
9%
9%
8%
8%
7%
7%
5%
5%
4%
4%
4%
4%
3%
3%
3%
3%
2%
2%
2%
1%
1%
1%
1%
1%
0%
0%
0%
Construction
Wholesale and retail trade
Other (please specify)
Metals
Software and programming
Processed foods
Transport/Logistics
Transportation
Electrical machinery (shavers, lamps, telephones,televisions, electronic integrated circuits, etc.)
Marketing/ advertising/ communications services
Fresh fruits and Vegetables
Machinery and mechanical appliances (boilers, turbines,washing machines, agricultural machinery, etc.)
Pharma, Chemicals & Allied Industries
Accounting, Legal and Consulting services
Animal & Animal Products
Travel/Leisure/Hospitality
Wood & Wood Products
Plastics / Rubbers
Articles of Apparel
Other manufacturing (arms, furniture, toys, arms, art)
Financial/Banking/Insurance
Mineral Products
Footwear / Headgear
Cotton-Yarn-Fabric
Skins and Leathers
Stone / Glass
Health Services
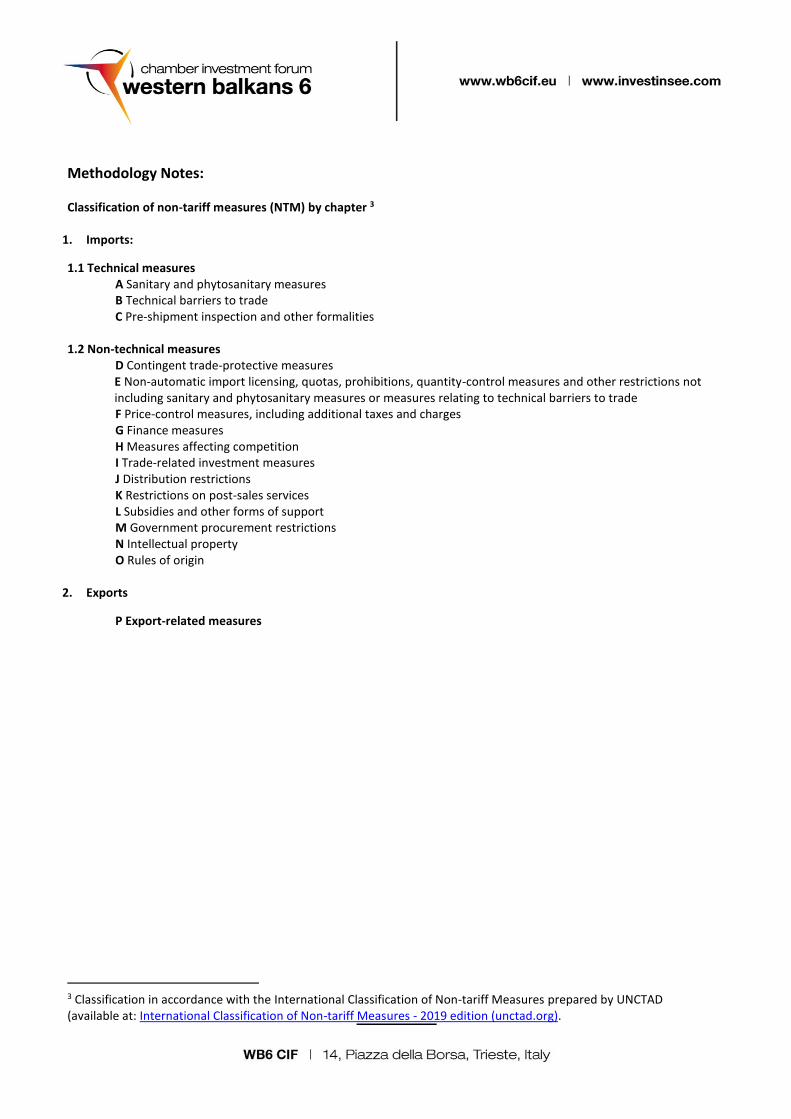
Methodology Notes: Classification of non-tariff measures (NTM) by chapter 3
1. Imports:
1.1 Technical measures A Sanitary and phytosanitary measures B Technical barriers to trade C Pre-shipment inspection and other formalities
1.2 Non-technical measures
D Contingent trade-protective measures E Non-automatic import licensing, quotas, prohibitions, quantity-control measures and other restrictions not including sanitary and phytosanitary measures or measures relating to technical barriers to trade F Price-control measures, including additional taxes and charges G Finance measures H Measures affecting competition I Trade-related investment measures J Distribution restrictions K Restrictions on post-sales services L Subsidies and other forms of support M Government procurement restrictions N Intellectual property O Rules of origin
2. Exports
P Export-related measures
3 Classification in accordance with the International Classification of Non-tariff Measures prepared by UNCTAD (available at: International Classification of Non-tariff Measures - 2019 edition (unctad.org).