ECG Monitoring of Myocardial Ischemia for Perioperative · PDF file ·...
74
ECG Monitoring of Myocardial Ischemia for Perioperative Care Patrick Friederich D-2431-2009
-
Upload
truongnhan -
Category
Documents
-
view
230 -
download
1
Transcript of ECG Monitoring of Myocardial Ischemia for Perioperative · PDF file ·...

ECG Monitoring of Myocardial Ischemia for Perioperative CarePatrick Friederich
D-2
431-
2009

About the AuthorProfessor Dr. med. Patrick Friederich
Professor of Anesthesiology and Chairman, Department of Anesthesiology, Critical Care Medicine, and Pain Therapy, Klinikum Bogenhausen, Academic Hospital of the Technische Universität München, Munich, Germany.
Professor Friederich’s primary area of research focuses on perioperative cardiac electrophysiology. He has published numerous articles in leading international journals and serves as a highly recognized international reviewer of peer-reviewed articles. He has a long-standing record of international lecturing and regularly organizes workshops and symposia on ECG interpretation at national and international meetings.
ABOUT THE AUTHOR |
D-4
722-
2011

Professor Friederich is board certified in Anesthesiology, Critical Care Medicine, Accident and Emergency Medicine, as well as Quality Management, and holds specialist certifications in Echocardiography, OR-Management and Health Care Economics. Over the last decade, he has received numerous research awards, including the Research Award of the European Society of Anaesthesiologists, Glasgow (2003), Vienna (2005) and Munich (2007).
Contact: [email protected]
02|03
Notice
Knowledge and best practice in this field are constantly changing. As new research and experience broaden our knowledge, changes in practice, treatment, and drug therapy may become necessary or appropriate. Readers are advised to check the most current informa-tion provided on procedures or by the manufacturer of each product to be administered, to verify the recommended dose or formula, the method and duration of administration, and contraindications. It is the responsibility of the practitioner, relying on their own experience and knowledge of the patient, to take all appropriate safety precautions. To the fullest extent of the law, neither the Publisher nor the Author assume any liability for any injury and/or dam -age to persons or property arising out of or related to any use of the material contained in this book.
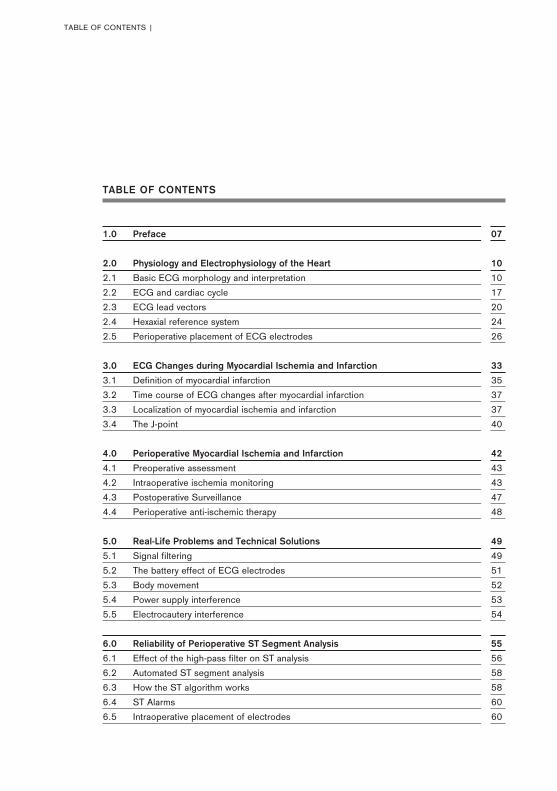
TABLE OF CONTENTS
1.0 Preface 07
2.0 Physiology and Electrophysiology of the Heart 10
2.1 Basic ECG morphology and interpretation 10
2.2 ECG and cardiac cycle 17
2.3 ECG lead vectors 20
2.4 Hexaxial reference system 24
2.5 Perioperative placement of ECG electrodes 26
3.0 ECG Changes during Myocardial Ischemia and Infarction 33
3.1 Definition of myocardial infarction 35
3.2 Time course of ECG changes after myocardial infarction 37
3.3 Localization of myocardial ischemia and infarction 37
3.4 The J-point 40
4.0 Perioperative Myocardial Ischemia and Infarction 42
4.1 Preoperative assessment 43
4.2 Intraoperative ischemia monitoring 43
4.3 Postoperative Surveillance 47
4.4 Perioperative anti-ischemic therapy 48
5.0 Real-Life Problems and Technical Solutions 49
5.1 Signal filtering 49
5.2 The battery effect of ECG electrodes 51
5.3 Body movement 52
5.4 Power supply interference 53
5.5 Electrocautery interference 54
6.0 Reliability of Perioperative ST Segment Analysis 55
6.1 Effect of the high-pass filter on ST analysis 56
6.2 Automated ST segment analysis 58
6.3 How the ST algorithm works 58
6.4 ST Alarms 60
6.5 Intraoperative placement of electrodes 60
TABLE OF CONTENTS |

04|05
7.0 Conclusion 63
8.0 Glossary of Terms 64
9.0 References 68
10.0 Recommended Further Reading 70 The purpose of this manual is to provide you with a foundation of basic clinical knowledge about the monitoring of myocardial ischemia and to offer support in using ECG monitoring to achieve the highest standards of perioperative care.

1.0 PREFACE |
06|07
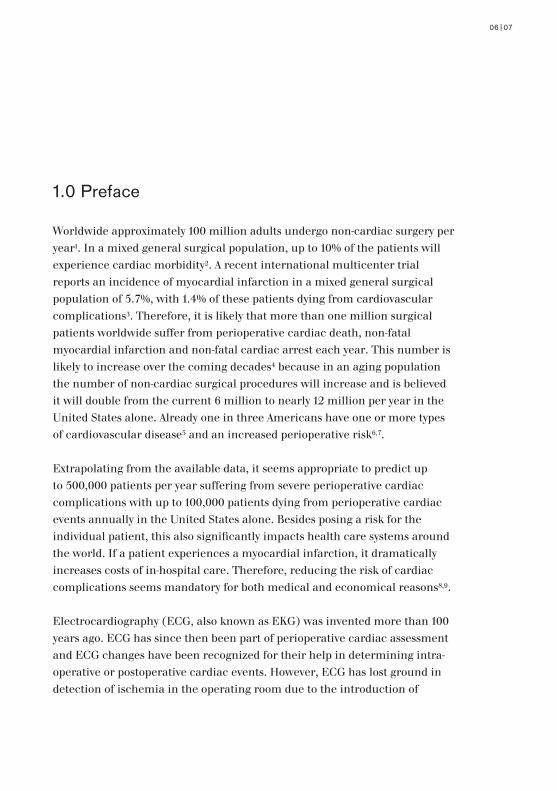
1.0 Preface
Worldwide approximately 100 million adults undergo non-cardiac surgery per year1. In a mixed general surgical population, up to 10% of the patients will experience cardiac morbidity2. A recent international multicenter trial reports an incidence of myocardial infarction in a mixed general surgical population of 5.7%, with 1.4% of these patients dying from cardiovascular complications3. Therefore, it is likely that more than one million surgical patients worldwide suffer from perioperative cardiac death, non-fatal myocardial infarction and non-fatal cardiac arrest each year. This number is likely to increase over the coming decades4 because in an aging population the number of non-cardiac surgical procedures will increase and is believed it will double from the current 6 million to nearly 12 million per year in the United States alone. Already one in three Americans have one or more types of cardiovascular disease5 and an increased perioperative risk6,7.
Extrapolating from the available data, it seems appropriate to predict up to 500,000 patients per year suffering from severe perioperative cardiac complications with up to 100,000 patients dying from perioperative cardiac events annually in the United States alone. Besides posing a risk for the individual patient, this also significantly impacts health care systems around the world. If a patient experiences a myocardial infarction, it dramatically increases costs of in-hospital care. Therefore, reducing the risk of cardiac complications seems mandatory for both medical and economical reasons8,9.
Electrocardiography (ECG, also known as EKG) was invented more than 100 years ago. ECG has since then been part of perioperative cardiac assessment and ECG changes have been recognized for their help in determining intra-operative or postoperative cardiac events. However, ECG has lost ground in detection of ischemia in the operating room due to the introduction of
1.0 PREFACE |
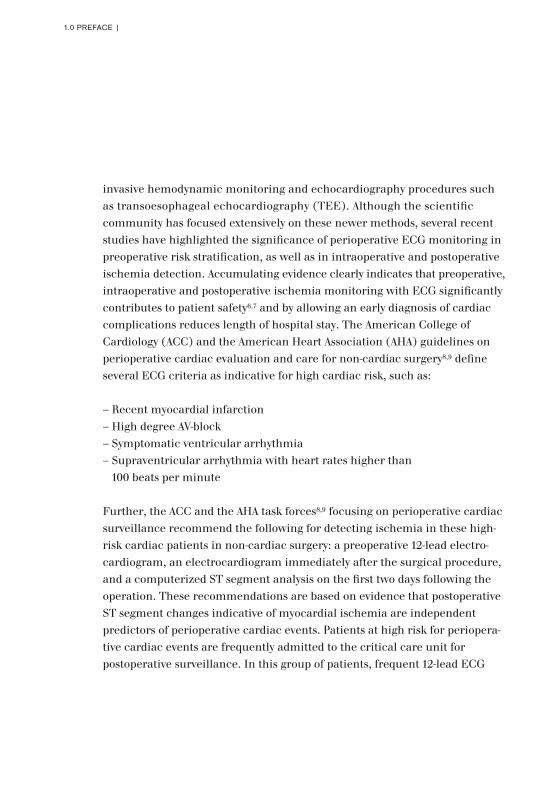
invasive hemodynamic monitoring and echocardiography procedures such as transoesophageal echocardiography (TEE). Although the scientific community has focused extensively on these newer methods, several recent studies have highlighted the significance of perioperative ECG monitoring in preoperative risk stratification, as well as in intraoperative and postoperative ischemia detection. Accumulating evidence clearly indicates that preoperative, intraoperative and postoperative ischemia monitoring with ECG significantly contributes to patient safety6,7 and by allowing an early diagnosis of cardiac complications reduces length of hospital stay. The American College of Cardiology (ACC) and the American Heart Association (AHA) guidelines on perioperative cardiac evaluation and care for non-cardiac surgery8,9 define several ECG criteria as indicative for high cardiac risk, such as:
– Recent myocardial infarction – High degree AV-block – Symptomatic ventricular arrhythmia – Supraventricular arrhythmia with heart rates higher than
100 beats per minute
Further, the ACC and the AHA task forces8,9 focusing on perioperative cardiac surveillance recommend the following for detecting ischemia in these high-risk cardiac patients in non-cardiac surgery: a preoperative 12-lead electro-cardiogram, an electrocardiogram immediately after the surgical procedure, and a computerized ST segment analysis on the first two days following the operation. These recommendations are based on evidence that postoperative ST segment changes indicative of myocardial ischemia are independent predictors of perioperative cardiac events. Patients at high risk for periopera-tive cardiac events are frequently admitted to the critical care unit for postoperative surveillance. In this group of patients, frequent 12-lead ECG
monitoring has a significantly higher sensitivity for detecting myocardial ischemia than routine intensive care unit surveillance, which consists of continuous 2-lead ECG monitoring with ST trending, infrequent 12-lead ECG monitoring, and clinical detection10.
Anesthesiologists are among a small group of professionals who spent several hours a day in front of an ECG monitor. The need for formal ECG training for anesthesiologists is of growing interest at anesthesia conferences in Europe and North America. The wealth of information contained in ECGs will only enhance patient care if we increase our understanding of the physiological, pathophysiological and technical aspects of the ECG. It is only by transferring this information to the bedside that scientific knowledge can support evidence-based medical treatment.
The role of electrocardiographic detection of myocardial ischemia and infarction can hardly be overemphasized. The purpose of this booklet is to translate medical knowledge into real-world treatment that can help save patients’ lives.
08|09
2.0 PHYSIOLOGY AND ELECTROPHYSIOLOGY OF THE HEART |
2.0 Physiology and Electrophysiology of the Heart
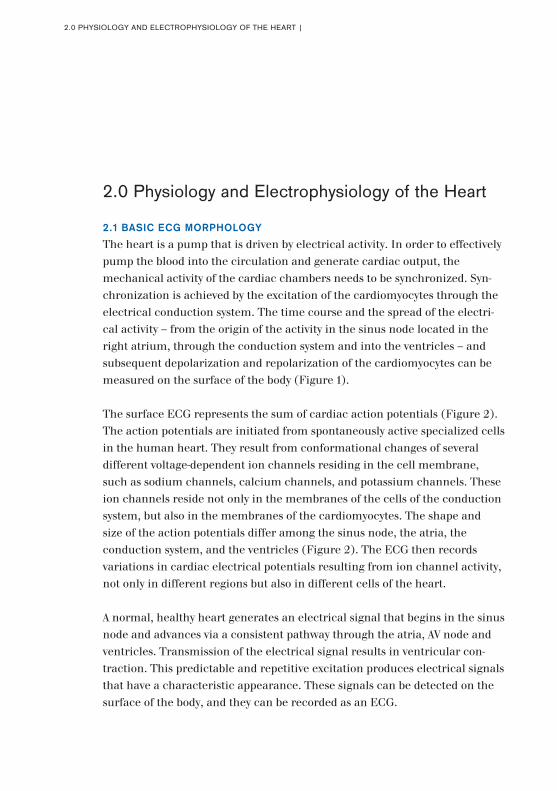
2.1 BASIC ECG MORPHOLOGY The heart is a pump that is driven by electrical activity. In order to effectively pump the blood into the circulation and generate cardiac output, the mechanical activity of the cardiac chambers needs to be synchronized. Syn-chronization is achieved by the excitation of the cardiomyocytes through the electrical conduction system. The time course and the spread of the electri-cal activity – from the origin of the activity in the sinus node located in the right atrium, through the conduction system and into the ventricles – and subsequent depolarization and repolarization of the cardiomyocytes can be measured on the surface of the body (Figure 1).
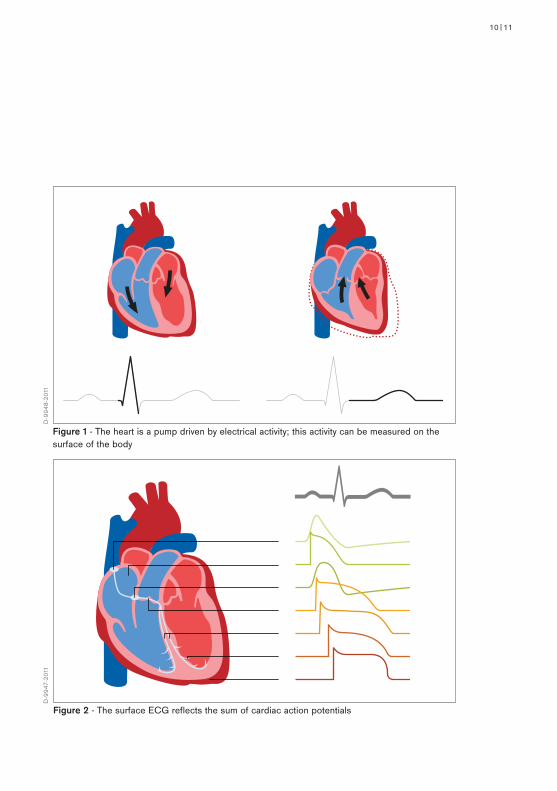
The surface ECG represents the sum of cardiac action potentials (Figure 2). The action potentials are initiated from spontaneously active specialized cells in the human heart. They result from conformational changes of several different voltage-dependent ion channels residing in the cell membrane, such as sodium channels, calcium channels, and potassium channels. These ion channels reside not only in the membranes of the cells of the conduction system, but also in the membranes of the cardiomyocytes. The shape and size of the action potentials differ among the sinus node, the atria, the conduction system, and the ventricles (Figure 2). The ECG then records variations in cardiac electrical potentials resulting from ion channel activity, not only in different regions but also in different cells of the heart.
A normal, healthy heart generates an electrical signal that begins in the sinus node and advances via a consistent pathway through the atria, AV node and ventricles. Transmission of the electrical signal results in ventricular con-traction. This predictable and repetitive excitation produces electrical signals that have a characteristic appearance. These signals can be detected on the surface of the body, and they can be recorded as an ECG.
10|11
Figure 1 - The heart is a pump driven by electrical activity; this activity can be measured on the surface of the body
Figure 2 - The surface ECG reflects the sum of cardiac action potentials
D-9
948-
2011
D-9
947-
2011
2.0 PHYSIOLOGY AND ELECTROPHYSIOLOGY OF THE HEART |
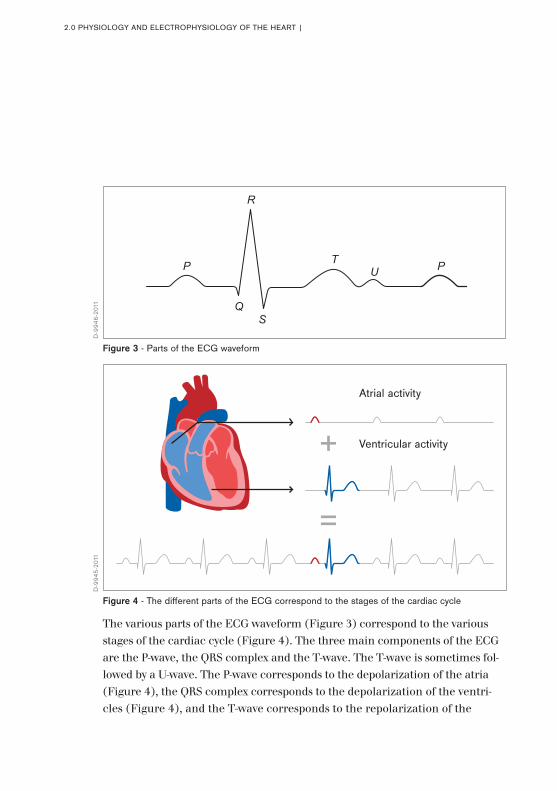
The various parts of the ECG waveform (Figure 3) correspond to the various stages of the cardiac cycle (Figure 4). The three main components of the ECG are the P-wave, the QRS complex and the T-wave. The T-wave is sometimes fol-lowed by a U-wave. The P-wave corresponds to the depolarization of the atria (Figure 4), the QRS complex corresponds to the depolarization of the ventri-cles (Figure 4), and the T-wave corresponds to the repolarization of the
P P
Q
R
S
TU
Figure 3 - Parts of the ECG waveform
Figure 4 - The different parts of the ECG correspond to the stages of the cardiac cycle
+
=
Atrial activity
Ventricular activity
D-9
946-
2011
D-9
945-
2011
12|13
ventricles (Figure 4). Although repolarization already begins with the ST seg-ment, it becomes visible in the surface ECG only with the beginning of the T-wave. The end of the T-wave indicates completed repolarization.
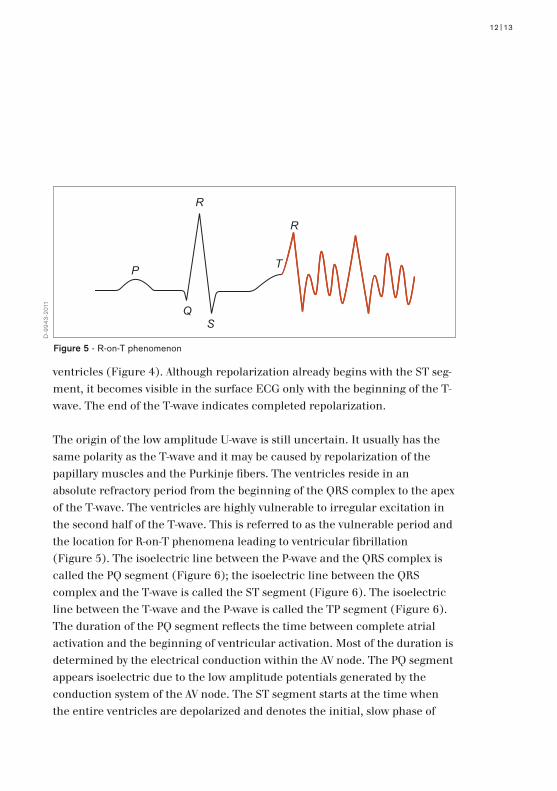
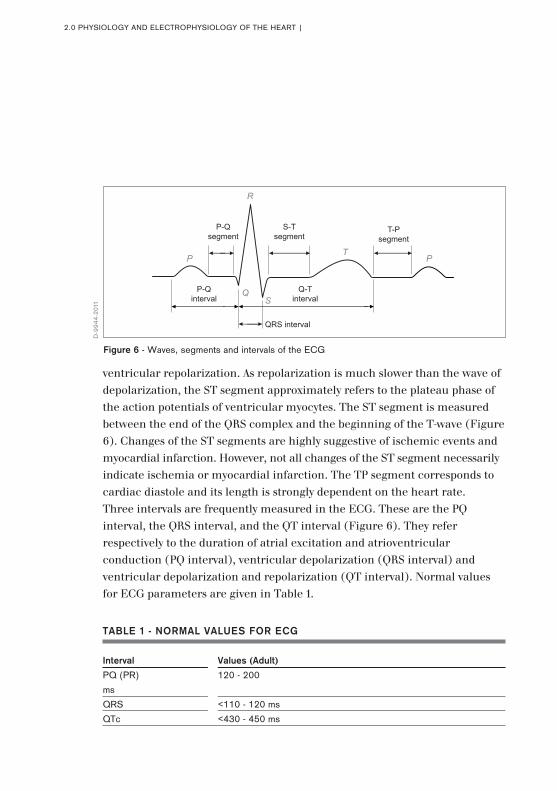
The origin of the low amplitude U-wave is still uncertain. It usually has the same polarity as the T-wave and it may be caused by repolarization of the papillary muscles and the Purkinje fibers. The ventricles reside in an absolute refractory period from the beginning of the QRS complex to the apex of the T-wave. The ventricles are highly vulnerable to irregular excitation in the second half of the T-wave. This is referred to as the vulnerable period and the location for R-on-T phenomena leading to ventricular fibrillation (Figure 5). The isoelectric line between the P-wave and the QRS complex is called the PQ segment (Figure 6); the isoelectric line between the QRS complex and the T-wave is called the ST segment (Figure 6). The isoelectric line between the T-wave and the P-wave is called the TP segment (Figure 6). The duration of the PQ segment reflects the time between complete atrial activation and the beginning of ventricular activation. Most of the duration is determined by the electrical conduction within the AV node. The PQ segment appears isoelectric due to the low amplitude potentials generated by the conduction system of the AV node. The ST segment starts at the time when the entire ventricles are depolarized and denotes the initial, slow phase of
Figure 5 - R-on-T phenomenon
P
R
R
QS
T
D-9
943-
2011
2.0 PHYSIOLOGY AND ELECTROPHYSIOLOGY OF THE HEART |
ventricular repolarization. As repolarization is much slower than the wave of depolarization, the ST segment approximately refers to the plateau phase of the action potentials of ventricular myocytes. The ST segment is measured between the end of the QRS complex and the beginning of the T-wave (Figure 6). Changes of the ST segments are highly suggestive of ischemic events and myocardial infarction. However, not all changes of the ST segment necessarily indicate ischemia or myocardial infarction. The TP segment corresponds to cardiac diastole and its length is strongly dependent on the heart rate.Three intervals are frequently measured in the ECG. These are the PQ interval, the QRS interval, and the QT interval (Figure 6). They refer respectively to the duration of atrial excitation and atrioventricular conduction (PQ interval), ventricular depolarization (QRS interval) and ventricular depolarization and repolarization (QT interval). Normal values for ECG parameters are given in Table 1.
Figure 6 - Waves, segments and intervals of the ECG
P P
Q
R
S
T
Q-Tinterval
QRS interval
P-Qinterval
P-Qsegment
S-Tsegment
T-Psegment
TABLE 1 - NORMAL VALUES FOR ECG
Interval Values (Adult)
PQ (PR) 120 - 200
ms
QRS <110 - 120 ms
QTc <430 - 450 ms
D-9
944-
2011
14|15
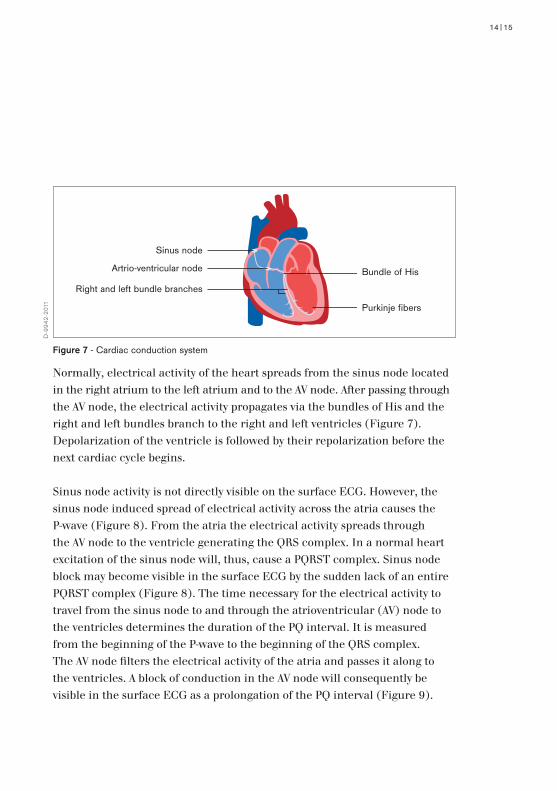
Normally, electrical activity of the heart spreads from the sinus node located in the right atrium to the left atrium and to the AV node. After passing through the AV node, the electrical activity propagates via the bundles of His and the right and left bundles branch to the right and left ventricles (Figure 7). Depolarization of the ventricle is followed by their repolarization before the next cardiac cycle begins.
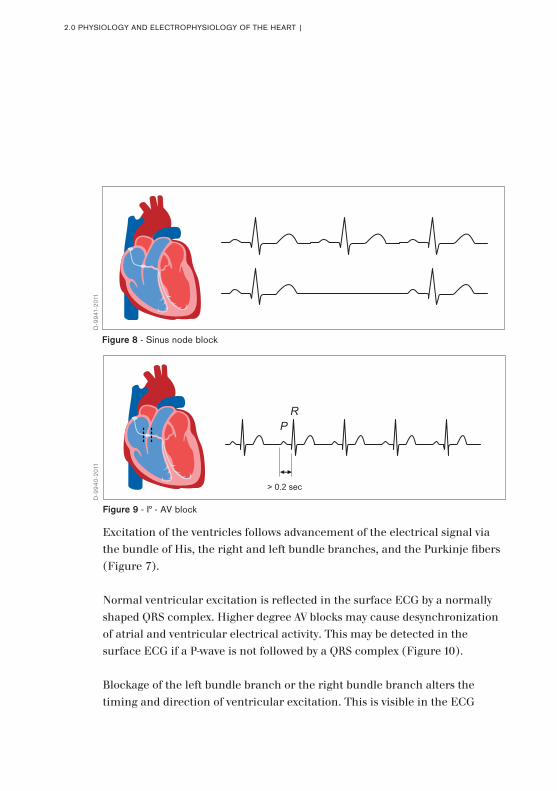
Sinus node activity is not directly visible on the surface ECG. However, the sinus node induced spread of electrical activity across the atria causes the P-wave (Figure 8). From the atria the electrical activity spreads through the AV node to the ventricle generating the QRS complex. In a normal heart excitation of the sinus node will, thus, cause a PQRST complex. Sinus node block may become visible in the surface ECG by the sudden lack of an entire PQRST complex (Figure 8). The time necessary for the electrical activity to travel from the sinus node to and through the atrioventricular (AV) node to the ventricles determines the duration of the PQ interval. It is measured from the beginning of the P-wave to the beginning of the QRS complex. The AV node filters the electrical activity of the atria and passes it along to the ventricles. A block of conduction in the AV node will consequently be visible in the surface ECG as a prolongation of the PQ interval (Figure 9).
Figure 7 - Cardiac conduction system
Sinus node
Bundle of His
Purkinje fibers
Artrio-ventricular node
Right and left bundle branches
D-9
942-
2011
2.0 PHYSIOLOGY AND ELECTROPHYSIOLOGY OF THE HEART |
Excitation of the ventricles follows advancement of the electrical signal via the bundle of His, the right and left bundle branches, and the Purkinje fibers (Figure 7).
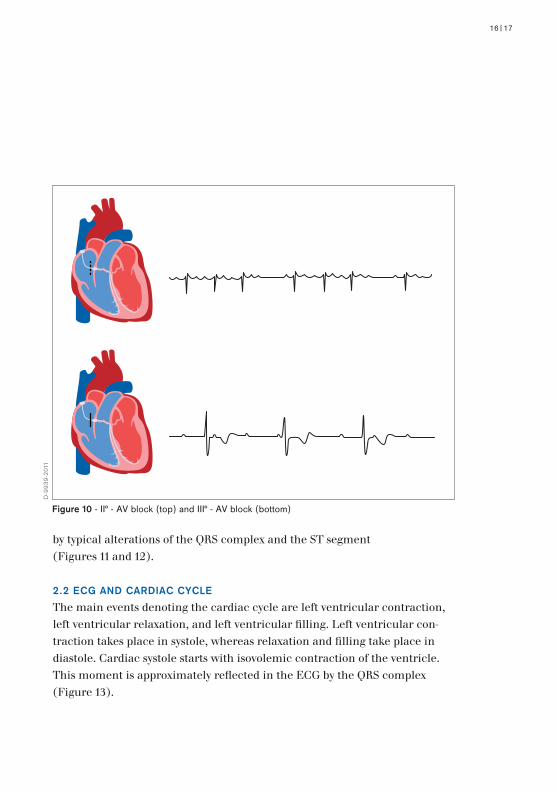
Normal ventricular excitation is reflected in the surface ECG by a normally shaped QRS complex. Higher degree AV blocks may cause desynchronization of atrial and ventricular electrical activity. This may be detected in the surface ECG if a P-wave is not followed by a QRS complex (Figure 10).
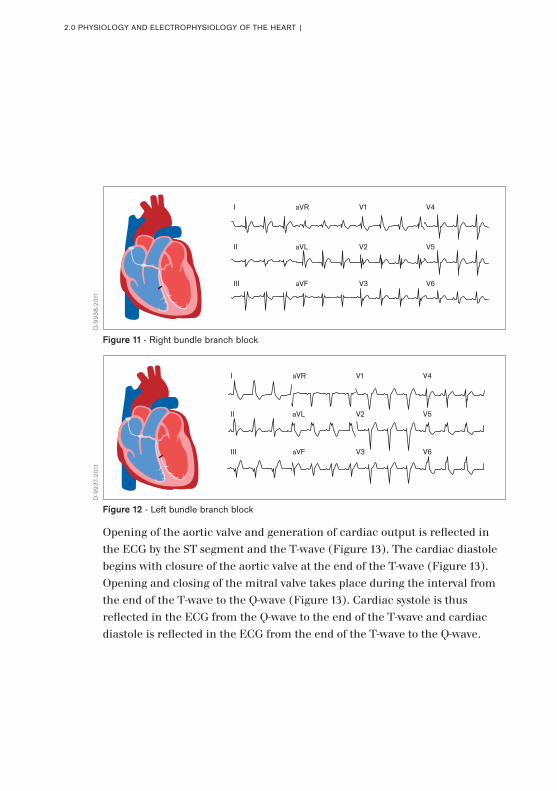
Blockage of the left bundle branch or the right bundle branch alters the timing and direction of ventricular excitation. This is visible in the ECG
Figure 8 - Sinus node block
Figure 9 - I° - AV block
PR
> 0.2 sec
D-9
941-
2011
D-9
940-
2011
16|17
by typical alterations of the QRS complex and the ST segment (Figures 11 and 12).
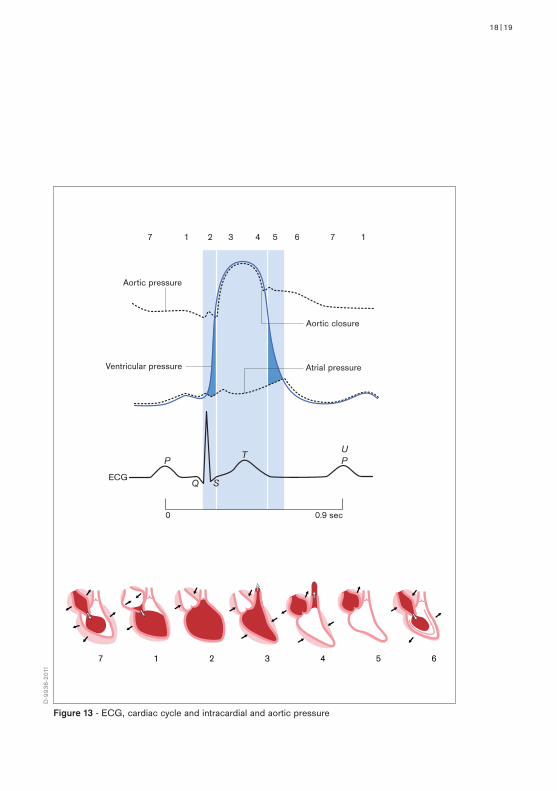
2.2 ECG AND CARDIAC CYCLEThe main events denoting the cardiac cycle are left ventricular contraction, left ventricular relaxation, and left ventricular filling. Left ventricular con-traction takes place in systole, whereas relaxation and filling take place in diastole. Cardiac systole starts with isovolemic contraction of the ventricle. This moment is approximately reflected in the ECG by the QRS complex (Figure 13).
Figure 10 - II° - AV block (top) and III° - AV block (bottom)
D-9
939-
2011
2.0 PHYSIOLOGY AND ELECTROPHYSIOLOGY OF THE HEART |
Opening of the aortic valve and generation of cardiac output is reflected in the ECG by the ST segment and the T-wave (Figure 13). The cardiac diastole begins with closure of the aortic valve at the end of the T-wave (Figure 13). Opening and closing of the mitral valve takes place during the interval from the end of the T-wave to the Q-wave (Figure 13). Cardiac systole is thus reflected in the ECG from the Q-wave to the end of the T-wave and cardiac diastole is reflected in the ECG from the end of the T-wave to the Q-wave.
Figure 11 - Right bundle branch block
I
II
III
aVR
aVL
aVF
V4
V5
V6
V1
V2
V3
Figure 12 - Left bundle branch block
I
II
III
aVR
aVL
aVF
V4
V5
V6
V1
V2
V3
D-9
938-
2011
D-9
937-
2011
18|19
P
ECG
7
Aortic pressure
Aortic closure
Ventricular pressure Atrial pressure
1 2 3 4 5 6 7 1
7 1 2 3 4 5 6
0 0.9 sec
P
Q S
TU
Figure 13 - ECG, cardiac cycle and intracardial and aortic pressure
D-9
936-
2011
2.0 PHYSIOLOGY AND ELECTROPHYSIOLOGY OF THE HEART |
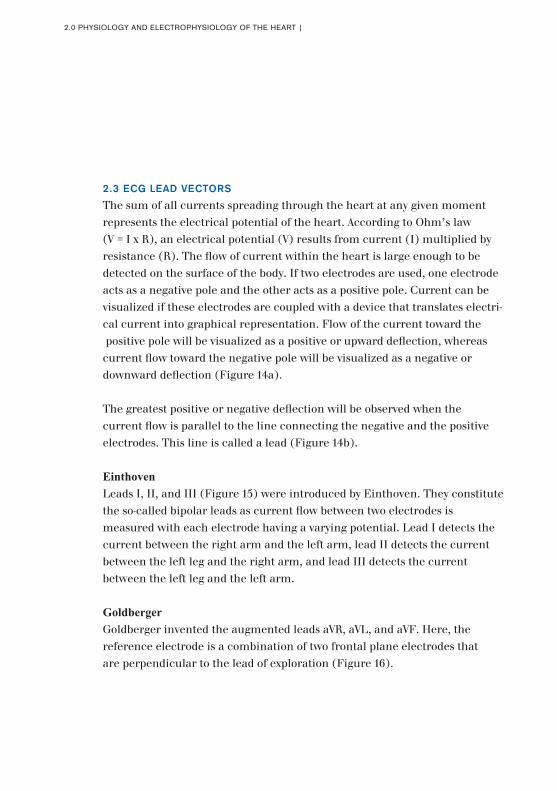
2.3 ECG LEAD VECTORSThe sum of all currents spreading through the heart at any given moment represents the electrical potential of the heart. According to Ohm’s law (V = I x R), an electrical potential (V) results from current (I) multiplied by resistance (R). The flow of current within the heart is large enough to be detected on the surface of the body. If two electrodes are used, one electrode acts as a negative pole and the other acts as a positive pole. Current can be visualized if these electrodes are coupled with a device that translates electri-cal current into graphical representation. Flow of the current toward the positive pole will be visualized as a positive or upward deflection, whereas current flow toward the negative pole will be visualized as a negative or downward deflection (Figure 14a).
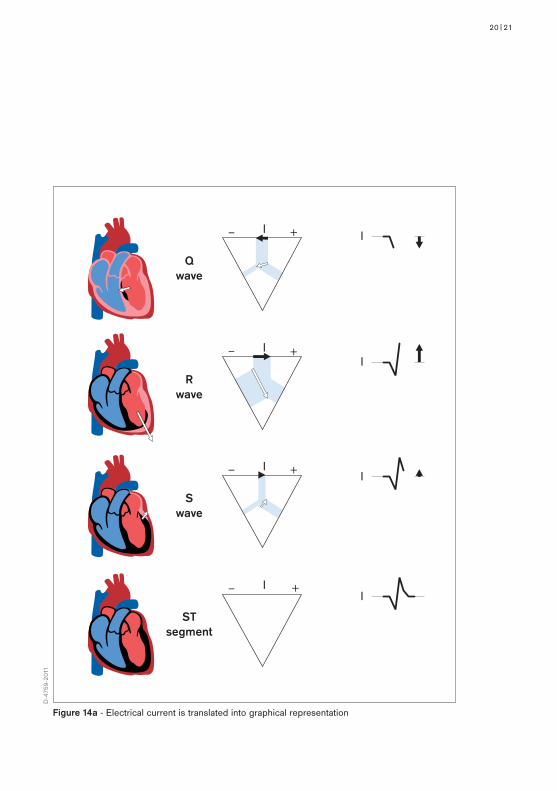
The greatest positive or negative deflection will be observed when the current flow is parallel to the line connecting the negative and the positive electrodes. This line is called a lead (Figure 14b).
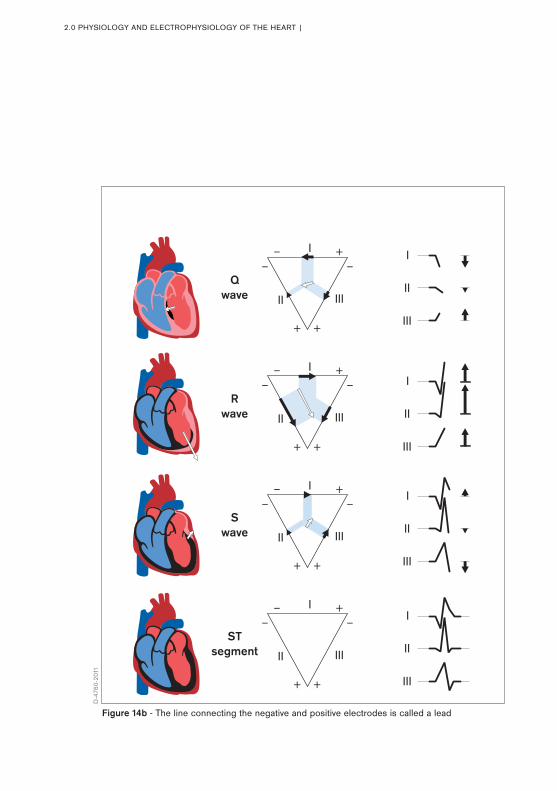
EinthovenLeads I, II, and III (Figure 15) were introduced by Einthoven. They constitute the so-called bipolar leads as current flow between two electrodes is measured with each electrode having a varying potential. Lead I detects the current between the right arm and the left arm, lead II detects the current between the left leg and the right arm, and lead III detects the current between the left leg and the left arm.
Goldberger Goldberger invented the augmented leads aVR, aVL, and aVF. Here, the reference electrode is a combination of two frontal plane electrodes that are perpendicular to the lead of exploration (Figure 16).
20|21
Figure 14a - Electrical current is translated into graphical representation
Qwave
Rwave
Swave
STsegment
D-4
759-
2011
2.0 PHYSIOLOGY AND ELECTROPHYSIOLOGY OF THE HEART |
Qwave
Rwave
Swave
STsegment
Figure 14b - The line connecting the negative and positive electrodes is called a lead
D-4
760-
2011
22|23
If aVR is the exploring lead, the reference electrode will result from the combination of the left arm and left foot electrodes (Figure 17). If aVL is the exploring lead, the reference electrode will result from the combination of the right arm and left foot electrodes (Figure 17). If aVF is the exploring electrode, the reference electrode will result from the combination of the right arm and the left electrodes (Figure 17). Lead aVR, therefore, detects the current between the reference electrode and the right arm, lead aVL detects the current between the reference electrode and the left arm, and lead aVF detects the current between the reference electrode and the left leg.
Figure 15 - Einthoven leads
I
II IIIEinthoven
Figure 16 - Goldberger leads
I
II IIIEinthoven
aVR
aVF
Goldberger
aVL
aVR aVL aVF
Figure 17 - The reference electrode in Goldberger lead is a combination of two frontal plane electrodes
D-4
758-
2011
D-4
757-
2011
D-4
756-
2011
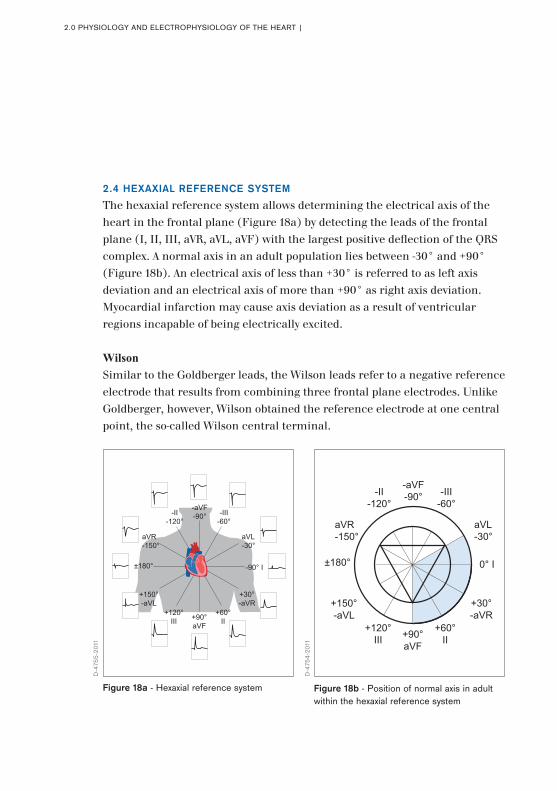
2.4 HEXAXIAL REFERENCE SYSTEMThe hexaxial reference system allows determining the electrical axis of the heart in the frontal plane (Figure 18a) by detecting the leads of the frontal plane (I, II, III, aVR, aVL, aVF) with the largest positive deflection of the QRS complex. A normal axis in an adult population lies between -30° and +90° (Figure 18b). An electrical axis of less than +30° is referred to as left axis deviation and an electrical axis of more than +90° as right axis deviation. Myocardial infarction may cause axis deviation as a result of ventricular regions incapable of being electrically excited.
Wilson Similar to the Goldberger leads, the Wilson leads refer to a negative reference electrode that results from combining three frontal plane electrodes. Unlike Goldberger, however, Wilson obtained the reference electrode at one central point, the so-called Wilson central terminal.
2.0 PHYSIOLOGY AND ELECTROPHYSIOLOGY OF THE HEART |
Figure 18a - Hexaxial reference system
aVL-30°
-III-60°
-aVF-90°-II
-120°
aVR-150°
+150°-aVL
+120°III
+60°II
+30°-aVR
+90°aVF
±180° -90° I
Figure 18b - Position of normal axis in adult within the hexaxial reference system
0° I
aVL-30°
-III-60°
-aVF-90°-II
-120°
aVR-150°
±180°
+150°-aVL
+120°III
+60°II
+30°-aVR
+90°aVF
D-4
755-
2011
D-4
754-
2011

24|25
This central terminal is created by con-necting the lead wires from the right arm, the left arm, and the left leg (Figure 19) and is still used today to measure the chest leads V1-V6 (Figure 20). These leads allow recording the electrical activity of the heart from a horizontal approach (Figure 20).
Taken together, the leads according to Einthoven, Goldberger, and Wilson provide information on the electrical activity of most regions of the heart. This is achieved by combining vertical (Einthoven and Goldberger) with hori-zontal leads (Wilson). Whereas the limb
leads are sufficient to determine the main electrical axis of the heart, both limb leads and chest leads are needed for adequate ischemia detection.
Figure 20 - Position of electrodes for recording of Wilson leads
V2
V6
V3V4
V5
V1
N CentralTerminal
V lead
Figure 19 - Wilson central terminal
D-4
753-
2011
D-4
752-
2011
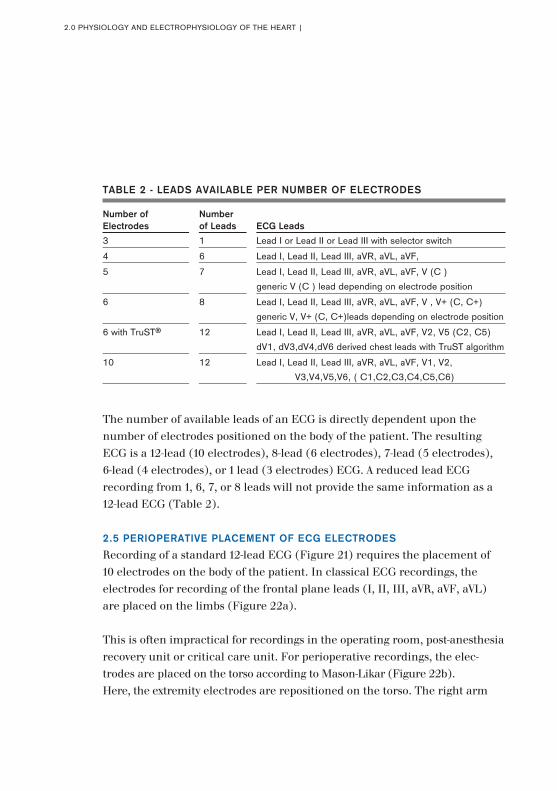
The number of available leads of an ECG is directly dependent upon the number of electrodes positioned on the body of the patient. The resulting ECG is a 12-lead (10 electrodes), 8-lead (6 electrodes), 7-lead (5 electrodes), 6-lead (4 electrodes), or 1 lead (3 electrodes) ECG. A reduced lead ECG recording from 1, 6, 7, or 8 leads will not provide the same information as a 12-lead ECG (Table 2).
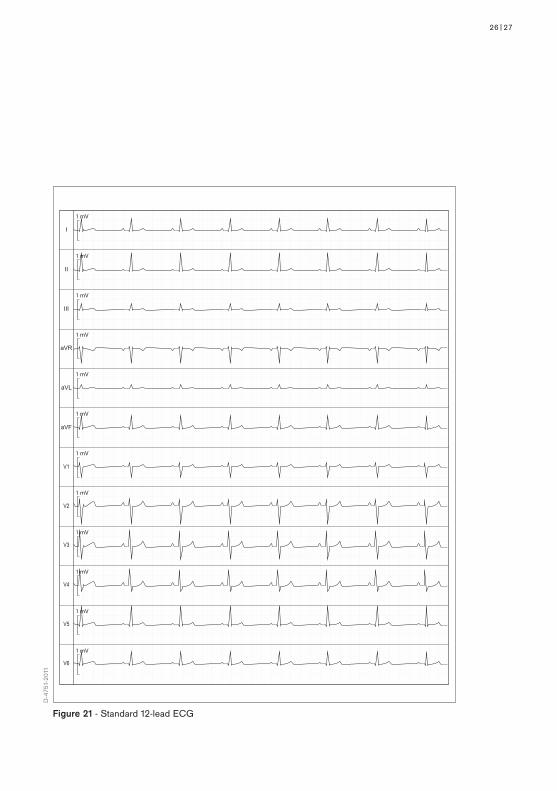
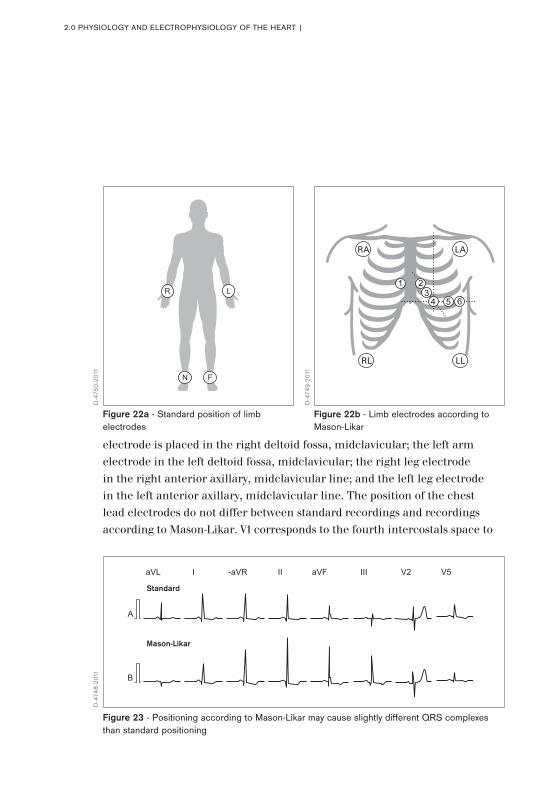
2.5 PERIOPERATIVE PLACEMENT OF ECG ELECTRODESRecording of a standard 12-lead ECG (Figure 21) requires the placement of 10 electrodes on the body of the patient. In classical ECG recordings, the electrodes for recording of the frontal plane leads (I, II, III, aVR, aVF, aVL) are placed on the limbs (Figure 22a).
This is often impractical for recordings in the operating room, post-anesthesia recovery unit or critical care unit. For perioperative recordings, the elec-trodes are placed on the torso according to Mason-Likar (Figure 22b). Here, the extremity electrodes are repositioned on the torso. The right arm
TABLE 2 - LEADS AVAILABLE PER NUMBER OF ELECTRODES Number of Number Electrodes of Leads ECG Leads
3 1 Lead I or Lead II or Lead III with selector switch
4 6 Lead I, Lead II, Lead III, aVR, aVL, aVF,
5 7 Lead I, Lead II, Lead III, aVR, aVL, aVF, V (C )
generic V (C ) lead depending on electrode position
6 8 Lead I, Lead II, Lead III, aVR, aVL, aVF, V , V+ (C, C+)
generic V, V+ (C, C+)leads depending on electrode position
6 with TruST® 12 Lead I, Lead II, Lead III, aVR, aVL, aVF, V2, V5 (C2, C5)
dV1, dV3,dV4,dV6 derived chest leads with TruST algorithm
10 12 Lead I, Lead II, Lead III, aVR, aVL, aVF, V1, V2,
V3,V4,V5,V6, ( C1,C2,C3,C4,C5,C6)
2.0 PHYSIOLOGY AND ELECTROPHYSIOLOGY OF THE HEART |
26|27
Figure 21 - Standard 12-lead ECG
I
II
III
aVR
aVL
aVF
V1
V2
V3
V4
V5
V6
D-4
751-
2011
2.0 PHYSIOLOGY AND ELECTROPHYSIOLOGY OF THE HEART |
electrode is placed in the right deltoid fossa, midclavicular; the left arm electrode in the left deltoid fossa, midclavicular; the right leg electrode in the right anterior axillary, midclavicular line; and the left leg electrode in the left anterior axillary, midclavicular line. The position of the chest lead electrodes do not differ between standard recordings and recordings according to Mason-Likar. V1 corresponds to the fourth intercostals space to
Figure 22a - Standard position of limb electrodes
Figure 22b - Limb electrodes according to Mason-Likar
B
A
Standard
Mason-Likar
I -aVRaVL II aVF III V2 V5
Figure 23 - Positioning according to Mason-Likar may cause slightly different QRS complexes than standard positioning
D-4
750-
2011
D-4
748-
2011
D-4
749-
2011
28|29
the right of the sternal border, V2 corresponds to the fourth intercostals space to the left of the sternal border, V3 is located between V2 and V4, V4 corresponds to the fifth intercostal space, midclavicular line, V5 corresponds to the anterior axillary line, in line with V4, and V6 corresponds to the midaxillary line, in line with V4. It needs to be emphasized that lead positioning according to Mason-Likar may cause slightly different QRS complexes than conventional placement of electrodes in amplitude and axis, as well as slightly varying results in precordial leads. Thus, the ability to compare preoperative ECG recordings with intraoperative and postoperative ECG recordings may be limited (Figure 23).
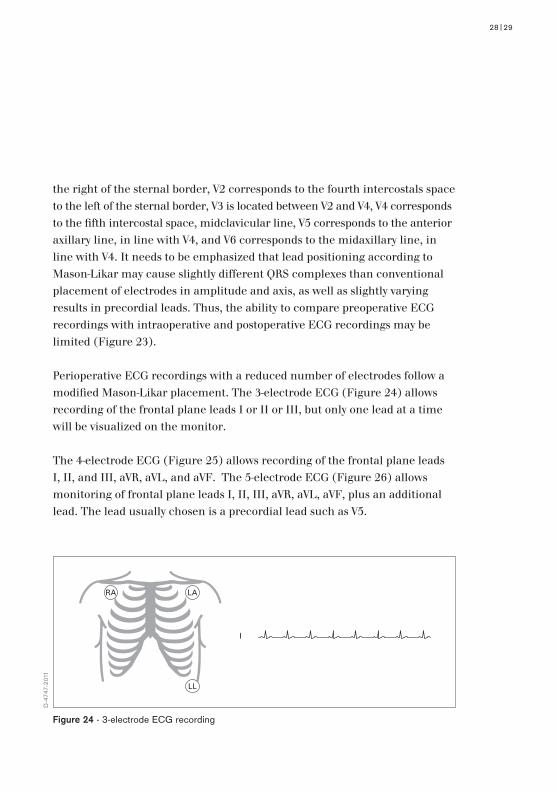
Perioperative ECG recordings with a reduced number of electrodes follow a modified Mason-Likar placement. The 3-electrode ECG (Figure 24) allows recording of the frontal plane leads I or II or III, but only one lead at a time will be visualized on the monitor.
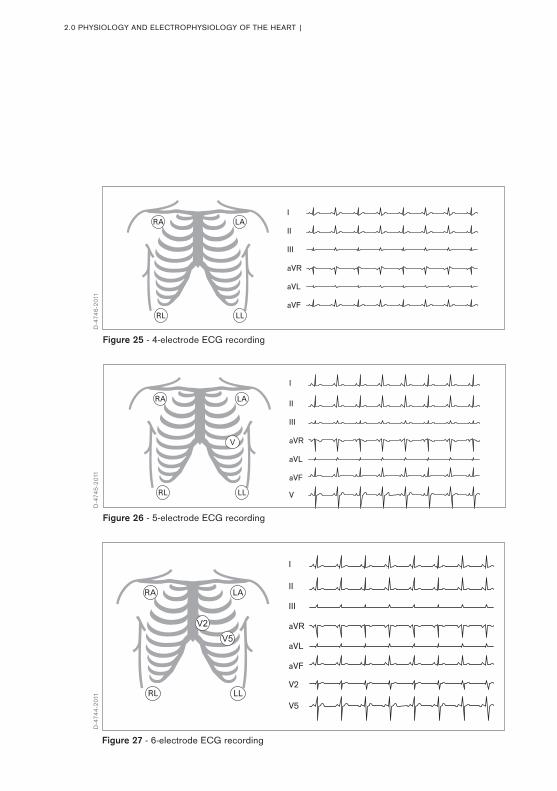
The 4-electrode ECG (Figure 25) allows recording of the frontal plane leads I, II, and III, aVR, aVL, and aVF. The 5-electrode ECG (Figure 26) allows monitoring of frontal plane leads I, II, III, aVR, aVL, aVF, plus an additional lead. The lead usually chosen is a precordial lead such as V5.
I
Figure 24 - 3-electrode ECG recording
D-4
747-
2011
2.0 PHYSIOLOGY AND ELECTROPHYSIOLOGY OF THE HEART |
Figure 25 - 4-electrode ECG recording
I
II
III
aVR
aVL
aVF
Figure 27 - 6-electrode ECG recording
I
II
III
aVR
aVL
aVF
V2
V5
V2
V5
Figure 26 - 5-electrode ECG recording
I
II
III
aVR
aVL
aVF
V
D-4
746-
2011
D-4
745-
2011
D-4
744-
2011
30|31
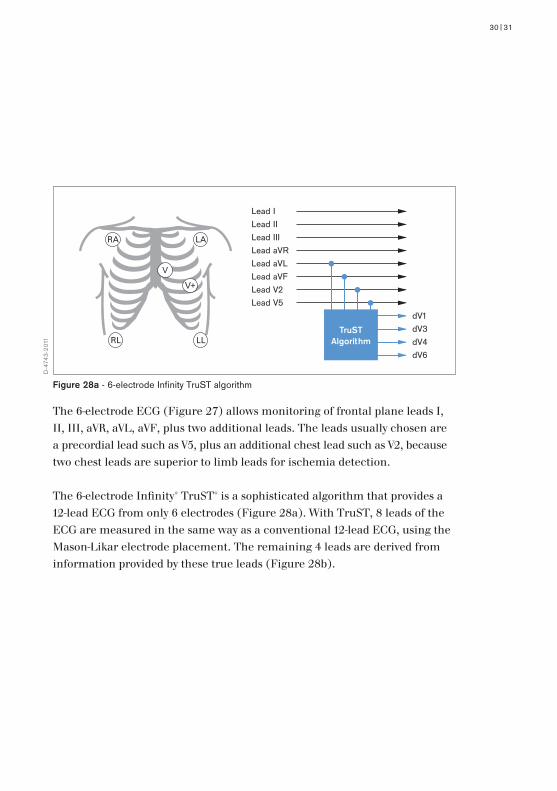
The 6-electrode ECG (Figure 27) allows monitoring of frontal plane leads I, II, III, aVR, aVL, aVF, plus two additional leads. The leads usually chosen are a precordial lead such as V5, plus an additional chest lead such as V2, because two chest leads are superior to limb leads for ischemia detection.
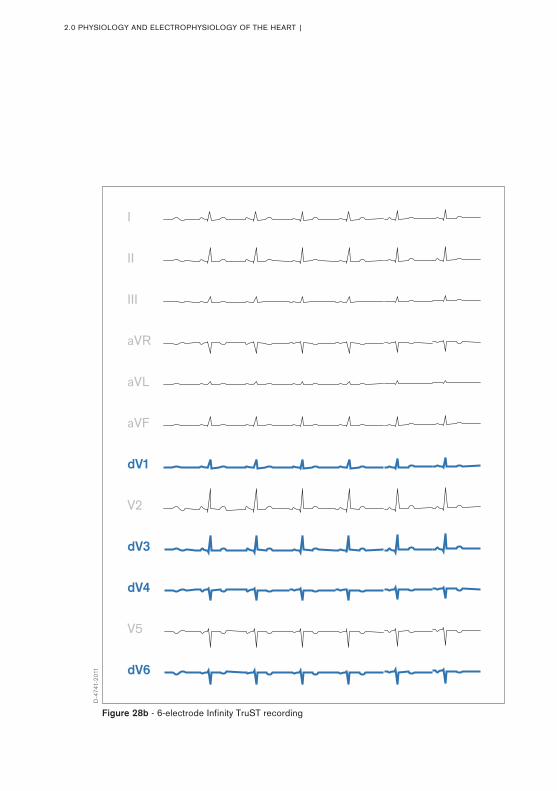
The 6-electrode Infinity® TruST® is a sophisticated algorithm that provides a 12-lead ECG from only 6 electrodes (Figure 28a). With TruST, 8 leads of the ECG are measured in the same way as a conventional 12-lead ECG, using the Mason-Likar electrode placement. The remaining 4 leads are derived from information provided by these true leads (Figure 28b).
Lead ILead IILead IIILead aVRLead aVLLead aVFLead V2Lead V5
dV1dV3dV4dV6
TruSTAlgorithm
Figure 28a - 6-electrode Infinity TruST algorithm
D-4
743-
2011
2.0 PHYSIOLOGY AND ELECTROPHYSIOLOGY OF THE HEART |
Figure 28b - 6-electrode Infinity TruST recording
I
II
III
aVR
aVL
aVF
dV1
V2
dV3
dV4
V5
dV6
D-4
741-
2011
32|33
3.0 ECG Changes during Myocardial Ischemia and Infarction
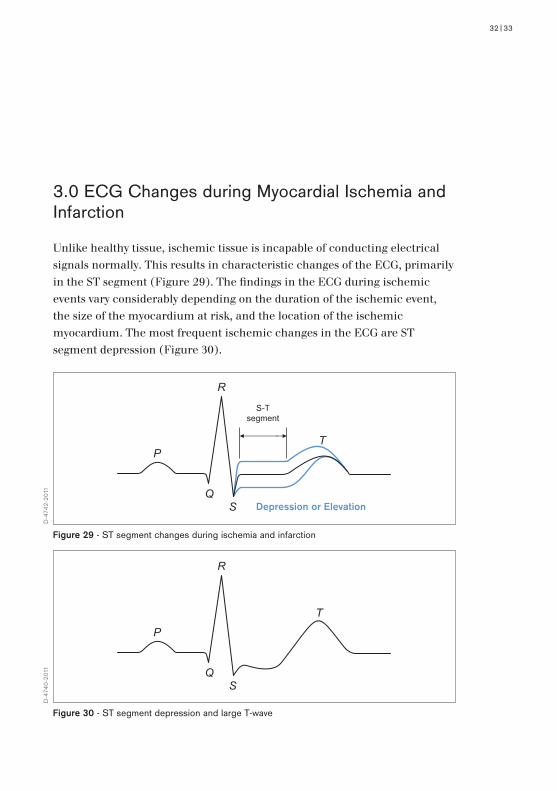
Unlike healthy tissue, ischemic tissue is incapable of conducting electrical signals normally. This results in characteristic changes of the ECG, primarily in the ST segment (Figure 29). The findings in the ECG during ischemic events vary considerably depending on the duration of the ischemic event, the size of the myocardium at risk, and the location of the ischemic myocardium. The most frequent ischemic changes in the ECG are ST segment depression (Figure 30).
Figure 29 - ST segment changes during ischemia and infarction
Figure 30 - ST segment depression and large T-wave
P
Q
R
S
T
S-Tsegment
Depression or Elevation
P
Q
R
S
T
D-4
742-
2011
D-4
740-
2011
3.0 ECG CHANGES DURING MYOCARDIAL ISCHEMIA AND INFARCTION |
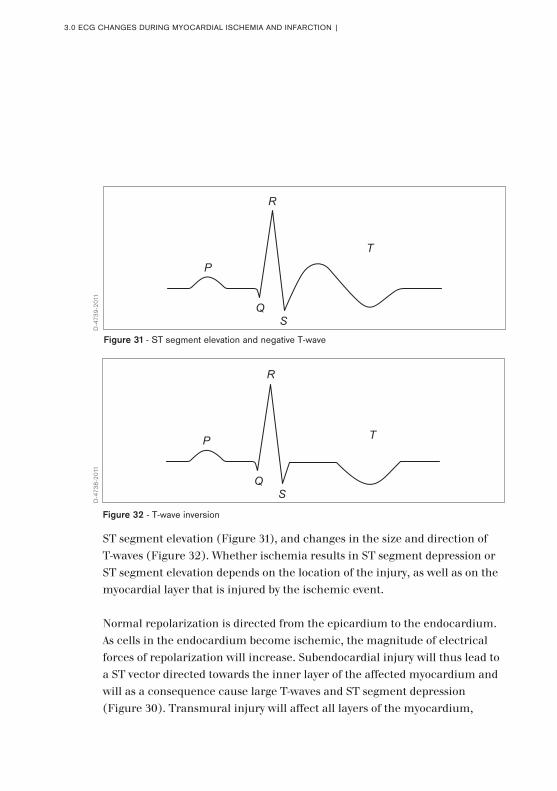
ST segment elevation (Figure 31), and changes in the size and direction of T-waves (Figure 32). Whether ischemia results in ST segment depression or ST segment elevation depends on the location of the injury, as well as on the myocardial layer that is injured by the ischemic event.
Normal repolarization is directed from the epicardium to the endocardium. As cells in the endocardium become ischemic, the magnitude of electrical forces of repolarization will increase. Subendocardial injury will thus lead to a ST vector directed towards the inner layer of the affected myocardium and will as a consequence cause large T-waves and ST segment depression (Figure 30). Transmural injury will affect all layers of the myocardium,
P
Q
R
S
T
Figure 32 - T-wave inversion
Figure 31 - ST segment elevation and negative T-wave
P
Q
R
S
T
D-4
739-
2011
D-4
738-
2011
34|35
including the epicardium. As a consequence, there is a reversal in the direction of normal repolarization. As it will now proceed from the endo- cardium to the epicardium, the ST vector will be directed outward and as consequence cause ST segment elevation and T-wave inversion (Figures 31 and 32).
3.1 DEFINITION OF MYOCARDIAL INFARCTIONIschemia and infarction are the result of an imbalance between oxygen supply and demand. Myocardial infarction can be defined pathologically as evolving (< 6h), acute (6h-7days), healing (7-28 days), and healed (29 days and older). It may be classified as microscopic (focal necrosis), small (< 10% of the left ventricle), moderate (10-30% of the left ventricle), and large (> 30% of the left ventricle). The diagnosis of acute, evolving, or recent myocardial infarction is based on the rise of biochemical markers of myocardial necrosis above the upper refer-ence limit (99th percentile) combined with clinical symptoms of ischemia, ECG signs of ischemia, or imaging evidence of myocardial injury such as wall motion abnormalities. The diagnosis of myocardial infarction can also be made on the basis of histopathological findings. Myocardial infarction can be clinically classified into five different types (Table 3).
Although all five types may occur in the perioperative period, type 2 is assumed to be the most frequent intraoperative type – whereas type 1 and type 2 may be observed in the postoperative period. Ischemia is most often observed at the end of surgery, in the post anesthesia recovery unit, and in the 24-48 hours following the operation. Patients presenting with a rise of biochemical markers of myocardial necrosis and clinical signs of myocardial infarction can be segregated into those presenting with ST segment elevation myocardial infarction (STEMI) and patients with no ST segment elevation (NSTEMI).
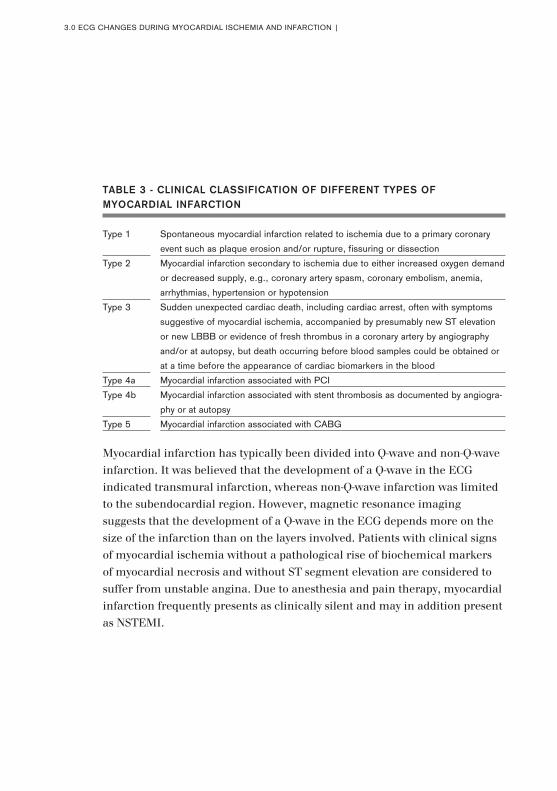
Myocardial infarction has typically been divided into Q-wave and non-Q-wave infarction. It was believed that the development of a Q-wave in the ECG indicated transmural infarction, whereas non-Q-wave infarction was limited to the subendocardial region. However, magnetic resonance imaging suggests that the development of a Q-wave in the ECG depends more on the size of the infarction than on the layers involved. Patients with clinical signs of myocardial ischemia without a pathological rise of biochemical markers of myocardial necrosis and without ST segment elevation are considered to suffer from unstable angina. Due to anesthesia and pain therapy, myocardial infarction frequently presents as clinically silent and may in addition present as NSTEMI.
3.0 ECG CHANGES DURING MYOCARDIAL ISCHEMIA AND INFARCTION |
TABLE 3 - CLINICAL CLASSIFICATION OF DIFFERENT TYPES OF MYOCARDIAL INFARCTION
Type 1 Spontaneous myocardial infarction related to ischemia due to a primary coronary
event such as plaque erosion and/or rupture, fissuring or dissection
Type 2 Myocardial infarction secondary to ischemia due to either increased oxygen demand
or decreased supply, e.g., coronary artery spasm, coronary embolism, anemia,
arrhythmias, hypertension or hypotension
Type 3 Sudden unexpected cardiac death, including cardiac arrest, often with symptoms
suggestive of myocardial ischemia, accompanied by presumably new ST elevation
or new LBBB or evidence of fresh thrombus in a coronary artery by angiography
and/or at autopsy, but death occurring before blood samples could be obtained or
at a time before the appearance of cardiac biomarkers in the blood
Type 4a Myocardial infarction associated with PCI
Type 4b Myocardial infarction associated with stent thrombosis as documented by angiogra-
phy or at autopsy
Type 5 Myocardial infarction associated with CABG
36|37
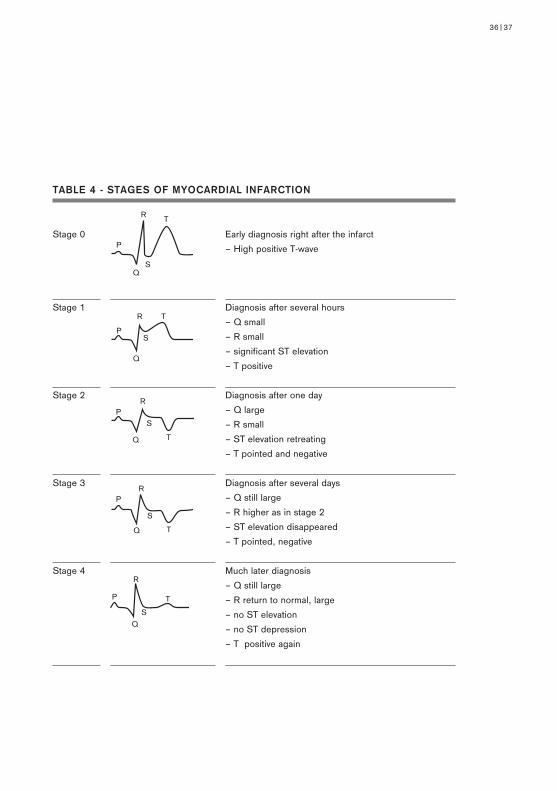
TABLE 4 - STAGES OF MYOCARDIAL INFARCTION
Stage 0 Early diagnosis right after the infarct
– High positive T-wave
Stage 1 Diagnosis after several hours
– Q small
– R small
– significant ST elevation
– T positive
Stage 2 Diagnosis after one day
– Q large
– R small
– ST elevation retreating
– T pointed and negative
Stage 3 Diagnosis after several days
– Q still large
– R higher as in stage 2
– ST elevation disappeared
– T pointed, negative
Stage 4 Much later diagnosis
– Q still large
– R return to normal, large
– no ST elevation
– no ST depression
– T positive again
P
R
QS
T
P
R
Q
S
T
PR
Q
S
T
PR
Q
S
T
P
R
QS
T
3.0 ECG CHANGES DURING MYOCARDIAL ISCHEMIA AND INFARCTION |
3.2 TIME COURSE OF ECG CHANGES AFTER MYOCARDIAL INFARCTIONIf myocardial ischemia remains untreated or does not resolve spontaneously, it may lead to myocardial infarction within 20 minutes. The earliest signs of acute transmural myocardial infarction occurring within minutes after the infarction consist of ST elevation and tall, upright T-waves (Table 4). Increased, hyperacute T-wave amplitude with prominent symmetrical T-waves in at least two contiguous leads may precede changes of the ST segment. ST segment and T-wave changes are usually followed by a decrease in R-wave amplitude, T-wave inversion, and an occurrence of abnormal Q-waves within hours to days after the infarction (Table 4). Weeks after the infarction, the ST segment may become isoelectric and abnormal Q-waves will reach their maximal size (Table 4). Several months after the infarction, the ECG will usually show residual signs of the infarction, such as abnormal Q-waves and reduced R-wave amplitude and progression (Table 4).
3.3 LOCALIZATION OF MYOCARDIAL ISCHEMIA AND INFARCTIONThe region of ischemia and infarction is currently identified by the localiza-tion on the body surface of the ECG leads that reveal ST segment changes. Correlation of ST segment changes to the results of coronary angiography, magnetic resonance imaging, and post-mortem morphological analysis have led to recommendations on localization of myocardial ischemia and infarc-tion based on the presence of ST segment changes (Table 5). The terminolo-gy used to localize the region of infarction is anterior, anteroseptal, lateral, inferior, inferobasal (referring to the basal part of the left ventricle lying on the diaphragm) or posterior (Table 5). Nonetheless, localizing myocardial ischemia and infarction to specific anatomical regions of the heart by ECG analysis remains imprecise.
38|39
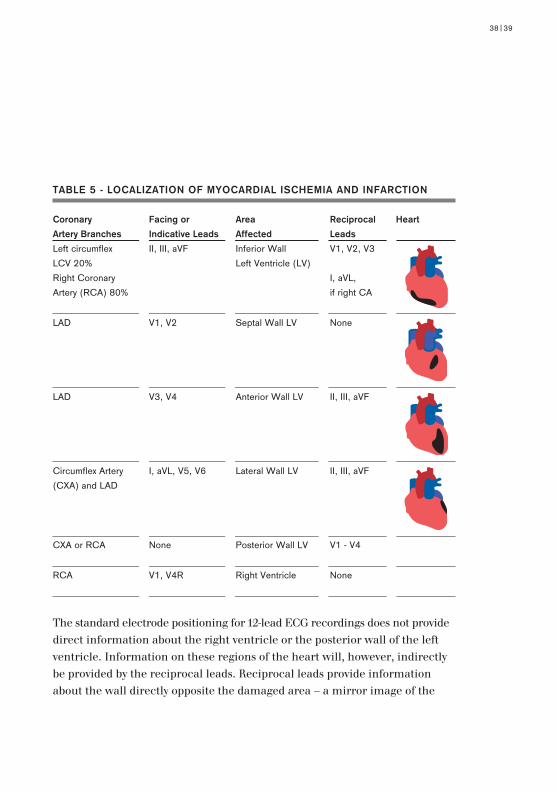
The standard electrode positioning for 12-lead ECG recordings does not provide direct information about the right ventricle or the posterior wall of the left ventricle. Information on these regions of the heart will, however, indirectly be provided by the reciprocal leads. Reciprocal leads provide information about the wall directly opposite the damaged area – a mirror image of the
TABLE 5 - LOCALIZATION OF MYOCARDIAL ISCHEMIA AND INFARCTION
Coronary Facing or Area Reciprocal Heart
Artery Branches Indicative Leads Affected Leads
Left circumflex II, III, aVF Inferior Wall V1, V2, V3
LCV 20% Left Ventricle (LV)
Right Coronary I, aVL,
Artery (RCA) 80% if right CA
LAD V1, V2 Septal Wall LV None
LAD V3, V4 Anterior Wall LV II, III, aVF
Circumflex Artery I, aVL, V5, V6 Lateral Wall LV II, III, aVF
(CXA) and LAD
CXA or RCA None Posterior Wall LV V1 - V4
RCA V1, V4R Right Ventricle None
3.0 ECG CHANGES DURING MYOCARDIAL ISCHEMIA AND INFARCTION |
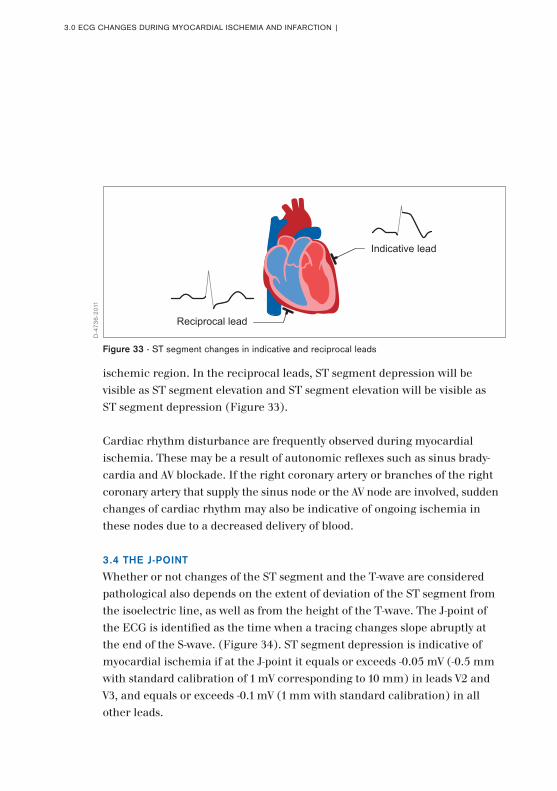
ischemic region. In the reciprocal leads, ST segment depression will be visible as ST segment elevation and ST segment elevation will be visible as ST segment depression (Figure 33).
Cardiac rhythm disturbance are frequently observed during myocardial ischemia. These may be a result of autonomic reflexes such as sinus brady-cardia and AV blockade. If the right coronary artery or branches of the right coronary artery that supply the sinus node or the AV node are involved, sudden changes of cardiac rhythm may also be indicative of ongoing ischemia in these nodes due to a decreased delivery of blood.
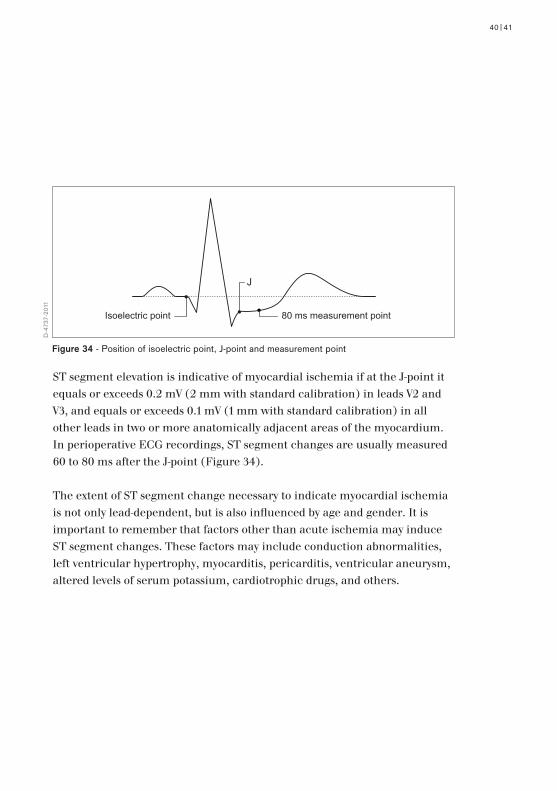
3.4 THE J-POINTWhether or not changes of the ST segment and the T-wave are considered pathological also depends on the extent of deviation of the ST segment from the isoelectric line, as well as from the height of the T-wave. The J-point of the ECG is identified as the time when a tracing changes slope abruptly at the end of the S-wave. (Figure 34). ST segment depression is indicative of myocardial ischemia if at the J-point it equals or exceeds -0.05 mV (-0.5 mm with standard calibration of 1 mV corresponding to 10 mm) in leads V2 and V3, and equals or exceeds -0.1 mV (1 mm with standard calibration) in all other leads.
Reciprocal lead
Indicative lead
Figure 33 - ST segment changes in indicative and reciprocal leads
D-4
736-
2011
40|41
J
80 ms measurement pointIsoelectric point
Figure 34 - Position of isoelectric point, J-point and measurement point
ST segment elevation is indicative of myocardial ischemia if at the J-point it equals or exceeds 0.2 mV (2 mm with standard calibration) in leads V2 and V3, and equals or exceeds 0.1 mV (1 mm with standard calibration) in all other leads in two or more anatomically adjacent areas of the myocardium.In perioperative ECG recordings, ST segment changes are usually measured 60 to 80 ms after the J-point (Figure 34).
The extent of ST segment change necessary to indicate myocardial ischemia is not only lead-dependent, but is also influenced by age and gender. It is important to remember that factors other than acute ischemia may induce ST segment changes. These factors may include conduction abnormalities, left ventricular hypertrophy, myocarditis, pericarditis, ventricular aneurysm, altered levels of serum potassium, cardiotrophic drugs, and others.
D-4
737-
2011
4.0 PERIOPERATIVE MYOCARDIAL ISCHEMIA AND INFARCTION |
4.0 Perioperative Myocardial Ischemia and Infarction
Myocardial ischemia is most often identified from the clinical manifestation, the patient history, changes in the ECG, and biochemical changes. Because clinical symptoms such as chest pain or epigastric discomfort are blunted or difficult to detect during anesthesia, ECG alterations and biochemical changes often need to be relied upon in perioperative care unit in order to detect myocardial infarction.
The earliest signs of transmural myocardial infarction occurring within min-utes consist of ST elevation and tall, upright T-waves. Increased hyperacute T-wave amplitude with prominent, symmetrical T-waves in at least two contiguous leads may precede changes of the ST segment. The preferred biomarker for myocardial necrosis is troponin I or troponin T. They will not become elevated until 4-6 hours after the event and they will remain elevated for 7-14 days following the onset of infarction. Blood samples should be drawn on first suspicion of an infarction and repeated 6-9 hours later. If the measurements do not show troponin elevation and the suspicion of myocardial infarction is high, an additional measurement should be performed 12-24 hours later. Several conditions such as aortic dissection, renal failure, acute neurological disease, burns, or extreme exertion may increase troponin in the absence of myocardial infarction.
It is not entirely clear how long the myocardium can sustain ischemic events without death of myocytes occurring. It depends on specific circumstances such as collateral blood flow, presence of preconditioning, and concomitant medication. Ischemic events of 20 minutes in duration are considered significant. However, it is acknowledged that even an ischemic period of 10 minutes can lead to myocardial infarction.
Perioperative management of cardiac risk patients demands a thorough and specific preoperative assessment in order to identify patients at risk for myocardial infarction. These patients demand thorough intraoperative ischemic monitoring as well as adequate postoperative surveillance.
4.1 PREOPERATIVE ASSESSMENTThe cardiovascular assessment of patients presenting for surgery is an integral part of the preoperative evaluation. Over the years, extensive guidelines by the AHA/ACC have been developed in collaboration with other societies such as the Society of Cardiovascular Anesthesiologists. These guide-lines encompass the risk of concurrent disease, the risk associated with the surgical procedures, the patient’s functional capacity and medications such as β-blockers, statins, and α2-agonists. The preoperative patient work-up should consider all of these aspects for appropriate risk stratification and to allow for additional consultations before surgery. 4.2 INTRAOPERATIVE ISCHEMIA MONITORINGIn the operating room, the electrical activity of a patient’s heart is monitored in an electrically unfriendly environment. Isolating the patient from other sources of interference is difficult, if not impossible. The ECG observed on the screen of the patient monitor, therefore, differs in quality from the standard 12-lead ECG taken from the cardiology ECG laboratory. Often the surgical procedure does not allow for proper electrode placement, so reduced-lead ECG recording is preferred most of the time. This reductionist approach to perioperative ischemia monitoring has several important limitations that need to be considered.
ECG recordings with limited electrodes follow a modified Mason-Likar placement. A 3- and 4-electrode ECG allows recording of the bipolar frontal plane leads I, II, and III and possibly aVR, aVL, and aVF. It will, therefore, only allow for identification of ischemia and myocardial infarction in myocardial regions represented in these leads. Evidence indicates that many periopera-tive ischemic events will be missed by 3- and 4-electrode ECG recordings.
42|43
4.0 PERIOPERATIVE MYOCARDIAL ISCHEMIA AND INFARCTION |
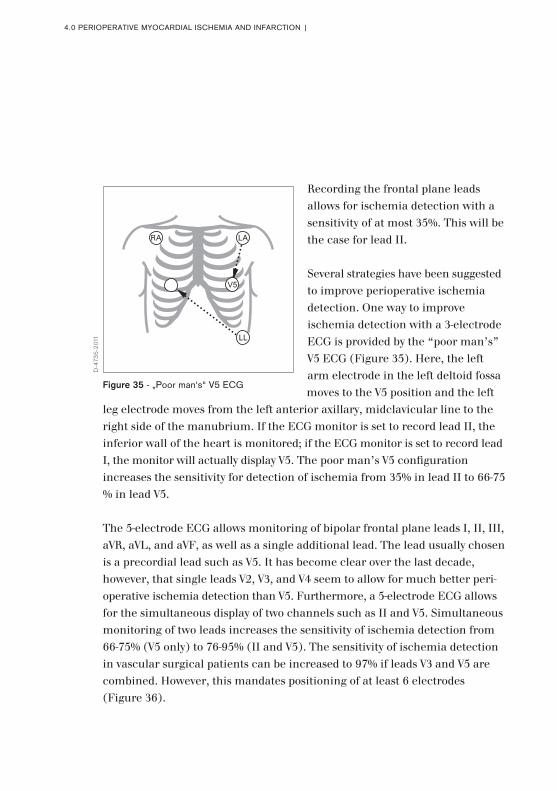
Recording the frontal plane leads allows for ischemia detection with a sensitivity of at most 35%. This will be the case for lead II.
Several strategies have been suggested to improve perioperative ischemia detection. One way to improve ischemia detection with a 3-electrode ECG is provided by the “poor man’s” V5 ECG (Figure 35). Here, the left arm electrode in the left deltoid fossa moves to the V5 position and the left
leg electrode moves from the left anterior axillary, midclavicular line to the right side of the manubrium. If the ECG monitor is set to record lead II, the inferior wall of the heart is monitored; if the ECG monitor is set to record lead I, the monitor will actually display V5. The poor man’s V5 configuration increases the sensitivity for detection of ischemia from 35% in lead II to 66-75 % in lead V5.
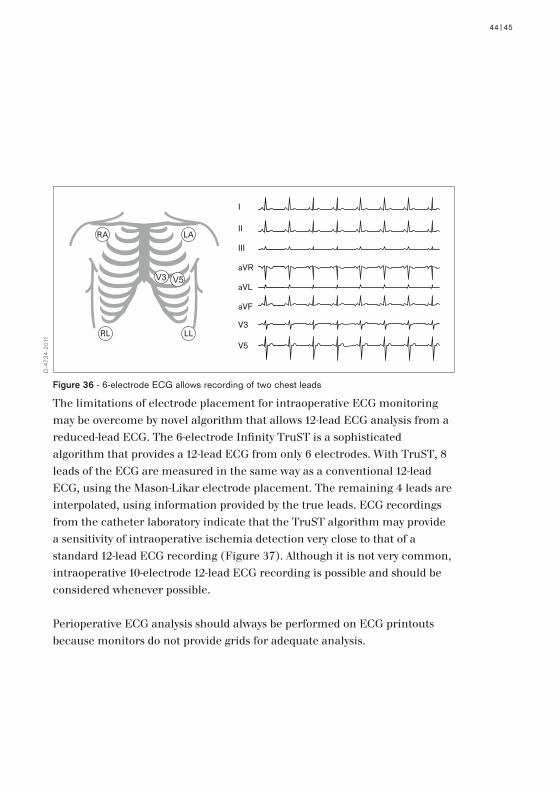
The 5-electrode ECG allows monitoring of bipolar frontal plane leads I, II, III, aVR, aVL, and aVF, as well as a single additional lead. The lead usually chosen is a precordial lead such as V5. It has become clear over the last decade, however, that single leads V2, V3, and V4 seem to allow for much better peri-operative ischemia detection than V5. Furthermore, a 5-electrode ECG allows for the simultaneous display of two channels such as II and V5. Simultaneous monitoring of two leads increases the sensitivity of ischemia detection from 66-75% (V5 only) to 76-95% (II and V5). The sensitivity of ischemia detection in vascular surgical patients can be increased to 97% if leads V3 and V5 are combined. However, this mandates positioning of at least 6 electrodes (Figure 36).
V5
Figure 35 - „Poor man‘s“ V5 ECG
D-4
735-
2011
44|45
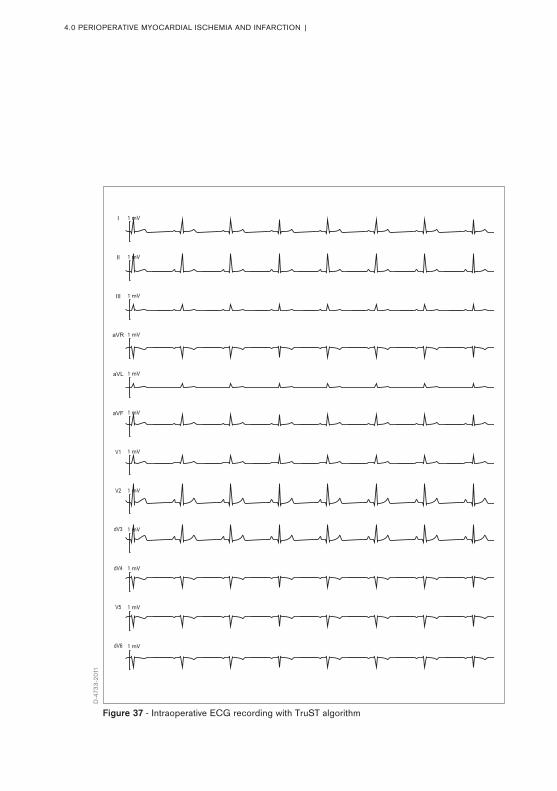
The limitations of electrode placement for intraoperative ECG monitoring may be overcome by novel algorithm that allows 12-lead ECG analysis from a reduced-lead ECG. The 6-electrode Infinity TruST is a sophisticated algorithm that provides a 12-lead ECG from only 6 electrodes. With TruST, 8 leads of the ECG are measured in the same way as a conventional 12-lead ECG, using the Mason-Likar electrode placement. The remaining 4 leads are interpolated, using information provided by the true leads. ECG recordings from the catheter laboratory indicate that the TruST algorithm may provide a sensitivity of intraoperative ischemia detection very close to that of a standard 12-lead ECG recording (Figure 37). Although it is not very common, intraoperative 10-electrode 12-lead ECG recording is possible and should be considered whenever possible.
Perioperative ECG analysis should always be performed on ECG printouts because monitors do not provide grids for adequate analysis.
I
II
III
aVR
aVL
aVF
V3
V5
V3 V5
Figure 36 - 6-electrode ECG allows recording of two chest leads
D-4
734-
2011
4.0 PERIOPERATIVE MYOCARDIAL ISCHEMIA AND INFARCTION |
Figure 37 - Intraoperative ECG recording with TruST algorithm
III
I
II
aVR
aVL
aVF
V1
V2
dV3
dV4
V5
dV6
D-4
733-
2011
4.3 POSTOPERATIVE SURVEILLANCE Ischemic ST segment changes are relatively common in postoperative surgical patients and affect at least between 10-20% of high-cardiac-risk patients. The precise incidence has not yet been defined because routine ischemia screening is insufficient. In addition, clinical signs of ischemia and myocardial infarction are often masked by analgesic medication, sedation, and artificial ventilation. Furthermore, routine continuous 12-lead ECG recordings are infrequently performed and biochemical diagnosis is often difficult, as elevated cardiac biomarkers can also occur in sepsis and other diseases common in post-operative critical care unit patients.
Raised levels of troponin in patients with sepsis may not necessarily result from cardiac hypoperfusion and ischemia, but may instead result from other mechanisms – including infection of cardiac tissue, such as in septic cardiomyopathy. In addition, electrocardiographic changes in sepsis are not well defined. However, some of the ECG findings associated with septic shock have been identified and include loss of QRS amplitude, increase in QTc interval, bundle branch blocks, and development of narrowed QRS intervals with deformed, positively deflected J-waves (Osborn waves). Although ST segment elevations in sepsis are rare, some case reports of ST-segment elevations and increased levels of cardiac troponin in patients with a normal coronary angiography exist.
Despite these limitations, post-operative critical care unit patients require continuous ECG monitoring because pre-existing cardiac disease is common among surgical patients. Continuous 12-lead ECG recordings are the most effective, but they are also impractical due to the number of electrodes that have to be placed on the patient. A reduced-lead ECG is more practical, but also requires that the electrodes be positioned in the optimum location. Recent evidence suggests that combining leads V2 and V4 instead of II and V5 in post-operative critical care unit patients increases the sensitivity of
46|47
ischemia detection from 41% to 76%. The combination of leads V2 and V4 further increases the sensitivity of detecting myocardial ischemia early, to 76% from 29% if the combination of leads II and V5 are used. From the data available so far, it seems reasonable to suggest the combination of two precordial leads for postoperative ischemia detection over the combination of a precordial lead with a limb lead such as the common II-V5 combination. Although many conditions such as sepsis, hypovolemia, atrial fibrillation, and renal failure may be associated with an increased troponin level, ECG recordings should be combined with troponin measurements.
4.4 PERIOPERATIVE ANTI-ISCHEMIC THERAPYAs troponin elevations may arise from causes other than thrombotic coronary artery occlusion, it seems prudent to suggest that patients with nonthrombotic troponin elevation should not be treated with antithrombotic or antiplatelet agents. Rather, the underlying cause of the troponin elevation – such as sepsis or hypovolemia – should be targeted. Regardless of these methodological problems, surgical patients with high cardiac risk remain at an increased risk for postoperative ischemia and myocardial infarction for at least 24-48 hours. In the case of myocardial ischemia, a predefined perioperative ischemia algorithm should be followed. In any case, it should be acknowl- edged that continuous ECG recording constitutes an indispensable part in the perioperative treatment of patients at high risk for cardiac ischemia.
4.0 PERIOPERATIVE MYOCARDIAL ISCHEMIA AND INFARCTION | 5.0 REAL-LIFE PROBLEMS AND TECHNICAL SOLUTIONS
48|49
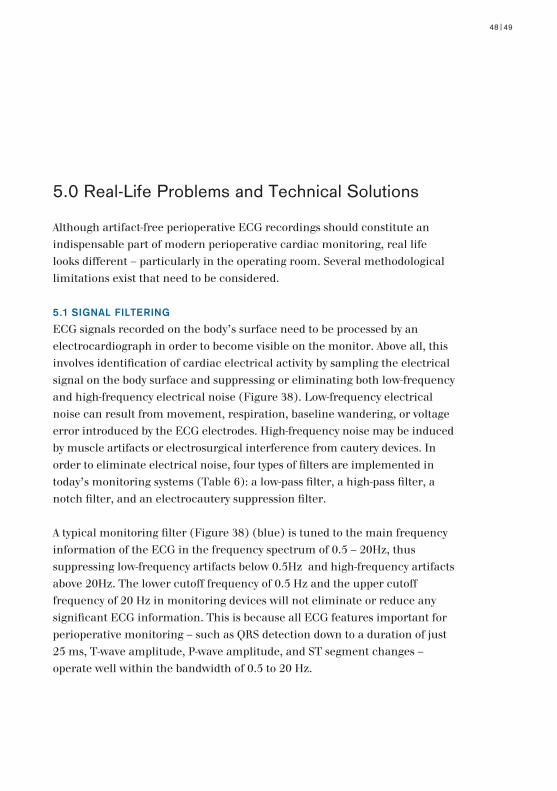
5.0 Real-Life Problems and Technical Solutions
Although artifact-free perioperative ECG recordings should constitute an indispensable part of modern perioperative cardiac monitoring, real life looks different – particularly in the operating room. Several methodological limitations exist that need to be considered.
5.1 SIGNAL FILTERINGECG signals recorded on the body’s surface need to be processed by an electrocardiograph in order to become visible on the monitor. Above all, this involves identification of cardiac electrical activity by sampling the electrical signal on the body surface and suppressing or eliminating both low-frequency and high-frequency electrical noise (Figure 38). Low-frequency electrical noise can result from movement, respiration, baseline wandering, or voltage error introduced by the ECG electrodes. High-frequency noise may be induced by muscle artifacts or electrosurgical interference from cautery devices. In order to eliminate electrical noise, four types of filters are implemented in today’s monitoring systems (Table 6): a low-pass filter, a high-pass filter, a notch filter, and an electrocautery suppression filter.
A typical monitoring filter (Figure 38) (blue) is tuned to the main frequency information of the ECG in the frequency spectrum of 0.5 – 20Hz, thus suppressing low-frequency artifacts below 0.5Hz and high-frequency artifacts above 20Hz. The lower cutoff frequency of 0.5 Hz and the upper cutoff frequency of 20 Hz in monitoring devices will not eliminate or reduce any significant ECG information. This is because all ECG features important for perioperative monitoring – such as QRS detection down to a duration of just 25 ms, T-wave amplitude, P-wave amplitude, and ST segment changes – operate well within the bandwidth of 0.5 to 20 Hz.
However, to eliminate the very high amplitude interference by the 50/60Hz mains power, a dedicated notch filter is necessary. Such a notch filter is tuned into a particular frequency (50/60Hz) and can suppress this frequency
5.0 REAL-LIFE PROBLEMS AND TECHNICAL SOLUTIONS |
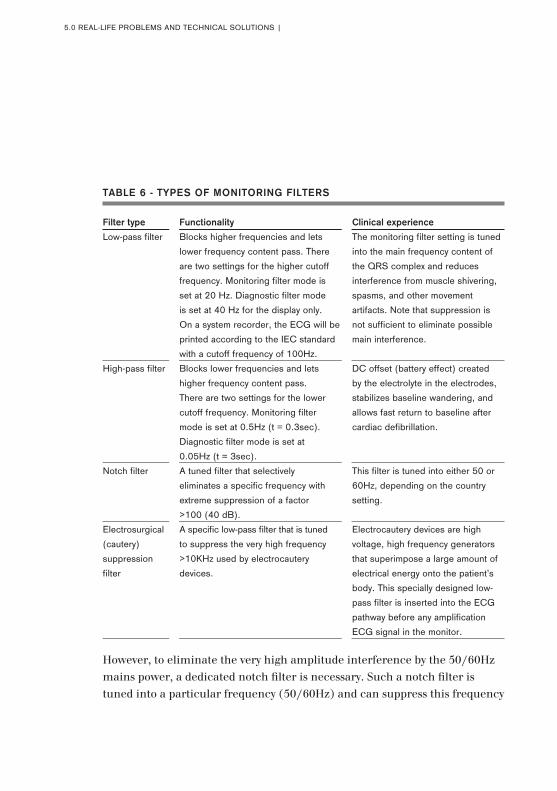
TABLE 6 - TYPES OF MONITORING FILTERS
Filter type Functionality Clinical experience
Low-pass filter Blocks higher frequencies and lets The monitoring filter setting is tuned
lower frequency content pass. There into the main frequency content of
are two settings for the higher cutoff the QRS complex and reduces
frequency. Monitoring filter mode is interference from muscle shivering,
set at 20 Hz. Diagnostic filter mode spasms, and other movement
is set at 40 Hz for the display only. artifacts. Note that suppression is
On a system recorder, the ECG will be not sufficient to eliminate possible
printed according to the IEC standard main interference.
with a cutoff frequency of 100Hz.
High-pass filter Blocks lower frequencies and lets DC offset (battery effect) created
higher frequency content pass. by the electrolyte in the electrodes,
There are two settings for the lower stabilizes baseline wandering, and
cutoff frequency. Monitoring filter allows fast return to baseline after
mode is set at 0.5Hz (t = 0.3sec). cardiac defibrillation.
Diagnostic filter mode is set at
0.05Hz (t = 3sec).
Notch filter A tuned filter that selectively This filter is tuned into either 50 or
eliminates a specific frequency with 60Hz, depending on the country
extreme suppression of a factor setting.
>100 (40 dB).
Electrosurgical A specific low-pass filter that is tuned Electrocautery devices are high
(cautery) to suppress the very high frequency voltage, high frequency generators
suppression >10KHz used by electrocautery that superimpose a large amount of
filter devices. electrical energy onto the patient’s
body. This specially designed low-
pass filter is inserted into the ECG
pathway before any amplification
ECG signal in the monitor.
50|51
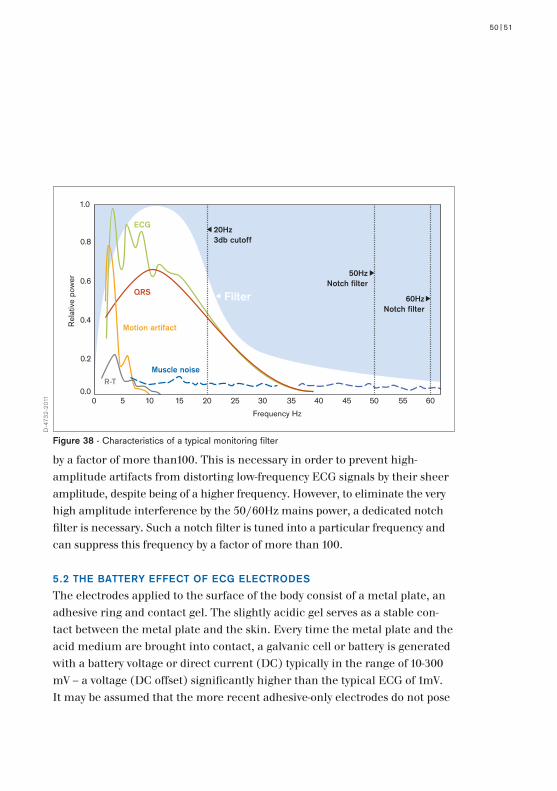
by a factor of more than100. This is necessary in order to prevent high- amplitude artifacts from distorting low-frequency ECG signals by their sheer amplitude, despite being of a higher frequency. However, to eliminate the very high amplitude interference by the 50/60Hz mains power, a dedicated notch filter is necessary. Such a notch filter is tuned into a particular frequency and can suppress this frequency by a factor of more than 100. 5.2 THE BATTERY EFFECT OF ECG ELECTRODESThe electrodes applied to the surface of the body consist of a metal plate, an adhesive ring and contact gel. The slightly acidic gel serves as a stable con-tact between the metal plate and the skin. Every time the metal plate and the acid medium are brought into contact, a galvanic cell or battery is generated with a battery voltage or direct current (DC) typically in the range of 10-300 mV – a voltage (DC offset) significantly higher than the typical ECG of 1mV.It may be assumed that the more recent adhesive-only electrodes do not pose
0
1.0
0.8
0.6
0.4
0.2
0.05 10 15 20 25 30 35 40 45 50 55 60
Frequency Hz
Motion artifact
50HzNotch filter
60HzNotch filter
QRS
ECG
R-TMuscle noise
Filter
Rel
ativ
e po
wer
20Hz3db cutoff
Figure 38 - Characteristics of a typical monitoring filter
D-4
732-
2011
this problem since they lack a contact gel. However, here the gel is incorpo-rated in the acidic adhesive. As the battery voltage or DC generally depends on the metals used, modern electrodes reduce the battery voltage to less than 3 mV by combining two different metals with opposite polari-ties. The most commonly used mate-rials in today’s electrodes are silver and silver chloride. A high-pass filter with capacitive coupling to the amplifier of the ECG recorder removes the DC portion of the electrical signal (Figure 39).
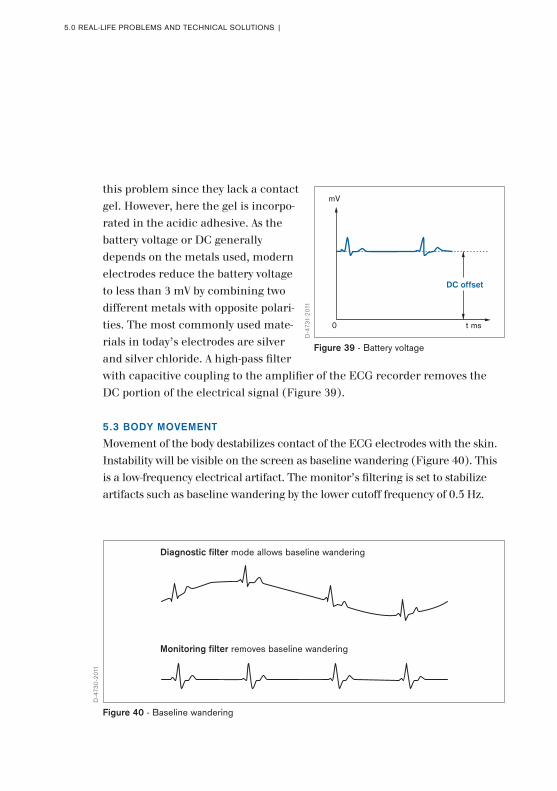
5.3 BODY MOVEMENTMovement of the body destabilizes contact of the ECG electrodes with the skin. Instability will be visible on the screen as baseline wandering (Figure 40). This is a low-frequency electrical artifact. The monitor’s filtering is set to stabilize artifacts such as baseline wandering by the lower cutoff frequency of 0.5 Hz.
5.0 REAL-LIFE PROBLEMS AND TECHNICAL SOLUTIONS |
0
DC offset
mV
t ms
Figure 39 - Battery voltage
Figure 40 - Baseline wandering
Diagnostic filter mode allows baseline wandering
Monitoring filter removes baseline wandering
D-4
731-
2011
D-4
730-
2011
52|53
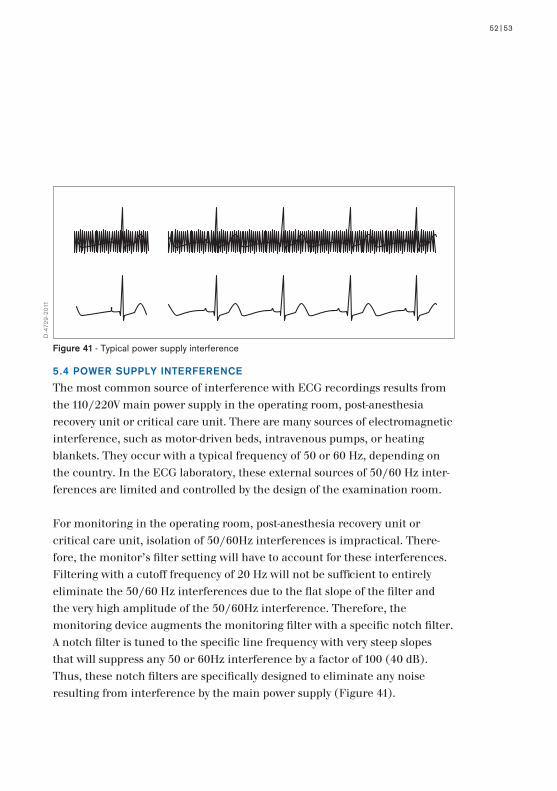
5.4 POWER SUPPLY INTERFERENCEThe most common source of interference with ECG recordings results from the 110/220V main power supply in the operating room, post-anesthesia recovery unit or critical care unit. There are many sources of electromagnetic interference, such as motor-driven beds, intravenous pumps, or heating blankets. They occur with a typical frequency of 50 or 60 Hz, depending on the country. In the ECG laboratory, these external sources of 50/60 Hz inter-ferences are limited and controlled by the design of the examination room.
For monitoring in the operating room, post-anesthesia recovery unit or critical care unit, isolation of 50/60Hz interferences is impractical. There-fore, the monitor’s filter setting will have to account for these interferences. Filtering with a cutoff frequency of 20 Hz will not be sufficient to entirely eliminate the 50/60 Hz interferences due to the flat slope of the filter and the very high amplitude of the 50/60Hz interference. Therefore, the monitoring device augments the monitoring filter with a specific notch filter. A notch filter is tuned to the specific line frequency with very steep slopes that will suppress any 50 or 60Hz interference by a factor of 100 (40 dB). Thus, these notch filters are specifically designed to eliminate any noise resulting from interference by the main power supply (Figure 41).
Figure 41 - Typical power supply interference
D-4
729-
2011
5.0 REAL-LIFE PROBLEMS AND TECHNICAL SOLUTIONS | 6.0 RELIABILITY OF PERIOPERATIVE ST SEGMENT ANALYSIS
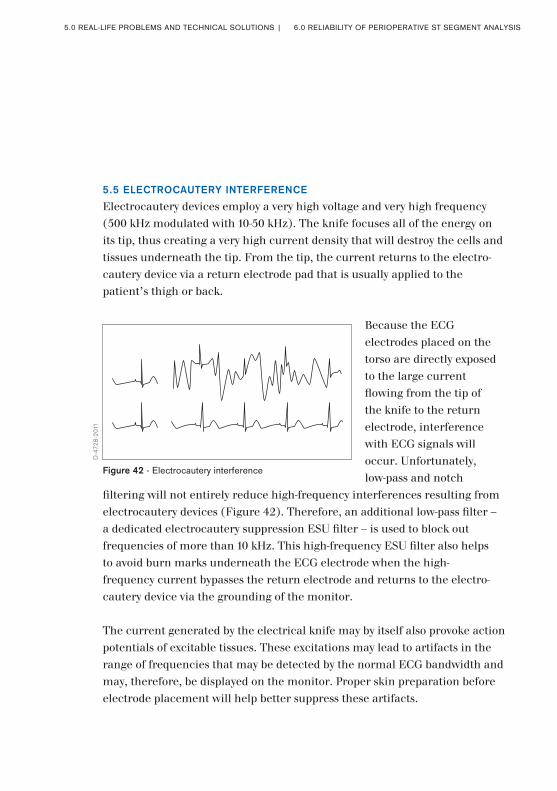
5.5 ELECTROCAUTERY INTERFERENCEElectrocautery devices employ a very high voltage and very high frequency (500 kHz modulated with 10-50 kHz). The knife focuses all of the energy on its tip, thus creating a very high current density that will destroy the cells and tissues underneath the tip. From the tip, the current returns to the electro-cautery device via a return electrode pad that is usually applied to the patient’s thigh or back.
Because the ECG electrodes placed on the torso are directly exposed to the large current flowing from the tip of the knife to the return electrode, interference with ECG signals will occur. Unfortunately, low-pass and notch
filtering will not entirely reduce high-frequency interferences resulting from electrocautery devices (Figure 42). Therefore, an additional low-pass filter – a dedicated electrocautery suppression ESU filter – is used to block out frequencies of more than 10 kHz. This high-frequency ESU filter also helps to avoid burn marks underneath the ECG electrode when the high-frequency current bypasses the return electrode and returns to the electro-cautery device via the grounding of the monitor.
The current generated by the electrical knife may by itself also provoke action potentials of excitable tissues. These excitations may lead to artifacts in the range of frequencies that may be detected by the normal ECG bandwidth and may, therefore, be displayed on the monitor. Proper skin preparation before electrode placement will help better suppress these artifacts.
Figure 42 - Electrocautery interference
D-4
728-
2011
54|55
6.0 Reliability of Perioperative ST Segment Analysis
The sum of artifacts in the operating room, post-anesthesia recover unit, or critical care unit makes meaningful ECG recordings possible only with data filtering. However, data filtering virtually eliminates information from the ECG recording and may also introduce artifacts. Both elimination of information and introduction of artifacts may resemble ST segment alteration. Therefore, monitoring devices need on one hand to filter out artifacts, yet on the other hand they have to electronically compensate for changes of the ECG signal introduced by the filtering itself. The recording and filtering setup of the electronic ECG recorder therefore needs to be known in order to allow interpretation of the recording. It is important to acknowledge that ECG recorders used for diagnostic purposes in the ECG laboratory differ from ECG recorders implemented in monitoring devices used in the operating room, post-anesthesia recovery unit or critical care unit.
The necessity for differences between a monitoring ECG and a diagnostic ECG can be explained by considering the specific purpose of each. In an ECG laboratory, the patient is lying still and the recording usually lasts for only 10 seconds. The operator observes the ECG recordings until a period occurs that is free from artifacts and the recording is started. The purpose is to precisely diagnose or exclude the existence of potential cardiac diseases.
In the operating room, post-anesthesia recovery unit or critical care unit, the ECG is continuously monitored even if the body of the patient moves due to repositioning, mobilization, artificial ventilation or chest therapy. All these movements will introduce interference to the ECG that must be removed. The purpose here is to detect early warning signs of acute changes or alarm-ing signs in the electrical activity of the heart. For precise diagnosis of these acute changes, a diagnostic printout generated by the monitor is necessary.
6.0 RELIABILITY OF PERIOPERATIVE ST SEGMENT ANALYSIS |
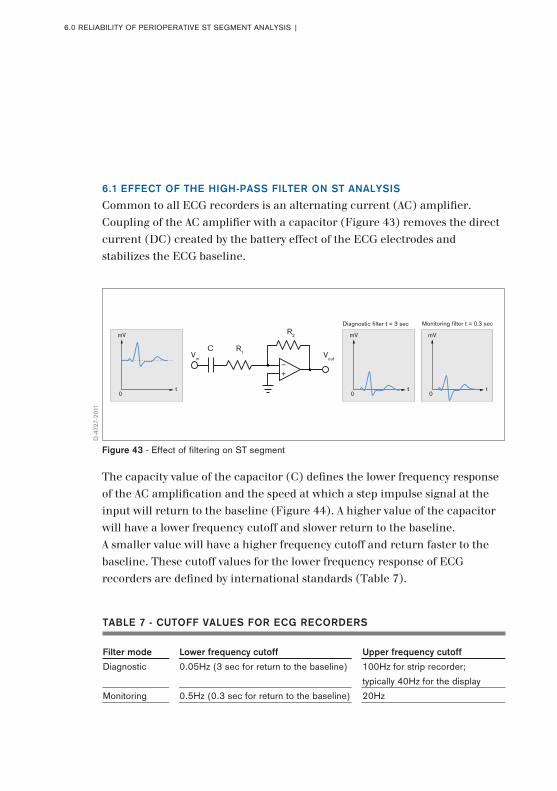
6.1 EFFECT OF THE HIGH-PASS FILTER ON ST ANALYSISCommon to all ECG recorders is an alternating current (AC) amplifier. Coupling of the AC amplifier with a capacitor (Figure 43) removes the direct current (DC) created by the battery effect of the ECG electrodes and stabilizes the ECG baseline.
The capacity value of the capacitor (C) defines the lower frequency response of the AC amplification and the speed at which a step impulse signal at the input will return to the baseline (Figure 44). A higher value of the capacitor will have a lower frequency cutoff and slower return to the baseline. A smaller value will have a higher frequency cutoff and return faster to the baseline. These cutoff values for the lower frequency response of ECG recorders are defined by international standards (Table 7).
Figure 43 - Effect of filtering on ST segment
Monitoring filter t = 0.3 secDiagnostic filter t = 3 sec
Vin
C R1
R2
Vout
0
mV
t0
mV
t0
mV
t
TABLE 7 - CUTOFF VALUES FOR ECG RECORDERS
Filter mode Lower frequency cutoff Upper frequency cutoff
Diagnostic 0.05Hz (3 sec for return to the baseline) 100Hz for strip recorder;
typically 40Hz for the display
Monitoring 0.5Hz (0.3 sec for return to the baseline) 20Hz
D-4
727-
2011
56|57
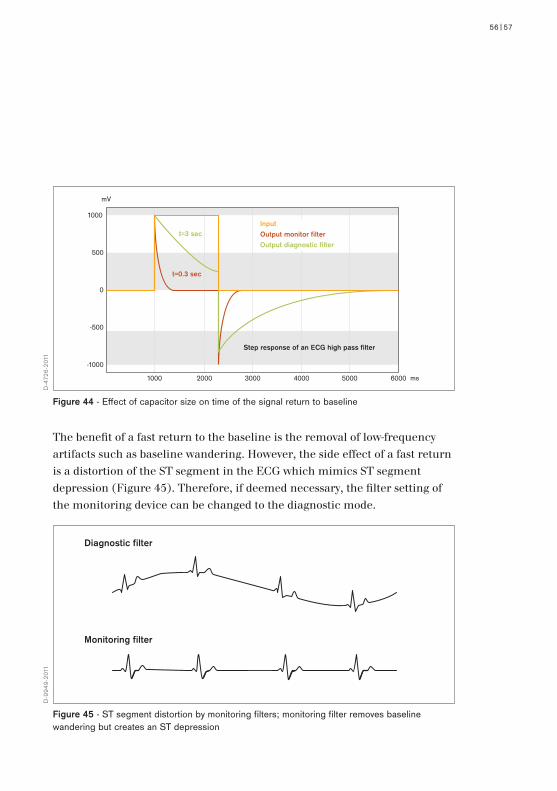
The benefit of a fast return to the baseline is the removal of low-frequency artifacts such as baseline wandering. However, the side effect of a fast return is a distortion of the ST segment in the ECG which mimics ST segment depression (Figure 45). Therefore, if deemed necessary, the filter setting of the monitoring device can be changed to the diagnostic mode.
1000
500
0
-500
-1000
1000 2000 3000 4000 5000 6000 ms
mV
t=0.3 sec
t=3 sec
Step response of an ECG high pass filter
Input
Output monitor filter
Output diagnostic filter
Figure 44 - Effect of capacitor size on time of the signal return to baseline
Figure 45 - ST segment distortion by monitoring filters; monitoring filter removes baseline wandering but creates an ST depression
Diagnostic filter
Monitoring filter
D-4
726-
2011
D-9
949-
2011
6.0 RELIABILITY OF PERIOPERATIVE ST SEGMENT ANALYSIS |
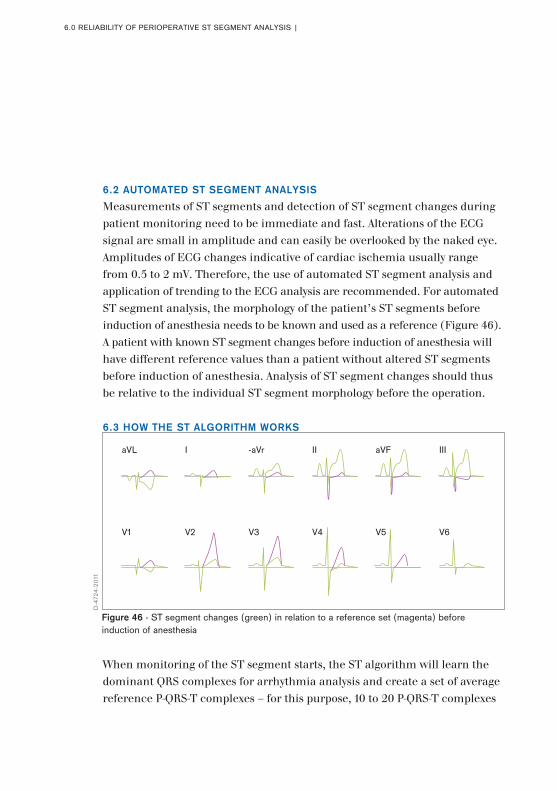
6.2 AUTOMATED ST SEGMENT ANALYSISMeasurements of ST segments and detection of ST segment changes during patient monitoring need to be immediate and fast. Alterations of the ECG signal are small in amplitude and can easily be overlooked by the naked eye. Amplitudes of ECG changes indicative of cardiac ischemia usually range from 0.5 to 2 mV. Therefore, the use of automated ST segment analysis and application of trending to the ECG analysis are recommended. For automated ST segment analysis, the morphology of the patient’s ST segments before induction of anesthesia needs to be known and used as a reference (Figure 46). A patient with known ST segment changes before induction of anesthesia will have different reference values than a patient without altered ST segments before induction of anesthesia. Analysis of ST segment changes should thus be relative to the individual ST segment morphology before the operation.
6.3 HOW THE ST ALGORITHM WORKS
When monitoring of the ST segment starts, the ST algorithm will learn the dominant QRS complexes for arrhythmia analysis and create a set of average reference P-QRS-T complexes – for this purpose, 10 to 20 P-QRS-T complexes
aVL I -aVr II
V1 V2 V3 V4
aVF
V5
III
V6
Figure 46 - ST segment changes (green) in relation to a reference set (magenta) before induction of anesthesia
D-4
724-
2011
58|59
of the patient’s ECG will be combined by overlaying each complex around a fiduciary reference (usually the R-peak) and average the shape into an average P-QRS-T complex. The benefit of this averaging is that minute beat-to-beat variations in the P-QRS-T morphology will not affect the ST segment measurement.
As mentioned above, the monitor employs an arrhythmia algorithm to detect premature ventricular beats. These arrhythmic beats, as well as paced beats and artifacts, are excluded from the averaged P-QRS-T complex.
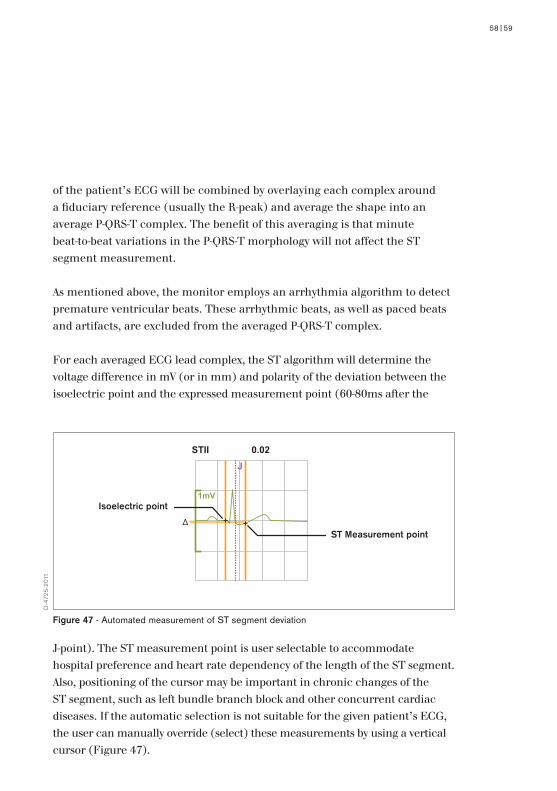
For each averaged ECG lead complex, the ST algorithm will determine the voltage difference in mV (or in mm) and polarity of the deviation between the isoelectric point and the expressed measurement point (60-80ms after the
J-point). The ST measurement point is user selectable to accommodate hospital preference and heart rate dependency of the length of the ST segment. Also, positioning of the cursor may be important in chronic changes of the ST segment, such as left bundle branch block and other concurrent cardiac diseases. If the automatic selection is not suitable for the given patient’s ECG, the user can manually override (select) these measurements by using a vertical cursor (Figure 47).
Figure 47 - Automated measurement of ST segment deviation
1mV
STII
J
0.02
∆
Isoelectric point
ST Measurement point
D-4
725-
2011
6.0 RELIABILITY OF PERIOPERATIVE ST SEGMENT ANALYSIS |
The ST review screen also aids in reviewing the automatic selection of the isoelectric and J-point by the algorithm. The voltage difference between the isoelectric and ST measurement point is forwarded as an ST value to the parameter display box and the alarm logic.
6.4 ST ALARMS The monitor’s alarms are usually set to detect changes of the ST segment in increments of 0.1 mV. However based on age, gender and concurrent disease, other values may be necessary. This needs to be adjusted on an individual basis. As mentioned previously, the filter setting of the monitoring device can be changed to the diagnostic mode if deemed necessary. This will allow ECG recordings with the full bandwidth of diagnostic devices. It should be taken into consideration, however, that the display of the monitor should be set at a recording speed of 50 mm/s, since the resolution of a digital TFT display does not allow for diagnostic resolution on the screen. Also, because the TFT monitor does not provide for a grid, ECG analysis should always be performed with a printout.
6.5 INTRAOPERATIVE PLACEMENT OF ELECTRODESPlacement of electrodes for intraoperative ECG recordings is often dependent on the surgical operation. Many operations do not allow for proper placement of electrodes according to Mason-Likar, and even proper placement of 5 electrodes is often difficult to achieve. Regardless of the surgical approach to the patient, caregivers have to be aware of the limitations of the ECG recording performed with atypical placement of the electrodes during the operation. Atypical placement may cause wrong lead assignment on the display of the ECG monitor, as well as assignment of electrical changes to the wrong regions of the heart.
60|61
In view of these methodological limitations, it is not surprising that only 15- 40% of ST segment changes are adequately detected in the operating room. Given the low sensitivity of single-lead ECG recordings – and even the low sensitivity of the combination of a limb lead and a precordial lead – perioperative myocardial ischemia is likely to have a higher incidence than may generally be assumed.
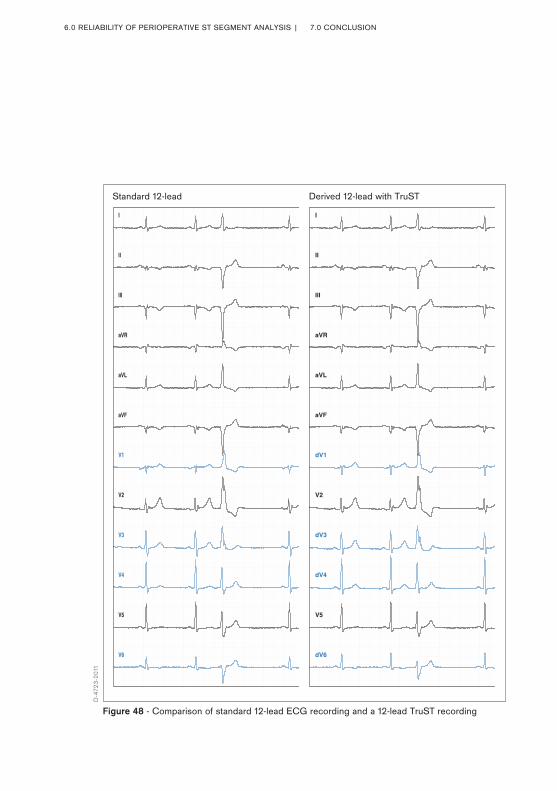
Several of these limitations may be improved with the TruST algorithm, which as stated previously allows 12-lead ECG analysis from a reduced-lead ECG recorded from only 6 electrodes. Interference with the surgical site may be avoided more often. ECG recordings from the catheter laboratory indicate that the TruST algorithm provides nearly identical results as standard 12-lead ECG recording (Figure 48). Thus, it seems possible that reduced-lead ECG systems such as the TruST algorithm may help to improve perioperative ischemia monitoring without compromising the amount of available ECG leads.
6.0 RELIABILITY OF PERIOPERATIVE ST SEGMENT ANALYSIS | 7.0 CONCLUSION
Figure 48 - Comparison of standard 12-lead ECG recording and a 12-lead TruST recording
I
II
III
aVR
aVL
aVF
dV1
V2
dV3
dV4
V5
dV6
I
II
III
aVR
aVL
aVF
V1
V2
V3
V4
V5
V6
Standard 12-lead Derived 12-lead with TruST
D-4
723-
2011
7.0 Conclusion
The benefits of myocardial ischemia monitoring in perioperative care are compelling. More than 100 years after its invention, ECG monitoring still constitutes an invaluable, non-invasive and inexpensive perioperative moni-tor of patients undergoing surgery. The interpretation of perioperative ECG recordings follows easy rules, thereby helping to increase the safety of a sig-nificant amount of patients on a daily basis. By translating current evidence into clinical practice, the ECG provides the physician with a diagnostic tool of high sensitivity and specificity for the detection of myocardial ischemia.
It is only by considering and overcoming the limitations of reduced-lead ECG recordings that the perioperative treatment of high-cardiac-risk patients will improve even further. This will not only improve medical treatment, but may also reduce health care expenditure. In short, high quality perioperative ECG monitoring and interpretation can have a significant impact on the quality and costs of patient care.
62|63
8.0 GLOSSARY OF TERMS |
8.0 Glossary of Terms
ANATOMY AND PHYSIOLOGY
Absolute refractory period – The period immediately following depolarization of a cardiomyocyte when it cannot be stimulated by an electrical stimulus.
AV-block – Disorder of electrical impulse conduction at the level of the AV node.
AV node – Specialized cardiac cells, located between the atria and the ventricles of the heart. They receive electrical impulses from the atria and direct them to the conduction systems of the ventricles.
Cardiac action potentials – Transmembrane potential of cardiomyocytes consisting of five phases: A) upstroke or rapid depolarization, B) early rapid repolarization, C) plateau phase, D) final rapid repolarization, E) resting membrane potential and diastolic depolarization.
Depolarization – An electrical state in an excitable cell whereby the inside of the cell is made less negative relative to the outside.
Diastole – Relaxation and dilatation of the cardiac ventricles during normal rhythmical activity of the heart.
Left and right bundle – Conduction system in the ventricles.
Repolarization – Restoration of the difference in charge between the inside and outside of the cell membrane following depolarization.
64|65
Sinus node – Specialized cardiac cells located in the right atrium that act as the primary pacemaker of the electrical activity of the heart. Generates the sinus rhythm.
Supraventricular arrhythmia – Abnormal, usually rapid, heart rhythm with supraventricular origin.
Systole – Period of the cardiac cycle when the heart is contracting.
Ventricular arrhythmia – Abnormal, usually rapid, heart rhythm with ventricular origin.
ECG
12-lead ECG – ECG recording from 10 electrodes typically combining Einthoven leads (I, II, III), Goldberger leads (aVR, aVF, aVL), and Wilson leads (V1-V6).
Einthoven – Willem Einthoven described the first clinically important ECG measuring system. Einthoven invented the limb leads I, II, and III and assigned the letters P, Q, R, S and T to electrocardiographic recordings of the heart. He was awarded the Nobel Prize in Medicine in 1924.
Electrocardiograph – Electrical instrument for recording changes of electrical activity in the heart.
Goldberger – Emanuel Goldberger invented the augmented leads of the ECG.
J-point – Junction of QRS complex and ST segment.
Lead – Voltage between two electrodes attached to the patient‘s body at defined positions. Combination of different electrodes produces different leads visible in the ECG.
Mason-Likar – The Mason-Likar modification is the most important modification of the 12-lead system used in exercise and monitoring ECGs.
PQ interval – Part of the ECG from the beginning of the P-wave to the beginning of the Q-wave.
PQ segment – Part of the ECG from the end of the P-wave to the beginning of the Q-wave.
PQRST complex – The pattern of the electrical activity of the heart during one cardiac cycle as visible in the ECG.
P-wave – Electrical signal visible in the ECG that represents depolarization of the atria.
QRS complex – Electrical signal visible in the ECG that represents depolarization of the ventricles.
QRS interval – Time from the Q-wave to the S-wave.
QT interval – Time from the Q-wave to the end of the T-wave.
Reduced-lead ECG recording – Reconstruction of the standard 12-lead ECG from recordings using a reduced number of leads.
8.0 GLOSSARY OF TERMS |

ST segment – Isoelectric line between the end of the QRS complex and the beginning of the T-wave.
TP segment – Part of the ECG from the end of the T-wave to the beginning of the P-wave.
T-wave – Electrical signal visible in the ECG that represents repolarization of the ventricles.
U-wave – Small wave visible in the ECG that follows the T-wave.
Wilson – Frank Norman Wilson invented the Wilson leads of the ECG.
ISCHEMIA AND INFARCTION
Cardiomyocyte – A cell of muscular tissue in the heart.
Myocardial infarction – Necrosis of cardiomyocytes due to prolonged ischemia.
Myocardial ischemia – Insufficient blood flow to the heart.
Non-ST segment elevation myocardial infarction (NSTEMI) – Myocardial infarction without visible elevation of ST segments in the ECG.
ST segment elevation myocardial infarction (STEMI) – Myocardial infarction with visible elevation of ST segments in the ECG.
66|67

9.0 REFERENCES |
9.0 References
1. Devereaux PJ, Goldman L, Cook DJ, Gilbert K, Leslie K, Guyatt GH. Perioperative cardiac events in patients undergoing noncardiac surgery: a review of the magnitude of the problem, the pathophysiology of the events and methods to estimate and communicate risk. CMAJ 2005; 173:627-34.
2. Lee TH, Marcantonio ER, Mangione CM, Thomas EJ, Polanczyk CA, Cook EF, Sugarbaker DJ, Donaldson MC, Poss R, Ho KK, Ludwig LE, Pedan A, Goldman L. Derivation and prospective validation of a simple index for prediction of cardiac risk of major noncardiac surgery. Circulation 1999; 100:1043-9.
3. POISE Study Group, Devereaux PJ, Yang H, Yusuf S, Guyatt G, Leslie K, Villar JC, Xavier D, Chrolavicius S, Greenspan L, Pogue J, Pais P, Liu L, Xu S, Málaga G, Avezum A, Chan M, Montori VM, Jacka M, Choi P. Effects of extended-release metoprolol succinate in patients undergoing non-cardiac surgery (POISE trial): a randomised controlled trial. Lancet 2008; 371:1839-47.
4. Gaziano JM. Global Burden of cardiovascular disease. In: Braunwald’s Heart Disease, 8th edition 2008, Saunders Elsevier, Philadelphia, PE, USA, 1-22.
5. Nussmeier NA, Hauser MC, Sarwar MF, Grigore AM, Searles BE. Anaesthesia for cardiac surgical procedures. In: Miller’s Anesthesia, 7th edition 2010, Churchill Livingstone Philadelphia, PE, USA, 1889-1975.
68|69
6. Fischer SP, Bader AM, Sweitzer B: Preoperative evaluation. In: Miller’s Anesthesia, 7th edition 2010, Churchill Livingstone Philadelphia, PE, USA, 1001-1066.
7. Roizen MF, Fleisher LA. Anesthetic implications of concurrent disease. In: Miller’s Anesthesia, 7th edition 2010, Churchill Livingstone Philadelphia, PE, USA, 1067-1149.
8. Fleisher LA, Beckman JA, Brown KA, Calkins H, Chaikof EL, Fleischmann KE, Freeman WK, Froehlich JB, Kasper EK, Kersten JR, Riegel B, Robb JF. 2009 ACCF/AHA focused update on perioperative beta blockade incorporated into the ACC/AHA 2007 guidelines on perioperative cardio-vascular evaluation and care for noncardiac surgery: a report of the American college of cardiology foundation/American heart association task force on practice guidelines. Circulation 2009; 120:e169-276.
9. Fleisher LA, Beckman JA, Brown KA, Calkins H, Chaikof E, Fleischmann KE, Freeman WK, Froehlich JB, Kasper EK, Kersten JR, Riegel B, Robb JF. ACC/AHA 2007 guidelines on perioperative cardiovascular evaluation and care for noncardiac surgery: a report of the American College of Cardiology/American Heart Association Task Force on Practice Guide-lines (Writing Committee to Revise the 2002 Guidelines on Perioperative Cardiovascular Evaluation for Noncardiac Surgery). Circulation 2007; 116:e418-99.
10. Martinez EA, Kim LJ, Faraday N, Rosenfeld B, Bass EB, Perler BA, Williams GM, Dorman T, Pronovost PJ. Sensitivity of routine intensive care unit surveillance for detecting myocardial ischemia. Crit Care Med. 2003;31: 2302-2308.
10.0 RECOMMENDED FURTHER READING |
10.0 Recommended further reading
1. Braunwald’s Heart Disease, 8th edition 2008, Saunders Elsevier, Philadelphia, PE, USA.
2. Miller’s Anesthesia, 7th edition 2010, Churchill Livingstone Philadelphia, PE, USA.
3. White HD, Chew DP. Acute myocardial infarction. Lancet. 2008; 372:570-84.
4. Fleisher LA, Beckman JA, Brown KA, Calkins H, Chaikof EL, Fleischmann KE, Freeman WK, Froehlich JB, Kasper EK, Kersten JR, Riegel B, Robb JF. 2009 ACCF/AHA focused update on perioperative beta blockade incorporat-ed into the ACC/AHA 2007 guidelines on perioperative cardiovascular evaluation and care for noncardiac surgery: a report of the American college of cardiology foundation/American heart association task force on practice guidelines. Circulation 2009; 120:e169-276.
5. Thygesen K, Alpert JS, White HD; Joint ESC/ACCF/AHA/WHF Task Force for the Redefinition of Myocardial Infarction, Jaffe AS, Apple FS, Galvani M, Katus HA, Newby LK, Ravkilde J, Chaitman B, Clemmensen PM, Dellborg M, Hod H, Porela P, Underwood R, Bax JJ, Beller GA, Bonow R, Van der Wall EE, Bassand JP, Wijns W, Ferguson TB, Steg PG, Uretsky BF, Williams DO, Armstrong PW, Antman EM, Fox KA, Hamm CW, Ohman EM, Simoons ML, Poole-Wilson PA, Gurfinkel EP, Lopez-Sendon JL, Pais P, Mendis S, Zhu JR, Wallentin LC, Fernández-Avilés F, Fox KM, Parkhomenko AN, Priori SG, Tendera M, Voipio-Pulkki LM, Vahanian A, Camm AJ, De Caterina R, Dean V, Dickstein K, Filippatos G, Funck-Brentano C, Hellemans I, Kristensen SD, McGregor K, Sechtem U, Silber S, Tendera M, Widimsky P, Zamorano JL, Morais J, Brener S, Harrington R, Morrow D, Lim M, Martinez-Rios
70|71
MA, Steinhubl S, Levine GN, Gibler WB, Goff D, Tubaro M, Dudek D, Al-Attar N. Universal definition of myocardial infarction. Circulation. 2007; 116:2634-53. Thygesen K, Alpert JS, Jaffe AS, White HD. Diagnostic applica-tion of the universal definition of myocardial infarction in the intensive care unit. Curr Opin Crit Care. 2008; 14:5438.
6. Drew BJ, Califf RM, Funk M, Kaufman ES, Krucoff MW, Laks MM, Macfarlane PW, Sommargren C, Swiryn S, Van Hare GF; Practice standards for electrocardiographic monitoring in hospital settings: an American Heart Association scientific statement from the Councils on Cardiovascular Nursing, Clinical Cardiology, and Cardiovascular Disease in the Young: endorsed by the International Society of Computerized Electrocardiology and the American Association of Critical-Care Nurses. Circulation. 2004; 110:2721-46.
7. Kligfield P, Gettes LS, Bailey JJ, Childers R, Deal BJ, Hancock EW, van Herpen G, Kors JA, Macfarlane P, Mirvis DM, Pahlm O, Rautaharju P, Wagner GS; American Heart Association Electrocardiography and Arrhythmias Committee, Council on Clinical Cardiology; American College of Cardiology Foundation; Heart Rhythm Society, Josephson M, Mason JW, Okin P, Surawicz B, Wellens H. Recommendations for the standardization and interpretation of the electrocardiogram: part I: The electrocardiogram and its technology: a scientific statement from the American Heart Association Electrocardiography and Arrhythmias Com-mittee, Council on Clinical Cardiology; the American College of Cardiology Foundation; and the Heart Rhythm Society: endorsed by the International Society for Computerized Electrocardiology. Circulation. 2007; 115:1306-24.
8. Mason JW, Hancock EW, Gettes LS; American Heart Association Electrocar- diography and Arrhythmias Committee, Council on Clinical Cardiology; American College of Cardiology Foundation; Heart Rhythm Society, Bailey
9.0 RECOMMENDED FURTHER READING |
JJ, Childers R, Deal BJ, Josephson M, Kligfield P, Kors JA, Macfarlane P, Pahlm O, Mirvis DM, Okin P, Rautaharju P, Surawicz B, van Herpen G, Wagner GS, Wellens H. Recommendations for the standardization and interpretation of the electrocardiogram: part II: Electrocardiography diagnostic statement list: a scientific statement from the American Heart Association Electrocardiography and Arrhythmias Committee, Council on Clinical Cardiology; the American College of Cardiology Foundation; and the Heart Rhythm Society: endorsed by the International Society for Computerized Electrocardiology. Circulation. 2007; 115:1325-32.
9. Surawicz B, Childers R, Deal BJ, Gettes LS, Bailey JJ, Gorgels A, Hancock EW, Josephson M, Kligfield P, Kors JA, Macfarlane P, Mason JW, Mirvis DM, Okin P, Pahlm O, Rautaharju PM, van Herpen G, Wagner GS, Wellens H; American Heart Association Electrocardiography and Arrhythmias Com-mittee, Council on Clinical Cardiology; American College of Cardiology Foundation; Heart Rhythm Society. HA/ACCF/HRS recommendations for the standardization and interpretation of the electrocardiogram: part III: intraventricular conduction disturbances: a scientific statement from the American Heart Association Electrocardiography and Arrhythmias Com-mittee, Council on Clinical Cardiology; the American College of Cardiology Foundation; and the Heart Rhythm Society: endorsed by the International Society for Computerized Electrocardiology. Circulation. 2009; 119:e235-40.
10. Rautaharju PM, Surawicz B, Gettes LS, Bailey JJ, Childers R, Deal BJ, Gorgels A, Hancock EW, Josephson M, Kligfield P, Kors JA, Macfarlane P, Mason JW, Mirvis DM, Okin P, Pahlm O, van Herpen G, Wagner GS, Wellens H; American Heart Association Electrocardiography and Arrhyth-mias Committee, Council on Clinical Cardiology; American College of Cardiology Foundation; Heart Rhythm Society. AHA/ACCF/HRS recom-mendations for the standardization and interpretation of the electrocardio-gram: part IV: the ST segment, T and U waves, and the QT interval: a scien-tific statement from the American Heart Association Electrocardiography
72|73
and Arrhythmias Committee, Council on Clinical Cardiology; the American College of Cardiology Foundation; and the Heart Rhythm Society: endorsed by the International Society for Computerized Electrocardiology. Circula-tion. 2009; 119:e241-50.
11. Hancock EW, Deal BJ, Mirvis DM, Okin P, Kligfield P, Gettes LS, Bailey JJ, Childers R, Gorgels A, Josephson M, Kors JA, Macfarlane P, Mason JW, Pahlm O, Rautaharju PM, Surawicz B, van Herpen G, Wagner GS, Wellens H; American Heart Association Electrocardiography and Arrhythmias Com-mittee, Council on Clinical Cardiology; American College of Cardiology Foundation; Heart Rhythm Society. HA/ACCF/HRS recommendations for the standardization and interpretation of the electrocardiogram: part V: electrocardiogram changes associated with cardiac chamber hypertrophy: a scientific statement from the American Heart Association Electrocardiog-raphy and Arrhythmias Committee, Council on Clinical Cardiology; the American College of Cardiology Foundation; and the Heart Rhythm Society: endorsed by the International Society for Computerized Electrocardiology. Circulation. 2009; 119: e251-61.
12. Wagner GS, Macfarlane P, Wellens H, Josephson M, Gorgels A, Mirvis DM, Pahlm O, Surawicz B, Kligfield P, Childers R, Gettes LS, Bailey JJ, Deal BJ, Gorgels A, Hancock EW, Kors JA, Mason JW, Okin P, Rautaharju PM, van Herpen G; American Heart Association Electrocardiography and Arrhyth-mias Committee, Council on Clinical Cardiology; American College of Car-diology Foundation; Heart Rhythm Society. AHA/ACCF/HRS recommenda-tions for the standardization and interpretation of the electrocardiogram: part VI: acute ischemia/infarction: a scientific statement from the Ameri-can Heart Association Electrocardiography and Arrhythmias Committee, Council on Clinical Cardiology; the American College of Cardiology Foun-dation; and theHeart Rhythm Society: endorsed by the International Society for Computerized Electrocardiology. Circulation. 2009; 119: e262-70.

90 6
6 44
5 |
15.0
7-2
| C
omm
unic
atio
ns &
Sal
es M
arke
ting
| P
P |
LE
| P
rinte
d in
Ger
man
y |
Sub
ject
to m
odifi
catio
ns |
© 2
015
Drä
gerw
erk
AG &
Co.
KG
aA
Manufacturer:Drägerwerk AG & Co. KGaAMoislinger Allee 53–5523558 Lübeck, Germany
REGION EUROPE CENTRAL AND EUROPE NORTHDrägerwerk AG & Co. KGaA Moislinger Allee 53–5523558 Lübeck, GermanyTel +49 451 882 0Fax +49 451 882 [email protected]
REGION EUROPE SOUTHDräger Médical S.A.S. Parc de Haute Technologie d’Antony 225, rue Georges Besse92182 Antony Cedex, FranceTel +33 1 46 11 56 00Fax +33 1 40 96 97 [email protected]
REGION MIDDLE EAST, AFRICADrägerwerk AG & Co. KGaABranch OfficeP.O. Box 505108Dubai, United Arab EmiratesTel +971 4 4294 600Fax +971 4 4294 [email protected]
CORPORATE HEADQUARTERSDrägerwerk AG & Co. KGaAMoislinger Allee 53–5523558 Lübeck, Germany
www.draeger.com
Locate your Regional Sales Representative at: www.draeger.com/contact
REGION ASIA / PACIFICDraeger Medical South East Asia Pte Ltd.25 International Business Park#04-27/29 German CentreSingapore 609916, SingaporeTel +65 6572 4388Fax +65 6572 4399 [email protected]
REGION NORTH AMERICADraeger Medical, Inc.3135 Quarry Road Telford, PA 18969-1042, USATel +1 215 721 5400Toll-free +1 800 437 2437Fax +1 215 723 [email protected]
REGION CENTRAL AND SOUTH AMERICADräger Panama Comercial S. de R.L.Complejo Business Park, V tower, 10th floorPanama CityTel +507 377 9100Fax +507 377 [email protected]