EARNINGS RELEASE n - mz-prod-cvm.s3.amazonaws.com · Special note: figures for 1Q17 include the...
41
1 EARNINGS RELEASE 1Q18 ¹ Excludes investments in M&A and Special Projects. ² EBITDA excluding the capital gain from the divestment of NOVATEC in 4Q17. Special note: figures for 1Q17 include the operations of FAIR, FAC/FAMAT and NOVATEC while the figures for 4Q17 include only the results of NOVATEC. ¹ Excludes figures from FAIR, FAC/FAMAT and NOVATEC for 2017, as well as results relating to new On-Campus units (Greenfields). On April 10, Kroton announced the creation of Saber, its holding company dedicated exclusively to Primary & Secondary Education. On the same date, the Company concluded the acquisition of Centro Educacional Leonardo da Vinci (“CELV”), an institution with around 1,300 students and unique facilities located in Vitória, Espírito Santo. On April 23, Kroton, through its subsidiary Saber, signed an agreement to acquire the operations of Somos. The transaction was executed under typical precedent conditions, including approval by Brazil's antitrust authority CADE. If approved, the acquisition will perfectly complement Kroton’s operations in the Primary & Secondary Education segment with high-quality products, services and digital platforms with national coverage. In addition to representing an important strategic step, the acquisition of a leading player in this segment should further diversify the Company’s markets and revenue sources and offer synergies and operating efficiency gains. Values in R$ ('000) 1Q18 1Q17 Chg.% 4Q17 Chg.% Gross Revenue 1,757,827 1,740,781 1.0% 1,754,889 0.2% Net Revenue 1,363,325 1,365,122 -0.1% 1,349,690 1.0% Gross Income 1,050,550 1,061,151 -1.0% 956,622 9.8% Gross Margin 77.1% 77.7% -0.7 p.p. 70.9% 6.2 p.p. Operating Result 785,792 814,001 -3.5% 704,826 11.5% Operat ing Margin 57.6% 59.6% -2.0 p.p. 52.2% 5.4 p.p. Adjusted EBITDA 614,713 639,529 -3.9% 534,149 15.1% Adjust ed EBITDA Margin 45.1% 46.8% -1.8 p.p. 39.6% 5.5 p.p. Adjusted Net Income 538,991 577,063 -6.6% 488,638 10.3% Adjust ed Net Margin 39.5% 42.3% -2.7 p.p. 36.2% 3.3 p.p. Adjusted Net Income /share 0.33 0.35 -7.6% 0.30 10.0% Operating Cash Generation (OCG) after Capex ¹ (125,271) 51,155 n.a. 392,208 n.a. OCG aft er Capex 1 / EBITDA (unadjust ed)² - 8.6% n.a. 82.9% n.a. Consolidated - Values in R$ ('000) 1Q18 1Q17 Chg.% Net Revenue 1,357,949 1,357,256 0.1% Adjusted EBITDA 629,733 634,451 -0.7% Adjust ed EBITDA Margin 46.4% 46.7% -0.4 p.p. Adjusted Net Income 554,717 571,978 -3.0% Adjust ed Net Margin 40.8% 42.1% -1.3 p.p. HIGHLIGHTS – MANAGEMENT ANALYSIS HIGHLIGHTS – MANAGEMENT ANALYSIS (Ex-Sale of Assets and Greenfields) Belo Horizonte, May 11, 2018, Kroton Educacional S.A. (B3: KROT3; OTCQX: KROTY) – “Kroton” or “Company,” announces today its results for the first quarter of 2018 (1Q18). The Company’s financial information is presented on a consolidated basis and in Brazilian real, in accordance with Brazilian Corporate Law and Generally Accepted Accounting Principles in Brazil (BRGAAP), and already conforms to International Financial Reporting Standards (IFRS), except where stated otherwise. HIGHLIGHTS INVESTOR RELATIONS Carlos Lazar – IRO Pedro Gomes – IR Manager Ana Troster – IR Coordinator +55 11 3133-7309 / 7311 / 7314 [email protected] www.kroton.com.br/ir
Transcript of EARNINGS RELEASE n - mz-prod-cvm.s3.amazonaws.com · Special note: figures for 1Q17 include the...
1
EARNINGS RELEASE 1Q18
¹ Excludes investments in M&A and Special Projects.
² EBITDA excluding the capital gain from the divestment of NOVATEC in 4Q17.
Special note: figures for 1Q17 include the operations of FAIR, FAC/FAMAT and NOVATEC while the figures for 4Q17 include only the results of NOVATEC.
¹ Excludes figures from FAIR, FAC/FAMAT and NOVATEC for 2017, as well as results relating to new On-Campus units (Greenfields).
On April 10, Kroton announced the creation of Saber, its holding company dedicated exclusively to Primary &
Secondary Education. On the same date, the Company concluded the acquisition of Centro Educacional Leonardo
da Vinci (“CELV”), an institution with around 1,300 students and unique facilities located in Vitória, Espírito Santo.
On April 23, Kroton, through its subsidiary Saber, signed an agreement to acquire the operations of Somos. The
transaction was executed under typical precedent conditions, including approval by Brazil's antitrust authority
CADE. If approved, the acquisition will perfectly complement Kroton’s operations in the Primary & Secondary
Education segment with high-quality products, services and digital platforms with national coverage. In addition
to representing an important strategic step, the acquisition of a leading player in this segment should further
diversify the Company’s markets and revenue sources and offer synergies and operating efficiency gains.
Values in R$ ('000) 1Q18 1Q17 Chg.% 4Q17 Chg.%
Gross Revenue 1,757,827 1,740,781 1.0% 1,754,889 0.2%
Net Revenue 1,363,325 1,365,122 -0.1% 1,349,690 1.0%
Gross Income 1,050,550 1,061,151 -1.0% 956,622 9.8%
Gross Margin 77.1% 77.7% -0.7 p.p. 70.9% 6.2 p.p.
Operating Result 785,792 814,001 -3.5% 704,826 11.5%
Operat ing Margin 57.6% 59.6% -2.0 p.p. 52.2% 5.4 p.p.
Adjusted EBITDA 614,713 639,529 -3.9% 534,149 15.1%
Adjust ed EBITDA Margin 45.1% 46.8% -1.8 p.p. 39.6% 5.5 p.p.
Adjusted Net Income 538,991 577,063 -6.6% 488,638 10.3%
Adjust ed Net Margin 39.5% 42.3% -2.7 p.p. 36.2% 3.3 p.p.
Adjusted Net Income /share 0.33 0.35 -7.6% 0.30 10.0%
Operating Cash Generation (OCG) after Capex ¹ (125,271) 51,155 n.a. 392,208 n.a.
OCG aft er Capex1
/ EBITDA (unadjust ed)² - 8.6% n.a. 82.9% n.a.
Consolidated - Values in R$ ('000) 1Q18 1Q17 Chg.%
Net Revenue 1,357,949 1,357,256 0.1%
Adjusted EBITDA 629,733 634,451 -0.7%
Adjust ed EBITDA Margin 46.4% 46.7% -0.4 p.p.
Adjusted Net Income 554,717 571,978 -3.0%
Adjust ed Net Margin 40.8% 42.1% -1.3 p.p.
HIGHLIGHTS – MANAGEMENT ANALYSIS
HIGHLIGHTS – MANAGEMENT ANALYSIS (Ex-Sale of Assets and Greenfields)
Belo Horizonte, May 11, 2018, Kroton Educacional S.A. (B3: KROT3; OTCQX: KROTY) –
“Kroton” or “Company,” announces today its results for the first quarter of 2018 (1Q18). The Company’s financial
information is presented on a consolidated basis and in Brazilian real, in accordance with Brazilian Corporate Law and
Generally Accepted Accounting Principles in Brazil (BRGAAP), and already conforms to International Financial
Reporting Standards (IFRS), except where stated otherwise.
HIGHLIGHTS
INVESTOR RELATIONS
Carlos Lazar – IRO
Pedro Gomes – IR Manager
Ana Troster – IR Coordinator
+55 11 3133-7309 / 7311 / 7314
[email protected] www.kroton.com.br/ir
2
EARNINGS RELEASE 1Q18
The pace of new unit openings remained robust and should accelerate over the coming months. Excluding the 10
units opened in the past few semesters and the 3 acquisitions of On-campus units in late 2017 and early 2018,
Kroton plans to open another 20 new campuses by the second semester of this year, as well as 100 new DL centers,
which should start operating in the coming months. As a result, the expectation is to end 2018 with 35 new units
in the On-campus segment and 400 new DL centers opened in the past year. Despite the natural maturation curve
and the short-term impact that these new units will have on the Company as a whole, this will serve as an important
future growth lever, expanding the addressable market and enabling increasingly broader offerings in all regions
in Brazil.
The first student-recruiting process of 2018 was concluded successfully and should enable the Company to deliver
solid performance over the year. In all, Kroton added 322,800 new Undergraduate On-Campus and Distance
Learning students, which represents growth of 3.4% compared to the same period last year, despite the more
challenging competitive landscape and still-high unemployment rates.
Kroton also was able to deliver strong results in controlling dropout indicators, which directly reflects the expansion
and consolidation of initiatives associated with the Retention Program, which now includes, among other actions,
retention teams at all units and predictive dropout models.
Accordingly, Kroton’s Postsecondary student base once again neared the one-million-student mark, growing 14%
on the prior quarter, reflecting the Company’s strong brand recognition, efficient sales team, balanced offering of
student installment products and an employability channel that has proven to be an important competitive
advantage. In relation to a year earlier, the student base contracted 1.3%, reflecting the greater number of
graduations in the period.
In terms of financial performance in 1Q18, net revenue was virtually stable compared to the same quarter last year.
The solid performance of the latest new enrollment and re-enrollment processes, coupled with the better mix of
academic programs and the higher average ticket, were offset by the asset divestments in late 2017 and the higher
number of graduates, which adversely affected the student base.
Adjusted EBITDA (managerial analysis) was R$614.7 million in the quarter, down 3.9% from 1Q17, with margin
contraction of 1.8 p.p., pressured by change in the student profile, with a higher level of provisioning to support
the student installment products, and by higher costs and expenses associated with the new units. The latter factor,
however, is of a short-term nature and should become less significant as the greenfield projects mature.
Adjusted net income (managerial analysis) came to R$539.0 million in 1Q18, down 6.6% from R$577.1 million in
the same quarter of 2017, with adjusted net margin contracting by 270 bps.
Operating cash generation after capex was negative R$125.3 million in 1Q18, with this reversal explained by the
postponement of the start of the re-enrollment process of FIES contracts compared to 1Q17, in addition to the
larger base of students with installment plans. On the other hand, the expectation is for this indicator to improve
as of the next quarter, with the normalization of FIES re-enrollments.
In April, the Company intensified its share repurchases as a way to optimize returns for shareholders, with
13,767,400 common shares repurchased since the start of the program at an average price of R$13.83 per share,
which represents 28.2% of the limit established in the program.
MESSAGE FROM MANAGEMENT
As we wrote in one of our Messages from Management a few years back, we believe that people figure at the center of the
educational process and that, at the end of the day, the most important agent in this process is the student.
Well, although not a new principle, the focus on our students has gained greater relevance as of the review of our strategic
planning process concluded in the first quarter of this year. More than that, “Student Success” has consolidated itself as the
structural pillar of all actions and decisions taken at the various levels of the organization as we strive to offer an exceptional
experience in our different learning platforms. To us, Student Success is a combination of i) academic quality, ii) employability
3
EARNINGS RELEASE 1Q18
and iii) the student experience in all its dimensions (physical and digital experience, in the academic and administrative areas).
That is what we seek relentlessly at Kroton, since our students’ success is an essential condition for our sustainable growth.
With that in mind, in April, we held our annual meeting with around 450 leaders of the Company to disseminate our strategic
guidelines and intensify all of the efforts to improve Kroton’s position from the perspective of our students and other
stakeholders. It was three intense days, filled with content and always highlighting that efficiency and a mindset guided by
Student Success go hand in hand, and will be embraced by all the digital transformation initiatives that we are currently
developing.
And, speaking of digital transformation, we have made extensive progress to date. We have approximately 150 professionals
with IT and Business profiles already working and organized into 3 “trains” of agile deliveries. Another 150 professionals are
being trained and reorganized into 3 new “trains,” to be launched in June. By the end of the year, 100% of Kroton’s system
development teams will be working under a Scalable Agile Framework (SAFe) model to ensure complete alignment between
the business and technology areas, which is an essential step on our digital transformation journey.
Meanwhile, we continue to advance in our strategy to promote structured organic growth. For the first student-recruiting
process of 2018, we were able to implement 13 new units, of which ten are greenfield projects (all of which enjoyed successful
student-recruiting and class-formation processes) and three are acquisitions of smaller institutions. Another 20 new units are
already in the process of recruiting students for the second semester of 2018 and another 38 greenfield projects are currently
being prepared to launch their recruiting processes for next year. So, we started with 115 units and will reach 186 on-campus
units by the end of 2019, representing expansion of 62% in three years. In Distance Learning, the situation is no different,
since we launched 300 new centers since August 2017 and will open another 100 for the recruitment process this second
semester, reaching a total of 1,310 centers, or 44% more than in July 2017 (before the new regulatory framework). But our
strategy is not just about opening a campus or center. We know there is a huge difference between obtaining authorization
to open a unit and successfully implementing it. Today, the competitive advantage no longer lies in obtaining accreditation,
but in the quality of the implementation process, which involves selecting the city, determining the best location in the city,
selecting a partner, training local teams and monitoring, managing and supporting the administration of these units. This is
the major competitive advantage for implementing new units, whether in the on-campus or distance learning segment, and
the positive results achieved by Kroton’s campuses and centers to date show that we are fully prepared to successfully deliver
this organic growth.
Having at Kroton people who truly understand education certainly continues to help us make the right strategic decisions.
That was the case of the acquisition of Unopar and the merger with Anhanguera, which were ideal partners for building the
Company we are today. Likewise, we are convinced that the acquisition of a controlling interest in Somos Educação (Somos)
by our holding company Saber, which was created exclusively to manage our Primary & Secondary Education assets, also has
the potential to become a new milestone in our history. More than that, the operation represents a return to our origins,
given that Kroton operated exclusively in the Primary & Secondary Education segment since its creation in 1966 up until 2001,
when it first began offering programs in Postsecondary Education. But our determination to strengthen our presence in th is
segment at this time was a very conscious decision. Some two years ago, we decided to conduct a more in-depth study of
this market and, after a comprehensive analysis, we began forming the management team and made the strategic decision
to grow in the segment. Somos is, without a doubt, the best partner for this new milestone in our history. The transaction is
subject to typical precedent conditions and must be submitted for analysis by Brazil's antitrust authority (CADE). If approved,
the acquisition will enable the creation of an educational platform with relevant operations in various segments. Moreover,
given the high degree of complementarity, we will be able to diversify our markets and revenue sources, opening up a new
growth avenue.
In a country that so desperately needs Education to sustain its development and reduce inequality, we will continue to work
tirelessly to do our part. To achieve that, we have over 26,000 employees who are fully engaged in transforming the lives of
our students.
4
EARNINGS RELEASE 1Q18
POSTSECONDARY EDUCATION
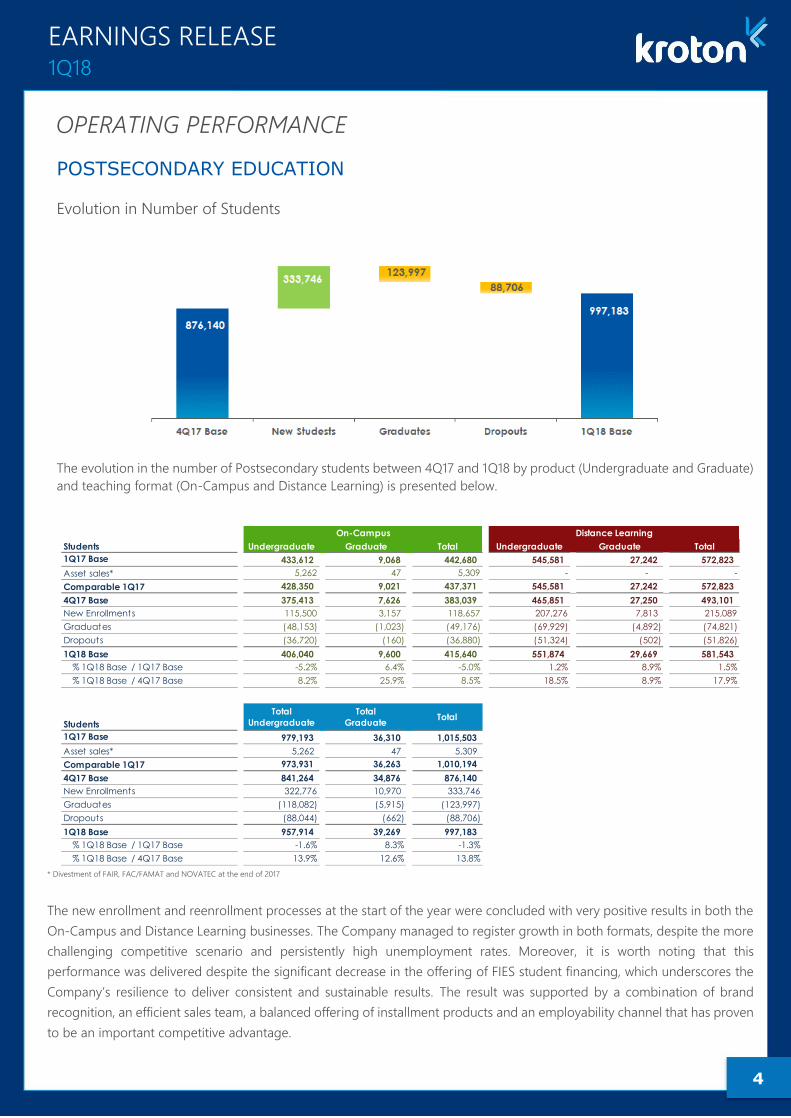
Evolution in Number of Students
The evolution in the number of Postsecondary students between 4Q17 and 1Q18 by product (Undergraduate and Graduate)
and teaching format (On-Campus and Distance Learning) is presented below.
* Divestment of FAIR, FAC/FAMAT and NOVATEC at the end of 2017
The new enrollment and reenrollment processes at the start of the year were concluded with very positive results in both the
On-Campus and Distance Learning businesses. The Company managed to register growth in both formats, despite the more
challenging competitive scenario and persistently high unemployment rates. Moreover, it is worth noting that this
performance was delivered despite the significant decrease in the offering of FIES student financing, which underscores the
Company’s resilience to deliver consistent and sustainable results. The result was supported by a combination of brand
recognition, an efficient sales team, a balanced offering of installment products and an employability channel that has proven
to be an important competitive advantage.
Students Undergraduate Graduate Total Undergraduate Graduate Total
1Q17 Base 433,612 9,068 442,680 545,581 27,242 572,823
Asset sales* 5,262 47 5,309 - - -
Comparable 1Q17 428,350 9,021 437,371 545,581 27,242 572,823
4Q17 Base 375,413 7,626 383,039 465,851 27,250 493,101
New Enrollments 115,500 3,157 118,657 207,276 7,813 215,089
Graduates (48,153) (1,023) (49,176) (69,929) (4,892) (74,821)
Dropouts (36,720) (160) (36,880) (51,324) (502) (51,826)
1Q18 Base 406,040 9,600 415,640 551,874 29,669 581,543
% 1Q18 Base / 1Q17 Base -5.2% 6.4% -5.0% 1.2% 8.9% 1.5%
% 1Q18 Base / 4Q17 Base 8.2% 25.9% 8.5% 18.5% 8.9% 17.9%
Students
1Q17 Base 979,193 36,310 1,015,503
Asset sales* 5,262 47 5,309
Comparable 1Q17 973,931 36,263 1,010,194
4Q17 Base 841,264 34,876 876,140
New Enrollments 322,776 10,970 333,746
Graduates (118,082) (5,915) (123,997)
Dropouts (88,044) (662) (88,706)
1Q18 Base 957,914 39,269 997,183
% 1Q18 Base / 1Q17 Base -1.6% 8.3% -1.3%
% 1Q18 Base / 4Q17 Base 13.9% 12.6% 13.8%
On-Campus Distance Learning
Total
Undergraduate
Total
GraduateTotal
OPERATING PERFORMANCE
5
EARNINGS RELEASE 1Q18
Overall, 322,800 new Undergraduate students were added, or 3.4% more than in the same period of 2017. This result reflects:
(i) the new programs being launched in both the On-Campus segment (especially in medical and engineering fields) and
Premium DL, which have helped to expand the product offering and addressable market; (ii) the offering of installment plans,
including the Private Special Installment Plan (PEP) and Late-Enrollment Installment Program (PMT), which can be considered
efficient student-recruiting tools; (iii) the good performance of new students paying out of pocket, which currently account
for the majority of freshmen; and (iv) the new campuses and centers opened in recent months, which, despite their low
significance in the first student-recruiting processes, will be important drivers of future growth.
The re-enrollment process (enrollments of students in the second to last academic semesters) also achieved very solid results
considering the market conditions faced in the period, registering a decline of 4% from the same period last year, a level
much lower than the increase in graduations which occurred before the start of this semester (+12% compared to 1Q17).
Considering only Graduate programs, the student base expanded 8.3% on the year-ago period, supported by the enrollment
of almost 11,000 new students coming mainly from Distance Learning programs, which more than offset the significant number
of graduations, of approximately 6,000 students in total. Bear in mind that the LFG brand also offers Graduate programs,
whose students are included in the above table.
Considering these results, the Company ended the quarter with nearly one million Postsecondary students (Undergraduate
and Graduate) in the On-Campus and Distance Learning segments combined, representing a slight reduction of 1.3% from
the same period last year and demonstrating the resilience of Kroton’s operations in a still-adverse scenario, with increased
competition, economic uncertainty and a higher number of graduations. Compared to 4Q17, the student base expanded
13.8%, supported by the solid student-recruiting process at the start of the year. Broken down by teaching format, the On-
Campus student base accounted for 42% of the total student base in the quarter, while the Distance Learning student base
accounted for 58%.
Note that the admissions and reenrollment processes for the second semester of 2018 already have begun and that Kroton
remains focused on maintaining its high academic standards, while strengthening its organic growth strategies, with the
opening of new On-Campus units and new Distance Learning centers, besides strengthening its brands and sales actions to
deliver growing results in student recruiting and retention.
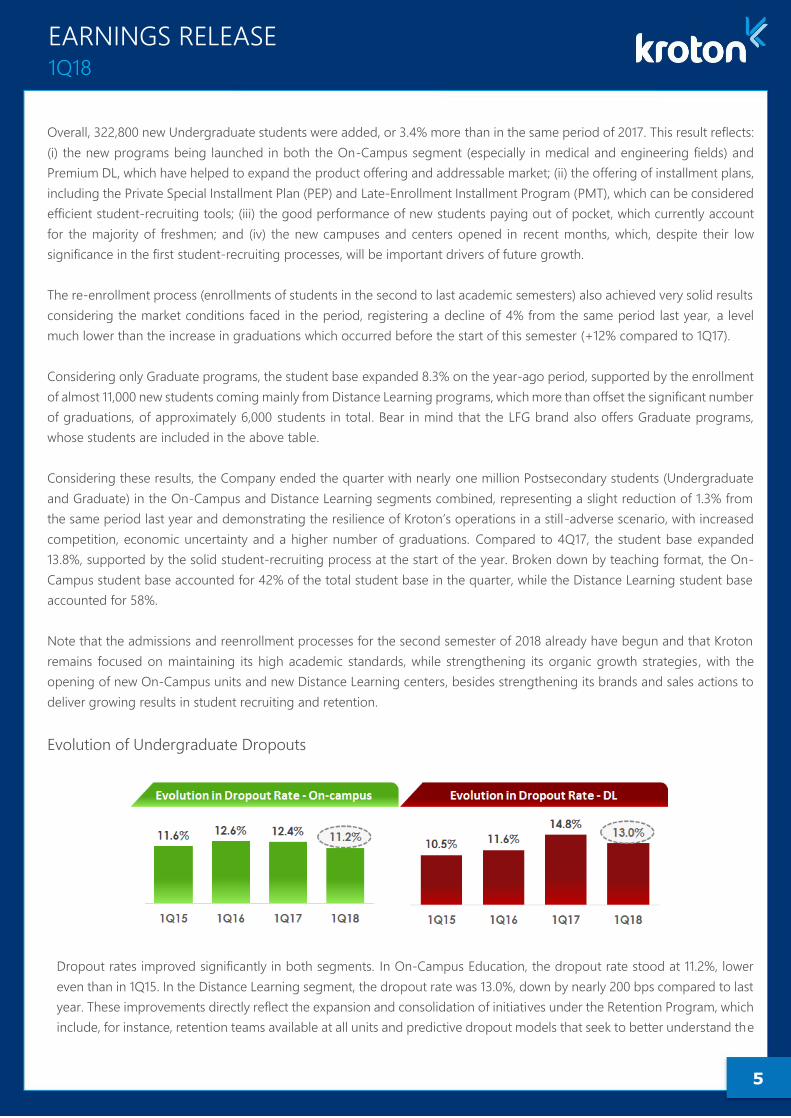
Evolution of Undergraduate Dropouts
Dropout rates improved significantly in both segments. In On-Campus Education, the dropout rate stood at 11.2%, lower
even than in 1Q15. In the Distance Learning segment, the dropout rate was 13.0%, down by nearly 200 bps compared to last
year. These improvements directly reflect the expansion and consolidation of initiatives under the Retention Program, which
include, for instance, retention teams available at all units and predictive dropout models that seek to better understand the

6
EARNINGS RELEASE 1Q18
profile of Kroton’s students, aiming to identify and determine the dropout likelihood and treat the causes beforehand. Note
that this decrease in dropout rates occurred despite the change in the profile of the student base in both segments, which
makes the result in the period even more significant and reinforces the importance and success of the initiatives
implemented to improve this indicator.
FIES
Number of FIES Students
At the end of 1Q18, Kroton had 116,628 students enrolled with FIES financing, substantially fewer than in the same period of
2017, which confirms the lower share of FIES in recent student-recruiting cycles, as well as highlighting the higher number
of graduations of seniors with FIES financing. To illustrate this behavior, in the latest student-recruiting cycle, FIES accounted
for less than 3% of new enrollments in On-Campus Undergraduate programs and for only 1% of total Undergraduate new
enrollments. Moreover, the number of graduations of FIES students before the start of this semester was one of the highest
of recent years, which indicates that the program should account for a declining share of students over the coming years.
As a result, the penetration of students with FIES financing decreased 10.8 p.p. from the previous year, accounting for 28.7%
of the On-Campus Undergraduate student base, or 12.2% of the total Undergraduate student base.
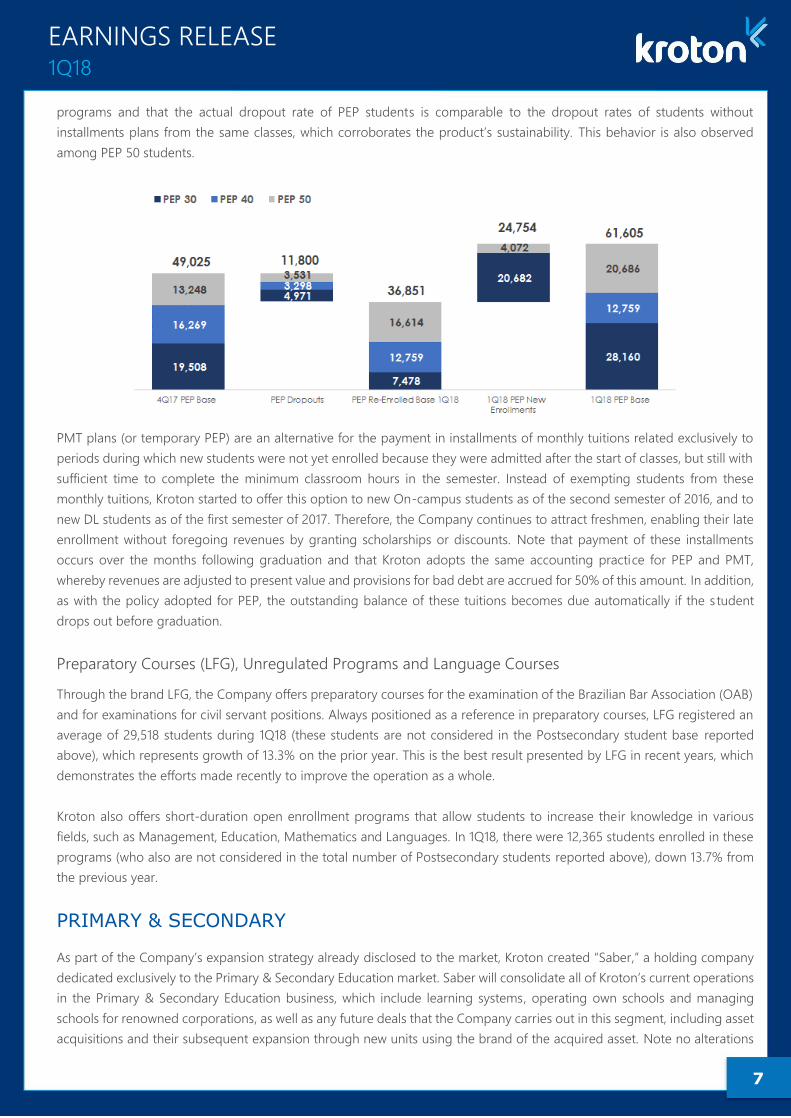
Private Special Installment Plan (PEP) and Late Enrollment Installment Plan (PMT)
At the end of 1Q18, Kroton had 61,605 students enrolled in PEP programs, of which 47,500 enrolled in PEP30 and 14,100 in
PEP50. In the most recent student-recruiting process, 24,754 new students were enrolled using PEP plans (PEP30 and PEP50),
representing approximately 21% of On-Campus new enrollments. This level was above that of the second semester of last
year and is in line with the commercial strategy adopted for the segment.
Remember that Kroton adopts a conservative approach for revenue recognition and provisioning for PEP students, which
includes Adjustment to Present Value (APV) of revenues and provisioning for bad debt equivalent to 50% of the amount
paid in installments by PEP students, as has been done since the launch of the program.
As already presented throughout 2017, the following analysis shows the evolution in the PEP30 student base, including the
number of students who migrated from PEP30 (who paid 30% of tuitions during the contract’s first year) to PEP40 and
PEP50 (who began paying 40% and 50% of tuitions during the contract’s second and third years, respectively), in accordance
with the plans’ rules. Likewise, students who re-enrolled and remained with PEP30 are those admitted in 3Q17 and who will
migrate to PEP40 in 3Q18. Furthermore, note that the dropout curve is naturally higher during the first semesters of academic
7
EARNINGS RELEASE 1Q18
programs and that the actual dropout rate of PEP students is comparable to the dropout rates of students without
installments plans from the same classes, which corroborates the product’s sustainability. This behavior is also observed
among PEP 50 students.
PMT plans (or temporary PEP) are an alternative for the payment in installments of monthly tuitions related exclusively to
periods during which new students were not yet enrolled because they were admitted after the start of classes, but still with
sufficient time to complete the minimum classroom hours in the semester. Instead of exempting students from these
monthly tuitions, Kroton started to offer this option to new On-campus students as of the second semester of 2016, and to
new DL students as of the first semester of 2017. Therefore, the Company continues to attract freshmen, enabling their late
enrollment without foregoing revenues by granting scholarships or discounts. Note that payment of these installments
occurs over the months following graduation and that Kroton adopts the same accounting practice for PEP and PMT,
whereby revenues are adjusted to present value and provisions for bad debt are accrued for 50% of this amount. In addition,
as with the policy adopted for PEP, the outstanding balance of these tuitions becomes due automatically if the s tudent
drops out before graduation.
Preparatory Courses (LFG), Unregulated Programs and Language Courses
Through the brand LFG, the Company offers preparatory courses for the examination of the Brazilian Bar Association (OAB)
and for examinations for civil servant positions. Always positioned as a reference in preparatory courses, LFG registered an
average of 29,518 students during 1Q18 (these students are not considered in the Postsecondary student base reported
above), which represents growth of 13.3% on the prior year. This is the best result presented by LFG in recent years, which
demonstrates the efforts made recently to improve the operation as a whole.
Kroton also offers short-duration open enrollment programs that allow students to increase their knowledge in various
fields, such as Management, Education, Mathematics and Languages. In 1Q18, there were 12,365 students enrolled in these
programs (who also are not considered in the total number of Postsecondary students reported above), down 13.7% from
the previous year.
PRIMARY & SECONDARY
As part of the Company’s expansion strategy already disclosed to the market, Kroton created “Saber,” a holding company
dedicated exclusively to the Primary & Secondary Education market. Saber will consolidate all of Kroton’s current operations
in the Primary & Secondary Education business, which include learning systems, operating own schools and managing
schools for renowned corporations, as well as any future deals that the Company carries out in this segment, including asset
acquisitions and their subsequent expansion through new units using the brand of the acquired asset. Note no alterations
8
EARNINGS RELEASE 1Q18
will be made to the educational projects of institutions under Saber, since they concentrate a large part of the value
attributed to the brand.
Through the Pitágoras Network, which offers Learning Systems, including textbook collections, teacher training, education;
assessments and other services to private schools in the Pre-School, Primary & Secondary Education, Saber serves a total
of 687 Associated Schools and approximately 227,000 students in the private sector, which represent increases of 2.2% and
3.1% compared to last year, respectively.
In April, Saber concluded its first acquisition, of Centro Educacional Leonardo Da Vinci (“CELV”). Founded in the 1990s and
located in Vitória, Espírito Santo, CELV has unique facilities and serves 1,311 students (December 2017 base), 71% of whom
are enrolled in full-time programs. With a strong focus on quality, CELV placed first in the state’s ENEM examination for six
times in recent years, and offers a bilingual program from pre school to secondary school, including the option of a high
school diploma that facilitates acceptance by U.S. universities.
More recently, on April 22, Saber announced the signing of an agreement to acquire a controlling interest in Somos
Educação S.A., which has complementary operations, offering a wide array of high-quality products and services in Primary
& Secondary Education, including high schools, learning systems, textbooks, publishing houses and language courses. With
the acquisition, Saber will serve 37,000 students in own schools, 25,000 students in language courses, 1.2 million students in
private schools served by learning systems, and reach 33 million students in public schools through the National Textbook
Program (PNLD). Saber will also become an important community of teachers who use its products and services in Brazil,
with approximately 85,000 professionals working in private schools and 1.7 million teachers in public schools.
Saber will be responsible for renowned teaching institutions, such as Pitágoras, PH, Anglo, Red Balloon, and publishing
houses, such as Ática, Scipione and Saraiva, among others, with a nationwide presence in all Brazilian states.
The consummation of the transaction is subject to evaluation and prior approval by Brazil's antitrust authority (CADE). Until
all due validations are obtained and the operation is approved by the regulatory agency, the companies wi ll continue to
operate independently.
9
EARNINGS RELEASE 1Q18
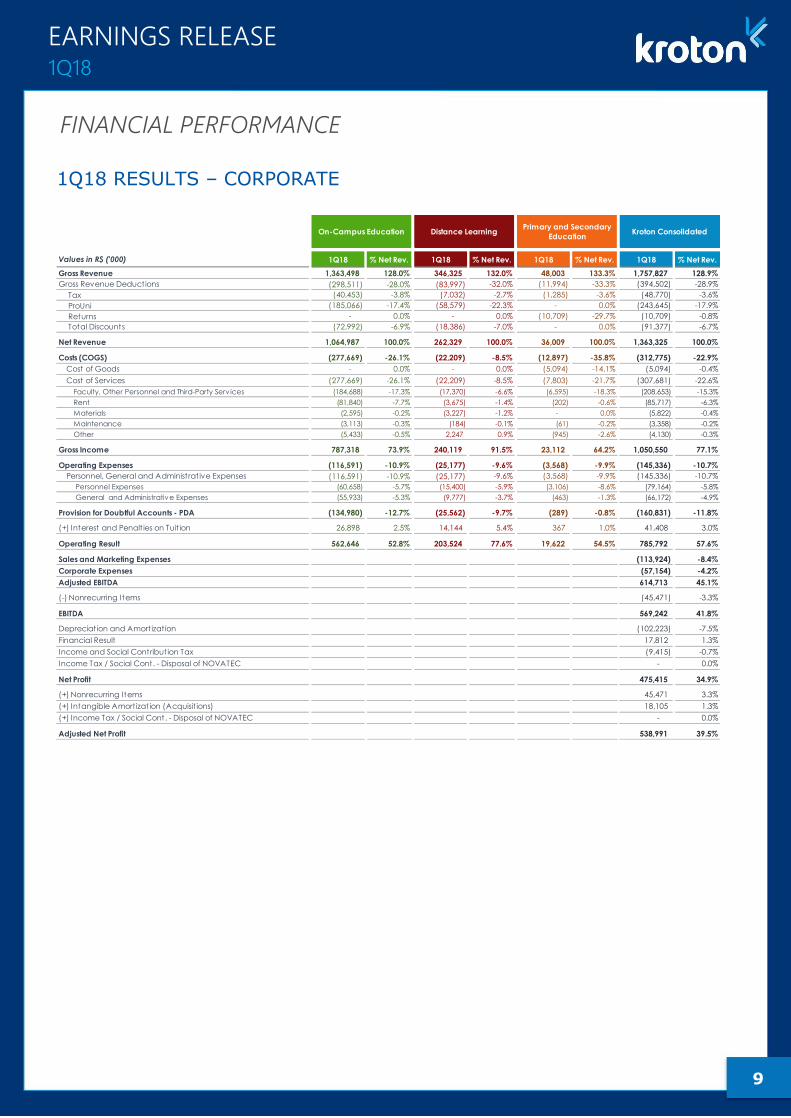
1Q18 RESULTS – CORPORATE
Values in R$ ('000) 1Q18 % Net Rev. 1Q18 % Net Rev. 1Q18 % Net Rev. 1Q18 % Net Rev.
Gross Revenue 1,363,498 128.0% 346,325 132.0% 48,003 133.3% 1,757,827 128.9%
Gross Revenue Deductions (298,511) -28.0% (83,997) -32.0% (11,994) -33.3% (394,502) -28.9%
Tax (40,453) -3.8% (7,032) -2.7% (1,285) -3.6% (48,770) -3.6%
ProUni (185,066) -17.4% (58,579) -22.3% - 0.0% (243,645) -17.9%
Returns - 0.0% - 0.0% (10,709) -29.7% (10,709) -0.8%
Total Discounts (72,992) -6.9% (18,386) -7.0% - 0.0% (91,377) -6.7%
Net Revenue 1,064,987 100.0% 262,329 100.0% 36,009 100.0% 1,363,325 100.0%
Costs (COGS) (277,669) -26.1% (22,209) -8.5% (12,897) -35.8% (312,775) -22.9%
Cost of Goods - 0.0% - 0.0% (5,094) -14.1% (5,094) -0.4%
Cost of Services (277,669) -26.1% (22,209) -8.5% (7,803) -21.7% (307,681) -22.6%
Faculty, Other Personnel and Third-Party Serv ices (184,688) -17.3% (17,370) -6.6% (6,595) -18.3% (208,653) -15.3%
Rent (81,840) -7.7% (3,675) -1.4% (202) -0.6% (85,717) -6.3%
Materials (2,595) -0.2% (3,227) -1.2% - 0.0% (5,822) -0.4%
Maintenance (3,113) -0.3% (184) -0.1% (61) -0.2% (3,358) -0.2%
Other (5,433) -0.5% 2,247 0.9% (945) -2.6% (4,130) -0.3%
Gross Income 787,318 73.9% 240,119 91.5% 23,112 64.2% 1,050,550 77.1%
Operating Expenses (116,591) -10.9% (25,177) -9.6% (3,568) -9.9% (145,336) -10.7%
Personnel, General and Administrat ive Expenses (116,591) -10.9% (25,177) -9.6% (3,568) -9.9% (145,336) -10.7%
Personnel Expenses (60,658) -5.7% (15,400) -5.9% (3,106) -8.6% (79,164) -5.8%
General and Administrative Expenses (55,933) -5.3% (9,777) -3.7% (463) -1.3% (66,172) -4.9%
Provision for Doubtful Accounts - PDA (134,980) -12.7% (25,562) -9.7% (289) -0.8% (160,831) -11.8%
(+) Interest and Penalt ies on Tuit ion 26,898 2.5% 14,144 5.4% 367 1.0% 41,408 3.0%
Operating Result 562,646 52.8% 203,524 77.6% 19,622 54.5% 785,792 57.6%
Sales and Marketing Expenses (113,924) -8.4%
Corporate ExpensesC
o(57,154) -4.2%
Adjusted EBITDA 614,713 45.1%
(-) Nonrecurring Items (45,471) -3.3%
EBITDA 569,242 41.8%
Depreciat ion and Amort izat ion (102,223) -7.5%
Financial Result 17,812 1.3%
Income and Social Contribut ion Tax (9,415) -0.7%
Income Tax / Social Cont. - Disposal of NOVATEC - 0.0%
Net Profit 475,415 34.9%
(+) Nonrecurring Items 45,471 3.3%
(+) Intangible Amort izat ion (Acquisit ions) 18,105 1.3%
(+) Income Tax / Social Cont. - Disposal of NOVATEC - 0.0%
Adjusted Net Profit 538,991 39.5%
On-Campus Education Distance LearningPrimary and Secondary
EducationKroton Consolidated
FINANCIAL PERFORMANCE
10
EARNINGS RELEASE 1Q18
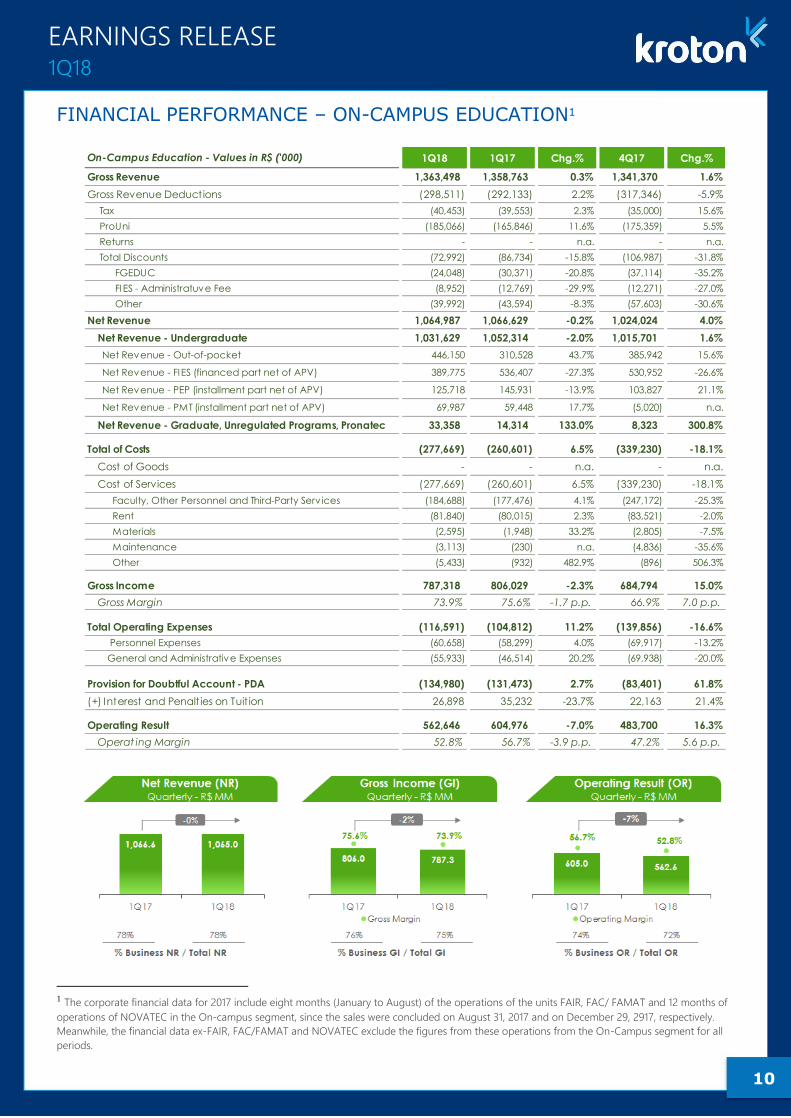
FINANCIAL PERFORMANCE – ON-CAMPUS EDUCATION1
1 The corporate financial data for 2017 include eight months (January to August) of the operations of the units FAIR, FAC/ FAMAT and 12 months of
operations of NOVATEC in the On-campus segment, since the sales were concluded on August 31, 2017 and on December 29, 2917, respectively.
Meanwhile, the financial data ex-FAIR, FAC/FAMAT and NOVATEC exclude the figures from these operations from the On-Campus segment for all
periods.
On-Campus Education - Values in R$ ('000) 1Q18 1Q17 Chg.% 4Q17 Chg.%
Gross Revenue 1,363,498 1,358,763 0.3% 1,341,370 1.6%
Gross Revenue Deductions (298,511) (292,133) 2.2% (317,346) -5.9%
Tax (40,453) (39,553) 2.3% (35,000) 15.6%
ProUni (185,066) (165,846) 11.6% (175,359) 5.5%
Returns - - n.a. - n.a.
Total Discounts (72,992) (86,734) -15.8% (106,987) -31.8%
FGEDUC (24,048) (30,371) -20.8% (37,114) -35.2%
FIES - Administratuve Fee (8,952) (12,769) -29.9% (12,271) -27.0%
Other (39,992) (43,594) -8.3% (57,603) -30.6%
Net Revenue 1,064,987 1,066,629 -0.2% 1,024,024 4.0%
Net Revenue - Undergraduate 1,031,629 1,052,314 -2.0% 1,015,701 1.6%
Net Revenue - Out-of-pocket 446,150 310,528 43.7% 385,942 15.6%
Net Revenue - FIES (financed part net of APV) 389,775 536,407 -27.3% 530,952 -26.6%
Net Revenue - PEP (installment part net of APV) 125,718 145,931 -13.9% 103,827 21.1%
Net Revenue - PMT (installment part net of APV) 69,987 59,448 17.7% (5,020) n.a.
Net Revenue - Graduate, Unregulated Programs, Pronatec 33,358 14,314 133.0% 8,323 300.8%
Total of Costs (277,669) (260,601) 6.5% (339,230) -18.1%
Cost of Goods - - n.a. - n.a.
Cost of Services (277,669) (260,601) 6.5% (339,230) -18.1%
Faculty, Other Personnel and Third-Party Serv ices (184,688) (177,476) 4.1% (247,172) -25.3%
Rent (81,840) (80,015) 2.3% (83,521) -2.0%
Materials (2,595) (1,948) 33.2% (2,805) -7.5%
Maintenance (3,113) (230) n.a. (4,836) -35.6%
Other (5,433) (932) 482.9% (896) 506.3%
Gross Income 787,318 806,029 -2.3% 684,794 15.0%
Gross Margin 73.9% 75.6% -1.7 p.p. 66.9% 7.0 p.p.
Total Operating Expenses (116,591) (104,812) 11.2% (139,856) -16.6%
Personnel Expenses (60,658) (58,299) 4.0% (69,917) -13.2%
General and Administrative Expenses (55,933) (46,514) 20.2% (69,938) -20.0%
Provision for Doubtful Account - PDA (134,980) (131,473) 2.7% (83,401) 61.8%
(+) Interest and Penalt ies on Tuit ion 26,898 35,232 -23.7% 22,163 21.4%
Operating Result 562,646 604,976 -7.0% 483,700 16.3%
Operat ing Margin 52.8% 56.7% -3.9 p.p. 47.2% 5.6 p.p.
11
EARNINGS RELEASE 1Q18
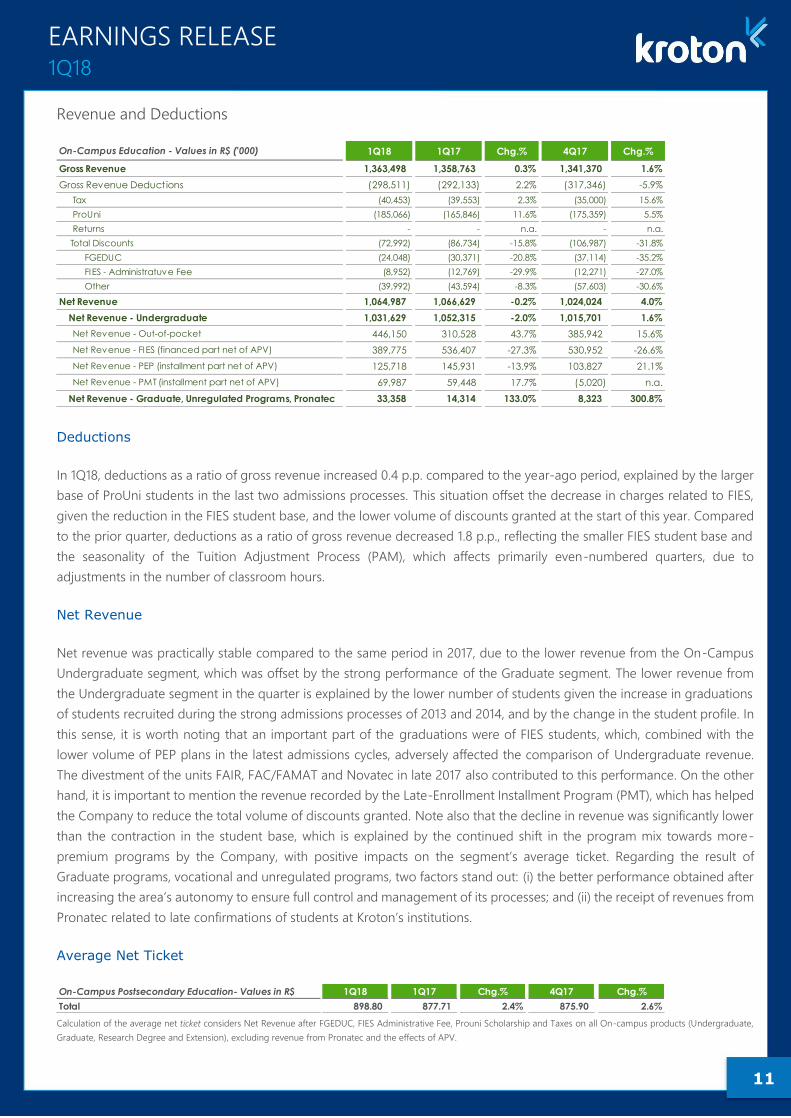
Revenue and Deductions
Deductions
In 1Q18, deductions as a ratio of gross revenue increased 0.4 p.p. compared to the year-ago period, explained by the larger
base of ProUni students in the last two admissions processes. This situation offset the decrease in charges related to FIES,
given the reduction in the FIES student base, and the lower volume of discounts granted at the start of this year. Compared
to the prior quarter, deductions as a ratio of gross revenue decreased 1.8 p.p., reflecting the smaller FIES student base and
the seasonality of the Tuition Adjustment Process (PAM), which affects primarily even-numbered quarters, due to
adjustments in the number of classroom hours.
Net Revenue
Net revenue was practically stable compared to the same period in 2017, due to the lower revenue from the On-Campus
Undergraduate segment, which was offset by the strong performance of the Graduate segment. The lower revenue from
the Undergraduate segment in the quarter is explained by the lower number of students given the increase in graduations
of students recruited during the strong admissions processes of 2013 and 2014, and by the change in the student profile. In
this sense, it is worth noting that an important part of the graduations were of FIES students, which, combined with the
lower volume of PEP plans in the latest admissions cycles, adversely affected the comparison of Undergraduate revenue.
The divestment of the units FAIR, FAC/FAMAT and Novatec in late 2017 also contributed to this performance. On the other
hand, it is important to mention the revenue recorded by the Late-Enrollment Installment Program (PMT), which has helped
the Company to reduce the total volume of discounts granted. Note also that the decline in revenue was significantly lower
than the contraction in the student base, which is explained by the continued shift in the program mix towards more-
premium programs by the Company, with positive impacts on the segment’s average ticket. Regarding the result of
Graduate programs, vocational and unregulated programs, two factors stand out: (i) the better performance obtained after
increasing the area’s autonomy to ensure full control and management of its processes; and (ii) the receipt of revenues from
Pronatec related to late confirmations of students at Kroton’s institutions.
Average Net Ticket
Calculation of the average net ticket considers Net Revenue after FGEDUC, FIES Administrative Fee, Prouni Scholarship and Taxes on all On-campus products (Undergraduate,
Graduate, Research Degree and Extension), excluding revenue from Pronatec and the effects of APV.
On-Campus Education - Values in R$ ('000) 1Q18 1Q17 Chg.% 4Q17 Chg.%
Gross Revenue 1,363,498 1,358,763 0.3% 1,341,370 1.6%
Gross Revenue Deductions (298,511) (292,133) 2.2% (317,346) -5.9%
Tax (40,453) (39,553) 2.3% (35,000) 15.6%
ProUni (185,066) (165,846) 11.6% (175,359) 5.5%
Returns - - n.a. - n.a.
Total Discounts (72,992) (86,734) -15.8% (106,987) -31.8%
FGEDUC (24,048) (30,371) -20.8% (37,114) -35.2%
FIES - Administratuve Fee (8,952) (12,769) -29.9% (12,271) -27.0%
Other (39,992) (43,594) -8.3% (57,603) -30.6%
Net Revenue 1,064,987 1,066,629 -0.2% 1,024,024 4.0%
Net Revenue - Undergraduate 1,031,629 1,052,315 -2.0% 1,015,701 1.6%
Net Revenue - Out-of-pocket 446,150 310,528 43.7% 385,942 15.6%
Net Revenue - FIES (financed part net of APV) 389,775 536,407 -27.3% 530,952 -26.6%
Net Revenue - PEP (installment part net of APV) 125,718 145,931 -13.9% 103,827 21.1%
Net Revenue - PMT (installment part net of APV) 69,987 59,448 17.7% (5,020) n.a.
Net Revenue - Graduate, Unregulated Programs, Pronatec 33,358 14,314 133.0% 8,323 300.8%
On-Campus Postsecondary Education- Values in R$ 1Q18 1Q17 Chg.% 4Q17 Chg.%
Total 898.80 877.71 2.4% 875.90 2.6%
12
EARNINGS RELEASE 1Q18
For a better understanding, the calculation of Kroton’s average ticket considers the number of students effectively billed in
the period (including ProUni students), since, due to retroactive contract amendments, a student could be billed more than
once in a certain month. The net average ticket of On-Campus programs in 1Q18 was R$898.80, an increase of 2.4% from
the year-ago period, reflecting the annual adjustment of monthly tuitions and the increased share of programs with higher
tickets in the base. In this sense, it is worth reinforcing that, in the student-recruiting process at the start of the year, new
students enrolling in programs in the fields of engineering and medicine once again accounted for over 50% of total new
enrollments. However, this increase in the average ticket lagged inflation in the period, reflecting a different composition of
the mix of new students, with a smaller share of PEP and PMT students (whose tickets do not include discounts), and the
temporal effect of ProUni, which has a faster enrollment and re-enrollment cycle compared to other students. Excluding this
impact, the effect on the average ticket would have been higher, which should become clearer in the results for the second
quarter.
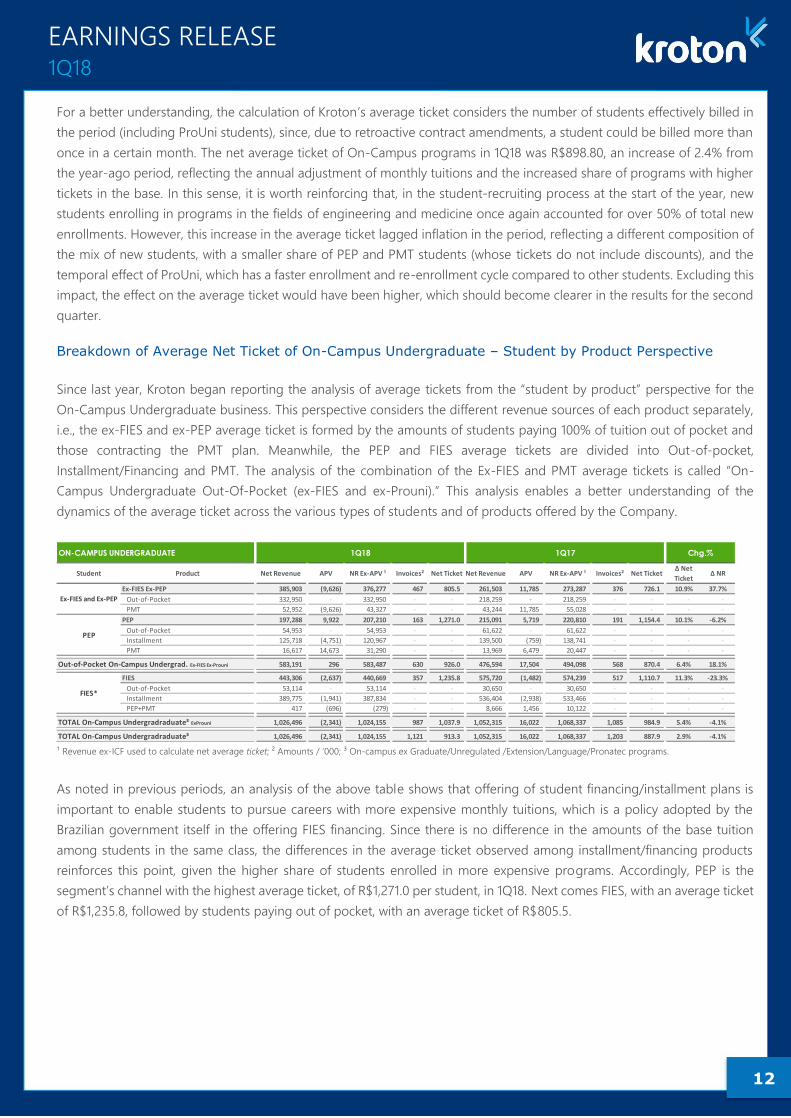
Breakdown of Average Net Ticket of On-Campus Undergraduate – Student by Product Perspective
Since last year, Kroton began reporting the analysis of average tickets from the “student by product” perspective for the
On-Campus Undergraduate business. This perspective considers the different revenue sources of each product separately,
i.e., the ex-FIES and ex-PEP average ticket is formed by the amounts of students paying 100% of tuition out of pocket and
those contracting the PMT plan. Meanwhile, the PEP and FIES average tickets are divided into Out-of-pocket,
Installment/Financing and PMT. The analysis of the combination of the Ex-FIES and PMT average tickets is called “On-
Campus Undergraduate Out-Of-Pocket (ex-FIES and ex-Prouni).” This analysis enables a better understanding of the
dynamics of the average ticket across the various types of students and of products offered by the Company.
¹ Revenue ex-ICF used to calculate net average ticket; ² Amounts / ‘000; ³ On-campus ex Graduate/Unregulated /Extension/Language/Pronatec programs.
As noted in previous periods, an analysis of the above table shows that offering of student financing/installment plans is
important to enable students to pursue careers with more expensive monthly tuitions, which is a policy adopted by the
Brazilian government itself in the offering FIES financing. Since there is no difference in the amounts of the base tuition
among students in the same class, the differences in the average ticket observed among installment/financing products
reinforces this point, given the higher share of students enrolled in more expensive programs. Accordingly, PEP is the
segment’s channel with the highest average ticket, of R$1,271.0 per student, in 1Q18. Next comes FIES, with an average ticket
of R$1,235.8, followed by students paying out of pocket, with an average ticket of R$805.5.
Student Product Net Revenue APV NR Ex-APV ¹ Invoices² Net Ticket Net Revenue APV NR Ex-APV ¹ Invoices² Net TicketΔ Net
TicketΔ NR
Ex-FIES Ex-PEP 385,903 (9,626) 376,277 467 805.5 261,503 11,785 273,287 376 726.1 10.9% 37.7%
Out-of-Pocket 332,950 - 332,950 - - 218,259 - 218,259 - - - -
PMT 52,952 (9,626) 43,327 - - 43,244 11,785 55,028 - - - -
PEP 197,288 9,922 207,210 163 1,271.0 215,091 5,719 220,810 191 1,154.4 10.1% -6.2%
Out-of-Pocket 54,953 - 54,953 - - 61,622 - 61,622 - - - -
Installment 125,718 (4,751) 120,967 - - 139,500 (759) 138,741 - - - -
PMT 16,617 14,673 31,290 - - 13,969 6,479 20,447 - - - -
583,191 296 583,487 630 926.0 476,594 17,504 494,098 568 870.4 6.4% 18.1%
FIES 443,306 (2,637) 440,669 357 1,235.8 575,720 (1,482) 574,239 517 1,110.7 11.3% -23.3%
Out-of-Pocket 53,114 - 53,114 - - 30,650 - 30,650 - - - -
Installment 389,775 (1,941) 387,834 - - 536,404 (2,938) 533,466 - - - -
PEP+PMT 417 (696) (279) - - 8,666 1,456 10,122 - - - -
1,026,496 (2,341) 1,024,155 987 1,037.9 1,052,315 16,022 1,068,337 1,085 984.9 5.4% -4.1%
1,026,496 (2,341) 1,024,155 1,121 913.3 1,052,315 16,022 1,068,337 1,203 887.9 2.9% -4.1%
Ex-FIES and Ex-PEP
PEP
Out-of-Pocket On-Campus Undergrad. Ex-FIES Ex-Prouni
FIES*
TOTAL On-Campus Undergradraduate³ ExProuni
TOTAL On-Campus Undergradraduate³
ON-CAMPUS UNDERGRADUATE 1Q18 1Q17 Chg.%

13
EARNINGS RELEASE 1Q18
Costs
In 1Q18, cost of services as a ratio of net revenue increased by 1.6 p.p. compared to the same period of 2017. This result
shows the costs related to the expansion projects of the Company, which significantly increased the number of new units in
recent months. This ends up creating additional costs related to both faculty and rent, which are the segment’s main
expenses. Although all efficiency levers are functioning fully, it is only natural to assume that pressures from growth projects
will adversely affect results in the short term. However, initiatives related to implementing the operational research (OR)
software, combined with increased efficiency of faculty allocation and utilization of facilities, in addition to negotiations
related to strategic sourcing, remain the key factors for maintaining an optimized cost structure for the segment. Compared
to the prior quarter, total costs as a ratio of net revenue decreased 7.1 p.p., a result that exceeds the seasonality of the
business and attests to the robustness of the cost controls.
Gross Income
Gross income from On-Campus Education was R$787.3 million in 1Q18, decreasing 2.3% from the same period last year.
The combination of stable revenue and a larger cost structure to support growth projects led to gross margin contraction
of 1.7 p.p. in the period. Compared to the prior quarter, gross margin expanded 7.0 p.p., supported by revenue growth in
the period due to the solid student-recruiting results at the start of the year and by the seasonally lower operating costs.
On-Campus Education - Values in R$ ('000) 1Q18 1Q17 Chg.% 4Q17 Chg.%
Total of Costs (277,669) (260,601) 6.5% (339,230) -18.1%
Cost of Goods (CG) - - n.a. - n.a.
Cost of Services (CS) (277,669) (260,601) 6.5% (339,230) -18.1%
Faculty, Other Personnel and Third-Party Serv ices (184,688) (177,476) 4.1% (247,172) -25.3%
Rent (81,840) (80,015) 2.3% (83,521) -2.0%
Materials (2,595) (1,948) 33.2% (2,805) -7.5%
Maintenance (3,113) (230) n.a. (4,836) -35.6%
Other (5,433) (932) 482.9% (896) 506.3%
% of Net Revenues 1Q18 1Q17 Chg.% 4Q17 Chg.%
Total of Costs -26.1% -24.4% -1.6 p.p. -33.1% 7.1 p.p.
Cost of Goods (CG) 0.0% 0.0% n.a. 0.0% n.a.
Cost of Services (CS) -26.1% -24.4% -1.6 p.p. -33.1% 7.1 p.p.
Faculty, Other Personnel and Third-Party Serv ices -17.3% -16.6% -0.7 p.p. -24.1% 6.8 p.p.
Rent -7.7% -7.5% -0.2 p.p. -8.2% 0.5 p.p.
Materials -0.2% -0.2% -0.1 p.p. -0.3% 0.0 p.p.
Maintenance -0.3% 0.0% -0.3 p.p. -0.5% 0.2 p.p.
Other -0.5% -0.1% -0.4 p.p. -0.1% -0.4 p.p.
On-Campus Education - Values in R$ ('000) 1Q18 1Q17 Chg.% 4Q17 Chg.%
Gross Income 787,318 806,029 -2.3% 684,794 15.0%
Gross Margin 73.9% 75.6% -1.7 p.p. 66.9% 7.0 p.p.
14
EARNINGS RELEASE 1Q18
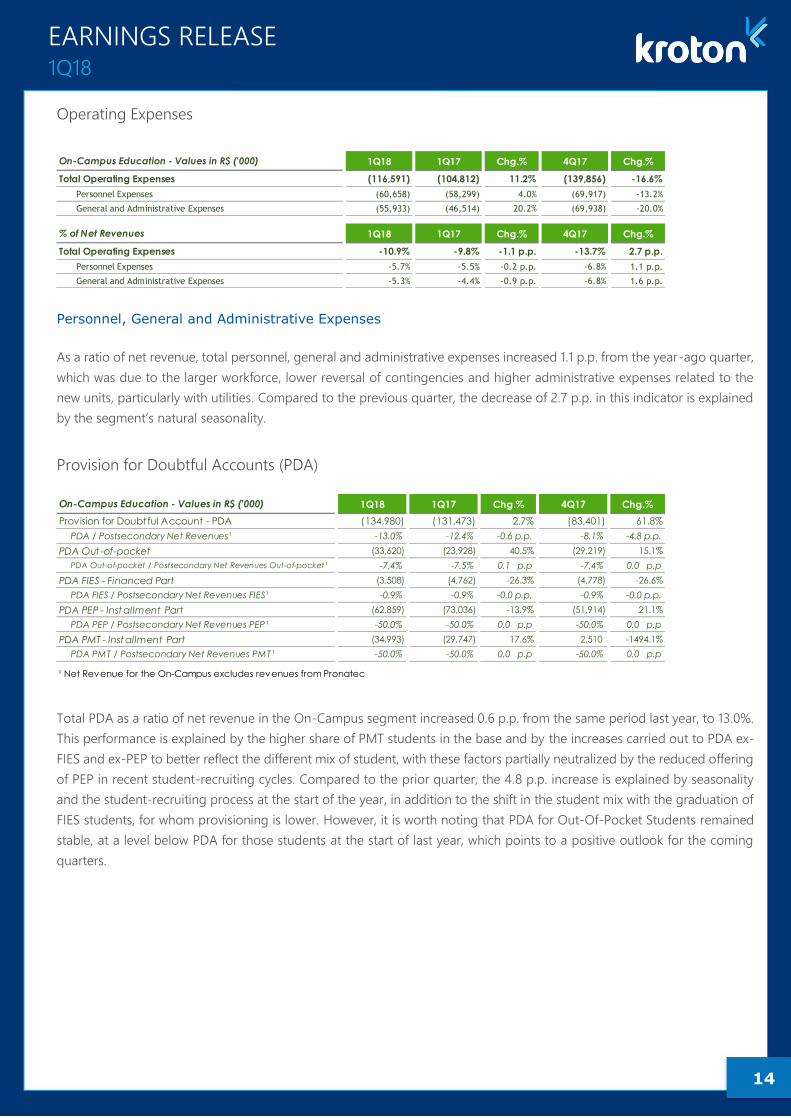
Operating Expenses
Personnel, General and Administrative Expenses
As a ratio of net revenue, total personnel, general and administrative expenses increased 1.1 p.p. from the year-ago quarter,
which was due to the larger workforce, lower reversal of contingencies and higher administrative expenses related to the
new units, particularly with utilities. Compared to the previous quarter, the decrease of 2.7 p.p. in this indicator is explained
by the segment’s natural seasonality.
Provision for Doubtful Accounts (PDA)
Total PDA as a ratio of net revenue in the On-Campus segment increased 0.6 p.p. from the same period last year, to 13.0%.
This performance is explained by the higher share of PMT students in the base and by the increases carried out to PDA ex-
FIES and ex-PEP to better reflect the different mix of student, with these factors partially neutralized by the reduced offering
of PEP in recent student-recruiting cycles. Compared to the prior quarter, the 4.8 p.p. increase is explained by seasonality
and the student-recruiting process at the start of the year, in addition to the shift in the student mix with the graduation of
FIES students, for whom provisioning is lower. However, it is worth noting that PDA for Out-Of-Pocket Students remained
stable, at a level below PDA for those students at the start of last year, which points to a positive outlook for the coming
quarters.
On-Campus Education - Values in R$ ('000) 1Q18 1Q17 Chg.% 4Q17 Chg.%
Total Operating Expenses (116,591) (104,812) 11.2% (139,856) -16.6%
Personnel Expenses (60,658) (58,299) 4.0% (69,917) -13.2%
General and Administrative Expenses (55,933) (46,514) 20.2% (69,938) -20.0%
% of Net Revenues 1Q18 1Q17 Chg.% 4Q17 Chg.%
Total Operating Expenses -10.9% -9.8% -1.1 p.p. -13.7% 2.7 p.p.
Personnel Expenses -5.7% -5.5% -0.2 p.p. -6.8% 1.1 p.p.
General and Administrative Expenses -5.3% -4.4% -0.9 p.p. -6.8% 1.6 p.p.
On-Campus Education - Values in R$ ('000) 1Q18 1Q17 Chg.% 4Q17 Chg.%
Provision for Doubtful Account - PDA (134,980) (131,473) 2.7% (83,401) 61.8%
PDA / Postsecondary Net Revenues¹ -13.0% -12.4% -0.6 p.p. -8.1% -4.8 p.p.
PDA Out -of-pocket (33,620) (23,928) 40.5% (29,219) 15.1%
PDA Out-of-pocket / Postsecondary Net Revenues Out-of-pocket¹ -7.4% -7.5% 0.1 p.p -7.4% 0.0 p.p
PDA FIES - Financed Part (3,508) (4,762) -26.3% (4,778) -26.6%
PDA FIES / Postsecondary Net Revenues FIES¹ -0.9% -0.9% -0.0 p.p. -0.9% -0.0 p.p.
PDA PEP - Inst allment Part (62,859) (73,036) -13.9% (51,914) 21.1%
PDA PEP / Postsecondary Net Revenues PEP¹ -50.0% -50.0% 0.0 p.p -50.0% 0.0 p.p
PDA PMT - Inst allment Part (34,993) (29,747) 17.6% 2,510 -1494.1%
PDA PMT / Postsecondary Net Revenues PMT¹ -50.0% -50.0% 0.0 p.p -50.0% 0.0 p.p
¹ Net Revenue for the On-Campus excludes revenues from Pronatec
15
EARNINGS RELEASE 1Q18
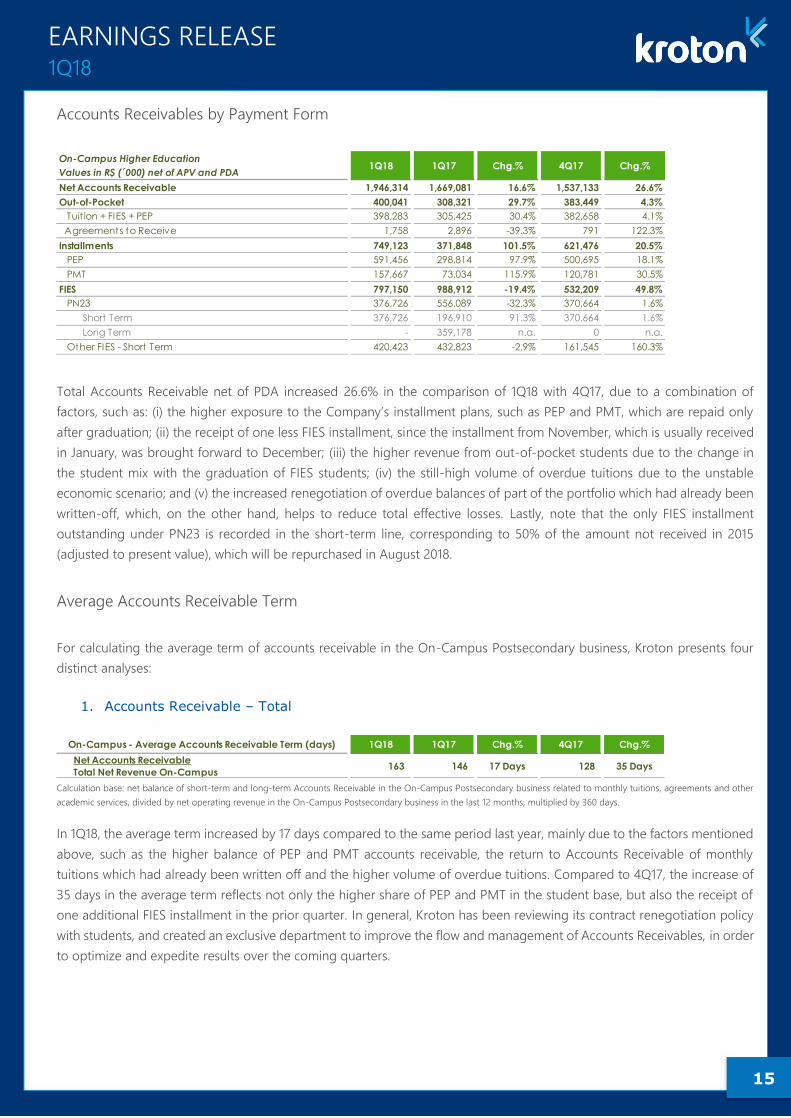
Accounts Receivables by Payment Form
Total Accounts Receivable net of PDA increased 26.6% in the comparison of 1Q18 with 4Q17, due to a combination of
factors, such as: (i) the higher exposure to the Company’s installment plans, such as PEP and PMT, which are repaid only
after graduation; (ii) the receipt of one less FIES installment, since the installment from November, which is usually received
in January, was brought forward to December; (iii) the higher revenue from out-of-pocket students due to the change in
the student mix with the graduation of FIES students; (iv) the still-high volume of overdue tuitions due to the unstable
economic scenario; and (v) the increased renegotiation of overdue balances of part of the portfolio which had already been
written-off, which, on the other hand, helps to reduce total effective losses. Lastly, note that the only FIES installment
outstanding under PN23 is recorded in the short-term line, corresponding to 50% of the amount not received in 2015
(adjusted to present value), which will be repurchased in August 2018.
Average Accounts Receivable Term
For calculating the average term of accounts receivable in the On-Campus Postsecondary business, Kroton presents four
distinct analyses:
1. Accounts Receivable – Total
Calculation base: net balance of short-term and long-term Accounts Receivable in the On-Campus Postsecondary business related to monthly tuitions, agreements and other
academic services, divided by net operating revenue in the On-Campus Postsecondary business in the last 12 months, multiplied by 360 days.
In 1Q18, the average term increased by 17 days compared to the same period last year, mainly due to the factors mentioned
above, such as the higher balance of PEP and PMT accounts receivable, the return to Accounts Receivable of monthly
tuitions which had already been written off and the higher volume of overdue tuitions. Compared to 4Q17, the increase of
35 days in the average term reflects not only the higher share of PEP and PMT in the student base, but also the receipt of
one additional FIES installment in the prior quarter. In general, Kroton has been reviewing its contract renegotiation policy
with students, and created an exclusive department to improve the flow and management of Accounts Receivables, in order
to optimize and expedite results over the coming quarters.
On-Campus Higher Education
Values in R$ (´000) net of APV and PDA1Q18 1Q17 Chg.% 4Q17 Chg.%
Net Accounts Receivable 1,946,314 1,669,081 16.6% 1,537,133 26.6%
Out-of-Pocket 400,041 308,321 29.7% 383,449 4.3%
Tuit ion + FIES + PEP 398,283 305,425 30.4% 382,658 4.1%
Agreements to Receive 1,758 2,896 -39.3% 791 122.3%
Installments 749,123 371,848 101.5% 621,476 20.5%
PEP 591,456 298,814 97.9% 500,695 18.1%
PMT 157,667 73,034 115.9% 120,781 30.5%
FIES 797,150 988,912 -19.4% 532,209 49.8%
PN23 376,726 556,089 -32.3% 370,664 1.6%
Short Term 376,726 196,910 91.3% 370,664 1.6%
Long Term - 359,178 n.a. 0 n.a.
Other FIES - Short Term 420,423 432,823 -2.9% 161,545 160.3%
On-Campus - Average Accounts Receivable Term (days) 1Q18 1Q17 Chg.% 4Q17 Chg.%
Net Accounts Receivable
Total Net Revenue On-Campus163 146 17 Days 128 35 Days
16
EARNINGS RELEASE 1Q18
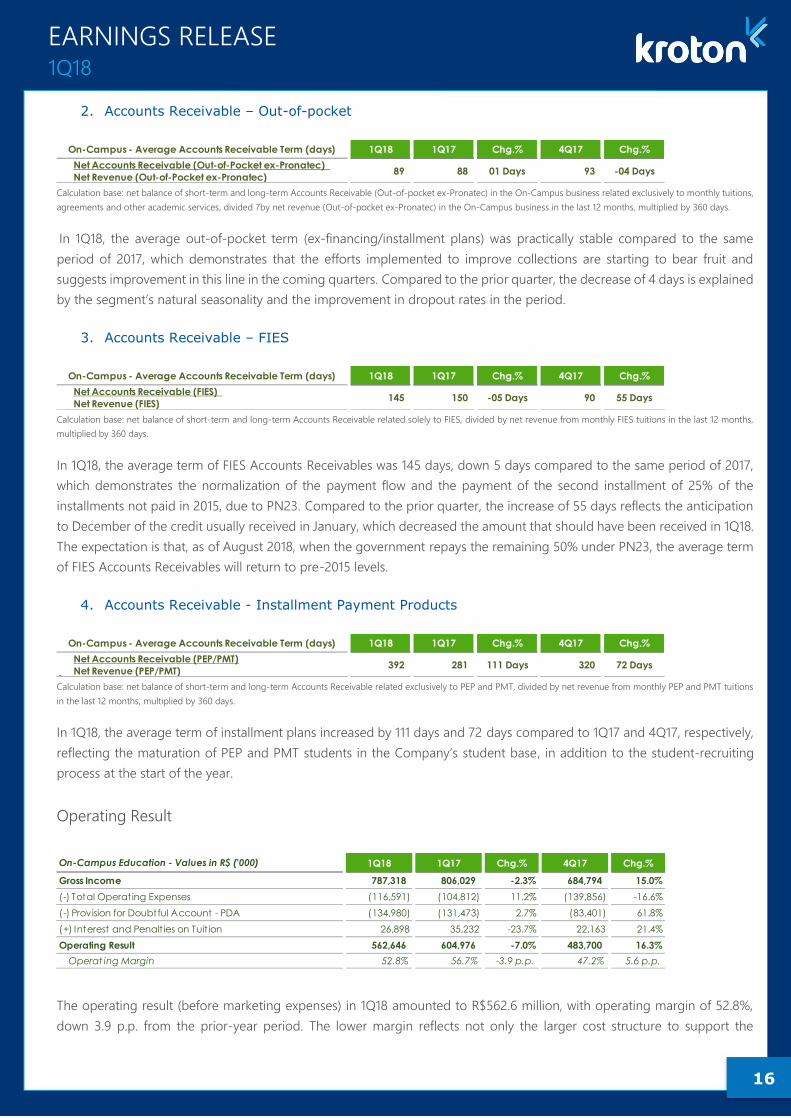
2. Accounts Receivable – Out-of-pocket
Calculation base: net balance of short-term and long-term Accounts Receivable (Out-of-pocket ex-Pronatec) in the On-Campus business related exclusively to monthly tuitions,
agreements and other academic services, divided 7by net revenue (Out-of-pocket ex-Pronatec) in the On-Campus business in the last 12 months, multiplied by 360 days.
In 1Q18, the average out-of-pocket term (ex-financing/installment plans) was practically stable compared to the same
period of 2017, which demonstrates that the efforts implemented to improve collections are starting to bear fruit and
suggests improvement in this line in the coming quarters. Compared to the prior quarter, the decrease of 4 days is explained
by the segment’s natural seasonality and the improvement in dropout rates in the period.
3. Accounts Receivable – FIES
Calculation base: net balance of short-term and long-term Accounts Receivable related solely to FIES, divided by net revenue from monthly FIES tuitions in the last 12 months,
multiplied by 360 days.
In 1Q18, the average term of FIES Accounts Receivables was 145 days, down 5 days compared to the same period of 2017,
which demonstrates the normalization of the payment flow and the payment of the second installment of 25% of the
installments not paid in 2015, due to PN23. Compared to the prior quarter, the increase of 55 days reflects the anticipation
to December of the credit usually received in January, which decreased the amount that should have been received in 1Q18.
The expectation is that, as of August 2018, when the government repays the remaining 50% under PN23, the average term
of FIES Accounts Receivables will return to pre-2015 levels.
4. Accounts Receivable - Installment Payment Products
Calculation base: net balance of short-term and long-term Accounts Receivable related exclusively to PEP and PMT, divided by net revenue from monthly PEP and PMT tuitions
in the last 12 months, multiplied by 360 days.
In 1Q18, the average term of installment plans increased by 111 days and 72 days compared to 1Q17 and 4Q17, respectively,
reflecting the maturation of PEP and PMT students in the Company’s student base, in addition to the student-recruiting
process at the start of the year.
Operating Result
The operating result (before marketing expenses) in 1Q18 amounted to R$562.6 million, with operating margin of 52.8%,
down 3.9 p.p. from the prior-year period. The lower margin reflects not only the larger cost structure to support the
On-Campus - Average Accounts Receivable Term (days) 1Q18 1Q17 Chg.% 4Q17 Chg.%
Net Accounts Receivable (Out-of-Pocket ex-Pronatec)
Net Revenue (Out-of-Pocket ex-Pronatec)89 88 01 Days 93 -04 Days
On-Campus - Average Accounts Receivable Term (days) 1Q18 1Q17 Chg.% 4Q17 Chg.%
Net Accounts Receivable (FIES)
Net Revenue (FIES)145 150 -05 Days 90 55 Days
On-Campus - Average Accounts Receivable Term (days) 1Q18 1Q17 Chg.% 4Q17 Chg.%
Net Accounts Receivable (PEP/PMT)
Net Revenue (PEP/PMT)392 281 111 Days 320 72 Days
On-Campus Education - Values in R$ ('000) 1Q18 1Q17 Chg.% 4Q17 Chg.%
Gross Income 787,318 806,029 -2.3% 684,794 15.0%
(-) Total Operating Expenses (116,591) (104,812) 11.2% (139,856) -16.6%
(-) Provision for Doubtful Account - PDA (134,980) (131,473) 2.7% (83,401) 61.8%
(+) Interest and Penalt ies on Tuit ion 26,898 35,232 -23.7% 22,163 21.4%
Operating Result 562,646 604,976 -7.0% 483,700 16.3%
Operat ing Margin 52.8% 56.7% -3.9 p.p. 47.2% 5.6 p.p.

17
EARNINGS RELEASE 1Q18
Company’s growth projects, but also all the associated pressures, which mainly refer to the shift in the profile of the On-
Campus student base and to the higher provisioning to support the Company’s installment plans in a conservative manner.
However, note that the maintenance of operating margins above 50%, despite the short-term challenges and accelerated
growth rate, demonstrates the consistency of the Company’s various levers to continuously deliver a high level of efficiency.
Compared to the prior quarter, operating margin expanded 5.6 p.p., reflecting the seasonality of the operation and the
strong results achieved in the new enrollment and re-enrollment processes at the start of the year.
OPERATING RESULT EX- FAIR, FAC/FAMAT and NOVATEC
Excluding the recent divestments of FAIR, FAC/FAMAT and NOVATEC from the results for 1Q17 leads to a slight difference
in indicators for the On-campus segment, with revenue growing 0.6%, reversing the decline registered in the corporate
result. Meanwhile, gross income in 1Q18 decreased by 1.5%, with margin contraction of 1.6 p.p. from the same period last
year. Operating margin, however, declined by 3.8 p.p. due to the higher provisioning and the larger cost structure to support
the growth projects.
On-Campus - Values in R$ ('000) 1Q18 1Q17 Chg.%
Net Revenue 1,064,987 1,058,764 0.6%
Gross Income 787,318 799,565 -1.5%
Gross Margin 73.9% 75.5% -1.6 p.p.
Operating Result 562,646 599,743 -6.2%
Operat ing Margin 52.8% 56.6% -3.8 p.p.
18
EARNINGS RELEASE 1Q18
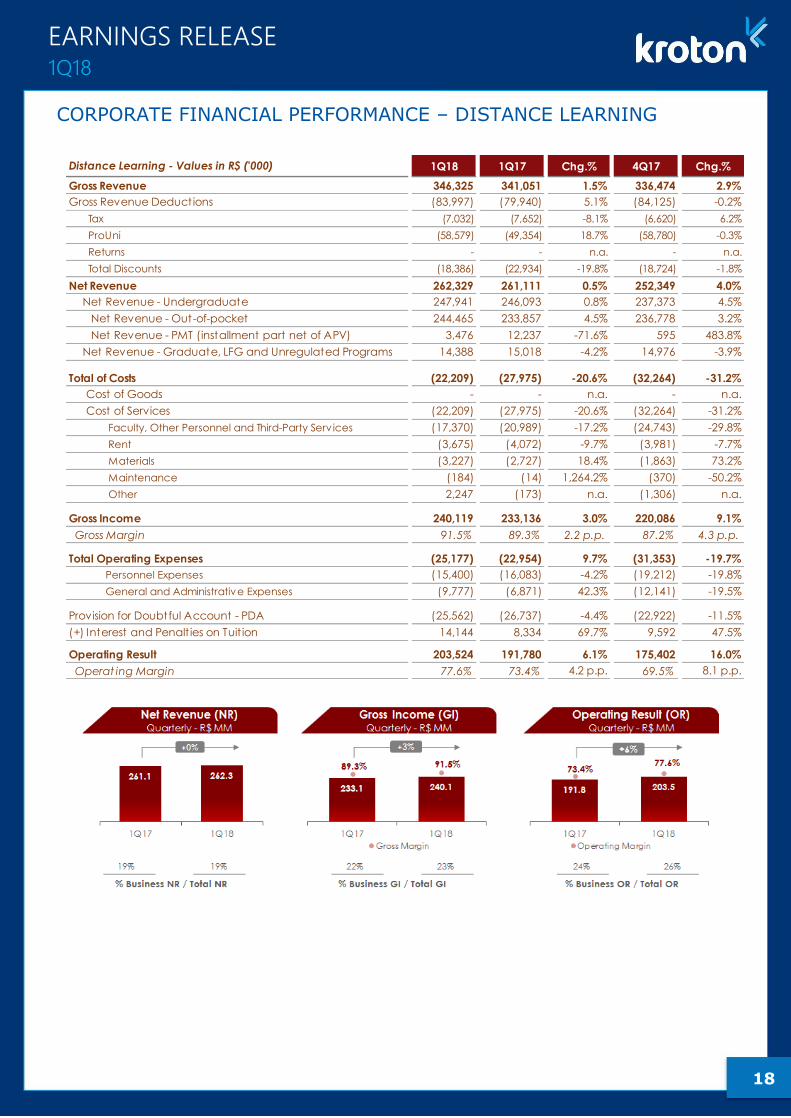
CORPORATE FINANCIAL PERFORMANCE – DISTANCE LEARNING
Distance Learning - Values in R$ ('000) 1Q18 1Q17 Chg.% 4Q17 Chg.%
Gross Revenue 346,325 341,051 1.5% 336,474 2.9%
Gross Revenue Deductions (83,997) (79,940) 5.1% (84,125) -0.2%
Tax (7,032) (7,652) -8.1% (6,620) 6.2%
ProUni (58,579) (49,354) 18.7% (58,780) -0.3%
Returns - - n.a. - n.a.
Total Discounts (18,386) (22,934) -19.8% (18,724) -1.8%
Net Revenue 262,329 261,111 0.5% 252,349 4.0%
Net Revenue - Undergraduate 247,941 246,093 0.8% 237,373 4.5%
Net Revenue - Out-of-pocket 244,465 233,857 4.5% 236,778 3.2%
Net Revenue - PMT (installment part net of APV) 3,476 12,237 -71.6% 595 483.8%
Net Revenue - Graduate, LFG and Unregulated Programs 14,388 15,018 -4.2% 14,976 -3.9%
Total of Costs (22,209) (27,975) -20.6% (32,264) -31.2%
Cost of Goods - - n.a. - n.a.
Cost of Services (22,209) (27,975) -20.6% (32,264) -31.2%
Faculty, Other Personnel and Third-Party Serv ices (17,370) (20,989) -17.2% (24,743) -29.8%
Rent (3,675) (4,072) -9.7% (3,981) -7.7%
Materials (3,227) (2,727) 18.4% (1,863) 73.2%
Maintenance (184) (14) 1,264.2% (370) -50.2%
Other 2,247 (173) n.a. (1,306) n.a.
Gross Income 240,119 233,136 3.0% 220,086 9.1%
Gross Margin 91.5% 89.3% 2.2 p.p. 87.2% 4.3 p.p.
Total Operating Expenses (25,177) (22,954) 9.7% (31,353) -19.7%
Personnel Expenses (15,400) (16,083) -4.2% (19,212) -19.8%
General and Administrative Expenses (9,777) (6,871) 42.3% (12,141) -19.5%
Provision for Doubtful Account - PDA (25,562) (26,737) -4.4% (22,922) -11.5%
(+) Interest and Penalt ies on Tuit ion 14,144 8,334 69.7% 9,592 47.5%
Operating Result 203,524 191,780 6.1% 175,402 16.0%
Operat ing Margin 77.6% 73.4% 4.2 p.p. 69.5% 8.1 p.p.
19
EARNINGS RELEASE 1Q18
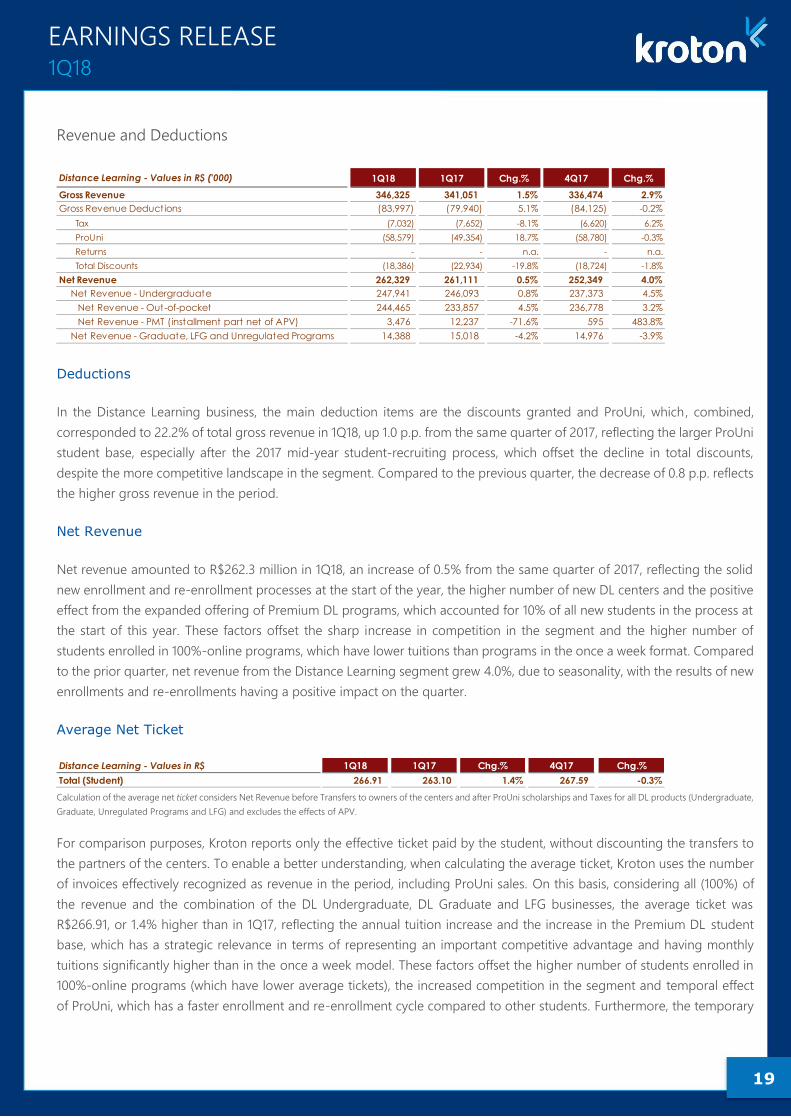
Revenue and Deductions
Deductions
In the Distance Learning business, the main deduction items are the discounts granted and ProUni, which, combined,
corresponded to 22.2% of total gross revenue in 1Q18, up 1.0 p.p. from the same quarter of 2017, reflecting the larger ProUni
student base, especially after the 2017 mid-year student-recruiting process, which offset the decline in total discounts,
despite the more competitive landscape in the segment. Compared to the previous quarter, the decrease of 0.8 p.p. reflects
the higher gross revenue in the period.
Net Revenue
Net revenue amounted to R$262.3 million in 1Q18, an increase of 0.5% from the same quarter of 2017, reflecting the solid
new enrollment and re-enrollment processes at the start of the year, the higher number of new DL centers and the positive
effect from the expanded offering of Premium DL programs, which accounted for 10% of all new students in the process at
the start of this year. These factors offset the sharp increase in competition in the segment and the higher number of
students enrolled in 100%-online programs, which have lower tuitions than programs in the once a week format. Compared
to the prior quarter, net revenue from the Distance Learning segment grew 4.0%, due to seasonality, with the results of new
enrollments and re-enrollments having a positive impact on the quarter.
Average Net Ticket
Calculation of the average net ticket considers Net Revenue before Transfers to owners of the centers and after ProUni scholarships and Taxes for all DL products (Undergraduate,
Graduate, Unregulated Programs and LFG) and excludes the effects of APV.
For comparison purposes, Kroton reports only the effective ticket paid by the student, without discounting the transfers to
the partners of the centers. To enable a better understanding, when calculating the average ticket, Kroton uses the number
of invoices effectively recognized as revenue in the period, including ProUni sales. On this basis, considering all (100%) of
the revenue and the combination of the DL Undergraduate, DL Graduate and LFG businesses, the average ticket was
R$266.91, or 1.4% higher than in 1Q17, reflecting the annual tuition increase and the increase in the Premium DL student
base, which has a strategic relevance in terms of representing an important competitive advantage and having monthly
tuitions significantly higher than in the once a week model. These factors offset the higher number of students enrolled in
100%-online programs (which have lower average tickets), the increased competition in the segment and temporal effect
of ProUni, which has a faster enrollment and re-enrollment cycle compared to other students. Furthermore, the temporary
Distance Learning - Values in R$ ('000) 1Q18 1Q17 Chg.% 4Q17 Chg.%
Gross Revenue 346,325 341,051 1.5% 336,474 2.9%
Gross Revenue Deductions (83,997) (79,940) 5.1% (84,125) -0.2%
Tax (7,032) (7,652) -8.1% (6,620) 6.2%
ProUni (58,579) (49,354) 18.7% (58,780) -0.3%
Returns - - n.a. - n.a.
Total Discounts (18,386) (22,934) -19.8% (18,724) -1.8%
Net Revenue 262,329 261,111 0.5% 252,349 4.0%
Net Revenue - Undergraduate 247,941 246,093 0.8% 237,373 4.5%
Net Revenue - Out-of-pocket 244,465 233,857 4.5% 236,778 3.2%
Net Revenue - PMT (installment part net of APV) 3,476 12,237 -71.6% 595 483.8%
Net Revenue - Graduate, LFG and Unregulated Programs 14,388 15,018 -4.2% 14,976 -3.9%
Distance Learning - Values in R$ 1Q18 1Q17 Chg.% 4Q17 Chg.%
Total (Student) 266.91 263.10 1.4% 267.59 -0.3%
20
EARNINGS RELEASE 1Q18
increase in discounts had a negative effect on average ticket for the period. The expectation is for recovery in the average
monthly tuition in the second quarter, bringing the result of the semester closer to the variation in inflation.
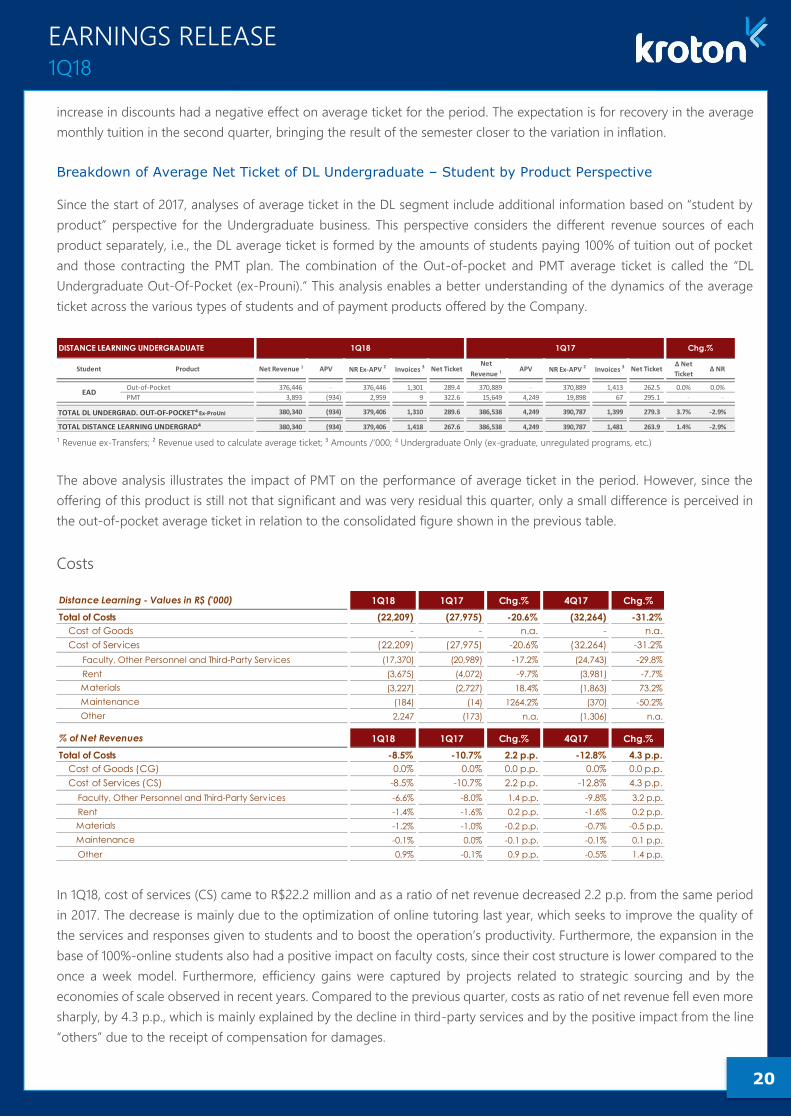
Breakdown of Average Net Ticket of DL Undergraduate – Student by Product Perspective
Since the start of 2017, analyses of average ticket in the DL segment include additional information based on “student by
product” perspective for the Undergraduate business. This perspective considers the different revenue sources of each
product separately, i.e., the DL average ticket is formed by the amounts of students paying 100% of tuition out of pocket
and those contracting the PMT plan. The combination of the Out-of-pocket and PMT average ticket is called the “DL
Undergraduate Out-Of-Pocket (ex-Prouni).” This analysis enables a better understanding of the dynamics of the average
ticket across the various types of students and of payment products offered by the Company.
¹ Revenue ex-Transfers; ² Revenue used to calculate average ticket; ³ Amounts /‘000; 4 Undergraduate Only (ex-graduate, unregulated programs, etc.)
The above analysis illustrates the impact of PMT on the performance of average ticket in the period. However, since the
offering of this product is still not that significant and was very residual this quarter, only a small difference is perceived in
the out-of-pocket average ticket in relation to the consolidated figure shown in the previous table.
Costs
In 1Q18, cost of services (CS) came to R$22.2 million and as a ratio of net revenue decreased 2.2 p.p. from the same period
in 2017. The decrease is mainly due to the optimization of online tutoring last year, which seeks to improve the quality of
the services and responses given to students and to boost the operation’s productivity. Furthermore, the expansion in the
base of 100%-online students also had a positive impact on faculty costs, since their cost structure is lower compared to the
once a week model. Furthermore, efficiency gains were captured by projects related to strategic sourcing and by the
economies of scale observed in recent years. Compared to the previous quarter, costs as ratio of net revenue fell even more
sharply, by 4.3 p.p., which is mainly explained by the decline in third-party services and by the positive impact from the line
“others” due to the receipt of compensation for damages.
Student Product Net Revenue 1 APV NR Ex-APV 2 Invoices 3 Net TicketNet
Revenue 1APV NR Ex-APV 2 Invoices 3 Net Ticket
Δ Net
TicketΔ NR
Out-of-Pocket 376,446 - 376,446 1,301 289.4 370,889 - 370,889 1,413 262.5 0.0% 0.0%
PMT 3,893 (934) 2,959 9 322.6 15,649 4,249 19,898 67 295.1 - -
380,340 (934) 379,406 1,310 289.6 386,538 4,249 390,787 1,399 279.3 3.7% -2.9%
380,340 (934) 379,406 1,418 267.6 386,538 4,249 390,787 1,481 263.9 1.4% -2.9%
Chg.%DISTANCE LEARNING UNDERGRADUATE 1Q18 1Q17
EAD
TOTAL DL UNDERGRAD. OUT-OF-POCKET⁴ Ex-ProUni
TOTAL DISTANCE LEARNING UNDERGRAD⁴
Distance Learning - Values in R$ ('000) 1Q18 1Q17 Chg.% 4Q17 Chg.%
Total of Costs (22,209) (27,975) -20.6% (32,264) -31.2%
Cost of Goods - - n.a. - n.a.
Cost of Services (22,209) (27,975) -20.6% (32,264) -31.2%
Faculty, Other Personnel and Third-Party Serv ices (17,370) (20,989) -17.2% (24,743) -29.8%
Rent (3,675) (4,072) -9.7% (3,981) -7.7%
Materials (3,227) (2,727) 18.4% (1,863) 73.2%
Maintenance (184) (14) 1264.2% (370) -50.2%
Other 2,247 (173) n.a. (1,306) n.a.
% of Net Revenues 1Q18 1Q17 Chg.% 4Q17 Chg.%
Total of Costs -8.5% -10.7% 2.2 p.p. -12.8% 4.3 p.p.
Cost of Goods (CG) 0.0% 0.0% 0.0 p.p. 0.0% 0.0 p.p.
Cost of Services (CS) -8.5% -10.7% 2.2 p.p. -12.8% 4.3 p.p.
Faculty, Other Personnel and Third-Party Serv ices -6.6% -8.0% 1.4 p.p. -9.8% 3.2 p.p.
Rent -1.4% -1.6% 0.2 p.p. -1.6% 0.2 p.p.
Materials -1.2% -1.0% -0.2 p.p. -0.7% -0.5 p.p.
Maintenance -0.1% 0.0% -0.1 p.p. -0.1% 0.1 p.p.
Other 0.9% -0.1% 0.9 p.p. -0.5% 1.4 p.p.
21
EARNINGS RELEASE 1Q18
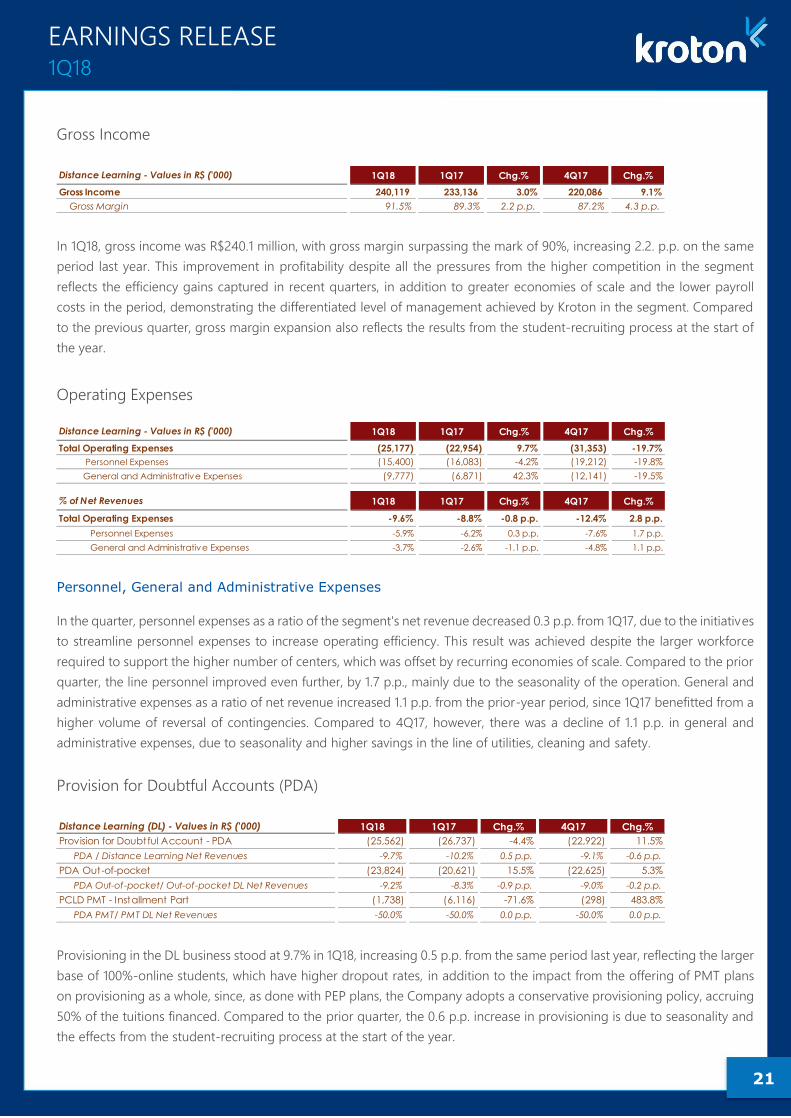
Gross Income
In 1Q18, gross income was R$240.1 million, with gross margin surpassing the mark of 90%, increasing 2.2. p.p. on the same
period last year. This improvement in profitability despite all the pressures from the higher competition in the segment
reflects the efficiency gains captured in recent quarters, in addition to greater economies of scale and the lower payroll
costs in the period, demonstrating the differentiated level of management achieved by Kroton in the segment. Compared
to the previous quarter, gross margin expansion also reflects the results from the student-recruiting process at the start of
the year.
Operating Expenses
Personnel, General and Administrative Expenses
In the quarter, personnel expenses as a ratio of the segment's net revenue decreased 0.3 p.p. from 1Q17, due to the initiatives
to streamline personnel expenses to increase operating efficiency. This result was achieved despite the larger workforce
required to support the higher number of centers, which was offset by recurring economies of scale. Compared to the prior
quarter, the line personnel improved even further, by 1.7 p.p., mainly due to the seasonality of the operation. General and
administrative expenses as a ratio of net revenue increased 1.1 p.p. from the prior-year period, since 1Q17 benefitted from a
higher volume of reversal of contingencies. Compared to 4Q17, however, there was a decline of 1.1 p.p. in general and
administrative expenses, due to seasonality and higher savings in the line of utilities, cleaning and safety.
Provision for Doubtful Accounts (PDA)
Provisioning in the DL business stood at 9.7% in 1Q18, increasing 0.5 p.p. from the same period last year, reflecting the larger
base of 100%-online students, which have higher dropout rates, in addition to the impact from the offering of PMT plans
on provisioning as a whole, since, as done with PEP plans, the Company adopts a conservative provisioning policy, accruing
50% of the tuitions financed. Compared to the prior quarter, the 0.6 p.p. increase in provisioning is due to seasonality and
the effects from the student-recruiting process at the start of the year.
Distance Learning - Values in R$ ('000) 1Q18 1Q17 Chg.% 4Q17 Chg.%
Gross Income 240,119 233,136 3.0% 220,086 9.1%
Gross Margin 91.5% 89.3% 2.2 p.p. 87.2% 4.3 p.p.
Distance Learning - Values in R$ ('000) 1Q18 1Q17 Chg.% 4Q17 Chg.%
Total Operating Expenses (25,177) (22,954) 9.7% (31,353) -19.7%
Personnel Expenses (15,400) (16,083) -4.2% (19,212) -19.8%
General and Administrative Expenses (9,777) (6,871) 42.3% (12,141) -19.5%
% of Net Revenues 1Q18 1Q17 Chg.% 4Q17 Chg.%
Total Operating Expenses -9.6% -8.8% -0.8 p.p. -12.4% 2.8 p.p.
Personnel Expenses -5.9% -6.2% 0.3 p.p. -7.6% 1.7 p.p.
General and Administrative Expenses -3.7% -2.6% -1.1 p.p. -4.8% 1.1 p.p.
Distance Learning (DL) - Values in R$ ('000) 1Q18 1Q17 Chg.% 4Q17 Chg.%
Provision for Doubtful Account - PDA (25,562) (26,737) -4.4% (22,922) 11.5%
PDA / Distance Learning Net Revenues -9.7% -10.2% 0.5 p.p. -9.1% -0.6 p.p.
PDA Out-of-pocket (23,824) (20,621) 15.5% (22,625) 5.3%
PDA Out-of-pocket/ Out-of-pocket DL Net Revenues -9.2% -8.3% -0.9 p.p. -9.0% -0.2 p.p.
PCLD PMT - Installment Part (1,738) (6,116) -71.6% (298) 483.8%
PDA PMT/ PMT DL Net Revenues -50.0% -50.0% 0.0 p.p. -50.0% 0.0 p.p.
22
EARNINGS RELEASE 1Q18
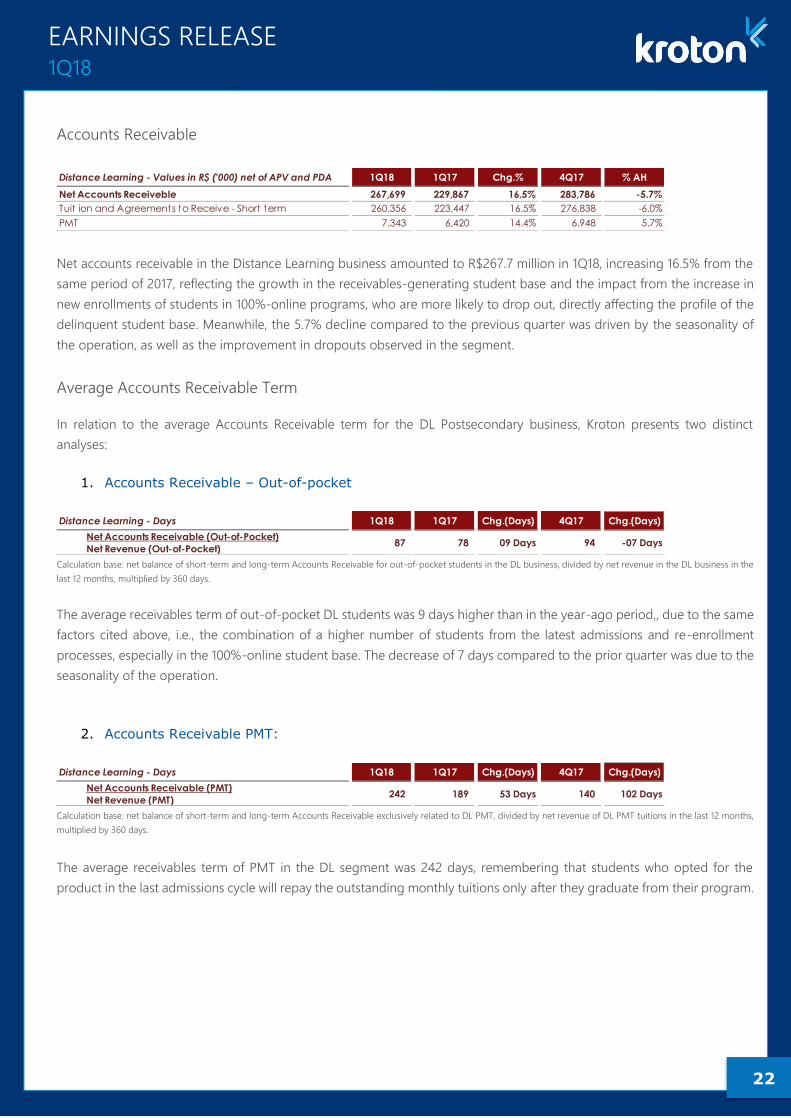
Accounts Receivable
Net accounts receivable in the Distance Learning business amounted to R$267.7 million in 1Q18, increasing 16.5% from the
same period of 2017, reflecting the growth in the receivables-generating student base and the impact from the increase in
new enrollments of students in 100%-online programs, who are more likely to drop out, directly affecting the profile of the
delinquent student base. Meanwhile, the 5.7% decline compared to the previous quarter was driven by the seasonality of
the operation, as well as the improvement in dropouts observed in the segment.
Average Accounts Receivable Term
In relation to the average Accounts Receivable term for the DL Postsecondary business, Kroton presents two distinct
analyses:
1. Accounts Receivable – Out-of-pocket
Calculation base: net balance of short-term and long-term Accounts Receivable for out-of-pocket students in the DL business, divided by net revenue in the DL business in the
last 12 months, multiplied by 360 days.
The average receivables term of out-of-pocket DL students was 9 days higher than in the year-ago period,, due to the same
factors cited above, i.e., the combination of a higher number of students from the latest admissions and re-enrollment
processes, especially in the 100%-online student base. The decrease of 7 days compared to the prior quarter was due to the
seasonality of the operation.
2. Accounts Receivable PMT:
Calculation base: net balance of short-term and long-term Accounts Receivable exclusively related to DL PMT, divided by net revenue of DL PMT tuitions in the last 12 months,
multiplied by 360 days.
The average receivables term of PMT in the DL segment was 242 days, remembering that students who opted for the
product in the last admissions cycle will repay the outstanding monthly tuitions only after they graduate from their program.
Distance Learning - Values in R$ ('000) net of APV and PDA 1Q18 1Q17 Chg.% 4Q17 % AH
Net Accounts Receiveble 267,699 229,867 16.5% 283,786 -5.7%
Tuit ion and Agreements to Receive - Short term 260,356 223,447 16.5% 276,838 -6.0%
PMT 7,343 6,420 14.4% 6,948 5.7%
Distance Learning - Days 1Q18 1Q17 Chg.(Days) 4Q17 Chg.(Days)
Net Accounts Receivable (Out-of-Pocket)
Net Revenue (Out-of-Pocket)87 78 09 Days 94 -07 Days
Distance Learning - Days 1Q18 1Q17 Chg.(Days) 4Q17 Chg.(Days)
Net Accounts Receivable (PMT)
Net Revenue (PMT)242 189 53 Days 140 102 Days
23
EARNINGS RELEASE 1Q18
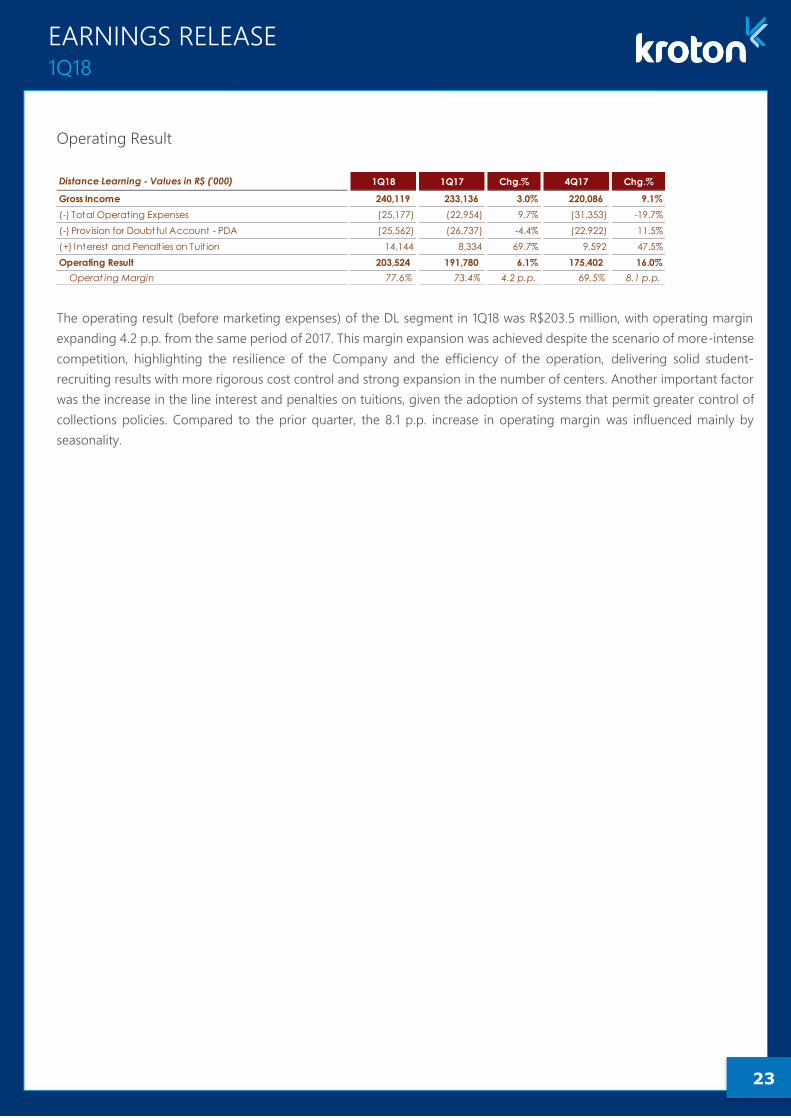
Operating Result
The operating result (before marketing expenses) of the DL segment in 1Q18 was R$203.5 million, with operating margin
expanding 4.2 p.p. from the same period of 2017. This margin expansion was achieved despite the scenario of more-intense
competition, highlighting the resilience of the Company and the efficiency of the operation, delivering solid student-
recruiting results with more rigorous cost control and strong expansion in the number of centers. Another important factor
was the increase in the line interest and penalties on tuitions, given the adoption of systems that permit greater control of
collections policies. Compared to the prior quarter, the 8.1 p.p. increase in operating margin was influenced mainly by
seasonality.
Distance Learning - Values in R$ ('000) 1Q18 1Q17 Chg.% 4Q17 Chg.%
Gross Income 240,119 233,136 3.0% 220,086 9.1%
(-) Total Operating Expenses (25,177) (22,954) 9.7% (31,353) -19.7%
(-) Provision for Doubtful Account - PDA (25,562) (26,737) -4.4% (22,922) 11.5%
(+) Interest and Penalt ies on Tuit ion 14,144 8,334 69.7% 9,592 47.5%
Operating Result 203,524 191,780 6.1% 175,402 16.0%
Operat ing Margin 77.6% 73.4% 4.2 p.p. 69.5% 8.1 p.p.
24
EARNINGS RELEASE 1Q18
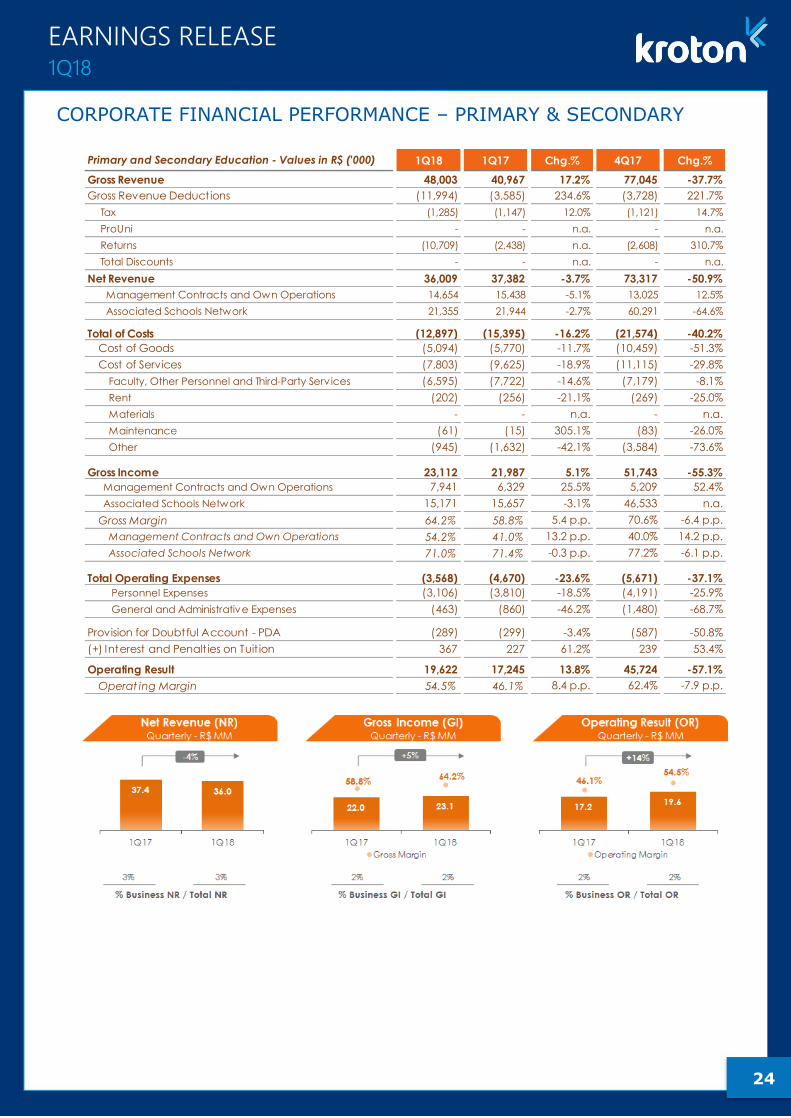
CORPORATE FINANCIAL PERFORMANCE – PRIMARY & SECONDARY
Primary and Secondary Education - Values in R$ ('000) 1Q18 1Q17 Chg.% 4Q17 Chg.%
Gross Revenue 48,003 40,967 17.2% 77,045 -37.7%
Gross Revenue Deductions (11,994) (3,585) 234.6% (3,728) 221.7%
Tax (1,285) (1,147) 12.0% (1,121) 14.7%
ProUni - - n.a. - n.a.
Returns (10,709) (2,438) n.a. (2,608) 310.7%
Total Discounts - - n.a. - n.a.
Net Revenue 36,009 37,382 -3.7% 73,317 -50.9%
Management Contracts and Own Operations 14,654 15,438 -5.1% 13,025 12.5%
Associated Schools Network 21,355 21,944 -2.7% 60,291 -64.6%
Total of Costs (12,897) (15,395) -16.2% (21,574) -40.2%
Cost of Goods (5,094) (5,770) -11.7% (10,459) -51.3%
Cost of Services (7,803) (9,625) -18.9% (11,115) -29.8%
Faculty, Other Personnel and Third-Party Serv ices (6,595) (7,722) -14.6% (7,179) -8.1%
Rent (202) (256) -21.1% (269) -25.0%
Materials - - n.a. - n.a.
Maintenance (61) (15) 305.1% (83) -26.0%
Other (945) (1,632) -42.1% (3,584) -73.6%
Gross Income 23,112 21,987 5.1% 51,743 -55.3%
Management Contracts and Own Operations 7,941 6,329 25.5% 5,209 52.4%
Associated Schools Network 15,171 15,657 -3.1% 46,533 n.a.
Gross Margin 64.2% 58.8% 5.4 p.p. 70.6% -6.4 p.p.
Management Contracts and Own Operations 54.2% 41.0% 13.2 p.p. 40.0% 14.2 p.p.
Associated Schools Network 71.0% 71.4% -0.3 p.p. 77.2% -6.1 p.p.
Total Operating Expenses (3,568) (4,670) -23.6% (5,671) -37.1%
Personnel Expenses (3,106) (3,810) -18.5% (4,191) -25.9%
General and Administrative Expenses (463) (860) -46.2% (1,480) -68.7%
Provision for Doubtful Account - PDA (289) (299) -3.4% (587) -50.8%
(+) Interest and Penalt ies on Tuit ion 367 227 61.2% 239 53.4%
Operating Result 19,622 17,245 13.8% 45,724 -57.1%
Operat ing Margin 54.5% 46.1% 8.4 p.p. 62.4% -7.9 p.p.
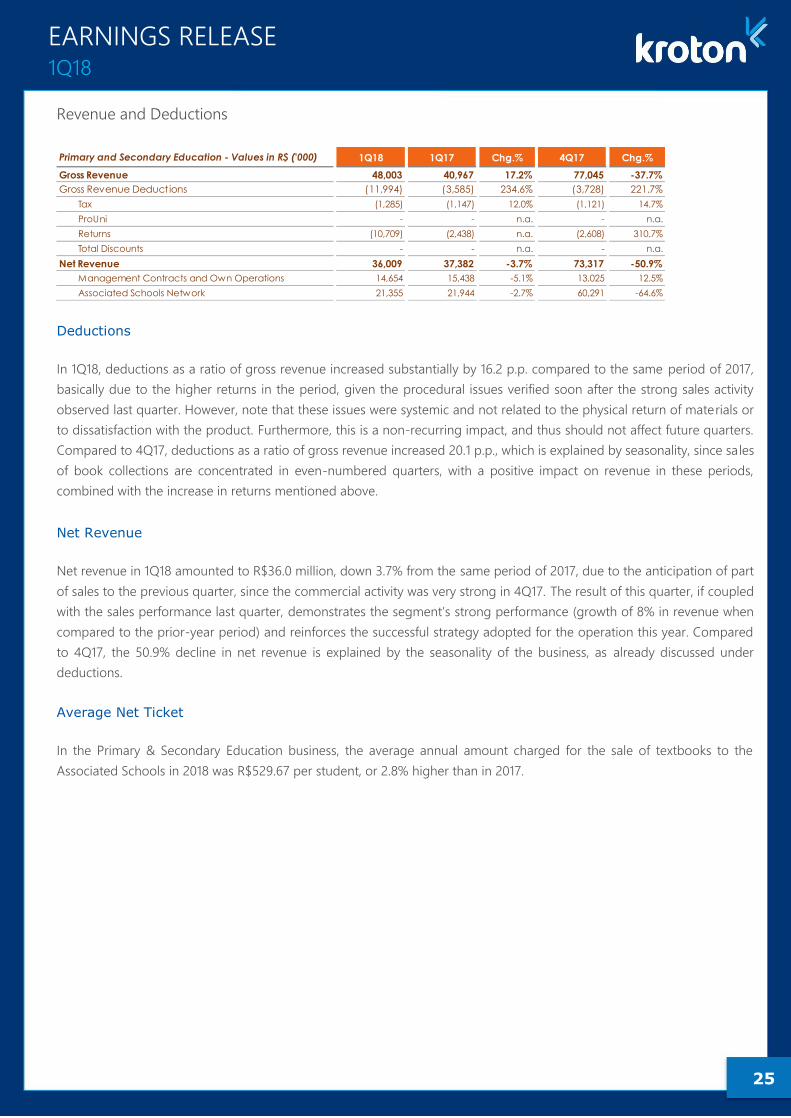
25
EARNINGS RELEASE 1Q18
Revenue and Deductions
Deductions
In 1Q18, deductions as a ratio of gross revenue increased substantially by 16.2 p.p. compared to the same period of 2017,
basically due to the higher returns in the period, given the procedural issues verified soon after the strong sales activity
observed last quarter. However, note that these issues were systemic and not related to the physical return of materials or
to dissatisfaction with the product. Furthermore, this is a non-recurring impact, and thus should not affect future quarters.
Compared to 4Q17, deductions as a ratio of gross revenue increased 20.1 p.p., which is explained by seasonality, since sales
of book collections are concentrated in even-numbered quarters, with a positive impact on revenue in these periods,
combined with the increase in returns mentioned above.
Net Revenue
Net revenue in 1Q18 amounted to R$36.0 million, down 3.7% from the same period of 2017, due to the anticipation of part
of sales to the previous quarter, since the commercial activity was very strong in 4Q17. The result of this quarter, if coupled
with the sales performance last quarter, demonstrates the segment’s strong performance (growth of 8% in revenue when
compared to the prior-year period) and reinforces the successful strategy adopted for the operation this year. Compared
to 4Q17, the 50.9% decline in net revenue is explained by the seasonality of the business, as already discussed under
deductions.
Average Net Ticket
In the Primary & Secondary Education business, the average annual amount charged for the sale of textbooks to the
Associated Schools in 2018 was R$529.67 per student, or 2.8% higher than in 2017.
Primary and Secondary Education - Values in R$ ('000) 1Q18 1Q17 Chg.% 4Q17 Chg.%
Gross Revenue 48,003 40,967 17.2% 77,045 -37.7%
Gross Revenue Deductions (11,994) (3,585) 234.6% (3,728) 221.7%
Tax (1,285) (1,147) 12.0% (1,121) 14.7%
ProUni - - n.a. - n.a.
Returns (10,709) (2,438) n.a. (2,608) 310.7%
Total Discounts - - n.a. - n.a.
Net Revenue 36,009 37,382 -3.7% 73,317 -50.9%
Management Contracts and Own Operations 14,654 15,438 -5.1% 13,025 12.5%
Associated Schools Network 21,355 21,944 -2.7% 60,291 -64.6%
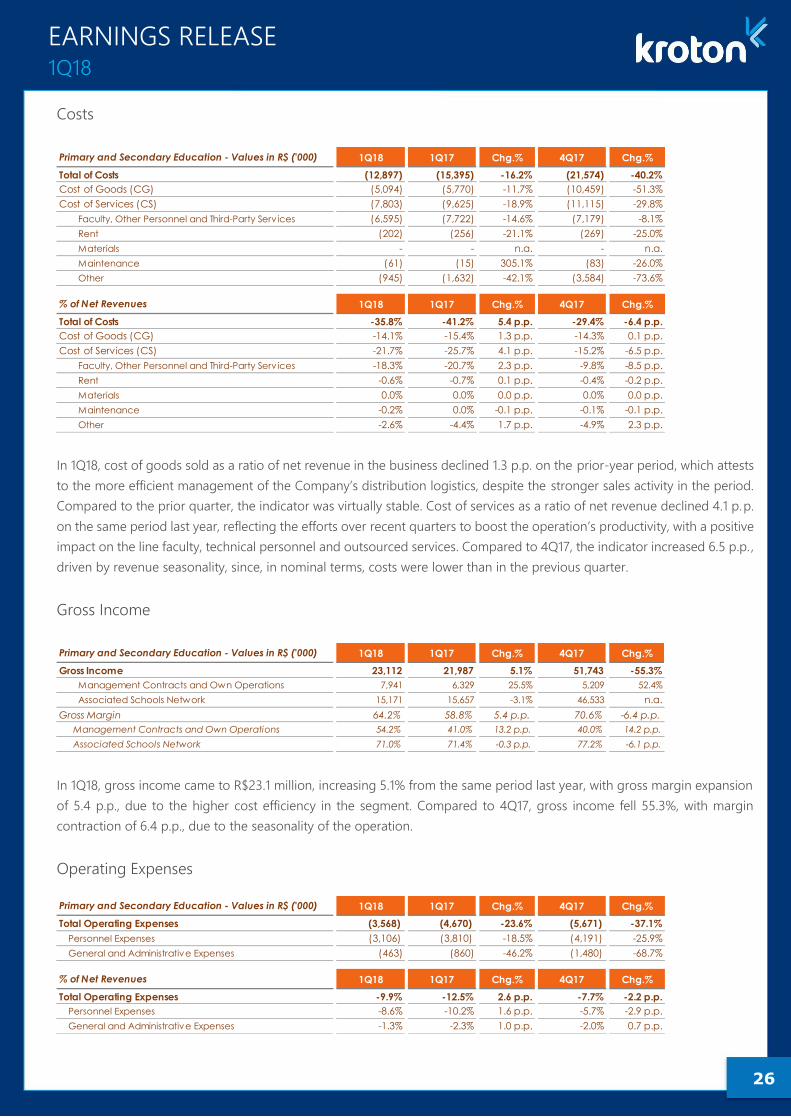
26
EARNINGS RELEASE 1Q18
Costs
In 1Q18, cost of goods sold as a ratio of net revenue in the business declined 1.3 p.p. on the prior-year period, which attests
to the more efficient management of the Company’s distribution logistics, despite the stronger sales activity in the period.
Compared to the prior quarter, the indicator was virtually stable. Cost of services as a ratio of net revenue declined 4.1 p.p.
on the same period last year, reflecting the efforts over recent quarters to boost the operation’s productivity, with a positive
impact on the line faculty, technical personnel and outsourced services. Compared to 4Q17, the indicator increased 6.5 p.p. ,
driven by revenue seasonality, since, in nominal terms, costs were lower than in the previous quarter.
Gross Income
In 1Q18, gross income came to R$23.1 million, increasing 5.1% from the same period last year, with gross margin expansion
of 5.4 p.p., due to the higher cost efficiency in the segment. Compared to 4Q17, gross income fell 55.3%, with margin
contraction of 6.4 p.p., due to the seasonality of the operation.
Operating Expenses
Primary and Secondary Education - Values in R$ ('000) 1Q18 1Q17 Chg.% 4Q17 Chg.%
Total of Costs (12,897) (15,395) -16.2% (21,574) -40.2%
Cost of Goods (CG) (5,094) (5,770) -11.7% (10,459) -51.3%
Cost of Services (CS) (7,803) (9,625) -18.9% (11,115) -29.8%
Faculty, Other Personnel and Third-Party Serv ices (6,595) (7,722) -14.6% (7,179) -8.1%
Rent (202) (256) -21.1% (269) -25.0%
Materials - - n.a. - n.a.
Maintenance (61) (15) 305.1% (83) -26.0%
Other (945) (1,632) -42.1% (3,584) -73.6%
% of Net Revenues 1Q18 1Q17 Chg.% 4Q17 Chg.%
Total of Costs -35.8% -41.2% 5.4 p.p. -29.4% -6.4 p.p.
Cost of Goods (CG) -14.1% -15.4% 1.3 p.p. -14.3% 0.1 p.p.
Cost of Services (CS) -21.7% -25.7% 4.1 p.p. -15.2% -6.5 p.p.
Faculty, Other Personnel and Third-Party Serv ices -18.3% -20.7% 2.3 p.p. -9.8% -8.5 p.p.
Rent -0.6% -0.7% 0.1 p.p. -0.4% -0.2 p.p.
Materials 0.0% 0.0% 0.0 p.p. 0.0% 0.0 p.p.
Maintenance -0.2% 0.0% -0.1 p.p. -0.1% -0.1 p.p.
Other -2.6% -4.4% 1.7 p.p. -4.9% 2.3 p.p.
Primary and Secondary Education - Values in R$ ('000) 1Q18 1Q17 Chg.% 4Q17 Chg.%
Gross Income 23,112 21,987 5.1% 51,743 -55.3%
Management Contracts and Own Operations 7,941 6,329 25.5% 5,209 52.4%
Associated Schools Network 15,171 15,657 -3.1% 46,533 n.a.
Gross Margin 64.2% 58.8% 5.4 p.p. 70.6% -6.4 p.p.
Management Contracts and Own Operations 54.2% 41.0% 13.2 p.p. 40.0% 14.2 p.p.
Associated Schools Network 71.0% 71.4% -0.3 p.p. 77.2% -6.1 p.p.
Primary and Secondary Education - Values in R$ ('000) 1Q18 1Q17 Chg.% 4Q17 Chg.%
Total Operating Expenses (3,568) (4,670) -23.6% (5,671) -37.1%
Personnel Expenses (3,106) (3,810) -18.5% (4,191) -25.9%
General and Administrative Expenses (463) (860) -46.2% (1,480) -68.7%
% of Net Revenues 1Q18 1Q17 Chg.% 4Q17 Chg.%
Total Operating Expenses -9.9% -12.5% 2.6 p.p. -7.7% -2.2 p.p.
Personnel Expenses -8.6% -10.2% 1.6 p.p. -5.7% -2.9 p.p.
General and Administrative Expenses -1.3% -2.3% 1.0 p.p. -2.0% 0.7 p.p.
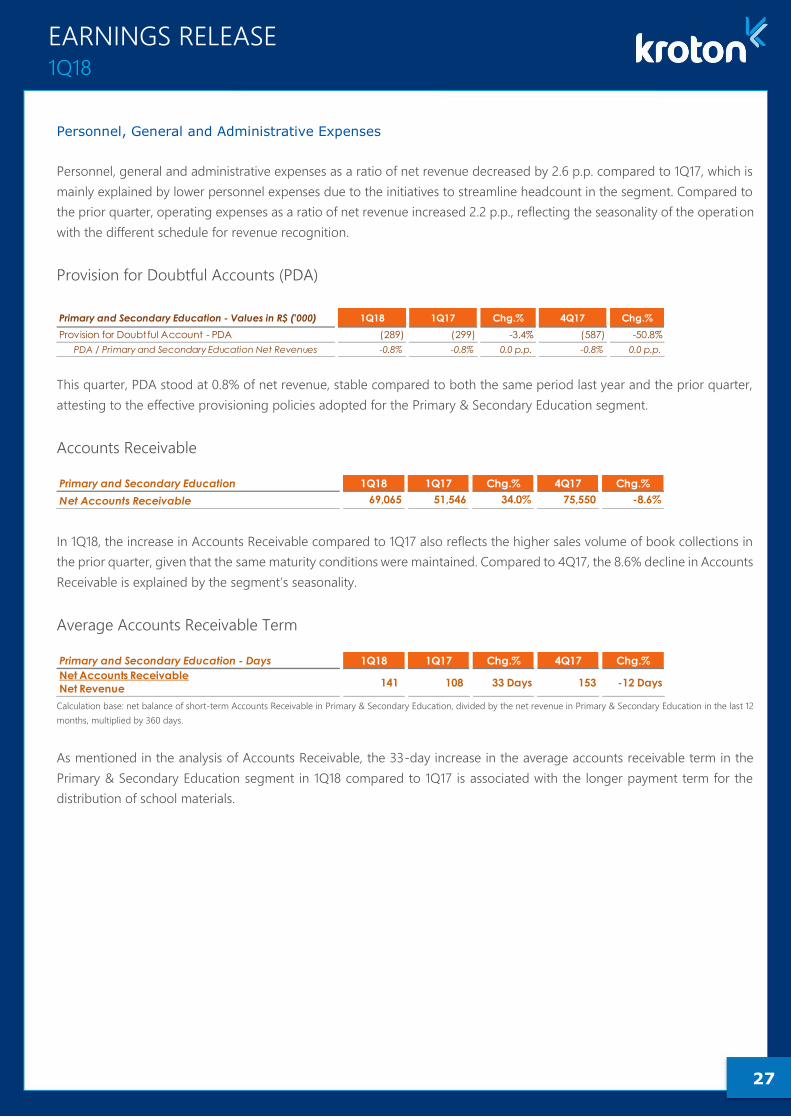
27
EARNINGS RELEASE 1Q18
Personnel, General and Administrative Expenses
Personnel, general and administrative expenses as a ratio of net revenue decreased by 2.6 p.p. compared to 1Q17, which is
mainly explained by lower personnel expenses due to the initiatives to streamline headcount in the segment. Compared to
the prior quarter, operating expenses as a ratio of net revenue increased 2.2 p.p., reflecting the seasonality of the operation
with the different schedule for revenue recognition.
Provision for Doubtful Accounts (PDA)
This quarter, PDA stood at 0.8% of net revenue, stable compared to both the same period last year and the prior quarter,
attesting to the effective provisioning policies adopted for the Primary & Secondary Education segment.
Accounts Receivable
In 1Q18, the increase in Accounts Receivable compared to 1Q17 also reflects the higher sales volume of book collections in
the prior quarter, given that the same maturity conditions were maintained. Compared to 4Q17, the 8.6% decline in Accounts
Receivable is explained by the segment’s seasonality.
Average Accounts Receivable Term
Calculation base: net balance of short-term Accounts Receivable in Primary & Secondary Education, divided by the net revenue in Primary & Secondary Education in the last 12
months, multiplied by 360 days.
As mentioned in the analysis of Accounts Receivable, the 33-day increase in the average accounts receivable term in the
Primary & Secondary Education segment in 1Q18 compared to 1Q17 is associated with the longer payment term for the
distribution of school materials.
Primary and Secondary Education - Values in R$ ('000) 1Q18 1Q17 Chg.% 4Q17 Chg.%
Provision for Doubtful Account - PDA (289) (299) -3.4% (587) -50.8%
PDA / Primary and Secondary Education Net Revenues -0.8% -0.8% 0.0 p.p. -0.8% 0.0 p.p.
Primary and Secondary Education 1Q18 1Q17 Chg.% 4Q17 Chg.%
Net Accounts Receivable 69,065 51,546 34.0% 75,550 -8.6%
Primary and Secondary Education - Days 1Q18 1Q17 Chg.% 4Q17 Chg.%
Net Accounts Receivable
Net Revenue 141 108 33 Days 153 -12 Days
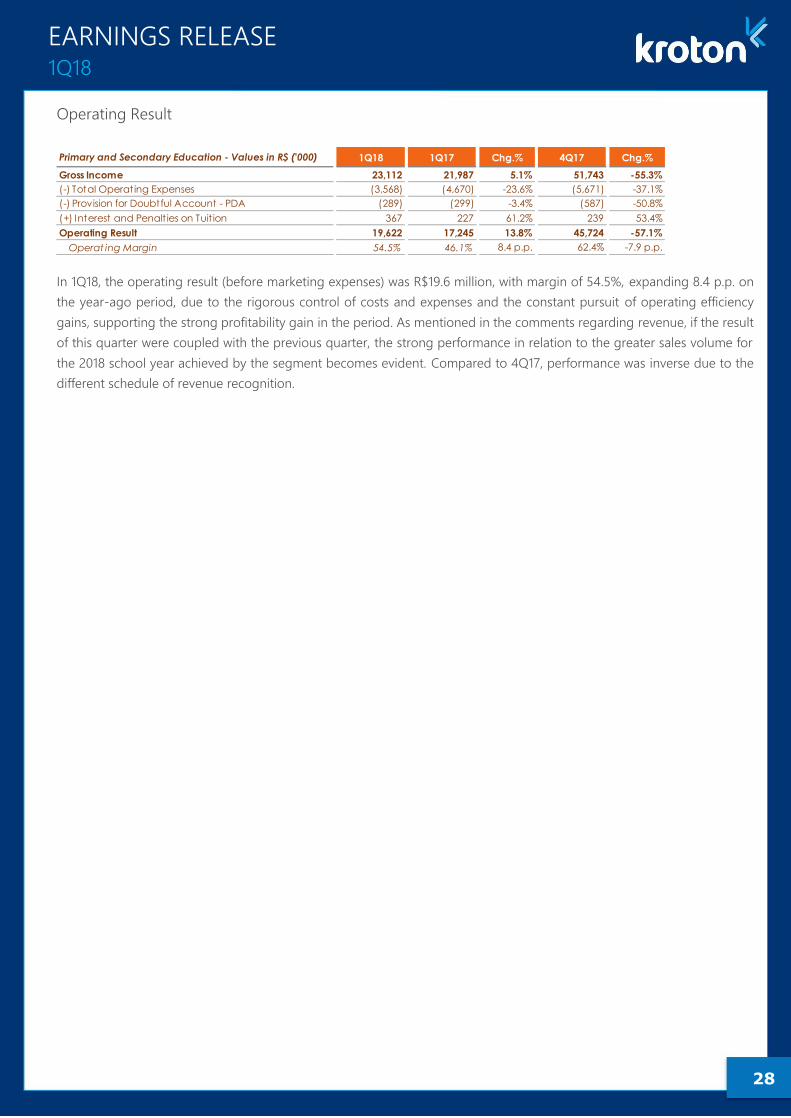
28
EARNINGS RELEASE 1Q18
Operating Result
In 1Q18, the operating result (before marketing expenses) was R$19.6 million, with margin of 54.5%, expanding 8.4 p.p. on
the year-ago period, due to the rigorous control of costs and expenses and the constant pursuit of operating efficiency
gains, supporting the strong profitability gain in the period. As mentioned in the comments regarding revenue, if the result
of this quarter were coupled with the previous quarter, the strong performance in relation to the greater sales volume for
the 2018 school year achieved by the segment becomes evident. Compared to 4Q17, performance was inverse due to the
different schedule of revenue recognition.
Primary and Secondary Education - Values in R$ ('000) 1Q18 1Q17 Chg.% 4Q17 Chg.%
Gross Income 23,112 21,987 5.1% 51,743 -55.3%
(-) Total Operating Expenses (3,568) (4,670) -23.6% (5,671) -37.1%
(-) Provision for Doubtful Account - PDA (289) (299) -3.4% (587) -50.8%
(+) Interest and Penalt ies on Tuit ion 367 227 61.2% 239 53.4%
Operating Result 19,622 17,245 13.8% 45,724 -57.1%
Operat ing Margin 54.5% 46.1% 8.4 p.p. 62.4% -7.9 p.p.
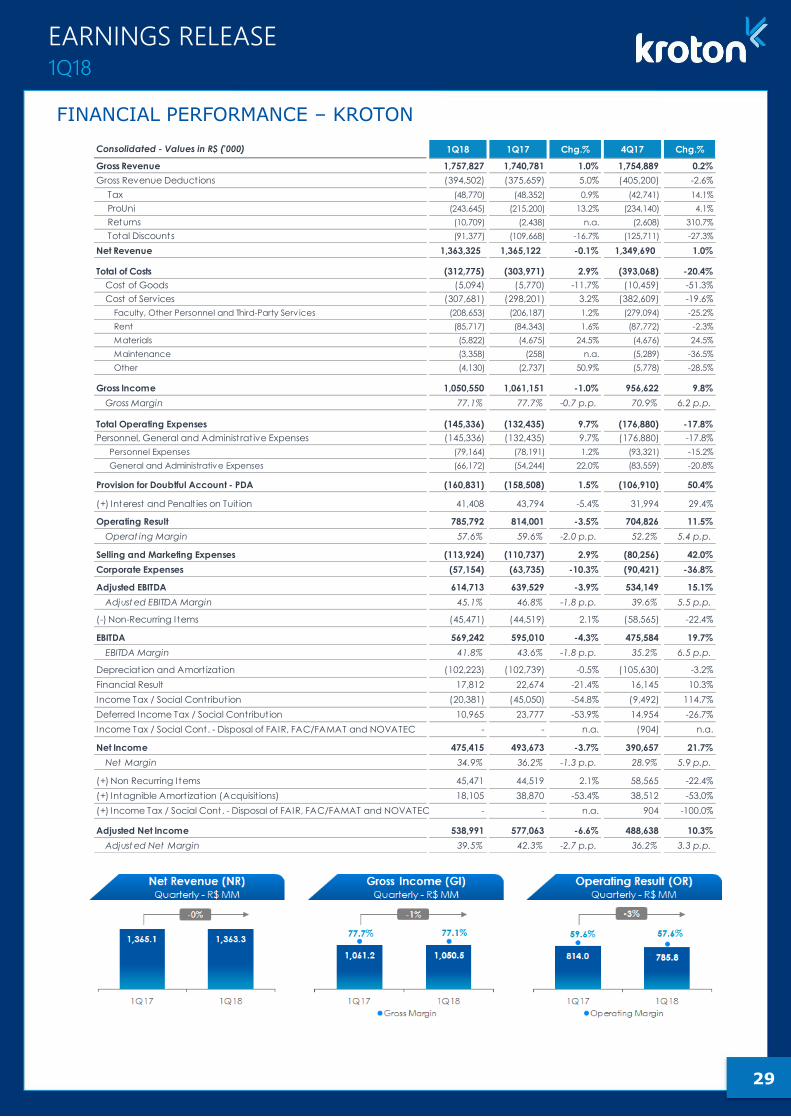
29
EARNINGS RELEASE 1Q18
FINANCIAL PERFORMANCE – KROTON
Consolidated - Values in R$ ('000) 1Q18 1Q17 Chg.% 4Q17 Chg.%
Gross Revenue 1,757,827 1,740,781 1.0% 1,754,889 0.2%
Gross Revenue Deductions (394,502) (375,659) 5.0% (405,200) -2.6%
Tax (48,770) (48,352) 0.9% (42,741) 14.1%
ProUni (243,645) (215,200) 13.2% (234,140) 4.1%
Returns (10,709) (2,438) n.a. (2,608) 310.7%
Total Discounts (91,377) (109,668) -16.7% (125,711) -27.3%
Net Revenue 1,363,325 1,365,122 -0.1% 1,349,690 1.0%
Total of Costs (312,775) (303,971) 2.9% (393,068) -20.4%
Cost of Goods (5,094) (5,770) -11.7% (10,459) -51.3%
Cost of Services (307,681) (298,201) 3.2% (382,609) -19.6%
Faculty, Other Personnel and Third-Party Serv ices (208,653) (206,187) 1.2% (279,094) -25.2%
Rent (85,717) (84,343) 1.6% (87,772) -2.3%
Materials (5,822) (4,675) 24.5% (4,676) 24.5%
Maintenance (3,358) (258) n.a. (5,289) -36.5%
Other (4,130) (2,737) 50.9% (5,778) -28.5%
Gross Income 1,050,550 1,061,151 -1.0% 956,622 9.8%
Gross Margin 77.1% 77.7% -0.7 p.p. 70.9% 6.2 p.p.
Total Operating Expenses (145,336) (132,435) 9.7% (176,880) -17.8%
Personnel, General and Administrat ive Expenses (145,336) (132,435) 9.7% (176,880) -17.8%
Personnel Expenses (79,164) (78,191) 1.2% (93,321) -15.2%
General and Administrative Expenses (66,172) (54,244) 22.0% (83,559) -20.8%
Provision for Doubtful Account - PDA (160,831) (158,508) 1.5% (106,910) 50.4%
(+) Interest and Penalt ies on Tuit ion 41,408 43,794 -5.4% 31,994 29.4%
Operating Result 785,792 814,001 -3.5% 704,826 11.5%
Operat ing Margin 57.6% 59.6% -2.0 p.p. 52.2% 5.4 p.p.
Selling and Marketing Expenses (113,924) (110,737) 2.9% (80,256) 42.0%
Corporate Expenses (57,154) (63,735) -10.3% (90,421) -36.8%
Adjusted EBITDA 614,713 639,529 -3.9% 534,149 15.1%
Adjust ed EBITDA Margin 45.1% 46.8% -1.8 p.p. 39.6% 5.5 p.p.
(-) Non-Recurring Items (45,471) (44,519) 2.1% (58,565) -22.4%
EBITDA 569,242 595,010 -4.3% 475,584 19.7%
EBITDA Margin 41.8% 43.6% -1.8 p.p. 35.2% 6.5 p.p.
Depreciat ion and Amort izat ion (102,223) (102,739) -0.5% (105,630) -3.2%
Financial Result 17,812 22,674 -21.4% 16,145 10.3%
Income Tax / Social Contribut ion (20,381) (45,050) -54.8% (9,492) 114.7%
Deferred Income Tax / Social Contribut ion 10,965 23,777 -53.9% 14,954 -26.7%
Income Tax / Social Cont. - Disposal of FAIR, FAC/FAMAT and NOVATEC - - n.a. (904) n.a.
Net Income 475,415 493,673 -3.7% 390,657 21.7%
Net Margin 34.9% 36.2% -1.3 p.p. 28.9% 5.9 p.p.
(+) Non Recurring Items 45,471 44,519 2.1% 58,565 -22.4%
(+) Intagnible Amort izat ion (Acquisit ions) 18,105 38,870 -53.4% 38,512 -53.0%
(+) Income Tax / Social Cont. - Disposal of FAIR, FAC/FAMAT and NOVATEC - - n.a. 904 -100.0%
Adjusted Net Income 538,991 577,063 -6.6% 488,638 10.3%
Adjust ed Net Margin 39.5% 42.3% -2.7 p.p. 36.2% 3.3 p.p.
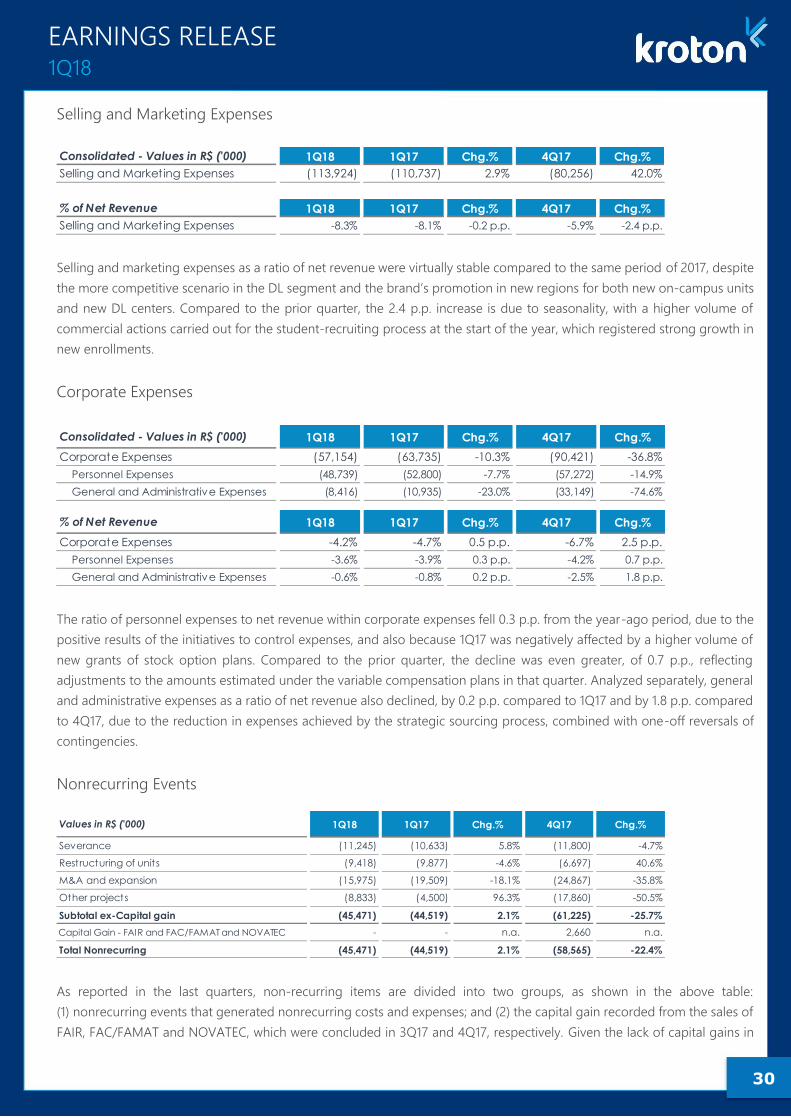
30
EARNINGS RELEASE 1Q18
Selling and Marketing Expenses
Selling and marketing expenses as a ratio of net revenue were virtually stable compared to the same period of 2017, despite
the more competitive scenario in the DL segment and the brand’s promotion in new regions for both new on-campus units
and new DL centers. Compared to the prior quarter, the 2.4 p.p. increase is due to seasonality, with a higher volume of
commercial actions carried out for the student-recruiting process at the start of the year, which registered strong growth in
new enrollments.
Corporate Expenses
The ratio of personnel expenses to net revenue within corporate expenses fell 0.3 p.p. from the year-ago period, due to the
positive results of the initiatives to control expenses, and also because 1Q17 was negatively affected by a higher volume of
new grants of stock option plans. Compared to the prior quarter, the decline was even greater, of 0.7 p.p., reflecting
adjustments to the amounts estimated under the variable compensation plans in that quarter. Analyzed separately, general
and administrative expenses as a ratio of net revenue also declined, by 0.2 p.p. compared to 1Q17 and by 1.8 p.p. compared
to 4Q17, due to the reduction in expenses achieved by the strategic sourcing process, combined with one-off reversals of
contingencies.
Nonrecurring Events
As reported in the last quarters, non-recurring items are divided into two groups, as shown in the above table:
(1) nonrecurring events that generated nonrecurring costs and expenses; and (2) the capital gain recorded from the sales of
FAIR, FAC/FAMAT and NOVATEC, which were concluded in 3Q17 and 4Q17, respectively. Given the lack of capital gains in
Consolidated - Values in R$ ('000) 1Q18 1Q17 Chg.% 4Q17 Chg.%
Selling and Marketing Expenses (113,924) (110,737) 2.9% (80,256) 42.0%
% of Net Revenue 1Q18 1Q17 Chg.% 4Q17 Chg.%
Selling and Marketing Expenses -8.3% -8.1% -0.2 p.p. -5.9% -2.4 p.p.
Consolidated - Values in R$ ('000) 1Q18 1Q17 Chg.% 4Q17 Chg.%
Corporate Expenses (57,154) (63,735) -10.3% (90,421) -36.8%
Personnel Expenses (48,739) (52,800) -7.7% (57,272) -14.9%
General and Administrative Expenses (8,416) (10,935) -23.0% (33,149) -74.6%
% of Net Revenue 1Q18 1Q17 Chg.% 4Q17 Chg.%
Corporate Expenses -4.2% -4.7% 0.5 p.p. -6.7% 2.5 p.p.
Personnel Expenses -3.6% -3.9% 0.3 p.p. -4.2% 0.7 p.p.
General and Administrative Expenses -0.6% -0.8% 0.2 p.p. -2.5% 1.8 p.p.
Values in R$ ('000) 1Q18 1Q17 Chg.% 4Q17 Chg.%
Severance (11,245) (10,633) 5.8% (11,800) -4.7%
Restructuring of units (9,418) (9,877) -4.6% (6,697) 40.6%
M&A and expansion (15,975) (19,509) -18.1% (24,867) -35.8%
Other projects (8,833) (4,500) 96.3% (17,860) -50.5%
Subtotal ex-Capital gain (45,471) (44,519) 2.1% (61,225) -25.7%
Capital Gain - FAIR and FAC/FAMAT and NOVATEC - - n.a. 2,660 n.a.
Total Nonrecurring (45,471) (44,519) 2.1% (58,565) -22.4%
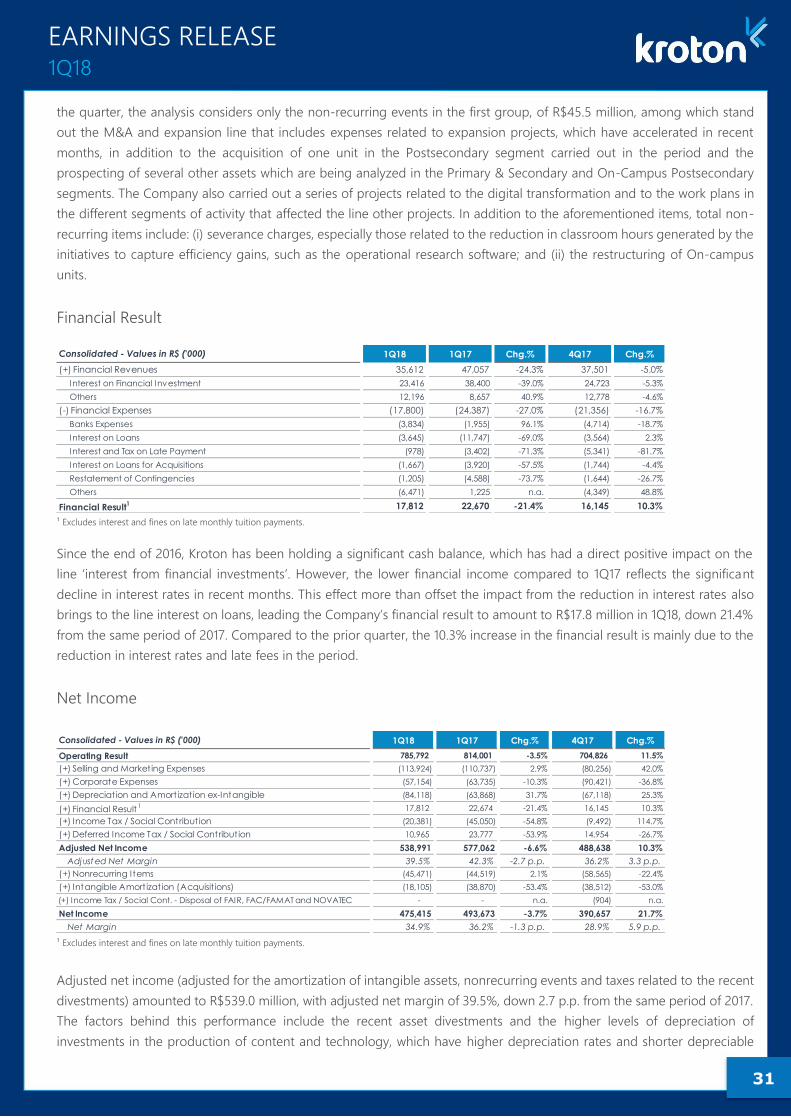
31
EARNINGS RELEASE 1Q18
the quarter, the analysis considers only the non-recurring events in the first group, of R$45.5 million, among which stand
out the M&A and expansion line that includes expenses related to expansion projects, which have accelerated in recent
months, in addition to the acquisition of one unit in the Postsecondary segment carried out in the period and the
prospecting of several other assets which are being analyzed in the Primary & Secondary and On-Campus Postsecondary
segments. The Company also carried out a series of projects related to the digital transformation and to the work plans in
the different segments of activity that affected the line other projects. In addition to the aforementioned items, total non-
recurring items include: (i) severance charges, especially those related to the reduction in classroom hours generated by the
initiatives to capture efficiency gains, such as the operational research software; and (ii) the restructuring of On-campus
units.
Financial Result
¹ Excludes interest and fines on late monthly tuition payments.
Since the end of 2016, Kroton has been holding a significant cash balance, which has had a direct positive impact on the
line ‘interest from financial investments’. However, the lower financial income compared to 1Q17 reflects the significant
decline in interest rates in recent months. This effect more than offset the impact from the reduction in interest rates also
brings to the line interest on loans, leading the Company’s financial result to amount to R$17.8 million in 1Q18, down 21.4%
from the same period of 2017. Compared to the prior quarter, the 10.3% increase in the financial result is mainly due to the
reduction in interest rates and late fees in the period.
Net Income
¹ Excludes interest and fines on late monthly tuition payments.
Adjusted net income (adjusted for the amortization of intangible assets, nonrecurring events and taxes related to the recent
divestments) amounted to R$539.0 million, with adjusted net margin of 39.5%, down 2.7 p.p. from the same period of 2017.
The factors behind this performance include the recent asset divestments and the higher levels of depreciation of
investments in the production of content and technology, which have higher depreciation rates and shorter depreciable
Consolidated - Values in R$ ('000) 1Q18 1Q17 Chg.% 4Q17 Chg.%
(+) Financial Revenues 35,612 47,057 -24.3% 37,501 -5.0%
Interest on Financial Investment 23,416 38,400 -39.0% 24,723 -5.3%
Others 12,196 8,657 40.9% 12,778 -4.6%
(-) Financial Expenses (17,800) (24,387) -27.0% (21,356) -16.7%
Banks Expenses (3,834) (1,955) 96.1% (4,714) -18.7%
Interest on Loans (3,645) (11,747) -69.0% (3,564) 2.3%
Interest and Tax on Late Payment (978) (3,402) -71.3% (5,341) -81.7%
Interest on Loans for Acquisitions (1,667) (3,920) -57.5% (1,744) -4.4%
Restatement of Contingencies (1,205) (4,588) -73.7% (1,644) -26.7%
Others (6,471) 1,225 n.a. (4,349) 48.8%
Financial Result1 17,812 22,670 -21.4% 16,145 10.3%
Consolidated - Values in R$ ('000) 1Q18 1Q17 Chg.% 4Q17 Chg.%
Operating Result 785,792 814,001 -3.5% 704,826 11.5%
(+) Selling and Marketing Expenses (113,924) (110,737) 2.9% (80,256) 42.0%
(+) Corporate Expenses (57,154) (63,735) -10.3% (90,421) -36.8%
(+) Depreciat ion and Amort izat ion ex-Intangible (84,118) (63,868) 31.7% (67,118) 25.3%
(+) Financial Result1 17,812 22,674 -21.4% 16,145 10.3%
(+) Income Tax / Social Contribut ion (20,381) (45,050) -54.8% (9,492) 114.7%
(+) Deferred Income Tax / Social Contribut ion 10,965 23,777 -53.9% 14,954 -26.7%
Adjusted Net Income 538,991 577,062 -6.6% 488,638 10.3%
Adjust ed Net Margin 39.5% 42.3% -2.7 p.p. 36.2% 3.3 p.p.
(+) Nonrecurring Items (45,471) (44,519) 2.1% (58,565) -22.4%
(+) Intangible Amort izat ion (Acquisit ions) (18,105) (38,870) -53.4% (38,512) -53.0%
(+) Income Tax / Social Cont. - Disposal of FAIR, FAC/FAMAT and NOVATEC - - n.a. (904) n.a.
Net Income 475,415 493,673 -3.7% 390,657 21.7%
Net Margin 34.9% 36.2% -1.3 p.p. 28.9% 5.9 p.p.
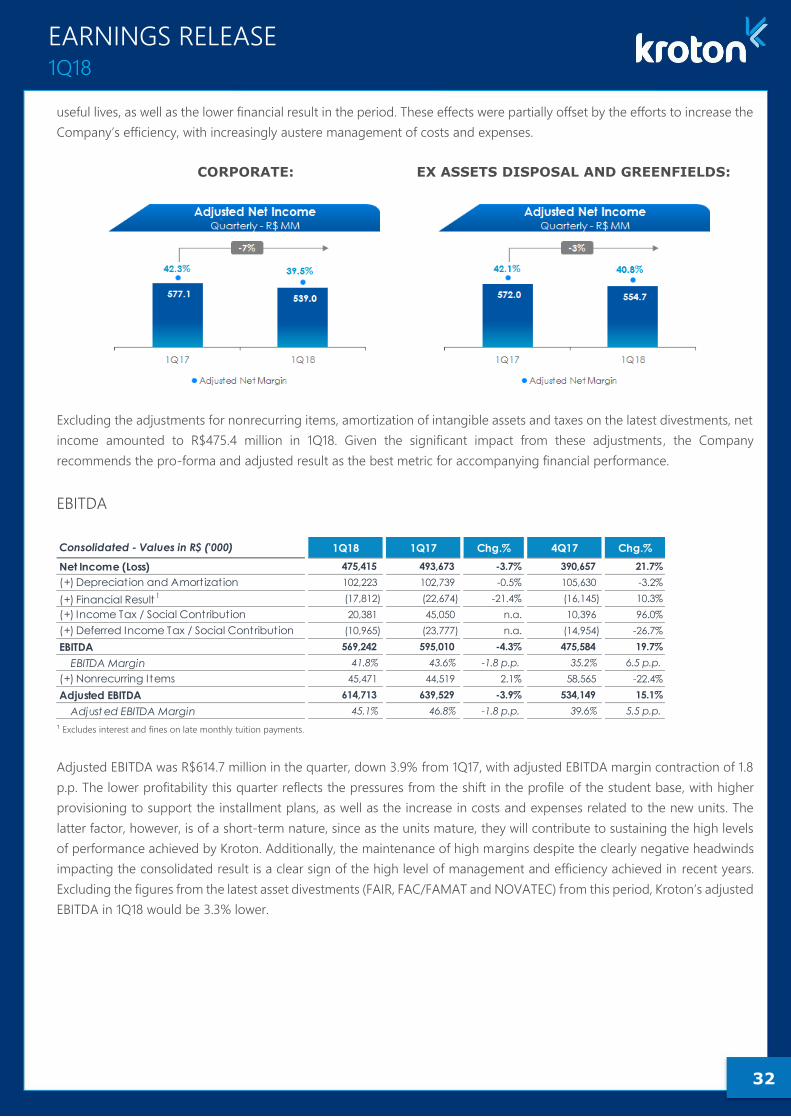
32
EARNINGS RELEASE 1Q18
useful lives, as well as the lower financial result in the period. These effects were partially offset by the efforts to increase the
Company’s efficiency, with increasingly austere management of costs and expenses.
CORPORATE: EX ASSETS DISPOSAL AND GREENFIELDS:
Excluding the adjustments for nonrecurring items, amortization of intangible assets and taxes on the latest divestments, net
income amounted to R$475.4 million in 1Q18. Given the significant impact from these adjustments, the Company
recommends the pro-forma and adjusted result as the best metric for accompanying financial performance.
EBITDA
¹ Excludes interest and fines on late monthly tuition payments.
Adjusted EBITDA was R$614.7 million in the quarter, down 3.9% from 1Q17, with adjusted EBITDA margin contraction of 1.8
p.p. The lower profitability this quarter reflects the pressures from the shift in the profile of the student base, with higher
provisioning to support the installment plans, as well as the increase in costs and expenses related to the new units. The
latter factor, however, is of a short-term nature, since as the units mature, they will contribute to sustaining the high levels
of performance achieved by Kroton. Additionally, the maintenance of high margins despite the clearly negative headwinds
impacting the consolidated result is a clear sign of the high level of management and efficiency achieved in recent years.
Excluding the figures from the latest asset divestments (FAIR, FAC/FAMAT and NOVATEC) from this period, Kroton’s adjusted
EBITDA in 1Q18 would be 3.3% lower.
Consolidated - Values in R$ ('000) 1Q18 1Q17 Chg.% 4Q17 Chg.%
Net Income (Loss) 475,415 493,673 -3.7% 390,657 21.7%
(+) Depreciat ion and Amort izat ion 102,223 102,739 -0.5% 105,630 -3.2%
(+) Financial Result1 (17,812) (22,674) -21.4% (16,145) 10.3%
(+) Income Tax / Social Contribution 20,381 45,050 n.a. 10,396 96.0%
(+) Deferred Income Tax / Social Contribution (10,965) (23,777) n.a. (14,954) -26.7%
EBITDA 569,242 595,010 -4.3% 475,584 19.7%
EBITDA Margin 41.8% 43.6% -1.8 p.p. 35.2% 6.5 p.p.
(+) Nonrecurring Items 45,471 44,519 2.1% 58,565 -22.4%
Adjusted EBITDA 614,713 639,529 -3.9% 534,149 15.1%
Adjust ed EBITDA Margin 45.1% 46.8% -1.8 p.p. 39.6% 5.5 p.p.
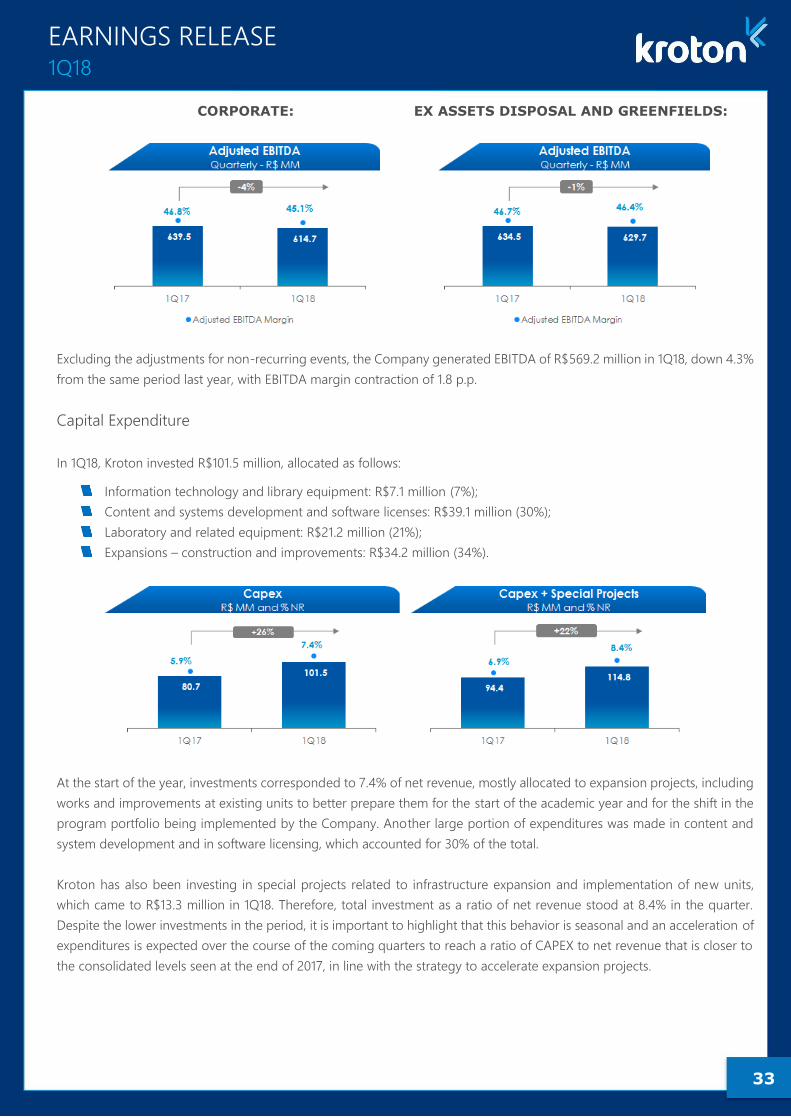
33
EARNINGS RELEASE 1Q18
CORPORATE: EX ASSETS DISPOSAL AND GREENFIELDS:
Excluding the adjustments for non-recurring events, the Company generated EBITDA of R$569.2 million in 1Q18, down 4.3%
from the same period last year, with EBITDA margin contraction of 1.8 p.p.
Capital Expenditure
In 1Q18, Kroton invested R$101.5 million, allocated as follows:
Information technology and library equipment: R$7.1 million (7%);
Content and systems development and software licenses: R$39.1 million (30%);
Laboratory and related equipment: R$21.2 million (21%);
Expansions – construction and improvements: R$34.2 million (34%).
At the start of the year, investments corresponded to 7.4% of net revenue, mostly allocated to expansion projects, including
works and improvements at existing units to better prepare them for the start of the academic year and for the shift in the
program portfolio being implemented by the Company. Another large portion of expenditures was made in content and
system development and in software licensing, which accounted for 30% of the total.
Kroton has also been investing in special projects related to infrastructure expansion and implementation of new units,
which came to R$13.3 million in 1Q18. Therefore, total investment as a ratio of net revenue stood at 8.4% in the quarter.
Despite the lower investments in the period, it is important to highlight that this behavior is seasonal and an acceleration of
expenditures is expected over the course of the coming quarters to reach a ratio of CAPEX to net revenue that is closer to
the consolidated levels seen at the end of 2017, in line with the strategy to accelerate expansion projects.

34
EARNINGS RELEASE 1Q18
Net Debt
¹ Considers only bank obligations.
² Considering all short- and long-term obligations related to the taxes paid in installments and the acquisitions, including the amount to be paid within 6 years related to the
Uniasselvi acquisition.
³ Considers the short-term receivables related to 50% of the FIES installments not paid in 2015 and the long-term receivables related to the Uniasselvi, FAIR, FAC/FAMAT and
NOVATEC divestment to be earned from 2018 to 2022 adjusted to present value (excluding the earn-out amounts).
At the end of 1Q18, total cash and financial investments amounted to R$1,542.7 million, down 11.0% from the previous
quarter, reflecting the stock repurchases at the start of the year, in addition to the payment of dividends relating to 4Q17
and of a portion of the Company’s debentures, in the amount of R$50 million (or R$54.4 million including interest and
charges). Net cash and equivalents stood at R$1,289.4 at the end of 1Q18, increasing 49.9% from the same period in 2017,
driven by the solid cash generation in the previous quarters. Considering all short-term and long-term obligations, which
include taxes and contributions paid in installments and the obligations and rights related to the acquisitions, Kroton ended
the period with net cash of over R$1.1 billion. Total long-term obligations include amounts related to the installment
payments for acquisitions, especially those for Uniasselvi, which are being repaid in six annual installments since 2013. In
addition, it is important to remember that Kroton also has short-term and long-term receivables that will have a positive
impact on its cash in the coming years. These receivables include both the short-term accounts receivables corresponding
to one of the installments from the sale of Uniasselvi and 50% of the FIES installments not paid in 2015, which will be credited
in August 2018 (impacting 3Q18), and the long-term accounts receivables related to the remaining 4 installments of the
payment for Uniasselvi adjusted to present value (excluding the earn-out amounts) that will be received annually until 2022,
as well as the proceeds from the divestment of FAIR, FAC/FAMAT and NOVATEC. Therefore, adding all short-term and long-
term receivables, the net cash balance was even more robust, surpassing R$2.0 billion and placing Kroton in a unique
position in terms of its capital structure and prepared to advance in its growth projects.
Consolidated - Values in R$ ('000) 1Q18 1Q17 Chg.% 4Q17 Chg.%
Cash and Cash Equivalents 1,542,745 1,356,720 13.7% 1,733,269 -11.0%
Cash 257 2,796 -90.8% 294 -12.6%
Securities 1,542,488 1,353,924 13.9% 1,732,975 -11.0%
Loans and Financing 253,373 496,783 -49.0% 303,881 -16.6%
Short-term Debt 177,861 250,691 -29.1% 227,767 -21.9%
Long-term Debt 75,512 246,092 -69.3% 76,114 -0.8%
Net Cash (Debt) ¹ 1,289,372 859,937 49.9% 1,429,388 -9.8%
Other Short and Long Term Debt ² 174,639 202,354 -13.7% 171,191 2.0%
(1) Net Cash (Debt) 1,114,733 657,583 69.5% 1,258,197 -11.4%
Short Term Accounts Receivable ³ 502,674 196,910 155.3% 495,298 1.5%
FIES - NR 23 - cash balance and Uniasselv i Disposal 376,726 196,910 91.3% 370,664 1.6%
Uniasselv i Disposal 115,952 - n.a. 114,743 1.1%
FAIR , FAC/FAMAT and NOVATEC Disposal 9,996 - n.a. 9,891 1.1%
Long-Term Accounts Receivable ³ 456,306 866,950 -47.4% 446,891 2.1%
FIES - NR 23 - cash balance - 359,178 n.a. - n.a.
Uniasselv i Disposal 422,290 507,772 -16.8% 413,806 2.1%
FAIR , FAC/FAMAT and NOVATEC Disposal 34,016 - n.a. 33,085 2.8%
(2) Other Accouts Receivable ᶟ 958,980 1,063,861 -9.9% 942,189 1.8%
(1)+(2) Pro Forma Net Cash (Debt) 2,073,713 1,721,444 20.5% 2,200,386 -5.8%
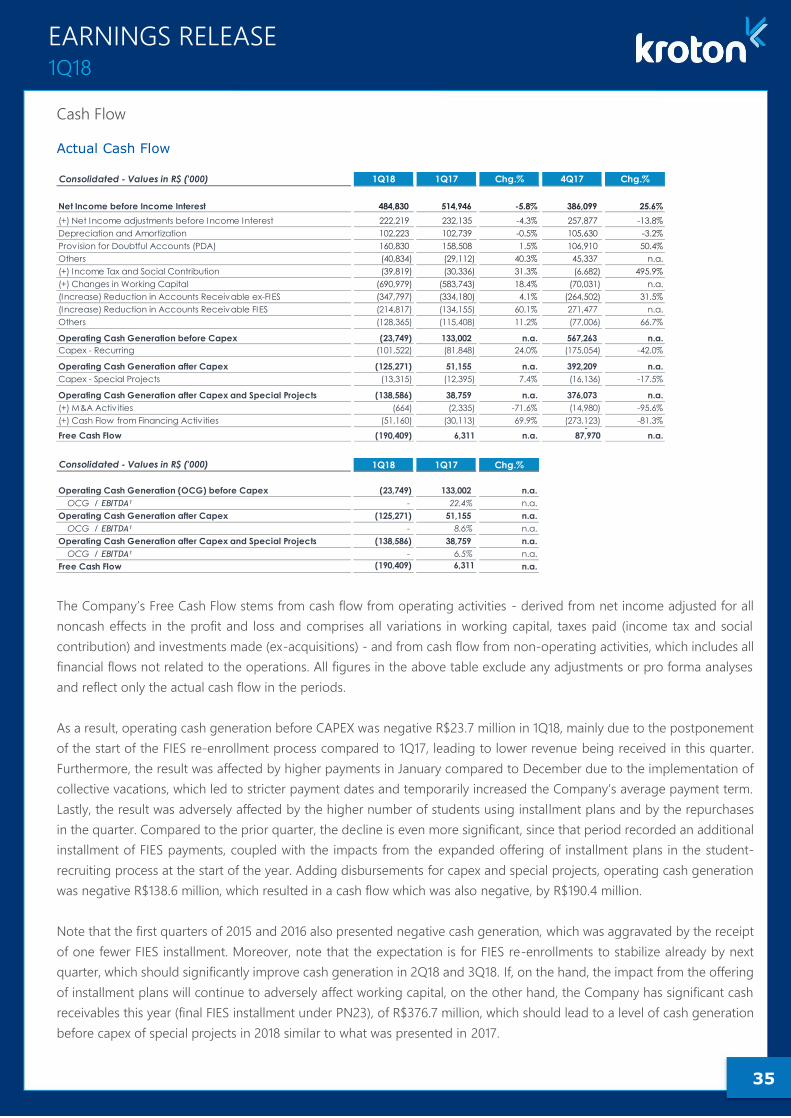
35
EARNINGS RELEASE 1Q18
Cash Flow
Actual Cash Flow
The Company’s Free Cash Flow stems from cash flow from operating activities - derived from net income adjusted for all
noncash effects in the profit and loss and comprises all variations in working capital, taxes paid (income tax and social
contribution) and investments made (ex-acquisitions) - and from cash flow from non-operating activities, which includes all
financial flows not related to the operations. All figures in the above table exclude any adjustments or pro forma analyses
and reflect only the actual cash flow in the periods.
As a result, operating cash generation before CAPEX was negative R$23.7 million in 1Q18, mainly due to the postponement
of the start of the FIES re-enrollment process compared to 1Q17, leading to lower revenue being received in this quarter.
Furthermore, the result was affected by higher payments in January compared to December due to the implementation of
collective vacations, which led to stricter payment dates and temporarily increased the Company’s average payment term.
Lastly, the result was adversely affected by the higher number of students using installment plans and by the repurchases
in the quarter. Compared to the prior quarter, the decline is even more significant, since that period recorded an additional
installment of FIES payments, coupled with the impacts from the expanded offering of installment plans in the student-
recruiting process at the start of the year. Adding disbursements for capex and special projects, operating cash generation
was negative R$138.6 million, which resulted in a cash flow which was also negative, by R$190.4 million.
Note that the first quarters of 2015 and 2016 also presented negative cash generation, which was aggravated by the receipt
of one fewer FIES installment. Moreover, note that the expectation is for FIES re-enrollments to stabilize already by next
quarter, which should significantly improve cash generation in 2Q18 and 3Q18. If, on the hand, the impact from the offering
of installment plans will continue to adversely affect working capital, on the other hand, the Company has significant cash
receivables this year (final FIES installment under PN23), of R$376.7 million, which should lead to a level of cash generation
before capex of special projects in 2018 similar to what was presented in 2017.
Consolidated - Values in R$ ('000) 1Q18 1Q17 Chg.% 4Q17 Chg.%
Net Income before Income Interest 484,830 514,946 -5.8% 386,099 25.6%
(+) Net Income adjustments before Income Interest 222,219 232,135 -4.3% 257,877 -13.8%
Depreciation and Amortization 102,223 102,739 -0.5% 105,630 -3.2%
Provision for Doubtful Accounts (PDA) 160,830 158,508 1.5% 106,910 50.4%
Others (40,834) (29,112) 40.3% 45,337 n.a.
(+) Income Tax and Social Contribution (39,819) (30,336) 31.3% (6,682) 495.9%
(+) Changes in Working Capital (690,979) (583,743) 18.4% (70,031) n.a.
(Increase) Reduction in Accounts Receivable ex-FIES (347,797) (334,180) 4.1% (264,502) 31.5%
(Increase) Reduction in Accounts Receivable FIES (214,817) (134,155) 60.1% 271,477 n.a.
Others (128,365) (115,408) 11.2% (77,006) 66.7%
Operating Cash Generation before Capex (23,749) 133,002 n.a. 567,263 n.a.
Capex - Recurring (101,522) (81,848) 24.0% (175,054) -42.0%
Operating Cash Generation after Capex (125,271) 51,155 n.a. 392,209 n.a.
Capex - Special Projects (13,315) (12,395) 7.4% (16,136) -17.5%
Operating Cash Generation after Capex and Special Projects (138,586) 38,759 n.a. 376,073 n.a.
(+) M&A Activ ities (664) (2,335) -71.6% (14,980) -95.6%
(+) Cash Flow from Financing Activ ities (51,160) (30,113) 69.9% (273,123) -81.3%-
Free Cash Flow (190,409) 6,311 n.a. 87,970 n.a.
Consolidated - Values in R$ ('000) 1Q18 1Q17 Chg.%
Operating Cash Generation (OCG) before Capex (23,749) 133,002 n.a.
OCG / EBITDA¹ - 22.4% n.a.
Operating Cash Generation after Capex (125,271) 51,155 n.a.
OCG / EBITDA¹ - 8.6% n.a.
Operating Cash Generation after Capex and Special Projects (138,586) 38,759 n.a.
OCG / EBITDA¹ - 6.5% n.a.
Free Cash Flow (190,409) 6,311 n.a.
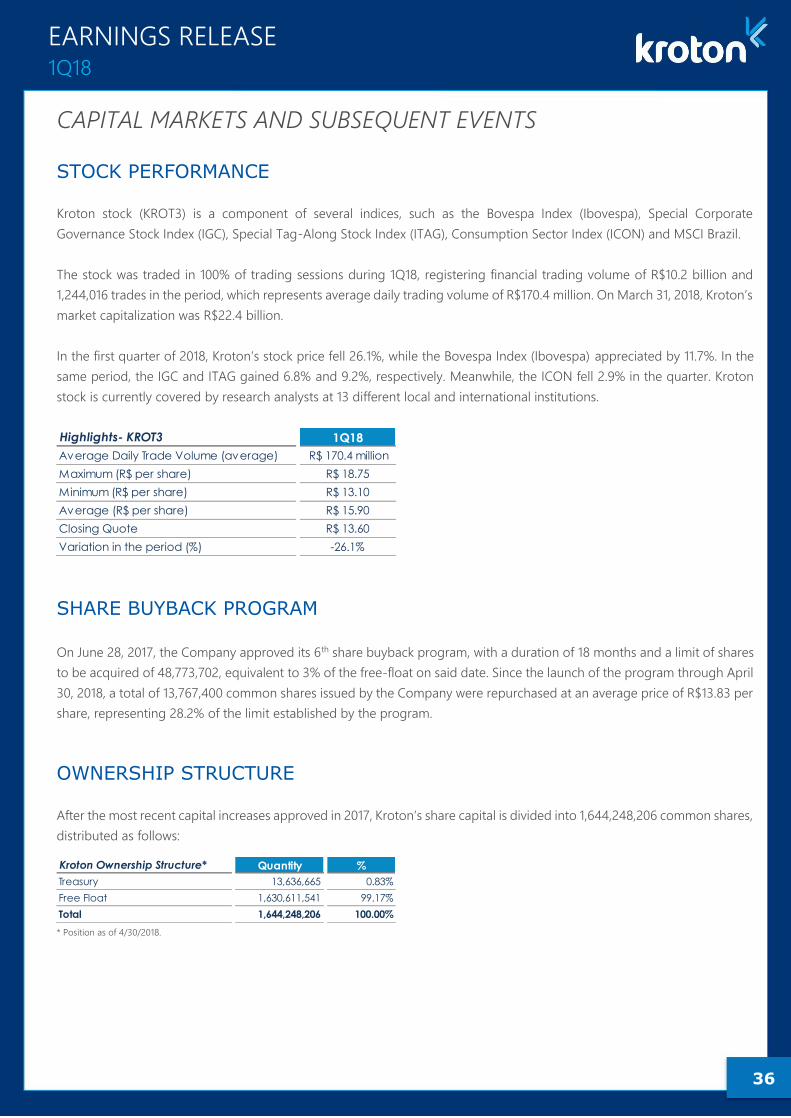
36
EARNINGS RELEASE 1Q18
CAPITAL MARKETS AND SUBSEQUENT EVENTS
STOCK PERFORMANCE
Kroton stock (KROT3) is a component of several indices, such as the Bovespa Index (Ibovespa), Special Corporate
Governance Stock Index (IGC), Special Tag-Along Stock Index (ITAG), Consumption Sector Index (ICON) and MSCI Brazil.
The stock was traded in 100% of trading sessions during 1Q18, registering financial trading volume of R$10.2 billion and
1,244,016 trades in the period, which represents average daily trading volume of R$170.4 million. On March 31, 2018, Kroton’s
market capitalization was R$22.4 billion.
In the first quarter of 2018, Kroton’s stock price fell 26.1%, while the Bovespa Index (Ibovespa) appreciated by 11.7%. In the
same period, the IGC and ITAG gained 6.8% and 9.2%, respectively. Meanwhile, the ICON fell 2.9% in the quarter. Kroton
stock is currently covered by research analysts at 13 different local and international institutions.
SHARE BUYBACK PROGRAM
On June 28, 2017, the Company approved its 6th share buyback program, with a duration of 18 months and a limit of shares
to be acquired of 48,773,702, equivalent to 3% of the free-float on said date. Since the launch of the program through April
30, 2018, a total of 13,767,400 common shares issued by the Company were repurchased at an average price of R$13.83 per
share, representing 28.2% of the limit established by the program.
OWNERSHIP STRUCTURE
After the most recent capital increases approved in 2017, Kroton’s share capital is divided into 1,644,248,206 common shares,
distributed as follows:
* Position as of 4/30/2018.
Highlights- KROT3 1Q18
Average Daily Trade Volume (average) R$ 170.4 million
Maximum (R$ per share) R$ 18.75
Minimum (R$ per share) R$ 13.10
Average (R$ per share) R$ 15.90
Closing Quote R$ 13.60
Variation in the period (%) -26.1%
Kroton Ownership Structure* Quantity %
Treasury 13,636,665 0.83%
Free Float 1,630,611,541 99.17%
Total 1,644,248,206 100.00%
37
EARNINGS RELEASE 1Q18
DIVIDENDS
In a Meeting held on May 11, 2018, the Board of Directors approved the distribution of dividends related to the results for
the first quarter of 2018 in the amount of R$180.7 million, which will be calculated towards the minimum mandatory dividend
for 2018 and corresponds to R$ 0.1107914697 per common share and to 40% of adjusted net income, after deduction of the
legal reserve. Shareholders of record at the close of trading on May 18, 2018 are entitled to the dividends.
ABOUT KROTON EDUCACIONAL
Kroton Educacional S.A. is one of the largest private for-profit educational organizations in the world. Operating for over 50
years, the Company has a nationwide presence in all of Brazil’s states. At the end of 1Q18, Kroton had 997,000 students
enrolled in its On-Campus and Distance Learning Postsecondary Education programs at its 128 Postsecondary units and its
1,210 Distance Learning centers. It also offers Preparatory Courses under the brand LFG. In Primary & Secondary Education,
its main business is offering Learning Systems, which in 2018 serves 687 private schools in the country.
DISCLAIMER
This document contains forward-looking statements and information. These forward-looking statements and information
are merely forecasts and not guarantees of future performance. All stakeholders are cautioned that such forward-looking
statements and information involve risks, uncertainties and factors relating to the operations and business environments of
Kroton and its subsidiaries and affiliates, and that the actual results of the companies could differ materially from the future
results anticipated explicitly or implicitly by such forward-looking statements and information.
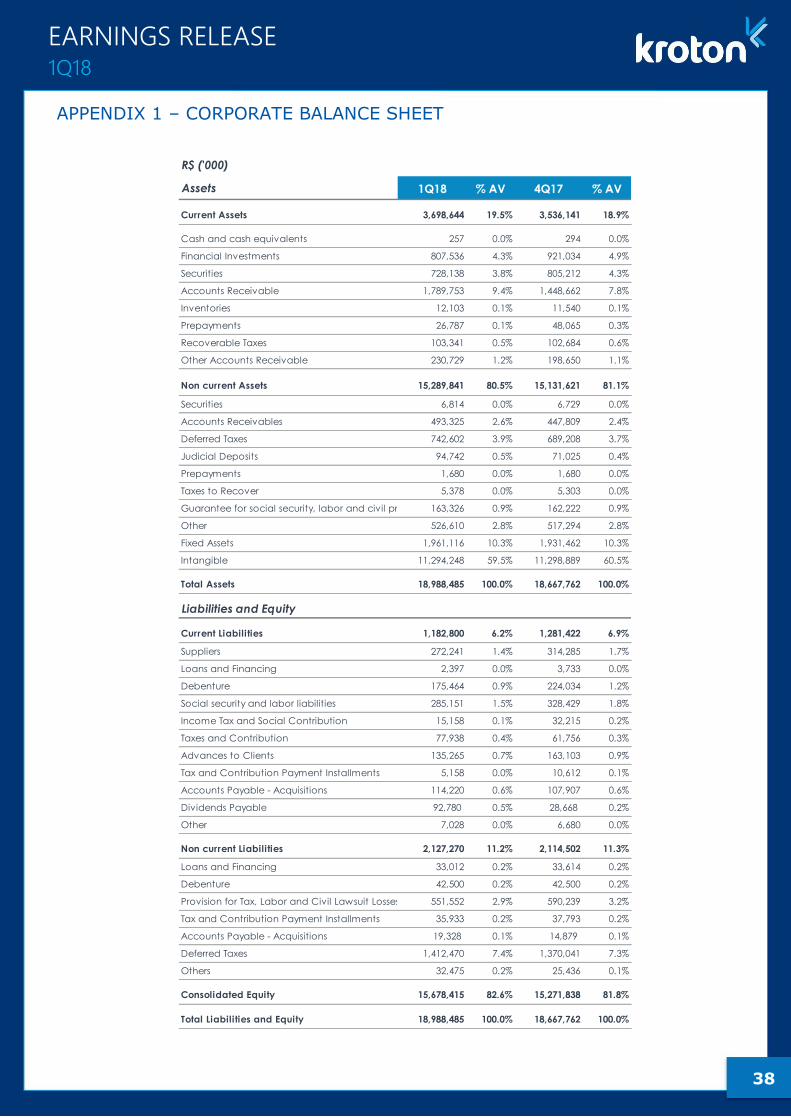
38
EARNINGS RELEASE 1Q18
APPENDIX 1 – CORPORATE BALANCE SHEET
R$ ('000)
Assets 1Q18 % AV 4Q17 % AV
Current Assets 3,698,644 19.5% 3,536,141 18.9%
Cash and cash equivalents 257 0.0% 294 0.0%
Financial Investments 807,536 4.3% 921,034 4.9%
Securities 728,138 3.8% 805,212 4.3%
Accounts Receivable 1,789,753 9.4% 1,448,662 7.8%
Inventories 12,103 0.1% 11,540 0.1%
Prepayments 26,787 0.1% 48,065 0.3%
Recoverable Taxes 103,341 0.5% 102,684 0.6%
Other Accounts Receivable 230,729 1.2% 198,650 1.1%
Non current Assets 15,289,841 80.5% 15,131,621 81.1%
Securities 6,814 0.0% 6,729 0.0%
Accounts Receivables 493,325 2.6% 447,809 2.4%
Deferred Taxes 742,602 3.9% 689,208 3.7%
Judicial Deposits 94,742 0.5% 71,025 0.4%
Prepayments 1,680 0.0% 1,680 0.0%
Taxes to Recover 5,378 0.0% 5,303 0.0%
Guarantee for social security, labor and civil provisions163,326 0.9% 162,222 0.9%
Other 526,610 2.8% 517,294 2.8%
Fixed Assets 1,961,116 10.3% 1,931,462 10.3%
Intangible 11,294,248 59.5% 11,298,889 60.5%
Total Assets 18,988,485 100.0% 18,667,762 100.0%
Liabilities and Equity
Current Liabilities 1,182,800 6.2% 1,281,422 6.9%
Suppliers 272,241 1.4% 314,285 1.7%
Loans and Financing 2,397 0.0% 3,733 0.0%
Debenture 175,464 0.9% 224,034 1.2%
Social security and labor liabilities 285,151 1.5% 328,429 1.8%
Income Tax and Social Contribution 15,158 0.1% 32,215 0.2%
Taxes and Contribution 77,938 0.4% 61,756 0.3%
Advances to Clients 135,265 0.7% 163,103 0.9%
Tax and Contribution Payment Installments 5,158 0.0% 10,612 0.1%
Accounts Payable - Acquisitions 114,220 0.6% 107,907 0.6%
Dividends Payable 92,780 0.5% 28,668 0.2%
Other 7,028 0.0% 6,680 0.0%
Non current Liabilities 2,127,270 11.2% 2,114,502 11.3%
Loans and Financing 33,012 0.2% 33,614 0.2%
Debenture 42,500 0.2% 42,500 0.2%
Provision for Tax, Labor and Civil Lawsuit Losses 551,552 2.9% 590,239 3.2%
Tax and Contribution Payment Installments 35,933 0.2% 37,793 0.2%
Accounts Payable - Acquisitions 19,328 0.1% 14,879 0.1%
Deferred Taxes 1,412,470 7.4% 1,370,041 7.3%
Others 32,475 0.2% 25,436 0.1%
Consolidated Equity 15,678,415 82.6% 15,271,838 81.8%
Total Liabilities and Equity 18,988,485 100.0% 18,667,762 100.0%
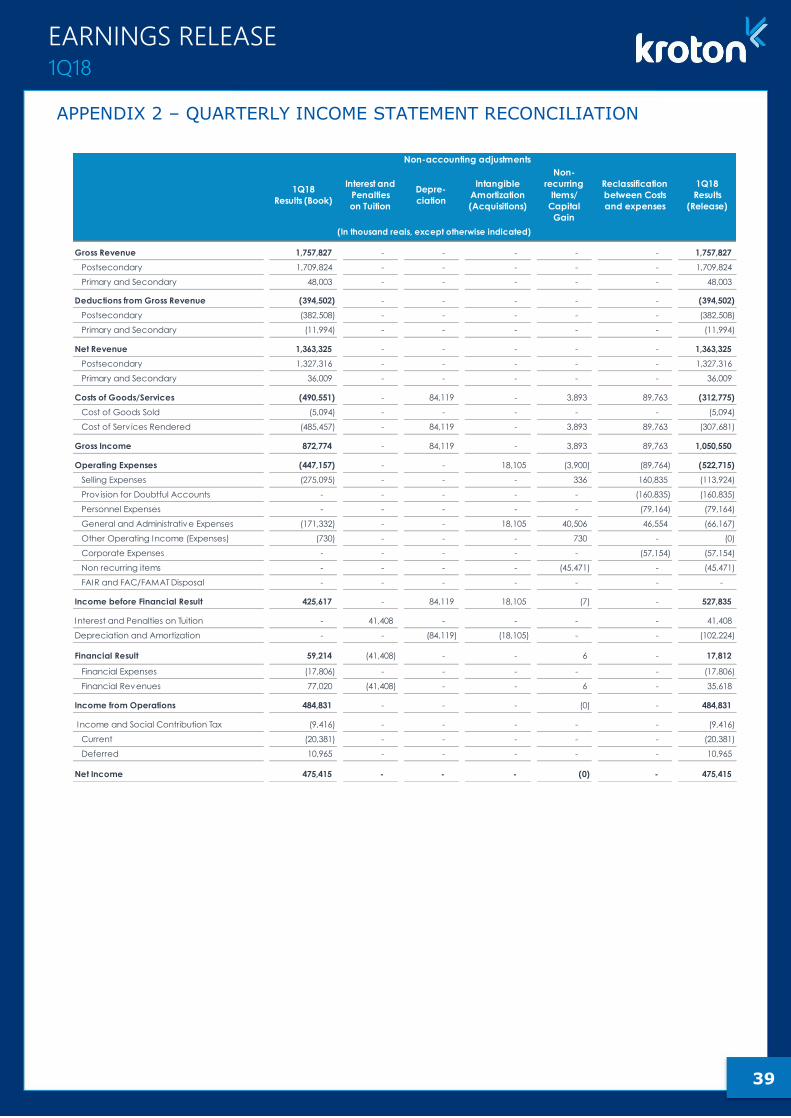
39
EARNINGS RELEASE 1Q18
APPENDIX 2 – QUARTERLY INCOME STATEMENT RECONCILIATION
1Q18
Results (Book)
Interest and
Penalties
on Tuition
Depre-
ciation
Intangible
Amortization
(Acquisitions)
Non-
recurring
Items/
Capital
Gain
Reclassification
between Costs
and expenses
1Q18
Results
(Release)
Gross Revenue 1,757,827 - - - - - 1,757,827
Postsecondary 1,709,824 - - - - - 1,709,824
Primary and Secondary 48,003 - - - - - 48,003
Deductions from Gross Revenue (394,502) - - - - - (394,502)
Postsecondary (382,508) - - - - - (382,508)
Primary and Secondary (11,994) - - - - - (11,994)
Net Revenue 1,363,325 - - - - - 1,363,325
Postsecondary 1,327,316 - - - - - 1,327,316
Primary and Secondary 36,009 - - - - - 36,009
Costs of Goods/Services (490,551) - 84,119 - 3,893 89,763 (312,775)
Cost of Goods Sold (5,094) - - - - - (5,094)
Cost of Serv ices Rendered (485,457) - 84,119 - 3,893 89,763 (307,681)
Gross Income 872,774 - 84,119 - 3,893 89,763 1,050,550
Operating Expenses (447,157) - - 18,105 (3,900) (89,764) (522,715)
Selling Expenses (275,095) - - - 336 160,835 (113,924)
Prov ision for Doubtful Accounts - - - - - (160,835) (160,835)
Personnel Expenses - - - - - (79,164) (79,164)
General and Administrative Expenses (171,332) - - 18,105 40,506 46,554 (66,167)
Other Operating Income (Expenses) (730) - - - 730 - (0)
Corporate Expenses - - - - - (57,154) (57,154)
Non recurring items - - - - (45,471) - (45,471)
FAIR and FAC/FAMAT Disposal - - - - - - -
Income before Financial Result 425,617 - 84,119 18,105 (7) - 527,835
Interest and Penalties on Tuition - 41,408 - - - - 41,408
Depreciation and Amortization - - (84,119) (18,105) - - (102,224)
Financial Result 59,214 (41,408) - - 6 - 17,812
Financial Expenses (17,806) - - - - - (17,806)
Financial Revenues 77,020 (41,408) - - 6 - 35,618
Income from Operations 484,831 - - - (0) - 484,831
Income and Social Contribution Tax (9,416) - - - - - (9,416)
Current (20,381) - - - - - (20,381)
Deferred 10,965 - - - - - 10,965
Net Income 475,415 - - - (0) - 475,415
Non-accounting adjustments
(In thousand reais, except otherwise indicated)
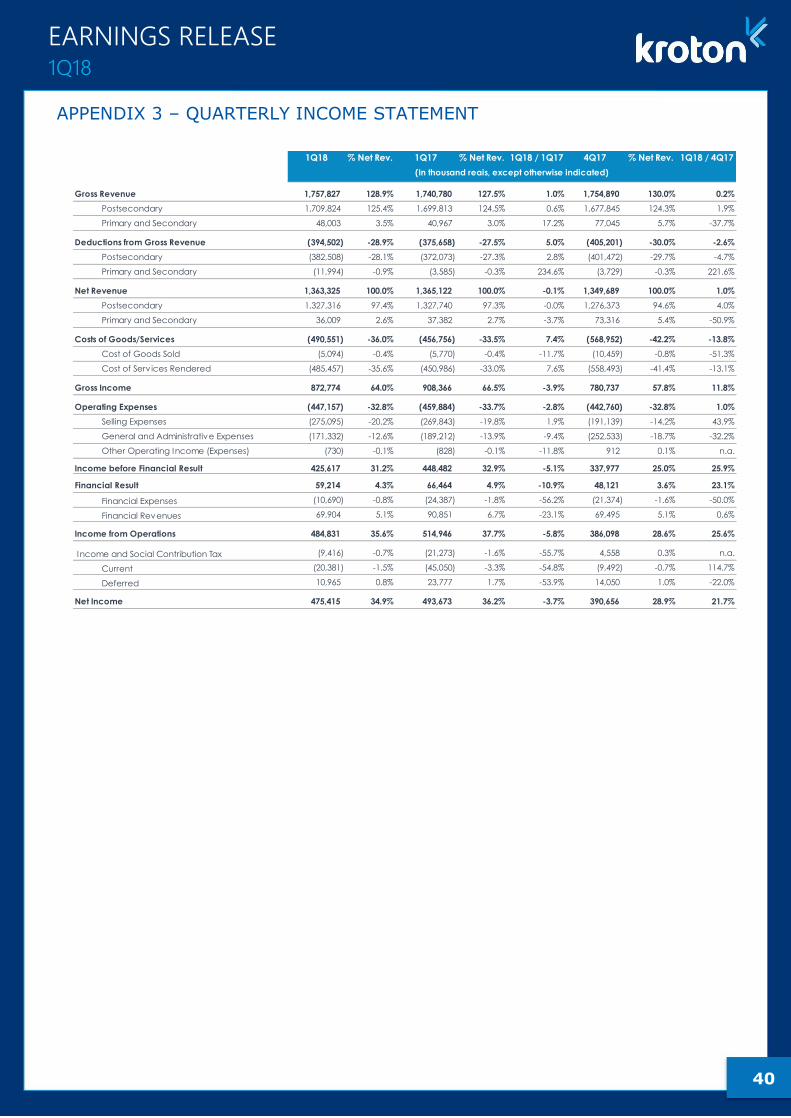
40
EARNINGS RELEASE 1Q18
APPENDIX 3 – QUARTERLY INCOME STATEMENT
1Q18 % Net Rev. 1Q17 % Net Rev. 1Q18 / 1Q17 4Q17 % Net Rev. 1Q18 / 4Q17
Gross Revenue 1,757,827 128.9% 1,740,780 127.5% 1.0% 1,754,890 130.0% 0.2%
Postsecondary 1,709,824 125.4% 1,699,813 124.5% 0.6% 1,677,845 124.3% 1.9%
Primary and Secondary 48,003 3.5% 40,967 3.0% 17.2% 77,045 5.7% -37.7%
Deductions from Gross Revenue (394,502) -28.9% (375,658) -27.5% 5.0% (405,201) -30.0% -2.6%
Postsecondary (382,508) -28.1% (372,073) -27.3% 2.8% (401,472) -29.7% -4.7%
Primary and Secondary (11,994) -0.9% (3,585) -0.3% 234.6% (3,729) -0.3% 221.6%
Net Revenue 1,363,325 100.0% 1,365,122 100.0% -0.1% 1,349,689 100.0% 1.0%
Postsecondary 1,327,316 97.4% 1,327,740 97.3% -0.0% 1,276,373 94.6% 4.0%
Primary and Secondary 36,009 2.6% 37,382 2.7% -3.7% 73,316 5.4% -50.9%
Costs of Goods/Services (490,551) -36.0% (456,756) -33.5% 7.4% (568,952) -42.2% -13.8%
Cost of Goods Sold (5,094) -0.4% (5,770) -0.4% -11.7% (10,459) -0.8% -51.3%
Cost of Serv ices Rendered (485,457) -35.6% (450,986) -33.0% 7.6% (558,493) -41.4% -13.1%
Gross Income 872,774 64.0% 908,366 66.5% -3.9% 780,737 57.8% 11.8%
Operating Expenses (447,157) -32.8% (459,884) -33.7% -2.8% (442,760) -32.8% 1.0%
Selling Expenses (275,095) -20.2% (269,843) -19.8% 1.9% (191,139) -14.2% 43.9%
General and Administrative Expenses (171,332) -12.6% (189,212) -13.9% -9.4% (252,533) -18.7% -32.2%
Other Operating Income (Expenses) (730) -0.1% (828) -0.1% -11.8% 912 0.1% n.a.
Income before Financial Result 425,617 31.2% 448,482 32.9% -5.1% 337,977 25.0% 25.9%
Financial Result 59,214 4.3% 66,464 4.9% -10.9% 48,121 3.6% 23.1%
Financial Expenses (10,690) -0.8% (24,387) -1.8% -56.2% (21,374) -1.6% -50.0%
Financial Revenues 69,904 5.1% 90,851 6.7% -23.1% 69,495 5.1% 0.6%
Income from Operations 484,831 35.6% 514,946 37.7% -5.8% 386,098 28.6% 25.6%
Income and Social Contribution Tax (9,416) -0.7% (21,273) -1.6% -55.7% 4,558 0.3% n.a.
Current (20,381) -1.5% (45,050) -3.3% -54.8% (9,492) -0.7% 114.7%
Deferred 10,965 0.8% 23,777 1.7% -53.9% 14,050 1.0% -22.0%
Net Income 475,415 34.9% 493,673 36.2% -3.7% 390,656 28.9% 21.7%
(In thousand reais, except otherwise indicated)
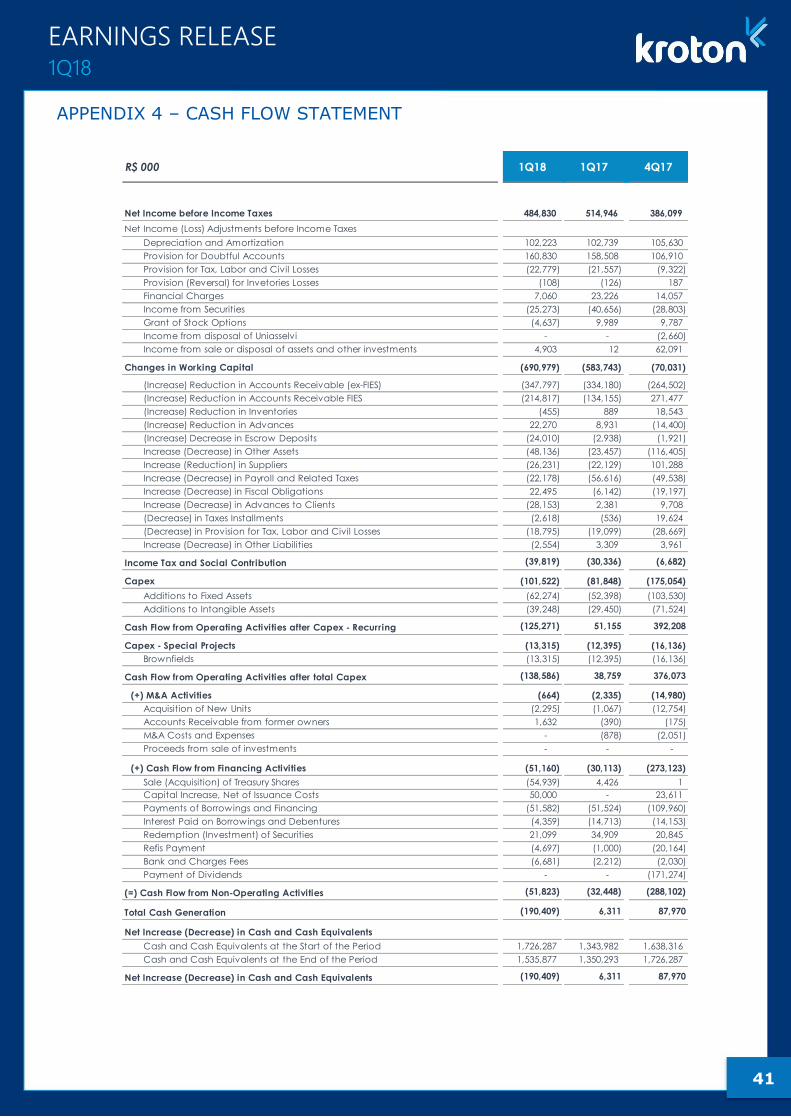
41
EARNINGS RELEASE 1Q18
APPENDIX 4 – CASH FLOW STATEMENT
R$ 000 1Q18 1Q17 4Q17
Net Income before Income Taxes 484,830 514,946 386,099 - - -
Net Income (Loss) Adjustments before Income Taxes
Depreciation and Amortization 102,223 102,739 105,630
Provision for Doubtful Accounts 160,830 158,508 106,910
Provision for Tax, Labor and Civil Losses (22,779) (21,557) (9,322)
Provision (Reversal) for Invetories Losses (108) (126) 187
Financial Charges 7,060 23,226 14,057
Income from Securities (25,273) (40,656) (28,803)
Grant of Stock Options (4,637) 9,989 9,787
Income from disposal of Uniasselvi - - (2,660)
Income from sale or disposal of assets and other investments 4,903 12 62,091 - - -
Changes in Working Capital (690,979) (583,743) (70,031) - - -
(Increase) Reduction in Accounts Receivable (ex-FIES) (347,797) (334,180) (264,502)
(Increase) Reduction in Accounts Receivable FIES (214,817) (134,155) 271,477
(Increase) Reduction in Inventories (455) 889 18,543
(Increase) Reduction in Advances 22,270 8,931 (14,400)
(Increase) Decrease in Escrow Deposits (24,010) (2,938) (1,921)
Increase (Decrease) in Other Assets (48,136) (23,457) (116,405)
Increase (Reduction) in Suppliers (26,231) (22,129) 101,288
Increase (Decrease) in Payroll and Related Taxes (22,178) (56,616) (49,538)
Increase (Decrease) in Fiscal Obligations 22,495 (6,142) (19,197)
Increase (Decrease) in Advances to Clients (28,153) 2,381 9,708
(Decrease) in Taxes Installments (2,618) (536) 19,624
(Decrease) in Provision for Tax, Labor and Civil Losses (18,795) (19,099) (28,669)
Increase (Decrease) in Other Liabilities (2,554) 3,309 3,961 - - -
Income Tax and Social Contribution (39,819) (30,336) (6,682)- - -
Capex (101,522) (81,848) (175,054) - - -
Additions to Fixed Assets (62,274) (52,398) (103,530)
Additions to Intangible Assets (39,248) (29,450) (71,524) - - -
Cash Flow from Operating Activities after Capex - Recurring (125,271) 51,155 392,208 0 0 0
Capex - Special Projects (13,315) (12,395) (16,136)
Brownfields (13,315) (12,395) (16,136) 0 0 0
Cash Flow from Operating Activities after total Capex (138,586) 38,759 376,073 - - -
(+) M&A Activities (664) (2,335) (14,980)
Acquisition of New Units (2,295) (1,067) (12,754)
Accounts Receivable from former owners 1,632 (390) (175)
M&A Costs and Expenses - (878) (2,051)
Proceeds from sale of investments - - - - - -
(+) Cash Flow from Financing Activities (51,160) (30,113) (273,123)
Sale (Acquisition) of Treasury Shares (54,939) 4,426 1
Capital Increase, Net of Issuance Costs 50,000 - 23,611
Payments of Borrowings and Financing (51,582) (51,524) (109,960)
Interest Paid on Borrowings and Debentures (4,359) (14,713) (14,153)
Redemption (Investment) of Securities 21,099 34,909 20,845
Refis Payment (4,697) (1,000) (20,164)
Bank and Charges Fees (6,681) (2,212) (2,030)
Payment of Dividends - - (171,274) - - -
(=) Cash Flow from Non-Operating Activities (51,823) (32,448) (288,102)- - -
Total Cash Generation (190,409) 6,311 87,970 - - -
Net Increase (Decrease) in Cash and Cash Equivalents
Cash and Cash Equivalents at the Start of the Period 1,726,287 1,343,982 1,638,316
Cash and Cash Equivalents at the End of the Period 1,535,877 1,350,293 1,726,287 - - -
Net Increase (Decrease) in Cash and Cash Equivalents (190,409) 6,311 87,970