Earliness of Bolting and Flowering in Lettuce Mapping and ...
34
Page 1/34 Mapping and Identication of Genetic Loci Affecting Earliness of Bolting and Flowering in Lettuce Leah Rosental Ben-Gurion University of the Negev David W. Still Cal Poly Pomona: California State Polytechnic University Pomona Youngsook You Cal Poly Pomona: California State Polytechnic University Pomona Ryan J. Hayes USDA-ARS Forage Seed and Cereal Research Unit Ivan Simko ( [email protected] ) USDA-ARS Crop Improvement and Protection Research Unit Research Article Keywords: Lettuce, QTL, bolting, owering, photoperiod, temperature Posted Date: April 26th, 2021 DOI: https://doi.org/10.21203/rs.3.rs-432642/v1 License: This work is licensed under a Creative Commons Attribution 4.0 International License. Read Full License
Transcript of Earliness of Bolting and Flowering in Lettuce Mapping and ...

Page 1/34
Mapping and Identi�cation of Genetic Loci AffectingEarliness of Bolting and Flowering in LettuceLeah Rosental
Ben-Gurion University of the NegevDavid W. Still
Cal Poly Pomona: California State Polytechnic University PomonaYoungsook You
Cal Poly Pomona: California State Polytechnic University PomonaRyan J. Hayes
USDA-ARS Forage Seed and Cereal Research UnitIvan Simko ( [email protected] )
USDA-ARS Crop Improvement and Protection Research Unit
Research Article
Keywords: Lettuce, QTL, bolting, �owering, photoperiod, temperature
Posted Date: April 26th, 2021
DOI: https://doi.org/10.21203/rs.3.rs-432642/v1
License: This work is licensed under a Creative Commons Attribution 4.0 International License. Read FullLicense

Page 2/34
AbstractBolting, de�ned as stem elongation, marks the plant life cycle transition from vegetative to reproductive stage. Lettuceis grown for its leaf rosettes, and premature bolting may reduce crop quality resulting in economic losses. Thetransition to reproductive stage is a complex process that involves many genetic and environmental factors. In thisstudy the effects of photoperiod and ambient temperature on bolting and �owering regulation was studied by utilizinga lettuce mapping population to identify quantitative trait loci (QTL) and by gene expression analyses of genotypeswith contrasting phenotypes. A recombinant inbred line (RIL) population, derived from a cross between PI251246(early bolting) and cv. Salinas (late bolting), was grown in four combinations of short (8 hours) and long (16 hours)days and low (20°C) and high (35°C) temperature. QTL models revealed both genetic (G) and environmental (E)effects, and GxE interactions. A major QTL for bolting and �owering time was found on chromosome 7 (qFLT7.2) andtwo candidate genes were identi�ed by �ne mapping, homology and gene expression studies. In short days and hightemperature conditions qFLT7.2 had no effect on plant development, while several small-effect loci on chromosomes2, 3, 6, 8 and 9 were associated with bolting and �owering. Of these, the QTL on chromosome 2, qBFr2.1, co-locatedwith the Flowering Locus T (LsFT) gene. Polymorphisms between parent genotypes in the promotor region mayexplain identi�ed gene expression differences, and were used to design a genetic marker which may be used toidentify the late bolting trait.
Key MessagePhotoperiod and temperature conditions elicit different genetic regulation over lettuce bolting and �owering. Thisstudy identi�es environment-speci�c QTLs and putative genes and provides information for genetic marker assay.
IntroductionThe phase transition from vegetative to the reproductive stage is a critical step in the life cycle of �owering plants thataffects the successes of �owering, fruit set, and seed production. In lettuce (Lactuca sativa L.), the transition from thevegetative to reproductive stage occurs in the meristem concealed within the rosette. During the transition, thevegetative shoot apical meristem cap is elongated and then the microscopic �oral primordia are formed (Chen et al.2018b, a). Subsequently, rapid elongation of the stem internodes occurs, a process called bolting, and thein�orescence expands followed by �owers opening over the course of several days. Since lettuce is a crop grown forits leaf rosettes, early bolting is an undesirable trait. Determining the genetic and environmental factors affectingbolting would increase the ability to develop cultivars with greater resistance to premature bolting.
The vegetative-�owering transition is regulated by a complex network of genetic and environmental factors. In thewell-studied Arabidopsis model, more than 100 genes have been implicated in the control of �owering time (Komeda2004; Putterill et al. 2004; Amasino 2010; Bouché et al. 2016) Internal regulatory pathways converge with pathwaysintegrating environmental signals to control the timing of meristem differentiation. Endogenous factors in�uence�oral induction and include the gibberellin (GA) pathway, circadian clock, and plant age (Fornara et al. 2010; Song etal. 2015; Bao et al. 2020). Environmental cues in�uencing �owering time include day length, light quality, ambienttemperature, and vernalization (Michaels and Amasino 2000; Samach and Coupland 2000; Blázquez et al. 2003; Songet al. 2013; Romera-Branchat et al. 2014; Capovilla et al. 2015; Cho et al. 2017).
Lettuce is a facultative long-day plant, and cultivars and accessions exhibit wide variability in the rate of transition to�owering (Ryder 1988; Lafta et al. 2017). Very early cultivars (Ryder 1996) start to bolt and �ower seven weeks afterplanting in long days in a greenhouse while very late cultivars may �ower as late as four months after planting.
Page 3/34
Besides genetic factors, environmental factors substantially affect the rate of transition to the reproductive phase (Itoet al. 1963; Jenni et al. 2013). Earlier bolting (less than 90 days) can be induced in certain genotypes by increased daylength (Waycott 1995) or by high ambient temperatures (Rappaport et al. 1956), thus leading to a strong genotype xenvironment (GxE) interaction (Lafta et al. 2017; Wien 2017).
For lettuce production, a prolonged vegetative phase is bene�cial for accumulation of leaf biomass and to maintainquality. Premature bolting results in elongated cores and/or cracked heads that are not suitable for the market. Inaddition, the initiation of �ower signaling causes biochemical changes to form accumulation of latex in the leaveswhich makes them undesirably bitter (Simonne et al. 2002). Premature bolting can lead to partial or complete yieldloss, particularly in early fall planting periods in hot production regions. Therefore, the genetic basis for regulation ofbolting and �owering has been the focus of numerous studies over years (Thompson 1943; Rappaport et al. 1956;Ryder 1983; Ryder and Milligan 2005; Han et al. 2021).
Ryder (1983, 1988) identi�ed two genes controlling early �owering (Ef) Ef-1 and Ef-2, with earliness beingincompletely dominant. The author later described four more Ef genes in additional crosses (Ryder and Milligan2005). More recently, multiple quantitative trait loci (QTLs) for bolting and �owering time, as well as for stem length,which correlates with earliness of bolting, have been identi�ed on lettuce chromosomes 2 and 7 (Jeuken and Lindhout2004; Hartman et al. 2012, 2013; Han et al. 2021) in crosses between cultivated lettuce and its wild relatives. In arecombinant inbred line (RIL) population developed from crossing late and early bolting lettuce cultivars andevaluated in four summer experiments, three QTLs where identi�ed on chromosomes 2, two QTLs on chromosome 5,and one each on chromosomes 7 and 8 (Jenni et al. 2013). Linkage mapping performed on another RIL populationdeveloped from crossing two cultivars with similar time to bolting revealed QTLs on chromosomes 1, 4, and 5 (Mamoet al. 2019). Perhaps due to the polygenic nature of the trait, transgressive segregation was observed in several bi-parental populations (Silva et al. 1999; Jenni et al. 2013; Mamo et al. 2019). A genome-wide association study(GWAS) identi�ed several single nucleotide polymorphism (SNP) markers linked to bolting (on chromosomes 1, twoon 7, and one that was not mapped) and �owering (on chromosomes 5, 7, 8 and one that was not mapped; Kwon etal. 2013). Although bolting and �owering are closely related processes, mapping of each phenotype separatelyresulted in only partial overlap of the associated SNPs. Another GWAS study performed on ~500 accessions identi�eda major QTL for developmental rate on chromosome 7, while minor QTLs with substantial QTL x environmentinteraction were detected on most of the other chromosomes (Sthapit Kandel et al. 2020).
In lettuce, the homolog of the Arabidopsis FLOWERING LOCUS T (FT) gene had only one copy and LsFT expressionlevels increased with higher ambient temperature and induced earlier differentiation to �owering (Fukuda et al. 2011).The response of LsFT to heat treatment was also characterized in FT RNAi plants (Chen et al. 2018a). In these linesthere was also a reduction in expression of putative downstream genes (based on homology to Arabidopsis AP2, AP3and LFY). Another study showed association between the bolting time and the expression levels of additionalArabidopsis homologs in lettuce: LsFVEL, LsFLDL, LsLDL, LsLFYL, LsAP1L (Fukuda et al. 2017). The lettuce homologof AtSOC1 (LsSOC1), an important �oral integrating gene, was found to be expressed in lettuce shoot apicalmeristems during the reproductive phase. Silencing of this gene greatly delayed �owering (Chen et al. 2018a, b).LsSOC1 was also shown to greatly increase upon heat treatment which promoted �owering. Han (2016) found manygenes that were differentially expressed between two lettuce cultivars with different bolting time. The authorsimplicated a group of MADS-box and GA genes as �owering regulators (Ning et al. 2019). GA and related genes wereshown to be related to bolting (Fukuda et al. 2009; Umetsu et al. 2011) speci�cally in response to high temperatures(Liu et al. 2018). The similarities in expression and function of these central genes suggests the main structure of thesignaling pathway to be conserved between lettuce and Arabidopsis. There are many examples where homologs ofArabidopsis genes function differently in crop species (Blümel et al. 2015), and paralogs that broadened natural

Page 4/34
variation in �owering time (Blackman et al. 2010). In other cases, several genes have been found in crops that haveno Arabidopsis homologs. Therefore, focusing solely on Arabidopsis homologues could lead to identifying newplayers or overlook the central genes that are involved in regulation of bolting and/or �owering in lettuce.
While studying functions of gene homologs and molecular genetic manipulation sheds light on the molecularmechanism of �owering in lettuce, their use for traditional breeding is limited. For conventional breeding that usescrossing and selection, information about bene�cial alleles that exist in plant accessions, including marker-assistedselection (MAS) (GuoYou et al. 2010; Simko 2013), is most needed.
To identify novel genes for lettuce �owering time, we used a recombinant inbred lines (RIL) population segregating for�owering time. The RIL population was created from a cross between PI 251246 and cv. Salinas (Yoong et al. 2016).Parental line PI 251246, is a primitive type lettuce accession cultivated for seed oil that skips the rosette stage and�owers within six weeks after germination (Grube and Ryder 2004). Parental line cv. Salinas, an iceberg type, isrelatively late to bolting, 95 days under long day conditions, and ~132 days under short day conditions (Waycott1995).
The wide range of �owering phenotypes and environmental sensitivities observed in the RIL population, and carefulevaluation in controlled environments, revealed multiple environment-speci�c QTLs and interactions among them.Fine mapping in conjunction with gene sequencing and expression studies allowed identi�cation of candidate genesand the development of a MAS assay that can be used by breeders to confer bolting resistance.
Material And Methods
RIL population, plant growing conditions and phenotyping ofphenological stagesA F7 RIL population, consisting of 161 families, was evaluated under controlled environmental conditions. The RILwas derived from single seed descent following a cross between PI 251246 and cv. Salinas. For the �rst 14 daysplants were grown in controlled environment chambers under a photoperiod regime consisting of 8h light and 16hdark at 20°C for 14 days to allow seedling establishment. Light was provided by a combination of �uorescent andincandescent electric bulbs. After 14 days, plants were transferred to growth chambers under four light andtemperature conditions: long day and low temperature (LD-LT; 16h light /8h dark at 20°C), long days and hightemperature (LD-HT; 16h light /8h dark at 35°C), short days and low temperature (SD-LT; 8h light / 16h dark at 20°C)and short days and high temperature (SD-HT; 8h light/ 16h dark at 35°C). In each of these four environmentalconditions, the phenological stage of three plants per RIL and both parents was evaluated weekly using a rating scaleof 1 = rosette; 2 = bolting- visible internode elongation; 3 = visual buds; 4 = expanded in�orescence; 5 = �owering-opening of �rst �ower; 6 = more than half of buds �owered; 7 = open involucres. Also evaluated were the number ofdays to bolting (DBLT; days after germination to reaching stage 2) and days to �owering (DFLT; days after germinationto reaching stage 5). It has been shown that DBLT and DFLT share both common and unique pathways (Kwon et al.2013). To potentially identify regulation of �owering distinct from bolting, the residuals from the linear regression ofDFLT to DBLT (DBFr) were calculated for each RIL and used alongside other traits as an independent phenotype for QTLanalysis.

Page 5/34
Genotyping and linkage map constructionDNA was extracted from each RIL family (DNeasy Plant Mini Kit, Cat No. 69104, Qiagen Inc., Valencia, CA), digestedwith the EcoT22I enzyme and subjected to genotyping-by-sequencing (GBS ; Elshire et al. 2011) by the CornellInstitute of Biotechnology (http://www.biotech.cornell.edu/brc/genomics-facility). SNP calling and �ltering waspreformed using the TASSEL SNP discovery pipeline (Glaubitz et al. 2014). A linkage map based on informativemarkers was generated using an online version of MSTmap (http://mstmap.org/). Fully linked markers, with norecombination between them, were collapsed to a single combined marker. The linkage map for QTL analysis was re-generated to verify the correct placing and centimorgan (cM) distance determination of the combined markers and theoriginal ones.
QTL mapping and model selectionQTL mapping and model selections were performed in R using the R/qtl package (Broman et al. 2003). Simpleinterval QTL mapping (SIM) was preformed using the Haley-Knott regression method (Feenstra et al. 2006). Thesigni�cance LOD threshold for each environmental condition was determined by 1,000 permutations. QTLs weredeemed signi�cant when exceeding α = 0.05 LOD threshold and suggestive when exceeding α = 0.1 LOD threshold.QTL naming followed the nomenclature convention using q + trait abbreviation + chromosome number + QTL numberon the particular chromosome. Trait abbreviations followed those suggested by Han et al. 2021.
All signi�cant and suggestive QTLs were considered in the model �tting for DBLT and DFLT in each environmentalcondition separately. Initially, additive and interactive effects of all QTLs were considered in the model. Subsequently,a backward selection was applied to eliminate QTLs out of the model when they had no signi�cant additive effect orinteraction. The Bayesian information criterion (BIC; Broman and Speed 2002) with a δ value of 2 to minimize falsepositives was calculated for each evaluated model. Finally, the best model was selected based on the BIC, i.e. themodel explaining the highest variance with the least number of parameters.
Fine mappingTo enable �ne mapping of the qBLT7.2 -qFLT7.2 QTL region, an F2 population was developed from a cross betweentwo RILs (RIL 68 and RIL 69) with high similarity of marker alleles across the whole genome, but harboringcontrasting marker alleles in the region of interest.
Genomic polymorphisms between RIL 68 and RIL 69 in the region of interest were identi�ed by SNP mining of RNA-seq data generously provided by Fei-Yian Yoong (Yoong et al. 2016). To identify additional polymorphisms, Sangersequencing was performed (Eton Bioscience Inc., San Diego, California) on PCR ampli�cation products that targetedgenes and inter-gene segments within the region of interest. Polymorphisms identi�ed along the qBLT7.2 -qFLT7.2region were used to design high-resolution DNA melting (HRM) markers (Simko 2016; Supplementary Table 1).Testing for recombination and genotyping of all recombinants with the HRM markers was performed with theLightScanner instrument (BioFire Diagnostics LLC, Salt Lake City, Utah). PCR conditions and �orescent detection wereaccording to manufacturer’s instructions. Speci�cally, PCR annealing temperature was 66°C, and elongationtemperature was held at 72°C for 30 seconds and LightScanner temperature scan ranged between 72 and 96°C.

Page 6/34
To identify recombinants, 2,094 F2 plants, all derived from a single F1 plant from the RIL 68 × RIL 69 cross, wereevaluated. Of these, 773 plants were found to have recombination between two co-dominant markers �anking theQTL region. Recombinant plants were genotyped with 18 additional markers, designed throughout the qBLT7.2/qFLT7.2 region. The phenological development of recombinants was evaluated weekly on plants grown under longdays and mild temperature (18°C -25°C) conditions in which the parental RILs (RIL 68 and RIL 69) signi�cantlydiffered in their �owering time.
qBFr2.1 allele effect validationIn order to validate the effect of the P allele (originating from PI 251246 parent) on �owering time, F3 plants from theRIL 68 × RIL 69 cross were evaluated. Plants selected by HRM markers were homozygous for P alleles in qBFr2.1 andfor S alleles (originating from cv. Salinas parent) in other detected DFLT QTLs. For further validation, a series of backcrosses of the F3 plants to cv. Salinas was conducted, selecting for the P allele with the HRM marker LZ001. F3 andbackcross plants were evaluated for DFLT in the greenhouse during spring under ~LD-LT conditions.
Gene expression assaysTo examine the range of gene expression responses of �owering related genes, the RIL parental lines (PI 251246 andcv. Salinas, along with the RILs used for �ne mapping, RIL 68 and RIL 69, were used. The plants were grown under thefour photoperiod and temperature conditions (LD-LT, LD-HT, SD-LT, SD-HT) and evaluated weekly using thephenological rating scale. In previous experiments a ~14-day difference between appearance of a �rst bud and a �rst�ower was consistently observed. Furthermore, the appearance of the bud demonstrated that the transition from avegetative to a reproductive phase occurred. Therefore, in this experiment DBUD (days after germination to reachingstage 3) was used to quantify developmental progress.
At selected time-points leaf and stem tip samples were harvested for RNA extraction. Leaf samples were taken fromthe distal part of the second-to-newest fully expanded leaf in the rosette. Stem tip samples included the apicalmeristem with minimal wrapping of young leaves. To improve uniformity of results, all samples were collectedbetween hour two and three of the growth chamber light period. For each sample, three independent pools of tissuewere collected from three individual plants and �ash- frozen in liquid nitrogen. Total RNA was extracted from eachsample using the RNeasy Plant Mini Kit (Cat No. 74904, Qiagen Inc., Valencia, CA)) according to the manufacturer’sinstructions.
A total of 31 candidate genes within the qBLT7.2 /qFLT7.2 QTL region were identi�ed using the lettuce referencegenome (ver. 4; Reyes-Chin-Wo et al. 2017). Genes whose predicted function were deemed unlikely to be involved inreproductive transition regulation were excluded from further consideration, resulting in 12 candidate genes retained.To better understand the effects of the QTL alleles on the reproductive transition regulatory network, 15 genes knownto be involved in �owering time regulation in Arabidopsis were tested for expression (Supplementary Table 2). Ofthese, eleven have been identi�ed in lettuce (Han et al. 2016; Huo et al. 2016; Ning et al. 2019) including MADS-boxgenes. The MADS-box genes assessed in this work are arbitrarily named MAD1-7 because of their high sequencehomology. Additionally, three normalization genes (PP23, PP21 and TIP4) were chosen from the literature based on

Page 7/34
their low constitutive expression in various tissues and in different experimental conditions. PP23, PP21 and TIP4,encode for Protein Phosphatase 2a subunit 3, Protein phosphatase 2A-1 and TIP41-like protein, respectively(Czechowski et al. 2005; Borowski et al. 2014; Sgamma et al. 2016).
The GenomeLab GeXP Analysis System (SCIEX, USA) was used to assay mRNA levels in tissues with multiplex primerdesign (Supplementary Table 2). Gene expression primers for multiplexed reactions were designed using GenomeLabeXpress Pro�ler software. The multiplexed expression panel consisted of 27 candidate genes plus the threenormalization genes. Complementary primer binding sites for both genotypes were veri�ed by sequencing. The cDNAfor GeXP was synthesized from 50ng of total RNA using the GenomeLab GeXP Start Kit. PCR and multiplex detectionwere performed according to manufacturer’s instructions (Hayashi et al. 2007). Gene expression was quanti�ed asarea under the peak. All peaks under a background noise threshold of 500 counts were removed and remaining peakswere normalized to the intensity of the internal control Kanr gene. Since TIP4 was not stably expressed in theexperiment, in order to select optimal genes for normalization, the full panel of 30 genes was subject to an expressionstability test following the GeNorm algorithm (Vandesompele et al. 2002). The geometric mean of expressions levelsof the selected three most stable genes, PP21, PP23 and 7b_8, were used for normalization of expression levels of alltarget genes.
Lactuca sativa FLOWERING LOCUS T gene expression was independently evaluated by RT- real-time PCR, using thesame RNA samples as were used for the GeXP analysis. Reverse transcription was performed using 170ng of totalRNA with the High-Capacity RNA-to-cDNA™ Kit (Cat no: 4387406, Thermo Fisher Scienti�c Inc., Foster City, California).The normalization gene PP23 was selected for real-time PCR based on having lowest variation in the GeXP panel.Target and normalization genes were detected in the same well by a duplex Taq-man reaction using reporter dyesFAM and VIC, respectively, and custom designed primers and probes (Supplementary Table 2), with an annealingtemperature of 60°C (Custom TaqMan® Gene Expression Assays, Thermo Fisher Scienti�c Inc., Foster City,California). Color compensation to account for differences in using different dyes was applied to the raw data. Dosecurve experiments revealed ampli�cation e�ciency for both genes and genotypes ranging from 1.98-2.02, thus ane�ciency of 2 was used for calculation of target to reference concentration ratio (conc. ratio=2-(Cp target-Cp ref)). Eachsample was tested in triplicate, and their average was used for further statistical analysis.
Gene expression differences between the genotypes and controlled environment condition were compared usingTukey’s Honest Signi�cant Difference (HSD) test. For comparison of environmental condition effect on geneexpression, values of the four environmental conditions at a speci�c time point were compared by Tukey’s HSD testfor each genotype. For comparisons of genotype effect on gene expression, values of the four genotypes at a speci�ctime point were compared by Tukey’s HSD for each condition. An indication of a signi�cant increase or decrease wasmade by Student’s t-test, comparing gene expression values of the speci�c genotype and environmental conditionbetween the time points described in the text. Signi�cance was determined at α = 0.05 corrected for the number ofcomparisons in each time point.
Candidate gene homology, sequencing and polymorphismannotationCandidate genes were identi�ed by positioning GBS markers to the lettuce reference genome (Reyes-Chin-Wo et al.2017) and using blastp to search the Arabidopsis Information Resource (TAIR) protein database with the predictedlettuce protein sequence. Reciprocally, the protein of the best Arabidopsis match was used to search the lettuce TSAdatabase in NCBI using tblastn (McGinnis and Madden 2004).

Page 8/34
Candidate genes and their promotor regions were sequenced using PCR ampli�cation of overlapping gene segments.The PCR products were puri�ed and subjected to Sanger sequencing (Eton Bioscience Inc., San Diego, California). Tobetter understand the biological signi�cance of differences discovered in promotor regions, an in silico annotationbased on known Arabidopsis promotor motifs was performed using AgRIS (Davuluri et al. 2003) and PLACE (Higo etal. 1999).
Results
QTLs associated with day length and temperatureUnder all environmental conditions, DBLT were lowest for PI 251246 and highest for cv. Salinas with no transgressivesegregation observed among RILs. In contrast, transgressive segregation for DFLT was observed with several RILsfamilies displaying both earlier and later DFLT compared to PI 251246 and cv. Salinas, respectively (Fig. 1).
Both DBLT and DFLT of RILs grown under HT were signi�cantly shorter (p < 0.0001) than under LT (Table 1). Day lengthdid not signi�cantly affect DBLT, but DFLT was signi�cantly shorter (p < 0.0001) in LD compared to SD. The range ofdays between bolting and �owering also differed among the four environmental conditions, and both HT and LDsigni�cantly (p < 0.0001) reduced the observed range. These results support the idea that DBLT and DFLT share bothcommon and unique pathways (Kwon et al. 2013; Chen et al. 2018b), and hence supports the use of residuals of thelinear correlation between them, DBFr, as an additional phenotypic trait.
Table 1 Descriptive statistics of the RIL population for DBLT and DFLT grown under four different controlledenvironment conditions. SD - standard deviation
Daylength
Temp-erature
Conditionabbreviation
DBLT DFLT DBFr
Range Mean SD Range Mean SD Range Mean SD
Long High LD-HT 13-27 20.6 3.8 34-111
58.8 19.9 14-84 38.3 17.6
Long Low LD-LT 20-40 25.3 6.8 41-153
72.3 26.7 21-119
43.8 20.7
Short High SD-HT 13-48 23.3 7.9 41-111
69.6 16.1 7-91 43.9 14.0
Short Low SD-LT 20-41 24.6 6.3 69-160
100.3 26.2 35-133
76.2 24.1
a DBLT- Days after germination to bolting.
b DFLT - Days after germination to �rst �ower.
c DBFr- The residuals from the correlation between bolting and �owering, representing the degree by which �owering isregulated independently of bolting.
Page 9/34
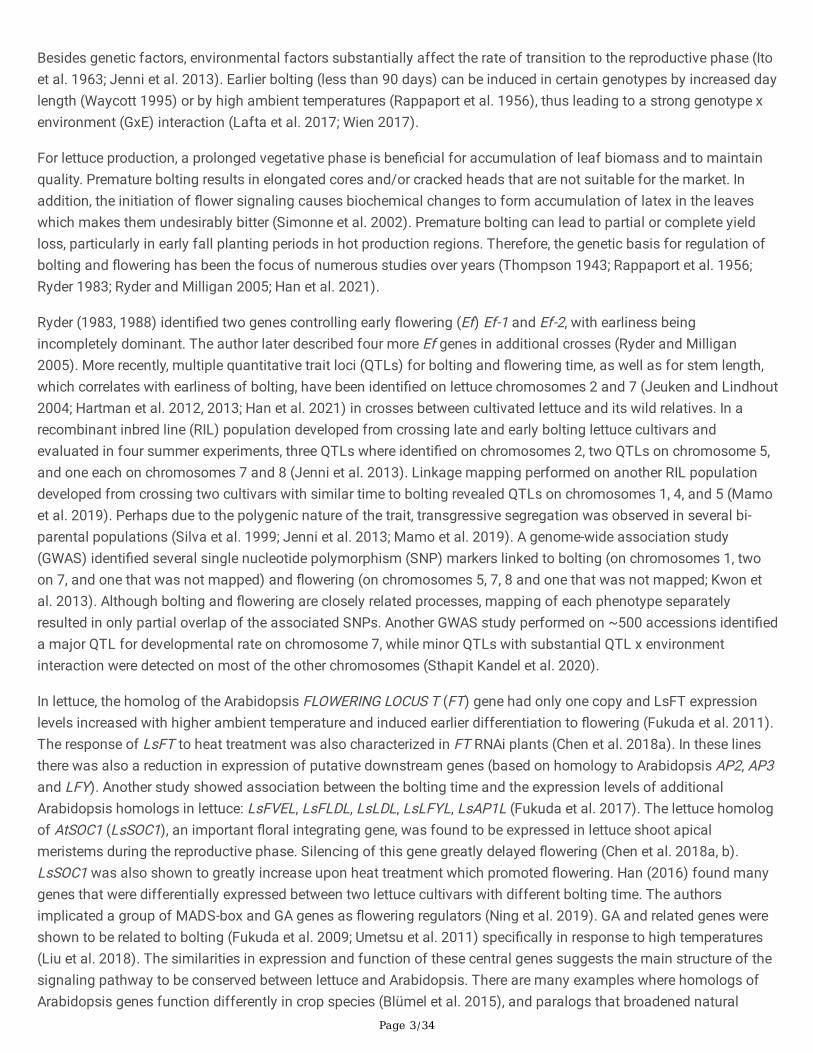
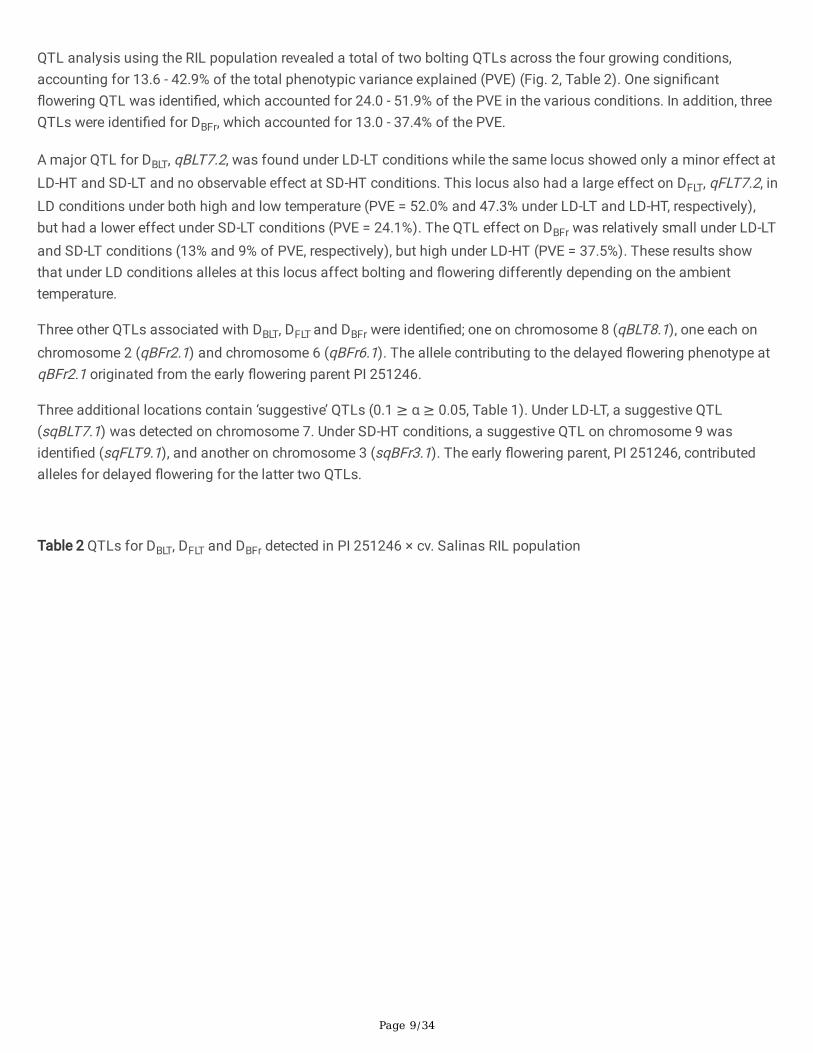
QTL analysis using the RIL population revealed a total of two bolting QTLs across the four growing conditions,accounting for 13.6 - 42.9% of the total phenotypic variance explained (PVE) (Fig. 2, Table 2). One signi�cant�owering QTL was identi�ed, which accounted for 24.0 - 51.9% of the PVE in the various conditions. In addition, threeQTLs were identi�ed for DBFr, which accounted for 13.0 - 37.4% of the PVE.
A major QTL for DBLT, qBLT7.2, was found under LD-LT conditions while the same locus showed only a minor effect atLD-HT and SD-LT and no observable effect at SD-HT conditions. This locus also had a large effect on DFLT, qFLT7.2, inLD conditions under both high and low temperature (PVE = 52.0% and 47.3% under LD-LT and LD-HT, respectively),but had a lower effect under SD-LT conditions (PVE = 24.1%). The QTL effect on DBFr was relatively small under LD-LTand SD-LT conditions (13% and 9% of PVE, respectively), but high under LD-HT (PVE = 37.5%). These results showthat under LD conditions alleles at this locus affect bolting and �owering differently depending on the ambienttemperature.
Three other QTLs associated with DBLT, DFLT and DBFr were identi�ed; one on chromosome 8 (qBLT8.1), one each onchromosome 2 (qBFr2.1) and chromosome 6 (qBFr6.1). The allele contributing to the delayed �owering phenotype atqBFr2.1 originated from the early �owering parent PI 251246.
Three additional locations contain ‘suggestive’ QTLs (0.1 ≥ α ≥ 0.05, Table 1). Under LD-LT, a suggestive QTL(sqBLT7.1) was detected on chromosome 7. Under SD-HT conditions, a suggestive QTL on chromosome 9 wasidenti�ed (sqFLT9.1), and another on chromosome 3 (sqBFr3.1). The early �owering parent, PI 251246, contributedalleles for delayed �owering for the latter two QTLs.
Table 2 QTLs for DBLT, DFLT and DBFr detected in PI 251246 × cv. Salinas RIL population

Page 10/34
Daylength
Temperature QTL Chr. PeakLODlocation(cM)
1-LODsupportinterval(cM)
Marker closestto peak LOD
PeakLOD
PVEb Additiveeffectc
(days)
Long High qBLT7.2 7 106.5 86.7-106.5
cS7_242106278 3.3 10.7 1.2
qFLT7.2 7 94.1 93.2-98.3
cS7_209035609 15.5 47.2 13.0
qBFr7.2 7 94.1 93.2-98.3
cS7_209035609 11.1 37.4 10.2
Low asqBLT7.1 7 0 0-5 cS7_1980750 2.8 10 2.2
qBLT7.2 7 94.1 93.2-98.3
cS7_209035609 16 42.9 4.4
qFLT7.2 7 94.1 93.2-98.3
cS7_209035609 18.8 51.9 18.7
qBFr7.2 7 94.1 79.3-98.3
cS7_209035609 3.4 13 6.2
Short High qBFr2.1 2 18.1 15.6-26 cS2_40045553 3.4 14.4 -5.3
asqBFr3.1 3 57.7 53-63 cS3_113143153 2.7 9.6 -4.4
qBFr6.1 6 100.3 97.5-104.4
cS6_220422004 3.7 13.8 5.4
qBLT8.1 8 34.6 28.9-38.5
S8_71245709 4.7 13.6 2.9
asqFLT9.1 9 17.9 17-24 cS9_31330927 3 11.7 -5.3
Low qBLT7.2 7 94.1 91.9-98.3
cS7_209035609 5.9 20.2 2.7
qFLT7.2 7 91.9 87.5-93.2
cS7_200076206 4.9 24 13.6
a Suggestive QTLs (sq) are signi�cant at α=0.1 (determined by 1000 permutations).
b PVE- Percent of variance in mapped phenotype explained by the QTL.
c directionality of effect: positive- allele contributed by cv. Salinas; negative- allele contributed by PI 251246
Table 3 Genetic models to explain the DBLT and DFLT phenotype under each environmental condition

Page 11/34
Trait Daylength
Temperature PeakLOD
PVEa
p-valuemodel
Positions included in model b
Bolting Long High 16.2 46.7 8.88E-04 p2.1 x p3.1 x p6.1 x p7.2 x p8.1 +p9.1c
Low 17.3 47.5 1.11E-16 p7.1 x p7.2
Short High 3.7 13.6 3.53E-05 p8.1
Low 16.5 46 4.03E-04 p2.1 x p6.1 x p7.2 x p8.1 x p9.1
Flowering Long High 39.4 83.1 < 2.00E-16 p2.1 x p6.1 x p7.1 x p7.2 x p9.1
Low 45.1 83.8 < 2.00E-16 p2.1 x p6.1 x p7.1 x p7.2 x p9.1
Short High 23.0 61.1 2.45E-07 p2.1 x p3.1 x p6.1 x p7.1 x p9.1
Low 13.4 77 4.93E-05 p2.1 x p6.1 x p7.2 x p9.1
a PVE- Percent of variance in mapped phenotype explained by the QTL.
b Positions of markers included in the models correspond to QTL names found in Table 1. All QTLs were initiallyincluded in the full model followed by removal of the QTL with the smallest contribution to the model (backwardelimination).
c Positions where the interaction among QTLs was signi�cant are marked with ‘x’, while positions preceded by + havean additive effect.
QTL modelsTo identify QTLs that explained the highest amount of phenotypic variation for DBLT and DFLT, Bayesian informationcriterion were used (Broman and Speed 2002). The PVE explained by the models ranged from 13.5% to 83.8%, of asingle QTL model for bolting under SD-HT and a �ve QTL model for �owering under LD-LT, respectively (Table 3). Anidentical �ve QTL model was the best �t for both �owering under LD-HT and LD-LT; all other conditions tested hadunique models (Table 3, Supplementary Table 3).
The models show that QTLs which were detected only at a suggestive (0.1 ≥ α ≥ 0.05) level using SIM can have asigni�cant effect on �owering through interaction with other QTLs (i.e., epistasis). Furthermore, the extent of theireffect and interaction is affected by the light and temperature conditions. The most obvious condition-dependentinteraction was seen between qFLT2.1 and qFLT7.2 (Fig. 3), where at LD-HT and SD-LT alleles in these positions haveconstant effects, while at SD-HT only qFLT2.1 alleles affect DFLT. At LD-LT, the qFLT2.1 alleles have an effect on�owering only when the homozygous combination of alleles originating from cv. Salinas is present at the qFLT7.2locus, thus demonstrating epistatic effect. In this population, under all environmental conditions, the allelesmaintained directionality of their effect on bolting and �owering.

Page 12/34
Fine mapping of qBLT7.2 / qFLT7.2 regionUnder �eld and controlled environment studies, qBLT7.2 / qFLT7.2 was consistently observed to have the largest PVEof all QTLs detected. Therefore, this locus was selected for further study. F2 plants with recombination in the qBLT7.2/ qFLT7.2 region were grown in the greenhouse and evaluated for bolting and �owering. Under greenhouse conditions,the parents of the F2 cross, RIL 68 and RIL 69, signi�cantly differed (p < 0.001) in �owering time by an average of 40days. Of 21 markers tested (Supplementary Table 1), �ve closely linked markers, LZ431, LZ481, LZ261, LZ299 andLZ425 displayed complete association with the �owering phenotype (Fig. 4). The QTL region of interest was re-de�ned based on these markers and included a 1.15 Mbp long region (chromosome 7: 207,702,411 - 209,071,520 bp)and contained 31 predicted genes. Genes whose function, predicted by Arabidopsis homology annotations (Reyes-Chin-Wo et al. 2017), were unlikely to be involved in development regulation (such as glycolysis or chloroplasttargeted genes) were not pursued for further analysis.
Locus qBLT7.2 / qFLT7.2 candidate genes, homology andsequencingThe predicted annotation of twelve genes further studied in the �ned mapped region was veri�ed by Arabidopsisprotein homology (Supplementary Table 2), and three genes were found homologous to genes known to be involvedin �owering time regulation.
CONSTANS LIKE-9 (COL9) was found to be the best matching homolog for the Lsat_1_v5_gn_7_97240.1 lettuce gene.In Arabidopsis, COL9 delays �owering-time and is a FT, SOC1 and CO repressor (Cheng and Wang 2005). The fullcoding region and part of the UTRs of COL9 in cv. Salinas and PI 251246 were sequenced using both genomic andcDNA. A single polymorphism between sequences of the two genotypes was found in the fourth intron, but none inthe coding region. The COL9 gene-speci�c maker used for �ne mapping, LZ431, mapped to the center of the QTLregion, and matched exactly with the �owering time phenotype (Figure 4 d).
PHYTOCHROME C(PhyC) was found to be the best match for Lsat_1_v5_gn_7_96941.1. PhyC encodes a phytochromeprotein that is known to be involved in �owering time regulation in Arabidopsis (Pearce et al. 2016). Sequencing ofPhyC revealed six SNP polymorphisms in the coding sequence between cv. Salinas and PI 251246, all in the �rst exon.A gene speci�c marker, LZ425, based on a SNP in the �rst exon of this gene, matched exactly with the �owering timephenotype (Figure 4 d). Of the six described SNPs, �ve were silent mutations, but one in position 118 (cv. Salinas,reference genome) causes a change of isoleucine to phenylalanine in PI 251246. This mutation is located within thehistidine kinase A domain (SM00388), as annotated by SMART database (Letunic and Bork 2018), and serves asdimerization and phosphoacceptor domain of histidine kinases (Vierstra and Davis 2000). The isoleucine residue,corresponding to isoleucine in position 901 in Arabidopsis, is conserved within the PhyC genes in angiosperms(supplementary information). It is also conserved in histidine kinase A domains of more diverse organisms, includingprokaryotes (it is either isoleucine, leucine or alanine in over 60% of matched sequences in the SMART database).While the functional effect of this amino acid change is not known, it could alter the gene function in PI 251246.
AT4G14540.1, which is a nuclear factor Y, subunit B3, transcription regulator involved in photoperiod regulation(Kumimoto et al. 2008), was the best matching homolog for Lsat_1_v5_gn_7_96781.1. However, a gene speci�cmarker was not fully linked to the �owering phenotype so this gene was not considered to be a likely candidate.

Page 13/34
Expression of candidate genes from qBLT7.2 /qFLT7.2 regionTo identify genes whose gene expression pattern corresponds to QTL effects in the various conditions, PI 251246, cv.Salinas, RIL 68 and RIL 69 were sampled at multiple time points during development under the same environmentalconditions used for QTL mapping. Of the four genotypes, PI 251246 was the earliest to bolt in all environmentalconditions, bolting 21 days after germination. Soon after bolting, buds were visible on these plants (35 DBUD in SD-LTand 28 DBUD in the other three conditions). The three other genotypes bolted and �owered later than PI 251246 (Fig.5). In these genotypes DBLT was signi�cantly lower in HT conditions compared to LT (p < 0.0001), while day length didnot have a consistent effect on DBLT. What seems to be an exception in cv. Salinas is probably caused by low lightlevels due to aged bulbs at the beginning of the growth period in the SD-LT growth chamber. Only the cv. Salinasplants in the chamber were etiolated, and therefore accurate evaluation of bolting was not possible. Instead, thepresented data are corresponding to the �rst observation of stem internode elongation that is closely associated withbolting.
While PI 251246 DBUD was early and relatively unchanged in the four conditions, RIL 69 was also early but mean DBUD
ranged 28-44 across the four environmental conditions. RIL 68 and cv. Salinas had signi�cantly (p < 0.001) higherDBUD than PI25146 and RIL 69, and both displayed a wide range of mean DBUD in the four environmental conditions(71 - 109 and 67 - 124 for RIL 68 and cv. Salinas, respectively). For all genotypes, both HT and LD led to lower DBUD
compared to LT (p < 0.0001) and SD (p < 0.05), respectively. These data indicate that tested temperature conditionshad a larger effect than day length on development rate.
Gene expression studies focused on identifying genes which displayed expression patterns consistent with DBLT andDBUD phenotypes in response to speci�c environmental conditions, or genes whose expression pattern differedbetween PI 251246 and RIL 69, with P allele (originating from PI 251246), and cv. Salinas and RIL 68, with S allele(originating from cv. Salinas). PI 251246 and RIL 69, reached budding stage in only a few weeks and therefore hadonly the earlier sampling points available for gene expression assays.
Of the twelve targeted genes located in the qFLT7.2 locus (Supplementary Table 2), most did not display anyconsistent signi�cant patterns between environmental conditions or genotypes (Supplementary Figure 1).Interestingly, many genes in the study displayed an increase in gene expression in tips of RIL 68 between 42 and 49days after germination under HT conditions region (7b_1, 7b_4, 7b_5, 7b_6, 7b_7, 7b_8, 7b_10 and 7b_11, putativelyannotated as U-box protein, COL9, unknown protein1, P24, unknown protein2, unknown kinase, PhyC and FAR1,respectively), which is not seen under LT conditions. Additionally, several genes (7b_1, 7b_3, 7b_4, 7b_5, 7b_7 and7b_11, putatively annotated as U-box protein, HNRNPA1_3, COL9, unknown protein1, unknown protein2 and FAR1,respectively) also displayed a decrease in expression in RIL 69 tips under SD-LT during the 42 days of sampling. 7b_1(U-box protein) had signi�cantly lower expression under LD-HT early in the experiment (day 21 or 28) in cv. Salinas, PI251246 and RIL 68, and signi�cantly higher expression under SD-LT later in the experiment.
Notably, expression of COL9 (Lsat_1_v5_gn_7_97240.1) in cv. Salinas and RIL 68 leaves was signi�cantly higher inHT conditions compared to LT conditions, in which DBUD was higher. On the other hand, in PI 251246 and RIL 69expression of this gene was more effected by day length, as plants grown under LD displayed signi�cantly higherexpression than SD grown plants. In addition, at 14 days after germination leaf expression was higher in PI 251246and RIL 69 compare to cv. Salinas and RIL 68 (Fig. 6). Additionally, PhyC (Lsat_1_v5_gn_7_96941.1) gene expressionwas signi�cantly higher in cv. Salinas and RIL 68 compared to PI 251246 and RIL 69 in tips under all conditions (Fig.

Page 14/34
7). In leaves, expression of the PhyC gene signi�cantly increased in PI 251246 and RIL 69 at 21 days aftergermination in SD-LT, in which DBUD is higher, compared to the other environmental conditions.
Based on gene expression, homology and sequencing, the strongest candidate genes within the �ne mapped qBLT7.2/ qFLT7.2 region include PhyC and COL9. The lettuce PhyC homolog found in the QTL region, has a mutation causinga change of a conserved isoleucine to phenylalanine in a domain that may in�uence the protein function. Moreover,the correspondence between expression pattern and the QTL marker alleles further suggests potential involvement ofCOL9 and PhyC in regulation of the �owering phenotype.
QTL qDBFr2.1Under SD-HT conditions, the QTL associated with the residuals from the linear regression of DFLT to DBLT, designatedas qDBFr2.1, mapped to chromosome 2 and accounted for 14.4% of the phenotypic variation observed. In this QTLthe late �owering allele was contributed by the PI 251246 parental line (Table 2). When considering multi-QTL models,qDBtFr2.1, was included in two of the four environmental conditions for DBLT and all four conditions for DFLT (Table 3).Within this genomic region, only a single gene, Lsat_1_v5_gn_2_17881, was found to have an Arabidopsis homologknown to be related to �owering, the lettuce Flowering Locus T (LsFT) gene. FT is a widely conserved gene in dicotsand monocots and is a key integrator of �oral induction signaling pathways (reviewed in: Ballerini and Kramer 2011).To validate the location of this gene in the QTL, a gene-speci�c HRM marker (LZ001) mapped to the center of theqDBFr2.1 QTL.
LsFT gene expressionAt 14 days after germination, when all plants were grown under SD-LT, gene expression levels of LsFT were assessedon leaves and tips of cv. Salinas, PI 251246, RIL 68, and RIL 69. PI 251246 had the highest LsFT expression in leaves,with lower expression in RIL 69 and very little to no expression was observed in RIL 68 and cv. Salinas (Figure 8). Intips, LsFT expression was highest in cv. Salinas, but only lowly expressed in PI 251246, RIL 69 and RIL 68 (Figure 8).
In leaves of PI 251246 sampled 21 days after germination, expression of LsFT increased about four-fold higher thanobserved at 14 days after germination under LD-HT (Figure 9). LsFT expression of leaves in RIL 69 increased by fourto �ve fold at 21 and 28 days after germination under LD-HT, LD-LT, respectively (Figure 9). In cv. Salinas, LsFTexpression increased about 10-fold above that observed at 14- days under LD-HT (Figure 9). LsFT expressionremained essentially unchanged in RIL 68 up through 80 days after germination (Figure 9).
For tips, LsFT increased sharply in PI 251246 by 21 days under all four environmental conditions (Figure 9). In RIL 69,LsFT increased under LD-LT and SD-LT (but no data for LD-HT, SD-HT) at 28 and 42 days after germination,respectively (Figure 9). In RIL 68 and cv. Salinas, LsFT expression �uctuated under all environmental conditions, butremained essentially unchanged across all sampling dates (Figure 9).
LsFT sequencing

Page 15/34
Sequencing of genomic and cDNA revealed no polymorphisms between cv. Salinas and PI 251246 in the codingsequence of the gene. There were, however, numerous SNPs and indels in introns and the promotor region. The regionup to 600 bp upstream of the transcription start site had relatively few polymorphisms. However, the region between660 - 1,186 bp upstream of the start codon had many SNPs and indels in PI 251246 compared to cv. Salinas. Basedon in silico motif annotation (Davuluri et al. 2003) and (Higo et al. 1999), two GATA motifs (agatag or agataa) and aSORLIP1 motif (agccac) were found to in cv. Salinas but were absent in PI 251246. In Arabidopsis these motifs arerelated to light response (Terzaghi and Cashmore 1995; Adrian et al. 2010). None of the predicted motifs were foundonly in PI 251246 while absent in cv. Salinas.
QTL qBFr2.1 effect validationTo validate the effect of the delayed �owering phenotype contributed by the P allele from early bolting parent PI251246, we phenotypically evaluated F3 plants from the RIL 68 × RIL 69 cross which were homozygous for P alleles inthe qBFr2.1 region. When the plants were grown in the greenhouse under ~LD-LT conditions they �owered during thesame week or one week later than cv. Salinas. In a series of backcrosses of F3 plants to cv. Salinas, selection for the Pallele was done using the LZ001 HRM marker. BC2 plants �owering ranged from 92 - 128 days with an average of111.3, while cv. Salinas plants �owered after 100 days under LD-LT (Table 4). Furthermore, in BC1S1 families, whichare expected to segregate, DFLT ranged 85 - 153. In each BC1S1 family at least two of the ten plants evaluated �oweredmore than two weeks later than cv. Salinas plants. These results demonstrate the late �owering effect of the LsFT(qBFr2.1) P allele, derived from the early �owering PI 251246 parent, in the background of cv. Salinas. Moreover, sincethe effect of this QTL is much higher in warmer temperatures (Table 2), the bene�t of the allele is expected to be evengreater under such conditions.
Table 4 DFLT of backcross families for qBFr2.1 effect validation under a LD-LT greenhouse environment.
Range Mean SD
cv. Salinas 100 100 0
PI 251246 30 30 0
RIL 68 88-92 90 2.82
RIL 69 65 65 0
BC1S1-1 88-150 111.2 18.66
BC1S1-2 86-140 102.5 17.21
BC1S1-3 85-153 104 21.43
BC2 92-128 111.4 13.56
Since marker LZ001 is located within the �rst intron of the LsFT gene, is tightly linked to qBFr2.1 and distinguishesbetween S and P alleles, its utility for marker-assisted selection was tested on a panel of diverse lettuce cultivars.

Page 16/34
Cultivars Amazona, Anais, Ancora, Reine des Glaces, Costa Rica, Darkland, Eruption, Flashy Troutback, Green Towers,Hearts Delight, Iceberg, La Brillante, Lolla Rossa, PI491224, Paci�c, Salad Crisp, Sniper, Tiber, Tinto and Valmaine allhad the same marker allele as cv. Salinas. A Lactuca serriola accession (11G99), had the same P allele HRM pro�le asPI 251246. Only cv. Sentry had a HRM pattern distinct from those for both S and P alleles, indicating that this cultivarharbors an allele different from all other tested genotypes.
DiscussionThis work identi�ed multiple QTLs affecting bolting and �owering time, which is not surprising considering thecomplex regulatory network controlling �owering time in the plant kingdom [reviewed in: Komeda 2004; Putterill et al.2004; Andrés and Coupland 2012). The phenotypic divergence and genetic distance between the RIL populationparents allowed detection of multiple QTLs. The current �nding that most QTLs were involved in epistatic interactionsstrengthens the previous results documenting epistatic effect of QTLs on �owering time (Ryder and Milligan 2005;Schwartz et al. 2009).
The critical effect of day length and temperature on plant development (Koornneef et al. 1998; Song et al. 2013) andlettuce �owering (Ito et al. 1963; Jenni et al. 2013; Lafta et al. 2017) is well established. This study aimed to dissectthe effect of these environmental factors and their combinations over genetic regulation of development. The QTLdetected under the SD-HT condition were not detected under the other three environmental conditions tested,suggesting a different bolting and regulatory network (Table 2). While under both LD conditions and also in SD-LT onemajor QTL, qFLT7.2, dominated and explained much of the phenotypic variance (47.2%), the QTL was not detectedunder SD-HT. Instead, other QTLs, with lower PVE under other conditions, had signi�cant additive effects. Alternativeregulation of �owering under SD-HT was also found in Arabidopsis (Kumar et al. 2012; Fernández et al. 2016).Similarly, in fava bean (Vicia faba) under SD-HT many small QTLs were revealed compared to LD conditions (Catt etal. 2017).
Despite the extremely divergent bolting and �owering times of cv. Salinas and PI 251246, transgressive segregationwas observed for DFLT. In two detected QTLs and one suggestive QTL, qBFr2.1, sqBFr3.1 and sqFLT9.1, late �oweringalleles were contributed by the very early �owering parent. Presence of these alleles, and their interaction with otherloci, could explain the transgressive segregation. If these alleles are not yet present in domesticated lettuce cultivars,they can contribute to development of lettuce breeding lines and cultivars with late �owering. For bolting, on the otherhand, no transgressive segregation was observed, and either the qBLT7.2 allele from PI 251246 determined earlybolting or, under SD-HT, the PI 251246 allele in qBLT8.1. QTLs for �owering, stem length, and plant development werepreviously found on this chromosome (Hartman et al. 2012; Jenni et al. 2013; Kwon et al. 2013; Sthapit Kandel et al.2020).
To date, all published research regarding QTLs of bolting and/or �owering time related traits, whether using bi-parental population or diversity panel for GWAS analysis, identi�ed QTLs in chromosome 7 (Jeuken and Lindhout2004; Hartman et al. 2012; Jenni et al. 2013; Kwon et al. 2013; Lee et al. 2019; Sthapit Kandel et al. 2020; Han et al.2021; You, Still, Rosental, Hayes and Simko – unpublished data]. Although exact comparisons of QTL intervals is notalways possible, the consistent detection supports the importance of chromosome 7 for lettuce �owering control. Thecurrent �ndings of qFLT7.2, and its high effect QTL explaining a large percentage of the variance in bolting and�owering time, con�rms the contribution of this region, speci�cally in LD conditions.

Page 17/34
Bolting-�owering QTLs on chromosome 2 have been mapped in other RIL populations from inter and intra speci�ccrosses and qBFr2.1 consistently had a signi�cant additive effect in high temperature (HT) conditions (Hartman et al.2012; Jenni et al. 2013). Furthermore, an L. serriola accession used in previous bolting studies (Hartman et al. 2012)had the same P allele for marker LZ001, linked to the qBFr2.1, as PI 251246.
The two QTLs focused on in this study, qBFr2.1 and qFLT7.2, had epistatic relations, and the effect of the qFLT7.2QTL was speci�c to the environmental condition. In SD-HT, when qFLT7.2 had no additive effect, no epistatic effectwas observed in the models and interaction plot (Fig. 3). However, in LD condition, the QTL P allele determined early�owering while S allowed qBFr2.1 QTL alleles to affect DFLT. Since DFLT in the F2 plants heterozygous in qFLT7.2 wasearly, similar to the P genotype, S can be de�ned as the recessive allele, and could perhaps indicate loss of function.This suggests that in environmental conditions and genotypes where qFLT7.2 is functional and has an effect, itoverrides any effect qBFr2.1 may have. Consequently, only in conditions or alleles where qFLT7.2 is not functional,qBFr2.1 (and perhaps other loci, as seen in SD-HT) convey their effect. In other words, qBFr2.1 is not ‘induced’ onlyunder SD-HT, but rather is manifested in these conditions due to lack of qFLT7.2 effect.
This observation is supported by the gene expression pattern of LsFT, the putative gene underlying qBFr2.1 QTL.During most of development LsFT expression seems to be governed more by qFLT7.2 allele than by the qBFr2.1 allele.Speci�cally, RIL 68 expression in tips and leaves is similar to cv. Salinas and not like PI 251246 and RIL 69, withwhom it shares P allele in qBFr2.1. The latter genotypes have higher LsFT expression which increases in the �rstweeks of development and have an early �owering phenotype. This suggest that qFLT7.2 is an LsFT expressioninducer and supports the detailed work describing the effect of LsFT expression to induce �owering in lettuce (Fukudaet al. 2011, 2017).
In accordance with FT’s known role as �oral integrator (Kim et al. 2013), other genetic and environmental factorsin�uence FT expression levels. In this study, under HT conditions, FT had higher expression, as found previously inlettuce (Fukuda et al. 2011; Han et al. 2016) and Arabidopsis (Schwartz et al. 2009; Kim et al. 2012). InChrysanthemum (Chrysanthemum morifolium) leaves, on the other hand, heat caused reduction in FT-like geneexpression and delayed �owering (Nakano et al. 2013). However, the increase under HT conditions in leaves is nottranslated to an increase in tips in genotypes with qFLT7.2 S allele. The lack of epistasis in the SD-HT QTL modelstands in contrast to the apparent in�uence of qFLT7.2 on LsFT gene expression in this condition, as well.
The only time point when cv. Salinas LsFT gene expression matched its late �owering allele in qBFr2.1 locus was inthe tips of 14-day old plants. At this point all plants were grown in SD-LT conditions, considered to be least inductiveof �owering. The exclusive high expression in cv. Salinas’s tips, not seen in leaves, may initiate an induction of�owering in the absence of qFLT7.2. The inconsistency in LsFT expression between leaves and tips, also observed inlater stages in cv. Salinas and RIL 68, is especially interesting given previous reports that FT moves from leaves to themeristem within the tip where it is active as mRNA (Huang et al. 2005) or protein (Corbesier et al. 2007; Putterill andVarkonyi-Gasic 2016).
FT has a long promoter with many cis regulatory elements which affect its expression (Schwartz et al. 2009; Adrian etal. 2010; Liu et al. 2014), such as those identi�ed to be different between cv. Salinas and PI 251246. The lettuce FTgene is located in a relatively gene-poor region, with only one gene detected within a 3 Kbp upstream transcriptionstart site with no others for 116 Kbp, as seen in other plant species (Adrian et al. 2010). The modi�ed elements in PI251246, GATA motif and SORLIP1 motif, may in�uence the expression pattern differences seen between tips of cv.Salinas and the P allele genotypes at 14 days.

Page 18/34
As opposed to the most obvious candidate gene underlying the qBFr2.1 QTL, �ne mapping was required to shortenthe candidate list for qFLT7.2. After narrowing the interval to a 1.15 Mbp region, two genes remained plausiblecandidates. Still, the possibility that both genes have a role in the control of �owering in lettuce, either together or eachat different conditions, cannot be excluded. Lsat_1_v5_gn_7_96941.1 was identi�ed as an Arabidopsis PhyChomolog. PhyC belongs to a family of phytochrome factors (Sharrock and Quail 1989), which have important roles inmultiple aspects of plant growth and development, including germination, chloroplast development,photomorphogenesis, shade avoidance and photoperiod dependent �owering (Kronenberg and GHM 1994; Franklin etal. 2003; Nishida et al. 2013). In Arabidopsis, PhyC is not required for long-day induction of �owering time (Franklin etal. 2003). It is, however, involved in day length perception and delay of �owering in SD, together with PhyA and PhyB(Monte et al. 2003). In wheat and barley, on the other hand, PhyC was found to have a key role in LD induced�owering (Nishida et al. 2013; Pearce et al. 2016).
Phytochrome family proteins bind a billin chromophore and share a basic structure (Pham et al. 2018), with distinctand partially overlapping roles in development control and signal transduction. The N terminus of phytochromes hasa kinase domain, and kinase activity was shown to be important for plant photo- response (Shin et al. 2016). Genesequencing of both parents revealed a mutation in PI 251246 located in a conserved amino acid within the histidinekinase A domain. While the effect of the change on protein function is not known, it could possibly effect photoperiod-dependent �owering time regulation.
The closest Arabidopsis homolog of Lsat_1_v5_gn_7_97240.1 is COL9. The CO-like gene family three-group structureis conserved in various plant groups (Wang et al. 2019). Although most genes in the family promote �owering inArabidopsis, COL9 was found to suppress FT, SOC1 and CO and delay �owering in Arabidopsis (Cheng and Wang2005). Functional homologs of COL9 affect �owering time in Arabidopsis (Cheng and Wang 2005), rice (Wu et al.2018) maize (Maldonado et al. 2019), and was also identi�ed in Ambrosia artemisiifolia (Mátyás et al. 2019). In thisstudy, COL9 expression was higher in early �owering genotypes with the P allele, which could suggest a �oweringpromoting role. On the other hand, expression in S allele genotypes was higher in LT conditions, in which �owering islater. This contrasts with a previous study in which LsCOL9 expression was found to signi�cantly increase under�owering inducing heat conditions (Liu et al. 2018). These discrepancies may be due to unidenti�ed polymorphismsin the genotype’s promotors, leading to differing sensitivity to the environmental conditions. So the effect of COL9gene expression on the �owering phenotype is not yet well-de�ned. Taken together, either LsCOL9 or LsPhyC or both,could be qBLT/qFLT7.2 causal gene involved in lettuce �owering.
In summary, this work contributes to efforts of breeding cultivars resistant to premature bolting through improvedresolution and understanding of the major qBLT/qFLT7.2 QTL. This QTL was detected in multiple experimentalpopulations and has a determining effect on bolting and �owering rates in most lettuce production environments.
Another main contribution is the identi�cation of the qBFr2.1 allele from PI 251246 not currently present in the rosette-forming lettuce genepool, as demonstrated with marker LZ001 on a diverse group of cultivars. Since the primitive oil-seed cultivar (PI 251246) allele has a signi�cant effect in delaying �owering in SD-HT conditions and in delayingbolting and �owering in certain �eld conditions (You, Still, Rosental, Hayes and Simko – unpublished data),introgression of the allele into commercial germplasm may lead to development of breeding lines with delayedbolting. The allele may be particularly useful when breeding cultivars speci�cally adapted for lettuce production in fallplantings in the southwestern United States, an environment especially susceptible to premature bolting and�owering. The LZ001 marker can be used to facilitate breeding by MAS.

Page 19/34
DeclarationsFunding
This research was supported by grant # 14-01-008 from the California State University Agricultural Research Instituteto RJH and DWS.
LR is a fellow of the Arian de Rothschild Women Doctoral Program.
Con�icts of interest/Competing interests (include appropriate disclosures)
The authors state that there is no con�ict of interest.
Ethics approval - Not applicable
Consent to participate - Not applicable
Consent for publication - Not applicable
Availability of data and material (data transparency)
Code availability - Not applicable
Authors' contributions
LR planned and performed experiments, collected and analyzed data, and drafted the manuscript. YY guided andassisted in planning and analyzing GeXP experiment. RJH, DS, conceived the project, obtained funding, supervisedthe experiments and drafting of the manuscript. IS supervised the experiments, data analysis and drafting of themanuscript. All authors edited and approved the �nal manuscript.
Acknowledgments
The authors would like to thank Jose Orozco for his dedication and hard work which made this research possible,Rebecca Zhao for her assistance and Prof. Michele Zaccai for critical review of the manuscript. The mention of tradenames or commercial products in this publication is solely for the purpose of providing speci�c information and doesnot imply recommendation or endorsement by the U.S. Department of Agriculture (USDA).
References1. Adrian J, Farrona S, Reimer JJ, et al (2010) cis-Regulatory Elements and Chromatin State Coordinately Control
Temporal and Spatial Expression of FLOWERING LOCUS T in Arabidopsis. Plant Cell Online 22:1425–1440.https://doi.org/10.1105/tpc.110.074682
2. Amasino R (2010) Seasonal and developmental timing of �owering. Plant J 61:1001–1013.https://doi.org/10.1111/j.1365-313X.2010.04148.x
3. Andrés F, Coupland G (2012) The genetic basis of �owering responses to seasonal cues. Nat Rev Genet 13:627–639. https://doi.org/10.1038/nrg3291
4. Ballerini ES, Kramer EM (2011) In the light of evolution: A reevaluation of conservation in the CO-FT regulon andits role in photoperiodic regulation of �owering time. Front Plant Sci 2:1–13.https://doi.org/10.3389/fpls.2011.00081

Page 20/34
5. Bao S, Hua C, Shen L, Yu H (2020) New insights into gibberellin signaling in regulating �owering in Arabidopsis. JIntegr Plant Biol 62:118–131. https://doi.org/10.1111/jipb.12892
�. Blackman BK, Strasburg JL, Raduski AR, et al (2010) The Role of Recently Derived FT Paralogs in Sun�owerDomestication. Curr Biol 20:629–635. https://doi.org/10.1016/j.cub.2010.01.059
7. Blázquez MA, Ahn JH, Weigel D (2003) A thermosensory pathway controlling �owering time in Arabidopsisthaliana. Nat Genet 33:168–171. https://doi.org/10.1038/ng1085
�. Blümel M, Dally N, Jung C (2015) Flowering time regulation in crops-what did we learn from Arabidopsis? CurrOpin Biotechnol 32:121–129. https://doi.org/10.1016/j.copbio.2014.11.023
9. Borowski JM, Galli V, da Silva Messias R, et al (2014) Selection of candidate reference genes for real-time PCRstudies in lettuce under abiotic stresses. Planta 239:1187–1200. https://doi.org/10.1007/s00425-014-2041-2
10. Bouché F, Lobet G, Tocquin P, Périlleux C (2016) FLOR-ID: An interactive database of �owering-time gene networksin Arabidopsis thaliana. Nucleic Acids Res 44:D1167–D1171. https://doi.org/10.1093/nar/gkv1054
11. Broman KW, Speed TP (2002) A model selection approach for the identi�cation of quantitative trait loci inexperimental crosses. J R Stat Soc B 64:641–656. https://doi.org/10.1534/genetics.109.112912
12. Broman KW, Wu H, Sen Ś, Churchill GA (2003) R/qtl: QTL mapping in experimental crosses. Bioinformatics19:889–890. https://doi.org/10.1093/bioinformatics/btg112
13. Capovilla G, Schmid M, Posé D (2015) Control of �owering by ambient temperature. J Exp Bot 66:59–69.https://doi.org/10.1093/jxb/eru416
14. Catt SC, Braich S, Kaur S, Paull JG (2017) QTL detection for �owering time in faba bean and the responses toambient temperature and photoperiod. Euphytica 213:1–13. https://doi.org/10.1007/s10681-017-1910-8
15. Chen Z, Han Y, Ning K, et al (2018a) In�orescence Development and the Role of LsFT in Regulating Bolting inLettuce (Lactuca sativa L.). Front Plant Sci 8:1–10. https://doi.org/10.3389/fpls.2017.02248
1�. Chen Z, Zhao W, Ge D, et al (2018b) LCM-seq reveals the crucial role of LsSOC1 in heat-promoted bolting oflettuce (Lactuca sativa L.). Plant J 95:516–528. https://doi.org/10.1111/tpj.13968
17. Cheng XF, Wang ZY (2005) Overexpression of COL9, a CONSTANS-LIKE gene, delays �owering by reducingexpression of CO and FT in Arabidopsis thaliana. Plant J 43:758–768. https://doi.org/10.1111/j.1365-313X.2005.02491.x
1�. Cho LH, Yoon J, An G (2017) The control of �owering time by environmental factors. Plant J 90:708–719.https://doi.org/10.1111/tpj.13461
19. Corbesier L, Vincent C, Jang S, et al (2007) FT protein movement contributes to long-distance signaling in �oralinduction of Arabidopsis. Science (80- ) 316:1030–1033. https://doi.org/10.1126/science.1141752
20. Czechowski T, Stitt M, Altmann T, et al (2005) Genome-wide identi�cation and testing of superior reference genesfor transcript normalization. Plant Physiol 139:5–17. https://doi.org/10.1104/pp.105.063743.1
21. Davuluri R V., Sun H, Palaniswamy SK, et al (2003) AGRIS: Arabidopsis Gene Regulatory Information Server, aninformation resource of Arabidopsis cis-regulatory elements and transcription factors. BMC Bioinformatics 4:1–11. https://doi.org/10.1186/1471-2105-4-25
22. Elshire RJ, Glaubitz JC, Sun Q, et al (2011) A robust, simple genotyping-by-sequencing (GBS) approach for highdiversity species. PLoS One 6:1–10. https://doi.org/10.1371/journal.pone.0019379
23. Feenstra B, Skovgaard IM, Broman KW (2006) Mapping quantitative trait loci by an extension of the Haley-Knottregression method using estimating equations. Genetics 173:2269–2282.https://doi.org/10.1534/genetics.106.058537

Page 21/34
24. Fernández V, Takahashi Y, Le Gourrierec J, Coupland G (2016) Photoperiodic and thermosensory pathwaysinteract through CONSTANS to promote �owering at high temperature under short days. Plant J 86:426–440.https://doi.org/10.1111/tpj.13183
25. Fornara F, de Montaigu A, Coupland G (2010) SnapShot: Control of �owering in arabidopsis. Cell 141:3–5.https://doi.org/10.1016/j.cell.2010.04.024
2�. Franklin KA, Davis SJ, Stoddart WM, et al (2003) Mutant Analyses De�ne Multiple Roles for Phytochrome C inArabidopsis Photomorphogenesis. Plant Cell Online 15:1981–1989. https://doi.org/10.1105/tpc.015164
27. Fukuda M, Matsuo S, Kikuchi K, et al (2011) Isolation and functional characterization of the FLOWERING LOCUST homolog, the LsFT gene, in lettuce. J Plant Physiol 168:1602–1607.https://doi.org/10.1016/j.jplph.2011.02.004
2�. Fukuda M, Matsuo S, Kikuchi K, et al (2009) The endogenous level of GA1is upregulated by high temperatureduring stem elongation in lettuce through LsGA3ox1 expression. J Plant Physiol 166:2077–2084.https://doi.org/10.1016/j.jplph.2009.06.003
29. Fukuda M, Yanai Y, Nakano Y, et al (2017) Isolation and Gene Expression Analysis of Flowering-related Genes inLettuce (Lactuca sativa L.). Hortic J 86:340–348. https://doi.org/10.2503/hortj.OKD-036
30. Glaubitz JC, Casstevens TM, Lu F, et al (2014) TASSEL-GBS: A high capacity genotyping by sequencing analysispipeline. PLoS One 9:. https://doi.org/10.1371/journal.pone.0090346
31. Grube R, Ryder E (2004) Identi�cation of Lettuce (Lactuca sativa L.) Germplasm with Genetic Resistance to DropCaused by Sclerotinia minor. J Am Soc Hortic Sci 129:70–76. https://doi.org/10.21273/jashs.129.1.0070
32. GuoYou Y, Ogbonnaya F, Ginkel M van (2010) Marker-assisted recurrent backcrossing in cultivar development. In:Molecular plant breeding: principle, method and application. Studium Press LLC, Houston, pp 295–319
33. Han R, Truco MJ, Lavelle DO, Michelmore RW (2021) A Composite Analysis of Flowering Time Regulation inLettuce. Front Plant Sci 12:1–14. https://doi.org/10.3389/fpls.2021.632708
34. Han Y, Chen Z, Lv S, et al (2016) MADS-Box Genes and Gibberellins Regulate Bolting in Lettuce (Lactuca sativaL.). Front Plant Sci 7:1–14. https://doi.org/10.3389/fpls.2016.01889
35. Hartman Y, Hooftman DAP, Eric Schranz M, van Tienderen PH (2013) QTL analysis reveals the geneticarchitecture of domestication traits in Crisphead lettuce. Genet Resour Crop Evol 60:1487–1500.https://doi.org/10.1007/s10722-012-9937-0
3�. Hartman Y, Hooftman DAP, Uwimana B, et al (2012) Genomic regions in crop-wild hybrids of lettuce are affecteddifferently in different environments: Implications for crop breeding. Evol Appl 5:629–640.https://doi.org/10.1111/j.1752-4571.2012.00240.x
37. Hayashi E, Aoyama N, Wu Y, et al (2007) Multiplexed, Quantitative Gene Expression Analysis for Lettuce SeedGermination on GenomeLabTM GeXP Genetic Analysis System
3�. Higo K, Ugawa Y, Iwamoto M, Korenaga T (1999) Plant cis-acting regulatory DNA elements (PLACE) database:1999. Nucleic Acids Res 27:297–300. https://doi.org/10.1093/nar/27.1.297
39. Huang T, Bohlenius H, Eriksson S, et al (2005) The mRNA of the Arabidopsis gene FT moves from leaf to shootapex and induces �owering. Science (80- ) 309:1694–1696
40. Huo H, Wei S, Bradford KJ (2016) DELAY OF GERMINATION1 ( DOG1 ) regulates both seed dormancy and�owering time through microRNA pathways. Proc Natl Acad Sci 113:E2199–E2206.https://doi.org/10.1073/pnas.1600558113
41. Ito H, Kato T, Konno Y (1963) Factors associated with the Flower Induction in Lettuce. Tohoku J. Agric. Res.14:51–65

Page 22/34
42. Jenni S, Truco MJ, Michelmore RW (2013) Quantitative trait loci associated with tipburn, heat stress-inducedphysiological disorders, and maturity traits in crisphead lettuce. Theor Appl Genet 126:3065–3079.https://doi.org/10.1007/s00122-013-2193-7
43. Jeuken MJW, Lindhout P (2004) The development of lettuce backcross inbred lines (BILs) for exploitation of theLactuca saligna (wild lettuce) germplasm. Theor Appl Genet 109:394–401. https://doi.org/10.1007/s00122-004-1643-7
44. Kim JJ, Lee JH, Kim W, et al (2012) The microrNA156-SQUAMOSA promoter binding protein-like3 moduleregulates ambient temperature-responsive �owering via �owering locus in Arabidopsis. Plant Physiol 159:461–478. https://doi.org/10.1104/pp.111.192369
45. Kim W, Park TI, Yoo SJ, et al (2013) Generation and analysis of a complete mutant set for the ArabidopsisFT/TFL1 family shows speci�c effects on thermo-sensitive �owering regulation. J Exp Bot 64:1715–1729.https://doi.org/10.1093/jxb/ert036
4�. Komeda Y (2004) GENETIC REGULATION OF TIME TO FLOWER IN ARABIDOPSIS THALIANA. Annu Rev Plant Biol55:521–535. https://doi.org/10.1146/annurev.arplant.55.031903.141644
47. Koornneef M, Alonso-Blanco C, Peeters AJ, Soppe W (1998) Genetic control of �owering time in Arabidopsis.Annu Rev Plant Biol 49:345–370. https://doi.org/10.1002/9781119409144.ch22
4�. Kronenberg R, GHM EK (1994) Photomorphogenesis in plants. Springer Science & Business Media
49. Kumar SV, Lucyshyn D, Jaeger KE, et al (2012) Transcription factor PIF4 controls the thermosensory activation of�owering. Nature 484:242–245. https://doi.org/10.1038/nature10928
50. Kumimoto RW, Adam L, Hymus GJ, et al (2008) The Nuclear Factor Y subunits NF-YB2 and NF-YB3 play additiveroles in the promotion of �owering by inductive long-day photoperiods in Arabidopsis. Planta 228:709–723.https://doi.org/10.1007/s00425-008-0773-6
51. Kwon S, Simko I, Hellier B, et al (2013) Genome-wide association of 10 horticultural traits with expressedsequence tag-derived SNP markers in a collection of lettuce lines. Crop J 1:25–33.https://doi.org/10.1016/j.cj.2013.07.014
52. Lafta A, Turini T, Sandoya G V., Mou B (2017) Field Evaluation of Green and Red Leaf Lettuce Genotypes in theImperial, San Joaquin, and Salinas Valleys of California for Heat Tolerance and Extension of the GrowingSeasons. HortScience 52:40–48. https://doi.org/10.21273/HORTSCI10835-16
53. Lee ON, Lee SM, Park HY, Kawabata S (2019) Mapping of Stem Growth QTLs in lettuce ( Lactuca sativa L.) UsingGenotyping-by-Sequencing (GBS ). In: conference.horticulture.or.kr. pp 225–226
54. Letunic I, Bork P (2018) 20 years of the SMART protein domain annotation resource. Nucleic Acids Res 46:D493–D496. https://doi.org/10.1093/nar/gkx922
55. Liu L, Adrian J, Pankin A, et al (2014) Induced and natural variation of promoter length modulates thephotoperiodic response of FLOWERING LOCUS T. Nat Commun 5:1–9. https://doi.org/10.1038/ncomms5558
5�. Liu X, Lv S, Liu R, et al (2018) Transcriptomic analysis reveals the roles of gibberellin-regulated genes andtranscription factors in regulating bolting in lettuce (Lactuca sativa L.). PLoS One 13:1–17.https://doi.org/10.1371/journal.pone.0191518
57. Maldonado C, Mora F, Bengosi Bertagna FA, et al (2019) SNP- And haplotype-based GWAS of �owering-relatedtraits in maize with network-assisted gene prioritization. Agronomy 9:.https://doi.org/10.3390/agronomy9110725
5�. Mamo BE, Hayes RJ, Truco MJ, et al (2019) The genetics of resistance to lettuce drop (Sclerotinia spp.) in lettucein a recombinant inbred line population from Reine des Glaces × Eruption. Theor Appl Genet 132:2439–2460.

Page 23/34
https://doi.org/10.1007/s00122-019-03365-6
59. Mátyás KK, Hegedűs G, Taller J, et al (2019) Different expression pattern of �owering pathway genes contributeto male or female organ development during �oral transition in the monoecious weed Ambrosia artemisiifolia L.(Asteraceae). PeerJ 2019:. https://doi.org/10.7717/peerj.7421
�0. McGinnis S, Madden TL (2004) BLAST: At the core of a powerful and diverse set of sequence analysis tools.Nucleic Acids Res 32:20–25. https://doi.org/10.1093/nar/gkh435
�1. Michaels SD, Amasino RM (2000) Memories of winter: Vernalization and the competence to �ower. Plant, CellEnviron 23:1145–1153. https://doi.org/10.1046/j.1365-3040.2000.00643.x
�2. Monte E, Alonso JM, Ecker JR, et al (2003) Isolation and Characterization of phyC Mutants in ArabidopsisReveals Complex Crosstalk between Phytochrome Signaling Pathways. Plant Cell 15:1962–1980.https://doi.org/10.1105/tpc.012971.direction
�3. Nakano Y, Higuchi Y, Sumitomo K, Hisamatsu T (2013) Flowering retardation by high temperature inchrysanthemums: Involvement of FLOWERING LOCUS T-like 3 gene repression. J Exp Bot 64:909–920.https://doi.org/10.1093/jxb/ers370
�4. Ning K, Han Y, Chen Z, et al (2019) Genome ‐ wide analysis of MADS ‐ box family genes during �owerdevelopment in lettuce. Plant Cell Environ 42:1868–1881. https://doi.org/10.1111/pce.13523
�5. Nishida H, Ishihara D, Ishii M, et al (2013) Phytochrome C Is A Key Factor Controlling Long-Day Flowering inBarley. Plant Physiol 163:804–814. https://doi.org/10.1104/pp.113.222570
��. Pearce S, Kippes N, Chen A, et al (2016) RNA-seq studies using wheat PHYTOCHROME B and PHYTOCHROME Cmutants reveal shared and speci�c functions in the regulation of �owering and shade-avoidance pathways. BMCPlant Biol 16:1–19. https://doi.org/10.1186/s12870-016-0831-3
�7. Pham VN, Kathare PK, Huq E (2018) Phytochromes and phytochrome interacting factors. Plant Physiol176:1025–1038. https://doi.org/10.1104/pp.17.01384
��. Putterill J, Laurie R, Macknight R (2004) It’s time to �ower: The genetic control of �owering time. BioEssays26:363–373. https://doi.org/10.1002/bies.20021
�9. Putterill J, Varkonyi-Gasic E (2016) FT and �origen long-distance �owering control in plants. Curr Opin Plant Biol33:77–82. https://doi.org/10.1016/j.pbi.2016.06.008
70. Rappaport L, Wittwer S, Tukey H (1956) Seed Vernalization and Flowering in Lettuce (Lactuca sativa). Nature 51:.https://doi.org/https://doi.org/10.1038/178051a0
71. Reyes-Chin-Wo S, Wang Z, Yang X, et al (2017) Genome assembly with in vitro proximity ligation data and whole-genome triplication in lettuce. Nat Commun 8:1–11. https://doi.org/10.1038/ncomms14953
72. Romera-Branchat M, Andrés F, Coupland G (2014) Flowering responses to seasonal cues: What’s new? Curr OpinPlant Biol 21:120–127. https://doi.org/10.1016/j.pbi.2014.07.006
73. Ryder EJ (1996) Ten lettuce genetic stocks with early �owering genes Ef-lef- 1 and Ef- 2ef-2. HortScience 31:473–475
74. Ryder EJ (1988) Early Flowering in Lettuce as In�uenced by a Second Flowering Time Gene and SeasonalVariation. J Am Soc Hortic Sci 113:456–460
75. Ryder EJ (1983) Inheritance , Linkage , and Gene Interaction Studies in Lettuce. J Am Soc Hortic Sci 108:985–991
7�. Ryder EJ, Milligan DC (2005) Additional Genes Controlling Flowering Time in Lactuca sativa and L. serriola. JAmer Soc Hort Sci 130:448–453

Page 24/34
77. Samach A, Coupland G (2000) Time measurement and the control of �owering in plants. BioEssays 22:38–47.https://doi.org/10.1002/(SICI)1521-1878(200001)22:1<38::AID-BIES8>3.0.CO;2-L
7�. Schwartz C, Balasubramanian S, Warthmann N, et al (2009) Cis-regulatory changes at Flowering Locus Tmediate natural variation in �owering responses of Arabidopsis thaliana. Genetics 183:723–732.https://doi.org/10.1534/genetics.109.104984
79. Sgamma T, Pape J, Massiah A, Jackson S (2016) Selection of reference genes for diurnal and developmentaltime-course real-time PCR expression analyses in lettuce. Plant Methods 12:1–9.https://doi.org/10.1186/S13007-016-0121-Y
�0. Sharrock RA, Quail PH (1989) Novel phytochrome sequences in Arabidopsis thaliana: structure, evolution, anddifferential expression of a plant regulatory photoreceptor family. Genes Dev 3:1745–1757.https://doi.org/10.1101/gad.3.11.1745
�1. Shin AY, Han YJ, Baek A, et al (2016) Evidence that phytochrome functions as a protein kinase in plant lightsignalling. Nat Commun 7:. https://doi.org/10.1038/ncomms11545
�2. Silva EC, Maluf WR, Leal NR, Gomes LAA (1999) Inheritance of bolting tendency in lettuce Lactuca sativa L.Euphytica 109:1–7. https://doi.org/10.1023/A:1003698117689
�3. Simko I (2013) Marker-Assisted Selection for Disease Resistance in Lettuce. In: Rajeev K V, Tuberosa R (eds)Translational Genomics for Crop Breeding, Volume I: Biotic Stress, First Edit. John Wiley & Sons, Inc., pp 267–289
�4. Simko I (2016) High-Resolution DNA Melting Analysis in Plant Research. Trends Plant Sci 21:528–537.https://doi.org/10.1016/j.tplants.2016.01.004
�5. Simonne A, Simonne E, Eitenmiller R, Coker CH (2002) Bitterness and composition of lettuce varieties grown inthe southeastern United States. Horttechnology 12:721–726
��. Song YH, Ito S, Imaizumi T (2013) Flowering time regulation: Photoperiod- and temperature-sensing in leaves.Trends Plant Sci 18:575–583. https://doi.org/10.1016/j.tplants.2013.05.003
�7. Song YH, Shim JS, Kinmonth-Schultz HA, Imaizumi T (2015) Photoperiodic �owering: Time measurementmechanisms in leaves. Annu Rev Plant Biol 66:441–464. https://doi.org/10.1146/annurev-arplant-043014-115555
��. Sthapit Kandel J, Peng H, Hayes RJ, et al (2020) Genome-wide association mapping reveals loci for shelf life anddevelopmental rate of lettuce. Theor Appl Genet 133:1947–1966. https://doi.org/10.1007/s00122-020-03568-2
�9. Terzaghi WB, Cashmore AR (1995) Light-Regulated Transcription. Annu Rev Plant Physiol Plant Mol Biol 46:445–474
90. Thompson RC (1943) Further studies on interspeci�c genetic relationships in Lactuca. J Agric Res 66:41–48
91. Umetsu A, Sawada Y, Mitsuhashi W, et al (2011) Characterization of a Loss-of-Function Mutant of GibberellinBiosynthetic Gene LsGA3ox1 in Lettuce. Biosci Biotechnol Biochem 75:2398–2400.https://doi.org/10.1271/bbb.110475
92. Vandesompele J, De Preter K, Pattyn ilip, et al (2002) Accurate normalization of real-time quantitative RT-PCRdata by geometric averaging of multiple internal control genes. Genome Biol 3:34–1. https://doi.org/10.1186/gb-2002-3-7-research0034
93. Vierstra RD, Davis SJ (2000) Bacteriophytochromes: New tools for understanding phytochrome signaltransduction. Semin Cell Dev Biol 11:511–521. https://doi.org/10.1006/scdb.2000.0206
94. Wang L, Xue J, Dai W, et al (2019) Genome-wide Identi�cation, Phylogenetic Analysis, and Expression Pro�ling ofCONSTANS-like (COL) Genes in Vitis vinifera. J Plant Growth Regul 38:631–643.https://doi.org/10.1007/s00344-018-9878-8

Page 25/34
95. Waycott W (1995) Photoperiodic response of genetically diverse lettuce accessions. J Am Soc Hortic Sci120:460–467
9�. Wien HC (2017) Lettuce. In: HC Wein, Stutzel H (eds) The Physiology of Vegetable Crops. CAB International, pp1–34
97. Wu W, Zhang Y, Zhang M, et al (2018) The rice CONSTANS-like protein OsCOL15 suppresses �owering bypromoting Ghd7 and repressing RID1. Biochem Biophys Res Commun 495:1349–1355.https://doi.org/10.1016/j.bbrc.2017.11.095
9�. Yoong F-Y, O’Brien LK, Truco MJ, et al (2016) Genetic Variation for Thermotolerance in Lettuce Seed GerminationIs Associated with Temperature-Sensitive Regulation of ETHYLENE RESPONSE FACTOR1 ( ERF1 ). Plant Physiol170:472–488. https://doi.org/10.1104/pp.15.01251
Figures

Page 26/34
Figure 1
Distribution of DFLT in the RIL population grown in four controlled conditions: LD-HT, LD-LT, SD-HT and SD-LT. DFLTof population parents, cv. Salinas (Sal) and PI251246 (PI) in each condition are marked by vertical line if evaluated
Page 27/34
Figure 2
QTLs detected for DBLT, DFLT and DBFr in the RIL population in four controlled conditions. Signi�cant QTL (α=0.05)are marked by full bars within their 1-LOD range, error bars indicate 2-LOD range. Suggestive QTL (0.1 ≥ α ≥ 0.05) aremarked by hatched bars in their 1-LOD range. Growth conditions indicated by color: LD-LT (dark blue), LD-HT (darkred), SD-LT (blue) and SD-HT (red). Marker names and locations (in cM) of QTL peaks are indicated in addition to themarkers at top and bottom of each chromosome

Page 28/34
Figure 3
The interaction between the allelic effect of markers cS7_209035609 and cS2_40045553, linked to qFLT7.2 andqBFr2.1, respectively, on DFLT in four controlled conditions LD-HT, LD-LT, SD-HT and SD-LT. P alleles originated fromPI 251246 parent and S alleles from cv. Salinas. Note differences in Y axis scale, which was based on highest valuesobserved

Page 29/34
Figure 4
Fine mapping of qBLT7.2/qFLT7.2 QTL. a Chromosome 7 with the QTL region overlapping in multiple conditions anddevelopmental stages marked with a bar. b Linkage group of locally designed markers for �ne mapping in F2population and c corresponding LOD plot of marker association to DFLT. d Genotype of F2 plants which were found tohave recombination between the most tightly associated markers. In black, cv. Salinas allele and in whiteheterozygous for PI 251246 and cv. Salinas alleles. The late/early �owering phenotype is described above the bars. eThe genomic region identi�ed as associated with DFLT. Markers used for �ne mapping are indicated in red. Predictedgenes are indicated in green

Page 30/34
Figure 5
The average days to DBUD (solid bars) and DBLT (dashed bars) for each genotype used in gene expression study.Colors indicate growth conditions: LD-HT (dark red), LD-LT (dark blue), SD-HT (red) and SD-LT (blue). Averages arebased on at least nine plants, and error bars indicate standard deviation

Page 31/34
Figure 6
The relative expression levels of COL9 (Lsat_1_v5_gn_7_97240.1) in leaves over the time course of plantdevelopment. Shapes indicate genotype: PI251246 (full circle), RIL 69 (empty circle), RIL 68 (empty square) and cv.Salinas (full square). Colors indicate growth conditions: LD-HT (dark red), LD-LT (dark blue), SD-HT (red) and SD-LT(blue). Error bars indicate standard error of three replicates
Figure 7
The relative expression levels of PhyC (Lsat_1_v5_gn_7_96941.1) in plant tips over the time course of plantdevelopment. Shapes indicate genotype: PI 251246 (full circle), RIL 69 (empty circle), RIL 68 (empty square) and cv.Salinas (full square). Colors indicate growth conditions: LD-HT (dark red), LD-LT (dark blue), SD-HT (red) and SD-LT(blue). Error bars indicate standard error of three replicates

Page 32/34
Figure 8
The relative expression levels of LsFT in plant leaves and tips 14 days after germination. Sampling was prior totreatment initiation, when all plants were grown under 8h light at 20°C. Error bars indicate standard error of threereplicates.

Page 33/34
Figure 9
The relative expression levels of LsFT in plant leaves (top row) and tips (bottom row) over the time course of plantdevelopment. Shapes indicate genotype: PI 251246 (full circle), RIL 69 (empty circle), RIL 68 (empty square) and cv.Salinas (full square). Colors indicate growth conditions: LD-HT (dark red), LD-LT (dark blue), SD-HT (red) and SD-LT(blue). Error bars indicate standard error of three replicates. Each panel uses a y-axis scale to optimize visualization ofchanges during development of each genotype
Figure 10
The genomic region of LsFT. Light green bars annotate exons and light gray bars annotate UTRs. Red lines annotatesequence polymorphisms between cv. Salinas and PI 251246. Blue blocks annotate predicted transcription factorbinding sites in cv. Salinas that are affected by polymorphisms in PI 251246. Nucleotides are numbered relative to thetranslation start site
Supplementary Files

Page 34/34
This is a list of supplementary �les associated with this preprint. Click to download.
Supplementarytablessubmit.xlsx