Draft Measure Information Template – Chiller … · 4/27/2011 · Draft Measure Information...
41
CODES AND STANDARDS ENHANCEMENT INITIATIVE (CASE) Draft Measure Information Template – Chiller Minimum Efficiency 2013 California Building Energy Efficiency Standards California Utilities Statewide Codes and Standards Team, April 2011 This report was prepared by the California Statewide Utility Codes and Standards Program and funded by the California utility customers under the auspices of the California Public Utilities Commission. Copyright 2011 Pacific Gas and Electric Company, Southern California Edison, SoCalGas, SDG&E. All rights reserved, except that this document may be used, copied, and distributed without modification. Neither PG&E, SCE, SoCalGas, SDG&E, nor any of its employees makes any warranty, express of implied; or assumes any legal liability or responsibility for the accuracy, completeness or usefulness of any data, information, method, product, policy or process disclosed in this document; or represents that its use will not infringe any privately-owned rights including, but not limited to, patents, trademarks or copyrights
Transcript of Draft Measure Information Template – Chiller … · 4/27/2011 · Draft Measure Information...
CODES AND STANDARDS ENHANCEMENT INITIATIVE (CASE)
Draft Measure Information Template – Chiller Minimum Efficiency 2013 California Building Energy Efficiency Standards California Utilities Statewide Codes and Standards Team, April 2011
This report was prepared by the California Statewide Utility Codes and Standards Program and funded by the California utility customers under the auspices of the California Public Utilities Commission.
Copyright 2011 Pacific Gas and Electric Company, Southern California Edison, SoCalGas, SDG&E.
All rights reserved, except that this document may be used, copied, and distributed without modification.
Neither PG&E, SCE, SoCalGas, SDG&E, nor any of its employees makes any warranty, express of implied; or assumes any legal liability or responsibility for the accuracy, completeness or usefulness of any data, information, method, product, policy or process disclosed in this document; or represents that its use will not infringe any privately-owned rights including, but not limited to, patents, trademarks or copyrights

Chiller Minimum Efficiency Page 2
2013 California Building Energy Efficiency Standards April 26, 2011
CONTENTS CODES AND STANDARDS ENHANCEMENT INITIATIVE (CASE) ................. 1
1. Overview ................................................................................................................................. 3
2 Methodology ............................................................................................................................ 6
3 Analysis and Results .............................................................................................................. 12
4 Stakeholder Input ................................................................................................................... 18
5 Recommended Language for the Standards Document, ACM Manuals, and the Reference Appendices .................................................................................................................................... 19
6 Bibliography and Other Research .......................................................................................... 24
7 Appendices ............................................................................................................................ 25

Chiller Minimum Efficiency Page 3
2013 California Building Energy Efficiency Standards April 26, 2011
1. Overview
1.1 Measure Title Chiller Minimum Efficiency
1.2 Description This measure proposes to update Title 24-2013 to adopt and build on the changes to the chiller efficiency measures new in ASHRAE 90.1-2010. In particular this includes the new chiller efficiencies in 90.1-2007 Addendum M and the increase in coverage of centrifugal chillers in 90.1-2007 Addenda BL and BT (K-factor adjustment). Addendum M introduced two paths to compliance Path A for fixed speed chillers and Path B for variable speed chillers. This measure proposes to go beyond 90.1 2010 in that it seeks to choose only one path per chiller category based on life-cycle cost.
This report also proposes changes to the existing limitations for air cooled chillers 144(i) (new constructions) and 149(c) (plant expansions). These provisions have been gamed in the field and we are proposing changes to close loopholes.
1.3 Type of Change This proposes changes to the mandatory requirements, prescriptive requirements and the performance requirements.
1.4 Energy Benefits This measure proposes to increase the minimum energy efficiency requirements of both air-cooled and water-cooled chillers in California. Increased energy efficiency reduces the amount of cooling energy required to maintain the same cooling output.
A summary of the energy savings results are given below in
Electricity Savings (kwh/yr)
Demand Savings
(kw)
Natural Gas
Savings (therms/yr)
TDV Electricity Savings
TDV Gas
Savings
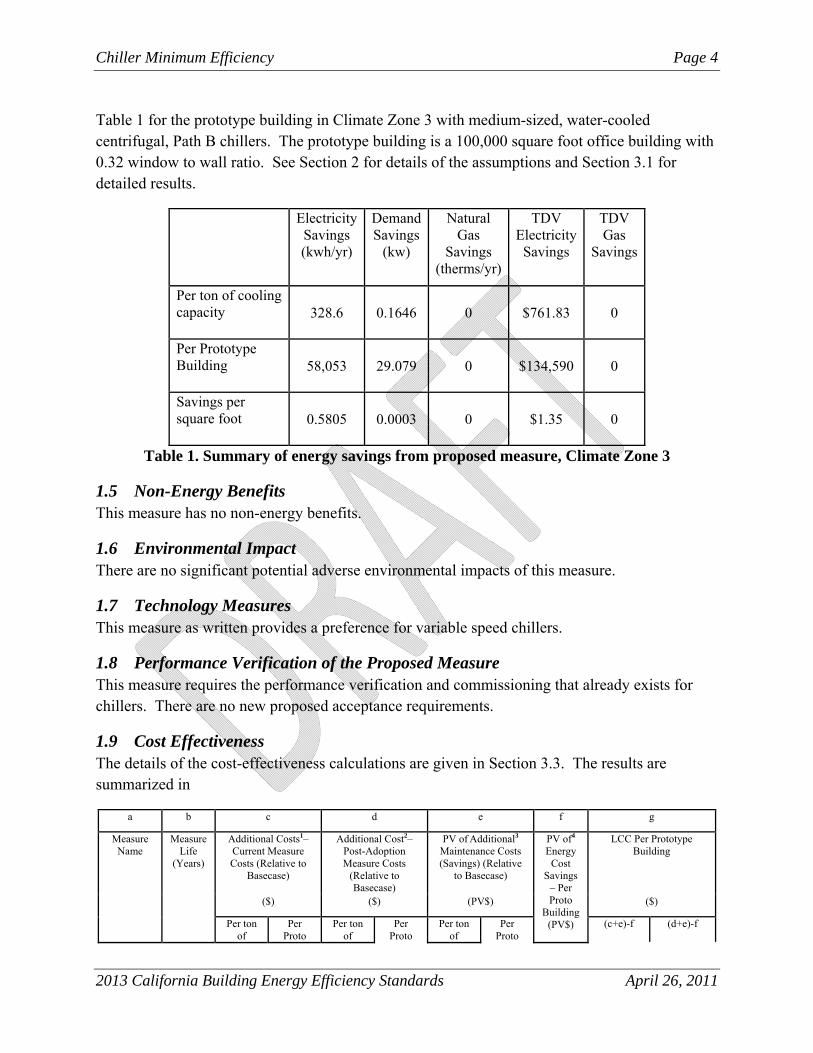
Per ton of cooling capacity 328.6 0.1646 0 $761.83 0
Per Prototype Building 58,053 29.079 0 $134,590 0
Savings per square foot 0.5805 0.0003 0 $1.35 0
Chiller Minimum Efficiency Page 4
2013 California Building Energy Efficiency Standards April 26, 2011
Table 1 for the prototype building in Climate Zone 3 with medium-sized, water-cooled centrifugal, Path B chillers. The prototype building is a 100,000 square foot office building with 0.32 window to wall ratio. See Section 2 for details of the assumptions and Section 3.1 for detailed results.
Electricity Savings (kwh/yr)
Demand Savings
(kw)
Natural Gas
Savings (therms/yr)
TDV Electricity Savings
TDV Gas
Savings
Per ton of cooling capacity 328.6 0.1646 0 $761.83 0
Per Prototype Building 58,053 29.079 0 $134,590 0
Savings per square foot 0.5805 0.0003 0 $1.35 0
Table 1. Summary of energy savings from proposed measure, Climate Zone 3
1.5 Non-Energy Benefits This measure has no non-energy benefits.
1.6 Environmental Impact There are no significant potential adverse environmental impacts of this measure.
1.7 Technology Measures This measure as written provides a preference for variable speed chillers.
1.8 Performance Verification of the Proposed Measure This measure requires the performance verification and commissioning that already exists for chillers. There are no new proposed acceptance requirements.
1.9 Cost Effectiveness The details of the cost-effectiveness calculations are given in Section 3.3. The results are summarized in
a b c d e f g
Measure Name
Measure Life
(Years)
Additional Costs1– Current Measure Costs (Relative to
Basecase)
Additional Cost2– Post-Adoption Measure Costs
(Relative to Basecase)
PV of Additional3 Maintenance Costs (Savings) (Relative
to Basecase)
PV of4 Energy
Cost Savings
– Per Proto
Building (PV$)
LCC Per Prototype Building
($) ($) (PV$) ($)
Per ton of
Per Proto
Per ton of
Per Proto
Per ton of
Per Proto
(c+e)-f (d+e)-f

Chiller Minimum Efficiency Page 5
2013 California Building Energy Efficiency Standards April 26, 2011
cooling capacity
Building cooling capacity
Building cooling capacity
Building Based on Current Costs
Based on Post-
Adoption Costs
WC PD, <75 tons
15 $52.98 $9,361 $52.98 $9,361 $0 $0 $70,087 -$60,727 -$60,727
WC PD, >75 and <150
15 $39.23 $6,931 $39.23 $6,931 $0 $0 $58,309 -$51,378 -$51,378
WC PD, >150 and <300
15 $36.31 $6,415 $36.31 $6,415 $0 $0 $52,647 -$46,231 -$46,231
WC PD, >300 tons
15 $26.07 $4,605 $26.07 $4,605 $0 $0 $47,284 -$42,678 -$42,678
WC Cent, <150 tons
15 $47.60 $8,409 $47.60 $8,409 $0 $0 $185,982 -$177,572 -$177,572
WC Cent, >150 and <300
15 $57.28 $10,119 $57.28 $10,119 $0 $0 $124,472 -$114,353 -$114,353
WC Cent, >300 and <600
15 $52.80 $9,328 $52.80 $9,328 $0 $0 $104,193 -$94,865 -$94,865
WC Cent, >600 tons
15 $44.83 $7,920 $44.83 $7,920 $0 $0 $111,353 -$103,433 -$103,433
Table 2 for Path B chillers in Climate Zone 3.
a b c d e f g
Measure Name
Measure Life
(Years)
Additional Costs1– Current Measure Costs (Relative to
Basecase)
Additional Cost2– Post-Adoption Measure Costs
(Relative to Basecase)
PV of Additional3 Maintenance Costs (Savings) (Relative
to Basecase)
PV of4 Energy
Cost Savings
– Per Proto
Building (PV$)
LCC Per Prototype Building
($) ($) (PV$) ($)
Per ton of
cooling capacity
Per Proto
Building
Per ton of
cooling capacity
Per Proto
Per ton of
cooling capacity
Per Proto
(c+e)-f (d+e)-f
Building Building Based on Current Costs
Based on Post-
Adoption Costs
WC PD, <75 tons
15 $52.98 $9,361 $52.98 $9,361 $0 $0 $70,087 -$60,727 -$60,727
WC PD, >75 and <150
15 $39.23 $6,931 $39.23 $6,931 $0 $0 $58,309 -$51,378 -$51,378
WC PD, >150 and <300
15 $36.31 $6,415 $36.31 $6,415 $0 $0 $52,647 -$46,231 -$46,231
WC PD, >300 tons
15 $26.07 $4,605 $26.07 $4,605 $0 $0 $47,284 -$42,678 -$42,678
WC Cent, <150 tons
15 $47.60 $8,409 $47.60 $8,409 $0 $0 $185,982 -$177,572 -$177,572

Chiller Minimum Efficiency Page 6
2013 California Building Energy Efficiency Standards April 26, 2011
WC Cent, >150 and <300
15 $57.28 $10,119 $57.28 $10,119 $0 $0 $124,472 -$114,353 -$114,353
WC Cent, >300 and <600
15 $52.80 $9,328 $52.80 $9,328 $0 $0 $104,193 -$94,865 -$94,865
WC Cent, >600 tons
15 $44.83 $7,920 $44.83 $7,920 $0 $0 $111,353 -$103,433 -$103,433
Table 2. Life-cycle cost results for Path B chillers in Climate Zone 3
1.10 Analysis Tools Currently available simulation programs such as eQuest are capable of modeling the requirements of this measure.
1.11 Relationship to Other Measures This measure has no relation to other measures.

Chiller Minimum Efficiency Page 7
2013 California Building Energy Efficiency Standards April 26, 2011
2 Methodology Chiller minimum efficiency is not federally pre-empted and therefore California is free to set minimum efficiency requirements as it sees fit. In the past, however, the chiller efficiencies in Title 24 have been identical to ASHRAE 90.1. For example, the Title 24-2001 chiller efficiencies were updated to be consistent with ASHRAE 90.1-1999 and the Title 24-2005 chiller efficiencies were updated to be consistent with ASHRAE 90.1-2001. Chiller efficiency levels did not change in 90.1-2004 or 90.1-2007, i.e ASHRAE chiller efficiencies have not changed since 2001. There are a number of reasons why Title 24 has historically followed ASHRAE’s lead on chiller efficiencies. One reason is that chiller manufacturers have generally not been willing to provide efficiency versus cost data, which makes it difficult to perform lifecycle cost analyses to determine the efficiency level at which lifecycle cost is minimized. In 2005 Title 24 went beyond 90.1 by adding a prescriptive restriction to air-cooled chillers in 144(h) and 149(c).
As mentioned in the overview, ASHRAE has recently completed three chiller addenda to 90.1-2007 which were adopted in 90.1-2010 (see Section 7.1).
Addendum M increased both full load efficiency (COP) and integrated part load efficiency (IPLV) for all chillers and added two alternative paths of compliance: Path A for fixed speed machines and Path B for variable speed machines. Path A has a lower COP but higher IPLV than Path B. Addendum M also reorganized all chillers into positive displacement and centrifugal. Finally Addendum M eliminated the ratings for chillers without a condenser.
Addenda BL and BT greatly increased the range of non-standard operating conditions over which the chiller efficiency requirements apply for centrifugal chilers.
The values in Addendum M were negotiated between chiller manufacturers, and manufacturers provided a limited amount of cost data which allowed ASHRAE to compute a scalar for Addendum M. ASHRAE also projected a total annual energy savings attributed to adoption of Addendum M of 457 GWh/yr.
Under Addenda BL and BT, AHRI calculated that 52% more centrifugal chillers will now be covered by 90.1-2010 compared to 90.1-2007. In other words there are now minimum efficiency requirements for many chillers which previously had no requirements at all. Addenda BL and BT are estimated to save over 24 GWh annually worldwide, with estimated savings of 12 GWh per year in the U.S.
The energy savings for both Path A and Path B presented in the 90.1 addenda were estimated using energy models. A generic large office building was modeled with a chiller plant. Chillers that comply with the existing standard were modeled, as well as chillers that comply with the proposed measure. The details of the model are given below.
Chiller Minimum Efficiency Page 8
2013 California Building Energy Efficiency Standards April 26, 2011
2.1 Envelope The building has 10 floors, totaling 100,000 ft2. Each floor has four perimeter zones (each 1,275 ft2) and one interior zone (4,900 ft2). The floor to floor height is 12 feet, and the plenum height is 3 feet. Each floor has a continuous strip of 4.8-ft tall glazing on all exterior walls.
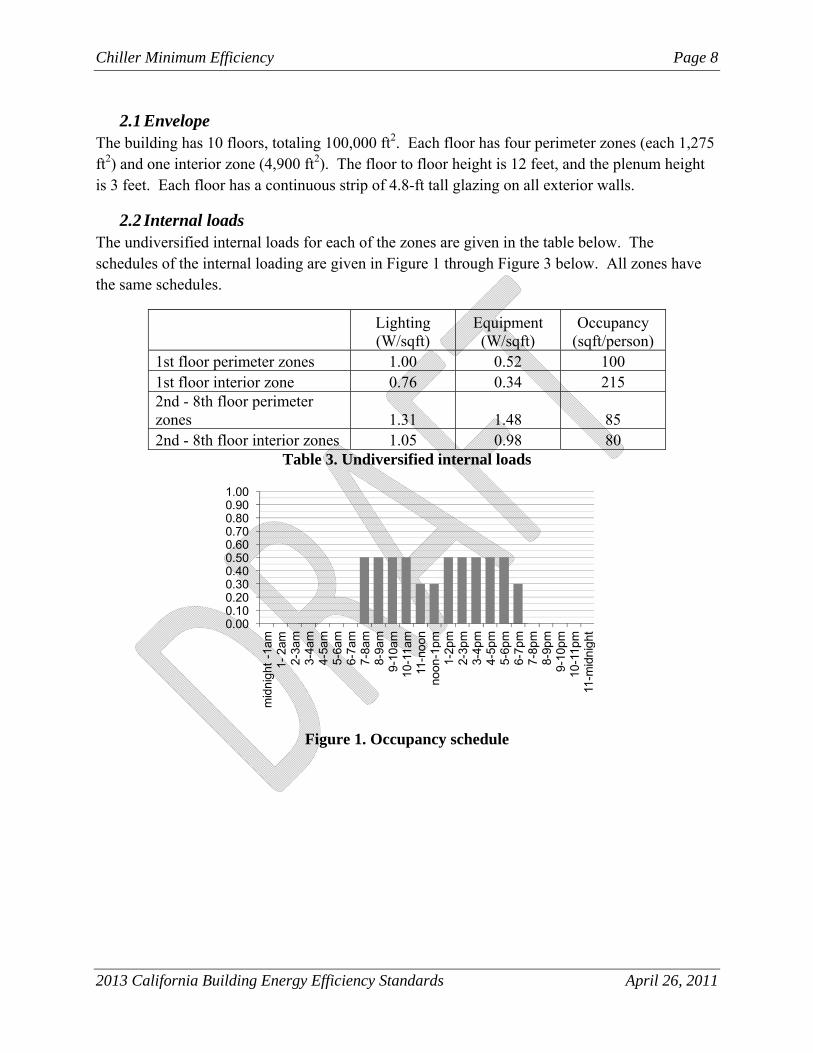
2.2 Internal loads The undiversified internal loads for each of the zones are given in the table below. The schedules of the internal loading are given in Figure 1 through Figure 3 below. All zones have the same schedules.
Lighting (W/sqft)
Equipment (W/sqft)
Occupancy (sqft/person)
1st floor perimeter zones 1.00 0.52 100 1st floor interior zone 0.76 0.34 215 2nd - 8th floor perimeter zones 1.31 1.48 85 2nd - 8th floor interior zones 1.05 0.98 80
Table 3. Undiversified internal loads
Figure 1. Occupancy schedule
0.000.100.200.300.400.500.600.700.800.901.00
mid
nigh
t -1
am1-
2am
2-3a
m3-
4am
4-5a
m5-
6am
6-7a
m7-
8am
8-9a
m9-
10am
10-1
1am
11-n
oon
noon
-1pm
1-2p
m2-
3pm
3-4p
m4-
5pm
5-6p
m6-
7pm
7-8p
m8-
9pm
9-10
pm10
-11p
m11
-mid
nigh
t

Chiller Minimum Efficiency Page 9
2013 California Building Energy Efficiency Standards April 26, 2011
Figure 2. Lighting schedule
Figure 3. Equipment schedule
2.3 Mechanical system The mechanical system consists of a large VAV air handler with chilled water and hot water coils. Local reheating is done at the zone terminal VAV boxes. Hot water is provided by a single atmospheric boiler. Water-cooled and air-cooled chillers are both modeled, the details of which are given below. The system fans run from 5am to 8pm, Monday through Friday, and 5am to 3pm on Saturdays. The fans do not run on Sundays and holidays. The thermostat setpoints in all zones are 74°F for cooling and 70°F for heating.
2.3.1 Air handler There is one large variable air volume air handler serving the building. The air handler has plenum return and outdoor air economizers. The cooling coils in the air handler were sized for each climate zone based on the peak building load, as calculated with eQuest. The cooling
0.000.100.200.300.400.500.600.700.800.901.00
mid
nigh
t -1
am1-
2am
2-3a
m3-
4am
4-5a
m5-
6am
6-7a
m7-
8am
8-9a
m9-
10am
10-1
1am
11-n
oon
noon
-1pm
1-2p
m2-
3pm
3-4p
m4-
5 pm
5-6p
m6-
7pm
7-8p
m8-
9pm
9-10
pm10
-11p
m11
-mid
nigh
t0.000.100.200.300.400.500.600.700.800.901.00
mid
nigh
t -1
am1-
2am
2-3a
m3-
4am
4-5a
m5-
6am
6-7a
m7-
8am
8-9a
m9-
10am
10-1
1am
11-n
oon
noon
-1pm
1-2p
m2-
3pm
3-4p
m4-
5 pm
5-6p
m6-
7pm
7-8p
m8-
9pm
9-10
pm10
-11p
m11
-mid
nigh
t
Chiller Minimum Efficiency Page 10
2013 California Building Energy Efficiency Standards April 26, 2011
supply air temperature is 55°F and is allowed to reset. The heating supply air temperature is 95°F, and has a 35°F delta T.
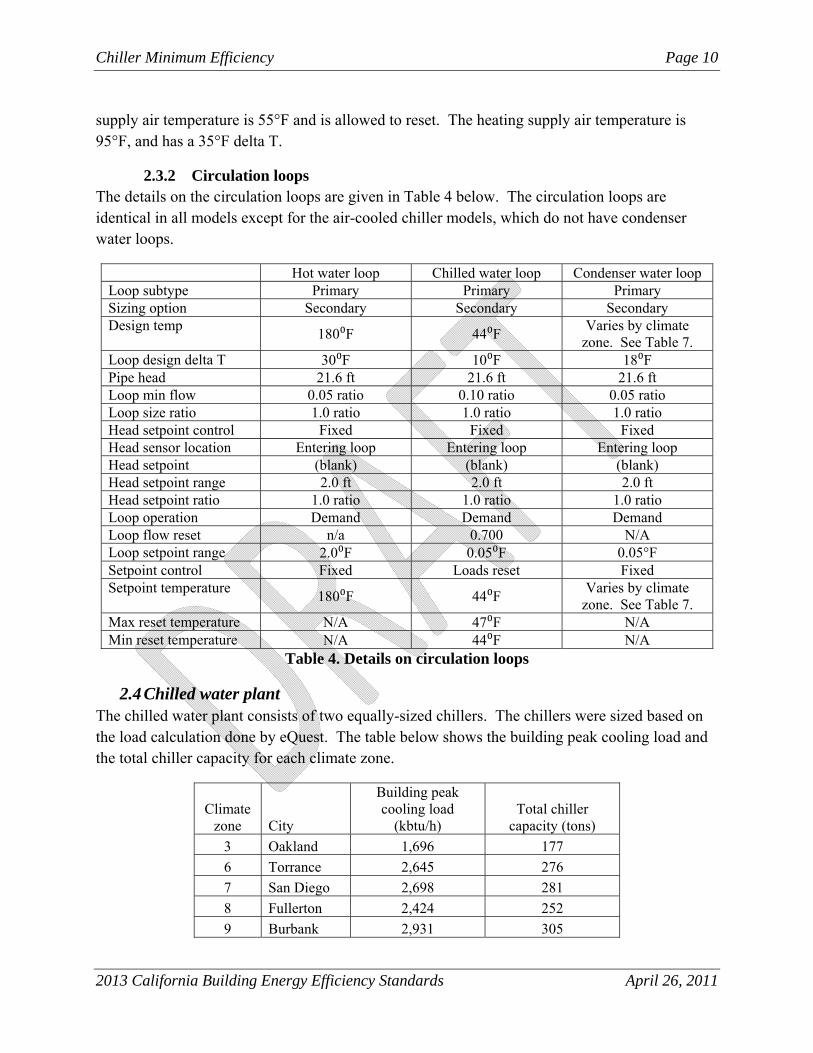
2.3.2 Circulation loops The details on the circulation loops are given in Table 4 below. The circulation loops are identical in all models except for the air-cooled chiller models, which do not have condenser water loops.
Hot water loop Chilled water loop Condenser water loop Loop subtype Primary Primary Primary Sizing option Secondary Secondary Secondary Design temp
180⁰F 44⁰F Varies by climate
zone. See Table 7. Loop design delta T 30⁰F 10⁰F 18⁰F Pipe head 21.6 ft 21.6 ft 21.6 ft Loop min flow 0.05 ratio 0.10 ratio 0.05 ratio Loop size ratio 1.0 ratio 1.0 ratio 1.0 ratio Head setpoint control Fixed Fixed Fixed Head sensor location Entering loop Entering loop Entering loop Head setpoint (blank) (blank) (blank) Head setpoint range 2.0 ft 2.0 ft 2.0 ft Head setpoint ratio 1.0 ratio 1.0 ratio 1.0 ratio Loop operation Demand Demand Demand Loop flow reset n/a 0.700 N/A Loop setpoint range 2.0⁰F 0.05⁰F 0.05°F Setpoint control Fixed Loads reset Fixed Setpoint temperature
180⁰F 44⁰F Varies by climate
zone. See Table 7. Max reset temperature N/A 47⁰F N/A Min reset temperature N/A 44⁰F N/A
Table 4. Details on circulation loops
2.4 Chilled water plant The chilled water plant consists of two equally-sized chillers. The chillers were sized based on the load calculation done by eQuest. The table below shows the building peak cooling load and the total chiller capacity for each climate zone.
Climate zone City
Building peak cooling load
(kbtu/h) Total chiller
capacity (tons)
3 Oakland 1,696 177
6 Torrance 2,645 276
7 San Diego 2,698 281
8 Fullerton 2,424 252
9 Burbank 2,931 305

Chiller Minimum Efficiency Page 11
2013 California Building Energy Efficiency Standards April 26, 2011
10 Riverside 2,749 286
12 Sacramento 2,688 280
13 Fresno 3,063 319 Table 5. Peak cooling coil load and chiller capacity
The chilled water setpoint was set to 44°F and allowed to reset up to 47°F. If one chiller is sufficient to meet the load, then only one chiller runs. When the load increases beyond the capacity of one chiller, the second chiller turns on and the two chillers share the load equally. The chillers stage down similarly. Figure 4 shows the number of run hours that each chiller operates at each part-load ratio in Climate Zone 3. As expected, the chiller spends the majority of the hours at very low loads. The second chiller only turns on when the load gets to be more than one chiller can handle.
Figure 4. Number of run hours at each part-load ratio in Climate Zone 3
The chillers were modeled in eQuest by specifying curves for how the chiller performs under different operating conditions. A nominal electric-input ratio (EIR) for each chiller is set. One performance curve corrects the nominal EIR as a function of the leaving chilled water temperature and the entering condenser water temperature. One performance curve corrects the EIR for part load ratio and the temperature difference between leaving chilled water and entering condenser water. The third performance curve corrects the chiller capacity as a function of leaving chilled water temperature and entering condenser water temperature. In eQuest each of these performance curves is a bi-quadratic, meaning that it is independent in two variables and takes the form: f(r1,r2) = c1 + c2*r1 + c3*r12 + c4*r2 + c5*r22 + c6*r1*r2, where c1, c2, c3, c4, c5, and c6 are coefficients and r1 and r2 are dimensionless variables.
The chillers were modeled to meet the performance criteria of the basecase and proposed chillers (Path A and Path B). Coefficients for the above mentioned performance curves were based on
0
500
1000
1500
2000
2500
0.1 0.2 0.3 0.4 0.5 0.6 0.7 0.8 0.9 1.0 +1.0
Number of run hours
Part‐load ratio
Chiller 1
Chiller 2

Chiller Minimum Efficiency Page 12
2013 California Building Energy Efficiency Standards April 26, 2011
chiller bids received from manufacturers for real jobs. These coefficients are given in Section 7.2. The nominal EIR for each chiller is given in Table 6.
Basecase Path A Path B
Air Cooled <150 tons 0.357 0.357 - >150 tons 0.357 0.357 -
Water Cooled Positive
Displacement
<75 tons 0.238 0.222 0.228 >75 and <150 0.225 0.220 0.225
>150 and <300 0.204 0.193 0.204
>300 tons 0.182 0.176 0.182
Water Cooled Centrifugal
<150 tons 0.200 0.180 0.182 >150 and
<300 0.180 0.180 0.182 >300 and
<600 0.164 0.164 0.171 >600 tons 0.164 0.162 0.168
Table 6. Nominal EIR for chillers
Sample of plots of the chiller curves are given in Error! Reference source not found..
All of the centrifugal chillers were modeled as hermetic centrifugal chillers in eQuest. All of the positive displacement chillers were modeled as hermetic screw chillers in eQuest, and all of the air-cooled chillers were modeled as hermetic screw chillers in eQuest.
The cooling tower is a one two-cell tower that operates the maximum number of cells for a given load. The tower fan has an EIR of 0.0100, and is variable speed. The design approach is 10°F. The condenser water loop temperature setpoint is 5 degrees higher than the design wetbulb temperature for each zone. The design wetbulb temperature of the tower and the condenser water temperature setpoint are given in
Climate zone City
Cooling tower design wetbulb (ºF)
Condenser water setpoint temperature
(ºF) 3 Oakland 65 70 6 Torrance 68 73 7 San Diego 69 74 8 Fullerton 69 74 9 Burbank 69 74 10 Riverside 69 74 12 Sacramento 71 76 13 Fresno 71 76
Table 7.

Chiller Minimum Efficiency Page 13
2013 California Building Energy Efficiency Standards April 26, 2011
Climate zone City
Cooling tower design wetbulb (ºF)
Condenser water setpoint temperature
(ºF) 3 Oakland 65 70 6 Torrance 68 73 7 San Diego 69 74 8 Fullerton 69 74 9 Burbank 69 74 10 Riverside 69 74 12 Sacramento 71 76 13 Fresno 71 76
Table 7. Cooling tower design wetbulb by climate zone.

Chiller Minimum Efficiency Page 14
2013 California Building Energy Efficiency Standards April 26, 2011
3 Analysis and Results
3.1 Energy savings The energy savings were calculated using the methodology described above in Section 2, and are tabulated below in
Climate Zone
City
Chiller Type Chiller
Size
Path A Path B Annual kWh
savings/ton TDV
savings/ton
Annual kWh
savings/ton TDV
savings/ton
3 Oakland
Water-cooled positive
displacement
<75 tons 32 $121 177 $450 >75 and
<150 10 $38 155 $369 >150 and
<300 23 $85 140 $334 >300 tons 12 $46 124 $294
Water-cooled centrifugal
<150 tons 108 $316 446 $1,100 >150 and
<300 - - 329 $762 >300 and
<600 - - 282 $643
>600 tons 25 $59 292 $675
6 Torrance
Water-cooled positive
displacement
<75 tons 64 $174 260 $567 >75 and
<150 20 $54 217 $452 >150 and
<300 45 $122 195 $406 >300 tons 24 $66 173 $358
Water-cooled centrifugal
<150 tons 168 $403 571 $1,229 >150 and
<300 - - 393 $800 >300 and
<600 - - 331 $659 >600 tons 31 $67 348 $704
7 San Diego
Water-cooled positive
displacement
<75 tons 64 $174 294 $622 >75 and
<150 20 $54 250 $507 >150 and
<300 45 $122 225 $455 >300 tons 24 $66 200 $402
Water-cooled centrifugal
<150 tons 187 $420 629 $1,280 >150 and
<300 - - 432 $838

Chiller Minimum Efficiency Page 15
2013 California Building Energy Efficiency Standards April 26, 2011
>300 and <600 - - 366 $695
>600 tons 37 $73 385 $740
8 Fullerton
Water-cooled positive
displacement
<75 tons 66 $186 255 $585 >75 and
<150 21 $58 211 $463 >150 and
<300 46 $131 190 $415 >300 tons 25 $71 168 $366
Water-cooled centrifugal
<150 tons 167 $423 522 $1,166 >150 and
<300 - - 345 $716 >300 and
<600 - - 287 $569
>600 tons 30 $68 305 $620
9 Burbank
Water-cooled positive
displacement
<75 tons 59 $180 224 $476 >75 and
<150 18 $56 185 $359 >150 and
<300 41 $126 166 $321 >300 tons 22 $69 147 $283
Water-cooled centrifugal
<150 tons 150 $396 475 $1,074 >150 and
<300 - - 316 $651 >300 and
<600 - - 261 $482 >600 tons 27 $64 277 $536
10 Riverside
Water-cooled positive
displacement
<75 tons 59 $181 221 $501 >75 and
<150 18 $56 182 $383 >150 and
<300 41 $127 163 $343 >300 tons 22 $69 145 $301
Water-cooled centrifugal
<150 tons 146 $396 458 $1,065 >150 and
<300 - - 303 $645 >300 and
<600 - - 250 $503 >600 tons 26 $62 266 $555
12 Sacramento Water-cooled
positive displacement
<75 tons 44 $147 177 $448 >75 and
<150 14 $47 147 $352 >150 and
<300 31 $102 132 $315

Chiller Minimum Efficiency Page 16
2013 California Building Energy Efficiency Standards April 26, 2011
>300 tons 16 $55 118 $278
Water-cooled centrifugal
<150 tons 114 $324 327 $800 >150 and
<300 - - 209 $462 >300 and
<600 - - 172 $356 >600 tons 21 $56 185 $399
13 Fresno
Water-cooled positive
displacement
<75 tons 20 $159 185 $448 >75 and
<150 16 $51 151 $344 >150 and
<300 35 $111 136 $308 >300 tons 19 $60 121 $271
Water-cooled centrifugal
<150 tons 124 $348 344 $844 >150 and
<300 - - 216 $479 >300 and
<600 - - 176 $366
>600 tons 21 $52 190 $410 Table 8 for both Path A and Path B compared to the basecase (Title 24 2008). The analysis was done in the top 8 climate zones, which represent 85% of new construction.
Climate Zone
City
Chiller Type Chiller
Size
Path A Path B Annual kWh
savings/ton TDV
savings/ton
Annual kWh
savings/ton TDV
savings/ton
3 Oakland
Water-cooled positive
displacement
<75 tons 32 $121 177 $450 >75 and
<150 10 $38 155 $369 >150 and
<300 23 $85 140 $334 >300 tons 12 $46 124 $294
Water-cooled centrifugal
<150 tons 108 $316 446 $1,100 >150 and
<300 - - 329 $762 >300 and
<600 - - 282 $643
>600 tons 25 $59 292 $675
6 Torrance Water-cooled
positive displacement
<75 tons 64 $174 260 $567 >75 and
<150 20 $54 217 $452 >150 and
<300 45 $122 195 $406 >300 tons 24 $66 173 $358

Chiller Minimum Efficiency Page 17
2013 California Building Energy Efficiency Standards April 26, 2011
Water-cooled centrifugal
<150 tons 168 $403 571 $1,229 >150 and
<300 - - 393 $800 >300 and
<600 - - 331 $659 >600 tons 31 $67 348 $704
7 San Diego
Water-cooled positive
displacement
<75 tons 64 $174 294 $622 >75 and
<150 20 $54 250 $507 >150 and
<300 45 $122 225 $455 >300 tons 24 $66 200 $402
Water-cooled centrifugal
<150 tons 187 $420 629 $1,280 >150 and
<300 - - 432 $838 >300 and
<600 - - 366 $695
>600 tons 37 $73 385 $740
8 Fullerton
Water-cooled positive
displacement
<75 tons 66 $186 255 $585 >75 and
<150 21 $58 211 $463 >150 and
<300 46 $131 190 $415 >300 tons 25 $71 168 $366
Water-cooled centrifugal
<150 tons 167 $423 522 $1,166 >150 and
<300 - - 345 $716 >300 and
<600 - - 287 $569 >600 tons 30 $68 305 $620
9 Burbank
Water-cooled positive
displacement
<75 tons 59 $180 224 $476 >75 and
<150 18 $56 185 $359 >150 and
<300 41 $126 166 $321 >300 tons 22 $69 147 $283
Water-cooled centrifugal
<150 tons 150 $396 475 $1,074 >150 and
<300 - - 316 $651 >300 and
<600 - - 261 $482 >600 tons 27 $64 277 $536
10 Riverside Water-cooled
positive <75 tons 59 $181 221 $501 >75 and 18 $56 182 $383

Chiller Minimum Efficiency Page 18
2013 California Building Energy Efficiency Standards April 26, 2011
displacement <150
>150 and <300 41 $127 163 $343
>300 tons 22 $69 145 $301
Water-cooled centrifugal
<150 tons 146 $396 458 $1,065 >150 and
<300 - - 303 $645 >300 and
<600 - - 250 $503 >600 tons 26 $62 266 $555
12 Sacramento
Water-cooled positive
displacement
<75 tons 44 $147 177 $448 >75 and
<150 14 $47 147 $352 >150 and
<300 31 $102 132 $315 >300 tons 16 $55 118 $278
Water-cooled centrifugal
<150 tons 114 $324 327 $800 >150 and
<300 - - 209 $462 >300 and
<600 - - 172 $356
>600 tons 21 $56 185 $399
13 Fresno
Water-cooled positive
displacement
<75 tons 20 $159 185 $448 >75 and
<150 16 $51 151 $344 >150 and
<300 35 $111 136 $308 >300 tons 19 $60 121 $271
Water-cooled centrifugal
<150 tons 124 $348 344 $844 >150 and
<300 - - 216 $479 >300 and
<600 - - 176 $366 >600 tons 21 $52 190 $410
Table 8. Energy savings in all climate zones
Path B chillers save between 65% and 1400% more energy than Path A chillers over the basecase across all chiller types and sizes and across the top 8 climate zones. Path B chillers are more efficient than Path A chillers at part load, but are less efficient than Path A chillers at full load. Both Path A and Path B have both higher part load and full load efficiencies compared to the basecase in all proposed cases. Because in most buildings chillers are loaded below their full-load for the majority of the time, it is not surprising that Path B chillers save more energy than Path B.

Chiller Minimum Efficiency Page 19
2013 California Building Energy Efficiency Standards April 26, 2011
3.2 Costs Incremental cost data of each chiller over the basecase chillers is given in Table 9. These costs were received from AHRI. This is the costs that they used in the 90.1 analysis.
Type Size Path A $/ton
Path B $/ton
Air Cooled <150 tons $33.01 - >150 tons $17.18 -
Water Cooled Positive
Displacement
<75 tons $47.34 $52.98 >75 and <150 $35.45 $39.23
>150 and <300 $30.74 $36.31
>300 tons $13.38 $26.07
Water Cooled
Centrifugal
<150 tons $31.56 $47.60 >150 and
<300 - $57.28 >300 and
<600 - $52.80 >600 tons $5.77 $44.83
Table 9. Incremental costs for Path A and Path B chillers
These costs do not include maintenance because it is unlikely that these chillers will require any additional maintenance over basecase chillers. However, one concern brought up by a stakeholder (see Section Error! Reference source not found.) is that because Path B chillers have VFDs, the VFDs will require replacement sooner than the chiller. To factor in the potential additional cost of these VFD replacements, a very conservative estimate was made about the cost of VFD replacement in the life-cycle cost calculations.
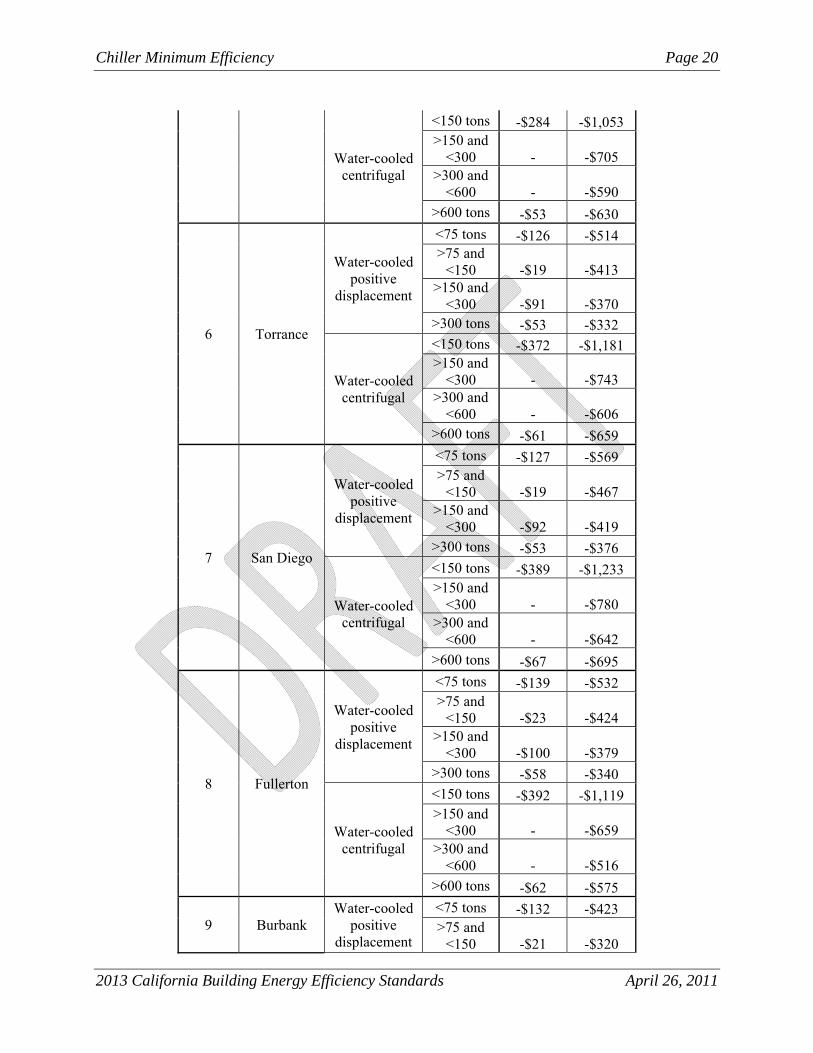
3.3 Life-cycle cost calculations The annual energy use of the Basecase, Path A, and Path B chillers were calculated from the eQuest model described above. The 15-year energy costs were calculated using the results of the energy model and the given TDV rates. The incremental measure costs are pre-adaption costs. The total 15-year life-cycle cost of the Basecase, Path A, and Path B chillers were calculated for each chiller-type and size category for each climate zone. See
Climate Zone
City Chiller Type
Chiller Size Path A Path B
3 Oakland Water-cooled
positive displacement
<75 tons -$73 -$397 >75 and
<150 -$2 -$330 >150 and
<300 -$54 -$298 >300 tons -$33 -$268
Chiller Minimum Efficiency Page 20
2013 California Building Energy Efficiency Standards April 26, 2011
Water-cooled centrifugal
<150 tons -$284 -$1,053 >150 and
<300 - -$705 >300 and
<600 - -$590 >600 tons -$53 -$630
6 Torrance
Water-cooled positive
displacement
<75 tons -$126 -$514 >75 and
<150 -$19 -$413 >150 and
<300 -$91 -$370 >300 tons -$53 -$332
Water-cooled centrifugal
<150 tons -$372 -$1,181 >150 and
<300 - -$743 >300 and
<600 - -$606 >600 tons -$61 -$659
7 San Diego
Water-cooled positive
displacement
<75 tons -$127 -$569 >75 and
<150 -$19 -$467 >150 and
<300 -$92 -$419 >300 tons -$53 -$376
Water-cooled centrifugal
<150 tons -$389 -$1,233 >150 and
<300 - -$780 >300 and
<600 - -$642
>600 tons -$67 -$695
8 Fullerton
Water-cooled positive
displacement
<75 tons -$139 -$532 >75 and
<150 -$23 -$424 >150 and
<300 -$100 -$379 >300 tons -$58 -$340
Water-cooled centrifugal
<150 tons -$392 -$1,119 >150 and
<300 - -$659 >300 and
<600 - -$516 >600 tons -$62 -$575
9 Burbank Water-cooled
positive displacement
<75 tons -$132 -$423 >75 and
<150 -$21 -$320

Chiller Minimum Efficiency Page 21
2013 California Building Energy Efficiency Standards April 26, 2011
>150 and <300 -$96 -$285
>300 tons -$55 -$257
Water-cooled centrifugal
<150 tons -$364 -$1,027 >150 and
<300 - -$594 >300 and
<600 - -$430 >600 tons -$58 -$491
10 Riverside
Water-cooled positive
displacement
<75 tons -$133 -$448 >75 and
<150 -$21 -$343 >150 and
<300 -$96 -$306 >300 tons -$56 -$275
Water-cooled centrifugal
<150 tons -$364 -$1,017 >150 and
<300 - -$588 >300 and
<600 - -$450
>600 tons -$57 -$510
12 Sacramento
Water-cooled positive
displacement
<75 tons -$99 -$395 >75 and
<150 -$11 -$312 >150 and
<300 -$72 -$279 >300 tons -$42 -$252
Water-cooled centrifugal
<150 tons -$293 -$752 >150 and
<300 - -$405 >300 and
<600 - -$303 >600 tons -$51 -$355
13 Fresno
Water-cooled positive
displacement
<75 tons -$112 -$395 >75 and
<150 -$15 -$305 >150 and
<300 -$81 -$272 >300 tons -$46 -$245
Water-cooled centrifugal
<150 tons -$317 -$796 >150 and
<300 - -$422 >300 and
<600 - -$313

Chiller Minimum Efficiency Page 22
2013 California Building Energy Efficiency Standards April 26, 2011
>600 tons -$46 -$365 Table 10 below for the results.
Climate Zone
City Chiller Type
Chiller Size Path A Path B
3 Oakland
Water-cooled positive
displacement
<75 tons -$73 -$397 >75 and
<150 -$2 -$330 >150 and
<300 -$54 -$298 >300 tons -$33 -$268
Water-cooled centrifugal
<150 tons -$284 -$1,053 >150 and
<300 - -$705 >300 and
<600 - -$590 >600 tons -$53 -$630
6 Torrance
Water-cooled positive
displacement
<75 tons -$126 -$514 >75 and
<150 -$19 -$413 >150 and
<300 -$91 -$370 >300 tons -$53 -$332
Water-cooled centrifugal
<150 tons -$372 -$1,181 >150 and
<300 - -$743 >300 and
<600 - -$606 >600 tons -$61 -$659
7 San Diego
Water-cooled positive
displacement
<75 tons -$127 -$569 >75 and
<150 -$19 -$467 >150 and
<300 -$92 -$419 >300 tons -$53 -$376
Water-cooled centrifugal
<150 tons -$389 -$1,233 >150 and
<300 - -$780 >300 and
<600 - -$642
>600 tons -$67 -$695
8 Fullerton Water-cooled
positive displacement
<75 tons -$139 -$532 >75 and
<150 -$23 -$424

Chiller Minimum Efficiency Page 23
2013 California Building Energy Efficiency Standards April 26, 2011
>150 and <300 -$100 -$379
>300 tons -$58 -$340
Water-cooled centrifugal
<150 tons -$392 -$1,119 >150 and
<300 - -$659 >300 and
<600 - -$516 >600 tons -$62 -$575
9 Burbank
Water-cooled positive
displacement
<75 tons -$132 -$423 >75 and
<150 -$21 -$320 >150 and
<300 -$96 -$285 >300 tons -$55 -$257
Water-cooled centrifugal
<150 tons -$364 -$1,027 >150 and
<300 - -$594 >300 and
<600 - -$430
>600 tons -$58 -$491
10 Riverside
Water-cooled positive
displacement
<75 tons -$133 -$448 >75 and
<150 -$21 -$343 >150 and
<300 -$96 -$306 >300 tons -$56 -$275
Water-cooled centrifugal
<150 tons -$364 -$1,017 >150 and
<300 - -$588 >300 and
<600 - -$450 >600 tons -$57 -$510
12 Sacramento
Water-cooled positive
displacement
<75 tons -$99 -$395 >75 and
<150 -$11 -$312 >150 and
<300 -$72 -$279 >300 tons -$42 -$252
Water-cooled centrifugal
<150 tons -$293 -$752 >150 and
<300 - -$405 >300 and
<600 - -$303

Chiller Minimum Efficiency Page 24
2013 California Building Energy Efficiency Standards April 26, 2011
>600 tons -$51 -$355
13 Fresno
Water-cooled positive
displacement
<75 tons -$112 -$395 >75 and
<150 -$15 -$305 >150 and
<300 -$81 -$272 >300 tons -$46 -$245
Water-cooled centrifugal
<150 tons -$317 -$796 >150 and
<300 - -$422 >300 and
<600 - -$313 >600 tons -$46 -$365
Table 10. Life-cycle cost, $/ton cooling capacity
From the results above, it was determined that over a 15-year life, the proposed Path B chillers had the lowest life-cycle cost and used the least amount of energy compared to both the basecase and Path A chillers. Though Path B chillers are more expensive than Path A chillers, they save significantly more energy and pay back quickly, making them cost effective even when considering a very short life.
Therefore the proposed code measure is to require that all chillers meet the Path B requirements.
Chiller Minimum Efficiency Page 25
2013 California Building Energy Efficiency Standards April 26, 2011
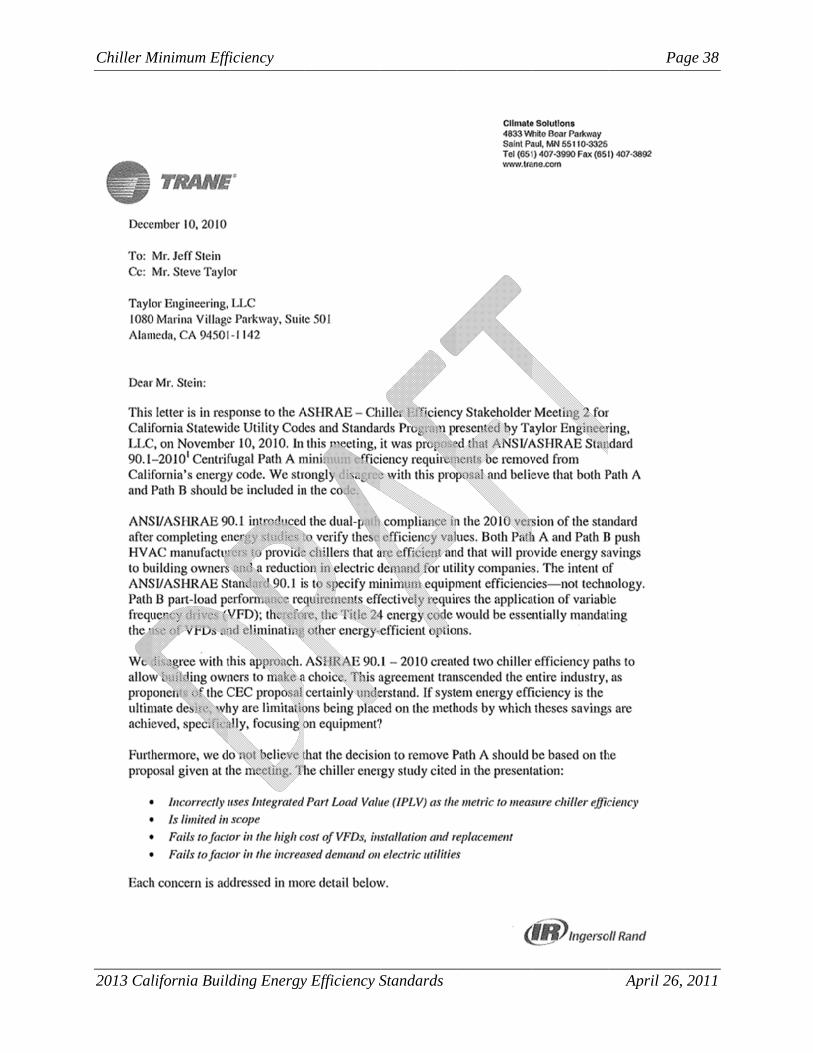
4 Stakeholder Input In December of 2010 we received a letter from the Trane Company that raised a number of issues with our proposal to only adopt either the Path A or Path B requirements for the mandatory tables. See Section 7.3 for the full content of the letter. In particular they listed a number of items of concern:
Chillers with voltages over 600V where the incremental costs of variable speed drives is much larger than the cost curves presented by AHRI.
Chillers that use heat recovery. High lift, fixed speed machines can used efficiently if the recover heat for reheat or other uses.
Chillers serving thermal energy storage (TES) systems. Again this often requires a chiller designed for high lift.
As a response to these concerns we changed our proposal to repeat the ASHRAE Addendum M tables in the mandatory section of the standard and provide a prescriptive requirement for the lowest LCC requirement for each chiller type and size (Path A or B). In addition we are proposing exceptions for each of the items listed above.

Chiller M
2013 Cal
5 RACM
5.1 Sta
5.1.1 DARI 550/Water Ch03).
5.1.2 N
Minimum Eff
lifornia Buil
RecommM Manua
andard
Definitions /590 is the Ahilling Packa
New Table 1
ficiency
lding Energy
mended Lals, and
Air-conditionages Using t
12D
y Efficiency S
Languathe Refe
ning and Refthe Vapor Co
Standards
ge for therence A
frigeration Inompression
he StandAppend
nstitute docuCycle,” 199
dards Dices
ument entitle8 2003 (AR
Pag
April 26,
Documen
ed “StandardI 550/590 –
ge 26
2011
nt,
d for 98

Chiller M
2013 Cal
Table Foa. N
b. Mc. Sd. Ne. N
5.1.3 KEXCEPTdesigned
operation85°F entein TABLTABLE following
Minimum Eff
lifornia Buil
ootnotes: No requireme
● Centri● Positiv● Absor
Must meet boee Section 1
NA means noNR means no
Kadj, ExceptTION to Se
d for
n at ARI Stanering conden
LE 112-H, TA112-K, TABg full load de
ficiency
lding Energy
ents for: ifugal chillerve displacemrption chilleroth COP and101 Definitioot applicableo minimum r
tion to 112(ction 112(a)
ndard 550 tenser water teABLE 112-I
BLE 112-L, aesign ranges
y Efficiency S
rs with Tchwment chillersrs with Tchw
d IPLV of eitons e requirement
(a) ): Water-co
est conditionemperature sI, and TABLand TABLEs:
Standards
ws_des<36Fs with Tchwsws_des<40Fther Path A o
in this field
oled centrifu
ns of 44°F leshall have a mLE 112-J, and 112-M The
F s_des<32F or B
ugal water-c
aving chilledminimum fud a minimum
e table values
chilling pack
d water tempull load COPm NPLV ratis are only ap
Pag
April 26,
kages that are
perature andP rating as shing as shownpplicable ove
ge 27
2011
e not
d hown n in er the

Chiller Minimum Efficiency Page 28
2013 California Building Energy Efficiency Standards April 26, 2011
Leaving Chiller Water Temp. 40 to 48°F
Entering Condenser Water Temp. 75 to 85°F
Condensing Water Temp. Rise 5 to 15°F
Water-cooled centrifugal chillers not designed for operation at ARI Standard 550/590 test conditions of 44°F leaving chilled-water temperature and 85°F entering condenser water temperature with 3 gpm/ton condenser water flow shall have maximum full-load kW/ton and NPLV ratings adjusted using the following equation:
Adjusted maximum full-load kW/ton rating = (full-load kW/ton from Table 112D)/Kadj
Adjusted maximum NPLV rating = (IPLV from Table 112D)/Kadj
where
Kadj = A * B
A = 0.00000014592 * (LIFT)4 – 0.0000346496 * (LIFT)3 + 0.00314196 * (LIFT)2 – 0.147199 * (LIFT) + 3.9302
LIFT = LvgCond – LvgEvap (°F)
LvgCond = Full-load leaving condenser fluid temperature (°F)
LvgEvap = Full-load leaving evaporator fluid temperature (°F)
B = 0.0015 * LvgEvap + 0.934
The adjusted full-load and NPLV values are only applicable for centrifugal chillers meeting all of the following full-load design ranges:
• Minimum Leaving Evaporator Fluid Temperature: 36°F
• Maximum Leaving Condenser Fluid Temperature: 115°F
• LIFT ≥ 20°F and ≤ 80°F
Centrifugal chillers designed to operate outside of these ranges are not covered by this standard.
EXCEPTION to Section 112(a): Positive displacement (air- and water-cooled) chillers with a leaving evaporator fluid temperature higher than 32°F, shall show compliance with Table 112D when tested or certified with water at standard rating conditions, per the referenced test procedure.

Chiller Minimum Efficiency Page 29
2013 California Building Energy Efficiency Standards April 26, 2011
5.1.4 New Prescriptive Requirement for Chiller Efficiency 144(tbd) Minimum Chiller Efficiencies
Where it is provided, chillers shall meet or exceed Path B from Table 112D
EXCEPTION 1 to Section 144(tbd): Chillers with electrical service >600V
EXCEPTION 2 to Section 144(tbd): Chillers attached to a heat recovery system with a design heat recovery capacity of >40% of the design chiller cooling capacity
EXCEPTION 3 to Section 144(tbd): Chillers used to charge thermal energy storage systems where the charging temperature is <40F
EXCEPTION 4 to Section 144(tbd): Chillers installed in plants with more than 3 chillers
5.1.5 Modify Prescriptive Requirement 144(i) for Air-Cooled Chillers 144(i) Limitation of Air-Cooled Chillers
Chilled water plants with more than 300 tons total capacity shall not have more than 100 300 tons provided by air-cooled chillers.
EXCEPTION 1 to Section 144(i): Where the designer demonstrates that the water quality at the building site fails to meet manufacturer’s specifications for the use of water-cooled equipment.
EXCEPTION 2 to Section 144(i): Plants that employ a Chillers that are used to charge cooling thermal energy storage systems with a design temperature <40F.
EXCEPTION 3 to Section 144(i): Air cooled chillers with minimum efficiencies approved by the Commission pursuant to Section 10-109(d).
5.1.6 Modify Alterations, Prescriptive Approach 149(b)1C for Air-Cooled Chillers 149(B)1C New space-conditioning systems or components other than new or replacement space conditioning ducts shall meet the requirements of Section 144 applicable to the systems or components being altered; and
EXCEPTION 1 to Section 149(b)1C: For expansions of existing chilled water plants, Section 144(i) applies only to expansions of more than 300 tons.
EXCEPTION 2 1 to Section 149(b)1C: For replacements of equivalent or lower capacity electric resistance space heaters for high rise residential apartment units.
EXCEPTION 3 2 to Section 149(b)1C: For replacement of electric reheat of equivalent or lower capacity electric resistance space heaters, when natural gas is not available.

Chiller Minimum Efficiency Page 30
2013 California Building Energy Efficiency Standards April 26, 2011
5.2 ACM Chillers in the budget design shall use the efficiencies from 144(tbd).
5.3 Reference appendices None.
Chiller Minimum Efficiency Page 31
2013 California Building Energy Efficiency Standards April 26, 2011
6 Bibliography and Other Research

Chiller Minimum Efficiency Page 32
2013 California Building Energy Efficiency Standards April 26, 2011
7 Appendices
7.1 Addendum M+BL+BT to 90.1-2007 6.4.1.2 Minimum Equipment Efficiencies—Listed Equipment—Nonstandard Conditions. 6.4.1.2.1 Water-cooled centrifugal chilling packages. Equipment not designed for operation at ARI Standard 550/590 test conditions of 44°F leaving chilled-water temperature and 85°F entering condenser water temperature with 3 gpm/ton condenser water flow (and thus cannot be tested to meet the requirements of Table 6.8.1C) shall have maximum full-load kW/ton and NPLV ratings adjusted using the following equation: Adjusted maximum full-load kW/ton rating = (full-load kW/ton from Table 6.8.1C)/Kadj Adjusted maximum NPLV rating = (IPLV from Table 6.8.1C)/Kadj where Kadj = A * B where A = 0.00000014592 * (LIFT)4 – 0.0000346496 * (LIFT)3 + 0.00314196 * (LIFT)2 – 0.147199 * (LIFT) + 3.9302 LIFT = LvgCond – LvgEvap (°F) LvgCond = Full-load leaving condenser fluid temperature (°F) LvgEvap = Full-load leaving evaporator fluid temperature (°F) B = 0.0015 * LvgEvap + 0.934 The adjusted full-load and NPLV values are only applicable for centrifugal chillers meeting all of the following full-load design ranges: • Minimum Leaving Evaporator Fluid Temperature: 36°F • Maximum Leaving Condenser Fluid Temperature: 115°F • LIFT ≥ 20°F and ≤ 80°F Manufacturers shall calculate the adjusted maximum kW/ton and NPLV before determining whether to label the chiller per 6.4.1.5. Compliance with 90.1-2007 or -2010 or both shall be labeled on chillers within the scope of the Standard. Centrifugal chillers designed to operate outside of these ranges are not covered by this standard. Example: Path A 600 ton centrifugal chiller Table 6.8.1C efficiencies as of 1/1/2010 Full Load = 0.570 kW/ton IPLV = 0.539 kW/ton LvgCond = 91.16°F LvgEvap = 42°F LIFT = 91.16 – 42 = 49.16°F Kadj = A x B

Chiller Minimum Efficiency Page 33
2013 California Building Energy Efficiency Standards April 26, 2011
A = 0.00000014592 x (49.16)4 – 0.0000346496 x (49.16)3 + 0.00314196 x (49.16)2 – 0.147199 x (49.16) + 3.930 = 1.023 B = 0.0015 x 42 + 0.934 = 0.997 Adjusted full load = 0.570/(1.023 x 0.997) = 0.559 kW/ton NPLV = 0.539/(1.023 x 0.997) = 0.528 kW/ton 6.4.1.2.2 Positive displacement (air- and water-cooled) chilling packages. Equipment with a leaving evaporator fluid temperature higher than 32°F, shall show compliance with Table 6.8.1C when tested or certified with water at standard rating conditions, per the referenced test procedure. Reference update to chapter 12 ASHRAE-IESNA 90.1 2007 American Society of Heating Refrigerating and Air-conditioning Engineers Replace the following table 6.8.1C with below table. Delete Table 6.8.1H in its entirety. Delete Table 6.8.1I in its entirety. Delete Table 6.8.1J in its entirety.

Chiller Minimum Efficiency Page 34
2013 California Building Energy Efficiency Standards April 26, 2011
Table 6.8.1C Water Chilling Packages – Efficiency Requirementsa
Equipment Type Size Category Path A Path B Test Procedureb
Air‐Cooled Chillers
<150 tons ≥9.562 EER ≥12.500 IPLV
NAd
ARI 550/590
≥150 tons ≥9.562 EER ≥12.750 IPLV
NAd
Air‐Cooled without Condenser, Electrical Operated
All Capacities
Air‐cooled chillers without condensers must be rated with matching condensers and comply with the air‐cooled chiller efficiency requirements
Water cooled, Electrically Operated, Reciprocating
All Capacities Reciprocating units must comply with water cooled positive displacement efficiency requirements
Water Cooled Electrically Operated, Positive Displacement
<75 tons ≤0.780 kW/ton ≤0.630 IPLV
≤0.800 kW/ton ≤0.600 IPLV
≥75 tons and < 150 tons ≤0.775 kW/ton ≤0.615 IPLV
≤0.790 kW/ton ≤0.586 IPLV
≥150 tons and < 300 tons ≤0.680 kW/ton ≤0.580 IPLV
≤0.718 kW/ton ≤0.540 IPLV
≥300 tons ≤0.620 kW/ton ≤0.540 IPLV
≤0.639 kW/ton ≤0.490 IPLV
Water Cooled Electrically Operated, Centrifugal
<150 tons ≤0.634 kW/ton ≤0.596 IPLV
≤0.639 kW/ton ≤0.450 IPLV
≥150 tons and < 300 tons
≥300 tons and < 600 tons ≤0.576 kW/ton ≤0.549 IPLV
≤0.600 kW/ton ≤0.400 IPLV
≥600 tons ≤0.570 kW/ton ≤0.539 IPLV
≤0.590 kW/ton ≤0.400 IPLV
Air Cooled Absorption Single Effect
All Capacities ≥0.600 COP NAd
ARI 560
Water‐Cooled Absorption Single Effect
All Capacities ≥0.700 COP NAd
Absorption Double Effect, Indirect‐Fired
All Capacities ≥1.000 COP ≥1.050 IPLV
NAd
Absorption Double Effect, Direct Fired
All Capacities ≥1.000 COP ≥1.000 IPLV
NAd
a. The centrifugal chiller equipment requirements after adjustment per 6.4.1.2 do not apply to chillers where the design leaving fluid temperature is < 36°F. The requirements do not apply to positive displacement chillers with design leaving fluid temperatures ≤ 32°F. The requirements do not apply to absorption chillers with design leaving fluid temperatures < 40°F. b. Section 12 contains a complete specification of the referenced test procedure, including the referenced year version of the test procedure. c. Compliance with this standard can be obtained by meeting the minimum requirements of Path A or Path B. However, both the full load and IPLV must be met to fulfill the requirements of Path A or Path B.

Chiller Minimum Efficiency Page 35
2013 California Building Energy Efficiency Standards April 26, 2011
d. NA means that this requirement is not applicable and cannot be used for compliance.
7.2 Performance curve coefficients
Chiller type CAPFT_a CAPFT_b CAPFT_c CAPFT_d CAPFT_e CAPFT_f
Baseline Positive Displacement, <75 tons, 0.446797 0.014742 0.000134 0.000440 -0.000015 -0.000085 Positive Displacement, >75 and <150 tons 0.446797 0.014742 0.000134 0.000440 -0.000015 -0.000085 Positive Displacement, >150 and <300 tons 0.446797 0.014742 0.000134 0.000440 -0.000015 -0.000085 Positive Displacement, >300 tons 0.446797 0.014742 0.000134 0.000440 -0.000015 -0.000085
Centrifugal, <150 tons -0.497373 -0.009561 -0.000596 0.043521 -0.000584 0.000960 Centrifugal, >150 and <300 tons -0.497373 -0.009561 -0.000596 0.043521 -0.000584 0.000960 Centrifugal, >300 and <600 tons -0.497373 -0.009561 -0.000596 0.043521 -0.000584 0.000960
Centrifugal, >600 tons -0.497373 -0.009561 -0.000596 0.043521 -0.000584 0.000960
Path A Positive Displacement, <75 tons, 0.446797 0.014742 0.000134 0.000440 -0.000015 -0.000085 Positive Displacement, >75 and <150 tons 0.446797 0.014742 0.000134 0.000440 -0.000015 -0.000085 Positive Displacement, >150 and <300 tons 0.446797 0.014742 0.000134 0.000440 -0.000015 -0.000085 Positive Displacement, >300 tons 0.446797 0.014742 0.000134 0.000440 -0.000015 -0.000085
Centrifugal, <150 tons -0.497373 -0.009561 -0.000596 0.043521 -0.000584 0.000960 Centrifugal, >150 and <300 tons -0.497373 -0.009561 -0.000596 0.043521 -0.000584 0.000960 Centrifugal, >300 and <600 tons -0.497373 -0.009561 -0.000596 0.043521 -0.000584 0.000960
Centrifugal, >600 tons -0.497373 -0.009561 -0.000596 0.043521 -0.000584 0.000960
Path B Positive Displacement, <75 tons, 0.334128 0.021015 -0.000102 -0.001407 -0.000029 0.000071 Positive Displacement, >75 and <150 tons 0.334128 0.021015 -0.000102 -0.001407 -0.000029 0.000071 Positive Displacement, >150 and <300 tons 0.334128 0.021015 -0.000102 -0.001407 -0.000029 0.000071
Positive Displacement, >300 0.334128 0.021015 -0.000102 -0.001407 -0.000029 0.000071

Chiller Minimum Efficiency Page 36
2013 California Building Energy Efficiency Standards April 26, 2011
tons
Centrifugal, <150 tons 0.180980 0.031844 -0.000154 0.009566 -0.000135 -0.000053 Centrifugal, >150 and <300 tons 0.180980 0.031844 -0.000154 0.009566 -0.000135 -0.000053 Centrifugal, >300 and <600 tons 0.363958 0.045022 -0.000274 -0.002028 -0.000088 -0.000012
Centrifugal, >600 tons -0.455204 0.031347 -0.000057 0.020383 -0.000153 -0.000127

Chiller Minimum Efficiency Page 37
2013 California Building Energy Efficiency Standards April 26, 2011
7.3 Letter from Trane
Chiller M
2013 Cal
Minimum Eff
lifornia Buil
ficiency
lding Energyy Efficiency SStandards
Pag
April 26,
ge 38
2011

Chiller M
2013 Cal
Minimum Eff
lifornia Buil
ficiency
lding Energyy Efficiency SStandards
Pag
April 26,
ge 39
2011

Chiller M
2013 Cal
Minimum Eff
lifornia Buil
ficiency
lding Energyy Efficiency SStandards
Pag
April 26,
ge 40
2011

Chiller M
2013 Cal
Minimum Eff
lifornia Buil
ficiency
lding Energyy Efficiency SStandards
Pag
April 26,
ge 41
2011


![2013 CASE - Draft Measure Information Template - · Measure Information Template Page 6 2013 California Building Energy Efficiency Standards [March 2011] yields increased excess air](https://static.fdocuments.us/doc/165x107/5aa9929d7f8b9a81188cf69b/2013-case-draft-measure-information-template-information-template-page-6.jpg)