Draft for Comment Asian Development Bank...
66
Draft for Comment Asian Development Bank Overview of Structure, Funding, Policy and Programs With Emphasis on the Health and Agriculture Sectors September 7, 2007 A. K. Nandakumar, Ph.D. Joanne Beswick, M.A. Binod Sah, M.S. Reuven Wallack, M.Sc. Brandeis University The Heller School for Social Policy and Management Waltham, MA USA This analysis was funded by a grant from the Bill and Melinda Gates Foundation. The views expressed are those of the authors and any errors or omissions are theirs.
Transcript of Draft for Comment Asian Development Bank...

Draft for Comment
Asian Development Bank
Overview of Structure, Funding, Policy and Programs
With Emphasis on the Health and Agriculture Sectors
September 7, 2007
A. K. Nandakumar, Ph.D. Joanne Beswick, M.A.
Binod Sah, M.S. Reuven Wallack, M.Sc.
Brandeis University
The Heller School for Social Policy and Management Waltham, MA
USA
This analysis was funded by a grant from the Bill and Melinda Gates Foundation. The views expressed are those of the authors and any errors or omissions are theirs.

1
Overview of the Asian Development Bank
Table of Contents Executive Summary ........................................................................................................................ 2 I. Introduction: ............................................................................................................................... 5 II. Organization Structure: .............................................................................................................. 6 III. Funding mechanisms: ............................................................................................................... 6
A. Ordinary Capital Resources ................................................................................................... 6 B. Asian Development Fund....................................................................................................... 6 C. Japan Special Fund (JSF) ....................................................................................................... 7 D. People’s Republic of China Regional Cooperation and Poverty Reduction Fund ................ 8 E. Technical Assistance .............................................................................................................. 8
IV. Financial Resources and Lending Portfolio:............................................................................ 8 V. Trend Analyses of Lending Portfolio: ...................................................................................... 9
A. Public Sector loan portfolio by type of loans......................................................................... 9 B. Public sector loan portfolio by country ................................................................................ 10 C. Public sector loan portfolio by Sector:................................................................................. 12 D. Technical Assistance (TA) portfolio by sector: ................................................................... 13 E. Technical Assistance (TA) portfolio by country:................................................................. 14
VI. Health Sector Policy and Lending: ......................................................................................... 14 Trends in Health Sector Investment:......................................................................................... 16
VII. Comparison of Development Lending Institutions by Sector .............................................. 17 VIII. Evaluation of ADB Performance ......................................................................................... 19
A. Evaluation of Health Sector Programs................................................................................. 20 1. Health Sector Program Impacts ........................................................................................ 21 2. Health Sector: Lessons Learned........................................................................................ 22 3. Health Sector Program Evaluations .................................................................................. 24
B. Evaluation of Agriculture Sector Programs ......................................................................... 25 1. Problems with Agriculture Sector Programs .................................................................... 26
IX. Conclusion .............................................................................................................................. 28 X: References............................................................................................................................... 30 XI. Annex Section......................................................................................................................... 32

2
Asian Development Bank
Overview of Structure, Funding, Policy and Program With Emphasis on the Health and Agriculture Sectors
Executive Summary The Asian Development Bank (ADB) is a multi-lateral development finance institution for Asia and the Pacific that works to mitigate poverty in the region by providing a range of financial tools to its Developing Member Countries (DMCs) such as policy dialogue, loans, technical assistance (TA), grants, and equity investments. With an annual lending volume of about US $6 billion and Technical Assistance at roughly US$ 180 million per year, ADB lends exclusively for development purposes with most of its lending occurring in the public sector. The range of development issues addressed by the Bank includes economics, environment, finance, trade, governance, law, policy, health, energy, infrastructure and social development. ADB raises its funds through bond issues on the world’s capital markets, member contributions, retained earnings from lending operations and the repayment of loans. Most of the funds available for lending operations are from Ordinary Capital Resources (OCR) and the Asian Development Fund (ADF). Ordinary Capital Resources loans are available to better-off borrowing countries at near-market terms and, over the last decade (1996-2005), about 76% of public lending came from OCR. In contrast, Asian Development Fund is designed to provide grants and concessional loans to DMCs with low incomes per capita and limited debt repayment capacity. Over the last decade (1996-2005), about 24% of public lending has come from DMF. Major borrowers of ADB include India, Indonesia, Pakistan and People’s Republic of China (PRC), which together account for 60% of borrowing for the 1996-2005 decade. Four more countries, Bangladesh, Philippines, Sri Lanka and Vietnam, account for 19% of the borrowing, and the remaining 25 DMCs account for 11% of the borrowing. In that same decade, 56% of the loans went towards transportation, communication, energy and finance. Agriculture and natural resources accounted for 8% of the lending and the social sector, which is comprised of education, health, nutrition, and social protection, accounted for 9% of the loans. TAs are portioned out in relatively similar manner with the exception of agriculture and natural resources. Until 1995, TAs for agriculture and natural resources comprised 32% of total TAs, but in the last decade, that number dropped by half to 16%. ADB attributes this reduction to a change in emphasis in its assistance programs and external factors. During the decade 1996-2005, ADB’s lending portfolio remained relatively flat in nominal terms except for a brief spike in 1997 during the Asian financial crisis. In real terms, the public sector loan portfolio declined by 28%, its OCR lending decreased by 22% and its ADF lending declined by 42%. For the decade 1995-2006 average annual lending to health, nutrition and social protection averaged 3.8% and ranked ninth out of ten lending categories while agriculture ranked fifth. An analysis of the most recent 3 years for which data are available shows that Asian Development Bank allocated 2.9% of its total loans to the health sector between 2003 and 2005. This is generally on par with the level of funding committed by African Development Bank (4.4%) and Inter-American Development Bank (2%). World Bank, in contrast, allocated 31% of

3
its total lending to the health sector with 12% of its total lending going towards health sector loans in the Asian region. However, when education, social protection and health are collapsed together, ADB clearly falls below the other institutions in the proportion of funds committed these sectors. Given the profile of its member states one would have expected the ADB to do better and probably be more in line with the IADB or the World Bank. ADB lending in the health sector is aimed at reducing poverty by targeting disadvantaged groups such as women, children, indigenous people, and those living in rural areas. In the late 1990’s, ADB formulated a new health sector policy, which directed focus away from development of large urban hospitals and an emphasis on treatment services in favor of a new strategy to address basic and preventive health care delivery to the rural poor. Primary health care, women’s health and reproductive health care became a new priority. Interestingly, while ADB states that its new policy has had a positive impact in changing the level of effect that the Bank has in the health sector, it has not resulted in an increase in lending in that sector. Lending has remained steady at between 2 and 3% of the Bank’s total activity. Possible reasons for this include lack of demand for health sector loans from members, non-competitiveness of ADB funding mechanisms, lack of internal capacity to design and manage complex health projects, and the fact that ADB does not have a comparative advantage over other lending sources in this sector. The success rate for health projects was only 55%. Independent program evaluation is an important component of the Bank’s activities and it is one of the Bank’s strengths due to the transparency it imparts to the institution as well as the opportunity it provides for ADB to accumulate practical know-how in the health sector area that it can use toward future projects. Because ADB maintains careful records of its activities and makes reasonable efforts to quantify the effects of its programs, it is possible to identify positive outcomes that can be directly attributed to its activities such as increases in the amount of health care that women, children and people living in rural areas have received. To its credit, ADB holds human capacity building as an integral part of its health sector program strategy and has been able to document related impacts such as a rise in the status of women through education and career opportunities and through self-governance in health clinics. Capacity building is also realized through practical support of rural area doctors, nurses and health care workers. Problem areas identified through evaluation of health sector projects included a continuing need for alternative financing strategies, difficulty harmonizing project efforts with governments and key stakeholders, and investment losses due to inadequate attention to recurrent costs. The ADB has not done enough to develop capacity within the region in the critical areas of health policy and health economics. Evaluation of the agriculture sector has shown a fairly even split between successful (52%) and less than successful (48%) projects during the 1990s. Believing that global agricultural trade reform could lead to a $140 billion per year gain in economic welfare for developing countries, ADB is very interested in working to liberalize the agricultural sectors in its member countries. Accordingly, ADB issued a loan to Nepal, for example, in 1998 for $49 million that went toward assisting the government to abandon interventionist policies and promote market-oriented growth. This resulted in significant liberalization of the agricultural input sector and led to a 3.3% growth rate per annum. Investment in rural people, infrastucture and rural social services

4
is also a focus of ADB as well as investment in building institutional capacity by assisting governments to implement new policies and developmental strategies. In the agriculture sector ADB continues to have problems with inadequate project design, short falls in operations and implementation, inability to address barriers confronting farmers and agribusiness and mitigating the impact of external factors such as declining global prices for agriculture products. The ADB also has come in for frequent criticism from organizations such as the NGO Forum on the ADB and Greenpeace. The primary reason for these criticisms has been the damage to the environment caused by ADB projects and lack of attention paid to the adverse impact on indigenous populations and the over emphasis of the ADB on liberalization as the preferred option to spur growth of the agriculture sector. Although Asian Development Bank lending has effectively decreased in real terms over the last decade, it has in some cases made clear efforts to respond to the needs of its DMCs in a way that shows a commitment to its stated policies as well as a willingness to allow its policies to evolve. With its foremost goal of tackling poverty in Asia and the Pacific, ADB has managed to combine a health systems approach with a developmental approach in the health sector. Unfortunately, a corresponding ability in the agricultural sector, which incorporates the needs of local people and land, is not evident. While certain strengths emerge from the review of program evaluation reports, a surprising finding was the fact that, in many instances, the ADB has been able to identify the underlying causes for poor performance and their solutions but has been unable to translate these into action. Some such examples include the need to develop and implement alternative financing strategies, increase dialogue with key stakeholders including civil society groups, establish a benefit monitoring and evaluation system and invest in human capacity development. While a much more in-depth analysis will be needed to identify the reasons for this we posit that this could be a result of the rigidity of its internal management structure, the level of influence a limited number of key members have in determining ADB programs and policies, and a lack of internal capacity in critical skill areas. In conclusion, while the ADB continues to be an important multi-lateral development finance institution with a strong commitment to address poverty in the Asia and Pacific region, it lacks the internal capacity to be a leader in critical areas of development lending and it appears unable to increase its lending to the social sector.

5
I. Introduction: Established in 1966 and headquartered in Manila, Philippines, the Asian Development Bank (ADB) is a multi-lateral development finance institution for Asia and the Pacific. Its foremost objective is to address poverty in the region and assist countries in their efforts to improve the quality of life for their citizens. In the Asia and Pacific region, 690 million people live on incomes of less than $1.00 per day and account for two thirds of the world’s poor (Special Evaluation Study on ADB Policy in the Health Sector, 2005). ADB envisions a poverty-free Asia and Pacific region and works toward this end by providing a range of financial tools to its Developing Member Countries (DMCs) such as policy dialogue, loans, technical assistance (TA), grants, guarantees, and equity investments. ADB’s annual lending volume is typically about US$ 6 billion, while Technical Assistance (TA) usually totals about US$ 180 million a year (www.adb.org). All ADB lending and related assistance is for development purposes, and most of its lending is in the public sector. ADB clients are member governments and these member governments are also its shareholders (www.adb.org). Between 1966 and 2007, the number of members increased from 31 to 67, with Georgia becoming the newest member on February 2, 2007. Of the 67 members, 48 are from the Asia and the Pacific regions while the remaining 19 are from Europe and North America. There are 44 Developing Member Countries1 (DMCs) distributed in five Asian and Pacific regions; Central and West Asia, East Asia, The Pacific, South Asia and the South East Asia. Basic information about DMCs has been provided in Annex-1. With 26 offices around the world and 2,000 employees from over 50 different countries (www.adb.org), ADB focuses on a wide range of development issues such as economics, environment, finance and trade, governance, law, policy, health, energy, infrastructure and social development. (A brief description of the various sectors and their sub-sectors is provided in Annex-2). Traditionally, agriculture and rural development have been the underpinnings of many Asian economies and have therefore received the most ADB support. Recently, however, the Social Infrastructure Sector, which includes health, education, and water supply has become a greater focus of ADB, and this shift is in line with ADB's goal to reduce poverty. The present analysis is intended to provide an overview of the organization and lending structure of ADB, its funding resources and lending portfolio, with special attention given to the Health Sector. Also included within this analysis are a synthesis of ADB program evaluation outcomes and a description of the apparent strengths and weaknesses of Health Sector programs. A synthesis of program evaluation outcomes for the Agricultural Sector is also provided. The Agriculture Sector is included due to the broad scope of importance it has traditionally had for many developing countries. In closing, an analytical conclusion provides insights, ideas and suggestions for future work based on the information presented. This analysis should not be viewed as an exhaustive or comprehensive account of the Bank’s activities; rather it represents snapshots of information believed to be relevant and important to understanding the major mechanisms and operations of ADB and the overall impact it has had in its chosen areas of engagement. 1 As Georgia became ADB’s member in 2007, has been excluded from the subsequent analyses

6
II. Organization Structure: Activities of ADB are managed by a Board of Governors, a Board of Directors, a President, four Vice-Presidents, a Managing Director General, and the Heads of departments and offices2. The highest level of policy making body of ADB is its Board of Governors. The Board of Governors is formed by one Governor and one alternate Governor from each of its 67 member countries. The Board of Governors meets formally once a year at the ADB’s Annual Meeting and delegates authority to the Board of Directors. The Board of Directors is comprised of 12 Directors that are elected by the Board of Governors. Each Director appoints his or her own alternate. Of the 12 Directors, eight represent the countries from the Asia and the Pacific region while the remaining four are from outside the region. Every two years, the Board of Governors elects a new Board of Directors and every five years, the Board of Governors elects a President of the Board of Directors. The President of the Board of Directors has the possibility of being re-elected. The Board of Directors is chaired by the President, and the Board follows the President’s direction in conducting the activities of the ADB. III. Funding mechanisms: The Asian Development Bank raises its funds through various mechanisms: bond issues on the world’s capital markets, member’s contributions, retained earnings from its lending operations, and the repayment of loans. ADB is actively involved in both borrowing and lending and maintains adequate net income, liquidity and reserves, monitors the creditworthiness of borrowers, requires borrowers to justify thoroughly the economic, financial and technical viability of projects for which they seek ADB loans. At ADB, there are different funds available for its lending operations: the most important funds are the Ordinary Capital Resources (OCR) and the Asian Development Fund (ADF).
A. Ordinary Capital Resources
The Ordinary Capital Resources is the pool of funds to which resources are replenished by borrowing from the world’s capital markets. There are three distinct sources for the OCR: private capital markets in the form of borrowings, paid-in capital provided by government funds, and accumulated retained income (reserves), which provide a buffer for risk arising from operations (ADB Annual Report, 2001). The OCR loans are made available at near-market terms (to better-off borrowing countries). Over the last decade (1996-2005), about 76% of cumulative public lending has come from the Ordinary Capital Resources.
B. Asian Development Fund
The oldest and the largest of the ADB’s existing special funds is its Asian Development Fund (ADF). The ADF was established in 1973. Its sources consist mainly of contributions which are mobilized under periodic replenishments from ADB’s members and reflows from ADF loan repayments. Since its establishment, ADF has been replenished eight times. The current ADF period, ADF IX, covers the period from 2005 to 2008.
2 See Annex-3 for the Organization Chart

7
ADF has been designed to provide loans on concessional terms and grants to those developing member countries which have low incomes per capita and limited debt repayment capacity. As of 31 December 2005, total contributed ADF resources amounted to US$ 24.4 billion. The largest contributions to ADF have been provided by following countries: Japan, the United States, Canada, Germany, Australia, France, and the United Kingdom, though other members also share the contributions. Over the last decade (1996-2005), about 24% of cumulative public lending has come from the ADF. Based on per capita GNP below/above the International Development Association (IDA) cut off of US$ 925 in 1997 prices, development status, and debt repayment capacity, ADB has classified its DMCs in four groups for lending purposes, as shown in Table 1.
There were 22 ADF borrowers in ADF VIII. The major borrowers from 2001-2004 were Pakistan, Bangladesh, Viet Nam, Sri Lanka, Afghanistan, and Nepal. There are 27 ADF borrowers that have access to ADF IX resources, 19 of which had either borrowed and/or received grants from ADF in 2005. Major borrowers included Pakistan, Bangladesh, Viet Nam, Afghanistan, Indonesia, and Sri Lanka.
In addition to OCR and ADF, ADB administers special funds and provides Technical Assistance (TA) including the following:
C. Japan Special Fund (JSF)
The Japan Special Fund (JSF) was established in 1988 when Japan and ADB agreed to provide financial support for ADB's technical assistance program in the form of an untied grant. The Government of Japan has appointed ADB as the Administrator of the JSF.
Country Category Lending Qualification
Gropup A ADF only
Gropup B1 ADF with limited OCR
Gropup B2 OCR with limited ADF
Gropup C OCR only
Source: Asian Development Bank
Per capita GNP below the IDA cutoff of US$925 in 1997 prices, classified as least developed, with weak debt repayment capacity
Per capita GNP above the IDA cutoff, not classified as least developed, with weak debt repayment capacity
Per capita GNP above the IDA cutoff, not classified as least developed, with limited debt repayment capacity
Per capita GNP above the IDA cutoff, not classified as least developed, with adequate debt repayment capacity
GNP = Gross National Product, IDA = International Development Association, OCR = Ordinary Capital Resources, ADF = Asian Development Fund
Table 1: Asian Development Bank (ADB)'s lending qualification to its Developing Member Countries (DMCs)
Armenia, Azerbaijan, Bangladesh, Cook Islands, Marshall Islands, Federated States of Micronesia, Pakistan, Sri Lanka, Tonga, and Viet Nam People’s Republic of China, India, Indonesia, Nauru, Palau, Papua New Guinea, and Uzbekistan
Fiji Islands, Kazakhstan, Malaysia, Philippines, Thailand, and Turkmenistan
Country Characteristics Afghanistan, Bhutan, Cambodia, Kiribati, Kyrgyz
Republic, Lao PDR, Maldives, Mongolia, Myanmar, Nepal, Samoa, Solomon Islands, Tajikistan, Timor-Leste, Tuvalu, and Vanuatu
Developing Member Countries (DMCs)

8
D. People’s Republic of China Regional Cooperation and Poverty Reduction Fund
The People's Republic of China (PRC) Regional Cooperation and Poverty Reduction Fund were established on March 25, 2005 to promote regional cooperation as a core component of the agenda to reduce poverty among the DMCs of ADB.
E. Technical Assistance
The objectives of ADB’s TA operations are to facilitate the flow and efficient utilization of development finance to developing member countries (DMCs) and to enhance their development capacity. Through its TA operations, ADB assists DMCs in (i) identifying, formulating, implementing, and operating development projects; (ii) improving their institutional capabilities; (iii) formulating and coordinating development strategies, plans and programs; (iv) undertaking sector, policy and issues-oriented studies; and (v) promoting the transfer of technology. ADB also utilizes its TA to foster regional cooperation among DMCs by assisting in the preparation of regional studies and conducting, by itself or in cooperation with other organizations, conferences, seminars, workshops, and training courses for participants from DMCs, thus promoting the role of ADB as a development resource center (ADB Operations Manual, Section D12/BP, 2003). Like the ADF, TA funds come from several sources. The major sources have been Technical Assistance Special Fund (TASF), funded by contributions from the member countries, and the Japan Special Fund (JSF). Additionally, a number of trust funds have been established with ADB by bilateral agencies and others to focus TA resources on special interest areas. Each fund is administered according to the requirements of the aid agency (ies), and most of the funds have been earmarked to support projects in specific sectors, or geographically defined regions, or some other aid agency-defined special interest area. Many of the trust funds are not replenished and expire once the original amounts have been exhausted. There are three types of TAs: Advisory, Project preparatory and the Regional TAs. During 2005 there were about 30 trust funds that were available to finance TA activities. (Annual Report on Loan and Technical Assistance Portfolio Performance 2005, ADB) IV. Financial Resources and Lending Portfolio: Authorized and subscribed capital stock amounted to US$ 53.2 billion as of 31 December 2006. ADB raised funds totaling US$ 5.6 billion, of which US$ 1.0 billion was raised through a global public offering as of 31 December 2006. Gross income, which includes revenue and net realized gains, amounted to US$ 1.9 billion, US$ 1.2 billion of which was generated from the loan portfolio, US$ 573.1 million from the investment portfolio, and US$ 136.4 million from other sources, of which US$ 105.0 million came from equity investment operations. ADB’s Special Funds are the Asian Development Fund (ADF) with 2006 committed resources amounting to US$ 1.3 billion, Technical Assistance Special Fund with US$ 89.4 million, Japan Special Fund with US$ 35.2 million, ADB Institute Special Fund with US$ 11.3 million, Asian Tsunami Fund with US$ 15.3 million, and Pakistan Earthquake Fund with US$ 28.5 million (www.adb.org, retrieved 8/17/07).

9
V. Trend Analyses of Lending Portfolio:
A. Public Sector loan portfolio3 by type of loans
Table 2 shows the public sector portfolio of loan approvals from 1996 to 2005. At the year-end 2005, there were 65 approved loans, which was lower than the decade average of 75 loans/year.
Items 1996 1997 1998 1999 2000 2001 2002 2003 2004 2005Decade average
A. OCR Loans1. Number 39 40 32 30 33 26 32 33 27 25 31.7Projects 38 35 26 23 27 18 24 26 20 20 25.7Programs 1 5 6 7 6 8 8 7 7 5 62. (a) Amount in nominal terms (in billions of USD) 3.5 7.7 4.9 3.8 3.9 3.9 3.9 4.5 3.7 3.9 4.4(b) Amount in real terms (in billions of USD) 3.5 7.2 4.3 3.1 3.1 3.1 3.0 3.4 2.7 2.7B. ADF Loans1. Number 44 49 27 32 48 46 53 47 47 40 43.3Projects 38 41 22 28 42 35 44 40 38 34 36.2Programs 6 8 5 4 6 11 9 7 9 6 7.12. (a) Amount in nominal terms (in billions of USD) 1.7 1.6 1.0 1.1 1.6 1.4 1.7 1.4 1.2 1.4 1.4(b) Amount in real terms (in billions of USD) 1.7 1.5 0.9 0.9 1.3 1.1 1.3 1.0 0.9 1.0C. Total Loans1. Number 83 89 59 62 81 72 85 80 74 65 75Projects 76 76 48 51 69 53 68 66 58 54 61.9Programs 7 13 11 11 12 19 17 14 16 11 13.12. (a) Amount in nominal terms (in billions of USD) 5.2 9.4 5.8 4.8 5.4 5.3 5.5 5.9 4.9 5.3 5.8(b) Amount in real terms (in billions of USD) 5.2 8.7 5.2 4.0 4.3 4.2 4.3 4.4 3.6 3.7Source: Annual Report on Loan and Technical Assistance Portfolio Performance for the year ending 31 December 2005, ADB
Table 2: Public Sector Loan Approvals - Annual Numbers and Amounts (in nominal and real terms) of Projects and Programs, 1996-2005
On average, US$ 5.8 billion per year was approved during the decade. The OCR loans constituted more than three-quarter of the total approved loans while the ADF loans accounted for 24%. The Asian financial crisis of 1997–1998 had a significant effect on the OCR loan portfolio. Due to the financial crisis in Asia, there was a sharp but temporary increase of about 220% in the value of the portfolio of approved OCR loans during 1998. However, it returned to roughly its pre-Asian financial crisis level by 1999. Due to the financial crisis, there was an immediate large increase in OCR program lending and a decrease in OCR project lending but the ADF loans remained virtually unchanged during the decade with an average of US$ 1.4 billion per year. The unchanged trend in ADF loans was evident even in the early part of the financial crisis during 1997 and in fact decreased to US$ 1.1 billion in 1999. The average size of the OCR project loans was US$ 111 million and that for OCR programs was US$ 251 million. There was no difference in the average size of the ADF projects and program loans – the amount being US$ 32 million.
3 To avoid double-counting, this analysis is based on the public sector loan approvals for the above mentioned period.

10
In nominal terms, the total amount of the public sector loan portfolio increased by about 2% from US$ 5.2 billion in 1996 to US$ 5.3 billion in 2005. However, in real terms4, there has been a decrease of 28% to US$ 3.7 billion in 2005. For the OCR loans, there has been increase of 11% in nominal terms but in real terms, it has decreased by 22%. Similarly for the ADF loans, there has been decrease in both nominal terms (17%) and in real terms (42%). A comparative trend of the loans, in both nominal and in real terms, has been shown in Figure-1. Figure-1:
Public Sector Loan Approvals (in nominal and real terms), 1996-2005
3.5
7.7
4.9
3.8 3.9 3.9 3.9
4.5
3.73.9
3.5
7.2
4.3
3.1 3.1 3.1 3.0
3.4
2.7 2.7
1.7 1.6
1.0 1.1
1.61.4
1.71.4 1.2 1.4
1.71.5
0.9 0.91.3
1.11.3
1.0 0.9 1.0
5.2
9.4
5.8
4.8
5.4 5.35.5
5.9
4.95.35.2
8.7
5.2
4.04.3
4.2 4.34.4
3.6 3.7
0.0
1.0
2.0
3.0
4.0
5.0
6.0
7.0
8.0
9.0
10.0
1996 1997 1998 1999 2000 2001 2002 2003 2004 2005
Years
Am
ou
nt
(in
bil
lio
ns
of
US
D)
OCR nominal OCR real ADF nominal ADF real Total nominal Total real
B. Public sector loan portfolio by country
Of the 43 DMCs5 of the ADB, 35 countries had loans approved in the last decade. Among them, 10 DMCs averaged more than US$ 100 million in loans approved/year (as shown in Table 3).
4 Using 1996 as the base year, the portfolio amounts for 2005 have been deflated by a factor of 0.7034, data taken from IMF’s World Economic Outlook Database, April 2006. 5 Georgia has not been included in the analysis as it became the member of the Bank in 2007.

11
Borrower 1996 1997 1998 1999 2000 2001 2002 2003 2004 2005 Decade Average
Average %
PRC 1032 656 1162 1232 872 997 833 1488 1260 1479 1101.1 19.1 India 600 563 250 625 1150 1500 1164 1430 1200 367 884.9 15.4 Indonesia 920 1109 1836 1020 800 500 767 262 225 796 823.4 14.3 Pakistan 583 501 - 403 707 957 1141 871 709 739 661.6 11.5 Korea, Rep. of - 4015 - - - - - - - - 401.5 7.0 Bangladesh 256 420 184 332 225 298 300 532 230 475 325.1 5.6 Viet Nam 303 360 284 220 189 243 234 179 296 578 288.5 5.0 Philippines 318 342 851 3 470 105 40 184 213 175 270.1 4.7 Thailand 330 550 630 364 - - - - - - 187.4 3.3 Sri Lanka 44 162 185 149 209 146 237 275 195 253 185.4 3.2 DMCs and Regional 770 693 465 485 809 555 833 697 619 399 632.4 11.0 Total 5156 9369 5846 4832 5431 5301 5548 5918 4947 5261 5760.8 100PRC = People's republic of ChinaSource: Annual Report on Loan and Technical Assistance Portfolio Performance for the year ending 31 December 2005, ADB
Table 3: Public Sector loan approvals for DMCs borrowing more than US$100 million/year (in millions of US$)
Of the major borrowers, the Republic of Korea had only one package of emergency assistance amounting to US$ 4,015 million approved during 1997 in response to the Asian financial crisis. Similarly, Thailand has not borrowed voluntarily from the Bank since 1999. India, Indonesia, Pakistan, and PRC have accounted for 60% of all ADB loan approvals during the decade. The remaining four countries - Bangladesh, Philippines, Sri Lanka, and Viet Nam – have accounted for 19% of the total loan approvals during the decade. The remaining 25 DMCs are small borrowers and together they have accounted for 11% of all loan approvals during the decade. In 2005, they accounted for 8% of the approved loans. As shown in Table 4, the Asian Development Bank has classified the potential borrowers among its DMCs as:
Frequent borrowers – countries which would have loans in at least 7 out of the next 10 years,
Occasional borrowers - countries which would have loans in at least 4-6 out of the next 10 years, and
Infrequent borrowers - countries which would have loans in at least 0-3 out of the next 10 years.
There are 4 graduated and 2 temporarily ineligible DMCs.

12
Frequent Occasional Infrequent Graduated
Curremtly ineligible (In default)
Afghanistan Bhutan Armenia Hong Kong, China MyanmarAzerbaijan Fiji Islands Cook Islands Korea, Republic of NauruBangladesh Maldives Kazakhstan SingaporeCambodia Marshall Islands Kiribati Taipei, ChinaChina, People's Republic Micronesia, Fed.States MalaysiaIndia Samoa PalauIndonesia Solomon IslandsKyrgyz Republic ThailandLao PDR Timor-LesteMongolia TongaNepal TurkmenistanPakistan TuvaluPapua New Guinea VanuatuPhilippinesSri LankaTajikistanUzbekistanViet NamFed = Federated, PDR = People's Democratic Republic
Table 4: Potential borrowers among the Developing Member Countries (DMCs) by frequency of borrowing
Source: Annual Report on Loan and Technical Assistance Portfolio Performance for the year ending 31 December 2005, ADB
C. Public sector loan portfolio by Sector:
Table 5 shows the public sector loans disaggregated by the various sectors during the past decade.
Sector 1996 1997 1998 1999 2000 2001 2002 2003 2004 2005Decade average Average %
Transport and Communication 1,388 933 1,480 918 1,340 1,426 1,673 2,578 1,976 1,723 1,544 26.8%Multisector 610 458 928 866 777 1,038 340 688 651 865 722 12.5%Law, Economic Management, and Public Policy 255 116 46 728 100 910 567 300 584 778 438 7.6%
Energy 1,077 824 400 719 1,066 663 928 655 707 637 768 13.3%Water Supply, Sanitation, and Waste Management 166 437 197 340 170 102 190 617 30 618 287 5.0%Agriculture and Natural Resources 781 499 235 384 663 671 505 392 199 314 464 8.1%Finance 283 5,271 1,552 41 402 109 895 228 100 186 907 15.7%Education 368 628 133 183 346 249 284 159 278 58 269 4.7%Health, Nutrition, and Social Protection 108 203 825 347 163 48 20 132 273 58 218 3.8%Industry and Trade 121 50 307 404 86 145 170 148 25 162 2.8%Total 5,157 9,369 5,846 4,833 5,431 5,302 5,547 5,919 4,946 5,262 5,761 100.0%Source: Annual Report on Loan and Technical Assistance Portfolio Performance for the year ending 31 December 2005, ADB
Table 5: Public Sector loans approved during 1996-2005; disaggregated by sector (in millions of US$)
During the decade 1996-2005, more than half of the total loans (56%) were approved for the following sectors: transport and communication, energy, and finance. The agriculture and natural resources sector received only about 8% of the total approved loans, in spite of the fact

13
that this sector has been the backbone of the many developing Asian countries. The social sector, which is comprised of education, and health, nutrition, and social protection, has collectively received 9% of the total approved loans. As would be expected, the finance sector received a 19- fold increase in the approved loans in 1997, compared to its 1996 level of US$ 283 million.
D. Technical Assistance (TA) portfolio by sector:
During the decade 1996-2005, more than half of the total approved TAs (53%) were for the following sectors: law, economic management, and public policy, agriculture and natural resources, and transport and communication (Annex-3). Until 1995, the agriculture and natural resources sector received about 32% of the total TAs (not shown here), however, during the past decade, that sector received only 16% of all the TAs. This reduction of 50% is attributed to changes in emphasis in ADB’s assistance program, and response to external factors. The Bank has been gradually reducing its emphasis on assistance to the agriculture and natural resources sector. Further, the law, economic management, and public policy sectors have received about 25% of the total TAs, compared to their collective share of 10% up until 1995 (not shown here). This increase in law, economic management, and public policy sector is attributed to the Asian financial crisis of 1997 and continues with an increased emphasis on improving governance and combating corruption in DMCs (Lending Portfolio, 2005). The social sector has received 10.3% of the total TAs. Figure-2 shows the trend in distribution of TAs to the various sectors over the past decade. Figure-2: TA approvals, disaggregated by various sectors, 1996-2005
TAs approvals by sectors, 1996-2005
0
5
10
15
20
25
30
35
40
45
50
1996 1997 1998 1999 2000 2001 2002 2003 2004 2005
Years
Am
ou
nt
(in
mil
lio
ns
of
US
D)
LEP ANR T & C FIN EN EDU WSS HNS I & T Multisector
14
E. Technical Assistance (TA) portfolio by country:
Table 6 shows the major recipients of TAs during the period of 1996-2005. The major recipients have been- People’s Republic of China, Indonesia, Pakistan, and Viet Nam- where they have received 38% of total TAs in between them.
DMC(in millions
of US$) Percent1 PRC 166.3 13.0%2 Indonesia 134.6 10.6%3 Pakistan 93.1 7.3%4 Viet Nam 91.2 7.2%5 India 87.5 6.9%6 Philippines 63.6 5.0%7 Bangladesh 62.9 4.9%8 Cambodia 55.6 4.4%9 Sri Lanka 52.4 4.1%10 Lao PDR 50.2 3.9%
11-37 27 DMCs 418.1 32.8%Total 37 DMCs 1,275.5 100.0%
Table 6: Major TA recipient DMCs, 1996-2005 (aggregate)
Technical Assistance
PRC = People's Republic of China, PDR = People's Democratic RepublicSource: Annual Report on Loan and Technical Assistance Portfolio Performance for the year ending 31 December 2005, ADB VI. Health Sector Policy and Lending: In more than 40% of developing member countries, per capita expenditures on health care fall below $34, which is the estimated minimum level of health spending for basic services (Special Evaluation Study on ADB Policy for Health Sector, 2005). Most of the region’s poor live in rural areas, where health services are inadequate, hard to access, or non-existent. A cycle of impoverishment is common, whereby poverty leads to poor nutrition and scant health care, which cause health to further decline and, in turn, poor health contributes to poor productivity in society and diminished participation in the economy. Through its lending in the health sector, ADB strives to reduce poverty by targeting disadvantaged groups such as women, children, indigenous people, and those who live in rural and remote places. In the late 1990’s, the ADB began shifting its focus away from large urban hospitals and delivery of treatment services in favor of addressing basic and preventive service delivery to the rural poor where primary health care, women’s health and reproductive health care are most in need. A new ADB health sector policy, approved in 1999, is more focused on identifying and addressing specific priorities, strategies and outcomes aimed at targeted populations. However, despite the new policy, ADB’s lending in the health and population sector has remained between 2 and 3% of its total activity, indicating that ADB policy on health sector lending has not resulted in increased lending.

15
The Asian Development Bank approved its first loan in the health sector in 1978. Investment in health represents 2.7% of the Bank’s cumulative lending. Although the Asian Development Bank is committed to improve health of the poorest of the poor people in the region, investment in health has continued to be a challenge for ADB’s operations (ADB Policy for the Health Sector, February, 2007). According to the Health Sector Annual Report, 2003 of the Bank, some of the proposed reasons for small proportion of ADB’s lending in Health Sector are:
Lack of demand for health sector investments from DMCs ADB's financing products are not competitive (particularly where there is an expectation
that social sectors should be financed with grants or soft loans) Misperception that ADB has no comparative advantage in the sector Insufficient staff resources for the demand and complexity of health sector operations There is a lack of absorptive capacity in DMCs for increased health sector investments There are already many other, if not too many donors
A description of the public sector loans to the health sector (from 1978 to 2003) has been provided in Annex-4. As Figure 5 shows, a total of US$ 2.12 billion has been invested in the health sector, of which 55% was contributed through Ordinary Capital Resources and the remaining 45% through the ADF. Figure 5: Health sector lending by types of loan, 1978-2004 (in millions of US$)
Health sector lending by types of loan, 1978-2004
55%
45%
OCR ADF

16
Most of the investments in the health sector have been devoted to the following program areas:
Health Care/Services Development Rural Health Services Reproductive Health and Safe Motherhood Child Health Communicable Diseases Control Primary Health Care
Trends in Health Sector Investment:
Table 7 shows the investment in the Health, Nutrition and Early Childhood Development Sector compared to that in all sectors, for the period of 1994-2003.
For the period of 1994-2003, investment to the HNP/ECD sector was about 2.1% of the cumulative lending to all sectors. An average of US$ 161 million was invested in health compared to the average investment of US$ 5,808 million to all sectors. Similarly, on average, there have been 4 projects allocated to the health sector compared to the 66 projects to all sectors over the same period of time. There has not been any particular trend in ADB’s investment in the health sector; rather lending has fluctuated, which is evident from Figure 4. Two loans amounting to US$ 300 million to Indonesia for crisis response caused a rise in health sector investment from .06% in 1998 to 7% in 1999, representing a sudden and temporary increase of over 1,000%. These large loans were aimed at providing support for the health sector in the context of Asian financial crisis. See Annex-5, “Indonesia Health and Nutrition and Social Protection Sector Development Programs”
Year All Sectors HNP/ECD
Sector1
Health sector component to
multisector projects
HNP/ECD
Sector2
% of HNP/ECD Sector to All
Sectors All Sectors
HNP/ECD
Sector 1 % of HNP/ECD
Sector to All Sectors
1994 3686.5 99.7 58.5 158.2 4.3% 48 5 10.4%1995 5504.4 30.9 0 30.9 0.6% 72 2 2.8%1996 5545.1 108 32.6 140.6 2.5% 83 4 4.8%1997 9414.0 203.3 0 203.3 2.2% 75 4 5.3%1998 5982.5 34.7 260.3 295 4.9% 57 4 7.0%1999 4978.6 347 7.3 354.3 7.1% 52 3 5.8%2000 5850.4 163.3 4 167.3 2.9% 74 5 6.8%2001 5339.0 36 10 46 0.9% 60 2 3.3%2002 5676.0 40 0 40 0.7% 71 2 2.8%2003 6105.0 132 40 172 2.8% 66 5 7.6%
Total 58081.5 1194.9 412.7 1607.6 2.8% 658 36 5.5%Average 5808.15 119.49 41.27 160.76 2.9% 65.8 3.6 5.7%1 Including private sector projects 2 Including private sector projects and health component of multisector projectsSource: Health Sector Annual Report, 2003, ADB
Loan Amount (in millions of USD) Number of projects
Table 7: Health, Nutrition, Population (HNP), and Early Childhood Development (ECD) sector lending, 1994-2003

17
for a description of this crisis response. In 2003, the Bank responded specifically to the outbreak of the Bird-flu by devoting 2.8% of its total lending to the health sector. Figure 4: Health, Nutrition, and Population/Early Childhood development lending as a percentage of ADB lending, 1994-2003.
% of HNP/ECD Sector to All Sectors
2.7
0.6
1.92.2
0.6
7
2.8
0.7 0.7
2.2
1.8
0
1
2
3
4
5
6
7
8
1994 1995 1996 1997 1998 1999 2000 2001 2002 2003
Years
% o
f H
NP
/EC
D s
ecto
r to
all
sec
tors
% of HNP/ECD Sector to All Sectors
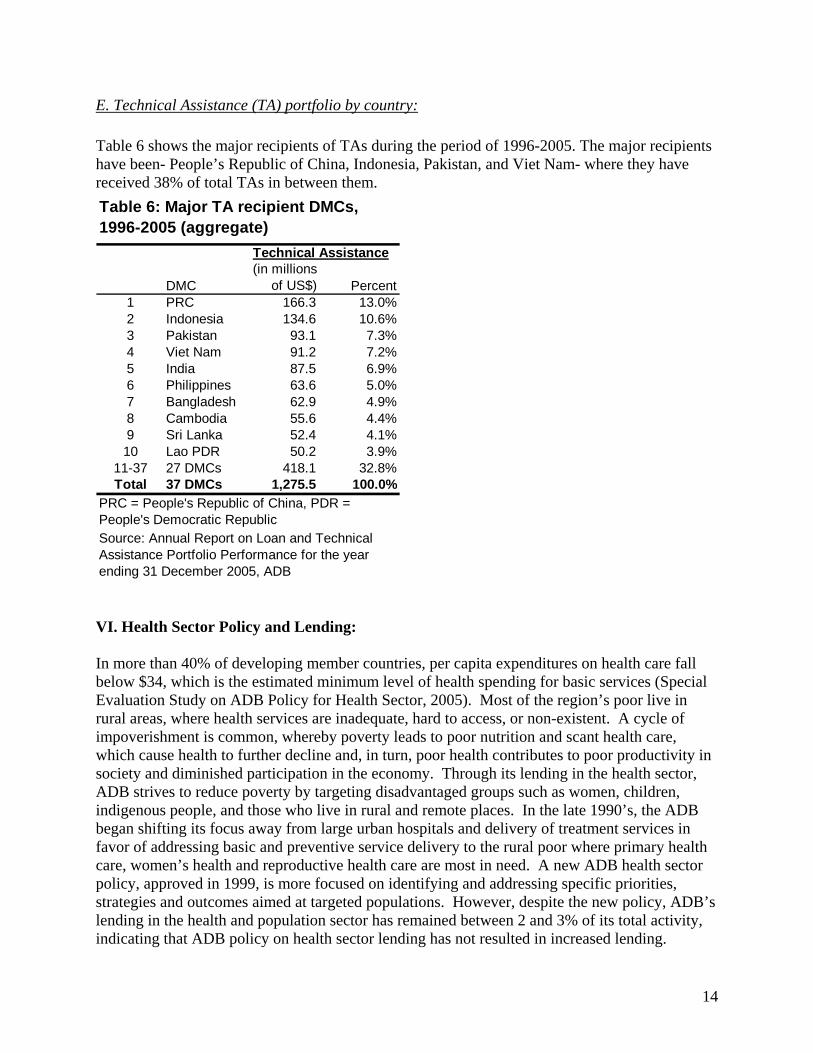
VII. Comparison of Development Lending Institutions by Sector Table 8 shows Asian Development Bank’s lending in comparison with the lending of the World Bank, the Inter-American Development Bank and the African Development Bank. Percentages of total lending are presented for each sector. With 31% of its total lending going towards the health sector, the World Bank approves the highest percentage of funding in the form of loans to the health sector. Moreover, the level of World Bank’s commitment to the health sector is second only to its level of commitment to the law, economic management and public policy sector, which receives 32.6% of World Bank’s total lending. World Bank lending to the health sector in Asia averaged 38.7% of total World Bank health sector lending for the years 2004 through 2006. This 38.7% represents 12% of the World Bank total lending for that time-period and amounts to a yearly average of $ 512 million US dollars. In contrast, the average percentage of total loan approvals made by Asian Development Bank to the health sector was only 2.9% with an average yearly commitment of $ 154 million US dollars between 2003 and 2005. Likewise, the African Development Bank committed 4.4% with a yearly average of $ 124.2 million US dollars and the Inter-American Development Bank committed 2% with a yearly
18
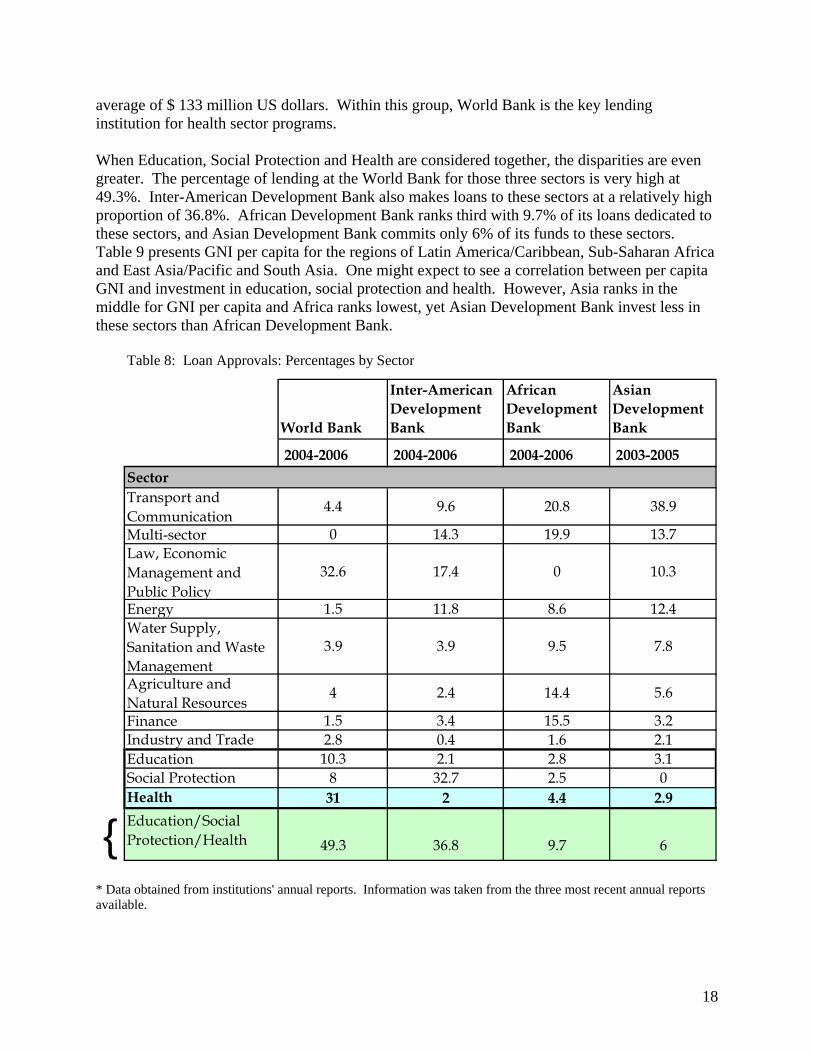
average of $ 133 million US dollars. Within this group, World Bank is the key lending institution for health sector programs. When Education, Social Protection and Health are considered together, the disparities are even greater. The percentage of lending at the World Bank for those three sectors is very high at 49.3%. Inter-American Development Bank also makes loans to these sectors at a relatively high proportion of 36.8%. African Development Bank ranks third with 9.7% of its loans dedicated to these sectors, and Asian Development Bank commits only 6% of its funds to these sectors. Table 9 presents GNI per capita for the regions of Latin America/Caribbean, Sub-Saharan Africa and East Asia/Pacific and South Asia. One might expect to see a correlation between per capita GNI and investment in education, social protection and health. However, Asia ranks in the middle for GNI per capita and Africa ranks lowest, yet Asian Development Bank invest less in these sectors than African Development Bank. Table 8: Loan Approvals: Percentages by Sector
World Bank
Inter-American Development Bank
African Development Bank
Asian Development Bank
2004-2006 2004-2006 2004-2006 2003-2005
SectorTransport and Communication
4.4 9.6 20.8 38.9
Multi-sector 0 14.3 19.9 13.7Law, Economic Management and Public Policy
32.6 17.4 0 10.3
Energy 1.5 11.8 8.6 12.4Water Supply, Sanitation and Waste Management
3.9 3.9 9.5 7.8
Agriculture and Natural Resources
4 2.4 14.4 5.6
Finance 1.5 3.4 15.5 3.2Industry and Trade 2.8 0.4 1.6 2.1Education 10.3 2.1 2.8 3.1Social Protection 8 32.7 2.5 0Health 31 2 4.4 2.9
{Education/Social Protection/Health 49.3 36.8 9.7 6
* Data obtained from institutions' annual reports. Information was taken from the three most recent annual reports available.
19
Table 9: GNI per capita GNI per capita 2005, PPP
Latin American and Caribean $8,129Sub-Saharan Africa $1,193East Asia and Pacific $6,060South Asia $3,124
World Development Indicators database, World Bank, 2007
VIII. Evaluation of ADB Performance One of the strengths of ADB is its program evaluation system. ADB has a long history of examining the process and outcomes of its programs, and its evaluation priorities and techniques have evolved in a way that keeps in step with changing ADB policies, objectives and information needs. This evaluation section presents a brief summary of ADB policy change and an analysis of the operations and impacts of ADB programs in the health and agriculture sectors based on the evaluation reports that are available on the OED portion of the ADB website. The Post-evaluation Office of ADB, created in 1978, was originally intended to assess whether the projects’ outcomes were commensurate with the original expectations. While program evaluation during the early years was focused on creating historical records, even then evaluation was seen as a means to improve the planning, appraisal and implementation of ADB programs. By 1986, performance evaluation had become more prominent, and program effectiveness and efficiency came more clearly in focus. Presently, evaluations contain not only historical records of the process and outcomes and measures of project efficacy, efficiency and sustainability, but evaluations also provide useful critiques and recommendations for future work in the specific program area and also in more generalized terms (www.adb.org, retrieved 8/17/07). All ADB programs are self-evaluated by the relevant ADB operations department in a mid-term review or a project completion report (PCR). Only a portion of ADB programs are independently evaluated. The Operation Evaluation Department is the independent evaluator. OED is a department within ADB but it reports to the Development Effectiveness Committee, which is governed by the ADB’s Board of Directors and not ADB management. Because of this, OED evaluations are considered to be independent. All of the information appearing in the Program Evaluation Annexes 7 and 8 was accessed at the OED website at: http://www.adb.org/Evaluation/ on 8/17/07. Annex 6 provides a more detailed description of the structure and process of OED. Table 9 shows success rates for broad sectors by decade from the 1970s through the 1990s. Social Infrastructure, which contains urban development, water supply and wastewater treatment, sanitation, education and health and population, was more successful in the OCR category with a total success rate of 73% as opposed to the ADF category where it attained a total success rating of only 55%.

20
Table 10: Project Performance by Sector and Source of Financing
A. Evaluation of Health Sector Programs
In 1999, ADB initiated a 5-year review of its new policy for the health sector to determine its relevance and ability to shape the future of health in the region. As compared with evaluation results from before 1999, ADB programs following the new policy have demonstrated increases under the five strategic goals and have shown that they are in step with ADB’s stated policies (Learning Curves: ADB’s Policy for the Health Sector, 2007): ADB’s Strategic Considerations Rating 1 Improve the health of vulnerable groups Relevant 2 Focus on achieving tangible results Highly relevant3 Support testing of innovations and deployment of new technologies Relevant 4 Encourage governments to take an appropriate and activist role Relevant 5 Increase the efficiency of health sector investments Highly relevant According to ADB, the policies have had a positive impact in changing the level of effect that the Bank has in the health sector. Positive outcomes have been shown by: (1) a large increase in the number of loans using specific health-outcome indicators; (2) inclusion of cost-benefit and economic sustainability analysis in all loans approved since 2001; (3) inclusion of economic rate of return calculations in most projects; (4) attention to supporting governance through health sector reforms and institutional capacity building. As previously stated, the new Health Sector policy introduced by ADB in 1999, did not lead to an increase in lending to the Health Sector. As described in ADB Special Evaluation Study on ADB Policy for the Health Sector (2005), clients tend not to borrow ordinary capital resources from ADB for health, and they do not appear to see competitive advantages ADB may have in this area. ADB recognizes this and asserts that the issue is too broad to handle in one sector
21
policy study. However, ADB does address the potential tools it could employ to expand its health program according to the Eighth Replenishment of the Asian Development Fund. ADB acknowledges that it will remain a minor player in health, education and poverty in middle-income countries unless a concessional lending modality can be developed. In order to increase its ability to effect positive change in these areas, ADB will have to develop a broader range of lower-cost products. Some concessions are needed to reduce the cost of such loans so that they are lower than ordinary capital resources (OCR) terms. Strategies that ADB may consider are: mobilizing greater cofinancing with bilateral donors or blending concessional funds of
bilateral donors with OCR funds for MICs for health sector operations. becoming more actively involved in the international discussion on developing
innovative financing modalities for MDGs work out a strategic focus in health sector within the poverty reduction strategy
framework and in harmony with development partners develop innovative partnerships with the private sector and civil society consider whether a proposal should be developed to argue for a change in ADF eligibility
from country-based to sector-based considerations. explore modified (hybrid) technical assistance modality.
1. Health Sector Program Impacts ADB lending has shifted its focus from what it calls “hardware,” or physical infrastructure and equipment, to “software,” or medical personnel training, health education and family planning programs, planning and management, and disease surveillance (Fighting Poverty through Better Health Care, ADB 2001). This shift requires flexibility and changes in ADB project design to emphasize preventive and promotive services rather than curative services, more beneficiary participation in project design and implementation, use of innovative and alternative approaches in health care, and increased funds allocated to health care research, health education for the general public and health regulation. Overall, ADB aims to help countries ensure that people have access to basic health care services that are cost-effective, efficacious, affordable and sustainable. Based on the “Fighting Poverty through Better Health Care” report, ADB demonstrates a strength in Health Sector lending by the way in which it effectively addresses the health care needs of women and children. ADB states that the greatest impact it has had in this sector is on the health status of mothers and babies, with fewer mothers dying at childbirth and fewer infants afflicted with disease. Among the impacts it claims to have had, ADB highlights the drop in infant mortality rate in Sri Lanka from 30 per 1,000 in 1985 to 17 per 1,000 in 1993, with Bangladesh and Pakistan experiencing similar downward trends, although not as pronounced. Papua New Guinea, on the other hand, experienced an upward trend in this area during the same time period, which ADB attributes to worsening social conditions in the country. ADB claims that, if it had not intervened with its loan programs, the deterioration of health status would have been worse. Governance and the condition of social services within countries are posited to have profound effects on program efficacy. Access to health care (Indonesia, Project # 32156), proximity to health centers (Lao, Project #25109) and home visits by midwives (Sri Lanka, Project # 18070) have had a widespread,

22
positive effect on health outcomes, especially for people living in rural areas, and for women and children. Women received more prenatal care and infants and children received more immunizations (Sri Lanka, Project #18070 and Indonesia, Project #32156). Easier access enabled women to save time and money getting to the facilities, and it increased the acceptance of family planning initiatives (Lao, Project #25109). In Pakistan (Project # 710PAK), the Second Health and Population Project helped bring down the population growth rate from more than 3% per annum in 1984 to 2.7% per annum in 1998. Seventy-two percent of the users of the primary health care facilities that were part of this project were women Moreover, the Third Health and Population Project in Pakistan (Project #19045) helped increase the status and empowerment of women by creating training opportunities and jobs for them in the health care sector, such as midwives, nurses and paramedics. A similar positive effect was found for women in Lao (Project #25109), whose status and empowerment was raised through their decision-making ability at the new women’s union health center. Women, in general, also benefited from family planning efforts, which led to better child spacing, better health, and more personal and career-oriented opportunities. Improved outcomes in nutrition and population initiatives have followed a similar pattern of emphasizing a finer and more specified approach by country, rather than by region. ADB has proposed integrating nutrition plans into overall development plans by piloting them first and tailoring them to local social conditions through the involvement of civil society, related partners, and private sector representatives in planning and implementation (Learning Curves: ADB Interventions on Nutrition and Food Fortification, 2007). Population growth is addressed within the constructs of health and family planning.
2. Health Sector: Lessons Learned
i. Focus on Vulnerable Populations has Paid Dividends
Clearly, ADB has moved its focus away from large investments in infrastructure with Myanmar, Project # 14043, Pakistan Project # 710PAK, Pakistan Project # 19045 and Malaysia, Project #19042 as examples of such projects that were begun in the 1980s. Beginning in the 1990s, ADB began targeting specific groups of people and areas of intervention to address health care access and education for the most vulnerable populations as well as training and support for the professionals who provide those services. This change in focus demonstrates an awareness and understanding of how to reach and engage the greatest number of the most vulnerable people. Not only was ADB able to improve health care delivery by actively seeking to identify, locate and help the poor (Indonesia, Project #32156), some of its efforts also helped raise the social and financial status of women by providing them with decision making authority (LAO, Project # 25109) and career training and employment opportunities (Pakistan, Project # 19045). Changes in the focus of ADB Health Sector programs also serve as an example of the way in which Health Sector program objectives have kept in step with the stated Health Sector policy.
ii. Importance of Human Capacity Development
Related to the changing focus of its initiatives, ADB has recognized the importance of investing in specific areas of human capacity building. Human capacity building has been a top priority of several more recent programs in the form of primary care health worker training (Lao, Project # 25109 and Cambodia, Project # 27411), technical and vocational training (Cambodia, Project #
23
27411), and teacher, midwife and paramedic training (Sri Lanka, Project # 18070). Malaysia (Project # 22051) succeeded in recruiting and retaining Ministry of Health staff in a manner that keeps them ahead of the typical manpower drain into the private sector and Sri Lanka (Project # 18070) has promoted senior medical staff who were trained under the project to key positions in planning, program design and policy implementation. However, a review of ADB’s portfolios shows that it has paid very little attention to creating capacity within the region in health policy analysis or health economics both of which are critical as countries in the region grapple with increasingly complex health systems issues.
iii. Need to Develop and Implement Alternative Financing Strategies
ADB (Fighting Poverty through Better Health Care, 2001) believes that alternative financing such as insurance packages must be explored to make health care systems sustainable and that scarce government resources should be directed toward the needier, rural areas. The ADB believes that even as insurance arrangements are developed, in order to continue providing access to health care and family planning services, some kind of cost recovery mechanisms need to be in place. ADB did not pursue cost recovery to enable internal resource mobilization by hospitals due to a belief that user fees reduce utilization by the poor. Except for Malaysia (Project # 22051), which presents a unique example because it could afford to provide health care to all its citizens and therefore did not impose charges, health care financing plans that include at least some kind of co-payment or insurance may be necessary. As with human capacity development our review of ADB’s portfolio showed that they have not paid enough attention to fostering the development and implementation of innovative or alternative financing strategies. This could be a result of ADB’s limited internal capacity in these areas.
iv. Dialogue with Governments and Key Stakeholders
ADB strives to design new projects by building on the positive and negative lessons learned from past projects. Some projects lacked coordination among government agencies and wasted resources, such as in Pakistan, where there was no technical staff to operate x-ray equipment (Project #710PAK). Other projects have underutilized their funding. For example, in Sri Lanka, only 20% of the funds for in-service training of midwives and public health inspectors were used in the First Health and Population Project because similar training was provided by other agencies. Other design flaws include absence of impact indicators (Malaysia, Project #19042), poor implementation monitoring (Indonesia, Project #16041), and little involvement by health care providers and beneficiaries in planning (Myanmar, Project #14043). Increased dialogue with governments and key stakeholders including civil society groups is another area where the ADB can do better. The ADB clearly understands the importance of greater harmony between governments, other funding agencies and stakeholders but we could not find documents that specify how it achieves this objective.
v. Establishing the Value Proposition
Performance indicators to measure the effectiveness of project designs or impacts of projects were often not included or, when they were, they were not always pursued diligently. Additionally, plans were stalled or misdirected due to difficulties recruiting and effectively utilizing consultants and counterpart staff (Myanmar, Project #14043). Because of the weaknesses in monitoring and evaluation, ADB has less outcome data, fewer benchmarks for

24
success, and fewer identified indicators to incorporate in future projects (Fighting Poverty through Better Health Care, 2001).
vi. Inadequate Attention to Recurrent Costs
In many cases, ADB did not get the full value for its investments because governments lacked the funds to sustain their health care facilities in good condition. Many countries, such as Myanmar (Project #14043) and Sri Lanka (Project #18070), did not have adequate budget allocations for operation and maintenance, which caused them not to perform regular maintenance of equipment and this often resulted in neglect leading to deterioration requiring major, costly repairs. In addition to inadequate funding, another factor that contributed to neglect of facilities is beneficiaries who show little interest in poorly maintained facilities and make few or no demands for care (Pakistan, Project # 710PAK). While the ADB has recognized inadequate funding for recurrent costs as a problem it has not done enough to address this issue in the design and implementation of its projects.
3. Health Sector Program Evaluations The following program evaluations are included in table format in Annex - 7. The Annex tables show specific achievements and challenges of the health sector programs that have been evaluated by OED and posted on the ADB website for public review.
MAL 19042
1986-1993
Health Services Development Partly Successful
Malaysia
MAL 22051
1989-1999
Third Health Project Successful
710 PAK
1984-1994
Second Health and Population Project
Partly Successful
Pakistan
PAK 19045
1987-1995
Third Health and Population Project Satisfactory
Cambodia CAM 27411
1995-2003
Basic Skills Project Successful
Sri Lanka SRI 18070
1992-1999
Second Health and Population Project
Successful
INO 16041
1985-1993
Health and Population Project Partly Successful
Indonesia
INO 32156
1999-2003
Health and Nutrition Development Project
Successful
Lao PDR LAO 25109
1995-2001
Primary Health Care Project Successful
Marshall Islands
RMI 26322
1994-2002
Health and Population Project Partly Successful
Myanmar MYA 14043
1981-1990
Upgrading of Hospitals Project Partly Successful

25
B. Evaluation of Agriculture Sector Programs
Agriculture accounts for nearly 25% of developing countries’ GDP and nearly 70% of its total employment. Therefore, it makes sense that over its 38 years of existence, the ADB has designed and implemented nearly 1,100 technical-assistance grants and 550 loan projects in agriculture and rural development. (“International Trade in Agri-Food: Recipes for Success”: Remarks by Jin Liqun, Vice President, Operations, 2004). For the years 2007 through 2009, the ADB has already approved $3.35 billion and has planned $8.08 billion for projects in this sector alone (BUYUSA.GOV U.S. Commercial Service Website, retrieved 8/17/07). Throughout its thirty-plus years, the ADB has primarily employed three methods to support its Developing Member Countries’ (DMC) efforts to accelerate agriculture growth. The first has been to help put in place a facilitating environment for such growth. This has been accomplished through policy dialogue, technical assistance support, and financial assistance to help its DMCs meet the adjustment costs associated with policy reform through ADB’s program lending modality. Second, the ADB has helped in designing and providing financial support for development projects that invest in rural people (social services), rural infrastructure (transport, irrigation, power, and communications), and rural support services (research and extension). Third, the ADB has supported governments in building institutional capacity to implement their chosen policies and developmental strategies (“International Trade in Agri-Food: Recipes for Success” Jin Liqun, Vice President, 2004). The ADB is heavily vested in liberalizing the agricultural sectors in developing countries because they believe that global agricultural trade reform could lead to a $140 billion per annum potential gain in economic welfare for developing countries. This would gain be amount to about three times the current level of official development assistance (“International Trade in Agri-Food: Recipes for Success” Remarks by Jin Liqun, Vice President, Operations, 2004). For instance, between the years 1998 and 2000, the ADB loaned Nepal $49 million to reconstruct its agricultural sector. This loan helped the government abandon its interventionist policies and promote market-oriented growth. Significant liberalization of the agricultural input sector took place and, as a result, a real 3.3% growth per annum was realized (Project # 25361). In another case, the ADB loaned Mongolia $35 million between 1995 and 1998. Although this project did not fully reach its objectives, farm privatization, price liberalization, and the promotion of free markets for land-use rights was largely achieved (Project # 27536). ADB helps accelerate agricultural growth is through designing and providing financial support for development projects that invest in rural people, rural infrastructure, and rural social services. For example, between the years 1988 and 1997, the ADB loaned Bangladesh nearly $31 million to successfully replenish its fish and prawn supply in order to increase shrimp export opportunities and to meet the domestic demand for fish. This project achieved many things: most notably, the extensive production of demonstration fish ponds which yielded higher financial returns than those they replaced. Techniques and information learned in these farms were disseminated to surrounding areas. Between the years 1986 and 2000, fish exports more than doubled (Bangladesh, Project #18045).

26
ADB assists governments in building institutional capacity through implementation of their chosen policies and developmental strategies. For example, in the 1980s, when Vietnam (Project # 25325) decided to dramatically change its economic policy so that the household was now viewed as the main unit of agricultural production, the ADB loaned this country $79 million so they could successfully make such a transition. As a result, rice production and rice exports increased and rural poverty dramatically fell from 66% in 1993 to 45% in 1998. ADB also supports regional cooperation initiatives in resource management, agricultural research, and trade reform. Technical assistance is being provided to identify best agricultural practices and then to encourage knowledge sharing between member countries. ADB also encourages the growth of regional agriculture trade, including the identification of regionally consistent and suitable methods for inspection and quarantine, as well as trying to ease agricultural trade barriers among its DMCs. Finally, the ADB assists its member countries to form collective bargaining positions on agricultural matters with regards to the WTO and other relevant trade organizations (“International Trade in Agri-Food: Recipes for Success”: Remarks by Jin Liqun, Vice President, Operations, 2004).
1. Problems with Agriculture Sector Programs During the 1990s, ADB’s success rate for its agricultural projects was 52%. The 52% success rate constitutes an improvement in performance over the 1970s and 1980s, which had overall success rates of 37% and 47% respectively (“Independent Evaluation at the Asian Development Bank” March 2007). In an attempt to investigate why the Bank has difficulty in this sector, the OED produced an evaluation report in 2005 covering two decades of partly satisfactory results in the Lao People’s Democratic Republic (“Sector Assistance Program Evaluation for the Agriculture and Natural Resources Sector in the Laos People’s Democratic Republic” December 2005). This investigation uncovered several problem areas, which the Bank feels may be the cause behind many of their lackluster returns in projects that they fund in this economic sector (“Independent Evaluation at the Asian Development Bank” March 2007). The problem areas are described below. Inadequate Project Design ADB programs have suffered from inadequate project design resulting from a lack of understanding of local problems and opportunities as they are viewed by those they are trying to help (“Independent Evaluation at the Asian Development Bank” March 2007). ADB receives frequent criticism from organizations such as the NGO Forum on the ADB, Greenpeace http://www.greenpeace.org retrieved on 8/17/07, and UNEP, http://ipsnews.net/news.asp?idnews=3856, retrieved on 8/17/07) mainly for two reasons:
(1) ADB programs are purported to cause damage to the environment (2) ADB fails to recognize the needs of the indigenous populations that they are trying to help and that their cultures are being displaced by the programs (http://www.forum-adb.org/ retrieved 8/17/07, International River Network “IRN’s Nam Theun 2 Campaign” and NGO Forum on ADB “ADB: 40 Years of Debt, Poverty and Pollution” May 2007).
27
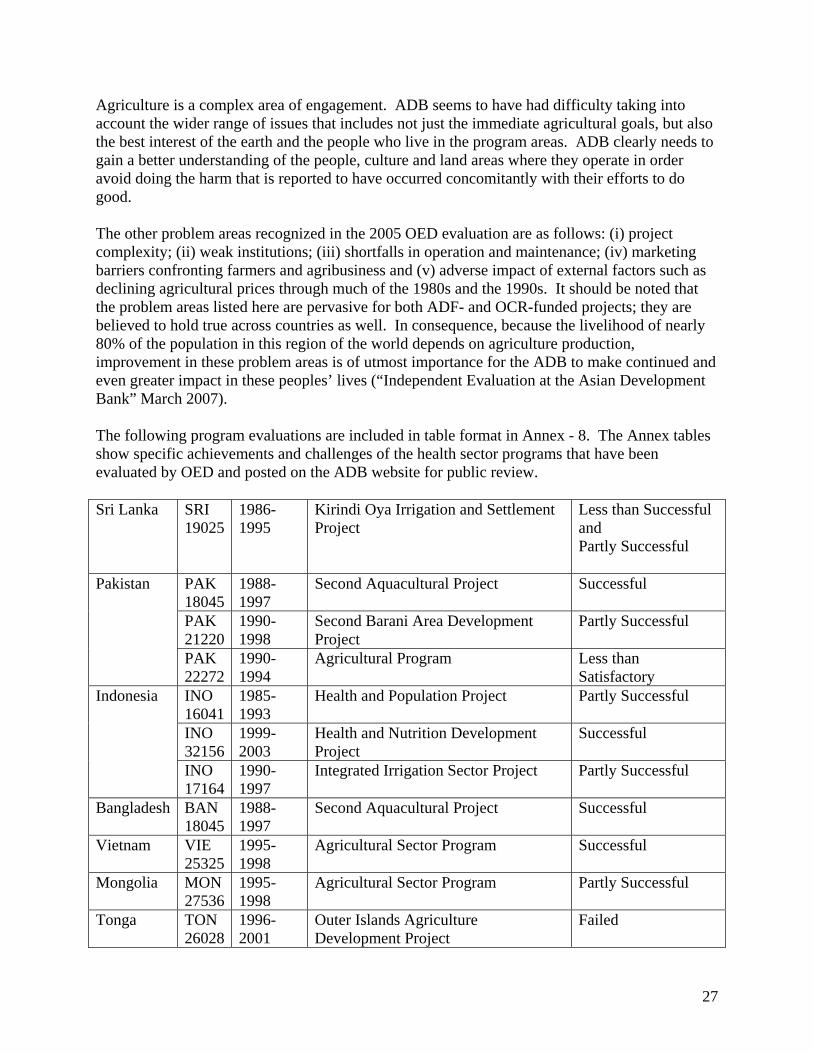
Agriculture is a complex area of engagement. ADB seems to have had difficulty taking into account the wider range of issues that includes not just the immediate agricultural goals, but also the best interest of the earth and the people who live in the program areas. ADB clearly needs to gain a better understanding of the people, culture and land areas where they operate in order avoid doing the harm that is reported to have occurred concomitantly with their efforts to do good. The other problem areas recognized in the 2005 OED evaluation are as follows: (i) project complexity; (ii) weak institutions; (iii) shortfalls in operation and maintenance; (iv) marketing barriers confronting farmers and agribusiness and (v) adverse impact of external factors such as declining agricultural prices through much of the 1980s and the 1990s. It should be noted that the problem areas listed here are pervasive for both ADF- and OCR-funded projects; they are believed to hold true across countries as well. In consequence, because the livelihood of nearly 80% of the population in this region of the world depends on agriculture production, improvement in these problem areas is of utmost importance for the ADB to make continued and even greater impact in these peoples’ lives (“Independent Evaluation at the Asian Development Bank” March 2007). The following program evaluations are included in table format in Annex - 8. The Annex tables show specific achievements and challenges of the health sector programs that have been evaluated by OED and posted on the ADB website for public review. Sri Lanka SRI
19025 1986-1995
Kirindi Oya Irrigation and Settlement Project
Less than Successful and Partly Successful
PAK 18045
1988-1997
Second Aquacultural Project Successful
PAK 21220
1990-1998
Second Barani Area Development Project
Partly Successful
Pakistan
PAK 22272
1990-1994
Agricultural Program Less than Satisfactory
INO 16041
1985-1993
Health and Population Project Partly Successful
INO 32156
1999-2003
Health and Nutrition Development Project
Successful
Indonesia
INO 17164
1990-1997
Integrated Irrigation Sector Project Partly Successful
Bangladesh BAN 18045
1988-1997
Second Aquacultural Project Successful
Vietnam VIE 25325
1995-1998
Agricultural Sector Program Successful
Mongolia MON 27536
1995-1998
Agricultural Sector Program Partly Successful
Tonga TON 26028
1996-2001
Outer Islands Agriculture Development Project
Failed

28
Nepal NEP 25361
1998-2000
Second Agricultural Program Successful
IX. Conclusion The Asian Development Bank believes that lending to social sectors including health is critical for tackling the problem of poverty in Asia and the Pacific. ADB has shown some ability to combine a health systems approach with a developmental approach in order to address the health needs of poor and vulnerable populations in a way that effects actual change and improvements in the lives and livelihoods of people. A necessary step in this process has been for ADB to move from vertical programs, as demonstrated by a primary focus being on large infrastructure investments in the early years, towards a more integrated approach focusing on building system capacity in countries. An analysis of ADB’s lending portfolio for the decade 1996-2005 shows that, in real terms, its public sector loan portfolio declined by 28%, its OCR lending decreased by 22% and its ADF lending declined by 42%. ADB lending in nominal terms has remained practically flat during this period except for a brief spike during the Asian financial crisis. Even though health, nutrition and social protection as well as agriculture are stated to be key focus areas for the ADB, this is not reflected in their lending practices. For the decade 1995-2006, annual lending to health, nutrition and social protection averaged 3.8% and ranked ninth out of ten lending categories while agriculture ranked fifth. More than half the loans were approved for transport and communication, energy and finance. In comparison, the social sector which comprises education, health and nutrition and social protection received only 9% of total approved loans. The success rate for health projects was only 55%. With 2.9% of its total lending committed to health sector initiatives over the most recent 3-year period for which data were available, ADB lending to the health sector is generally on par with that of the Inter-American Development Bank (2%) and the African Development Bank (4.4%). World Bank clearly emerged as the key lending institution for health sector programs with its average yearly commitment to the health sector of $ 512 million US Dollars, which represents 31% of its total funding. For World Bank, health sector lending ranks second out of ten lending categories. However, when education, social protection and health are collapsed together, ADB clearly falls below the other institutions in the proportion of funds committed and this phenomenon is not explained by GNI per capita for the region. The agriculture sector accounts for 25% of the GDP of developing countries and nearly 70% of total employment. The ADB is heavily vested in liberalizing the agricultural sectors in developing countries through farm privatization, price liberalization and the promotion of free markets. While ADB lending to the agriculture sector has met with successes, it also has its share of problems. The success rate for agriculture projects was just 52% and ADB’s own internal assessment shows continued problems with inadequate project design, short falls in operations and implementation, inability to address barriers confronting farmers and agribusiness, and mitigating the impact of external factors such as declining global prices for agriculture products. The ADB also has come in for frequent criticism from organizations such

29
as the NGO Forum on the ADB and Greenpeace. The primary reason for these criticisms has been the damage to the environment caused by ADB projects and lack of attention paid to the adverse impact on indigenous populations and the over emphasis of the ADB on liberalization as the preferred option to spur growth of the agriculture sector. In spite of demonstrating that its change in policy and focus led to improved health outcomes, ADB has been unable to increase its lending to the health sector. The reasons for this are many including a lack of demand for health sector investments from member, the non-competitiveness of ADB funding mechanisms, lack of internal capacity to design and manage complex health programs and projects and the fact that the ADB does not have any comparative advantage in this sector. An important strength of the ADB is its commitment to transparency which has translated into the establishment of an independent internal evaluation unit. Quite often the assessment of this unit has differed from that of the projects internal assessment. The ADB also has shown a willingness to act on the recommendations emerging from these evaluations. What we found surprising was the fact that, in many instances, the ADB has been able to identify the underlying causes for poor performance and their solutions but has been unable to translate these into action. Some such examples include the need to develop and implement alternative financing strategies, increase dialogue with key stakeholders including civil society groups, establish a benefit monitoring and evaluation system and invest in human capacity development. While a much more in-depth analysis will be needed to identify the reasons for this, we posit that this could be a result of the rigidity of its internal management structure, the level of influence a limited number of key members have in determining ADB programs and policies, and a lack of internal capacity in critical skill areas. In conclusion, while ADB continues to be an important multi-lateral development finance institution with a strong commitment to address poverty in the Asia and Pacific region, it lacks the internal capacity to be a leader in critical areas of development lending and it appears unable to increase its lending to the social sector.

30
X: References Asian Development Bank. Special Evaluation Study on ADB Policy for the Health Sector, http://www.adb.org/Documents/Reports/Evaluation/sst-reg-2005-04.pdf, ADB, 2005. Asian Development Bank. Annual Report, http://www.adb.org/documents/reports/annual_report/2001/default.asp, ADB 2001. Asian Development Bank. ADB Operations Manual, Section D12/BP http://www.adb.org/Documents/Manuals/Operations/OMD12.pdf, ADB 2007. Asian Development Bank. Annual Report on Loan and Technical Assistance Portfolio Performance http://www.adb.org/Documents/Reports/Portfolio_Performance/2006/LTAPP.asp, ADB 2005. Asian Development Bank. Lending Portfolio, http://www.adb.org/Documents/Reports/Portfolio_Performance/2006/LTAPP.asp, ADB 2005. Asian Development Bank. ADB Policy for the Health Sector, http://www.adb.org/Documents/Evaluation/Learning-Curves/SES/LC-Policy-Health-Sector.pdf, ADB, 2007. Asian Development Bank. Fighting Poverty through Better Health Care, http://www.adb.org/Documents/Reports/ADI/Health/default.asp, ADB, 2001. Asian Development Bank. Learning Curves: ADB Interventions on Nutrition and Food Fortification, http://www.adb.org/Documents/Evaluation/Learning-Curves/SES/LC-Nutrition-Food-Fortification.pdf, ADB, 2007. Asian Development Bank. International Trade in Agri-Food: Recipes for Success”: Remarks by Jin Liqun, Vice President, Operations, http://www.adb.org/Documents/Speeches/2004/ms2004029.asp, ADB, 2004. Asian Development Bank. Independent Evaluation at the Asian Development Bank, http://www.adb.org/Evaluation/, ADB, 2007. Asian Development Bank. Sector Assistance Program Evaluation for the Agriculture and Natural Resources Sector in the Laos People’s Democratic Republic, http://www.adb.org/Documents/Reports/SAPE/LAO/sap-lao-2005-17/sape-lao.asp, ADB, 2005. Macan-Markar, M. Environment: UNEP Faults Asian Development Bank Project, http://ipsnews.net/news.asp?idnews=38568, July 17, 2007. NGO Forum on ADB. ADB: 40 Years of Debt, Poverty and Pollution” May 2007, http://www.forum-adb.org/

31
International River Network, “IRN’s Nam Theun 2 Campaign” http://www.irn.org/, IRN, 2007. Asian Development Bank. Enhancing the Independence and Effectiveness of the Operations Evaluation Department, http://www.adb.org/Documents/Reports/ADF/enhancing_independence_final.pdf, ADB, 2003. Asian Development Bank. Project Performance Evaluation Report for the Outer Islands Agriculture Development Project in the Kingdom of Tonga, http://www.adb.org/Documents/PPERs/TON/PPER-TON-26028.asp, ADB, 2006.
32
XI. Annex Section 1. Basic Information of the Developing Member Countries 2. Sectors and their various sub-sectors 3. Organizational Chart 4. Technical Assistance by Sector 5. Health Sector Loans 6. Indonesia Health, Nutrition and Social Protection Sector Program Summary 7. ADB Independent Evaluation Background 8. Health Sector Program Evaluation Tables 9. Agriculture Sector Program Evaluation Tables

33
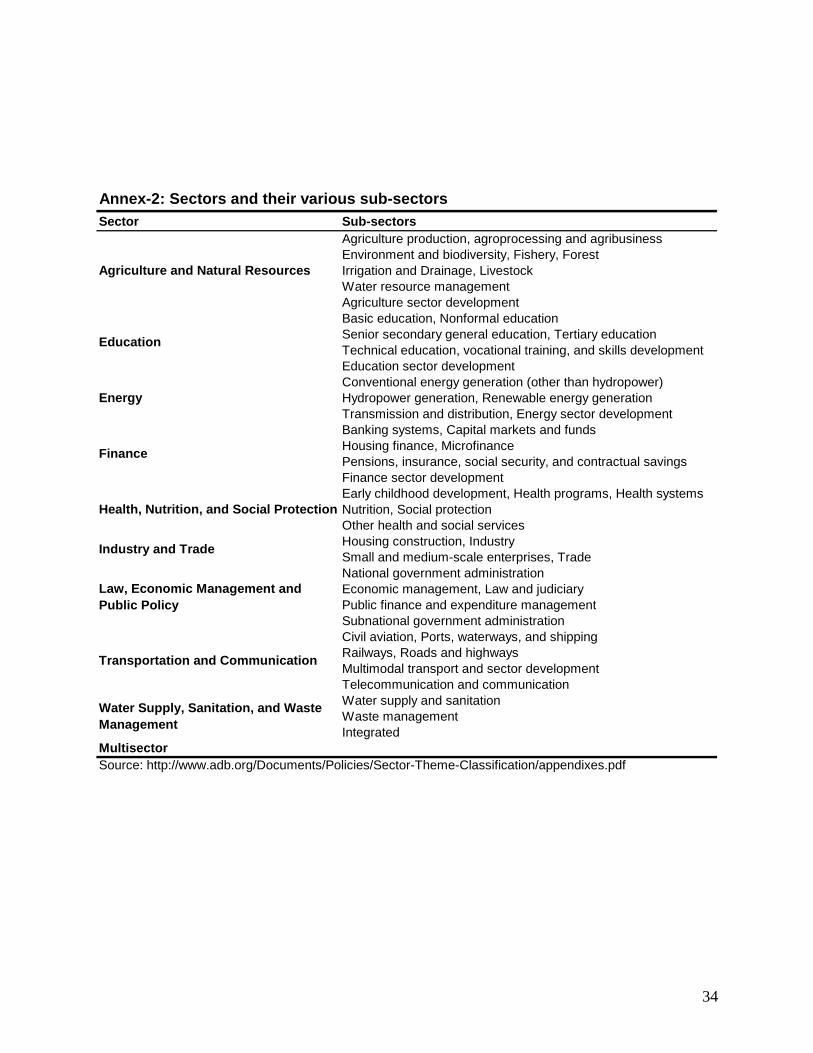
34
Sector Sub-sectors Agriculture production, agroprocessing and agribusiness Environment and biodiversity, Fishery, Forest Irrigation and Drainage, LivestockWater resource management Agriculture sector development Basic education, Nonformal education Senior secondary general education, Tertiary education Technical education, vocational training, and skills development Education sector development Conventional energy generation (other than hydropower) Hydropower generation, Renewable energy generation Transmission and distribution, Energy sector development Banking systems, Capital markets and funds Housing finance, Microfinance Pensions, insurance, social security, and contractual savings Finance sector development Early childhood development, Health programs, Health systems Nutrition, Social protection Other health and social services Housing construction, Industry Small and medium-scale enterprises, TradeNational government administration Economic management, Law and judiciary Public finance and expenditure management Subnational government administration Civil aviation, Ports, waterways, and shipping Railways, Roads and highwaysMultimodal transport and sector development Telecommunication and communication Water supply and sanitation Waste managementIntegrated
Multisector Source: http://www.adb.org/Documents/Policies/Sector-Theme-Classification/appendixes.pdf
Water Supply, Sanitation, and Waste Management
Annex-2: Sectors and their various sub-sectors
Health, Nutrition, and Social Protection
Industry and Trade
Law, Economic Management and Public Policy
Transportation and Communication
Agriculture and Natural Resources
Education
Energy
Finance

35
Annex 3: Organizational Chart http://www.adb.org/About/ADB_Organization_Chart.pdf

36
Annex 4: Technical Assistances by Sector

37
Annex 5: Health Sector Loans

38
Annex 6: Indonesia Health, Nutrition and Social Protection Sector Program Summary

39
Annex 6, Continued

40
Annex 7: ADB Independent Evaluation Background In 1978, the Asian Development Bank created a Postevaluation office. Its job was to assess whether the actual benefits of completed projects were in line with those expected at its appraisal and if this was not the case, to provide reasons for such a divergence. Thirty years later, the function of operations evaluation at the ADB has clearly evolved. Back then, its purpose was mostly to record history, whereas today it helps shape the decision making process throughout the project cycle through a two-tier evaluative process (“Independent Evaluation at the Asian Development Bank” March 2007). Today, all projects funded by the ADB are evaluated in terms of their development effectiveness. Evaluation includes two levels: program self-evaluation and independent evaluation. All projects are self-evaluated by the relevant ADB operations department in a mid-term review or project completion report (PCR). The person responsible for the self-evaluation report is the one responsible for designing and/or implementing the project under review (www.adb.org). These evaluations are publicly disclosed and are made available on ADB’s Internet site. More importantly, a proportion of completed and on-going projects are evaluated by ADB’s Operation Evaluation Department (OED). Because the OED reports directly to the Development Effectiveness Committee governed by the ADB’s Board of Directors and not to ADB management, its reports are considered to be independent (“Enhancing the Independence and Effectiveness of the Operations Evaluation Department” November 2003). This independence is achieved by maintaining high standards in the following four criteria: (i) behavioral autonomy, (ii) avoidance of conflicts of interest, (iii) insulation from external influence, and (iv) organizational independence, referring to the afore-mentioned fact that the OED lies outside the management function of the programs it evaluates (Asian Development Bank “Enhancing the Independence and Effectiveness of the Operations Evaluation Department” November 2003, pgs. 3-4). In fact, it is not very uncommon for the OED to view a project in quite a different way from what the initial PCR describes. For proof of this, one need only peruse the OED’s “Project Performance Evaluation Report for the Outer Islands Agriculture Development Project in the Kingdom of Tonga (July 2006)” whereby the OED explicitly counters the initial PCR findings that one of its projects was successful. The high credibility inherent in the OED’s reports is ensured by their maintaining what the ADB refers to as the three “I”s: Integrity and quality of analysis, Impartiality and transparency, and Independence of the evaluation unit (www.adb.org). The attainment of these three ideals, most notably its independence feature, is what makes the OED reports the more critical and valuable of the two evaluation measures--and hence what will be solely focused upon below. Like the self-evaluation reports mentioned above, the OED reports are publicly disclosed and are made available on the OED’s website (with some exclusions wherever confidential, private sector operations are concerned). This feature positively illustrates ADB’s transparency: how it independently reviews its operations and then publicly reports its findings and recommendations.
41
Annex 7, Continued OED evaluations are utilized to facilitate learning from past successes and failures, as well as to ensure proper accountability (“Enhancing the Independence and Effectiveness of the Operations Evaluation Department” November 2003). The Bank explicitly states that the lessons “identified” in these evaluations are used to improve the effectiveness of ongoing and future operations, so as to maximize contributions to the development of ADB’s developing member countries (DMCs) (www.adb.org, retrieved 8/17/07). As of December 2006, out of 1,062 ADB-funded projects evaluated and rated by the OED, 65% were recognized as successful, 27% as partly successful, and 8% as unsuccessful (http://en.wikipedia.org/wiki/Asian_Development_Bank). The trend in terms of what percentage of its funded projects are deemed successful is clearly on the up-swing, partly as a result of the “lessons the Bank has learned” over the years through its OED evaluations. During the 1980s, the ADB’s project success rate rang in at 58%, and its latest figures show that during the 1990s this number has risen to 71% (“Independent Evaluation at the Asian Development Bank” March 2007). Before moving on and taking a closer look at recent OED evaluations in the health and agriculture sectors, a few additional remarks should be made pertaining to ADB’s success rates (However, one should note that because it takes approximately 7 or more years to complete and evaluate a program after initial Board approval, the most current data pertains to projects begun in the year 1997 (“Independent Evaluation at the Asian Development Bank” March 2007). First, before 1990, the success rates of Asian Development Fund (ADF)-funded projects were considerably lower and much more volatile than those funded by ordinary capital resources (OCR). However, beginning in the 1990s, the ADF and OCR ratings have converged and both have improved. This is a positive and somewhat surprising finding given the inherent economic challenges faced by countries that are ADF-eligible (Asian Development Bank “Independent Evaluation at the Asian Development Bank” March 2007, pg. 11). Second, project performance has varied more significantly by sector than by country category (i.e. degree of eligibility for ADF funding), meaning that both OCR- and ADF-funded projects generally perform similarly in the same sectors (“Independent Evaluation at the Asian Development Bank” March 2007) —however this is not so true of the social infrastructure sector, which health related programs are a subsector of. Throughout the 1970s, 80s, and 90s, OCR-funded projects within this sector have been consistently rated as a whole as being more successful than its ADF-funded counterparts (Asian Development Bank “Independent Evaluation at the Asian Development Bank” March 2007, pg. 18). Social infrastructure, which includes a diverse group of subsectors (urban development, water supply and wastewater treatment, sanitation, education, and health and population), had a 72% success rate during the 1990s. This was a great improvement over its 1980s success rate of 48%. Among its ADF-funded projects, health and population programs had a 50% success rate during the 1990s. As a means for comparison with regards to sector analysis, during the 1990s
42
Annex 7, Continued the ADB had its highest success rates with energy and transport/communication projects with scores reaching 87% for both. On the other hand, the agriculture sector rates as one of its least successful at 52%. The good news, however, is that agriculture’s success rate has improved with each succeeding decade. In the 1970s, its success rate was 37% and during the 1980s it rose to 47% (“Independent Evaluation at the Asian Development Bank” March 2007).
43
Annex 8: Health Sector Program Evaluation Tables

44

45

46

47
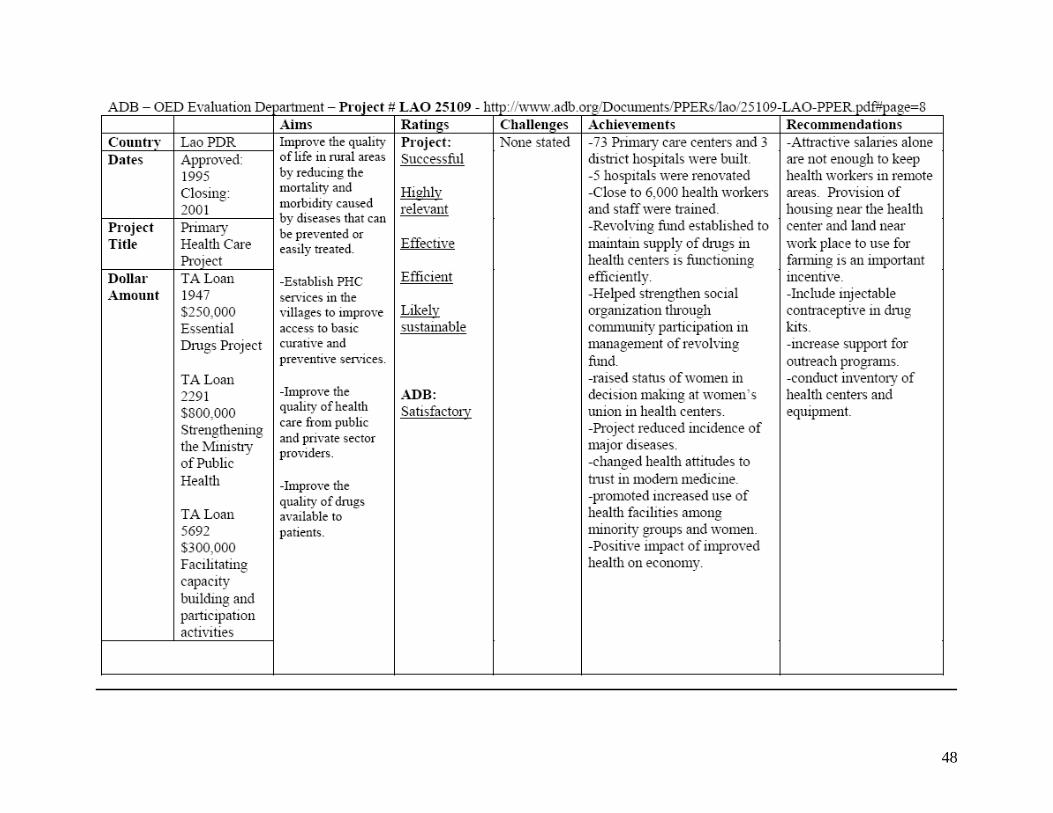
48

49
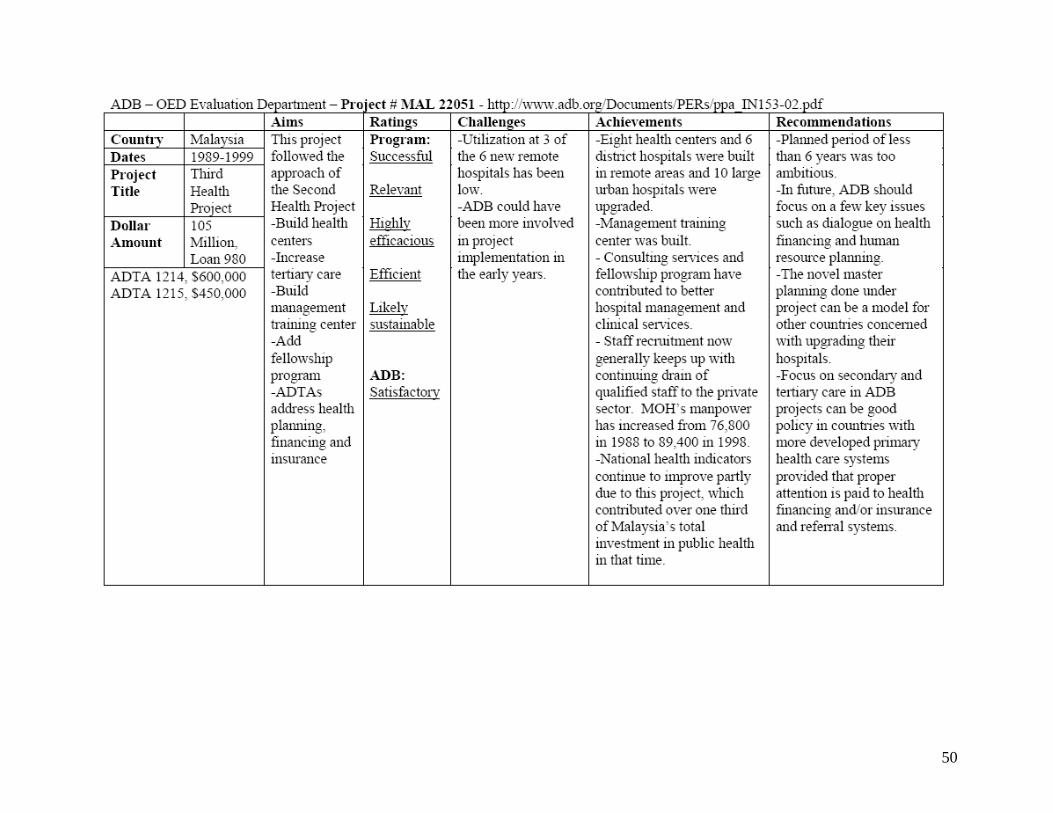
50

51

52

53
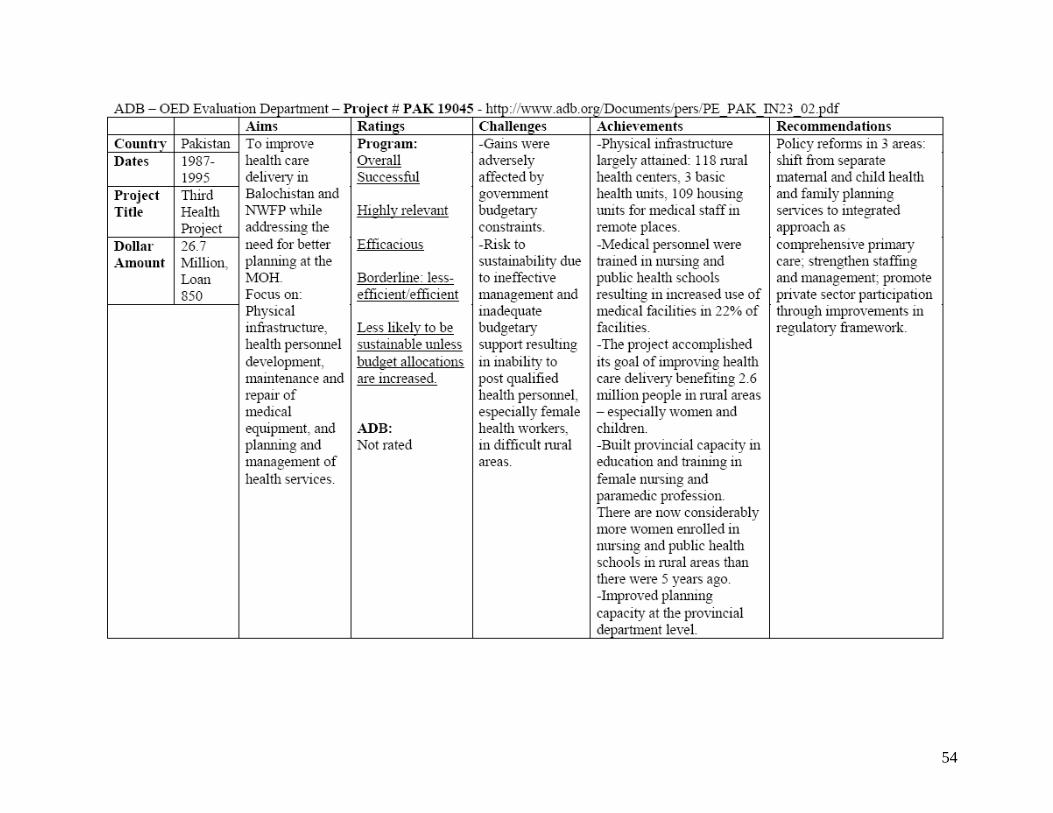
54

55

56
Annex 9: Agriculture Sector Program Evaluation Tables

57

58

59

60
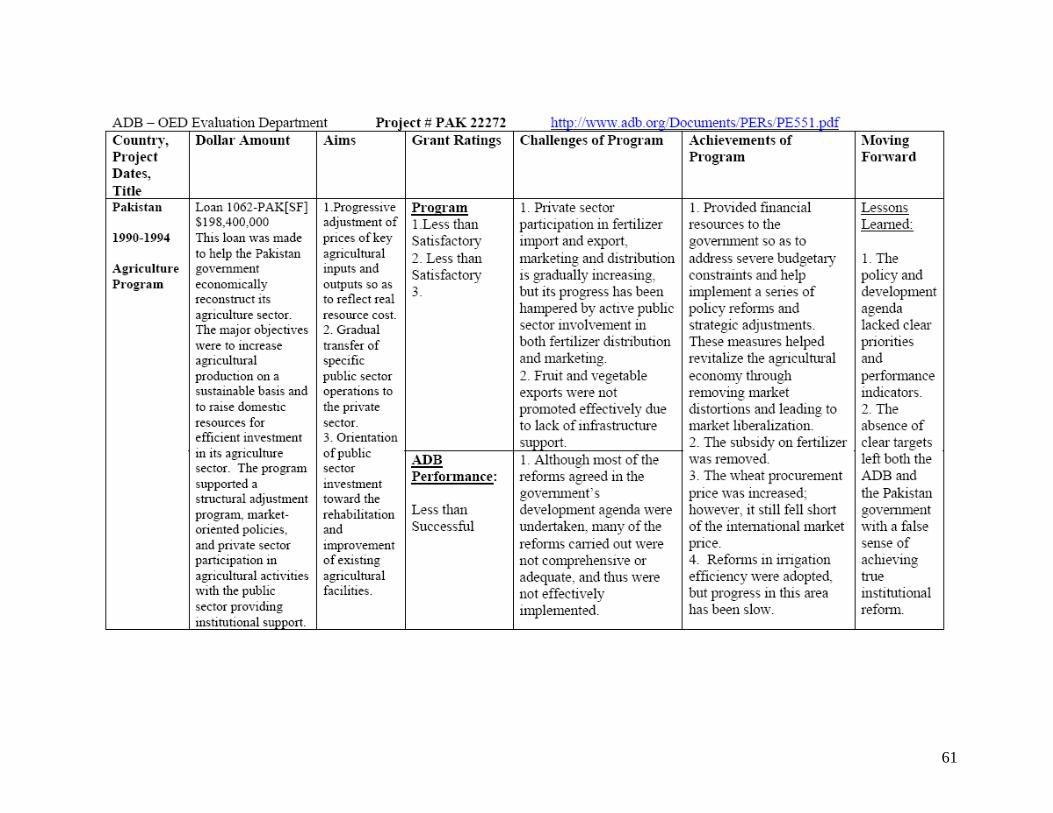
61

62

63

64

65