Draft Baseline Scenarios for - European...
88
Markus Amann, Janusz Cofala, Zbigniew Klimont, Wilfried Winiwarter, Wolfgang Schöpp, Frantisek Gyarfas, Imrich Bertok Draft Baseline Scenarios for CAFE CAFE Steering Group Brussels, May 17-18, 2004
Transcript of Draft Baseline Scenarios for - European...

Markus Amann, Janusz Cofala, Zbigniew Klimont, Wilfried Winiwarter, Wolfgang Schöpp, Frantisek Gyarfas, Imrich Bertok
Draft Baseline Scenariosfor
CAFE
CAFE Steering GroupBrussels, May 17-18, 2004

Integrated assessment in CAFE
Energy/agriculture projections
Environmental targets
OPTIMIZATION
Driving forces
BASELINE PROJECTION
Emission control options
Emissions Costs
Atmospheric dispersion
Health and environmental impacts

Preparation of input data

Bilateral consultationsMain issues
Energy projections:• Discrepancies of year 2000 energy statistics• Comments on PRIMES projections
– Obvious discrepancies– Differences in expectations
Emission calculations:• Review of year 2000 emission inventory• Penetration rates of control measures• Emission control potentialfor • SO2, NOx, VOC, NH3, PM10/2.5

Bilateral consultations (1)
-05 Dec 03 – 23 Mar 0422-3 Oct 03EUROPIA--430-31 Oct 03EURELECTRIC
--Y30 Mar 04 - 13 Apr 0454-5 Feb 04Spain
Y-Y19 Feb, 03 Mar - 15 Mar, 06 Apr 04
826-28 Jan 04UK
YYY29 Jan, 09 Mar - 04 Apr 04322-23 Jan 04Sweden-YY31 Mar 04 - 2-15 Apr 0458-9 Jan 04France
-YY19 Jan, 15 Feb - 02 Apr 04215-16 Dec 03Italy--1012 Dec 03ACEA
Y-Y19 Dec - 27 Feb, 07Apr 04325 Nov 03Czech Republic--Y19 Dec 03 - 23 Mar 04420-21 Nov 03Germany----114 Nov 03Hungary
Y--08 Oct 03--LatviaYY-16 Jan 04--Denmark
Agr. scen
Energy scenario
Comments PRIMES
Comments receivedNo of experts
Consultation meeting date
Country or organization
Red numbers indicate delivery after deadline

Bilateral consultations (2)
--Y22 Mar 04315 Mar 04Slovakia
---17,18 Mar 04 - 07 Apr 04217-18 Mar 04Poland
YY-24,29 Mar 04 - 01, 08 Apr 04222 Mar 04Slovenia
Y-Y16 Mar 04 - 02,08,18 Apr 04425-26 Mar 04Netherlands
10714219419 + 4
---17 Mar 04212 Mar 04Estonia
--Y24 Mar 04210 Mar 04Lithuania
-(Y)Y19,25 Mar 04 - 19 Apr 0438-9 Mar 04Finland
---38 Mar 04ESVOC
Y-Y12,19 Mar 0424-5/19 Mar 04Ireland
Y--24 Feb - 18,19 Mar, 19 Apr 041123 Feb 04Austria
-YY08 Mar - 2-13 Apr, 06 Apr 04716-17 Feb 04Belgium
YYY27 Feb, 03,05 Mar - 08 Apr 04512-13 Feb 04Portugal
Agr. . scen
Energy scenario
Comments PRIMES
Comments receivedNo of experts
Consultation meeting date
Country or organization
Red numbers indicate delivery after deadline

CAFE energy baseline projections
• Two draft baseline projections – available– include PRIMES numbers plus additional assumptions from
national submissions (e.g., share of LDTs in freight transport, fuel use by off-road vehicles and maritime activities, corrections for fuel used outside EMEP area)
• National projections - will be implemented by June– Currently available for eight countries, some of them need to
be completed or re-formatted
• Revised PRIMES projection (with climate) by June
Approach for baseline emission projections
• Match nationally reported emission inventories for 2000– Problem: for some countries important differences between
subsequent submissions (e.g., to CLRTAP, NEC, new national total different by > 10%)
– Values reported to CLRTAP plus changes documented during consultations taken into account
• Extrapolate penetration rates of control measures up to 2020– Takes international and national legislation into account– Done together with national teams to also include “current
practices”
Transport emissions - approach (1)
• Exhaust emissions – fuel use from PRIMES
• Non-exhaust emissions – veh-km (derived from fuel use)
• Turnover of fleet taken from national estimates
• National emission factors applied where available (Auto/Oil estimates modified during consultations)
• Efficiencies of EURO-stages based on Auto/Oil info plus other sources (TREMOD, Austrian model, RICARDO - for EURO 5/6)
Transport emissions - approach (2)
• Higher NOx emission factors for trucks considered (ARTEMIS Project, report by TU Graz, 2003),generates inconsistencies with some national 2000 emission inventories
• Other findings of ARTEMIS not included
• Data for off-road sources from EGTEI
• Consistency with TREMOVE not yet established
• Further calibration and updates is needed when new data become available

Next steps
End of May 2004• Deadline for further comments on emissions from MS
June 2004• Incorporate national scenarios• Settle feedbacks on emission scenarios• Revised PRIMES scenario (with climate measures)
taking into account country comments
September 2004• Presentation of final CAFE baseline scenarios• Start first set of policy scenarios

Draft baseline emission projections
Energy projections

Energy use per fuel EU-15 [PJ]
0
20000
40000
60000
80000
2000 2005 2010 2015 2020
No further climate measures With climate measures
0
20000
40000
60000
80000
2000 2005 2010 2015 2020
Solid fuels Liquid fuels Natural gas Renewable Nuclear Difference to "no further climate measures"

Energy use per fuelNew Member States [PJ]
0
2000
4000
6000
8000
10000
2000 2005 2010 2015 2020
No further climate measures With climate measures
0
2000
4000
6000
8000
10000
2000 2005 2010 2015 2020
Solid fuels Liquid fuels Natural gas Renewable Nuclear Difference to "no further climate measures"

Energy use per sectorEU-15 [PJ]
0
20000
40000
60000
80000
2000 2005 2010 2015 2020
Power generation Industry Households Transport Non-energy
No further climate measures With climate measures
0
20000
40000
60000
80000
2000 2005 2010 2015 2020
Difference to "no further climate measures"

Energy use per sectorNew Member States [PJ]
0
2000
4000
6000
8000
10000
12000
2000 2005 2010 2015 2020
Power generation Industry Households Transport Non-energy
No further climate measures With climate measures
0
2000
4000
6000
8000
10000
12000
2000 2005 2010 2015 2020
Difference to "no further climate measures"

CO2 emissionsrelative to 2000!
85%
90%
95%
100%
105%
110%
115%
2000 2010 2020 2010 2020
EU-15 NMS-10 EU-25

Agricultural projections

Animal numbers (pre-CAP reform), relative to 2000
EU-15 New Member States
0%
20%
40%
60%
80%
100%
120%
140%
2000 2005 2010 2015 20200%
20%
40%
60%
80%
100%
120%
140%
2000 2005 2010 2015 2020
Cattle Pigs Chicken Other animals

SO2 emissions
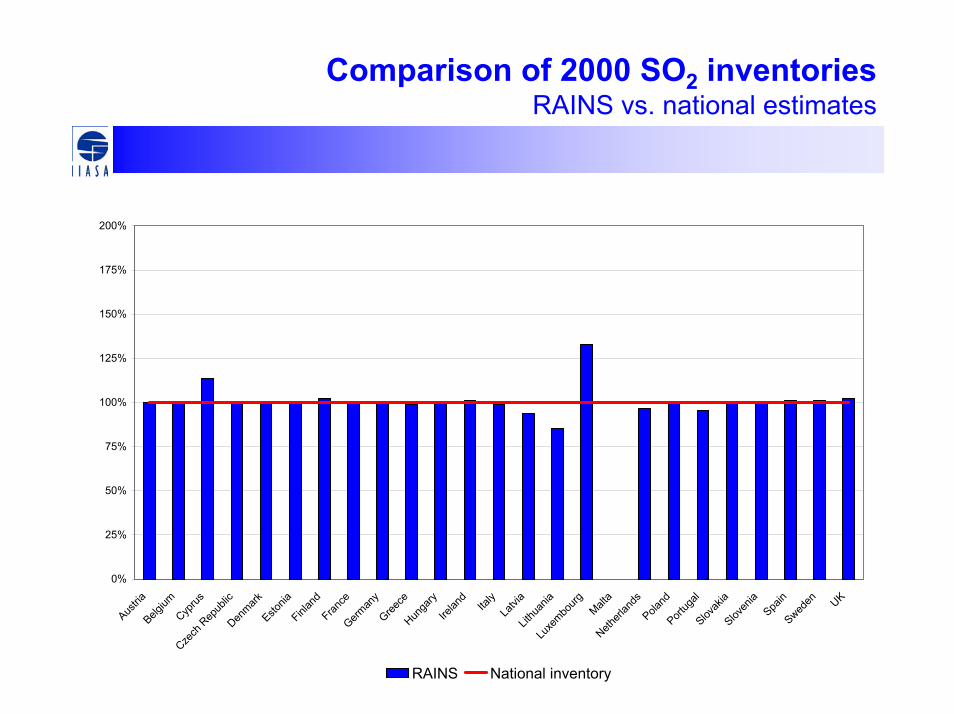
Comparison of 2000 SO2 inventoriesRAINS vs. national estimates
0%
25%
50%
75%
100%
125%
150%
175%
200%
Austria
Belgium
Cyprus
Czech
Rep
ublic
Denmark
Estonia
Finlan
dFran
ceGerm
any
Greece
Hunga
ryIre
land
Italy
Latvi
aLit
huan
iaLu
xembo
urgMalt
aNeth
erlan
dsPola
ndPort
ugal
Slovak
iaSlov
enia
Spain
Sweden UK
RAINS National inventory

SO2 emissions
• Measures:– Large Combustion Plant Directive– S Content of Liquid Fuels Directive – Directives on quality of petrol and diesel fuels– IPPC legislation on process sources– National legislation and national practices (if stricter)

SO2 emissions by fuelEU-15 [kt]
0
1000
2000
3000
4000
5000
6000
2000 2005 2010 2015 20200
1000
2000
3000
4000
5000
6000
2000 2005 2010 2015 2020
2005 2010 2015Solid fuels Liquid fuels Natural gas Process emissions "Climate bonus"
x---------------- NEC Ceiling 3850 ktx---------------
No further climate measures With climate measures

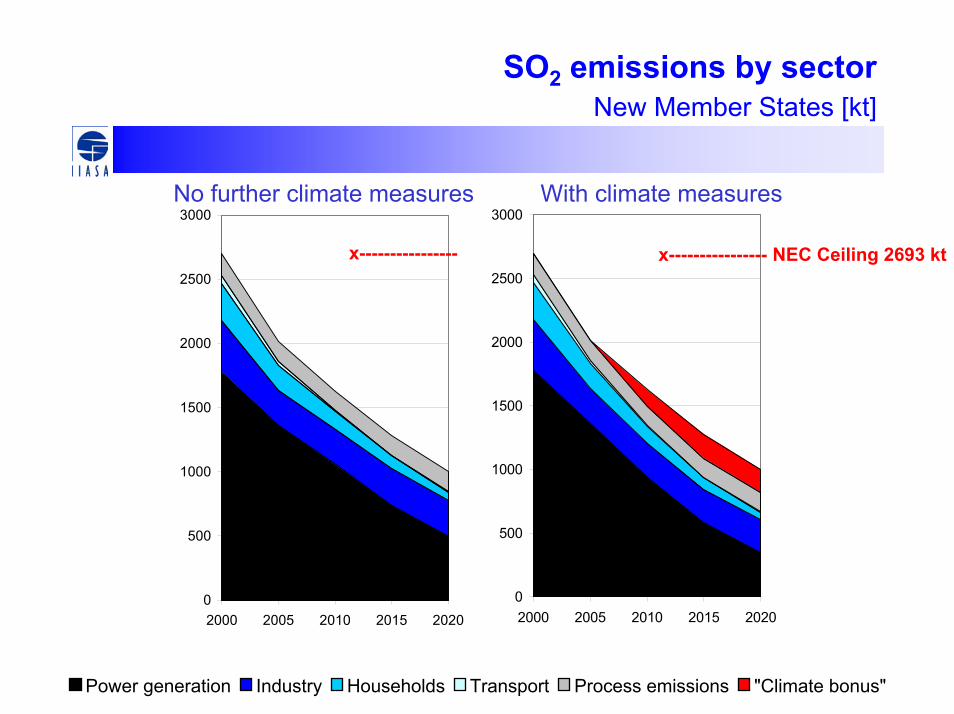
SO2 emissions by fuel New Member States [kt]
0
500
1000
1500
2000
2500
3000
2000 2005 2010 2015 20200
500
1000
1500
2000
2500
3000
2000 2005 2010 2015 2020
2005 2010 2015Solid fuels Liquid fuels Natural gas Process emissions "Climate bonus"
x---------------- NEC Ceiling 2693 ktx----------------
No further climate measures With climate measures

SO2 emissions by sector EU-15 [kt]
0
1000
2000
3000
4000
5000
6000
2000 2005 2010 2015 2020
x---------------- NEC Ceiling 3850 ktx----------------
0
1000
2000
3000
4000
5000
6000
2000 2005 2010 2015 2020
Power generation Industry Households Transport Process emissions "Climate bonus"
No further climate measures With climate measures
SO2 emissions by sector New Member States [kt]
0
500
1000
1500
2000
2500
3000
2000 2005 2010 2015 20200
500
1000
1500
2000
2500
3000
2000 2005 2010 2015 2020
Power generation Industry Households Transport Process emissions "Climate bonus"
x---------------- NEC Ceiling 2693 ktx----------------
No further climate measures With climate measures
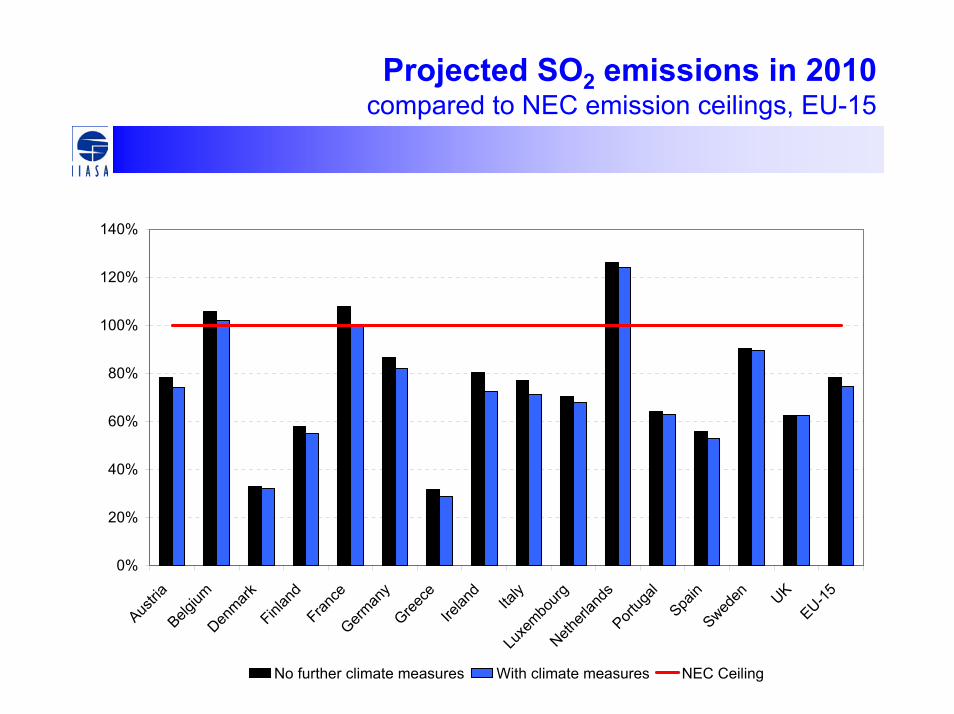
Projected SO2 emissions in 2010compared to NEC emission ceilings, EU-15
0%
20%
40%
60%
80%
100%
120%
140%
Austria
Belgium
Denmark
Finlan
dFran
ceGerm
any
Greece
Irelan
d
Italy
Luxe
mbourg
Netherl
ands
Portug
alSpa
inSwed
en UKEU-15
No further climate measures With climate measures NEC Ceiling

Projected SO2 emissions in 2010compared to NEC emission ceilings, NMS
0%
20%
40%
60%
80%
100%
120%
140%
Cyprus
Czech
Rep
ublic
Estonia
Hunga
ry
Latvi
a
Lithu
ania
Malta
Poland
Slovak
ia
Sloven
iaTota
l NMS
No further climate With climate measures NEC

NOx emissions

Comparison of 2000 NOx inventoriesRAINS vs. national estimates
0%
25%
50%
75%
100%
125%
150%
175%
200%
Austria
Belgium
Cyprus
Czech
Rep
ublic
Denmark
Estonia
Finlan
dFran
ceGerm
any
Greece
Hunga
ryIre
land
Italy
Latvi
aLit
huan
iaLu
xembo
urgMalt
aNeth
erlan
dsPola
ndPort
ugal
Slovak
iaSlov
enia
Spain
Sweden UK
RAINS National inventory

NOx emissions
Assumed measures:– LCP Directive– Auto/Oil EURO standards– Standards for motorcycles and mopeds– Legislation on non-road mobile machinery – Implementation failure of EURO-II and III for HDT– IPPC legislation on process sources– National legislation and national practices (if stricter)

NOx emissions by fuelEU-15 [kt]
0
2000
4000
6000
8000
10000
2000 2005 2010 2015 2020
2005 2010 2015Solid fuels Liquid fuels Natural gas Process emissions "Climate bonus"
x----------------
0
2000
4000
6000
8000
10000
2000 2005 2010 2015 2020
x---------------- NEC Ceiling 6519 kt
No further climate measures With climate measures

NOx emissions by fuel New Member States [kt]
0
300
600
900
1200
1500
1800
2000 2005 2010 2015 2020
2005 2010 2015Solid fuels Liquid fuels Natural gas Process emissions "Climate bonus"
x----------------
0
300
600
900
1200
1500
1800
2000 2005 2010 2015 2020
x---------------- NEC Ceiling 1800 ktNo further climate measures With climate measures

NOx emissions by sectorEU-15 [kt]
0
2000
4000
6000
8000
10000
2000 2005 2010 2015 2020
x---------------
Power generation Industry Households Transport Process emissions "Climate bonus"
0
2000
4000
6000
8000
10000
2000 2005 2010 2015 2020
x---------------- NEC Ceiling 6519 kt
No further climate measures With climate measures

NOx emissions by sectorNew Member States [kt]
0
300
600
900
1200
1500
1800
2000 2005 2010 2015 20200
300
600
900
1200
1500
1800
2000 2005 2010 2015 2020
Power generation Industry Households Transport Process emissions "Climate bonus"
x---------------- NEC Ceiling 1800 ktx----------------No further climate measures With climate measures

Projected NOx emissions in 2010compared to NEC emission ceilings, EU-15
0%
20%
40%
60%
80%
100%
120%
140%
160%
180%
200%
Austria
Belgium
Denmark
Finlan
dFran
ceGerm
any
Greece
Irelan
d
Italy
Luxe
mbourg
Netherl
ands
Portug
alSpa
inSwed
en UKEU-15
No further climate measures With climate measures NEC Ceiling

Projected NOx emissions in 2010compared to NEC emission ceilings, NMS
0%
20%
40%
60%
80%
100%
120%
Cyprus
Czech
Rep
ublic
Estonia
Hunga
ry
Latvi
a
Lithu
ania
Malta
Poland
Slovak
ia
Sloven
iaTota
l NMS
No further climate With climate measures NEC

Emissions from shipping [% of land-based EU-25 emissions]
0%
20%
40%
60%
80%
100%
120%
2000 2010 2020
NOx SO2

VOC emissions

Comparison of 2000 VOC inventoriesRAINS vs. national estimates
0%
25%
50%
75%
100%
125%
150%
175%
200%
Austria
Belgium
Cyprus
Czech
Rep
ublic
Denmark
Estonia
Finlan
dFran
ceGerm
any
Greece
Hunga
ryIre
land
Italy
Latvi
aLit
huan
iaLu
xembo
urgMalt
aNeth
erlan
dsPola
ndPort
ugal
Slovak
iaSlov
enia
Spain
Sweden UK
RAINS National inventory

VOC emissions
• Assumed measures:– Stage I Directive– Directive 91/441 (carbon canisters)– Auto/Oil EURO standards– Fuel Directive (RVP of fuels)– Solvents Directive– Product Directive (paints)– National legislation, e.g., Stage II
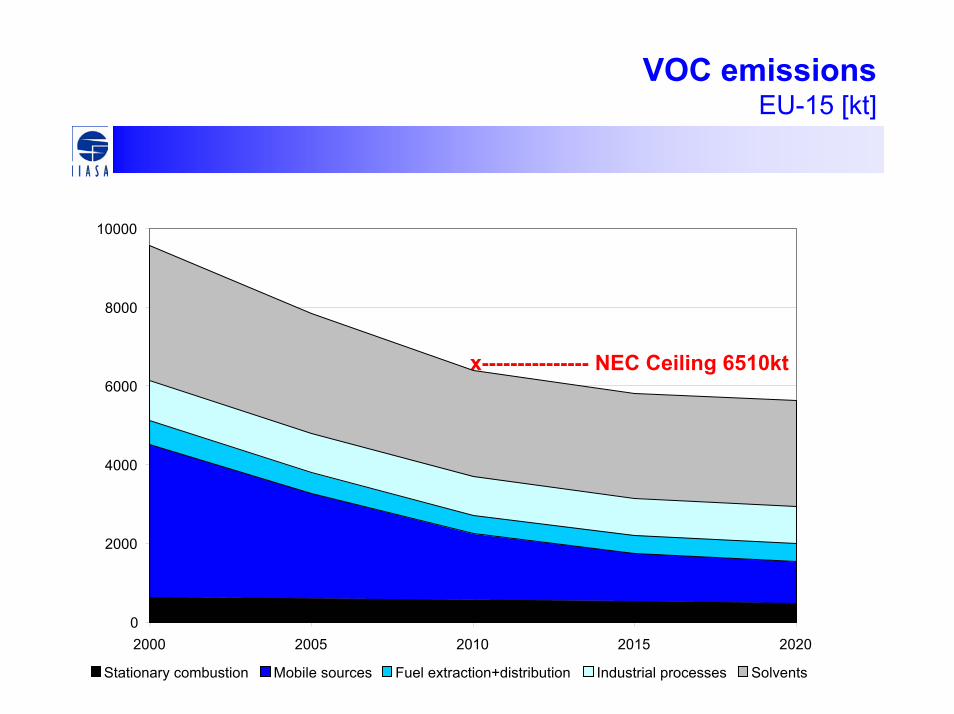
VOC emissionsEU-15 [kt]
x--------------- NEC Ceiling 6510kt
0
2000
4000
6000
8000
10000
2000 2005 2010 2015 2020
Stationary combustion Mobile sources Fuel extraction+distribution Industrial processes Solvents

VOC emissions New Member States [kt]
0
300
600
900
1200
1500
2000 2005 2010 2015 2020
Stationary combustion Mobile sources Fuel extraction+distribution Industrial processes Solvents
x--------------- NEC Ceiling 1640 kt
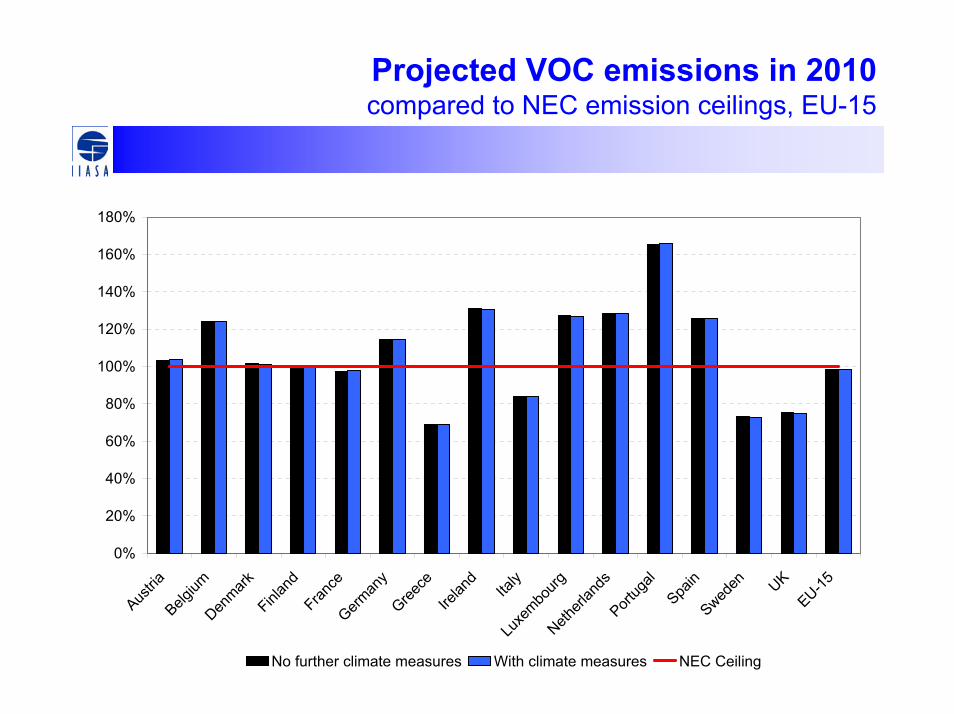
Projected VOC emissions in 2010compared to NEC emission ceilings, EU-15
0%
20%
40%
60%
80%
100%
120%
140%
160%
180%
Austria
Belgium
Denmark
Finlan
dFran
ceGerm
any
Greece
Irelan
d
Italy
Luxe
mbourg
Netherl
ands
Portug
alSpa
inSwed
en UKEU-15
No further climate measures With climate measures NEC Ceiling

Projected VOC emissions in 2010compared to NEC emission ceilings, NMS
0%
20%
40%
60%
80%
100%
120%
Cyprus
Czech
Rep
ublic
Estonia
Hunga
ry
Latvi
a
Lithu
ania
Malta
Poland
Slovak
ia
Sloven
iaTota
l NMS
No further climate With climate measures NEC
NH3 emissions

Comparison of 2000 NH3 inventoriesRAINS vs. national estimates
0%
25%
50%
75%
100%
125%
150%
175%
200%
Austria
Belgium
Cyprus
Czech
Rep
ublic
Denmark
Estonia
Finlan
dFran
ceGerm
any
Greece
Hunga
ryIre
land
Italy
Latvi
aLit
huan
iaLu
xembo
urgMalt
aNeth
erlan
dsPola
ndPort
ugal
Slovak
iaSlov
enia
Spain
Sweden UK
RAINS National inventory

NH3 emissions
Assumed measures:– No EU-wide legislation– National legislations – Current practice

NH3 emissions EU-15 [kt]
0
500
1000
1500
2000
2500
3000
3500
2000 2005 2010 2015 2020
Cattle Other animals Industry Fuel combustion
x--------------- NEC Ceiling 3310 kt

NH3 emissions New Member States [kt]
0
100
200
300
400
500
600
700
2000 2005 2010 2015 2020
Cattle Other animals Industry Fuel combustion
x--------------- NEC Ceiling 866 kt

Projected NH3 emissions in 2010compared to NEC emission ceilings, EU-15
0%
20%
40%
60%
80%
100%
120%
140%
Austria
Belgium
Denmark
Finlan
dFran
ceGerm
any
Greece
Irelan
d
Italy
Luxe
mbourg
Netherl
ands
Portug
alSpa
inSwed
en UKEU-15
Pre-CAP reform scenario NEC Ceiling
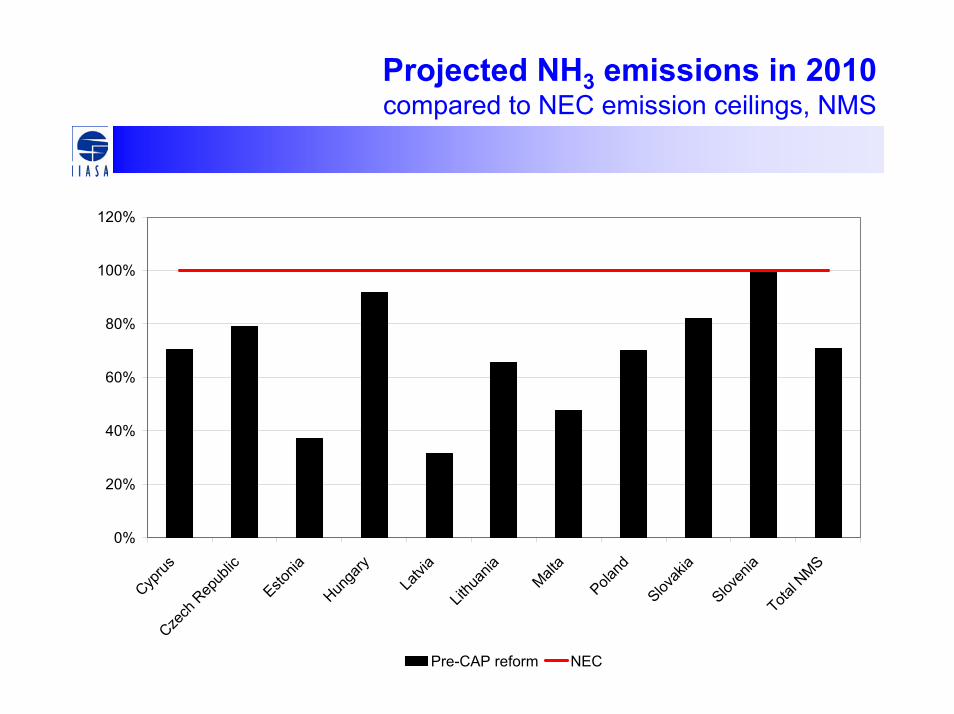
Projected NH3 emissions in 2010compared to NEC emission ceilings, NMS
0%
20%
40%
60%
80%
100%
120%
Cyprus
Czech
Rep
ublic
Estonia
Hunga
ry
Latvi
a
Lithu
ania
Malta
Poland
Slovak
ia
Sloven
iaTota
l NMS
Pre-CAP reform NEC
PM10 emissions
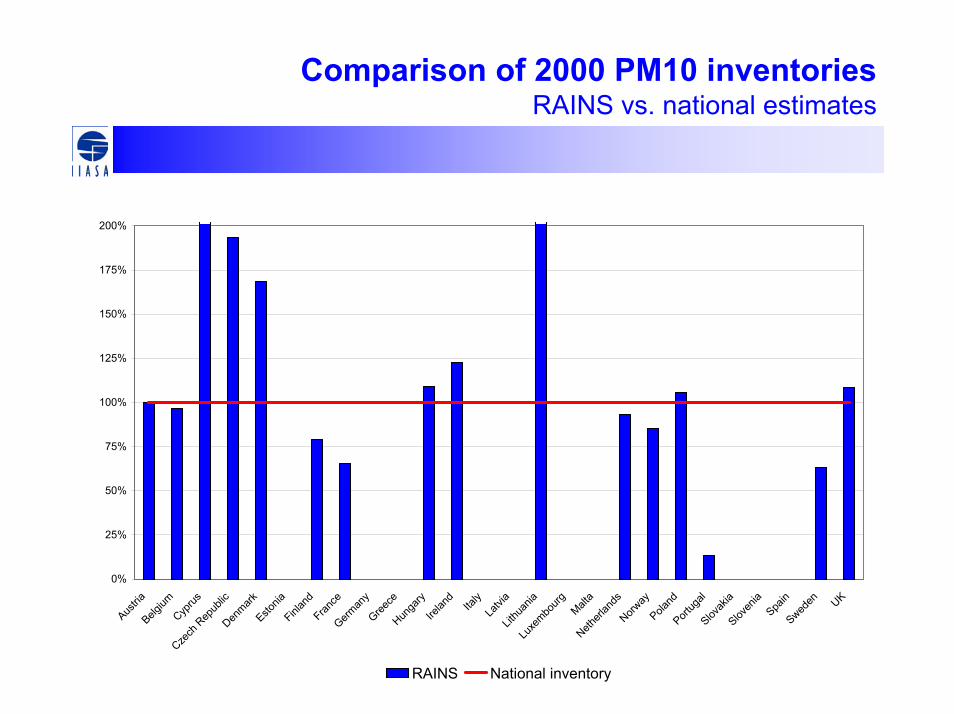
Comparison of 2000 PM10 inventoriesRAINS vs. national estimates
0%
25%
50%
75%
100%
125%
150%
175%
200%
Austria
Belgium
Cyprus
Czech
Rep
ublic
Denmark
Estonia
Finlan
dFran
ceGerm
any
Greece
Hunga
ryIre
land
Italy
Latvi
aLit
huan
iaLu
xembo
urgMalt
aNeth
erlan
dsNorw
ayPola
ndPort
ugal
Slovak
iaSlov
enia
Spain
Sweden UK
RAINS National inventory

Primary PM10 emissions by fuel EU-15 [kt]
0
400
800
1200
1600
2000
2000 2005 2010 2015 20200
400
800
1200
1600
2000
2000 2005 2010 2015 2020
Coal, oil Wood Diesel, gasoline Other "Climate bonus"
No further climate measures With climate measures

Primary PM10 emissions by fuel New Member States [kt]
Coal, oil Wood Diesel, gasoline Other "Climate bonus"
No further climate measures With climate measures
0
100
200
300
400
500
600
2000 2005 2010 2015 2020 0
100
200
300
400
500
600
2000 2005 2010 2015 2020

Primary PM10 emissions by sector EU-15 [kt]
Power generation Industry Households Transport Process emissions Waste+agriculture
0
400
800
1200
1600
2000
2000 2005 2010 2015 2020
No further climate measures With climate measures
0
400
800
1200
1600
2000
2000 2005 2010 2015 2020

Primary PM10 emissions by sector New Member States [kt]
Power generation Industry Households Transport Process emissions Waste+agriculture
No further climate measures With climate measures
0
100
200
300
400
500
600
2000 2005 2010 2015 20200
100
200
300
400
500
600
2000 2005 2010 2015 2020

PM2.5 emissions

Comparison of 2000 PM2.5 inventoriesRAINS vs. national estimates
0%
25%
50%
75%
100%
125%
150%
175%
200%
Austria
Belgium
Cyprus
Czech
Rep
ublic
Denmark
Estonia
Finlan
dFran
ceGerm
any
Greece
Hunga
ryIre
land
Italy
Latvi
aLit
huan
iaLu
xembo
urgMalt
aNeth
erlan
dsNorw
ayPola
ndPort
ugal
Slovak
iaSlov
enia
Spain
Sweden UK
RAINS National inventory

PM emissions
• Assumed measures:– LCP Directive– Auto/Oil EURO standards– Standards for motorcycles and mopeds– Legislation on non-road mobile machinery – IPPC legislation on process sources– National legislation and national practices (if stricter)
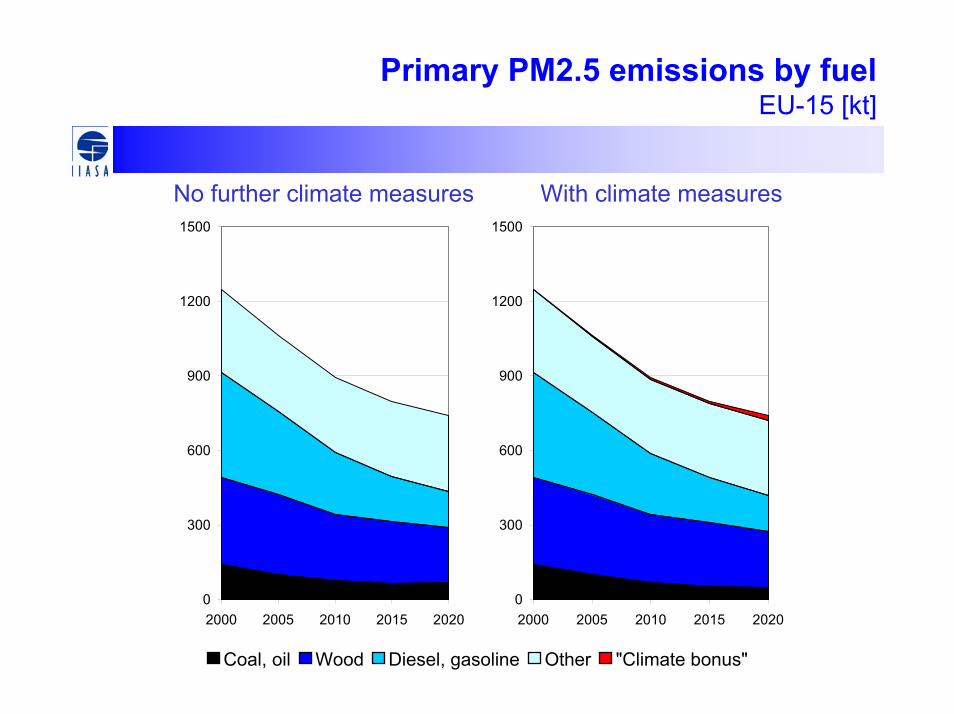
Primary PM2.5 emissions by fuel EU-15 [kt]
Coal, oil Wood Diesel, gasoline Other "Climate bonus"
No further climate measures With climate measures
0
300
600
900
1200
1500
2000 2005 2010 2015 20200
300
600
900
1200
1500
2000 2005 2010 2015 2020

Primary PM2.5 emissions by fuel New Member States [kt]
Coal, oil Wood Diesel, gasoline Other "Climate bonus"
No further climate measures With climate measures
0
100
200
300
400
2000 2005 2010 2015 2020 0
100
200
300
400
2000 2005 2010 2015 2020

Primary PM2.5 emissions by sector EU-15 [kt]
Power generation Industry Households Transport Process emissions Waste+agriculture
No further climate measures With climate measures
0
300
600
900
1200
1500
2000 2005 2010 2015 20200
300
600
900
1200
1500
2000 2005 2010 2015 2020

Primary PM2.5 emissions by sector New Member States [kt]
Power generation Industry Households Transport Process emissions Waste+agriculture
No further climate measures With climate measures
0
100
200
300
400
2000 2005 2010 2015 20200
100
200
300
400
2000 2005 2010 2015 2020

Draft conclusions
• General downwards trend in emissions caused by– Legislation on transport emissions– Further penetration of natural gas– Large Combustion Plant Directive
• Larger improvements in New Member States
• Caveats:– National energy projections might differ from PRIMES – Further validation of emission estimates necessary– More information on effects of transport emission
legislation required


Air quality impacts
Provisional estimates!
PM2.5
Contribution from anthropogenic emissions excluding secondary organic aerosols
No natural sources (soil, sea salt, biogenic, etc.) included!
Rural concentrationsAnnual mean
Average 1999 & 2003 meteorology

Anthropogenic contribution to PM2.5 2000
Rural concentrationsannual mean
[µg/m3]from known anthropogenic sources
excluding sec. org. aerosols
Emissions for 2000
Average meteorologyfor 1999 and 2003
EMEP Eulerian model

Anthropogenic contribution to PM2.5
2000 2010 2020
Rural concentrations, annual mean [µg/m3]from known anthropogenic sources excluding sec. org. aerosolsEmissions for no further climate measures scenario, Average meteorology for 1999 and 2003, EMEP Eulerian model

Inter-annual meteorological variabilityAnthropogenic contribution to PM2.5
2003 average 1999
Rural concentrations, annual mean [µg/m3]from known anthropogenic sources excluding sec. org. aerosolsEmissions for 2000, EMEP Eulerian model
Loss in life expectancy

Loss in life expectancy
2000 2010 2020Loss in average life expectancy due to identified anthropogenic PM2.5 (days)Mean meteorologyPreliminary estimates (simplified treatment of urban PM)

Loss in life expectancy due to PM2.5Inter-annual meteorological variability
2003 Mean 1999
Loss in average life expectancy (days)Due to identified anthropogenic PM2.5Emissions of 2000Preliminary estimates (simplified treatment of urban PM)

PM10
Contribution from anthropogenic emissions excluding secondary organic aerosols
No natural sources (soil, sea salt, etc.) included!
Rural concentrationsAnnual mean
Average 1999 & 2003 meteorology

Anthropogenic contribution to PM10 2000
Rural concentrationsannual mean
[µg/m3]from known anthropogenic sources
excluding sec. org. aerosols
Emissions for 2000
Average meteorologyfor 1999 and 2003
EMEP Eulerian model

Anthropogenic contribution to PM10
2000 2010 2020
Rural concentrations, annual mean [µg/m3]from known anthropogenic sources excluding sec. org. aerosolsEmissions for the “no further climate measures” scenario Average meteorology for 1999 and 2003

Ozone AOT40
Critical level for forests = 5 ppm.hours
Six months (April-September)
Average 1999 & 2003 meteorology
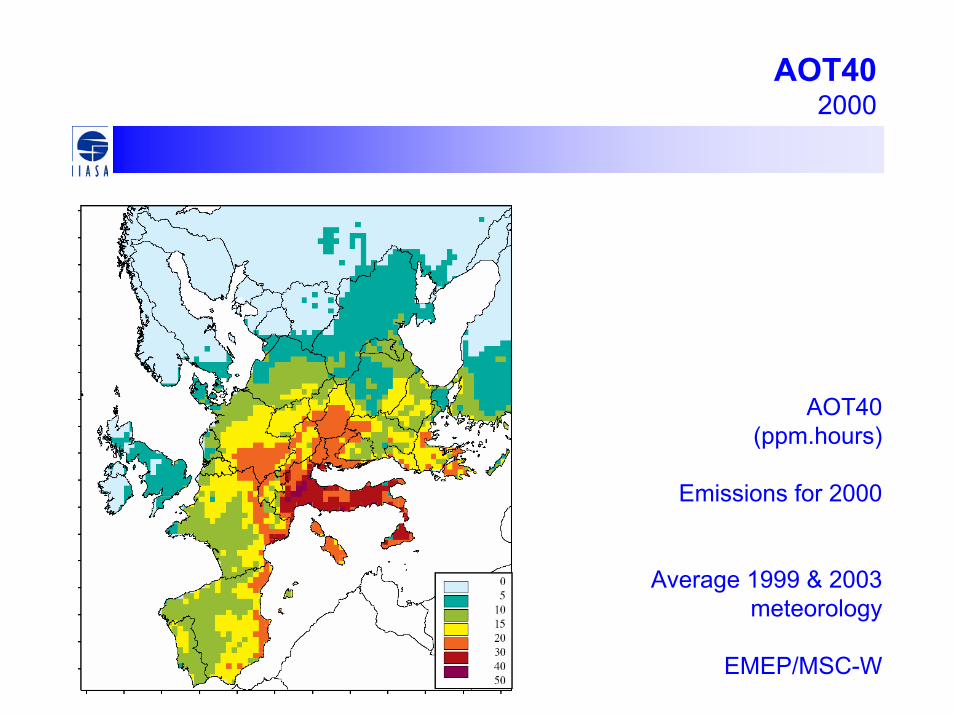
AOT402000
AOT40(ppm.hours)
Emissions for 2000
Average 1999 & 2003 meteorology
EMEP/MSC-W

AOT40
2000 2010 2020
Six months AOT40 (forests) [ppm.hours]Emissions for the “no further climate measures” scenario Average meteorology for 1999 and 2003

Ozone AOT60
Six months (April-September)
Average 1999 & 2003 meteorology

AOT60(ppm.hours)
2000 2010 2020
Mean meteorology, April-September

Acidification of forest soils
Percentage of forest areawith acid deposition above critical loads
Using ecosystem-specific deposition!
Based on preliminary critical loads data!
Average 1999 & 2003 meteorology

Excess of forest critical loads2000, Provisional estimates!
Percentage of forest areawith acid deposition above critical loads
Emissions for 2000
Using ecosystem-specific deposition!
Based on preliminary critical loads data!
Average 1999 & 2003 meteorology
EMEP/MSC-W & CCE

Excess of forest critical loads
2000 2010 2020
Percentage of forest areawith acid deposition above critical loads, using ecosystem-specific deposition, mean meteorology

Conclusions
• With decreasing pollution, also impacts are expected to decline in the future.
• However, problems will not be entirely resolved:
• PM remains serious (6 months life expectancy loss in 2020)
• Ozone: – Failure to meet old WHO guideline value in some parts of
Europe even in 2020
– More serious impacts to be expected according to new WHO findings (even with conservative interpretation)
• Acidification: Will not disappear, mainly due to NH3
• Eutrophication remains unresolved