DOCUMENT RESUME ED 048 362 TH 000 440 PUP LATE Cct 70 ... · DOCUMENT RESUME ED 048 362 TH 000 440....
15
DOCUMENT RESUME ED 048 362 TH 000 440 AUTHOR TITLE PUP LATE NOTE EDRS PRICE DESCRIPTORS ILENTIFIERS ABSTRACT Nigro, George A. A Theorem to Confirm Causal Directions in a Closed System of Five Variables. Cct 70 14p.; Paper presented at the Annual Meeting of the American Educational Rcsearch Association, New York, New York, February 1971 EDRS Price MF-$0.65 LC-$3.29 *Correlation, Educational Research, *?lathematical Models, *Multiple Regression Analysis, *Research Methodology, *Statistical Analysis, Systems Analysis *Causal Theory, Monte Carlo Methods The applicability of a mathematical theorem designed to trace causality of a three-variable path that consists of an initial cause variable, an intermediate variable, and a final-effect variable with control over other system variables is evaluated. The formula was used with a horizontal rather than a normal distributior, as had been done in an earlier study which successfully demonstrated the theorem. Horizontally-distributed random nuthbeLs (200);) were generated and substituted into five interdependent equations to produce five scores for each of 200 pseudo people. Methods and techniques, data sourceF, and results are presented. Results indicate that the model is reliable, potentially useful to the practitioner as a multivariate tool in educational research, and a possible instrument for the investigation of causality. (AE)
Transcript of DOCUMENT RESUME ED 048 362 TH 000 440 PUP LATE Cct 70 ... · DOCUMENT RESUME ED 048 362 TH 000 440....

DOCUMENT RESUME
ED 048 362 TH 000 440
AUTHORTITLE
PUP LATENOTE
EDRS PRICEDESCRIPTORS
ILENTIFIERS
ABSTRACT
Nigro, George A.A Theorem to Confirm Causal Directions in a ClosedSystem of Five Variables.Cct 7014p.; Paper presented at the Annual Meeting of theAmerican Educational Rcsearch Association, New York,New York, February 1971
EDRS Price MF-$0.65 LC-$3.29*Correlation, Educational Research, *?lathematicalModels, *Multiple Regression Analysis, *ResearchMethodology, *Statistical Analysis, Systems Analysis*Causal Theory, Monte Carlo Methods
The applicability of a mathematical theorem designedto trace causality of a three-variable path that consists of aninitial cause variable, an intermediate variable, and a final-effectvariable with control over other system variables is evaluated. Theformula was used with a horizontal rather than a normal distributior,as had been done in an earlier study which successfully demonstratedthe theorem. Horizontally-distributed random nuthbeLs (200);) weregenerated and substituted into five interdependent equations toproduce five scores for each of 200 pseudo people. Methods andtechniques, data sourceF, and results are presented. Results indicatethat the model is reliable, potentially useful to the practitioner asa multivariate tool in educational research, and a possibleinstrument for the investigation of causality. (AE)

A THEORF.Y.
TO own ro. CAUSAL DIRECTIONS
IN A CLOSED SYSTEM OF FIVE VARIABLES
By
3E0R3E A. NIGRO
Bri stc/ Community College
Fall River, Massachusetts 02720
October 1970
4;;4161Z)
V I 0IPAMMENT OR HEALTH..OUCATIONII wr.FAII2
OFFICE. OE EE UCATION
V.I.,HIS DOCLNINI HAS SEEN REPRCOUCtOExACTL/ AS RECEIVED FROM THE PERSON ORC RC.AMIATIOtt OFRGNATING IT POO+ IS CFVIEW OR OPIWONS STATED DO TIM %ICES
44SAM./ RIFF (S1.51 OIIrC,AL OFFICE OF (DuCA/.0% POS.T,Osi OR I OtACT
%Presented in Session D18s Applications of Monte Carlo Methods
:American Educational Research Associeticl Annual Meeting
Paper Sessions Synopsis, Div; A.on D
1 New York City, Nev Tor..February 5, 1971
1'4,

A THEOREM TO CONFIRM CA1:43AL DIRECTIONS
IN A CLOSED SYSTEM OF T.ITE VARIABLES
APSTRItOT
A theorem derived from a previous Uti.dy was tested in this study.
THEOREM! In a .-variable path contrasting of initial-cause variable A,intermediate variable B, and final - effect variable C, with control for othersystem variables K1
Id (3obk /al < idaablo/cwhere a and c are stepped into regrJssion to obtain beta differentials,
and
I acakbl I I3 ae kb I
< Irabkl < irbok I
fraCkbi < Irabk01 !rbe
Duplicating the previous study but with the important difference thathorizontal rather than normal distributions were used, the present studyyielded the finding that the theorem was reliable and potentially useful.
2

A THEOREM TO CONFIRM CAUSAL DIRECTIONS
IN A CLOSED SYSTEM OF FIVE, VARIABLES
George A. Nigro
Bristol Communi tv College
A paper presented at the 1969 AURA Annual Meetingl exposed a set ofinequalities based on the development of a 'bets index.' This index was proposedas a confirming device for causal directions of three-variable paths in a stepped-regreasion and correlation analysis from durmy data. These inequalities werecompletely consistent for causal directims but here inconsistent for acausaldireotions. The set was generalized to our mathematical statements of asymmetryand proposed we a theorem for t'lis paper.
THEOINEM1 In a three - variable pat consisting of initial-cause variable A,intermediate variable B, aid final effect variable C, with control for otherslaters variables
Id6cb.k/al '4(-cb.k/ol (1)
where a and c are stepped into ret-,reseion to obtain beta differentials,
16 c akb I C 72'ac kb I ' (2)
Ira° .k I < 101 davit I< Irbclo I (3)
and Ireckb I irabloc I < Irboka I (Li)
The purpose of the present paper is to report on the study to teat thetheorem in a duplication of t're previous study but with one important differencethat horizontal rather than no..,mal distributions were used. Since the theoremcould be demonstrated with r.ormal distributions, would dispGraions extending th:tinput data to the limits of 'horizontal (Retributions upset the theorem?
One might argue intuitively that the theorem should be robust if it is tobe accepted for wide usage. But it should be rigorously tested first. If thanalso demonstrated as tenable, speculation should be than made as to the applicc-tion of the theorem with real date.
}.XTHODS AND TECHNIQUES
20Cot5 horizontally-distributed random numbers, Ri, were generated andsubstituted into five interdependent equations to prockfee five scores, Xi, foreach of 200 pseudo-people, as follows.
Xl =
= 112
=1331X1 /'2X2 / ay
X4 = 1341 x1 hok Ivi
(5)
(6)
(7)
(8)

2
The data were then cs.sputerized and subjected to stepped-regression endcorrelation analysis. Beta and correlation coefficients produced which resultedfollow the usual explanations given in texts, whereas the beta differentialsrequire a set procedure oW,lined in the previous paper', Baatcally, for anygiven beta weight for variable A on the intermediate variable B, with controlfor other system variables A, the last variable C to stepped into regression toproduce a new beta weight cv. variable B; the algebraic difference between thetwo beta weights is found and its absolute value is the 'beta differential' forvariable A on variable B, d(.10.bk/0 or simply d6ab, as given in the right-handmember of Inequality I. In like manner, the beta differential for variableon variable B is found for cowparison. Comparison of the beta differentialsshould demonstrate or fail to demonstrate the beta constancy principle: thebeta coefficient of an intermeiite variable in a causal direction remain erelatively constant as other system variables are introduced and controlled instepped regression, whereas that in the 'causal direction changes noticeably.
Figure I. Causal Direction A-B-C
If variables Al B, and C are rilated causally as in Figure 1 above, endif other system variables X. ti Rpr 70; rie te, are controlled, then condition 1(Inequality 1) of the theorem is ex. :r1Iftel.
From the second of the two regression equations used for each betadifferentiallthe beta coefficient for the end variable, A in rredicting variableC or in predicting variable 1, is taken for comparison. Again, if the variablesare related causally as in Figure 1 above, condition 2 of the theorem is axempli-fiad.
Correlation ootapari gone of conditions ; and 4 are also exemplified inFigure 1 above for variables eausally related as shown.
The data for Xi from Equations 5 through 9 relate oausally as shown inFigure 2 below. The b weights were Bet equal to 1 to simplify manipulation endanalysis, as in the previous study. The Xi then served es input data in regres-sion, the beta and correlation coefficients as output for analysis.
7 ia.ua a. 1
In the initial atages of data processing, cirtain cl.ecks were conducted:(1) the 5x5 Ri correlation matrix reveal:1d no r signifif tly differ,nt fromzero at the .01 level; (2) the left and right members c' Equations 5 ,hrough 9
were found equal, to five significant figures, when ' :o.:riate mean Ri and Xi
were substituted; and (3) the b weights found in regrr3sion equations approxi-mated the b weights in Equations 5 through 9, predict -d Xi and mean Xi beingfound ewer, to five significant figures.
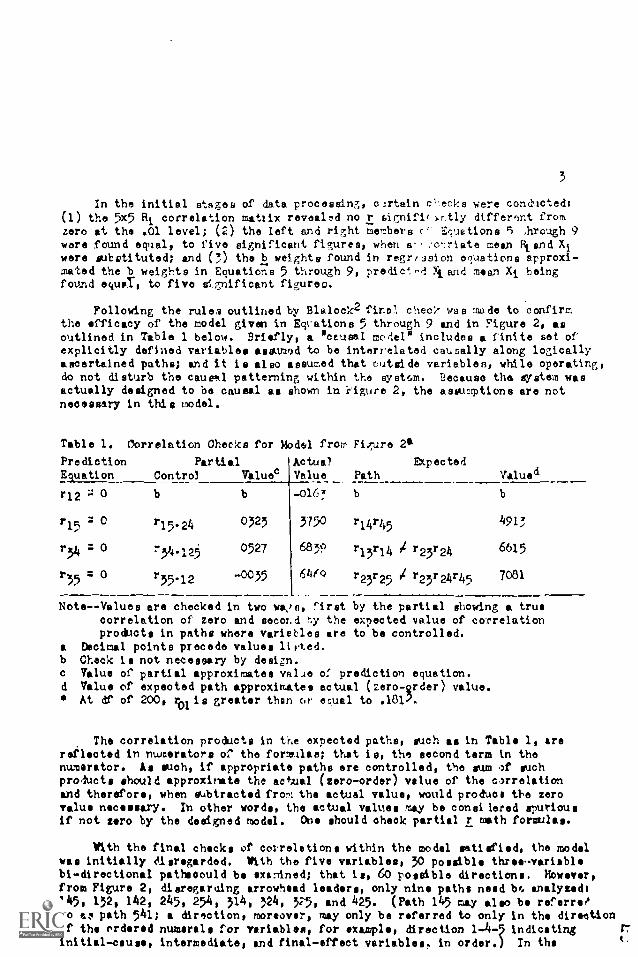
Following the rulea outlined by Blalock2 final check 'da a made to confirmthe efficacy of the model given in Equations 5 through 9 and in Figure 2, asoutlined in Table 1 below. Briefly, a "causal motel" includes a finite set ofexplicitly defined variables Rearmed to be interrelated causally along logicallyascertained paths; and it is also assumed that cutsi de variables, while operating,do not disturb the caueal patterning within the system. Because the system wasactually designed to be causal as shown in r'igure 2, the aseutrptions are notnecessary in this model.
Table 1.
PrediotionEquation
Correlation Checks for i4oclel
PartialControl Value
frau, Figure 2
Actual ExpectedValue Path Valued
r12 ° b b -0163 b
r15 = 0 r15.24 0323 3750 r14r45 4913
r34 = 0 ''34.125 0527 6830 r13r14 r23r24 6615
r3 z 0 r35.12 -0035 61" r23r25 r23r24r45 7081
NoteValues are checked in two wive], first by the partial showing a truecorrelation of zero and second the expected value of correlationproducts in paths where varieblee are to be controlled.
a Deoimal points precede values lirted.b Check is not necessary by design.c Value of partial approximates value of prediction equation.d Value of expeoted path approximates actual (zero-grder)
At df of 200, rol is greater than or equal to .1812.
The correlation products in tr.e expected paths, such as in Table 1, arereflected in numerators or the formulae; that ie, the second term in thenumerator. As suoh, if appropriate paths are controlled, the sum of suchproducts should approxinate the actual (zero-order) value of the cm-relationand therefore, when subtracted from the actual value, would produce the zerovalue necessary. In other words, the actual values Tay be consi lered spuriousif not zero by the designed model. One should cheek partial r math formulas.
With the final checks of correlations within the model sett died, the modelwas initially disregarded. With the five variables, 30 possible three-variablebi-directional pathscould be exit:lined; that is, 60 possible directions. However,from Figure 2, disregarkiing arrowhead leaders, only nine paths need be, analyzedr145, 132, 142, 245, 254, 314, 324, N5, and 425. (Path 145 may also be referredto e path 541; a direction, moreover, may only be referred to only in the directionof the ordered ntuaerals for variables, for example, direction 1-4-5 indicating
elinitial-ceuee, intermediate, end final-effect variables, in order,) In the

4
analysis, however, paths 145 and 245 were studied first, since they were theonly two designed as causal. l'or ease of understanding, the correlation matrixof all zero orders and partials was studied first, by triads, in blocks ofcorrelation values far comparisons, for conditions 3 and 4 of the theorem, foreach step in regression (partialling); all steps had to yield results consistentlythe same in order for asymmetry. Betas and beta differentials, plocedure outlinedabove, were then studied, step by step; again, all steps had to yield resultsoonsin.tently the same in order fon- asymmetry. My inconsistencies tentativelywould Indicate dropping a path completely. However, correlations would have tobe reanalyzed logically in that conditions 3 and 4 are compounds of three in.-quail ta s.
The total variances in predicted variables 3, 4, and 5 were then checkedfor contribution by component 7Ci iv the standardized regression equations. Itwas expected that the more upon lent an Xi was on system variables, the higherwould be the variano accounted for.
MTh SOURCES
Dimly data were generated via progrems for IBM 360/40 at the Boston CollegeComputer Center, under the Title IV prozram, UFA, PL 8940 (directed by Dr.John J. Welsh). Random Ri, as desert': r.,,d above, were substituted into Equations5 through 9 to produce Xi, the latter then subjected to stepped - regression andcorrelation analysis for the model in Figure 2 (originally suggested by Dr.Ronald L. Nuttall, al so of Boston College).
RESULTS AND CONCl'ISIONS
Blocks of correlations were compared by triad., the first set being thatfor variables 1, 4, and 5, as presented In Table 2 below. Since there was nolink designed for connecting variables 1 and 5, the only two directions tocheck were 1-45 and 5-4-1, and then by compering these two directly.
Table 2.
Controlsb
2
323
x
x2
x23
Correlation Comparisons for Variables 1, 4,
r14.
and 5, with Controls°
Direction°.122r
For Condition 3d
375059146
-01334592
5564Tl242574
3629
8850817919
65
7699
1-4-51-4-51-4-51-4-5
For Condition 40
-29810325
-3679G490
5177408 ,6
4587'594
875469598125L1965
1-4-51-4-51-4-51-4-5
bosrinal points precede values listed. b For partials of re.o From (souped son of absolute values. d Control only for variables X.
Control for third variable in path as well as for variables X; hence, x used.

5
In the traditional sense, it seems ridiculous to control variables whereit is not logical. For exartrle, holding variable 1 conetant should not be done,since variation in variable 4 is reduced by varivc le 1; hence, is reduced.It would also be absurd to hold variable 4, the intervenin; variale, constant,since variable 5 varies with variable 4 and not directly with variable 1.Nevertheless, the information is easily availolle with very little extra timeor effort on the computer. Real life systems of variebles do not seem so apriori as one may hypothesize. And nevertheless, the investigator has chosento disregard such oound salvias for the sake of di ecovery:
Direction 1-4-5 is the tentative decision for conditions 3 and 4 from thecorrelation atudy.
Regression equations in standard fors, were next studied for path 145, aspresented in Table 3 below.
Table 3.
Other Xi.
Beta Studies for Path 145'Direction 1-4-5b
X1 X4 d /354
Direction 5-4-1°
d614 X4 X5
Direction d
(4. d
- - 8830 5%4-- -1684 9767 0937 I4.639 1.0225 -5277 1-4-5 1-4-5
2 - 6690 89592 0173 6535 0155 0403 8556 0602 1-4-5 1-4-53 - 8277 2842 -3 -2201 8902 0625 5091 7933 -6150 1-4-5 1-4-52, 3 - 6750 80453002, 3 0321 654 0186 0504 5 0748 1-4-5 1-4-5
a Deoimal points precede values listed except where actually shown.b Variable 5 is predicted. c Variable 1 is predicted.d From comparison of abevlute values. Variables in regression ovations.
Again direction 1-4-5 is the decision; conditions 1 and 2 are satisfied.
Returning to the model of Figure 2 and then to the correlation matrix fora logical analysis, it appears that to satisfy the system beat,
Ir15.241 < 1r14.21 < 11.45.2 IThe values, respectively, for the members in Inequality 10 sm0525, .7124, andh163, the order being the ,wee as required by Inequality 10; that is, ascending.Hence, direction 1-4-5 is accepted as causal.
Procedures as in Tables 2 and 5 were repented for relations among variables2, 4, and 5. As one rosy guest, finding causal relations for variables 1, 4, and5 was fairly simples because there is no link between variables 1 an d 5, as sewin Figure 2. Obviously, path 245 would be difficult to decide the direction ofcausality, sines all three variables are linked, and it was precisely here that
modification to the theorem presented itself, as taken up later. The prooerisrofor s duplication of that in Table 2 produces direction 2-5-4 as the tentative
( 10 )

6
decision instead of the designed direction 2-4-5; that is, the ascending orderof rs is r24, 125, and r45. Desiite this deviation from whet ws expected, itis most important. to note that all correlations when compered yielded result.consistently the same, for all encries in the blocks. Since it wee noted thatr24 was lets than r45, however, the second end third members of conditions 3and 4 of the theorem, as applied to direction 2-4-5, were met; this would meana revision to the theorem would be needed to drop the first member or to haveGams reflected in a now condition. In light of a final step of logio at themacroscopic level, as in Inequality 10, such an added coldit'_on along with revi-sion of conditions 3 and 4 seems indicative. (See Table A for correlations.)
The proosdur of Table 3 for betas and beta differentials was also repeatedfor variables 2, 4, and 5. Noting that with in impending revision of conditions3 and 4 three different directions wore feasible, 2-5-4, 2-4-5, and 4-2-5, con-dition. 1 and 2 were °hooked in sets of regression equations for each of thee'.These wore; (1) predicting variable 4 from variable 5, then stepping end variable2 into regression; (2) predicting varis5le 5 from variable 4, then steppingvariable 2 in; and (3) predicting variable 5 from variable 2, then steppingvariable 4 in. For comparison, as in t!.e right side of Table 3, the reversesofthese directions were compiled. In ill three cases, conditions 1 and 2 were met.Again not discouraged, the investigator noted that all steps yielded consistentresults. The variables 2, 4, and 5 are so confounded that the decision as tothe correct direction, 2-5-4, 2-4-5, or 4-2-5, would have to depend on logic inthe final analysis. (No wonder the word lconfounded4 has an emotional stigmaattached to it not unlike Anglosaxonesei) (Sle Table B for betas.)
Returning to the model of Figure 2 end then to the oorrelstion matrix fora logioal analysi a, it appears that to sati sfy the crate% best, three inequality eswould have to be true; but only one can be trues
For direction 2-5-4,Ir24.1 < fr25.4I < 11.45.2 1
(11)
For direotion 2-4-5, 11.2541< 11'24.11 < 11'45.2 I(12)
For direction 4-2-5, 11.45.21 11'24.11 < 11'25.4 I(13)
The values for the members in Inequality 11 are, respsotively and in the sameorder, 7410, 5974, and 8163; Inequality 12, 5974, 7410, and 8163; and Inequality13, 8163, 7410, and 5974. Thus, direction 2-4-3 is accepted as oausal, in thatfor Inequality 12 yields values in seconding order and the others do not. (Thissounds pragrnatio, and it is, but it is considered less so than groping in thedark from personal bias.)
The remaining five paths, 132, 142, 314, 324, end 325, were rejeoted as*ousel in that comparisons did not yield consistent results for the four condi-tions of the theorem, as expected.
A revisit to the previous studyl revealed that the same result' were shownin both studies; that i s, for both horizontal and normal di stributions of RI.Exactly what happened to the Xi oould only be guessed at first. In the firststudy, 1,11 distributions were 4.11-shaped, Loth Ri and Xi. But in the presentstudy, Xl and X2 were rectangular sine, they were equated to and determined byAl and R2, respectively; whereas x3, X4, and x3 , when grouped, ware found to

7
be bell-shaped, as indicated in Figure 5 below. Like rolling a number of dice,the probability of getting central value, is greater than that of getting extremavalues, low or high.
Inequality 7:
Inequality 8:
X3 X 1 X2
XX4 X1 X2
31
Inequality 9: / N.X5 X2 C4
Figure 3. Distributions of Endogenous System Variable,
I
R3
I
R4
R5
Total 'variances for predicted variables 3, 4, and 5 were accounted for byboth 11end Xi in tho previous study to the extent of 1004, as expected. In thepresent study, the sane would be found; hence, total variances were only checkedfor contributions by Xi, as shown in Table 4 below, ouch that
V r 0.4)m.w. mwsx raw "wry rmxThe partitioning shows the amount of variance in the predicted variable con-tributed by each of the independent variables, Xi, from Equations 7, d, and 9.The Ri could be taken as 'random noise' from outride the vatem; this is tanta-mount to the assumption that outside variables, while operating, do not disturbthe patterning of variables within the vstem. (See Table Cat for total variances.)
Table 4. VariancesF'rectiote0Variance °
Accounted For by Xia
variances from Partitione°Total from.,Partitions°
6Z39.2 '2r135362
(332.1r23504 6609
T412 7341.2r14 '()42.1r246887 3151 3746 - 6897
Y5024 4r25 (454.2r458383 P
4263907 8583
Y5!124 65124r13 65214r25 54.12r450065 200 37708585
a Deoitatl points precede values listed.Products of tvo values
(1
b Fro', Table 0.d 'Sams from this table.

8
From Table 4 it 1s noted that the predicted variance and the totals frompartitions are equal within rounding error. It is also noted that variable 5,which i n "'deeper into the eestem (see Figure 2) than vsriables 3 and 4, hasmore var. once accounted for from within the system than variables from outside;except for R5, variable its further removed from Ri, the outside variables, anddetermined more from variation within the system. Indirectly, variable 1 con-tributes to variable 5 and is causally related through variable /:; it couldtherefore be argued that variable 1 should be in the regression equation forvariable 5, but notice how little it contributes to the variance in variable 5.
Ae a tide study of the varienc picture, by tradition again, it makessense to account for as much vtrit..Ice as possible in predicted variables fromother variables related to them sand stepped into regression to increase thevariance. For those who seemingly di sregard the actual ce. -30.1 patterning withina system, it should be quite obvious that variable 1 can be predicted fromsequentially posterior variables in such way as to obtain as much al, 67% ofits variance. Also notice how variable 4 stn have as much as 84% of the varianceaccounted for, if variable 5, a causally posterior vari0;18 is stepped in aftervariables 1 end 2, its direct causal variables, a preaturptuou..; fabrication tothe extent of 15% more variance accounted for; so much for the variance accoun-tant:
The problem of using a theorem with four conditions to confirm causal direc-tions for three-variable paths in a closed system of fit° variables was investi-gated. It was consistent, both mathematically and logically, for clearcutcausal directions, arch a.e direction 1-4-5. It was consistent in part, mathe-matically, for three - variable paths where variables were confounded, such aspath 245, but salvaged by the logic of deciding which variables K to control incomputing partials. Clearly, the theorem tray be left as is if the stipulationis made to return to conditions 3 and 4 in reference to the first of the threemember, of the condition; or it would be better to drop the first member ofconditions 3 and 4 and adia fifth condition arch that
I' aok' I < Irabka < Irbc.k" i I (15)
where variables K° follow from logical analysis. arch revision remains forfurther study. Ylis theorem was also valid for rejecting possible imitatorsof causal directions. With the one modification on th41 use of login after themathematical analyse, ceased directions 1-4-5 and 2-4-5, the only two designed,were not eliminated whereas all others were rejected. l'he theorem seems to workwith horizontal as wail as with normal distributions of Ri in generating asystem of Xi, the present study producing the came restlts of system relationsas the previous study. The variance picture for rretiihted variables was asexpected, with attention called to false variance acco+ulting.
From the theorem, one should note that there is a let of consistentlylogical and mathematical inequalities emanating a family -like relationship.In time, the relationship. among a grandfather, father, and on seem logicallyordered in ascending order of relational magnitude as ;grandfather -son, grandfather-failer, and father-son. If a characteristic of the oi were to be predicted,again it would seem logical to predict from the sere c^aracteristit of the father;and if that characteristic of the grandfather were step; .td into regression, itshould add less to the prettloted variance of the son's chartcteristio than thatof the father adds, while the latter should remain rels'Avely stable. If the
111

9
same characteristic were to be predicted in the grandfather from the fathe,and that of the son wenr stepped in, it peeing many a son two generations removedhas contributed to the old mania unpredictabilityp no matter how stable in lifehe is. When other system variables are considered, such as characteristics ofwives, siblings, intru.!ers, peers, and other amorphous iispedirnenta, the father-sonrelationship seems to remain strong. The theorem poses a r.athenatical analog aswell as a logical one in wystematic causal analysis.
The basic problem of the theorem presently 4,11 that it may have to be con-fined to the computer. However, it should at least be tested with real lifedata, to cross the bridge fro:a theory to practice. Moreover, the overallfinding about thy, theorem le that it is reliable for confirming hypothesizedcausal direotiona of three-variable paths and is potentially useful by thepractitioner. It i s further speculated that the structure of analysis epitomi. zedin Tables 2 and 3 car. serve, as a basis for determining as well as confirmingcausal directions; V.at is, for also generating hypothesee.
XMTIFIC OR EDUCATIONAL IHPORTAY.:CE OF THE STUDY
The educational world is largely t nonexperimental and correlational one.1.tessee of data are oft/liable and mast be handled. High-speed computers are alsoavailable. Yet how frustrating it is to both practitioner and researcher to tryto isolate variables to study their relationships: How often does one do witha system of variables wit,/ mach to be desired, palliating only public relationsaspects, settling for something much less than the. best: Obversely, how oftendoes one look di sdainfully or confused at eophi oticated multivariate stati stic 8:Perhaps a multivariate tool such as the theorem in thin paper could be thehelp needed to cross bridges of understarding betveen survey research and ex-perimental research, theorist and prectiUoner, researcher end adminstrator,evaluator and researcher. Hypotheses or not, it would make sense or even provideseourity if guess work were cut down in A measured way, perhaps with the theoremas presented heroin. It also seems thet such theoret could oleo cut time inanalysis land interpretation, were a computer program to come as a byproduct ofthe future studies. Indeed, the mathematics alone of the theorem seams to landto potence. If demonstrated with real data, the theorem could abe. educationalpractice while iliac it could be a door opener for cellist' theory. Onoe etusallinks are established, one may then be able to design an experiment to test weefindings from survey research, if feasible. Science end practice have no realborders. Hence, it I a expected that follow-up studies in applying the theoremshould yield results for both educational theory and practice. But caveat.
..****References
1. Nigro, George A., 'A Beta Index to Confirm Causal Directions in a ClonedSystem of Five Variables," a paper presented at AMA Annual Meeting, Feb.194914 also, BD 031 096, ERIC.
2. Blalook, Hubert N., Causal Inferenles in Nonexperimental Reseexoh, Universityof North Carolina Press, Chapel Hill, N.C., 1964.
3. Arkin, Herbert, and Raymond R. Colton, Tables for Statietioians, 2nd ed.,Barnes and Noble, Inc., N.Y., 1963.

10
Table A.
VariableXi
Correlation Matrix of Xis
Cb
X2 0b
X3 0b
X4 0b
X5
1 -0163 5923 5564 7503 -5047 2 7184 2 7124 2 59464 -5356 4 3494 3 2574 3 -01335 -4979 5 4947 5 51 77 4 -298134 -6744 24 5735 23 5629 23 459235 -6417 25 6398 25 48&.4 24 032345 -4670 45 4005 35 43F:' 54 -5679345 -6091 245 5743 235 3,694 234 0490
2 5471 366 75861 6911 1 1410 1 82504 2280 3 380 6339
5 1135 5 -2067 597414 5247 13 6119 13 726615 4775 15 0688 14 543145 1923 35 -2571 34 5889
135 0 355 134 4963
3 6839 - 64691 5293 1 56872 5290 2 4252
,
5 3149 4 1 256
12 0354 12 -003515 0791 14 256925 3481 24 -0136125 0527 124 -0393
4 - S8501 87542 8163
3 791912 695913 8231
23 7699123 6965
a Decimal points precede values listed.b The numbers pro those of variables controlled; 1-1 .for zero-orders.
At dt of 200, r01 is greater than or equal to .1817.

11
Table B.
Predicted
Xi
Beta Coefficients
Cb X1
of Predictor
Predictor
X2
Xia
Xi
ab
X3 0 X4b
1 - -0163 5923 - 5564 - 37503 -4858 2 8581 2 8959 2 912,4 -5597 4 3980 3 2842 3 -01415 -7084 5 6014 5 1.0223 4 -527734 -6783 24 5665 23 5084 23 5416
35 -7985 25 6739 2r, 8556 24 00245 -5810 45 4J;T7 '5 7935 54 -6150345-7043 245 5670 2)5 5300 234 0748
2 - -c163 541 6066 - 7586
3 -5244 1 8577 1 8917 1 88984 -5124 4 248'7, 3 4366 3 69585 -3500 5 0970 5 -2869 4 1.011934 -6705 14 5153 1) 6272 13 6886
35 -5157 15 4071 15 0969 14 813845 -3754 45 1694 35 -M5 34 9788345 -5264 145 4c50 135 0440 134 6551
3 5923 5471 6839 - 64692 6014 1 5569 J. 5132 1 49434 3068 4 2092
2 5570 2 54615 4070 5 1328 5 5116 4 195224 5805 14 5342 12 0369 12 -00)925 6029 15 5599 15 1305 14 )91945 3728 45 2183 25 5742 24 -0257245 5815 145 5562 12c; 0766 124 -0607
4 5564 - 6066 68 39 88302 5664 1 6150 1 5459 1 78473 2330 3 317 2 5025 2 99595 2621 5 -1489 5 1939 3 757623 5460 13 5969 12 0339 12 741125 2793 15 0489 15 79 13 761035 2426 35 -1769 25 2110 23 8807235 2574 135 0286 125 0363 123 7413
5 - 3750 - 7586 - 6469 883o2 3875 1 7649 1 6544 1 97673 -0126 3 5775 2 3310 2 66904 -1684 4 3528 4 0808 3 82772524
3894 13
0173 1
76663625
1214
-00321684
1213
68902535
34 -2201 34 3543 24 -0072 23 6730234 0321 E4 376o 124 .32.54 123 6544
a Decimal points recede vnlues listed except where actuallr shown.b The numbers are those of variables ccntrolled; "-1 for zero-orders.

Table C.
PredistorXi
12
Multiple Correlations and Total Variances Accounted for Predioted Xia(Correlation/Vartance)
Xl
1
1212124125123412351245
13134
1351 345
14145
15
2
23
234235
2345
24245
25
3
34345
35
45
5
- /-
0163/00037185/51628182/66957863/61828187/6703
7125/50767128/5081
5947/3537
5923/35096276/39696899/4759
5924/3510
5564/30966090/37o9
3750/1406
X2
0163/0003
- /-
Predicted Xi°
X3 X4 x5
6912/47788206/67338680/75358662/7538
7411/54928259/6822
8250/6807
- /-
5471/299;6331/40087801/6086
7621/58C9
606o/,6797704/5935
71:;(3), /57524
5923/3509 5564/3096 3750/14068131622 8299/012 8518/7255
83o1/6591 6518/72588132/6614 - /- 9265/85848130/6609 9162/8395 - /-- /- - /- 9266/8587
9165/8399 - /-8136/6619 - /-
7092//5030 6470/4186
9014/81259164/6397 - /-- /-
7299,`327 8940/7992
75o7/476 - /-
740/56o6 9158/8387
5471/2993 6o66/3679 7550/57547381/ 8076 /6521
9265/85539026/8146 - /-
-
7039/4954'039/4955
6527/4260
/_
6839/467869o04762
6469/410
8883/7891
6839/4678- 1.
8953/6015
- /-
8830/7796
9264/1M-
6469/41358849/7831- /-
8830/7796
- /-
a Decimal points precede values listed. True varikra:t2 'Ire underlined.
b The numbers are those variables contributin!, to variance ofpredicted veriable; that is, "independent' variables in rerissionequations.
o X listed are 'dependant' variables in regression equations.1t df ci 200, r01 is 7,ratter than or equal tg .181, .212, .234, or .255
for 2, 3, 4, or 5 viviables, respectively'.
1'1