Do You CEE?, IAB/Gemius report, 2009
190
-
date post
13-Sep-2014 -
Category
Documents
-
view
1.468 -
download
3
description
The first common publication of Gemius together with IAB Europe describing the landscape of the CEE online industry in 2009. The 2010 summary will be available soon through http://www.internetcee.com/ website. Keep you updated!
Transcript of Do You CEE?, IAB/Gemius report, 2009


Counselors:
Alain Heureux, Filip Pieczyoski, Jarosław Sobolewski
Authors:
Michalina Pelc, Bartosz Wardzioski, Marcin Dukat
Contributors:
Tamás Ács, Vesselin Angelov, Olga Brzozowska, Catalin Emilian, Tomáš Gregor, Vladimir Houba, Vlad
Ionescu, Ľuboš Ivanič , Akvile Jurgelaityte, Vibor Kalogjera, Natalia Królikowska, Alexander Levshin,
Dmytro Lysiuk, Mikuláš Németh, Gregor Nišavič , Toms Panders, Jolita Reidman, Marina Solovyeva,
Toomas Tepomes, Asta Tubeleviciute, Judit Volgyesi, Tanya Yordanova
Support:
Dawid Fillmann, Łukasz Urbaoski, Katarzyna Zagórska
With special thanks to: Géza Ambruszter, Ričardas Baltaduonis, Artur Brzęczkowski, Vladimir Chernyshov, Aleksey Chuksin, János Gulyás, Aivar Ilves, Marina Jeglova, Dominik Kaznowski, Tamás Kocsis, Maciej Kossowski, Elena Lazarova, Lauris Lietavietis, Péter Novák, Géza Palocsay, Rando Rannus, Dmytro Sholomko, Deividas Talijūnas, Balázs Tarnai, Michał Tober, Artur Waliszewski

I am delighted to be writing an introduction to the first detailed report on the CEE
region – Do you CEE? Interactive Overview of Central and Eastern Europe Markets
2009. At IAB Europe we believe that ‘information is power’ and one of our key
objectives is to give our members the research resources they need to do their jobs
effectively.
We have produced the annual advertising expenditure data for IAB Europe’s member countries since
2006, and in that time we have seen huge changes in the online advertising industry. One of those
changes has been the maturing of the more established markets whilst at the same time the CEE
markets have experienced significant growth, in terms of online penetration, online ad spend and the
growth of the online publishing industry.
This region has a fascinating story to tell, and I believe every one working in the interactive
advertising industry in Europe will benefit from the data and insight this report offers.
It is a huge achievement for the IABs in the CEE region, working with research partner Gemius, to
prepare this report. I would like to thank everyone who has been involved in its creation, and I look
forward to introducing more of these reports in the future!
Alain Heureux
IAB Europe President and CEO
When I was asked by Alain Heureux, President of IAB Europe, to help him develop
the internet trade organizations in the CEE region, I took a deeper insight on how
the mature internet economies perceive the development of the internet in those
countries. What struck me the most was the huge lack of knowledge about the
region. Few of the national CEE nation’s IABs were present at IAB Europe, but were
still struggling to build well represented and financed trade organizations. The meetings and private
talks with our western friends slowly began to change their minds, but it was only a small group of
people, even if the most influential. Consolidating this change was the main idea behind creating and
running this project.
I am happy that the IAB Europe board and Gemius were so enthusiastic. I believe that this report will
expose the strong evidence that the process of development is well advanced, that our markets are
an interesting part of the world in which to invest, and companies present here are worthy of
interest and co-operation. I also hope that it is a valuable tool to benchmark countries and internet
audience preferences which seems to be quite diverse when compared to the west. With the start
with this annual project we expect more CEE initiatives to be forthcoming and I am honoured to work
with the countries and companies of the region to make them more interesting and successful.
Jaroslaw Sobolewski
General Director IAB Poland and Board member of IAB Europe
IAB CEE Development Programme Coordinator

Central and Eastern Europe is an amazing arena to observe the dramatic changes in
the landscape of the media, business and society that are taking place alongside the
technological progress and development of the Web. In course of their history,
these countries have faced numerous obstacles, encountered technological and
economic barriers and suffered isolation from the Western markets. In spite of all
this, they have managed to prove their strength and now show their potential, even in the time of
economic downturn. Gemius has witnessed the fascinating growth of the internet in this region, its
advancing popularity, the way it responded to the needs that emerged with the development of the
online world and the new questions it posing.
For us, this year is a special one, as it has been ten years since Gemius was established, and for all
these ten years the internet reality of the CEE region has been our everyday concern. Today, after a
decade of Gemius' growth and expansion, we operate on 19 CEE markets. This region stands out as a
special place for us - for it is here that we have started our research, here we continue developing it
to fit the changing needs of the market with all our effort, and this is where we expect the best will
come.
We are proud to have participated in the preparation of the Internet CEE report in cooperation with
IAB. This is a great honor as well as a challenge. By providing all those interested with a deep insight
into the situation of the internet in Central and Eastern Europe, we hope to show the long way that
this part of world has come over the years to achieve the point where it is now. We trust that our
conjoined effort will become the source of indispensible information for all those fascinated with the
potential that the CEE region has to offer.
Filip Pieczyoski
Management Board Vice President
Director of International Operations in Gemius

TABLE OF CONTENTS
ONLINE LANDSCAPE OF CEE ..................................................................................................................... 6
MAIN PLAYERS, ONLINE AUDIENCE, TOOLS – OVERVIEW OF CEE INTERNET MARKET ........................ 14
BULGARIA ................................................................................................................................. 16
CROATIA ................................................................................................................................... 27
CZECH REPUBLIC ....................................................................................................................... 38
ESTONIA .................................................................................................................................... 49
HUNGARY ................................................................................................................................. 61
LATVIA ...................................................................................................................................... 73
LITHUANIA ................................................................................................................................ 85
POLAND .................................................................................................................................... 96
ROMANIA ............................................................................................................................... 109
RUSSIA .................................................................................................................................... 116
SLOVAKIA ................................................................................................................................ 127
SLOVENIA ................................................................................................................................ 138
UKRAINE ................................................................................................................................. 148
BRANCH ORGANIZATIONS ................................................................................................................... 158
OPINIONS FROM THE CHOSEN CEE MARKETS ..................................................................................... 170
METHODOLOGICAL NOTE .................................................................................................................... 186
ONLINE LANDSCAPE OF CEE
ONLINE LANDSCAPE OF CEE
The diversification of the Central and Eastern Europe market is obvious – in every country
we can observe a specific character of an online landscape. However, there are also some similar
patterns which differentiate the CEE markets from the western part of the continent.
As a whole, the CEE online market still does not display penetration and broadband levels
similar to mature economies, but growth figures are significant. Clearly, there is a big potential in the
CEE market. The economic crisis that struck the whole world could not have been avoided in Central
and Eastern Europe. Hopefully, this will not have a significant influence on the future development of
the online market.
1.1. Internet population
Chart 1 Internet penetration in CEE 2006-2009
(Bulgaria: gemiusAudience/NSI; Croatia: Gemius/Valicon, gemiusAudience/US Census Bureau; Czech Republic: NetMonitor–SPIR
/Mediaresearch/Gemius /CZSO; Estonia: gemiusAudience/National Statistic Department; Hungary: gemius/Ipsos Audience/KSH;
Lithuania: gemiusAudience/stat.gov.lt; Latvia: gemiusAudience/CSB; Poland: Megapanel PBI/Gemius/GUS; Romania: 2006 ANRCTI,
2007-2008 GFK, 2009 Mercury; Russia: Gemius’ calculation based on FOM; Slovakia: AIMmonitor – AIM – Mediaresearch & Gemius
/Statistical Office of the SR; Slovenia: Gemius/Valicon, gemiusAudience MOSS /Statistical Office of the Republic of Slovenia; Ukraine:
gemiusAudience/State Statistics Committee)
0%
10%
20%
30%
40%
50%
60%
70%
80%
Esto
nia
Cze
ch R
ep
ub
lic
Latv
ia
Slo
ven
ia
Lith
uan
ia
Bu
lgar
ia
Slo
vaki
a
Hu
nga
ry
Po
lan
d
Cro
atia
Ro
man
ia
Ru
ssia
Ukr
ain
e
Internet penetration
2006 2007 2008 2009

ONLINE LANDSCAPE OF CEE
In January 2009 there were five countries in CEE that recorded over 50 percent of online
penetration – Estonia, Czech Republic, Latvia, Slovenia and Lithuania. Among them Estonia was the
leader, where internet users constituted around 68 percent of the population [15+]. It seems that
internet development in Estonia started earlier than in most other CEE countries. Figures from 2006
already showed a 58 percent penetration rate. Since then the share has been constantly growing
until 2009, when it showed the same result as in 2008. For the rest of the CEE markets, the
penetration rate is below 50 percent and it should be noted that it is significantly less than in
Western European countries such as Germany, France or the UK – where it fluctuates at around 70
percent.
Chart 2 Internet users in CEE – absolute values growth 2007-2009
(Bulgaria: gemiusAudience; Croatia: Gemius/Valicon gemiusAudience; Czech Republic: NetMonitor–SPIR /Mediaresearch/Gemius; Estonia: gemiusAudience; Hungary: Gemius /Ipsos Audience; Latvia: gemiusAudience; Lithuania: gemiusAudience; Poland:Megapanel PBI/Gemius; Romania: GFK; Mercury; Russia: FOM – Public Opinion Foundation; Slovakia: AIMmonitor – AIM – Mediaresearch & Gemius; Slovenia: Gemius/Valicon, gemiusAudience MOSS ; Ukraine: gemiusAudience)
The country that lags the most with regard to internet penetration is Ukraine, which
remains far behind in comparison to all other CEE countries, reaching only 18 percent in 2009.
However, a constant growth of the internet penetration rate can be noted on the market. Since
2007, when the penetration rate was only 10 percent, it has grown by 80 percent. This makes
Ukraine the only country with such a considerable change noted. Moreover, with 7 million internet
users, it is in the fourth position after Russia, Poland and Romania in terms of absolute numbers.
When absolute number of internet users is taken into account, Russia has the biggest
online audience in the CEE region, around 38 million of internet users (according to FOM Public
0%
10%
20%
30%
40%
50%
60%
70%
80%
90%
0
5 000 000
10 000 000
15 000 000
20 000 000
25 000 000
30 000 000
35 000 000
40 000 000
Ukr
ain
e
Ro
man
ia
Ru
ssia
Hu
nga
ry
Bu
lgar
ia
Slo
ven
ia
Lith
uan
ia
Cze
ch
Re
pu
bli
c
Po
lan
d
Slo
vaki
a
Cro
atia
Latv
ia
Esto
nia
Internet users 2007-2009
2007 2008 2009 growth 2007-2009

ONLINE LANDSCAPE OF CEE
Opinion Foundation, 18+), so it constitutes one of the biggest markets in the whole Europe. In terms
of absolute numbers only Germany, the United Kingdom and France have higher figures, with over
40 million people using the internet in each of countries. However, the penetration level in Russia,
which reached 33 percent in 2009, is significantly lower than in those developed Western European
countries.
Hungary, Bulgaria, Slovenia and Lithuania constitute the next group after Ukraine, Romania
and Russia of the countries with the highest penetration growth rate, with the average result
exceeding 30 percent. Other countries fluctuate around a 20 percent growth level. Only the Estonian
online market remains stagnant, which may be connected to the fact that this country has a
relatively high penetration rate, which would indicate a saturated market.
The other significant market in the CEE region as far as the number of the internet users is
concerned is Poland, with almost 14 million people using the internet. The rest of the CEE countries
perform more poorly, mostly due to their smaller general populations, from over 7 million in
Romania to the smallest number in Estonia, which has around 767 thousand internet users.
1.2. Broadband
Broadband connections across the EU rose by 20 percent over the year, to a total of 110.5
million, representing 22.5 percent of Europe’s population, according to European Competitive
Telecommunications Associations’ (ECTA) latest six-monthly EU Broadband Scorecard published in
March 2009. However, the gap between the best and worst performers is still wide. Denmark, the
Netherlands and Sweden lead the European Union in broadband penetration1 while Romania,
Bulgaria and Poland trail, according to a recent broadband survey by ECTA. It is significant that
comparing to Western Europe, most of the CEE countries are still not well developed in terms of
broadband penetration. The only exceptions is Estonia (24 broadband lines/100 inhabitants), which
has already overtaken some of western markets – for example Austria (21 broadband lines/100
inhabitants) and Spain (19 broadband lines/100 inhabitants). The majority of the countries from
Western Europe have a broadband penetration rate of over 20 percent and the lowest performance
can be observed in Greece – 13 broadband lines/100 inhabitants. At the same time, in CEE the
average rate equals 15 percent and there are still countries with less than 10 broadband lines per 100
inhabitants, such as Bulgaria, Poland or Croatia. Moreover, taking into consideration the countries
not included in the ECTA survey, the huge gap between Russia and Ukraine and the rest of the
market can be noticed. According to the ITU, the broadband rate in Russia in 2008, was only 3
broadband lines/100 inhabitants. In Ukraine the broadband rate was even smaller with 2 broadband
lines/100 inhabitants.
1 Broadband penetration - the number of high- speed connections per 100 inhabitants. For most of the countries the
broadband lines are defined as those with a capacity equaled 144 kb/s or higher. Various technologies are covered: ADSL, cable modem and other access lines. However for Russia, Ukraine and Croatia the available data defines the broadband lines as those with capacity of 256 kb/s or higher.

ONLINE LANDSCAPE OF CEE
Chart 3 Broadband penetration on chosen European markets
(Austria, Bulgaria, Czech Republic, Denmark, Estonia, Finland, France, Germany, Greece, Hungary, Italy, Latvia, Lithuania, Netherlands, Poland, Portugal, Romania, Slovakia, Slovenia, Spain, Sweden, United Kingdom 04. 2008 European Competitive Telecommunications Associations; Croatia, Russia, Ukraine ITU)
It is also worth taking a look at the growth of broadband penetration rates in recent years.
The biggest increase between the third quarters of 2006 and 2008 can be observed in Greece, 282
percent and Cyprus 173 percent. The next two positions are taken by Slovakia and Poland, both
markets that are still behind in terms of broadband, yet regarding their size and general market
development, should have much higher penetration level. It seems, therefore, that they have started
to make up for lost time. Unsurprisingly, the lowest growth (above 50 percent) can be observed for
the mature markets of Western Europe, with only Ireland and Germany reaching high results (96
percent and 69 percent respectively). As far as the absolute value is concerned, the old players are
the unquestioned leaders: Germany – 22 million connections, France – 17 million connections and
the UK – 16 million connections. At the same time Russia, despite its size, reaches only 4 million
connections, which is the highest result in the CEE region. The next position on that market is held by
Poland, with 3.8 million connections, yet the numbers simply reflect the population size. For the
same reason, the last positions in terms of absolute value of broadband connections are taken by
Estonia and Latvia, with 325 thousand and 370 thousand respectively.
37% 36%
31% 30%28% 28% 27%
21%19% 19%
16%
13%
24%
20%17% 17% 16% 16%
11% 11% 10% 10%9%
3% 2%
0%
5%
10%
15%
20%
25%
30%
35%
40%
Den
mar
k
Net
herl
ands
Swed
en
Fin
lan
d
Un
ited
Kin
gdo
m
Ge
rma
ny
Fran
ce
Aus
tria
Spai
n
Ital
y
Port
ugal
Gre
ece
Est
on
ia
Slov
enia
Czec
h R
epub
lic
Lith
uani
a
Latv
ia
Hu
ng
ary
Slov
akia
Rom
ania
Bul
gari
a
Po
lan
d
Cro
atia
Ru
ssia
Ukr
aine
Broadband penetration 2008
Western Europe Central Eastern Europe

ONLINE LANDSCAPE OF CEE
Chart 4 Broadband absolute value and the growth rate Q3 2006 – Q3 2008
(Austria, Bulgaria, Czech Republic, Denmark, Estonia, Finland, France, Germany, Greece, Hungary, Italy, Latvia, Lithuania, Netherlands,
Poland, Portugal, Romania, Slovakia, Slovenia, Spain, Sweden, United Kingdom Q3 2006, Q3 2007, Q3 2008 European Competitive Telecommunications Associations; Croatia, Russia, Ukraine 2006, 2007, 2008 ITU)
1.3. Online Adspends
According to IAB Europe and PwC, in the year 2008 the online adspends in Europe totalled
12.9 billion euro, a 20 percent growth compared to 2007 and furthermore, this market can be one of
the few beneficiaries of the 2009 economic crisis. The gap between the value of US expenditure
(which are still the highest) and European markets is systematically diminishing and in 2008 was 3.7
billion euro. Moreover, the growth observed in Europe is still much more dynamic than in the US,
where it fluctuates around 10.6 percent.
0%
50%
100%
150%
200%
250%
300%
0
5 000 000
10 000 000
15 000 000
20 000 000
25 000 000G
ree
ce
Cyp
rus
Slo
vaki
a
Po
lan
d
Ire
lan
d
Mal
ta
Hu
nga
ry
Lith
uan
ia
Cze
ch R
ep
.
Ge
rman
y
Slo
ven
ia
Ukr
ain
e
Cro
atia
Spai
n
Luxe
mb
ou
rg
Fran
ce
Esto
nia
Be
lgiu
m UK
Ru
ssia
Ital
y
Au
stri
a
Swe
de
n
De
nm
ark
Latv
ia
Ne
the
rlan
ds
Po
rtu
gal
Fin
lan
d
Broadband absolute value and the growth rate 2006-2008
2006 2007 2008 growth 2006-2008
ONLINE LANDSCAPE OF CEE
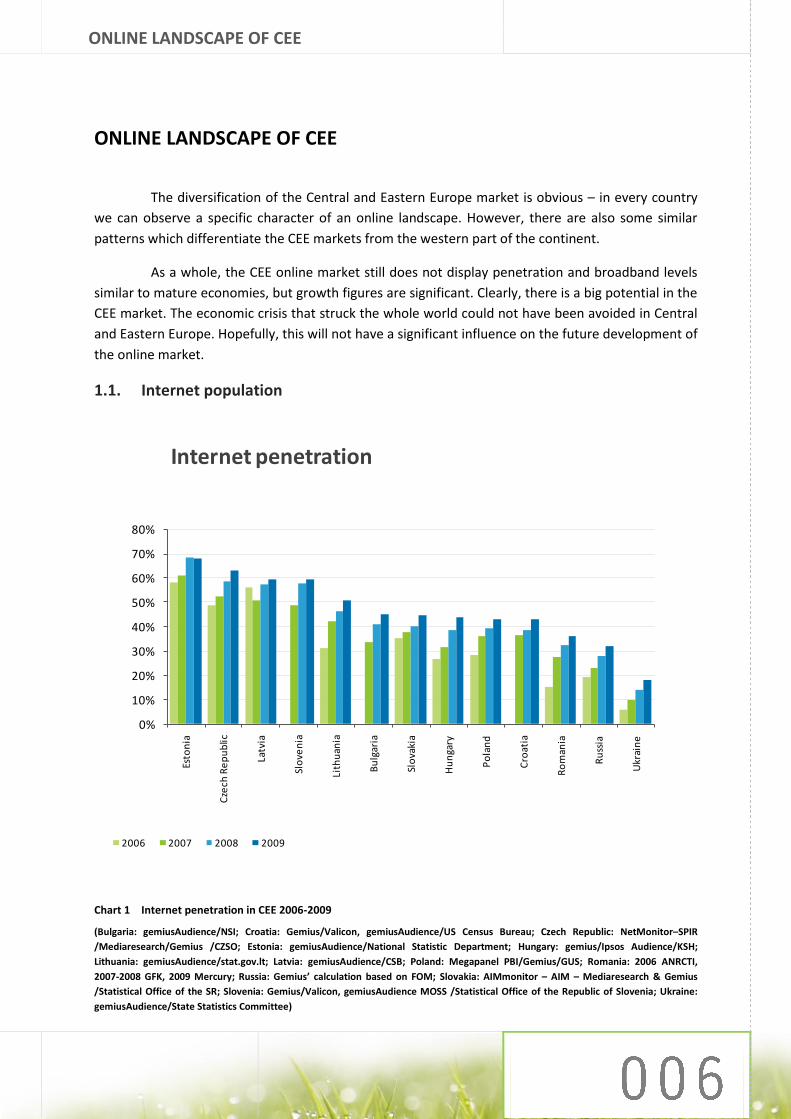
Chart 5 Online adspends – total growth by country from 2007 to 2008 (IAB Europe PwC)
The largest amount of adspends in Europe is still generated by old players (Western
Europe) and according to IAB Europe and PwC, the ten biggest players from that region were
responsible for 93 percent of all 2008 online expenditure. However, the growth observed on those
markets is quite stable and compared to 2007 was lower than 20 percent for the majority of those
countries. The highest growth was noted in Austria: 45 percent and the lowest in Netherlands: 9
percent. In contrast, the average growth on the developing markets of the CEE region was 56 percent
and there are some markets, such as Lithuania or Slovenia, which attained even 89 and 77 percent
respectively. Nonetheless, when absolute values are concerned, developing markets, though
dynamically growing are still behind and the average spending is lower than 100 million euro. Only
Russia, Poland and the Czech Republic constitute the exceptions. Expenditures in the Ru-Net
significantly outnumber the values spent on other CEE markets and in the year 2008 amounted to
417 million euro, according to AKAR and AIB. Yet, while taking into consideration the value per user,
this country does not lead and has a result of 14 euros per user.
In terms of online advertising, the Czech Republic seems to be the most developed in the
whole CEE region. It has the slowest growth, only 26 percent (2007 to 2008), but the highest value of
spending per user of 24 euro. This trend resembles those observed on mature Western Europe
markets.
The other quite well developed markets are Poland and Hungary, which take the second
and fourth position in terms of the value of adspends respectively and are also among top three
regarding the adspends per user indicator. Moreover, Poland takes the second position in terms of
the absolute value of adspends, which, as reported by IAB, in 2008 amounted to 310 million euro.
However, the growth in those countries is dynamic, which shows that those markets are still
increasing.
77%
60%
45%34% 33% 29% 26% 22% 22% 21% 20% 19% 19% 19% 18%
9%
0%10%20%30%40%50%60%70%80%90%
Slo
ven
ia
Po
lan
d
Au
stri
a
Fin
lan
d
Turk
ey
Gre
ece
Spai
n
No
rway
De
nm
ark
Be
lgiu
m
Ital
y
UK
Ge
rman
y
Swe
ed
en
Fran
ce
Ne
the
rlan
ds
Adspends - growth

ONLINE LANDSCAPE OF CEE
Chart 6 Online adspends per user 2008 [Euro]
(Czech Republic: SPIR (Admonitor) Press release/gemiusAudience; Hungary: IAB Hungary Adex 2008/gemiusAudience; Poland: IAB/gemiusAudience; Slovenia: Gemius' estimation; Estonia: TNS Emor/gemiusAudience; Russia: AKAR + AIB/gemiusAudience; Slovakia: amirs.sk/ gemiusAudience; Latvia; lra.lv/gemiusAudience; Croatia: Expert estimation (VP IAB Croatia); Lithuania: TNS Gallup/ gemiusAudience; Bulgaria: Gemius estimations; Romania: Media Fact Book – Initiative/gemiusAudience; Ukraine: Ukrainian Advertisement Coalition/gemiusAudience)
The last place in terms of absolute value of online adspends in the CEE countries is taken by
Lithuania with a value of 8.7 million euro according to TNS Gallup. However, the highest growth,
outreaching all other countries, can be observed on this market (almost 90 percent). Similar
situations can be seen in Slovenia and Romania, where the absolute numbers are still very low, but
the growth is very dynamic, at 77 and 70 percent, respectively. Yet, as far as values per user are
concerned, Slovenia has a quite high result of 19 euro, whereas Lithuania (6 euro) and Romania (4
euro) perform much more poorly.
Ukraine, along with Bulgaria, seem to be the least developed markets. In those countries
adspends per user are the lowest in the whole region – 2 euro and in Bulgaria – 4 euro. Though the
growth in those countries is significant at around 60 percent, the difference is really huge and it
seems that those countries await their development boom.
24 23 2219
1613 12 11
96
4 42
0
5
10
15
20
25
30
Cze
chR
ep
ub
lic
Hu
nga
ry
Po
lan
d
Slo
ven
ia
Esto
nia
Ru
ssia
Slo
vaki
a
Latv
ia
Cro
atia
Lith
uan
ia
Bu
lgar
ia
Ro
man
ia
Ukr
ain
e
Online adspends per user [Euro]

ONLINE LANDSCAPE OF CEE
Chart 7 Share of online advertising in total advertising spending
(Bulgaria: Gemius estimations based on BG Piero & Argent; Croatia: Gemius estimation; Czech Republic: UVDT - Czech Publishers Association; Estonia: TNS Emor; Hungary: IAB Hungary Adex; Latvia: lra.lv; Lithuania: TNS Gallup; Poland: ZenithOptimedia; Romania: GFK; Russia: AKAR/Mindshare; Slovenia: Gemius' estimation based on local experts’ opinion; Ukraine: Ukrainian Advertisement Coalition)
In terms of share of online in total adspends Estonia and Hungary are the leaders.
According to expert estimations of the Estonian market, 14 percent of money spent on advertising in
2009 will go online., With respect to online advertising it is worth mentioning that Estonia has
developed greatly since 2005 when the amount for online accounted for 3 percent. A similar pattern
can be observed for Hungary and Poland, where the share of online adspends in the total market
grew from 4 percent and 3 percent in 2005 to 11 percent and 10 percent in 2008, respectively.
However, by means of this indicator the gap between the CEE region and Western Europe can be
clearly illustrated – in half of the CEE markets the share of online adspends do not exceed 5 percent
and in the Ukraine it is around 1 percent.
It is highly probable that the position of online ads in the total media advertising spend will
be reinforcing its position due to the global economic crisis. According to the IAB Europe’s AdEx
Report, in 2008 online advertising in Europe (19 markets) increased by 20 percent compared to the
previous year. This was mainly because of the double-digit growth rates observed among
underdeveloped markets, while some of the most mature and recession-stricken markets – the UK,
the Netherlands, Norway and Sweden – had already experienced a significant slowing of growth
rates. However, authors of IAB Europe’s AdEx Report claim that the observed slowdown in the online
ad economy will end in 2010 when the growth is predicted to be 6.5 percent compared to the year
2009.
8% 8%8%
6% 7%
3% 3% 3%2% 2% 2%
1%
11% 11%10% 9% 9%
6% 5% 5%
3% 3% 2%1%
0%
2%
4%
6%
8%
10%
12%
Esto
nia
Hu
nga
ry
Po
lan
d
Latv
ia
Cze
chR
ep
ub
lic
Lith
uan
ia
Bu
lgar
ia
Ru
ssia
Slo
ven
ia
Ro
man
ia
Cro
atia
Ukr
ain
e
Share of online in total advertising spendings
2007 2008


BULGARIA
BULGARIA
1. MAIN PLAYERS
1.1. Top 10 websites
website's category
number of real users
number of page views
page views per user
average time spent per
user reach
1 dir.bg horizontal portal 1 488 810 115 037 779 77 01:22:44 50%
2 start.bg horizontal portal 970 012 8 426 787 8 00:12:38 33%
3 btv.bg news portal 668 288 13 020 819 19 00:17:29 22%
4 impulse.bg social network 598 328 520 457 275 869 07:57:26 20%
5 dnevnik.bg news portal 590 192 6 665 537 11 00:15:16 20%
6 kaldata.com IT 560 954 5 437 233 9 00:11:34 19%
7 snimka.bg image share
platform 545 995 28 435 805 52 00:14:23 18%
8 dnes.bg news portal 541 558 14 189 527 26 00:37:59 18%
9 jobs.bg classified (jobs) 503 461 62 518 050 124 01:00:12 17%
10 blog.bg blogging platform 479 336 4 590 257 9 00:09:14 16%
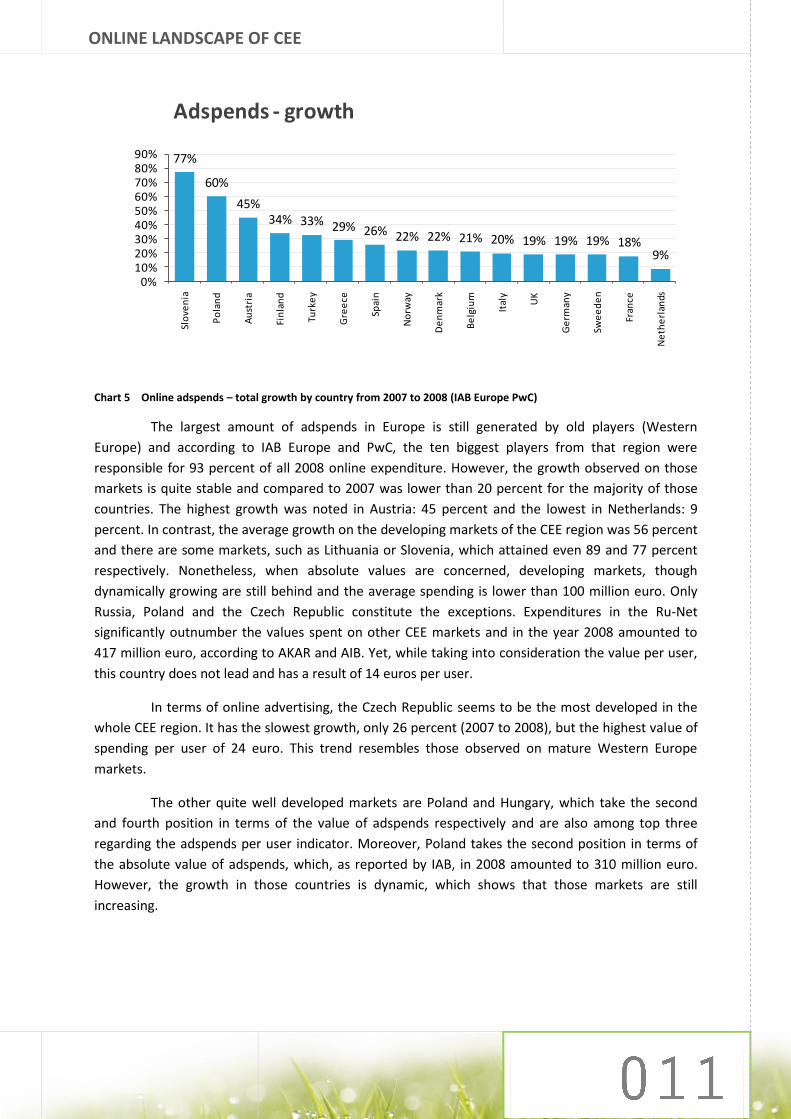
Table 1 Top 10 websites in Bulgaria by reach level (gemiusAudience, January 2009)
According to a gemiusAudience study, horizontal portals dir.bg and start.bg take the first
positions in the reach ranking, yet dir.bg might be described as the unquestioned leader. The service
contains a wide variety of content such as news, sport, mail or social network communities and is
thought to be a trusted site, with a reach of around 50 percent. According to the estimations of local
experts it has more than 20 percent of market share, understood as the collation of money, audience
loyalty, perception of media agencies, etc. The second ranked portal – start.bg – has a 33 percent
reach and is said to be the third biggest player on the whole Bulgarian online market.
The second group of players among the top ten gemiusAudience reach ranking consists of
services with a market share of around 20 percent. First among them is btv.bg – a news portal run by
a popular private Bulgarian TV broadcaster. Among this category two other services can also be
found: dnevnik.bg and dnes.bg. However, not only portals and news services are present among
leading Bulgarian websites, but also entertainment providers. The most popular of these are
snimka.bg , the image platform, or blog.bg – one of the most popular blogging platforms. Bulgarian

BULGARIA
users are also enthusiastic of social network services, especially those with a dating profile. The
famous Bulgarian website, which allows its users to meet new people – impulse.bg – comes fourth in
the gemiusAudience ranking by reach, with around 20 percent.
Another significant player on the Bulgarian online market, not included in gemiusAudience
ranking, is abv.bg. which is said to be the biggest mail provider and the most popular place in
Bulgaria to have a web based mailbox. Moreover, since the beginning of 2009 its owner – NetInfo –
has started to enlarge its scope of activities and has prepared a service for storing and sharing files –
dox.abv.bg. Furthermore, the company also controls the portal connected to abv.bg service – gbg.bg.
The relation between these two sites is based on redirecting users logging out from the mailbox to
the home page of gbg.bg instead of the main page of abv.bg. Because of this, it is estimated that
more than 60 percent of gbg.bg visitors come from abv.bg.
1.2. Top portals/ news services
number of real users
number of page views
page views per user
average time per user
reach
1 dir.bg - Home Page 1 488 810 115 037 779 77 01:22:44 50%
2 start.bg 970 012 8 426 787 8 00:12:38 33%
3 btv.bg 668 288 13 020 819 19 00:17:29 22%
4 dnevnik.bg 590 192 6 665 537 11 00:15:16 20%
5 dnes.bg 541 558 14 189 527 26 00:37:59 18%
Table 2 Top 3 portals and news services in Bulgaria by reach level (gemiusAudience, January 2009)
Three of the most popular portals also take the highest positions in the general ranking by
reach in the gemiusAudience study. The first – dir.bg – was founded in April 1998 and rapidly
succeeded in establishing itself as the country’s leading portal. Since then it has been the dominant
player with almost 1 500 000 real users, which gives a reach of 50 percent. The site covers the basic
needs of web visitors in terms of news, catalogues, entertainment, discussion forums, classifieds and
communication tools.
Second among the portals – start.bg – is an online catalogue, with a reach of over 30
percent. It belongs to Investor.BG AD, a company founded in 2000 and listed on the Bulgarian Stock
Exchange since 2004. It is said to have a market share of almost 10 percent and equity of BGN 1.2
million. Investor.BG AD also owns three other services among the gemiusAudience top ten websites
ranking: snimka.bg, dnes.bg (news service) and blog.bg.

BULGARIA
The next significant force, with a reach above 20 percent is btv.bg. which provides its users
with news and information on interesting shows. It is quite a new project, but due to well prepared
advertising campaigns and an entirely renewed, modern design, a considerable growth of its
popularity has been observed.
Dnevnik.bg and dnes.bg, both belonging to the news services category, take the following
places with a reach of 20 and 18 percent respectively. The horizontal portal market in Bulgaria is not
very well developed and apart from the services presented above, there are no other local websites
of this kind.
1.3. Social networks
number of
users number of page views
page views per user
average time per user
reach
1 CLUBS.dir.bg 652 195 11 642 494 17 00:13:04 22%
2 impulse.bg 598 328 520 457 275 869 07:57:26 20%
3 GLOG.dir.bg 598 082 12 011 436 20 00:15:59 20%
4 aha.bg 452 399 357 105 125 789 06:18:24 15%
5 sladur.com 222 927 22 469 258 100 01:22:07 8%
6 flirt4e.com 220 040 61 638 606 280 02:23:51 7%
7 3aka4ka.com 36 933 583 909 15 00:10:37 1%
8 Friends.dir.bg 25 659 500 620 19 00:11:03 1%
9 160.bg 23 036 168 139 7 00:05:54 1%
Table 3 Social networks in Bulgaria by reach level (gemiusAudience, January 2009)
Bulgarian users are very keen on social network services and a lot of sites of this type can
be found on the market. However, there is no pure community website, but the majority of dating
services also allow friends to be added, so in terms of this functionality, they can be treated as social
networks. Sites categorized as community networks focus mainly on the teenage audience and
generally provide the opportunity to make new relationships. The most important local player is
impulse.bg, a company owned by the Romanian group Neogen. The service has over 20 percent
reach and dominates the market in terms of average time spent per visitor monthly, with almost 8
hours. The Impulse’s audience is constituted mainly of men (52 percent), however women are much
more active, generating 53 percent of all page views and spending on the internet, on average,
around 50 minutes more than men. Moreover, the site is a real hit among the youngest users, aged

BULGARIA
15-24. The Impulse’s account guarantees access to two other services belonging to Neogen:
bestjobs.bg, dalavera.net.
Aha.bg is another significant force on the Bulgarian community network market and like
impulse.bg it provides its users with the possibility of adding friends and creating a community. The
service has a 15 percent reach and is the site where users more than 24 years old spent the largest
amount of time per visit monthly. Among other services are: sladur.com, flirt4e.com, 3aka4ka.com,
svejo.net, elmaz.com, atol.bg, sibir.bg.
In terms of significant forces of the community branch of the online market in Bulgaria,
there are also three services belonging to dir.bg: glog.dir.bg – popular place for teens to have a kind
of blogs – their websites covering areas of interest to them; clubs.dir.bg – clubs that are visited by
people with specific common interests and friends.dir.bg – a dating site. Apart from the latter, which
still has marginal impact, the first two services have a reach exceeding 20 percent and are important
elements of the Bulgarian social network market.
As far as age groups are concerned, people aged 30+ generally use the facebook.com
network and a few Bulgarian sites such as dotbulgaria.com, narod.bg and ibox.bg. Similarly to many
other markets, in Bulgaria a constant growth of the Facebook network can be observed and the
service is now estimated to out-reach all other community sites and have a strong position among
top ten websites on this market.
2. ONLINE AUDIENCE
2.1. Socio-demographic profile
The share of men and women is almost equal, with a minimal advantage of men using the
internet. Moreover, average time spent per visitor is very similar between both genders. However, as
far as percentage of page views measured in the gemiusAudience study2 is concerned, women
generate a slightly more. Among the youngest internet users, aged 15-24, women dominate. At the
same time among age groups 25-34 and 34-44 men constitute the majority.
2 In January 2009 gemiusAudience study in Bulgaria covered 146 websites (number of panelists - 67933).

BULGARIA
Chart 8 Bulgarian online population – gender structure by age intervals (gemiusAudience, January 2009)
In general the Bulgarian internet is clearly dominated by young people, aged 15-24, and they
account for 30 percent of the online population. Furthermore, users belonging to this age group
spent the greatest amount of time surfing the measured sites (average time per user monthly in this
group in January 2009 was more than 11 hours, whereas the average time throughout the population
was almost 7 hours).
Chart 9 Average time spent per user and share of age groups in Bulgarian online population (gemiusAudience, January 2009)
More than half of the internet users in Bulgaria have a secondary level education and they
generate over 51 percent of all page views made on measured services. Interestingly, the second
largest group constitutes people with a higher level of education (30 percent), but they generate only
14 percent of all page views shown in the gemiusAudience study. At the same time, users with a
16%
11%9% 8%
4%
14% 13%12%
7%
4%
0%
5%
10%
15%
20%
[15
-24
]
[25
-34
]
[35
-44
]
[45
-54
]
[55
+]
Age / gender
Female Male
00:00:00
02:00:00
04:00:00
06:00:00
08:00:00
10:00:00
12:00:00
0%
5%
10%
15%
20%
25%
30%
35%
[15
-24
]
[25
-34
]
[35
-44
]
[45
-54
]
[55
+]
Age / average time spent per user
age intervals average time per user

BULGARIA
basic education level, constituting only 13 percent of the internet population, are responsible for 28
percent of page views. As for the average time per visitor spent on the services measured in the
study, users with primary or no education spent by far the greatest amount of time surfing the
internet – around 17 hours 14 minutes.
Chart 10 Education of Bulgarian online population and share of page views (gemiusAudience, January 2009)
Bulgarian users living in big cities account for the majority of the online population, among
which users from Sofia constitute almost 30 percent. The other significant group is created by people
in cities with over 20 000 inhabitants – 18 percent. Generally, the share of the online population
decreases with the decrease in the size of place of living.
Chart 11 Bulgarian online population – size of settlement (gemiusAudience, January 2009)
1%
13%
52%
5%
30%
3%
28%
51%
3%
14%
0%
10%
20%
30%
40%
50%
60%P
rim
ary
or
no
e
du
cati
on
Bas
ic
Seco
nd
ary
sch
oo
l
Hig
h s
cho
ol -
bac
he
lor
(se
mi-
hig
he
r)
Mas
ters
de
gre
e,
do
cto
r
Education /share of page views
share of education level groups share of page views
29%
8% 8%5%
12%
18%
13%
7%
0%
5%
10%
15%
20%
25%
30%
35%
Sofi
a
Var
na
Plo
vdiv
Bu
rgas
Oth
er
ove
r1
00
00
0 c
itiz
ens
Oth
er
20
00
0to
99
99
9 c
itiz
en
s
Oth
er
5 0
00
to 1
9 9
99
cit
ize
ns
Oth
er
less
th
an4
99
9 c
itiz
en
s
Size of settlement
BULGARIA
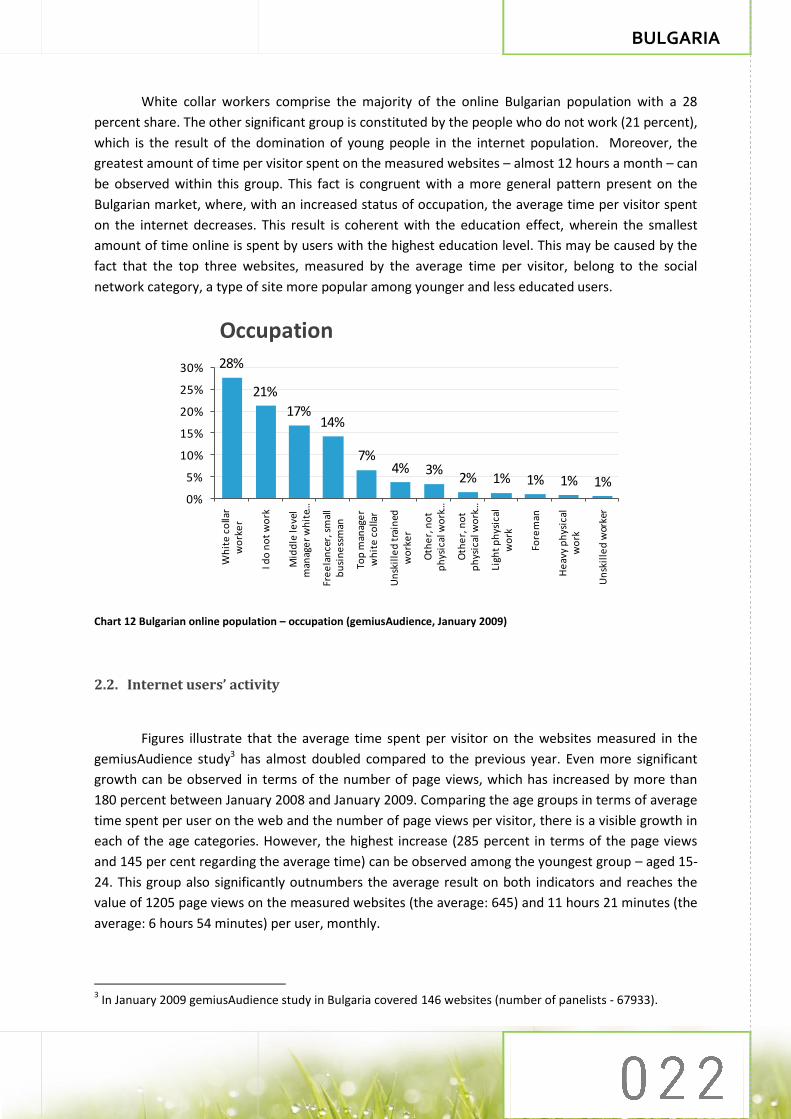
White collar workers comprise the majority of the online Bulgarian population with a 28
percent share. The other significant group is constituted by the people who do not work (21 percent),
which is the result of the domination of young people in the internet population. Moreover, the
greatest amount of time per visitor spent on the measured websites – almost 12 hours a month – can
be observed within this group. This fact is congruent with a more general pattern present on the
Bulgarian market, where, with an increased status of occupation, the average time per visitor spent
on the internet decreases. This result is coherent with the education effect, wherein the smallest
amount of time online is spent by users with the highest education level. This may be caused by the
fact that the top three websites, measured by the average time per visitor, belong to the social
network category, a type of site more popular among younger and less educated users.
Chart 12 Bulgarian online population – occupation (gemiusAudience, January 2009)
2.2. Internet users’ activity
Figures illustrate that the average time spent per visitor on the websites measured in the
gemiusAudience study3 has almost doubled compared to the previous year. Even more significant
growth can be observed in terms of the number of page views, which has increased by more than
180 percent between January 2008 and January 2009. Comparing the age groups in terms of average
time spent per user on the web and the number of page views per visitor, there is a visible growth in
each of the age categories. However, the highest increase (285 percent in terms of the page views
and 145 per cent regarding the average time) can be observed among the youngest group – aged 15-
24. This group also significantly outnumbers the average result on both indicators and reaches the
value of 1205 page views on the measured websites (the average: 645) and 11 hours 21 minutes (the
average: 6 hours 54 minutes) per user, monthly.
3 In January 2009 gemiusAudience study in Bulgaria covered 146 websites (number of panelists - 67933).
28%
21%
17%14%
7%4% 3%
2% 1% 1% 1% 1%0%
5%
10%
15%
20%
25%
30%
Wh
ite
co
llar
wo
rke
r
I do
no
t w
ork
Mid
dle
leve
l m
anag
er
wh
ite …
Fre
ela
nce
r, s
mal
l b
usi
ne
ssm
an
Top
man
age
r w
hit
e c
olla
r
Un
skil
led
tra
ined
w
ork
er
Oth
er,
no
t p
hys
ical
wo
rk …
Oth
er,
no
t p
hys
ical
wo
rk …
Ligh
t p
hys
ical
w
ork
Fore
man
He
avy
ph
ysic
al
wo
rk
Un
skil
led
wor
ker
Occupation

BULGARIA
Chart 13 Average number of page views per user monthly (age intervals) (gemiusAudience, January 2009)
Chart 14 Average time spent per user monthly (age intervals) (gemiusAudience, January 2009)
3. TOOLS
3.1. Browsers
The most popular browser in Bulgaria is Microsoft Internet Explorer. Nevertheless it has been
losing its popularity in recent years, its share decreasing from 73 percent in the third quarter of 2007
to 55 percent in the last quarter of the year 2008. The fall in MSIE popularity was accompanied by
the growing popularity of Firefox, its share growing from 22 percent in 2007 to 38 percent in the last
quarter of 2008. The third force on the Bulgarian browser market is Opera, whose share used to
oscillate around the 4 percent level, yet in the last quarter of the year 2008, 5 percent of the visits
313186 229 184 154
1 206
432 454 358
257
-
200
400
600
800
1 000
1 200
1 400
[15
-24
]
[25
-34
]
[35
-44
]
[45
-54
]
[55
+]
Average number of page views per user (age intervals)
2008 2009
00:00:00
02:00:00
04:00:00
06:00:00
08:00:00
10:00:00
12:00:00
[15
-24
]
[25
-34
]
[35
-44
]
[45
-54
]
[55
+]
Average time spent per user(age intervals)
2008 2009

BULGARIA
were generated by visitors using Opera. Other browsers on the Bulgarian market account for around
1 percent of share.
Chart 15 Top browsers in Bulgaria by share of page views generated by internet users who visit the Bulgarian web sites
using gemiusTraffic (gemiusTraffic study 1Q 2007 – 4Q 2008)
3.2. Operating systems
Windows XP is the most popular operating system in Bulgaria and since 2007 its share has
consistently been over 92 percent. However, Windows Vista has been gaining popularity – its share
increasing from 1 percent in 2007 to 6 percent in 2008. Other Windows operating systems have been
losing their share, such as Linux, which in the fourth quarter of 2008 had only 0.3 percent share.
Chart 16 Top operating systems in Bulgaria by share of the page views generated by internet users who visit the
Bulgarian web sites using gemiusTraffic (gemiusTraffic study 1Q 2007 – 4Q 2008)
0%
10%
20%
30%
40%
50%
60%
70%
80%
3Q
20
07
4Q
20
07
1Q
20
08
2Q
20
08
3Q
20
08
4Q
20
08
Browsers
MSIE Firefox Opera other
0%
20%
40%
60%
80%
100%
3Q
20
07
4Q
20
07
1Q
20
08
2Q
20
08
3Q
20
08
4Q
20
08
Operating systems
Windows XP Windows Vista other

BULGARIA
3.3. Search engines
Undoubted leader on the search engine market in Bulgaria is Google with a consistent
share of over 98 percent. Although MSN’s popularity has been growing in recent years, it still has just
a little over 1 percent share, a similar figure to Yahoo.
Chart 17 Top search engines in Bulgaria by share visits made by internet users who visit the Bulgarian web sites using
gemiusTraffic (gemiusTraffic study 1Q 2007 – 2Q 2009)
3.4. Screen resolutions
The most popular screen resolution in Bulgaria is 1024x768 although it has lost its
popularity during recent years – decreasing from 60 percent in the third quarter of 2007 to 50
percent at the end of 2008. The second most popular screen resolution is 1280x1024, which hovers
around the 20 percent mark. However, less typical screen resolutions such as 1280x800, 1440x900
have increased their share in recent years. At the same time, the 800x600 resolution has become less
popular.
Chart 18 Screen resolutions in Bulgaria by share of the page views generated by Internet users who visit the Bulgarian web sites using gemiusTraffic (gemiusTraffic study 1Q 2007 – 4Q 2009)
0%
20%
40%
60%
80%
100%3
Q 2
00
7
4Q
20
07
1Q
20
08
2Q
20
08
3Q
20
08
4Q
20
08
1Q
20
09
2Q
20
09
Search engines
Google MSN Yahoo other
0%
10%
20%
30%
40%
50%
60%
70%
3Q
20
07
4Q
20
07
1Q
20
08
2Q
20
08
3Q
20
08
4Q
20
08
Screen resolutions
1024 x 768 1280 x 1024 1280 x 8001440 x 900 800 x 600 other

CROATIA
CROATIA
1. MAIN PLAYERS
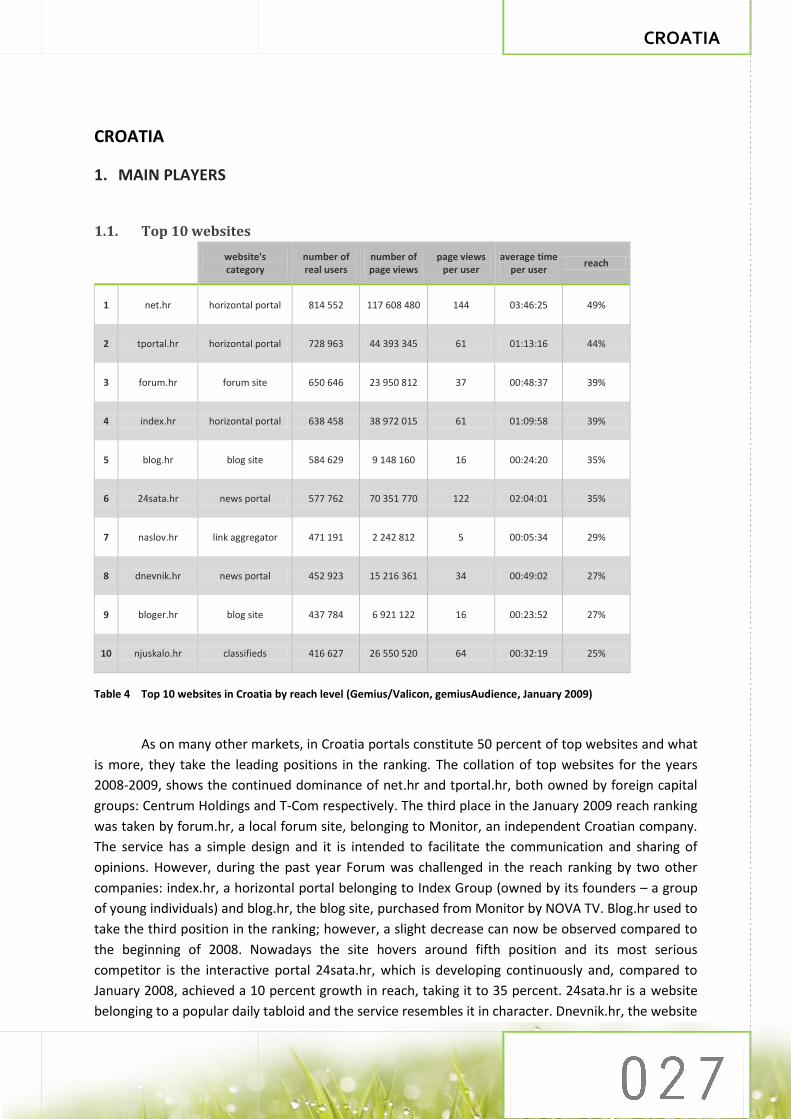
1.1. Top 10 websites
website's category
number of real users
number of page views
page views per user
average time per user
reach
1 net.hr horizontal portal 814 552 117 608 480 144 03:46:25 49%
2 tportal.hr horizontal portal 728 963 44 393 345 61 01:13:16 44%
3 forum.hr forum site 650 646 23 950 812 37 00:48:37 39%
4 index.hr horizontal portal 638 458 38 972 015 61 01:09:58 39%
5 blog.hr blog site 584 629 9 148 160 16 00:24:20 35%
6 24sata.hr news portal 577 762 70 351 770 122 02:04:01 35%
7 naslov.hr link aggregator 471 191 2 242 812 5 00:05:34 29%
8 dnevnik.hr news portal 452 923 15 216 361 34 00:49:02 27%
9 bloger.hr blog site 437 784 6 921 122 16 00:23:52 27%
10 njuskalo.hr classifieds 416 627 26 550 520 64 00:32:19 25%
Table 4 Top 10 websites in Croatia by reach level (Gemius/Valicon, gemiusAudience, January 2009)
As on many other markets, in Croatia portals constitute 50 percent of top websites and what
is more, they take the leading positions in the ranking. The collation of top websites for the years
2008-2009, shows the continued dominance of net.hr and tportal.hr, both owned by foreign capital
groups: Centrum Holdings and T-Com respectively. The third place in the January 2009 reach ranking
was taken by forum.hr, a local forum site, belonging to Monitor, an independent Croatian company.
The service has a simple design and it is intended to facilitate the communication and sharing of
opinions. However, during the past year Forum was challenged in the reach ranking by two other
companies: index.hr, a horizontal portal belonging to Index Group (owned by its founders – a group
of young individuals) and blog.hr, the blog site, purchased from Monitor by NOVA TV. Blog.hr used to
take the third position in the ranking; however, a slight decrease can now be observed compared to
the beginning of 2008. Nowadays the site hovers around fifth position and its most serious
competitor is the interactive portal 24sata.hr, which is developing continuously and, compared to
January 2008, achieved a 10 percent growth in reach, taking it to 35 percent. 24sata.hr is a website
belonging to a popular daily tabloid and the service resembles it in character. Dnevnik.hr, the website

CROATIA
of NOVA TV, is the last portal among the ten top players. Its market position seems to be unstable
and a several percent change was observed last year. In January 2009 Dnevnik.hr attained a 27
percent market reach.
Chart 19 Top 10 websites in Croatia – reach trends (Gemius/Valicon, gemiusAudience, January 2008 – January 2009)
Among other players, not belonging to the portal category there is also naslov.hr, a very
young site, which plays the role of a link aggregator. However, it is said to be overusing SEO methods
to gain an audience. There is also bloger.hr belonging to the same group as index.hr. Another site
among top ten is njuskalo.hr, the biggest classified ad site, owned by Styria group.
Some other important sites, not included in the Gemius/Valicon, gemiusAudience study, are
oglasnik.hr (classifieds), moj-posao.net (job portal) and two portals belonging to daily newspapers:
jutarnij.hr and vecernij.hr. According to rumours Europa Press Holding – the owner of Jutarni will
soon buy Monitor group. It is congruent with the trend that traditional big media companies are
buying the smaller independent web-sites as a way of entering the online business.
0%
10%
20%
30%
40%
50%
60%
01
. 20
08
02
. 20
08
03
. 20
08
04
. 20
08
05
. 20
08
06
. 20
08
07
. 20
08
08
. 20
08
09
. 20
08
10
. 20
08
11
. 20
08
12
. 20
08
01
. 20
09
Top players
net.hr tportal.hr forum.hr index.hr blog.hr24sata.hr naslov.hr dnevnik.hr bloger.hr njuskalo.hr

CROATIA
1.2. Top portals
number of real users
number of page views
page views per user
average time per user
reach
1 net.hr 814 552 117 608 480 144 03:46:25 49%
2 tportal.hr 728 963 44 393 345 61 01:13:16 44%
3 index.hr 638 458 38 972 015 61 01:09:58 39%
4 24sata.hr 577 762 70 351 770 122 02:04:01 34%
5 dnevnik.hr 452 923 15 216 361 34 00:49:02 27%
Table 5 Top 5 portals in Croatia by reach level (Gemius/Valicon, gemiusAudience, January 2009)
All of the most important portals on the Croatian online market are also present among top
ten services, with net.hr and tportal.hr being the leaders. The significant position of those sites might
be partly due to the fact, that the majority of Croatian portals are owned by large foreign investors.
For example, the market leader net.hr formerly known as iskon.hr, since the middle of 2008 has
belonged to Centrum Holdings, a company that also possesses significant sites on the Czech and
Slovakian markets. After the acquisition, slow but systematic growth could be observed and in
January the service achieved its highest reach of 49 percent, which gave it the unchallenged leading
position. Net.hr is the largest portal in Croatia, with more than 800,000 visitors monthly. The
company provides its users with various sites that specialize in all aspects of Croatian life from single
ads to movie listings, store openings, info portal or free email and chat. However, the service is not a
monopolist and has a serious competitor in tportal.hr. This website belongs to the largest ISP
provider, T-com and in the past took first place in the Gemius/Valicon, gemiusAudience reach
ranking. In January the number of visitors on that service was almost 730,000, a 44 percent reach.
Yet, the positions seem to remain stable, with a visible advantage for net.hr.
Index.hr, constitutes the only significant force on the Croatian portal market which is not
owned by a multinational corporation. The portal is perceived as daring for highlighting many
scandals and affairs. Besides news, Index offers a wide range of services, such as blogs, videos,
forum, sport, nightlife info and so on. The company, taken as a group (Index Media Group which also
owns bloger.hr,) achieved the second position on the market in terms of reach with the result of 48
percent. However, when the service index.hr is taken into account separately, it attains a 39 percent
share of Croatian internet users, among which the majority consists of men.
The other two portals, 24sata.hr and dnevnik.hr, a little less influential, are owned by a top
daily tabloid newspaper (a member of Styria group) and national TV station NOVA TV respectively.

CROATIA
1.3. Social networks
number of real users
number of page views
page views per user
average time per user
reach
1 tulumarka.com 72 945 1 217 530 17 00:07:21 4%
Table 6 Top social networks in Croatia by reach level (Gemius/Valicon, gemiusAudience, January 2009)
In contrast to the majority of the CEE countries, the online community market in Croatia is
not very well developed. Whereas in most of the internet markets of the region at least one local
player operates a social network category that is present among the top ten websites, in Croatia the
most important local service of this kind – Iskrica – is not that popular. The site is designed for dating
and it has been present on the market for almost ten years. The second local player – tulumarka.com
– belongs to the In Media Group, a company that also owns other significant domains, including moj-
posao.net, the popular job portal. Tulumarka has a reach exceeding 4 percent, with over 70,000 real
users.
The absence of local community sites among the market leaders might be explained simply
by the lack of a strong player which would be able to interest and attract a wide audience. The
phenomenon of Facebook, the largest social network, which is still growing in popularity on the
Croatian market, shows that internet users in this country are keen on virtual communities.
According to some informal estimates, one fourth of the Croatian population, or almost 40 percent
of internet users, have an account on Facebook. As far as global services are concerned,
myspace.com has quite a high popularity rating among music fans and teenagers (higher, in fact,
than both of the local sites). Moreover, LinkedIn, a specialized network, popular among younger,
business people, is also available on this market, but is not widely used.
2. ONLINE AUDIENCE
2.1. Socio-demographic profile
There is still an obvious domination of men among internet users in Croatia, where they
comprise 53 percent of the online population. However, this disparity is constantly decreasing. In
January 2007 there was an 8 percentage point difference among the share of genders in online
population and two years later it was only 5 percentage points. As far as gender differences among
age groups in the online population are concerned, women significantly predominate only among
young users (aged 15-24) but in the groups over 35 years old, there is a noticeable male dominance.

CROATIA
Chart 20 Croatian online population – gender structure by age (age intervals) (Gemius/Valicon, gemiusAudience, January 2009)
Age structure is similar to that observed in the majority of CEE countries, where the internet
is the domain of young people – the 15-24 age group accounts for 36 percent of all internet users in
Croatia. The share in total online population decreases with the increase in age and is the lowest for
the oldest users – 55 and over (only 6 percent). However, comparing to the year 2007, the
dominance of young people starts to diminish and though still the highest, the share of youths in the
online population begins to decrease systematically.
Chart 21 Croatian online population – age – trends (Gemius/Valicon, gemiusAudience, January 2007, 2008 and 2009)
The vast majority of internet users finished high school and they comprise 44 percent of the
online population and generate the 47 percent of all page views measured in the Gemius/Valicon,
19%
12%
9%
5%
2%
17%
12% 13%
7%4%
0%
5%
10%
15%
20%
[15
-24
]
[25
-34
]
[35
-44
]
[45
-54
]
[55
+]
Gender / age
Female Male
39%
26%
19%
10%6%
37%
23%21%
13%
6%
36%
24%21%
13%
6%
0%5%
10%15%20%
25%
30%
35%
40%
45%
[15
-24
]
[25
-34
]
[35
-44
]
[45
-54
]
[55
+]
Age
01.2007 01.2008 01.2009

CROATIA
gemiusAudience study.4 The other significant group of users, 33 percent, have not yet finished their
education, while those with elementary education constitute 2 % of internet users.
Chart 22 Education level structure of Croatian online population and share of page views by education (Gemius/Valicon, gemiusAudience, January 2009)
In general, Croatian internet users are either employed (27 percent) or they are still studying
(23 percent). Visitors from both of these categories are also the most active in terms of page views.
The smallest group of internet users consists of housewives, but they spent almost two hours more
than the average Croatian internet user on surfing the internet and generate the greatest number of
page views per person.
4 In January 2009 Gemius/Valicon, gemiusAudience study in Croatia covered 229 websites (number of panelists
- 28339).
3%
43%
21%
33%
2%
47%
20%
31%
0%
10%
20%
30%
40%
50%
ele
me
ntar
ysc
ho
ol o
r le
ss
hig
hsc
ho
ol
hig
h,
hig
he
r sc
ho
ol,
un
ive
rsit
yo
r m
ore
stil
l in
sch
oo
l /fa
cult
y
Education, share of page views
share of education level groups share of page views
27%
23%
19%
15%
6%4% 3% 2% 2%
28%
23%
18%
12%
7%
4% 3%2% 3%
0%
5%
10%
15%
20%
25%
30%
em
plo
yed
in c
om
pan
y
stu
de
nt
em
plo
yed
inp
ub
lic
sect
or
stil
l at
sch
oo
l
un
em
plo
yed
self
em
plo
yed
pe
nsi
on
er
oth
er
ho
use
wif
e
Occupation / share of page views
share of occupation groups share of page views
Chart 23 Occupation structure of Croatian online population and share of page views by occupation (Gemius/Valicon, gemiusAudience, January 2009)

CROATIA
As far as size of the place of residence is concerned, the majority of internet users – 31
percent – live in cities with more than 100,000 inhabitants. Each of the other groups accounts for 10-
20 percent, with the lowest share of people living in places with fewer than 999 inhabitants.
Chart 24 Croatian online population – settlement size (Gemius/Valicon, gemiusAudience, January 2009)
2.2. Internet users activity
Within the last three years, the time spent on the websites measured in the Gemius/Valicon,
gemiusAudience study5 has been systematically increasing and now it surpasses the average time of
internet usage in January 2007 by about 1 hour 48 minutes. The same pattern can be observed in the
average number of page views per user, which increased 44 percent from 2007 to 2009. Those
results indicate that the internet is becoming ever more popular and intensively used in Croatia. The
increase in average time spent online is significant in the over 25 age group. Surprisingly, as far as
younger users are concerned, the amount of time spent on the web has decreased by approximately
40 minutes from last year and now it is almost at the same level as in 2007. The same pattern can be
observed in terms of the number of page views. Whereas in all age groups over 25, the number of
page views had increased more or less 20 percent compared to 2008, in the youngest groups we can
observe a 9 percent decrease. This is probably due to increased internet usage among older groups,
while younger and more experienced groups have started to visit more intensively international
websites such as Facebook and MySpace.
5 In January 2009 Gemius/Valicon, gemiusAudience study in Croatia covered 229 websites (number of panelists
- 28339).
9%
17% 18%15%
31%
10%
0%
5%
10%
15%
20%
25%
30%
35%
up
to
99
9in
hab
itan
ts
10
00
-4
99
9in
hab
itan
ts
5 0
00
-2
4 9
99
inh
abit
ants
25
00
0 -
99
99
9in
hab
itan
ts
10
0 0
00
-1
00
0 0
00
inh
abit
ants
do
no
t kn
ow
Size of settlement

CROATIA
Chart 25 Gemius/Valicon, gemiusAudience, January 2007, January 2008, and January 2009
Chart 26 Gemius/Valicon, gemiusAudience, January 2007, January 2008, and January 2009
3. TOOLS
3.1. Browsers
As in many other CEE markets, in Croatia Microsoft Internet Explorer is slowly losing its
popularity. The percentage of page views generated in the gemiusTraffic study with the aid of this
browser decreased from 64 percent at the end of 2007 to 50 percent in the second quarter of 2009.
Firefox has become the main rival for MSIE in recent years and currently it has a 44 percent share of
the Croatian browser market. Opera is the third force on the market, but its share remains stable at
around 3 percent.
00:00:00
03:00:00
06:00:00
09:00:00
[15
-24
]
[25
-34
]
[35
-44
]
[45
-54
]
[55
+]
Average time spentper user (age intervals)
01.2007 01.2008 01.2009
325267
208237
205
402356 344 329
278
367418 428 406
335
0
100
200
300
400
500
[15
-24
]
[25
-34
]
[35
-44
]
[45
-54
]
[55
+]
Average number of page viewsper user (age intervals)
01.2007 01.2008 01.2009
CROATIA
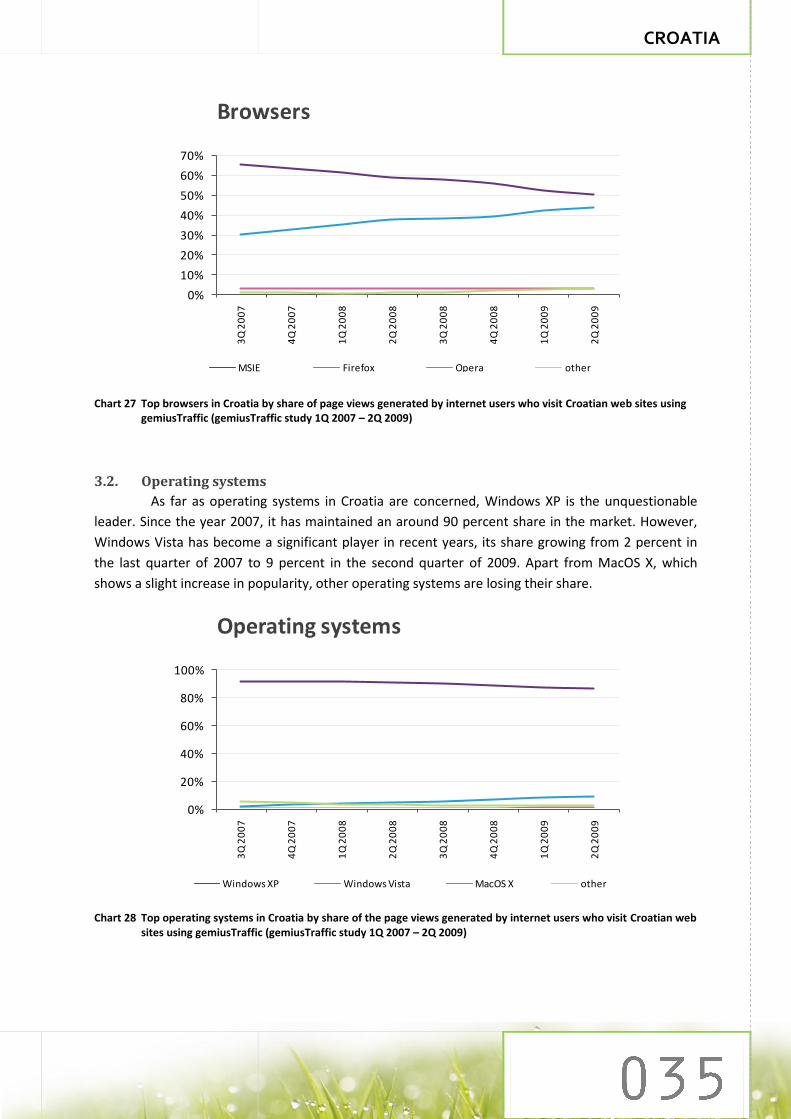
Chart 27 Top browsers in Croatia by share of page views generated by internet users who visit Croatian web sites using gemiusTraffic (gemiusTraffic study 1Q 2007 – 2Q 2009)
3.2. Operating systems
As far as operating systems in Croatia are concerned, Windows XP is the unquestionable
leader. Since the year 2007, it has maintained an around 90 percent share in the market. However,
Windows Vista has become a significant player in recent years, its share growing from 2 percent in
the last quarter of 2007 to 9 percent in the second quarter of 2009. Apart from MacOS X, which
shows a slight increase in popularity, other operating systems are losing their share.
Chart 28 Top operating systems in Croatia by share of the page views generated by internet users who visit Croatian web sites using gemiusTraffic (gemiusTraffic study 1Q 2007 – 2Q 2009)
0%
10%
20%
30%
40%
50%
60%
70%
3Q
20
07
4Q
20
07
1Q
20
08
2Q
20
08
3Q
20
08
4Q
20
08
1Q
20
09
2Q
20
09
Browsers
MSIE Firefox Opera other
0%
20%
40%
60%
80%
100%
3Q
20
07
4Q
20
07
1Q
20
08
2Q
20
08
3Q
20
08
4Q
20
08
1Q
20
09
2Q
20
09
Operating systems
Windows XP Windows Vista MacOS X other
CROATIA
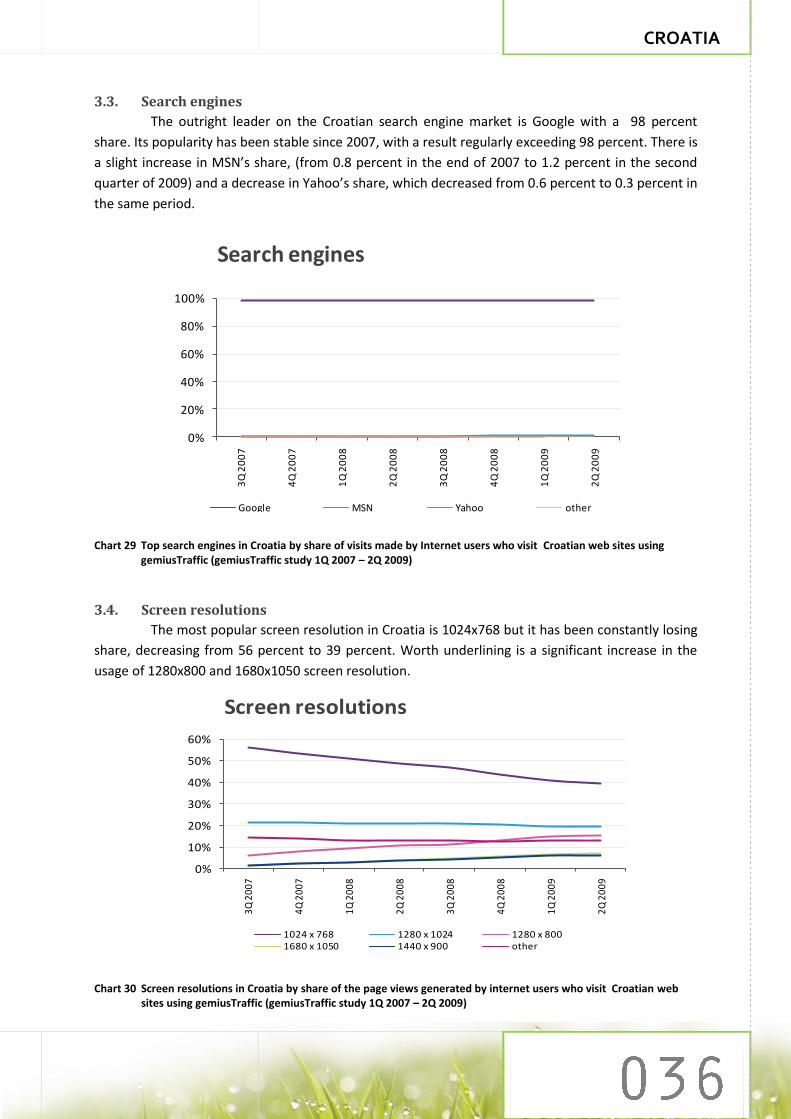
3.3. Search engines
The outright leader on the Croatian search engine market is Google with a 98 percent
share. Its popularity has been stable since 2007, with a result regularly exceeding 98 percent. There is
a slight increase in MSN’s share, (from 0.8 percent in the end of 2007 to 1.2 percent in the second
quarter of 2009) and a decrease in Yahoo’s share, which decreased from 0.6 percent to 0.3 percent in
the same period.
Chart 29 Top search engines in Croatia by share of visits made by Internet users who visit Croatian web sites using gemiusTraffic (gemiusTraffic study 1Q 2007 – 2Q 2009)
3.4. Screen resolutions
The most popular screen resolution in Croatia is 1024x768 but it has been constantly losing
share, decreasing from 56 percent to 39 percent. Worth underlining is a significant increase in the
usage of 1280x800 and 1680x1050 screen resolution.
Chart 30 Screen resolutions in Croatia by share of the page views generated by internet users who visit Croatian web sites using gemiusTraffic (gemiusTraffic study 1Q 2007 – 2Q 2009)
0%
20%
40%
60%
80%
100%
3Q
20
07
4Q
20
07
1Q
20
08
2Q
20
08
3Q
20
08
4Q
20
08
1Q
20
09
2Q
20
09
Search engines
Google MSN Yahoo other
0%
10%
20%
30%
40%
50%
60%
3Q
20
07
4Q
20
07
1Q
20
08
2Q
20
08
3Q
20
08
4Q
20
08
1Q
20
09
2Q
20
09
Screen resolutions
1024 x 768 1280 x 1024 1280 x 8001680 x 1050 1440 x 900 other


CZECH REPUBLIC
CZECH REPUBLIC
1. MAIN PLAYERS
1.1. Top 10 websites
website's category
number of real users
number of page views
page views per user
average time per user
reach
1 seznam.cz horizontal
portal 4 160 510 2 596 976 307 624 19:08:11 83%
2 novinky.cz news portal 2 811 653 210 380 637 75 01:50:48 56%
3 idnes.cz news portal 2 760 044 289 416 378 105 01:51:35 55%
4 centrum.cz horizontal
portal 2 525 140 445 188 223 176 03:22:14 51%
5 firmy.cz company
catalogues 2 089 364 65 544 255 31 00:29:24 42%
6 super.cz news portal 2 051 261 126 090 789 61 00:49:45 41%
7 mapy.cz maps 2 050 585 35 344 129 17 00:22:28 41%
8 lide.cz social
network 1 732 688 666 560 662 385 05:50:50 35%
9 blog.cz blogs 1 715 497 116 142 839 68 00:52:37 34%
10 estranky.cz webhosting
and web creation
1 572 033 45 158 205 29 00:23:35 32%
Table 7 Top 10 websites in Czech Republic by reach level (NetMonitor – SPIR/Mediaresearch/Gemius, January 2009)
Global services remain in the shadow of local websites on the Czech Republic’s online
market. The top ten players are mainly portals and news services, with the unquestioned leader –
seznam.cz – the biggest horizontal portal and search engine. Its reach regularly exceeds eighty
percent (83 in January 2009) and, notably, it even outreaches Google, the leading search engine on
many markets. The majority shareholder in Seznam.cz is its founder, Ivo Lukačovič (Seznam.cz a.s)
while the global private equity firms Tiger Holding Four and Miura International own 30 percent.
Seznam.cz a.s is one of the strongest players on the Czech Republic’s market and operates other
popular web services such as: novinky.cz – a news portal connected to the daily newspaper Právo;
firmy.cz – a business catalogue and database of company contacts, mapy.cz – a service providing
detailed maps of the Czech Republic and lide.cz – the biggest social network on the market. All those
sites are listed in the top ten ranking and their reach exceeds 30 percent. The company also owns the
slightly less popular websites, zbozi.cz – price comparison and a search engine for e-shop goods,
spoluzaci.cz – a social network for classmates, and sbazar.cz – a service which displays online
classified advertisements.

CZECH REPUBLIC
Apart from the players represented above, another noteworthy website – indes.cz –
belonging to the company Mafra a.s., is present in the Czech Republic. This is an online news portal
with a 55 percent reach, which gives it third place in the ranking. The other important player on the
market is Centrum Holdings, which owns two significant horizontal portals centrum.cz – (51 percent
reach) and atlas.cz – (24 percent reach).
Since the top positions on the Czech Republic’s internet have stabilized in recent periods, a
continuation of this situation might be expected – seznam.cz and centrum.cz preserve their
domination among horizontal portals and idnes.cz and novinky.cz remain the biggest news services.
As observed on other markets, internet users are very keen on video entertainment. The
local player in this field is stream.cz, a ‘fun’ video portal with a lot of user-made and professionally
produced videos, and a reach of 29 percent.
1.2. Top portals
number of real users
number of page views
page views per user
average time per user
reach
1 seznam.cz 4 160 510 2 596 976 307 624 19:08:11 83%
2 novinky.cz 2 811 653 210 380 637 75 01:50:48 56%
3 idnes.cz 2 760 044 289 416 378 105 01:51:35 55%
4 centrum.cz 2 525 140 445 188 223 176 03:22:14 51%
5 super.cz 2 051 261 126 090 789 61 00:49:45 41%
Table 8 Top 5 portals in Czech Republic by reach level (NetMonitor – SPIR/Mediaresearch/Gemius, January 2009)
According to local expert opinion (Jiri Hlavenka, Lupa.cz 12/2008), it is a common belief that
Czech portals build the internet in this country. This impression is the result of attempts by these
portals to create by the use of many marketing tools, the perception of being the biggest players.
However, of the total revenue of all internet companies on the Czech Republic market, estimated at
60-80 billions CZK, the majority is generated by e-shops, with portals producing only about 5 percent
(3-4 billion CZK). This fact suggests that portals are theoretically omnipotent, but their economic
results are not dizzying. Moreover, the growth of the whole internet sector in terms of traffic and
business is faster than the growth observed for portals and it is said that, although they generally
hold leading positions, these portals are slowly losing the market share.
Nevertheless, as far as traffic indicators are concerned, portals still lead on the Czech
Republic’s online market. First position regarding reach belongs, unchangingly, to seznam.cz (83
percent), which dominates also in terms of average time spent monthly per user which exceeds 19
hours. The second important horizontal portal is centrum.cz with a reach of 51 percent and an
average time per user of over 3 hours monthly. Among horizontal portals there is also atlas.cz,

CZECH REPUBLIC
belonging to the same owner as Centrum. However, this has a lower reach than some of the news
services. Among the most important, one can find: novinky.cz, idnes.cz and super.cz, an on-line daily
tabloid produced in co-operation with seznam.cz and Stratosfera. Furthermore, in 2009 several print
media have started their own online operations, but the expectation is that only the activities of PPF
and Mlada Fronta will be successful in attacking the positions of top local and regional news portals.
1.3. Social networks
number of real users
number of page views
page views per user
average time per user
reach
1 lide.cz 1 732 688 666 560 662 385 05:50:50 35%
2 spoluzaci.cz 1 424 209 176 031 262 124 01:13:52 29%
3 libimseti.cz 1 128 913 483 856 641 429 05:58:31 23%
4 idnes.cz|Rajce.net 627 792 19 985 105 32 00:26:11 13%
5 centrum.cz|chat 314 415 56 120 103 178 02:24:41 6%
6 stesti.cz 269 296 133 701 492 496 05:52:13 5%
7 centrum.cz|fotoalba 249 051 45 197 992 181 01:07:57 5%
8 idnes.cz|ukazse.cz 180 365 10 931 666 61 00:26:22 4%
Table 9 Social networks in Czech Republic (NetMonitor – SPIR/Mediaresearch/Gemius, January 2009)
The Czech online market offers many community services. However, contrary to the majority
of the CEE countries, local players are still bigger and more important than global ones6. Even
facebook.com, the latest worldwide phenomenon, has not yet won over the community in this
country. However, it is quite possible that Facebook will eventually become the leader, mainly due to
its complexity and streaming features. Competitive services do not yet offer such advanced and
comprehensive functionalities, nor do they have the access to a worldwide audience. Apart from
Facebook, there are a few other foreign services available. linkedin.com myspace.com, and
twitter.com, but they are not significant forces on the Czech Republic’s online market.
As for the most popular local players among social communities – lide.cz dominates the
market with a reach of 35 percent. However, the audience of this website is mostly the younger
generation, within the 12-24 year age group. The service is divided into several categories, including
popular instant messaging, discussion forums, dating and blogs. The second force on the Czech
community network market, with a reach of 29 percent, is Spolužáci.cz – a classmate community,
which provides its users with the school connections and chat. The service, similar to lide.cz belongs
to seznam.cz, the dominant company in the local market.
6 Mediaresearch 2009

CZECH REPUBLIC
The other important service, also mainly used by the young, (47 percent of users are aged 15-
24 years) is libimseti.cz. This service provides a wide variety of functionalities including email,
matchmaking, chat, blog, magazine, games, the possibility of uploading photos, and even auctions.
The service currently has a total audience of around 1,130,000 real users per month, 52 percent of
which are men.
On the Czech online market, there is also a dating portal, stesti.cz, which provides all users
with an opportunity to find friends and acquaintances or a new partner. It is much more popular
among men, who account for 54 percent of the audience; yet, women spend almost two hours
longer per month on the site. Among the Czech Republic’s social network services one can also find
two services which are a part of the indes.cz portal. The first – racje.net – is a photo-sharing system
with currently more than 100,000,000 photos uploaded. The second – the entertainment service,
ukazse.cz – has a 4 percent reach and is mainly visited by men (62 percent).
2. ONLINE AUDIENCE
2.1. Socio-demographic profile
The Czech internet population is dominated by men, who comprise 54 percent. Comparing to
other CEE countries, this is quite a large discrepancy. As far as age structure is concerned, there is a
significant predominance of young users [15-24] among women, while among men’s groups *15-24]
and [25-34] constitute the majority.
Chart 31 Czech online population – gender structure (age intervals) (NetMonitor – SPIR/Mediaresearch/Gemius, January 2009)
The largest group of users is composed of people aged 15-24, who account for 27 percent of
the whole internet population. The other significant group consists of people aged 25-34 (25 percent
of the Czech online population). Moreover, this group is a leader in terms of average time per visitor
3%
14%
11%
8%6%
4%3%
13% 14%
11%
8%6%
0%
2%
4%
6%
8%
10%
12%
14%
16%
[12
-14
]
[15
-24
]
[25
-34
]
[35
-44
]
[45
-54
]
[55
+]
Gender
Female Male

CZECH REPUBLIC
spent on the websites measured in the study7 and devote almost 3 hours more than the average
Czech user.
Chart 32 Age structure of Czech online population and average time spent per user (NetMonitor – SPIR/Mediaresearch/Gemius, January 2009)
People, who have completed secondary education, constitute the most numerous group in
the Czech Republic’s online population (35 percent). However, the other group – users that are still
at high school – comprise 25 percent and spent over 8 hours more than the average user on the
monitored websites. At the same time, students devote 46 minutes less than the ordinary visitor.
Chart 33 Educational structure of Czech Republic online population and share of all page views by education, generated in the study (NetMonitor – SPIR/Mediaresearch/Gemius, January 2009)
7 In January 2009 NetMonitor – SPIR/Mediaresearch/Gemius study in Czech Republic covered 389 websites
(number of panelists - 104825).
6%
27%
25%
18%
14%
10%
0:00:00
5:00:00
10:00:00
15:00:00
20:00:00
25:00:00
30:00:00
35:00:00
40:00:00
0%
5%
10%
15%
20%
25%
30%[1
2-1
4]
[15
-24
]
[25
-34
]
[35
-44
]
[45
-54
]
[55
+]
Age / average time spent per user
share of age groups average time spent per user
9%12%
25%
35%
6%
13%
0:00:00
5:00:00
10:00:00
15:00:00
20:00:00
25:00:00
30:00:00
35:00:00
40:00:00
45:00:00
0%
5%
10%
15%
20%
25%
30%
35%
40%
Un
fin
ish
ed
pri
mar
y
Fin
ish
ed
pri
mar
y
Seco
nd
ary
ed
uca
tio
nw
ith
ou
tle
avin
ge
xam
Seco
nd
ary
ed
uca
tio
nin
clu
din
ge
xte
nsi
on
stu
die
s
Bac
he
lor
de
gre
e
Un
ive
rsit
yd
egr
ee
Education / average time spent per user
share of education level groups average time spent per user

CZECH REPUBLIC
Most of internet users are employed. This group makes up 53 percent of online Czech
population and generates more than half of all page views. However, retired people, who constitute
only 4 percent of the online population spend the largest amount of time surfing the studied
websites.
Chart 34 Czech online population – occupation structure (NetMonitor – SPIR/Mediaresearch/Gemius, January 2009)
The Czech internet is still the domain of people settled in the big cites and more than 50
percent of users live in cities with over 100,000 inhabitants. There is a linear trend in terms of share
of the internet users according to the size settlement, the percent falling with the decrease in size of
the settlement.
Chart 35 Czech online population – size of settlement (NetMonitor – SPIR/Mediaresearch/Gemius, January 2009)
53%
26%
18%
3%
Occupation
Employed (also on irregular basis)
Not working
Businessman, sale trader
Retired
13%
18% 18%
25% 26%
0%
5%
10%
15%
20%
25%
30%
Up
to
99
9
inh
abit
ants
10
00
-4
99
9 in
hab
itan
ts
50
00
-1
99
99
inh
abit
ants
20
00
0 -
99
999
inh
abit
ants
Ove
r 1
00
000
in
hab
itan
ts
Size of settlement

CZECH REPUBLIC
2.2. Internet users activity
The average time per visitor and the average number of page views per user on the websites
included in the study8 are still increasing and there is a high probability that the value of both
indicators in the year 2009 will be ten times larger than it was in the year 2005. As far as the number
of page views is concerned, the average number per visitor dynamically increases among each of the
age groups. It is worth mentioning that the difference in the dynamics of growth among each of the
groups increases with age. This means that the oldest users are becoming more familiar with the net
and use it more intensively. Exactly the same pattern can be observed with regard to the average
time spent on the web, where the most dynamic growth (around 70 percentage point comparing to
2007) can be noticed among the two oldest groups (users above 45 years old).
Chart 36 Average number of page views by age (age intervals) (NetMonitor – SPIR/Mediaresearch/Gemius, January 2007, 2008 and 2009)
8 In January 2009 NetMonitor – SPIR/Mediaresearch/Gemius study in Czech Republic covered 389 websites
(number of panelists - 104825).
11961063 991
808 789
14791265 1210
1035 942
1578 16321548
1416 1351
-
500
1 000
1 500
2 000
[15
-24
]
[25
-34
]
[35
-44
]
[45
-54
]
[55
+]
Age / average number of page viewsper user (age intervals)
01.2007 01.2008 01.2009
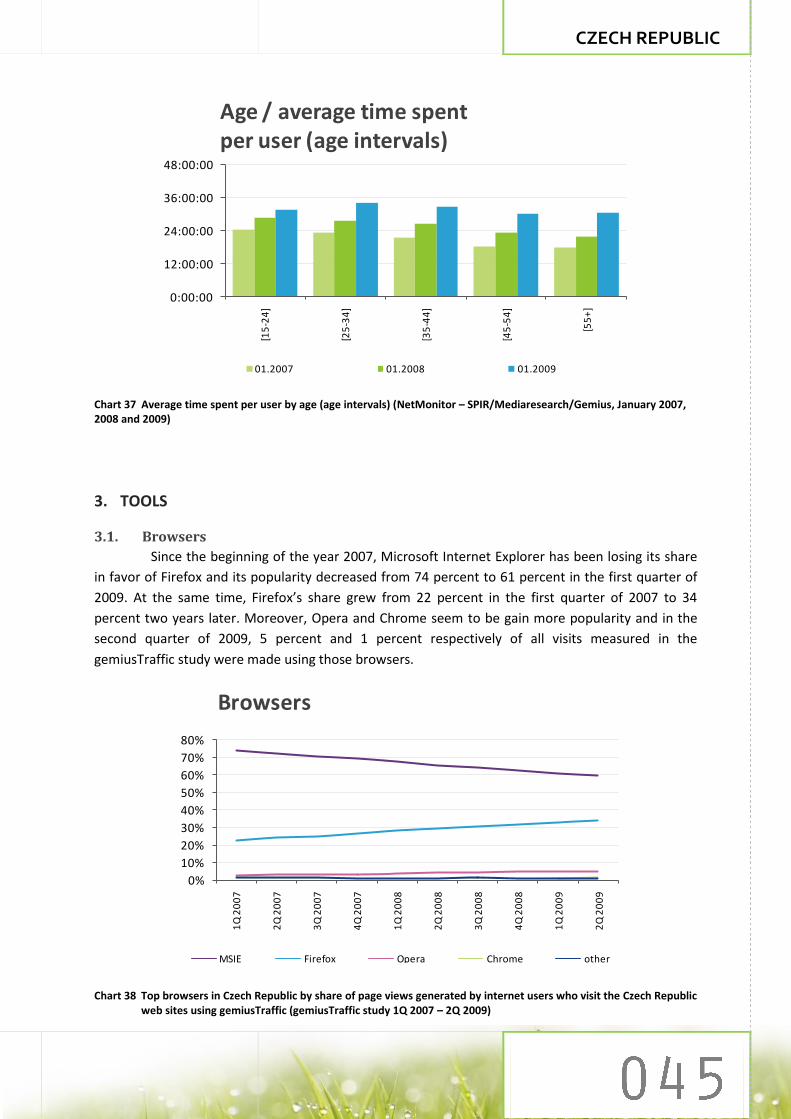
CZECH REPUBLIC
Chart 37 Average time spent per user by age (age intervals) (NetMonitor – SPIR/Mediaresearch/Gemius, January 2007, 2008 and 2009)
3. TOOLS
3.1. Browsers
Since the beginning of the year 2007, Microsoft Internet Explorer has been losing its share
in favor of Firefox and its popularity decreased from 74 percent to 61 percent in the first quarter of
2009. At the same time, Firefox’s share grew from 22 percent in the first quarter of 2007 to 34
percent two years later. Moreover, Opera and Chrome seem to be gain more popularity and in the
second quarter of 2009, 5 percent and 1 percent respectively of all visits measured in the
gemiusTraffic study were made using those browsers.
Chart 38 Top browsers in Czech Republic by share of page views generated by internet users who visit the Czech Republic web sites using gemiusTraffic (gemiusTraffic study 1Q 2007 – 2Q 2009)
0:00:00
12:00:00
24:00:00
36:00:00
48:00:00
[15
-24
]
[25
-34
]
[35
-44
]
[45
-54
]
[55
+]
Age / average time spentper user (age intervals)
01.2007 01.2008 01.2009
0%
10%
20%
30%
40%
50%
60%
70%
80%
1Q
20
07
2Q
20
07
3Q
20
07
4Q
20
07
1Q
20
08
2Q
20
08
3Q
20
08
4Q
20
08
1Q
20
09
2Q
20
09
Browsers
MSIE Firefox Opera Chrome other

CZECH REPUBLIC
3.2. Operating systems
Even though the popularity of Windows XP has decreased since 2007, it is still the most
popular operating system in the Czech Republic (79 percent). Nevertheless, Windows Vista has been
gaining new users over the past two years, its share growing from 0.2 percent in 2007 to 17 percent
in 2009. Other Windows operating systems has become less popular recently.
Chart 39 Top operating systems in Czech Republic by share of the page views generated by internet users who visit the Czech Republic web sites using gemiusTraffic (gemiusTraffic study 1Q 2007 – 2Q 2009)
3.3. Search engines
The Czech Republic’s search engines market, contrary to the majority of markets in the CEE
region, is dominated by a local player, seznam.cz. It has over 60 percent share in the market whereas
Google, the worldwide leader has just 36 percent. What is more, another Czech search engine,
Morfeo is the third force on this market and outreaches such global players as MSN or Yahoo.
Chart 40 Top search engines in Czech Republic by share visits made by internet users who visit the Czech Republic web sites using gemiusTraffic (gemiusTraffic study 1Q 2007 – 2Q 2009)
0%
20%
40%
60%
80%
100%
1Q
20
07
2Q
20
07
3Q
20
07
4Q
20
07
1Q
20
08
2Q
20
08
3Q
20
08
4Q
20
08
1Q
20
09
2Q
20
09
Operating systems
Windows XP Windows Vista Windows 2000 Windows 98 other
0%
20%
40%
60%
80%
1Q
20
09
2Q
20
09
Search engines
Seznam Google Morfeo MSN other

CZECH REPUBLIC
3.4. Screen resolutions
1024 x 768 still tends to be the most common screen resolution in Czech Republic – 33
percent of all page views measured in the gemiusTraffic study were made by the audience using the
this resolution, however, it is losing its popularity, whereas in the first quarter of 2007 it had gained
56 percent. The second most popular screen resolution is 1280 x 1024 and this fluctuates around the
20 percent share level. The resolution that has shown the most dynamic increase in popularity in
recent years is 1280 x 800 which has enlarged its share from 5 percent in the first quarter of 2007 to
18 percent years two years later.
Chart 41 Screen resolutions in Czech Republic by share of the page views generated by Internet users who visit the Bulgarian web sites using gemiusTraffic (gemiusTraffic study 1Q 2007 – 2Q 2009)
0%
10%
20%
30%
40%
50%
60%
1Q
20
07
2Q
20
07
3Q
20
07
4Q
20
07
1Q
20
08
2Q
20
08
3Q
20
08
4Q
20
08
1Q
20
09
2Q
20
09
Screen resoltutions
1024 x 768 1280 x 1024 1280 x 800 1152 x 864
1280 x 960 800 x 600 other

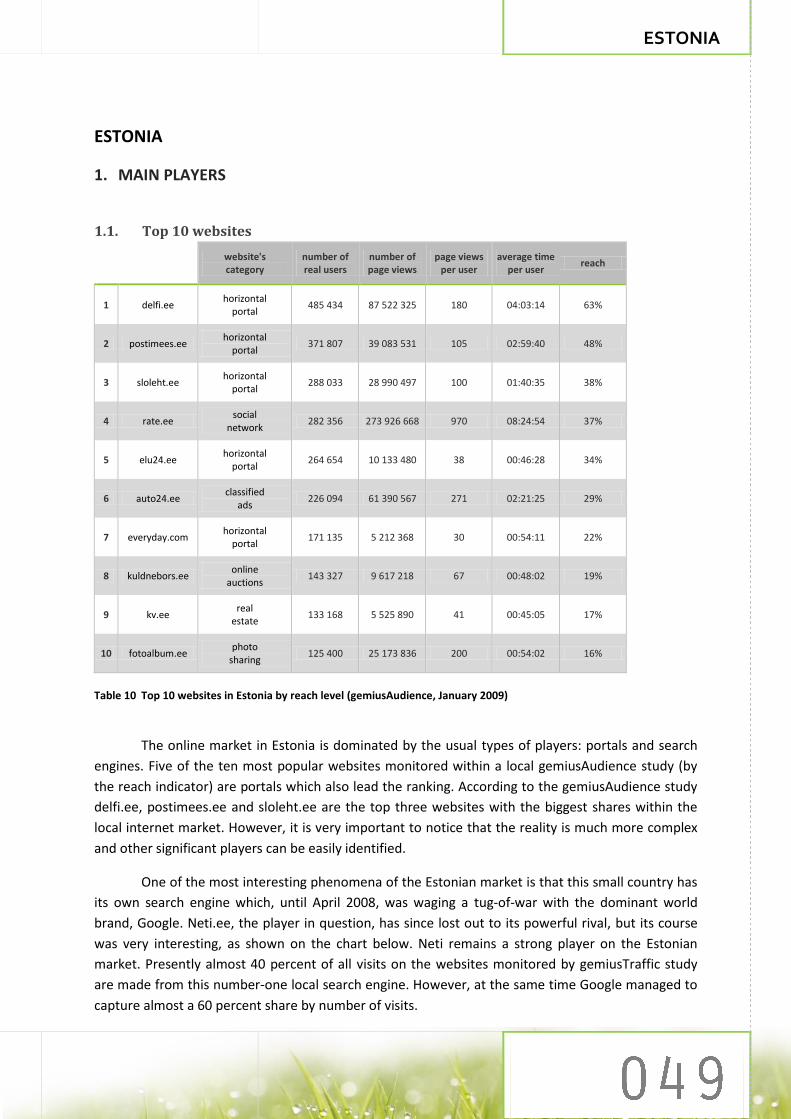
ESTONIA
ESTONIA
1. MAIN PLAYERS
1.1. Top 10 websites
website's category
number of real users
number of page views
page views per user
average time per user
reach
1 delfi.ee horizontal
portal 485 434 87 522 325 180 04:03:14 63%
2 postimees.ee horizontal
portal 371 807 39 083 531 105 02:59:40 48%
3 sloleht.ee horizontal
portal 288 033 28 990 497 100 01:40:35 38%
4 rate.ee social
network 282 356 273 926 668 970 08:24:54 37%
5 elu24.ee horizontal
portal 264 654 10 133 480 38 00:46:28 34%
6 auto24.ee classified
ads 226 094 61 390 567 271 02:21:25 29%
7 everyday.com horizontal
portal 171 135 5 212 368 30 00:54:11 22%
8 kuldnebors.ee online
auctions 143 327 9 617 218 67 00:48:02 19%
9 kv.ee real
estate 133 168 5 525 890 41 00:45:05 17%
10 fotoalbum.ee photo
sharing 125 400 25 173 836 200 00:54:02 16%
Table 10 Top 10 websites in Estonia by reach level (gemiusAudience, January 2009)
The online market in Estonia is dominated by the usual types of players: portals and search
engines. Five of the ten most popular websites monitored within a local gemiusAudience study (by
the reach indicator) are portals which also lead the ranking. According to the gemiusAudience study
delfi.ee, postimees.ee and sloleht.ee are the top three websites with the biggest shares within the
local internet market. However, it is very important to notice that the reality is much more complex
and other significant players can be easily identified.
One of the most interesting phenomena of the Estonian market is that this small country has
its own search engine which, until April 2008, was waging a tug-of-war with the dominant world
brand, Google. Neti.ee, the player in question, has since lost out to its powerful rival, but its course
was very interesting, as shown on the chart below. Neti remains a strong player on the Estonian
market. Presently almost 40 percent of all visits on the websites monitored by gemiusTraffic study
are made from this number-one local search engine. However, at the same time Google managed to
capture almost a 60 percent share by number of visits.

ESTONIA
Chart 42 Google.com and neti.ee – shares in search (gemiusTraffic, 26.12.2006-06.10.2008 / weekly data)
The most popular websites in Estonia are based on clear business models. Except for various
kinds of portals and news services, the main part of the local market constitutes e-commerce
platforms, TV guides or weather services. However, there are also strong brands on the market,
which are varying this general landscape. One of such is rate.ee, the only social networking service
present within the top group of local internet players. According to the gemiusAudience study, in
January 2009 it was the fourth most popular website on the market (by reach). Moreover, Rate.ee is
the only significant local internet service of its kind available in Estonia. This not isolated case gives a
modest view of the whole local market and illustrates its size, characteristics and the gap successively
filled by global players and their products.
1.2. Top portals
number of real users
number of page views
page views per user
average time per user
reach
1 delfi.ee 485 434 87 522 325 180 04:03:14 63%
2 postimees.ee 371 807 39 083 531 105 02:59:40 48%
3 sloleht.ee 288 033 28 990 497 100 01:40:35 38%
4 elu24.ee 264 654 10 133 480 38 00:46:28 34%
5 everyday.com 171 135 5 212 368 30 00:54:11 22%
Table 11 Top 5 portals in Estonia by reach level (gemiusAudience, January 2009)
0%
10%
20%
30%
40%
50%
60%
70%
1 11 21 31 41 51 61 71 81 91
Google.com / Neti.ee
neti.ee google.com
weeks

ESTONIA
The online portals in Estonia are the websites with a permanently high popularity rating. The
traffic data for three of the five top portals in this country did not change significantly since 2006, as
with the general ranking of the main players within the category. However, some reductions and
growths can be identified. According to the gemiusAudience study, everyday.com, presently the fifth
ranked portal in Estonia, as recently as three years ago had a reach fifty percent more than its
present position. But there is also a winner from the last three years of competition – postimees.ee.
This portal takes the second position within the presented ranking, but it is worthy of notice that it
was not always so high. Postimees improved its position by increasing its reach level from 32 percent
in January 2006 to almost 49 percent in January 2009.
Chart 43 Top portals in Estonia – reach trends (gemiusAudience, January 2006 – 2009)
The minimal changes within the popularity of top portals in Estonia are the result of the
frozen structure of the local market. Delfi.ee (as well as a other portals, which are mostly online
projects of newspaper companies or are closely related to similar ones) occupy a dominant position
which seems to be completely inviolable. According to local specialist opinion, it is very hard today
for a new portal to gain any real audience within the Estonian internet. Moreover, this situation is
even more apparent when the ownership of the existing players is considered. Within this structure
it is also easy to identify the companies or media groups (like Ekspress Group or Eesti Meedia) which
own the best performing titles and, in reality, play the role of local potentates. As a result it is safe to
say that this sector of the Estonian internet is well developed.
0%
10%
20%
30%
40%
50%
60%
70%
80%
01
.20
06
01
.20
07
01
.20
08
01
.20
09
Top portals
delfi.ee everyday.com postimees.ee

ESTONIA
1.3. Social networks
number of real users
number of page views
page views per user
average time per user
Reach
1 rate.ee 282 356 273 926 668 970 08:24:54 37%
2 keskus.ee 48 222 859 115 17 00:13:03 6%
Table 12 Top social networks in Estonia by reach level (gemiusAudience, January 2009)
In contrast to Estonian portals, there are only few local social networking services. Apart
from orkut.com, facebook.com, myspace.com or odnoklassniki.ru, which are quite popular among
Estonian internet users, there is only one visible local player that manages this part of the users’
activity – rate.ee. The only site that plays a similar role and can be regarded as a non-marginal
project is keskus.ee, an online community of people sharing multimedia materials such as videos and
photos. All remain social networking projects operating on the Estonian market can be judged as
completely insignificant players in the online reality (an average website of this kind attracts less than
five thousand users monthly).
Notably, even rate.ee shows a steady decline in its popularity. An important fact worthy of
mention is that (according to the gemiusAudiece study) since January 2006 the biggest social
network in Estonia lost almost 54 thousand users and almost 30 percent of its reach. This trend may
be interpreted as a first symptom of a passing fashion, as well as symptomatic of a serious
transformation of the market structure. This second possibility would be even more dangerous for
Estonian social networking, because it does not signify the end of online communities in Estonia, but
the constant migration of internet users who more and more frequently use international social
platforms.
Chart 44 Rate.ee – reach trend (gemiusAudience, January 2006 – January 2009)
0%
10%
20%
30%
40%
50%
60%
01
.20
06
01
.20
07
01
.20
08
01
.20
09
rate.ee
rate.ee

ESTONIA
2. ONLINE AUDIENCE
2.1. Socio-demographic profile
The gender structure of the Estonian online audience remains similar to that observed in the
two other Baltic Republics with a significant 6 percentage point majority of women in the total
internet population. Furthermore, women constitute the majority among almost all age groups,
except the oldest users (55+), where the share of genders is equal. This is somewhat surprising as in
the offline population in this age group there is a notable female dominance. This means that among
oldest Estonian users men are much more active online and intensively use the internet.
Chart 45 Estonian online population - gender structure (age intervals) (gemiusAudience, January 2009)
Similarly to the trend observed in all CEE region countries, the age structure of the Estonian
online population shows a linear decrease as users age. The most numerous group constitute people
aged 15-24, comprising 29 percent. Moreover, the youngest users generate almost 40 percent of all
page views measured in the gemiusAudience study9 and the average value per user is also the
highest among this age group. Share of other age groups in total online population range from 20
percent (25-34) to 13 percent (55+), the oldest group being the least active.
9 In January 2009 gemiusAudience study in Estonia covered 42 websites (number of panelists - 15073).
15%
12%10% 9%
7%
13%
9% 10%8% 7%
0%
10%
20%
[15
-24
]
[25
-34
]
[35
-44
]
[45
-54
]
[55
+]
Gender structure of internet users(age intervals)
Female Male

ESTONIA
Chart 46 Age structure of Estonian online population and share of all page views by age (gemiusAudience, January 2009)
The majority of Estonian internet users have a secondary level of education and this group
accounts for 37 percent of the online population. The other significant group comprises users with
higher education, however they reveal the lowest activity. The average time per user spent on the
monitored sites among this group is the shortest. In terms of time spent on the websites available in
the study, the leader is the group of people with an elementary or unfinished high school education
level, although it constitutes only 18 percent of the population. A similar trend can be observed in
terms of page views, where users from this category generate almost 30 percent of all page views
made on the measured websites with the average number reaching 1372.
Chart 47 Education structure of Estonian online population and average time per user by education (gemiusAudience, January 2009)
29%
21% 20%17%
13%
39%
19% 19%14%
9%
0%
5%
10%
15%
20%
25%
30%
35%
40%
[15
-24
]
[25
-34
]
[35
-44
]
[45
-54
]
[55
+]
Age / share of page views
share of age groups share of page views
17%22%
37%
24%
00:00:00
05:00:00
10:00:00
15:00:00
0%
5%
10%
15%
20%
25%
30%
35%
40%
Ele
me
nta
ry,
un
fin
ish
ed
hig
h s
cho
ol
Vo
cati
on
al
Hig
h s
cho
ol,
lyce
um
Un
ive
rsit
y
Education / average time per user
share of education level group Avg. time spent per visitor

ESTONIA
In terms of occupation structure, there are two leading groups: specialists or office
employees (26 percent) and students (21 percent). Regarding page views measured in the
gemiusAudience study, students generate over 27 percent. However, the greatest number of page
views per user is made by housewives, who also spent the largest amount of time surfing the
monitored sites (more than 15 hours per user monthly).
Chart 48 Occupation structure of Estonian online population and share of all page views by occupation (gemiusAudience, January 2009)
The greatest number of internet users, almost 30 percent, live in Tallinn. The other significant
groups are people from Tartumaa – 13 percent and Harjumaa – also 13 percent. Other towns and
cities account only for a few percent each.
Chart 49 Estonian online population – place of settlement (gemiusAudience, January 2009)
26%
21%
17%
11%
7% 5% 5% 5%3%
1%
16%
27%
20%
12%
6%3% 4%
7%4%
1%
0%
5%
10%
15%
20%
25%
30%
Spe
cial
ist
/o
ffic
ee
mp
loye
e
Stu
de
nt
Wo
rke
r /
tech
nic
alw
ork
er
Oth
er
Smal
lb
usi
ne
ssm
an
Top
/m
idd
le le
vel
man
age
r
Pe
nsi
on
er
Ho
use
wif
e
Un
em
plo
yed
Farm
er
Age / share of page views
share of occupation groups share of page views
30%
13%
1%6%
3% 3% 2%5%
2%7%
3% 3%
13%
2% 4% 3%
0%
5%
10%
15%
20%
25%
30%
35%
40%
Tall
inn
Har
jum
aa
Hii
um
aa
Ida-
Vir
um
aa
Joge
vam
aa
Järv
amaa
Lään
em
aa
Lään
e-V
iru
maa
Po
lvam
aa
Pär
nu
maa
Rap
lam
aa
Saar
em
aa
Tart
um
aa
Val
gam
aa
Vil
jan
dim
aa
Vo
rum
aa
Place of settlement
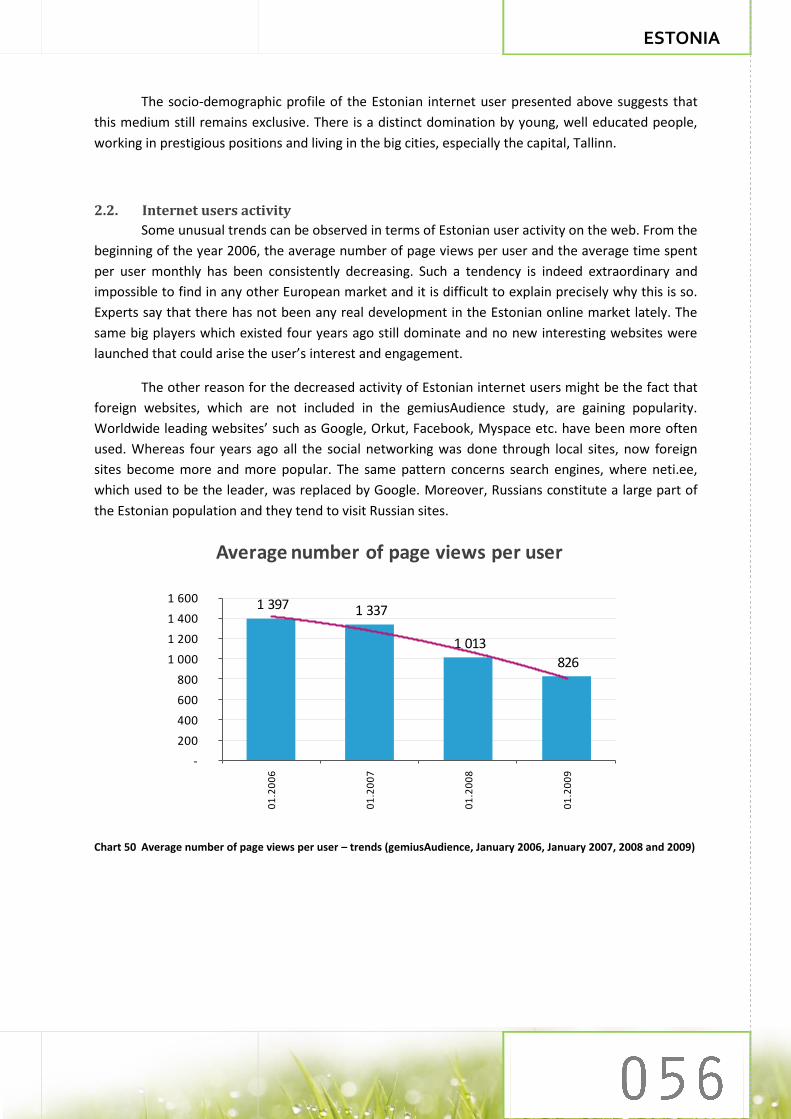
ESTONIA
The socio-demographic profile of the Estonian internet user presented above suggests that
this medium still remains exclusive. There is a distinct domination by young, well educated people,
working in prestigious positions and living in the big cities, especially the capital, Tallinn.
2.2. Internet users activity
Some unusual trends can be observed in terms of Estonian user activity on the web. From the
beginning of the year 2006, the average number of page views per user and the average time spent
per user monthly has been consistently decreasing. Such a tendency is indeed extraordinary and
impossible to find in any other European market and it is difficult to explain precisely why this is so.
Experts say that there has not been any real development in the Estonian online market lately. The
same big players which existed four years ago still dominate and no new interesting websites were
launched that could arise the user’s interest and engagement.
The other reason for the decreased activity of Estonian internet users might be the fact that
foreign websites, which are not included in the gemiusAudience study, are gaining popularity.
Worldwide leading websites’ such as Google, Orkut, Facebook, Myspace etc. have been more often
used. Whereas four years ago all the social networking was done through local sites, now foreign
sites become more and more popular. The same pattern concerns search engines, where neti.ee,
which used to be the leader, was replaced by Google. Moreover, Russians constitute a large part of
the Estonian population and they tend to visit Russian sites.
Chart 50 Average number of page views per user – trends (gemiusAudience, January 2006, January 2007, 2008 and 2009)
1 397 1 337
1 013
826
-
200
400
600
800
1 000
1 200
1 400
1 600
01
.20
06
01
.20
07
01
.20
08
01
.20
09
Average number of page views per user

ESTONIA
Chart 51 Average time spent per user – trends (gemiusAudience, January 2006, 2007, 2008 and 2009)
3. TOOLS
3.1. Browsers
Although Microsoft Internet Explorer’s share decreased (from 73 percent in 2007 to 59
percent in 2009) it remains the most popular browser in Estonia. It is worth underlining however,
that Firefox has been steadily gaining in popularity – its share increasing from 24 percent at the
beginning of 2007 to 36 percent in 2009. Also Chrome has been slowly increasing its share since its
release in September of 2008.
Chart 52 Top browsers in Estonia by share of page views generated by internet users who visit Estonian web sites using gemiusTraffic (gemiusTraffic study 1Q 2007 – 2Q 2009)
13:28:18 13:25:17
10:50:41 11:05:32
00:00:00
05:00:00
10:00:00
15:00:00
01
.20
06
01
.20
07
01
.20
08
01
.20
09
Average time spent per user
0%
10%
20%
30%
40%
50%
60%
70%
80%
1Q
20
07
2Q
20
07
3Q
20
07
4Q
20
07
1Q
20
08
2Q
20
08
3Q
20
08
4Q
20
08
1Q
20
09
2Q
20
09
Browsers
MSIE Firefox Opera Chrome

ESTONIA
3.2. Operating systems
The most popular operating system in Estonia is Windows XP (75 percent in 2009) but it has
been losing share in favour of Vista, which has been gaining new users over the last two years (20.3
percent in 2009). Mac OS X increased its share in the Estonian market (from 0.4 percent in 2007 to 1
percent in 2009).
Chart 53 Top operating systems in Estonia by share of the page views generated by internet users who visit Estonian web sites using gemiusTraffic (gemiusTraffic study 1Q 2007 – 2Q 2009)
1.1. Search engines
Since 2007 Google has been gaining popularity in Estonia and is now the clear market leader
(68 percent share). The second most popular search engine is NETI. Nevertheless its share decreased
from 59 percent in 2007 to 26 percent in 2009. These two players do not encounter any other strong
competitor on the market.
Chart 54 Top search engines in Estonia by share of visits made by internet users who visit Estonian web sites using gemiusTraffic (gemiusTraffic study 1Q 2007 – 2Q 2009)
0%
20%
40%
60%
80%
100%
1Q
20
07
2Q
20
07
3Q
20
07
4Q
20
07
1Q
20
08
2Q
20
08
3Q
20
08
4Q
20
08
1Q
20
09
2Q
20
09
Operating systems
Windows XP Windows Vista MacOS X
0%
10%
20%
30%
40%
50%
60%
70%
80%
1Q
20
07
2Q
20
07
3Q
20
07
4Q
20
07
1Q
20
08
2Q
20
08
3Q
20
08
4Q
20
08
1Q
20
09
2Q
20
09
Search engines
Google NETI Delfi MSN

ESTONIA
3.4. Screen resolutions
The most popular screen resolution in Estonia is 1024x768 but in recent years 1280x800 (the
screen resolution used in notebooks) has gained a significant share. Its popularity has grown from 8
percent in 2007 to 24 percent in 2009. Also other screen resolutions – 1440x900 and 1680x1050 have
gained some share.
Chart 55 Screen resolutions in Estonia by share of the page views generated by internet users who visit Estonian web sites using gemiusTraffic (gemiusTraffic study 1Q 2007 – 2Q 2009)
0%
10%
20%
30%
40%
50%
60%
70%1
Q 2
00
7
2Q
20
07
3Q
20
07
4Q
20
07
1Q
20
08
2Q
20
08
3Q
20
08
4Q
20
08
1Q
20
09
2Q
20
09
Screen resolutions
1024 x 768 1280 x 800 1280 x 1024 1440 x 900
1680 x 1050 1152 x 864 800 x 600 other


HUNGARY
HUNGARY
1. MAIN PLAYERS
1.1. Top 10 websites
website's category
number of real users
number of page views
page views per user
average time per user
reach
1 google.hu search engine
3 189 755 872 141 773 273 07:24:50 86%
2 iwiw.hu social
network 2 626 689 1 784 821 276 680 05:27:03 71%
3 startlap.hu web
directory 2 372 714 101 718 905 43 01:59:31 64%
4 youtube.com video
sharing 2 183 051 262 525 853 120 03:19:13 59%
5 freemail.hu mail
provider 1 923 662 158 367 222 82 01:58:37 52%
6 origo.hu horizontal
portal 1 676 935 62 007 476 37 02:22:36 45%
7 live.com search engine
1 660 055 87 108 628 53 00:48:02 45%
8 extra.hu web
hosting 1 569 282 35 716 672 23 00:22:57 43%
9 blog.hu blog site
1 560 305 23 496 375 15 00:28:07 42%
10 microsoft.com company
site 1 346 023 14 066 294 11 00:07:52 37%
Table 13 Top 10 websites in Hungary by reach level (gemius/Ipsos Audience, January 2009)
The ranking of the most popular websites in Hungary provides a very interesting view of
internet use in this country. Excluding the Google site, which is an obvious leader on most of the CEE
markets, in January 2009 a reach level of over 71 percent was achieved by the local social networking
service, iWiW.hu. While it is true that this website has long been dominant within the Hungarian
internet, what makes this market even more intriguing is the fact that the popularity of horizontal
portals is quite different from the experience of the majority of similar markets. Inversely to those,
the leading Hungarian portal barely makes the sixth position in the ranking. Moreover, the second
one, Index.hu, at the beginning of the year achieved only 35 percent of reach, which placed it outside
the top ten websites in Hungary.
Another fact regarding the Hungarian online market is the high position of Startlap.hu, the
most popular local web directory, which in reality functions as a specific kind of internet portal.
According to the gemius/Ipsos Audience study, in January 2009 this website recorded over 2 million
370 thousand real users, constituting a 64 percent of reach. The fall of web directories as a form of
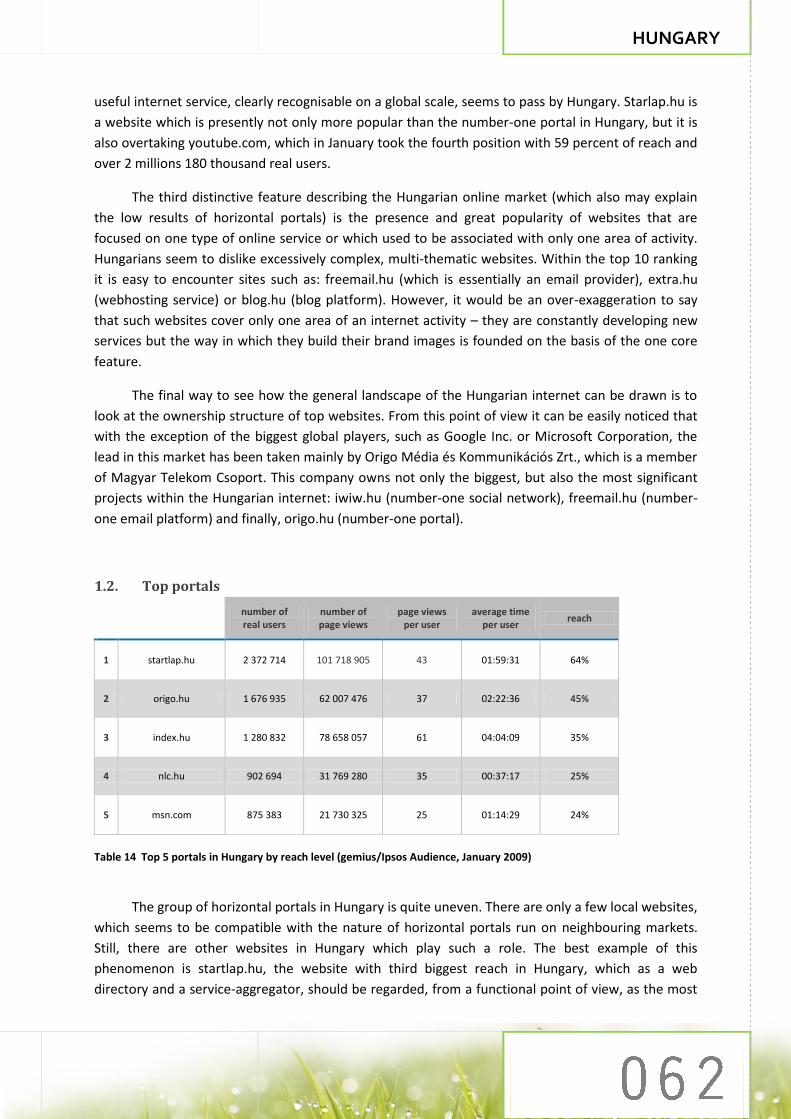
HUNGARY
useful internet service, clearly recognisable on a global scale, seems to pass by Hungary. Starlap.hu is
a website which is presently not only more popular than the number-one portal in Hungary, but it is
also overtaking youtube.com, which in January took the fourth position with 59 percent of reach and
over 2 millions 180 thousand real users.
The third distinctive feature describing the Hungarian online market (which also may explain
the low results of horizontal portals) is the presence and great popularity of websites that are
focused on one type of online service or which used to be associated with only one area of activity.
Hungarians seem to dislike excessively complex, multi-thematic websites. Within the top 10 ranking
it is easy to encounter sites such as: freemail.hu (which is essentially an email provider), extra.hu
(webhosting service) or blog.hu (blog platform). However, it would be an over-exaggeration to say
that such websites cover only one area of an internet activity – they are constantly developing new
services but the way in which they build their brand images is founded on the basis of the one core
feature.
The final way to see how the general landscape of the Hungarian internet can be drawn is to
look at the ownership structure of top websites. From this point of view it can be easily noticed that
with the exception of the biggest global players, such as Google Inc. or Microsoft Corporation, the
lead in this market has been taken mainly by Origo Média és Kommunikációs Zrt., which is a member
of Magyar Telekom Csoport. This company owns not only the biggest, but also the most significant
projects within the Hungarian internet: iwiw.hu (number-one social network), freemail.hu (number-
one email platform) and finally, origo.hu (number-one portal).
1.2. Top portals
number of real users
number of page views
page views per user
average time per user
reach
1 startlap.hu 2 372 714 101 718 905 43 01:59:31 64%
2 origo.hu 1 676 935 62 007 476 37 02:22:36 45%
3 index.hu 1 280 832 78 658 057 61 04:04:09 35%
4 nlc.hu 902 694 31 769 280 35 00:37:17 25%
5 msn.com 875 383 21 730 325 25 01:14:29 24%
Table 14 Top 5 portals in Hungary by reach level (gemius/Ipsos Audience, January 2009)
The group of horizontal portals in Hungary is quite uneven. There are only a few local websites,
which seems to be compatible with the nature of horizontal portals run on neighbouring markets.
Still, there are other websites in Hungary which play such a role. The best example of this
phenomenon is startlap.hu, the website with third biggest reach in Hungary, which as a web
directory and a service-aggregator, should be regarded, from a functional point of view, as the most

HUNGARY
popular portal in Hungary. A similar situation can be accorded to few other websites, which,
separately or together, make interesting case studies.
An interesting website that should be mentioned at this point is magyarorszag.hu, which
means ‘hungary.hu’. This is an e-government project providing various kinds of administrative
services, governmental information and interactive features addressed both to citizens and the
business sector. This is a quite unique project, mostly because it is rare for governmental service to
have a slightly lower reach than such brand as Yahoo. Exactly this situation can be observed in
Hungary. Magyarorszag.hu in January 2009 attained a reach level of almost 20 percent.
A very significant role is played in Hungary by vertical portals. The most popular is nlc.hu, an
online magazine for women, which provides many features typical of portals, such as a blog platform,
online shopping, dating service, online games and multimedia galleries, but because of its target
group, it shouldn’t be considered as a horizontal site. However, in January 2009 over 900,000 real
users visited the site (24 percent reach). According to the gemius/Ipsos Audience study, women
represent more than 60 percent of its audience.
Within the leading group of vertical portals there are also two significant websites: fn.hu and sg.hu.
The first one is a news portal which publishes information basically focused on business, the
economy and politics. However, presently it is evolving towards a horizontal portal, placing greater
emphasis on such topics as sports, culture, travel or technology. Moreover, fn.hu provides
functionalities characteristic of a horizontal platform, such as blog, forum or email access and
widgets. In January 2009 it achieved almost 20 percent reach. The second one, sg.hu, took a slightly
lower position with almost the same level of reach.
Finally, one of the most significant characteristics of the Hungarian online market is the
position of global portals, such as msn.com and yahoo.com. According to the gemius/Ipsos Audience
study in January 2009, the internet portal run by Microsoft Corporation (msn.com) gathered over
875,000 real users, while Yahoo attracted a little over 800,000 Hungarians. Since last year, however,
only one local player, index.hu, has gained a measurable increase in its popularity. Other portals are
gradually losing their reach, with the exception of MSN which is losing its popularity even more
rapidly.

HUNGARY
Chart 56 Top 5 horizontal portals in Hungary – reach trends (gemius/Ipsos Audience, September 2007 – January 2009)
1.3. Social networks
number of real users
number of page views
page views per user
average time per user
reach
1 iwiw.hu 2 626 689 1 784 821 276 680 05:27:03 71%
2 myvip.com 1 173 863 777 483 986 662 06:04:15 32%
3 hotdog.hu 1 030 648 32 336 799 31 00:31:26 28%
4 hi5.com 646 133 31 752 231 49 00:22:13 18%
5 baratikor.com 376712 66 489 069 177 00:22:13 10%
Table 15 Top 5 social networks in Hungary by reach level (gemius/Ipsos Audience, January 2009)
Social networking within the Hungarian internet is dominated by just one online service,
iwiw.hu, which is, incidentally, the most popular local website. In January 2009 it has attracted an
audience of over 2.6 million real users, which, considering that the entire internet population in
Hungary accounts for almost 3.7 millions of users, makes it a powerful player. Except for typical
networking functionalities, iWiW provides also an email service and classified advertisements.
Technologically, this website was not always up-to-date. Since 2009 (when mini-applications for
iWiW began to be developed) the service has not presented top quality. Creating the mobile version
of iWiW, as well as useful mini-applications (developed by the company and independent
programmers) was obviously a good business decision.
0%
10%
20%
30%
40%
50%
60%
70%
80%
09
.20
07
01
.20
08
01
.20
09
Top horizontal portals
startlap.hu origo.hu index.hu msn.com yahoo.com

HUNGARY
Despite the fact that there are many social networking websites in Hungary apart from iWiW,
it is significant that the gap between them and the market leader is actually large. At the beginning of
the year the audience of myvip.com, the second website of that kind in Hungary, accounted for less
than half that of iWiW. According to the gemius/Ipsos Audience study, in January 2009 over
1,170,000 Hungarians have visited myVIP, which gave it an almost 32 percent reach. MyVIP (similarly
to iWiW) is an exclusive network – users can sign in only if invited by a member. Except for typical
networking functionalities, mostly similar to those which are available on iWiW, myVIP offers several
extra inbuilt services (as own chat, dating service, MSN client or games). It is run by Generál Média
Kft., a company specializing mainly in online entertainment. Moreover, this community website pays
great attention to its multimedia content. Not only users are able to share their photos and videos,
but the service also publishes video material, since 2009 also in HD format.
The third significant player active in this segment of the internet is hotdog.hu, a Hungarian
social network oriented basically towards young people. This service adopts the appearance of a
highly developed community service and (from a functional point of view) a portal-oriented website.
Users of hotdog are able not only to communicate with each other, vote or register their pet, but
also to read news, check their horoscope, play online games, upload and manage their documents,
buy from an online store or auction, create an internet radio and even search for job offers.
One of the most significant features of Hungarian social networking is that the biggest global
brands, such as hi5.com, myspace.com and facebook.com, cannot overcome the strength of the local
players. The most popular of them, hi5, takes just fourth position in the presented ranking with only
18 percent reach. Uniquely MySpace and Facebook are even less popular – they occupy in turn the
sixth and eight position, the reach level for both of them being lower than 10 percent. However, the
local services, even those with a lower number of users, are able to propose some interesting
solutions. Donna.hu can be mentioned as a good example. This is an exclusive social network for
young women, that in January 2009 gathered only slightly more than 130,000 users. However, this
service has developed an interesting operational model and, as a result, created an interesting brand.
Only women can join this community and then only at the invitation of another member. Men can
join only with permission granted by a majority of female users (decisions in this matter are taking
after democratic voting). Moreover, on this website women can find much useful information, for
example advice from experts, such as medical doctors and psychologists.
2. ONLINE AUDIENCE
2.1. Socio-demographical profile
Hungarian internet users do not differ from audiences in neighbouring countries in terms of a
gender structure – the online population here is also very balanced. In January 2009 men accounted
for not much more than 50 percent of the total, while women had a share of 49.6 percent of the
population of all internet users.
Similarly to most CEE markets, Hungarian internet users are also very young people. The
cohort of individuals aged 15-25 years is the biggest group within the local internet. Moreover,
people under 45 years of age account for almost 76 percent of all Hungarians active within the global

HUNGARY
network. The most interesting fact, however, is that Hungarian internet users are getting older. Since
2006 only two age groups (35-44 and 55+) increased their share within the whole online population,
in summary over 30 percent. This trend is even more interesting if the constant growth of internet
penetration in Hungary is taken into consideration. A significant decrease in the share of internet
users aged 15-24 years and the relatively fast growing group of users elder than 55 years are the
indicators illustrating the state of development of the online market in Hungary. The internet is
evidently becoming an ever more attractive medium for mature people and at the same time, the
market profile is ageing along with its users.
Chart 57 Hungarian online population – age structure (gemius/Ipsos Audience, January 2009)
May 2006 January 2007 January 2008 January 2009
[15-24] 36% 35% 33% 31%
[25-34] 27% 27% 25% 26%
[35-44] 17% 17% 19% 19%
[45-54] 14% 14% 14% 13%
[55+] 6% 7% 9% 11%
Table 16 Hungarian online population – age structure trends (gemius/Ipsos Audience, May 2006 – January 2009)
Hungarian internet users live mostly in the big cities and larger towns. As in similar markets, a
significant proportion of internet users in Hungary live in the capital city (in January over 21 percent
of all internet users declared that they live in Budapest). Whilst analyzing the distribution of
Hungarian internet users based upon the precise size of the place of their settlement, it is easy to
observe that the general composition of users is quite balanced. However, people who live in cities
with more than 50,000 inhabitants account altogether for over 43 percent of the whole population of
internet users, and one in four internet users live in a city with between 20,000 and 50,000
inhabitants.
31%
26%
19%
13%
11%
Age
[15-24]
[25-34]
[35-44]
[45-54]
[55+]
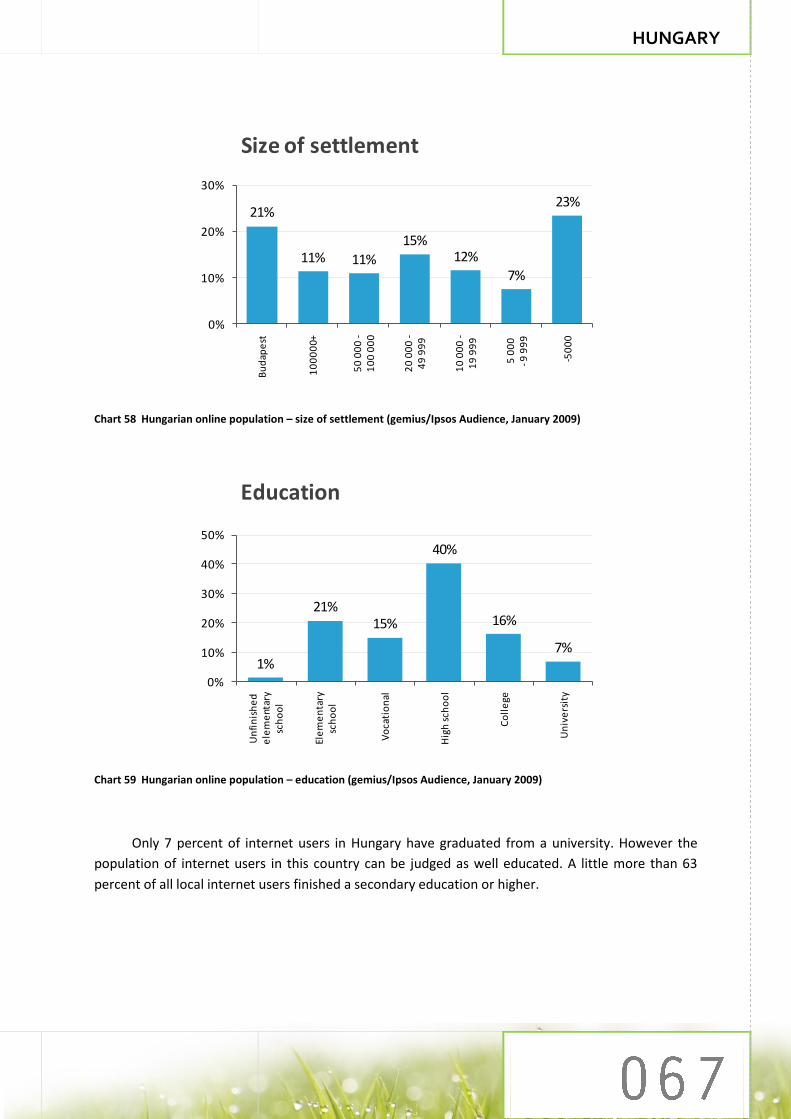
HUNGARY
Chart 58 Hungarian online population – size of settlement (gemius/Ipsos Audience, January 2009)
Chart 59 Hungarian online population – education (gemius/Ipsos Audience, January 2009)
Only 7 percent of internet users in Hungary have graduated from a university. However the
population of internet users in this country can be judged as well educated. A little more than 63
percent of all local internet users finished a secondary education or higher.
21%
11% 11%
15%12%
7%
23%
0%
10%
20%
30%
Bu
dap
est
10
00
00+
50
00
0 -
10
0 0
00
20
00
0 -
49
99
9
10
00
0 -
19
99
9
5 0
00
-9 9
99
-50
00
Size of settlement
1%
21%15%
40%
16%
7%
0%
10%
20%
30%
40%
50%
Un
fin
ish
ed
ele
me
ntar
ysc
ho
ol
Ele
me
nta
rysc
ho
ol
Vo
cati
on
al
Hig
h s
cho
ol
Co
lle
ge
Un
ive
rsit
y
Education

HUNGARY
Occupation share
student 26%
manager, businessman 16%
qualified worker 15%
graduated specialist 14%
other specialist 13%
other inactive 4%
pensioner 4%
unemployed 3%
other worker 3%
not available 1%
Table 17 Hungarian online population – occupation (gemius/Ipsos Audience, January 2009)
Yet a significant percentage of Hungarian internet users are still students and almost 44
percent of them work as managers, businessmen or specialists. Moreover, the share of professionally
inactive users of the internet (for example unemployed people or pensioners) is relatively low.
The general picture of Hungarians accessing the global network shows that their number is still
growing; they are an educated and well off segment of the local consumer market.
2.2. Internet users activity
Hungarian internet users are quite active within the network. A year ago the average
Hungarian user surfed the web for almost 41 hours monthly (based on the gemius/Ipsos Audience
study results) and in the same period of time he or she generated over 2.6 thousand page views. The
engagement of users in Hungary may be related to the internet’s domestication process. Nowadays
over 87 percent of the whole online population in the country access the network from home, which
is 13 percent more than four years ago. However, a very interesting fact concerning the Hungarian
market is that the share of local users accessing the web from a public place (such as a library or
internet cafe) in comparison to the other CEE markets is relatively high and has not changed
significantly over the last couple of years. Moreover, the increasing number of individuals using the
internet at home seems not to affect the popularity of this behaviour.
While analyzing Hungarian internet users in terms of consumption, it is very important to
notice that they are active consumers of various kinds of traditional media. Almost 73 percent of
them read newspapers at least once a week and a few more (73 percent) watch television every day
or almost every day. Still the most popular medium among Hungarian internet users is radio – over
81 percent of them listening to it daily or almost every day.

HUNGARY
Place of accessing internet share
at home 87%
at work 33%
at school 26%
at friends'/acquaintances' 17%
at public spaces (internet café, library, eMagyarorszag) 10%
other where 3%
Table 18 Hungarian online population – place of accessing internet (gemius/Ipsos Audience, January 2009)
3. TOOLS
3.1. Browsers
Firefox and Microsoft Internet Explorer are the leaders on the Hungarian browsers market.
However, over the past two years, Firefox‘s share has been steadily increasing. At the same time,
MSIE has been losing its position – its share decreasing from 73 percent in the first quarter of 2007 to
49 percent two years later. Moreover, Opera has been slowly gaining new users in Hungary and in
the first quarter of 2009 2.6 percent of page views, measured in the gemiusTraffic study, were
generated with the aid of this system.
Chart 60 Top browsers in Hungary by share of page views generated by internet users who visit the Hungarian web sites using gemiusTraffic (gemiusTraffic study 1Q 2007 – 2Q 2009)
0%
20%
40%
60%
80%
1Q
20
07
2Q
20
07
3Q
20
07
4Q
20
07
1Q
20
08
2Q
20
08
3Q
20
08
4Q
20
08
1Q
20
09
2Q
20
09
Browsers
Firefox MSIE Opera other

HUNGARY
3.2. Operating systems
The most popular operating system in Hungary is still Windows XP (in the first quarter of 2009
90 percent of page views, measured in the gemiusTraffic study, were generated by the use of this
system). Nevertheless, for two years it has been slowly losing its share. At the same time, Windows
Vista has become more popular among Hungarians – the share of page views generated by the users
of this system increased from 0.3 percent in the first quarter of 2007 to 8 percent in the first quarter
of 2009.
Chart 61 Top operating systems in Hungary by share of the page views generated by internet users who visit the Hungarian web sites using gemiusTraffic (gemiusTraffic study 1Q 2007 – 2Q 2009)
3.3. Search engines
The biggest player on the Hungarian search engine market is undoubtedly Google, with 97.1
percent of all visits indicated by a search engines on the websites measured in the gemiusTraffic
study. The significance of other search engines remains marginal; however, MSN’s popularity
increased from 1.5 percent at the beginning of 2007 to 2.3 percent in the first quarter of 2009.
Chart 62 Top search engines in Hungary by share visits made by Internet users who visit Hungarian websites using gemiusTraffic (gemiusTraffic study 1Q 2007 – 2Q 2009)
0%
20%
40%
60%
80%
100%
1Q
20
07
2Q
20
07
3Q
20
07
4Q
20
07
1Q
20
08
2Q
20
08
3Q
20
08
4Q
20
08
1Q
20
09
2Q
20
09
Operating systems
Windows XP Windows Vista MacOS X other
0%
20%
40%
60%
80%
100%
1Q
20
07
2Q
20
07
3Q
20
07
4Q
20
07
1Q
20
08
2Q
20
08
3Q
20
08
4Q
20
08
1Q
20
09
2Q
20
09
Search engines
Google MSN other

HUNGARY
3.4. Screen resolutions
The most common screen resolution in Hungary is 1024x768. However, its share has been
gradually decreasing over the past two years. During the same period, 1280x800’ popularity has
increased the most dynamically (from 4 percent in the first quarter of 2007 to 16 percent in the first
quarter of 2009). Moreover, 1440x900 screen resolution is also quite popular (16 percent share). The
greatest loss can be observed in terms of 800x600 screen resolution, which share decreased from 13
percent in the beginning of 2007 to 4 percent two years later.
Chart 63 Screen resolutions in Hungary by share of the page views generated by internet users who visit the Hungarian web sites using gemiusTraffic (gemiusTraffic study 1Q 2007 – 2Q 2009)
0%
10%
20%
30%
40%
50%
60%
70%
1Q
20
07
2Q
20
07
3Q
20
07
4Q
20
07
1Q
20
08
2Q
20
08
3Q
20
08
4Q
20
08
1Q
20
09
2Q
20
09
Screen resolutions
1024 x 768 1280 x 800 1280 x 1024 1440 x 900
1152 x 864 800 x 600 1680 x 1050 other

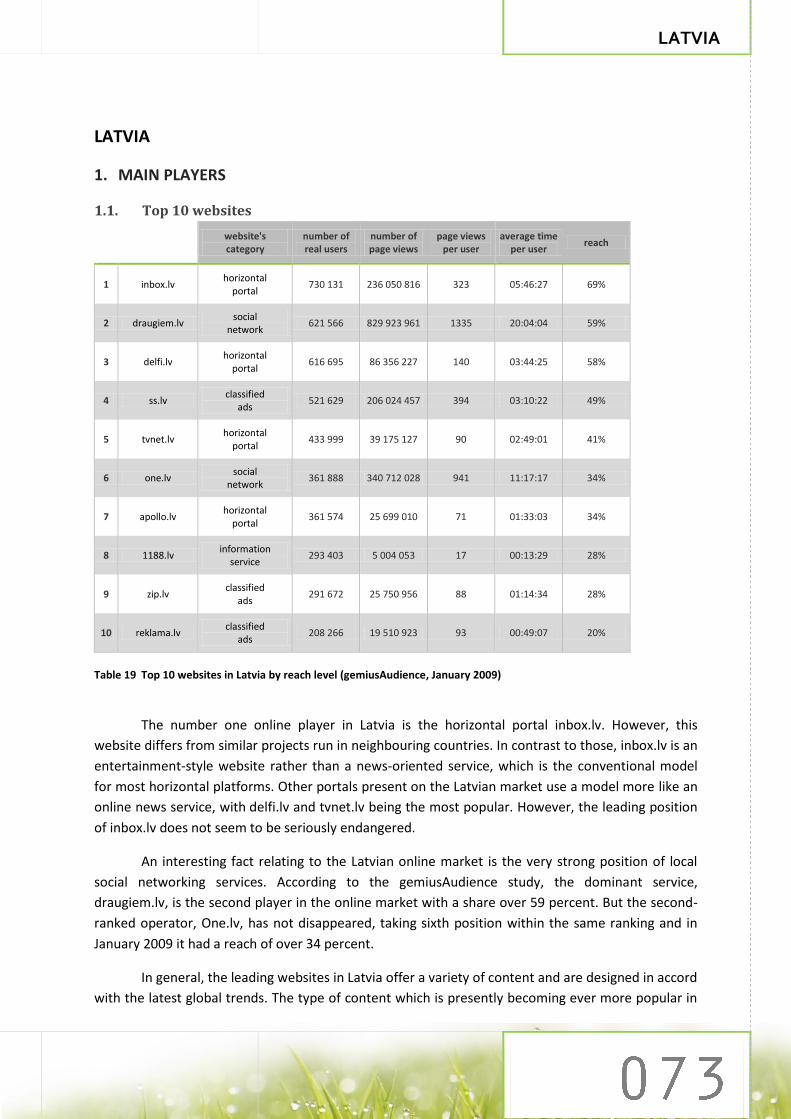
LATVIA
LATVIA
1. MAIN PLAYERS
1.1. Top 10 websites
website's category
number of real users
number of page views
page views per user
average time per user
reach
1 inbox.lv horizontal
portal 730 131 236 050 816 323 05:46:27 69%
2 draugiem.lv social
network 621 566 829 923 961 1335 20:04:04 59%
3 delfi.lv horizontal
portal 616 695 86 356 227 140 03:44:25 58%
4 ss.lv classified
ads 521 629 206 024 457 394 03:10:22 49%
5 tvnet.lv horizontal
portal 433 999 39 175 127 90 02:49:01 41%
6 one.lv social
network 361 888 340 712 028 941 11:17:17 34%
7 apollo.lv horizontal
portal 361 574 25 699 010 71 01:33:03 34%
8 1188.lv information
service 293 403 5 004 053 17 00:13:29 28%
9 zip.lv classified
ads 291 672 25 750 956 88 01:14:34 28%
10 reklama.lv classified
ads 208 266 19 510 923 93 00:49:07 20%
Table 19 Top 10 websites in Latvia by reach level (gemiusAudience, January 2009)
The number one online player in Latvia is the horizontal portal inbox.lv. However, this
website differs from similar projects run in neighbouring countries. In contrast to those, inbox.lv is an
entertainment-style website rather than a news-oriented service, which is the conventional model
for most horizontal platforms. Other portals present on the Latvian market use a model more like an
online news service, with delfi.lv and tvnet.lv being the most popular. However, the leading position
of inbox.lv does not seem to be seriously endangered.
An interesting fact relating to the Latvian online market is the very strong position of local
social networking services. According to the gemiusAudience study, the dominant service,
draugiem.lv, is the second player in the online market with a share over 59 percent. But the second-
ranked operator, One.lv, has not disappeared, taking sixth position within the same ranking and in
January 2009 it had a reach of over 34 percent.
In general, the leading websites in Latvia offer a variety of content and are designed in accord
with the latest global trends. The type of content which is presently becoming ever more popular in

LATVIA
Latvia is video streaming; however, at present only apollo.lv plays any substantial role as a local
pioneer within this area of publishing.
Moreover, it is also important to notice that the Russian speaking audience is notably active
on the Latvian market. This group accounts for a considerable proportion of the users of two popular
websites: one.lv and reklama.lv.
An interesting characteristic describing the Latvian market is the very high popularity of
online classifieds services. The local leaders, ss.lv, zip.lv and reklama.lv, constitute a significant share
of the top website rankings, occupying in turn fourth, ninth and tenth position. Moreover, the only
dynamic changes in the positions of the major market players over the last couple of years can be
observed only in this group of online services. The appearance of a new player – zip.lv – in June 2008,
disturbed the order and stability of the existing ranking and demonstrated how a well prepared
newcomer can quickly and effectively conquer the Latvian marketplace. Zip.lv has not only gathered
an audience in just one month, achieving a reach level of almost 30 percent, but also during this
period overtook one of its closest competitors, reklama.lv, a well known and experienced online
player. Presently zip.lv goes nip-and-tuck with 1188.lv, one of the most popular online information
services in Latvia.
Chart 64 Latvian classified ads services – reach trends (gemiusAudience, January 2008 – 2009, monthly data)
Apart from the above mentioned case, the leaders of the Latvian online market seem to be
stable brands. According to the gemiusAudience study, by reach level, the three dominant websites
did not change their positions within the ranking for the last 18 months at the least. The most
immovable one is inbox.lv, the reach variations of which are not more than two percent over a year.
Yet local experts estimate that in a longer or shorter period of time a struggle between inbox.lv and
the second portal in Latvia, delfi.lv, is probably unavoidable. Delfi, as a strong and active operator on
the market of all the Baltic Countries will surely take its chance and commence a battle for leadership
within the Latvian internet. Furthermore, the global economic crisis may accelerate the
transformations and bring the changes sooner than otherwise. A conflict between inbox.lv and
draugiem.lv is less likely, but could follow in the wake of a generational change.
0%
10%
20%
30%
40%
50%
60%
01
.20
08
02
.20
08
03
.20
08
04
.20
08
05
.20
08
06
.20
08
07
.20
08
08
.20
08
09
.20
08
10
.20
08
11
.20
08
12
.20
08
01
.20
09
Classified ads services - reach change
reklama.lv ss.lv zip.lv

LATVIA
1.2. Top portals/ news services
number of real users
number of page views
page views per user
average time per user
reach
1 www.inbox.lv 730 131 236 050 816 323 05:46:27 69%
2 www.delfi.lv 616 695 86 356 227 140 03:44:25 58%
3 www.tvnet.lv 433 999 39 175 127 90 02:49:01 41%
4 www.apollo.lv 361 574 25 699 010 71 01:33:03 34%
5 www.diena.lv 176 727 5 228 190 29 00:49:13 17%
Table 20 Top 5 portals in Latvia by reach level (gemiusAudience, January 2009)
Within the top Latvian portals, there are three easily identifiable types of player. The first is
Inbox, which basically focuses on entertainment content and is the only example of its type. Inbox.lv
is the biggest portal on the researched market. According to the gemiusAudience study, at the
beginning of the current year (January 2009) it gathered over 730,000 real users, giving it a reach of
over 69 percent. Among other things, Inbox offers free email service, online games, file hosting and
its own social network.
The second type of horizontal portal in Latvia is a platform with multimedia content. Within
this category apollo.lv is the most representative portal of its kind. The strongest services that run on
this website are: online radio (music grouped by genres) and online TV (broad choice of live
streaming, even an online cartoon channel for children). The second significant player that is very
active within the area of online multimedia in Latvia is tvnet.lv, which takes the third position in a
ranking of top 5 portals (in January 2009 its reach was almost 41 percent). Tvnet.lv runs online TV
and co-operates with the major offline stations to manage the best video content, however, the
strongest part of this portal’s activity is not its multimedia content. Tvnet.lv should be recognized
primarily as one of the best local news providers.
The third category of top portals present on the Latvian market is news platforms, such as
delfi.lv (the second portal with over 600,000 real users and a reach in January 2009 of over 58
percent) or diena.lv (the fifth portal with almost 177,000 real users and 17 percent reach). Delfi,
apart from a traditional news-reporting activity, runs a quite big user content area, as well as an eye-
witness photo gallery, which plays the role of social journalism. On the other hand, Diena, as an
online version of a respected print newspaper, focuses on high quality text content, such as articles
or interviews but also develops user generated content.

LATVIA
1.3. Social networks
number of real users
number of page views
page views per user
average time per user
reach
1 draugiem.lv 621 566 829 923 961 1335 20:04:04 59%
2 one.lv 361 888 340 712 028 941 11:17:17 34%
3 boomtime.lv 189 548 60 935 269 321 03:43:29 18%
4 orb.lv 166 016 8 636 072 52 00:45:00 16%
5 oho.lv 138 342 7 890 637 57 01:07:23 13%
6 face.lv 117 925 38 221 514 324 02:50:44 11%
7 moust.lv 107 945 4 362 779 40 00:22:04 10%
Table 21 Top 7 social networks in Latvia by reach level (gemiusAudience, January 2009)
This sector of the online market in Latvia is well developed and the unambiguous
identification of main players within the category does not generate any obstacles. Apart from
facebook.com and myspace.com, which are willingly used by the Latvians, draugiem.lv is the only
local website that can be described as an unquestionable leader of the local market. According to the
gemiusAudience report of January 2009, it achieved a reach of over 59 percent and gained over
620,000 real users. Draugiem.lv is a complex and well managed platform, mixing the concepts and
functionalities of the world’s biggest brands, such as Facebook and Twitter. Moreover, draugiem.lv
offers photo galleries, strong video content, IQ games, chat tools and opportunities for the effective
promotion of projects run by the users, for example new music bands. The creators and the
managers of draugiem.lv are obviously conscious of the fact that they have built the strongest brand
on the market; a brand with a meaningful influence, not only on the online reality, but also on social
opinion in general. This is expressed by the website’s slogan, which says that: ”If you are not on
Draugiem, you don’t exist”.
In Latvia, however, there is also a fairly strong second-place social networking service, one.lv.
Admittedly it does not have as large an audience as draugiem.lv (according to gemiusAudience in
January it had a group of real users more than 40 percent smaller) and additionally it attracts a
significant group of Russian speakers. However, the reach level of one.lv (34 percent in January 2009)
makes it the second force on the Latvian internet. The other social networking services in Latvia are
small or very small. Moreover, it is hard for them to compete with draugiem.lv and one.lv, for two
basic reasons. First is the market’s rigidity (the audience of the leading websites is quite loyal) and
second, the obstacles within management strategy. For example, orb.lv is overfilled with paid
services based on continuous promotion campaigns that ensure only temporary changes to the
number of visits generated randomly by internet users.

LATVIA
Finally, it is easily observed that although the majority of social networks in Latvia are run as
a typical social-connection platform, the most popular of them are diversified in a way which shows
that this sector of the local online market is very well developed. Each Latvian social network focuses
on a different target group (defined by age or interest), which makes the whole marketplace clearly
arranged. For example, face.lv is a service addressed to teenagers and moust.lv gathers young people
interested in fashion, beauty and motor vehicle promotion.
2. ONLINE AUDIENCE
2.1. Socio-demographic profile
In Latvia, contrary to the majority of the CEE region countries, the predomination of women
in the online population can be observed. Females account for 53 percent and also generate more
than half of all page views measured in the gemiusAudience study.10 Moreover, women comprise the
majority in terms of all age groups from 25 years upwards. However, with the youngest group, aged
15-24, a slight predominance of men is visible, but this is congruent with the distribution in the
general population.
Chart 65 Latvian online population – gender structure (age intervals) (gemiusAudience, January 2009)
Regarding age differentiation within the Latvian online market, a pattern observed in all CEE
countries can be seen. The youngest users, aged 15-24, predominate in the online population. In
Latvia this group accounts for 32 percent and also is the most active on the web – on the monitored
services, users from this group spent over 8 hours per visitor more than the average Latvian user.
10
In January 2009 gemiusAudience study in Latvia covered 129 websites (number of panelists - 25731).
15%13%
11%9%
4%
17%
12%
8% 8%
3%
0%
5%
10%
15%
20%
[15
-24
]
[25
-34
]
[35
-44
]
[45
-54
]
[55
+]
Gender structure of online population (age intervals)
Female Male

LATVIA
Chart 66 Latvian online population – age structure (gemiusAudience, January 2009)
Most Latvian internet users have higher education (28 percent) or have finished vocational
schools (26 percent). The third largest group is constituted of people with an elementary or
unfinished high school education. Although they account for only 17 percent of users, on average
they spent more than 38 hours per visitor on the web, which is over 9 hours more than a typical user.
This group also generates 24 percent of all page views, while the people with vocational education
(responsible for the largest share of all page views) generate only 2 percentage points more.
Chart 67 Education structure of Latvian online population and share of all page views by education (gemiusAudience, January 2009)
In terms of occupation, the group of specialists and white-collar employees constitute the
greatest number of users (25 percent), but they generate only 17 percent of page views. At the same
32%
25%
19%
17%
7%
Age
[15-24]
[25-34]
[35-44]
[45-54]
[55+]
17% 17%
26%
12%
28%24%
20%
26%
12%
18%
0%
5%
10%
15%
20%
25%
30%
Ele
me
nta
ry,
un
fin
ish
ed
hig
h s
cho
ol
Hig
h s
cho
ol,
lyce
um
Vo
cati
on
al
Un
fin
ish
ed
Un
ive
rsit
y
Un
ive
rsit
yEducation / share of page views
share of occupation group share of page vievs
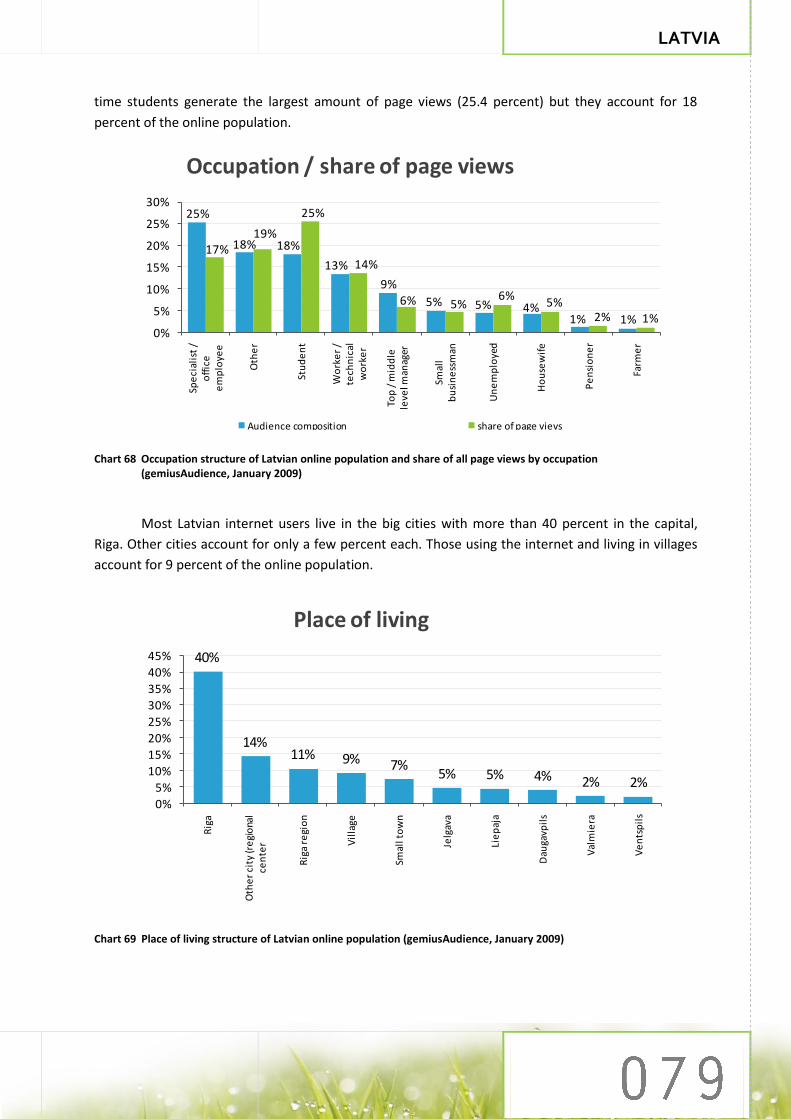
LATVIA
time students generate the largest amount of page views (25.4 percent) but they account for 18
percent of the online population.
Chart 68 Occupation structure of Latvian online population and share of all page views by occupation (gemiusAudience, January 2009)
Most Latvian internet users live in the big cities with more than 40 percent in the capital,
Riga. Other cities account for only a few percent each. Those using the internet and living in villages
account for 9 percent of the online population.
Chart 69 Place of living structure of Latvian online population (gemiusAudience, January 2009)
25%
18% 18%
13%
9%
5% 5% 4%1% 1%
17%19%
25%
14%
6% 5%6%
5%2% 1%
0%
5%
10%
15%
20%
25%
30%Sp
eci
alis
t /
off
ice
em
plo
yee
Oth
er
Stu
de
nt
Wo
rke
r /
tech
nic
alw
ork
er
Top
/ m
idd
lele
vel m
anag
er
Smal
lb
usi
ne
ssm
an
Un
em
plo
yed
Ho
use
wif
e
Pe
nsi
on
er
Farm
er
Occupation / share of page views
Audience composition share of page vievs
40%
14%11% 9% 7%
5% 5% 4% 2% 2%
0%
5%
10%
15%
20%
25%
30%
35%
40%
45%
Rig
a
Oth
er
city
(re
gio
nal
cen
ter
Rig
a re
gio
n
Vil
lage
Smal
l to
wn
Jelg
ava
Lie
paj
a
Dau
gavp
ils
Val
mie
ra
Ve
nts
pil
sPlace of living

LATVIA
Those facts might indicate that the Latvian internet is still rather an elite medium. The
apparent domination by highly educated people with prestigious jobs and living in the big cities
stresses the fact that until now the internet is not easily accessible for all socio-economic groups.
2.2. Internet users activity
Over time the average number of page views measured in the gemiusAudience study11 has
been systematically increasing and, in comparison to 2007, in 2009 it has more than doubled. In
terms of gender, males generated more page views than females and the growth among this group
was also more dynamic (144 percent since the year 2005) than observed for females (95 percent
since the year 2005).
Chart 70 Average number of page views by gender – trends (gemiusAudience, January 2007, 2008 and 2009)
As far as number of page views among various age categories is concerned, constant growth
in all groups can be observed since the year 2007. However, the most significant increase was in the
youngest group (more than 120 percent) and was respectively smaller for elder users, with the
lowest result for people 45+ (around 85 percent).
11
In January 2009 gemiusAudience study in Latvia covered 129 websites (number of panelists - 25731).
999
1 794 1 953
937
1 749 2 005
-
500
1 000
1 500
2 000
2 500
01
.20
07
01
. 20
08
01
. 20
09
Average number of page viewsper user / gender
Female Male

LATVIA
Chart 71 Average number of page views per user by age – trends (gemiusAudience, January 2007, 2008 and 2009)
Latvian users also devote more and more time to internet surfing. Whereas in January 2007
they spent on average almost 16 hours on the sites monitored by the gemiusAudience study, in
January 2009 this result has almost doubled to around 30 hours. There is almost no disparity among
gender in terms of the dynamics of growth of the average time per visitor. But regarding age groups,
the pattern is congruent with the one described for page views, where the growth is most dynamic
for the youngest users and slows down with an increase in age.
Chart 72 Average time spent per user by age – trends (gemiusAudience, January 2007, 2008 and 2009)
1 225 940 884 722
503
2 390
1 648 1 660
1 235
856
2 742
1 900 1 742
1 340
938
-
500
1 000
1 500
2 000
2 500
3 000
[15
-24
]
[25
-34
]
[35
-44
]
[45
-54
]
[55
+]
Average number of page viewsper user (age intervals)
01.2007 01.2008 01.2009
0:00:005:00:00
10:00:0015:00:0020:00:0025:00:0030:00:0035:00:0040:00:00
[15
-24
]
[25
-34
]
[35
-44
]
[45
-54
]
[55
+]
Average time spentper user (age intervals)
01. 2007 01. 2008 01. 2009

LATVIA
3. TOOLS
3.1. Browsers
Although at the beginning of 2007 Microsoft Internet Explorer was the most popular browser
on the Latvian market, it has been slowly losing share in favour of Firefox, which became the market
leader in 2009 (50 percent). Meanwhile Opera and Chrome have been slowly increasing their shares.
Chart 73 Top browsers in Latvia by share of page views generated by internet users who visit Latvian web sites using gemiusTraffic (gemiusTraffic study 1Q 2007 – 2Q 2009)
3.2. Operating systems
Undoubtedly, the most important player among operating systems in Latvia is Windows XP.
However, its popularity decreased from 93 percent in 2007 to 83 percent in 2009. The popularity of
MacOS X has been slowly increasing over the past two years.
Chart 74 Top operating systems in Latvia by share of page views generated by internet users who visit Latvian web sites using gemiusTraffic (gemiusTraffic study 1Q 2007 – 2Q 2009)
0%
10%
20%
30%
40%
50%
60%
70%
80%
1Q
20
07
2Q
20
07
3Q
20
07
4Q
20
07
1Q
20
08
2Q
20
08
3Q
20
08
4Q
20
08
1Q
20
09
2Q
20
09
Browsers
Firefox MSIE Opera Chrome other
0%
20%
40%
60%
80%
100%
1Q
20
07
2Q
20
07
3Q
20
07
4Q
20
07
1Q
20
08
2Q
20
08
3Q
20
08
4Q
20
08
1Q
20
09
2Q
20
09
Operating systems
Windows XP Windows Vista MacOS X

LATVIA
3.3. Search engines
Without doubt, the most popular search engine in Latvia is Google with a 98 percent share in
2009. Its use has been consistently increasing. Other search engines are not important players and
have been losing market share in recent years.
Chart 75 Top search engines in Latvia by share of visits made by internet users who visit Latvian web sites using gemiusTraffic (gemiusTraffic study 1Q 2007 – 2Q 2009)
3.4. Screen resolutions
The 1024x768 resolution tends to be most popular in Latvia. However its popularity
decreased from 59 percent in 2007 to 35 percent in 2009. The second most popular screen resolution
among Latvians is 1280x1024 (23 percent of share in 2009). It is worth mentioning that 1280x800 has
been gaining popularity during the last two years.
Chart 76 Screen resolutions in Latvia by share of the page views generated by internet users who visit Latvian web sites using gemiusTraffic (gemiusTraffic study 1Q 2007 – 2Q 2009)
0%
20%
40%
60%
80%
100%1
Q 2
00
7
2Q
20
07
3Q
20
07
4Q
20
07
1Q
20
08
2Q
20
08
3Q
20
08
4Q
20
08
1Q
20
09
2Q
20
09
Search engines
Google MSN Yandex Yahoo other
0%
10%
20%
30%
40%
50%
60%
70%
1Q
20
07
2Q
20
07
3Q
20
07
4Q
20
07
1Q
20
08
2Q
20
08
3Q
20
08
4Q
20
08
1Q
20
09
2Q
20
09
Screen resolutions
1024 x 768 1280 x 1024 1280 x 800 1440 x 900
1152 x 864 1680 x 1050 other


LITHUANIA
LITHUANIA
1. MAIN PLAYERS
1.1. Top 10 websites
website's category
number of real users
number of page views
page views per user
average time per user
reach
1 Delfi.lt portal, news
service 917 008 91 113 690 99 02:52:58 63%
2 One.lt social
network 782 959 756 369 153 966 11:49:44 54%
3 Lrytas.lt news
service 687 352 43 948 896 64 01:32:08 48%
4 Plius.lt classified
ads 611 819 61 766 891 101 01:16:26 42%
5 Alfa.lt news
service 537 787 14 161 752 26 00:39:14 37%
6 Draugas.lt social
network 484 672 188 004 342 388 04:54:12 34%
7 Skelbiu.lt classified
ads 451 101 48 118 587 107 01:05:00 31%
8 Zebra.lt horizontal
portal 440 466 13 116 871 30 00:33:03 30%
9 Blogas.lt blog 413 401 2 609 135 6 00:08:15 29%
10 Diena.lt portal, news
service 411 108 4 726 752 12 00:12:21 28%
Table 22 Top 10 websites in Lithuania by reach level (gemiusAudience, January 2009)
Portals, news services, and the combination of those two forms, are the current core of
leaders in the online Lithuanian market, among which the service delfi.lt has gained the highest
popularity. It is a horizontal portal which was established by the Estonian company MicroLink and
sold in 2003 to the Norwegian company Findexa.12 However, since August 2007, Delfi’s owner is AS
"Ekspress Group".13 Delfi.lt operates under the same name not only in Lithuania, Estonia, and Latvia,
but also in Ukraine, yet only in Lithuania and Estonia it holds the leading position. According to the
gemiusAudience study, at the beginning of 2009 delfi.lt gathered the biggest audience among
websites participating in the research with up to 1 million of real users. This number may not be very
impressive at first sight, considering that the population of local internet users in the country is no
bigger than 1.7 million (1.4 million in the age group 15+), this score gave delfi.lt a reach level of over
63 percent. Other popular services belonging to portal/news category are: lrytas.lt, zebra.lt, diena.lt
and alfa.lt. 12
http://www.eadp.org/index.php?q=node/12730 13
http://www.delfi.lt/news/economy/Media/article.php?id=13966301
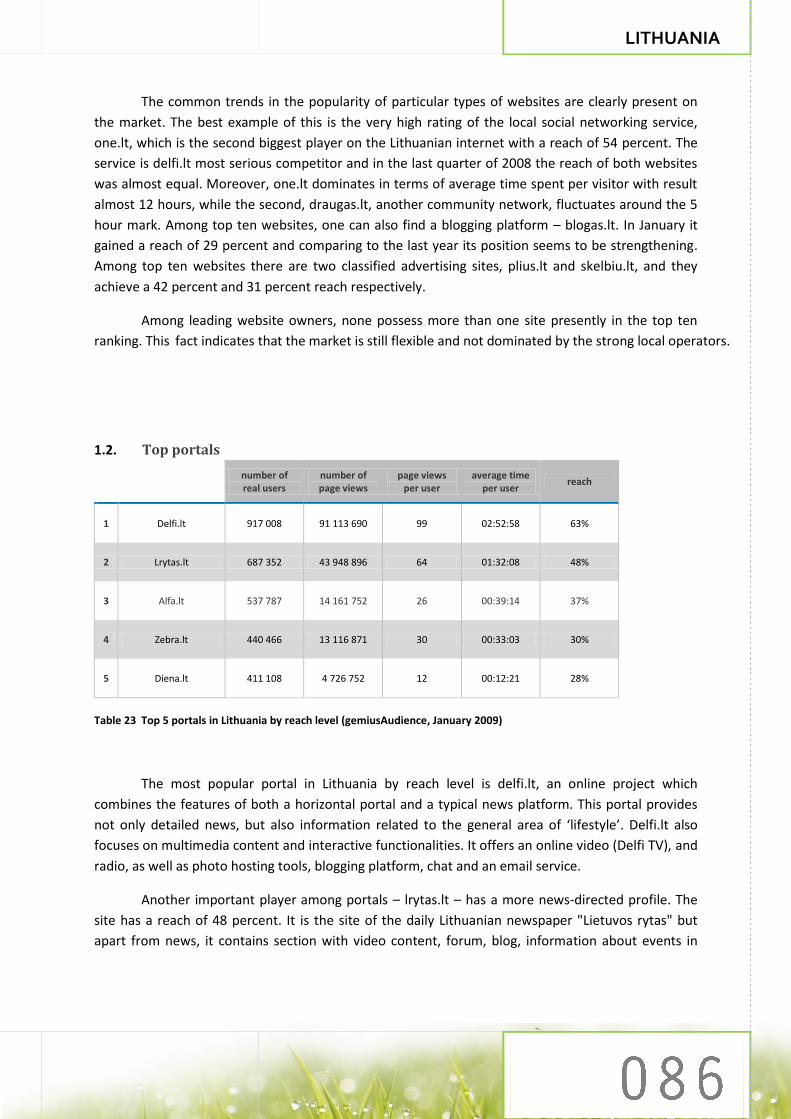
LITHUANIA
The common trends in the popularity of particular types of websites are clearly present on
the market. The best example of this is the very high rating of the local social networking service,
one.lt, which is the second biggest player on the Lithuanian internet with a reach of 54 percent. The
service is delfi.lt most serious competitor and in the last quarter of 2008 the reach of both websites
was almost equal. Moreover, one.lt dominates in terms of average time spent per visitor with result
almost 12 hours, while the second, draugas.lt, another community network, fluctuates around the 5
hour mark. Among top ten websites, one can also find a blogging platform – blogas.lt. In January it
gained a reach of 29 percent and comparing to the last year its position seems to be strengthening.
Among top ten websites there are two classified advertising sites, plius.lt and skelbiu.lt, and they
achieve a 42 percent and 31 percent reach respectively.
Among leading website owners, none possess more than one site presently in the top ten
ranking. This fact indicates that the market is still flexible and not dominated by the strong local operators.
1.2. Top portals
number of real users
number of page views
page views per user
average time per user
reach
1 Delfi.lt 917 008 91 113 690 99 02:52:58 63%
2 Lrytas.lt 687 352 43 948 896 64 01:32:08 48%
3 Alfa.lt 537 787 14 161 752 26 00:39:14 37%
4 Zebra.lt 440 466 13 116 871 30 00:33:03 30%
5 Diena.lt 411 108 4 726 752 12 00:12:21 28%
Table 23 Top 5 portals in Lithuania by reach level (gemiusAudience, January 2009)
The most popular portal in Lithuania by reach level is delfi.lt, an online project which
combines the features of both a horizontal portal and a typical news platform. This portal provides
not only detailed news, but also information related to the general area of ‘lifestyle’. Delfi.lt also
focuses on multimedia content and interactive functionalities. It offers an online video (Delfi TV), and
radio, as well as photo hosting tools, blogging platform, chat and an email service.
Another important player among portals – lrytas.lt – has a more news-directed profile. The
site has a reach of 48 percent. It is the site of the daily Lithuanian newspaper "Lietuvos rytas" but
apart from news, it contains section with video content, forum, blog, information about events in

LITHUANIA
Lithuania and a section dedicated to a traditional TV channel which is also owned by the ”Lietuvos
rytas” media group.
Alfa.lt, the third player in the category, is a typical news publishing site, but equipped with a
video section and a forum. It was launched in 2006 as a portal dedicated to a audience of different
age and likings. Alfa.lt aim is to inform with reliable news in an easily digestible way.
Another significant player among portals is zebra.lt – an entertainment portal, owned by Teo,
a telecommunication company. It contains news, leisure time information (TV schedule, event guide,
etc.) as well as entertainment services such as video, games, blogs, online radio or tools to create
one’s own web page. Moreover, zebra.lt offers the possibility to both place and look through
advertisements, browse directories and maps and provides e-mail services. Zebra.lt achieves a reach
of 30 percent, which has remained more or less stable during the past year. However, diena.lt,
another noteworthy portal, is steadily catching up. Diena.lt is a service that connects three sub
domains of regional newspapers (kauno.diena.lt, klaipeda.diena.lt, vilniaus.diena.lt), each of them
presenting information related to a particular Lithuanian city, including news and articles from local
newspapers. Moreover, they also have a forum, a directory of companies, advertisements and blogs.
With a similar profile is balsas.lt (28 percent reach), a portal that apart from news contains also
sections dedicated to many kinds of advertisements, complaints, video content, money, currency,
and games.
1.3. Social networks
number of real users
number of page views
page views per user
average time per user
reach
1 One.lt 782 959 756 369 153 966 11:49:44 54%
2 Draugas.lt 484 672 188 004 342 388 04:54:12 34%
3 Klase.lt 213 115 11 221 737 53 00:29:15 15%
4 Pazintys 159 350 14 365 117 90 01:39:23 11%
5 Frype.lt 130 868 10 034 193 77 01:19:11 9%
6 Point.lt 123 865 15 092 143 122 00:59:04 9%
7 Ieskok.lt 110 148 13 733 973 125 02:11:33 8%
8 Pazintysxxx (erotic) 71 474 15 729 658 220 02:38:21 5%
Table 24 Top social networks in Lithuania by reach level (gemiusAudience, January 2009)
The fact that more than ten local community services can be found on the Lithuanian online
market indicates that this branch of the internet is quite well developed in the country. Among the
most important services of this type, the leader is one.lt. It has almost 783,000 real users, which is a
54 percent reach, yet, its leadership is not by chance. It is a multi-thematic platform, which offers
many interesting tools, not only the typical networking solutions, but also some SMS service. A part

LITHUANIA
of the service is paid, which, together with advertising revenue, makes one.lt a well monetized
venture.
The second important player, with a reach of 34 percent, is the community service draugas.lt,
which in terms of construction is similar to a portal. It consists of several main sub-sites dedicated to
various types of content. The user can find services devoted to contacts with acquaintances, searches
for classmates, group mates, or other members, games, forum, e-mail, and others. However, despite
its complexity, with an average time spent per visitor monthly of five hours the service falls well
behind one.lt which can boast up to 12 hours. A similar pattern can be seen in the average number
of page views, where draugas.lt takes second position in the general ranking but has more than 570
million page views per month fewer than its major competitor.
Another important player – klase.lt – has a significantly smaller reach of almost 15 percent.
Similarly to draugas.lt, it also has a complex structure and consists of four main subsections
dedicated to classmates; group mates; clubs and acquaintances. Amongst other services with a reach
exceeding 10 percent, there is also pazintys.lt (11 percent), a community service designed to bring
together friends – old and new. It provides advanced search options for members, chat, information
about events, e-shop, games, forum, blogs and other services. Moreover, the company owns the
independent service, with a separate url address, pazintysxxx.lt, which has an erotic profile. This has
a reach of 5 percent and an average time per visitor monthly of more than 2.5 hours, which places
this site on the fifth position among websites in terms of this indicator, amongst those which
participated in the gemiusAudience study. Concerning average time per visitor monthly, the third
place is taken by starchat.lt, an interesting service with the very small reach of 0.4 percent. It can also
be considered as a community network, it is based on a virtual world where each user can create
their own unique player, find new friends and participate in games and adventures. Moreover, the
website contains sections dedicated to news, events, a forum about Starchat, etc.
2. ONLINE AUDIENCE
2.1. Socio-demographic profile
The general age structure of the Lithuanian online population is similar to those observed in
other CEE countries, where the share decreases with the increase of age. The largest group is the
youngest, accounting for 37 percent of the population. The same pattern can be observed regarding
the average time online and page views per visitor measured in the gemiusAudience study14, where
the values of both of those indicators decrease with user age.
14
In January 2009 gemiusAudience study in Lithuania covered 113 websites (sample 30 672).

LITHUANIA
Chart 77 Age structure of Lithuanian online population (gemiusAudience, January 2009)
The largest group of Lithuanian internet users, comprising over 41 percent of the online
population, have secondary level. . Moreover, this segment is responsible for almost half of all page
views measured in the gemiusAudience study (47 percent). The second largest group constitutes
users with higher education (25 percent). However, according to the gemiusAudience study, they
generate a lower number of page views than might be expected considering their share of the online
population. This may indicate that the group uses the internet less actively than others. Most active
on the web are people who have not yet completed secondary school and they generate 20 percent
of all page views but at the same time constitute only 13 percent of the whole population.
Chart 78 Education structure of Lithuanian online population and share of all page views by education level (gemiusAudience, January 2009)
37%
23%
19%
16%
5%
Age
[15-24]
[25-34]
[35-44]
[45-54]
[55+]
2%
13%
41%
13%
6%
25%
3%
20%
47%
10%5%
15%
0%5%
10%15%20%25%30%35%40%45%50%
Pri
mar
y o
r lo
wer
Un
com
ple
ted
se
con
dar
y
Seco
nd
ary
Vo
cati
on
al
Un
com
ple
ted
hig
her
(a
t le
ast
3 y
ear
s
Hig
he
r
Education / share of page views
share of education level groups share of the page views

LITHUANIA
Specialists and white collar workers constitute the most numerous group (28 percent) among
Lithuanian internet users, yet they do not devote much time to surfing the web, spending on average
around 12.5 hours online, which is the second lowest result among the occupation groups. As far as
the activity per user is concerned, housewives are unquestionable leaders. Although they account for
only 3 percent of online population, at almost 19 hours, they spent the greatest amount of time on
the monitored websites.
Chart 79 Occupation structure of online Lithuanian population and average time per user by occupation (gemiusAudience, January 2009)
The majority of Lithuanian internet users in live in big cities, the largest number being in the
capital, Vilnius with visitors from there making up 27 percent of the online population. The second
largest group, (17 percent) live, in Kaunas whereas users from villages constitute only 9 percent.
02:00:00
06:00:00
10:00:00
14:00:00
18:00:00
22:00:00
0%
5%
10%
15%
20%
25%
30%
Spe
cial
ist
/ o
ffic
e e
mp
loye
e
Stu
de
nt
Wo
rke
r/te
chni
cal
wo
rke
r
Top
/mid
dle
leve
l m
anag
er Oth
er
Smal
l bu
sin
ess
man
Un
em
plo
yed
Ho
use
wif
e
Pe
nsi
on
er
Farm
er
Occupation / average time per user
share of occupation groups average time per user

LITHUANIA
Chart 80 Settlement structure of online Lithuanian population (gemiusAudience, January 2009)
2.2. Internet users activity
In recent years the Lithuanian online market measured in the gemiusAudience study15 has
significantly developed in terms of the number of page views and average time spent per user.
Compared to 2005, the number of average page views per user in 2007 had increased more than
three times but in the two years since there was not a significant growth.
Chart 81 Average number of page views per user (gemiusAudience, January 2005, 2006, 2007, 2008, and 2009)
15
In January 2009 gemiusAudience study in Lithuania covered 113 websites (sample 30 672).
27%
17%
8%5% 5%
3% 2%
16%
9% 9%
0%
5%
10%
15%
20%
25%
30%
Vil
niu
s
Kau
nas
Kla
ipė
da
Šiau
liai
Pan
evė
žys
Aly
tus
Mar
ijam
po
lė
Oth
er
city
/ r
egi
ona
l ce
ntr
e
Smal
l to
wn
Vil
lage
Place of living
307
819
1 037 924
1 041
0
200
400
600
800
1 000
1 200
01
. 20
05
01
. 20
06
01
. 20
07
01
. 20
08
01
. 20
09
Average number ofpage views per user

LITHUANIA
In terms of the average time spent per visitor on monitored sites, growth is fastest among
the oldest group of users, 55+ (35 percent compared to 2007). The indicator has dropped for the
youngest users (15-24) in the same period.
Chart 82 Average time spent per user (age intervals) (gemiusAudience, January 2007, 2008, 2009)
3. TOOLS
3.1. Browsers
The most popular browser in Lithuania is Microsoft Internet Explorer with a market share of 52
percent in the second quarter of 2009. Nevertheless, its popularity has decreased since the first
quarter of 2007 when its share was 80 percent. At the same time, the share of the second most
popular browser in Lithuania – Firefox – has increased from 14 percent in the first quarter of 2007 to
37 percent in the second quarter of 2009. Opera has also been gradually gaining popularity in recent
years and, compared to the beginning of 2007, according to the gemiusTraffic study, a two
percentage point growth was observed in the first quarter of 2009 in terms of page views using
Opera.
01:00:00
05:00:00
09:00:00
13:00:00
17:00:00
21:00:00[1
5-2
4]
[25
-34
]
[35
-44
]
[45
-54
]
[55
+]
Age / average time spentper user (age intervals)
01. 2007 01. 2008 01. 2009

LITHUANIA
Chart 83 Top browsers in Lithuania by share of page views generated by internet users who visit the Lithuanian web sites
using gemiusTraffic (gemiusTraffic study 1Q 2007 – 2Q 2009)
3.2. Operating systems
The clear leader of the operating systems market in Lithuania is Windows XP, with an 84
percent share in the second quarter of 2009. However, its popularity has decreased over the last two
years – from 96 percent in the first quarter of 2007. Windows Vista has become the second most
popular operating system with a share of 13 percent in the second quarter of 2009. Other Windows
operating systems have lost their share, while MacOS X has gained over the past two years.
Chart 84 Top operating systems in Lithuania by share of the page views generated by internet users who visit the Lithuanian web sites using gemiusTraffic (gemiusTraffic study 1Q 2007 – 2Q 2009)
0%10%20%30%40%50%60%70%80%90%
1Q
20
07
2Q
20
07
3Q
20
07
4Q
20
07
1Q
20
08
2Q
20
08
3Q
20
08
4Q
20
08
1Q
20
09
2Q
20
09
Browsers
MSIE Firefox Opera other
0%
20%
40%
60%
80%
100%
1Q
20
07
2Q
20
07
3Q
20
07
4Q
20
07
1Q
20
08
2Q
20
08
3Q
20
08
4Q
20
08
1Q
20
09
2Q
20
09
Operating systems
Windows XP Windows Vista Windows 2000 MacOS X other

LITHUANIA
3.3. Search engines
Google, with a share of 98 percent in the second quarter of 2009, is the undoubted leader on
the search engines market and its popularity is still creeping upward. Other search engines such as
MSN, and Yahoo have lost share in recent years.
Chart 85 Top search engines in Lithuania by share visits made by internet users who visit the Lithuanian web sites using gemiusTraffic (gemiusTraffic study 1Q 2007 – 2Q 2009)
3.4. Screen resolutions
Although the market share of 1024 x 768 monitor screens resolution has decreased, it is still
the most popular choice among Lithuanians. Other popular screen resolutions in Lithuania tend to be
1280 x 1024 (20 percent in the second quarter of 2009) and 1280 x 800 (its share increased from 6
percent in the first quarter of 2007 to 19 percent in the second quarter of 2009). Also a screen
resolution of 1440 x 900 has become more popular in recent years.
Chart 86 Screen resolutions in Lithuania by share of the page views generated by Internet users who visit the Lithuania web sites using gemiusTraffic (gemiusTraffic study 1Q 2007 – 2Q 2009)
0%
20%
40%
60%
80%
100%1
Q 2
00
7
2Q
20
07
3Q
20
07
4Q
20
07
1Q
20
08
2Q
20
08
3Q
20
08
4Q
20
08
1Q
20
09
2Q
20
09
Search engines
Google MSN Yahoo other
0%
10%
20%
30%
40%
50%
60%
70%
1Q
20
07
2Q
20
07
3Q
20
07
4Q
20
07
1Q
20
08
2Q
20
08
3Q
20
08
4Q
20
08
1Q
20
09
2Q
20
09
Screen resolutions
1024 x 768 1280 x 1024 1280 x 800 1440 x 900 other


POLAND
POLAND
1. MAIN PLAYERS
1.1. Top 10 websites
website's category
number of real users
number of page views
page views per user
average time
per user reach
1 Google search engine
13 707 236 4 407 502 511 322 07:17:21 87%
2 onet.pl horizontal
portal 9 731 649 3 993 076 782 410 07:12:46 62%
3 nasza-klasa.pl social
networking 9 188 288 13 292 587 208 1447 18:44:17 59%
4 wp.pl horizontal
portal 8 627 364 2 638 202 152 306 05:48:16 55%
5 allegro.pl online
auctions 7 980 673 4 181 918 636 524 05:31:17 51%
6 interia.pl horizontal
portal 7 733 886 1 336 681 230 173 03:52:37 49%
7 o2.pl horizontal
portal 7 584 630 1 305 987 796 172 04:34:40 48%
8 gazeta.pl horizontal
portal 7 445 312 822 921 679 111 02:01:06 47%
9 youtube.com video
hosting 7 095 835 1 085 635 592 153 04:41:42 45%
10 wikipedia.org online
encyclopaedia 6 514 202 298 205 381 46 01:00:53 42%
Table 25 Top 10 websites in Poland by reach level (Megapanel PBI/Gemius, January 2009)
The initial and main conclusion regarding Polish internet users is that they are loyal and
oriented towards local brands. The best illustration is the position of the most popular online players
present on the Polish market. Unsurprisingly, the leader is Google, which appears as the clearly
dominant brand. In January 2009 Google attracted over 13,700,000 real users, totally subjecting the
local internet. The habit of using Google products (apparently wide-spread and strongly established
amongst local internet users) gave it not only the first position within the presented ranking, but
most importantly, a reach level of over 87 percent.
However, few global players have such strength and good fortune. Within the top 10 Polish
internet websites there are only two other foreign operators. These are: YouTube (45 percent of
reach in January 2009) and Wikipedia (41 percent of reach in the same month). Both offer Polish
language versions, but on the other hand, both hold relatively low market positions (ninth and tenth,
respectively). Polish internet users remain loyal to local websites, among which, and for many years

POLAND
now, portals are unquestionably the leaders. They are not only the biggest websites, but also account
for half of the very top group.
The most popular portal in Poland is Onet, which holds second position within the ranking by reach
level. The next, Wirtualna Polska (wp.pl) is in fourth position with other horizontal portals in the top
10 being: interia.pl (6th position, 49.2 percent of reach in January), o2.pl (7th position, 48.2 percent of
reach) and gazeta.pl (8th position, 47.3 percent of reach). As can be clearly seen, the differences in
popularity between top portals are very slight. Moreover, there are few other players of this kind
present on the market (outside the top 10), which are not out of vogue. Therefore, the horizontal
platforms can be judged as not only well-known types of online operation in Poland, but also the
websites which shape the majority of online activity.
It would be grossly negligent not to mention the third player on the Polish online market,
widely considered to be the most spectacular phenomenon, and which now demonstrates its true
identity and potential. Nasza-klasa.pl, is the site in question, is presently the biggest and the most
widely known Polish social networking service. But that alone is not what makes this website so
interesting. The key issue is that Nasza-Klasa achieved its tremendous success in a very short period
of time.
According to the Megapanel PBI/Gemius study, in January 2009 nasza-klasa.pl recorded a reach level
of almost 58.5 percent, which put it in third position in Poland. It should be noted that at the end of
2008 this website held the fourth position. In the first half of December 2008 it overtook one of the
biggest Polish horizontal portals, wp.pl, which is a quite extraordinary achievement. But the most
interesting aspect of the story concerns its very beginnings.
Nasza-Klasa came from nowhere to become one of the most brightly shining internet stars in Poland.
The chart below presents both its history and the disruption which it caused. The reach trends are
presented for nasza-klasa.pl, wp.pl (the portal which it overtook) and three other top social networks
active on the market. Accordingly, the latest changes, as well as Nasza-Klasa’s growth dynamics and
the huge gap between this website and the rest of social networks in Poland can be clearly seen.
Chart 87 Top 4 social networks / wp.pl (horizontal portal) – reach trends ( Megapanel PBI/Gemius, February 2007 - 2009)
0%
10%
20%
30%
40%
50%
60%
70%
02
. 20
07
05
. 20
07
08
. 20
07
11
. 20
07
02
. 20
08
05
. 20
08
08
. 20
08
11
. 20
08
02
. 20
09
Social networks / wp.pl (horizontal portal)
nasza-klasa.pl fotka.pl mojageneracja.pl myspace.com wp.pl

POLAND
Table 26 Top 4 social networks / wp.pl (horizontal portal) – reach trends ( Megapanel PBI/Gemius, February 2007 - 2009)
Finally, the fourth website which should be considered as one of the most significant
operations on the Polish market is allegro.pl – the biggest and best known online auction platform.
Allegro was established in 1999 as a very small company. Today, owned by Naspers, it is the
unquestionable leader within the e-commerce sector in Poland, as well as an active player in nine
other European countries (Belarus, Bulgaria, Czech Republic, Kazakhstan, Russia, Romania, Slovakia,
Ukraine, and Hungary). At the beginning of this year half of all Polish internet users regularly visited
Allegro (according to Megapanel PBI/Gemius this website registered over 7,980,000 real users in
January 2009).
1.2. Top portals
number of real users
number of page views
page views per user
average time per user
reach
1 onet.pl 9 731 649 3 993 076 782 410 07:12:46 62%
2 wp.pl 8 627 364 2 638 202 152 306 05:48:16 55%
3 interia.pl 7 733 886 1 336 681 230 173 03:52:37 49%
4 o2.pl 7 584 630 1 305 987 796 172 04:34:40 48%
5 gazeta.pl 7 445 312 822 921 679 111 02:01:06 47%
Table 27 Top 5 portals in Poland by reach level ( Megapanel PBI/Gemius, January 2009)
As mentioned in the previous section, internet space in Poland is replete with highly
developed, professional and powerful horizontal portals. These websites are without doubt the most
significant players constituting the main part of the local online marketplace.
The most popular horizontal portal in Poland is Onet. This website offers not only the basic
functionalities, such as email service, blogging platform, news, chat or e-commerce solutions, but
also a large number of external products. Many of them (for example zumi.pl – the best known Polish
map / localization service, sympatia.pl – one of the biggest local dating services or Skype – which is
distributed by Onet) can be considered as commercially successful operations. Apart from running
the portal itself and some vertical services, Onet Group is also active within other business areas
02. 2007 05. 2007 08. 2007 11. 2007 02. 2008 05. 2008 08. 2008 11. 2008 02. 2009
nasza-klasa.pl 1,1% 2,9% 4,1% 23,3% 50,8% 51% 52,4% 53,5% 57,3%
fotka.pl 15,3% 17,8% 18,7% 21,3% 20,6% 18,3% 16,4% 14,2% 14,1%
mojageneracja.pl 4,6% 11% 12,3% 12,1% 12,4% 12,1% 11,6% 11,4% 12,6%
myspace.com 4% 4,2% 4,3% 5% 6,2% 6,6% 6,1% 7% 6%
wp.pl 62% 61,6% 57,6% 57,1% 56,4% 54,8% 54,3% 55,2% 54,2%

POLAND
related to new media. In April 2006 it established Dream Lab – a company focused on the
development of new internet and multimedia technologies and in May 2006 – Media Entertainment
Ventures International Limited – a company concerned with online advertising and promotion issues.
Moreover, Onet owns 20 percent of shares in PBI, a significant institution responsible for developing
and researching the Polish internet. It operates within the TVN capital group (one of the biggest
multimedia players in Poland), which is its sole owner. Thereby, Onet is also a part of the ITI media
group.
The second force within the group of local horizontal platforms is wp.pl. This is a similarly
sized platform run by Telekomunikacja Polska, the biggest local telecommunications company
(telephone operator and internet provider). As with Onet, wp.pl runs a professional and highly
developed information platform, offering different online services typical of a horizontal site, as well
as developing many external projects. Not all of them are very successful (such as Spik, a local instant
messaging system released in 2005 – and now still a marginal project with only 0.17 percent reach).
However, Wirtualna Polska has stated to develop two very promising areas of internet activity –
multimedia and social networking. One of those – right on time. WP’s online television (launched two
years ago) is presently quite popular, attracting monthly about 1.7 million users. According to the
Megapanel PBI/Gemius study of January 2009, the wp.tv website was visited by over 1,690,000 real
users who, on average, spent 23 minutes on the site. Some of WP’s projects, however, are less
cutting edge. This year WP launched a social networking service named bliscy.pl (a community of
people interested in genealogy). This is the newest wp.pl brand and consequently a judgment of its
market well-being is not yet possible (presently bliscy.pl achieves from 1.3 to 2.2 percent reach).
However, many local experts claim that the best times for social networks in Poland have passed
with the incredible success of Nasza-Klasa. In the near future events will no doubt confirm or deny
this position.
The most important feature regarding Polish horizontal portals is the fact that the market
leaders do not differ significantly from each other. Basically, local portals offer quite similar products
and services and operate in a professional manner. Any interesting and meaningful disparities can be
observed only on two levels of analysis: the most broad (referring to the portals’ general image and
marketing strategy) and the most detailed one (referring to the particular products, solutions,
services or sub brands).
Taking this into consideration, it is legitimate to say that one of the most interesting players
is the fourth portal, o2.pl. This website projects entertainment as the core of its business identity and
activities. Nowadays o2 group is neither the most popular nor highly esteemed portal, but at the
same time it is the leader in developing the biggest network of external, mutually connected
entertainment services such as: wrzuta.pl (the most popular local audio-video sharing service – 25.7
percent of reach in January 2009) or pudelek.pl (one of the most known gossip sites in Poland). O2.pl
is also an active player within the area of social networking. Finally, this company owns Tlen, the
third most frequently used instant messaging service in Poland.

POLAND
1.3. Social networks
number of real users
number of page views
page views per user
average time per user
reach
1 nasza-klasa.pl 9 188 288 13 292 587 208 1447 18:44:17 59%
2 fotka.pl 2 334 805 1 806 206 013 774 06:38:37 15%
3 mojageneracja.pl 1 701 595 23 059 876 14 00:43:22 11%
4 myspace.com 990 414 48 219 912 49 00:53:17 6%
5 epuls.pl 927 879 356 377 663 384 03:09:29 6%
Table 28 Top 5 social networks in Poland by reach level ( Megapanel PBI/Gemius, January 2009)
Undoubtedly, the market for online social networking services in Poland is dominated by one
player, nasza-klasa.pl. The adaptation and operation of the concept, which originated from
classmates.com, on the local internet market in Poland has brought huge success for the initiators of
the venture.
Social networks in Poland, however, can be distinguished in a much more interesting way.
Firstly, it is easy to observe that at the top of the websites in this category there are three identifiable
groups operating sites characterized by different levels of popularity (expressed by the reach
indicator). The first group constitutes only one player, nasza-klasa.pl, which in January 2009
numbered almost 9.2 millions real users, achieving a share of over 58 percent.
Within the second group of Polish social networking services there are two platforms: fotka.pl (2.3
million real users – 15 percent share in January) and mojageneracja.pl (1.7 million of real users and
11 percent reach in the same reporting period). They can be defined as medium size local players.
The rest of the top social platforms in Poland are not able to congregate more than one
million users. They make up the third, mostly diverse group of websites, among which market
strengths are dispersed. The biggest representative of this group, MySpace, according to Megapanel
PBI/Gemius, in January 2009 attracted fewer than one million real users, achieving a 6 percent reach.
In turn, moikrewni.pl in the same period did not surpass 3 percent of reach.

POLAND
Chart 88 Social networks in Poland – reach distribution ( Megapanel PBI/Gemius, January 2009)
The second symptomatic feature describing the most popular social networking services in
Poland is that they are multifaceted. The strongly competitive market enforces the need for
innovation, therefore no dominating fashion can be easily developed and strengthened. Therefore,
on the local market of Poland the most significant social networking services are completely different
in nature, for example: classmates finder (nasza-klasa.pl), photos / hot-or-not format (fotka.pl),
youth community (mojageneracja.pl), work / career community (goldenline.pl) or neighbour
aggregator (bliziutko.pl). Against the background of many CEE countries this can be justifiably
interpreted as indicating a stage of market development. Moreover, contrary to some CEE markets,
amongst top Polish social networks there are no dating services, which are consistently losing their
popularity. However, the most crucial fact regarding social networking sites is that they are
extremely engaging. Apart from Nasza-Klasa, which keeps its users online on average for almost 19
hours monthly, many social networking websites engage Poles more than even the top horizontal
portals. The best example is grono.net, on which, in January 2008, internet users spent on average
almost 8 hours. As a matter of fact, Polish internet users surf this website for much longer than they
do when using all the services offered by Onet or even when exploring Google.
2. ONLINE AUDIENCE
2.1. Socio-demographic profile
The Polish internet is a highly egalitarian medium. Over the last 4 years there has been no
observable evidence of a disproportion between the numbers of males and females surfing the web.
Presently, the disparity of gender distribution is still much lower than 2 percent. In January 2009
women accounted for 49 of the whole online population.
As in most CEE markets, Polish internet users are also still quite young, although the first
symptoms of the ageing of the internet in Poland can be also easily perceived. Nowadays, the
58%
15%11%
6% 6% 5% 5% 5% 3% 3%
0%
10%
20%
30%
40%
50%
60%
70%
nas
za-k
lasa
.pl
fotk
a.p
l
mo
jage
ne
racj
a.pl
mys
pac
e.c
om
ep
uls
.pl
gold
en
line
.pl
gro
no
.ne
t
face
bo
ok.
com
mix
er.
pl
mo
ikre
wn
i.pl
Social networks

POLAND
dominant age group within the online population are people between 15 and 24 years of age.
Moreover, individuals younger than 45 account for over 81 percent of all internet users. However,
when analyzing the age structure of Poles active within the global network, it is also very important
to take into consideration all the changes that have taken place within the past couple of years.
Comparing the current age structure of Polish internet users and the audience composition from
2006, it is noticeable that the group of people younger than 25 is shrinking each year – presently they
constitute 41 percent of the total, whereas in 2006 the figure exceeded 50 percent. A completely
different trend is observed among individuals aged 55+. For last four years their share of the online
population increased from 5 percent in January 2006 to over 7 percent in January 2009. These
changes cannot be explained only by natural demographic trends. One of the most important factors
influencing those transformations is the process of the internet’s domestication. The network is
getting older together with its users, which is easy to observe within groups of individuals aged 25-34
(3 percentage points increase of population share since 2006) or 35-44 (2 percentage points growth).
It is also very important to remember the phenomenon of the biggest Polish social network (nasza-
klasa.pl), which is not only an example of a most spectacular commercial success, but also an
example of how a simple project can significantly enlarge the number of internet users and influence
the profile of the whole local market. Since the end of 2007, Nasza-Klasa has acquired a market
share of almost 60 percent (58.5 in January 2009) and now it is the third biggest player on the Polish
internet with over 9 million users. That is more than the whole population of Polish internet users in
2005.
January 2006 January 2007 January 2008 January 2009
[7-14] 13% 12% 11% 11 %
[15-24] 37% 34% 32% 30%
[25-34] 21% 22% 22% 24 %
[35-44] 14% 15% 16% 16%
[45-54] 11% 12 % 12% 12%
[55+] 5% 6% 7% 7%
Table 29 Polish online population – age structure trends ( Megapanel PBI/Gemius, January 2006 – January 2009)
Internet users in Poland live in the cities. Only 28.4 percent of them come from villages, but
this is still a bigger share than four years ago (in January 2006 inhabitants of rural areas accounted
for 25.6 percent of the whole population). Who relinquished market share for them? The share of
internet users living in small and medium towns as well as cities of up to 200 thousand inhabitants
remains stable. In the last couple of years, however, a slight decrease has been observed in the share
of users living in mid-sized and big cities (agglomerations bigger than 200 thousands of inhabitants).
Presently, the number of internet users living in big and very big agglomerations is by 12 percent
lower than in 2006 and of 20 percent in comparison to year 2005.

POLAND
Chart 89 Polish online population – size of settlement ( Megapanel PBI/Gemius, January 2009)
Chart 90 Polish online population – education ( Megapanel PBI/Gemius, January 2009)
Polish internet users are also well-educated. More than 19 percent of them have graduated
from universities or high schools and over 23 percent have a secondary education. The relatively high
share of users with a lower educational level can be explained by the significant role which is still
played on the Polish internet by youths. This fact is confirmed by the occupational status of Poles
surfing the web. Although the distribution of almost all categories referring to this matter is very
balanced, the majority of local internet users (31 percent in January 2009) declare that they are
professionally inactive pupils or students.
28%
13% 12%10% 9%
12%
16%
0%
5%
10%
15%
20%
25%
30%
cou
ntr
y
tow
n u
p t
o 2
0
00
0 in
hab
itan
ts
tow
n 2
0 0
00
-50
0
00
inh
abit
ants
tow
n 5
0 0
00
-1
00
00
0
inh
abit
ants
city
10
0 0
00 -
20
0 0
00
in
hab
itan
ts
city
20
0 0
00 -
50
0 0
00
in
hab
itan
ts
city
ove
r 50
0 0
00
inh
abit
ants
Size of settelment
10%
1%
5%
12%11%
23%
4% 5%
10%
19%
0%
5%
10%
15%
20%
25%
inco
mp
lete
pri
mar
y
pri
mar
y
low
er
seco
nd
ary
bas
icvo
cati
on
al
inco
mp
lete
tese
con
dar
y
seco
nd
ary
sch
oo
l
po
st-s
eco
nd
ary
ed
uca
tio
n
bac
he
lor'
sd
egr
ee
inco
mp
lete
hig
he
r
hig
he
r
Education

POLAND
Occupation share
pupil or student 32%
highly skilled worker, freelancer 8%
administration clerk 7%
trading industry worker 6%
self-employed 5%
middle manager 5%
retired or pensioner 5%
skilled worker 4%
unemployed 4%
business owner 3%
CEO, director, top-level manager 3%
housewife 2%
farmer 1%
unskilled worker 1%
military or police man 1%
other 14%
Table 30 Polish online population – occupation ( Megapanel PBI/Gemius, January 2009)
2.2. Internet users activity
Poles are very active and engaged internet users who also can be considered an attractive
group of potential online consumers. Year by year, they spend more time surfing the web and,
according to the Megapanel PBI/Gemius16, the average individual is online for almost 55 hours
monthly. Moreover, Poles are becoming more and more engaged users, who not only surf almost
three times longer than four years ago, but also generate three times more page views than in 2006.
They are experienced web-surfers who have been using the internet for 2 to 5 years (42.5 percent of
the whole population) or more than 5 years (34.3 percent of a totality). Above all, Polish internet
users can be described as a population of heavy users. Around 72 percent of all Poles using the
internet access the global network every day or almost every day and only 4.2 percent of them only
once a month. Furthermore, the above mentioned age disproportion increases.
Polish internet users also are increasingly engaged, which can be clearly demonstrated by
such indicators as number of page views generated by the average user or time spent by the average
Pole surfing the internet. At the beginning of last year, both numbers were twice those of 2005.
Presently they are even bigger – the average internet user in Poland generates monthly almost 3.5
thousand page views and stays online for almost 55 hours.
16
In January 2009 Megapanel PBI/Gemius study covered over 9200 websites (number of panelists – 17410).

POLAND
Chart 91 Polish online population – average number of page views per user monthly / average time spent per user monthly – trend ( Megapanel PBI/Gemius, January 2005-2009)
3. TOOLS
3.1. Browsers
During the last two years, the popularity of Microsoft’s Internet Explorer in Poland has been
decreasing, while the Firefox browser has become more popular. Recently, Firefox overtook MSIE to
become market leader in Poland. So far Chrome, Google’s browser, which was released in September
2009, has gained only one percent of the market.
Chart 92 Top browsers in Poland by share of page views generated by internet users who visit Polish websites using gemiusTraffic (gemiusTraffic study 1Q 2007 – 2Q 2009)
1 175 1 569 1 872
2 824 3 435 20:29:25
26:04:4130:57:19
45:32:37
54:56:50
0:00:00
12:00:00
24:00:00
36:00:00
48:00:00
60:00:00
0
500
1000
1500
2000
2500
3000
3500
4000
Jan
uar
y2
00
5
Jan
uar
y2
00
6
Jan
uar
y2
00
7
Jan
uar
y2
00
8
Jan
uar
y2
00
9
Page views / time spent (per user)
average page views per user average time spent per user
0%
10%
20%
30%
40%
50%
60%
70%
80%
1Q
20
07
2Q
20
07
3Q
20
07
4Q
20
07
1Q
20
08
2Q
20
08
3Q
20
08
4Q
20
08
1Q
20
09
2Q
20
09
Browsers
Firefox MSIE Opera Chrome other

POLAND
3.2. Operating systems
Windows Vista is gaining in popularity among Polish internet users and reached 14.11 percent
in the first quarter of 2009. However the most widely used operating system in Poland is still
Windows XP with an 82.72 percent market share. Other operating systems are still marginalized.
Chart 93 Top operating systems in Poland by share of page views generated by internet users who visit Polish websites using gemiusTraffic (gemiusTraffic study 1Q 2007 – 2Q 2009)
3.3. Search engines
Google is the outright leader in the Polish search engine market and its popularity is still
growing (an increase from 84.2 percent in 1Q 2007 to 95.66 percent in 2Q 2009). Furthermore, all of
its competitors are consistently losing market share.
Chart 94 Top search engines in Poland by share of visits made by internet users who visit Polish websites using gemiusTraffic (gemiusTraffic study 1Q 2007 – 2Q 2009)
0%
20%
40%
60%
80%
100%1
Q 2
00
7
2Q
20
07
3Q
20
07
4Q
20
07
1Q
20
08
2Q
20
08
3Q
20
08
4Q
20
08
1Q
20
09
2Q
20
09
Operating systems
Windows XP Windows Vista Windows 2000 other
0%
20%
40%
60%
80%
100%
120%
1Q
20
07
2Q
20
07
3Q
20
07
4Q
20
07
1Q
20
08
2Q
20
08
3Q
20
08
4Q
20
08
1Q
20
09
2Q
20
09
Search engines
Google MSN NetSprint other

POLAND
3.4. Screen resolutions
The most popular screen resolution in Poland is 1024x768. Nevertheless, it has lost market
share since the first quarter of 2007. Meanwhile the 1280x800 screen resolution – used in notebooks
– is becoming popular in Poland (rising from 4.89 percent in 1Q 2007 to 19.88 percent in 2Q of 2009).
Chart 95 Screen resolutions in Poland by share of page views generated by internet users who visit Polish websites using gemiusTraffic (gemiusTraffic study 1Q 2007 – 2Q 2009)
0%
10%
20%
30%
40%
50%
60%
70%
1Q
20
07
2Q
20
07
3Q
20
07
4Q
20
07
1Q
20
08
2Q
20
08
3Q
20
08
4Q
20
08
1Q
20
09
2Q
20
09
Screen resolutions
1024 x 768 1280 x 800 1280 x 1024 1440 x 900
1152 x 864 1680 x 1050 other


ROMANIA
ROMANIA
1. MAIN PLAYERS
1.1. Top 10 websites
website's category
visitors number of page views
page views per viewer
(average for 7 days)
1 forum.softpedia.com discussion
forum - - -
2 www.trilulilu.ro video
content - - -
3 www.ejobs.ro job
portal 1 766 966 32 493 628 8.8
4 www.kappa.ro portal 1 587 662 11 364 978 4.0
5 www.acasa.ro portal 1 584 098 11 336 760 3.9
6 www.cancan.ro media /
news 1 398 981 33 303 737 7.2
7 www.sport.ro sports 1 316 852 23 074 305 6.4
8 www.gsp.ro sports - - -
9 www.bizoo.ro business
portal - - -
10 www.okazii.ro online
auctions 1 258 090 46 265 731 20.6
Table 31 Top 10 websites in Romania by number of visitors (trafic.ro, April 2009)
According to trafic.ro, the most popular website in Romania is softpedia.com. In April 2009,
the discussion forum of Softpedia was the most popular website in Romania, while the second most
popular one was trilulilu.ro – the biggest Romanian photo-audio-video sharing service. The third
website mentioned in the ranking is ejobs.ro, the biggest job portal in Romania and present on the
market for ten years (in April 2009 this website attracted over 1.76 million of visitors, which is a
decrease over the previous month when visitors numbered more than 2 million). Gemius local
experts confirm, however, that the very top websites visited by local internet users is consists of
global players, including Google, Yahoo, YouTube, Facebook and Hi5.
Except for the horizontal portals and news services, among the biggest websites in Romania
are two interesting and significant players – sport.ro and gsp.ro. Both services being focused solely
on sport. The popularity of this kind of vertical portal is very high in Romania. Both of these websites
take meaningful positions within the general ranking (7th and 8th place respectively). In August 2009,
for example, sport.ro attracted over 1.3 million unique visitors (according to trafic.ro). The most

ROMANIA
interesting fact is that the simultaneous presence and competition between two similar and narrowly
targeted services is hard to find on any other CEE market. The interest in sport is demonstrably very
high among Romanian internet users. This condition created attractive business opportunities
exploited successfully by offline players. Nowadays the biggest sport portals in Romania are owned
by the television company (Pro TV / Central European Media Enterprises which own sport.ro) and
newspaper publisher (Gazeta Online which owns gsp.ro).
Within the very top group of Romanian internet players there is only one website which
represents e-commerce and it is okazii.ro – the biggest online auction service on the local market.
This website not only boasts one of the biggest local audiences each month (according to trafic.ro
data – almost 1.3 million of visitors in April 2009), but also it generates a huge number of page views
(according to recorded measurements – over 46 million during the same period). This prominent
service is run by New Century Holdings within the Netbridge Services online investments group.
1.2. Top portals
visitors
number of page views
page views per viewer
(average for 7 days)
1 www.kappa.ro 1 587 662 11 364 978 4.0
2 www.acasa.ro 1 584 098 11 336 760 3.9
Table 32 Top 2 portals in Romania by number of visitors (traffic.ro, April 2009)
The most significant Romanian horizontal portals are very diverse. Both, established and well
developed brands as well as young, new projects constitute the present image of the local online
market. Except for such players as rol.ro (one of the oldest online projects, present on the market for
12 years), internet activity in this country is shaped also by such as roportal.ro (one of the newest
brands). But that is not all. The local horizontal platforms are also specialized and targeted. Some of
them, for example kappa.ro or acasa.ro, are broadly oriented and they play the role of multi thematic
websites that are addressed to the general public and are reminiscent of classical horizontal portals
found in most of countries worldwide. On the other hand, however, it is also easy to find here such
projects as bizoo.ro, a portal targeted at a business audience. It offers many functionalities which
help small or medium companies build their online activities and even offer some e-commerce
solutions. One such is a website creator that makes it possible to generate a professional company
homepage in five minutes. Moreover, Bizoo helps with the effective promotion of brands and
products on the internet. This portal runs a job-board service (BizooJobs) providing HR management
functionalities and an expert / specialists discussion forum (MegaAjutor), where both individuals and
companies can seek advice on legislative, economic or business issues.
Most Romanian horizontal portals offer well known functionalities and standard scope of
information. Many of them combine journalistic and entertainment content in a smooth way.
Moreover, all significant market leaders in Romania have developed professional platforms working
not only as a sources of daily news and useful information, but also providing such online services as
email, hosting, web directories, databases of files / downloads, e-commerce or blogging platforms.

ROMANIA
Apart from the raw numbers, the leadership in this area does not belong to the pioneer portal
(kappa.ro), but to acasa.ro, which offers efficient access to a huge base of information, quick
searching tools and an extensive collection of online services.
1.3. Social networks
The most popular social networking services in Romania are the foreign players. Romanians
mostly use well known global platforms, such as Hi5, MySpace or Facebook. The latter, for example,
at the beginning of 2009 attracted about 300,000 users from Romania (according to Facebook
statistics). The other international brand, which should not be omitted, is Netlog. The glory days of
this website are now over (the highest reach levels were observed last year), notwithstanding it is
still one of the most popular community services on the local market.
The leading local brand in the category of social networks is neogen.ro. This is a fully featured
project which, according to local experts, achieves fairly good results on the market. This success is
not surprising considering that the website is run by a company which is not only the leader in social
networking, direct marketing and online jobs in four rising markets (Romania, Moldavia, Bulgaria and
Serbia), but has also been strengthened by recent investments by Tiger Global Management and
Wouwer.
The last group of local community websites is not large. There are only four online players
worthy of mention here: mysport.ro (website combining characteristics of a sport portal and a social
networking service), tpu.ro (simple website based on the popular question-answer model),
sentimente.ro and elmaz.ro. According to trafic.ro statistics the two last websites take significant
positions amongst local social networks (by number of visitors). However within the general ranking
of websites for March 2009 they took (respectively) the 57th and the 94thplace. Nevertheless, these
services are typical dating / matchmaking platforms. Their position on the local market is important,
as they play the role of the best known representatives of that kind of website in Romania.

ROMANIA
2. TOOLS
2.1. Browsers
Although Microsoft Internet Explorer has been losing its share of the Romanian browser
market since 2007, it has long been, and remains, the most popular browser in the country. The
second most popular browser in Romania is Firefox. Its share grew from 16 percent at the beginning
of 2007 to 32 percent in 2008. In the second quarter of 2009, 62 percent of page views were
generated with MSIE. Since 2008 Chrome has gained a 2 percent market share.
Chart 96 Top browsers in Romania by share of page views generated by internet users who visit Romanian websites
using gemiusTraffic (gemiusTraffic study 1Q 2007 – 2Q 2009)
2.2. Operating systems
The most popular operating system in Romania is Windows XP. Although it has been slowly
losing its popularity (it decreased from 93 percent in 2007 to 89 percent in 2009), it has had the
largest share of the operating systems market since 2007. It is worth mentioning that the Windows
Vista share has been growing rapidly, from 0.3 percent in 2007 to 9 percent in 2009. Also MacOS X
has become more popular among Romanian users in recent years (0.3 percent in 2009).
0%10%20%30%40%50%60%70%80%90%
1Q
20
07
2Q
20
07
3Q
20
07
4Q
20
07
1Q
20
08
2Q
20
08
3Q
20
08
4Q
20
08
1Q
20
09
2Q
20
09
Browsers
MSIE Firefox Opera Chrome other
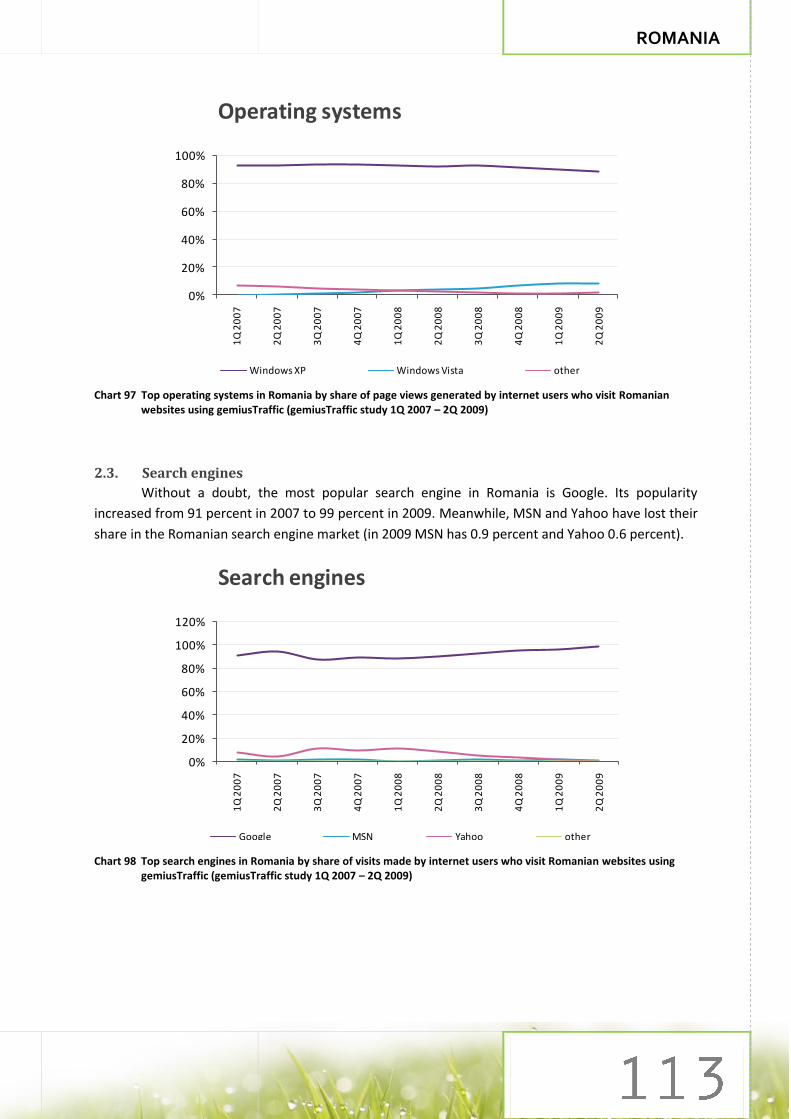
ROMANIA
Chart 97 Top operating systems in Romania by share of page views generated by internet users who visit Romanian
websites using gemiusTraffic (gemiusTraffic study 1Q 2007 – 2Q 2009)
2.3. Search engines
Without a doubt, the most popular search engine in Romania is Google. Its popularity
increased from 91 percent in 2007 to 99 percent in 2009. Meanwhile, MSN and Yahoo have lost their
share in the Romanian search engine market (in 2009 MSN has 0.9 percent and Yahoo 0.6 percent).
Chart 98 Top search engines in Romania by share of visits made by internet users who visit Romanian websites using
gemiusTraffic (gemiusTraffic study 1Q 2007 – 2Q 2009)
0%
20%
40%
60%
80%
100%
1Q
20
07
2Q
20
07
3Q
20
07
4Q
20
07
1Q
20
08
2Q
20
08
3Q
20
08
4Q
20
08
1Q
20
09
2Q
20
09
Operating systems
Windows XP Windows Vista other
0%
20%
40%
60%
80%
100%
120%
1Q
20
07
2Q
20
07
3Q
20
07
4Q
20
07
1Q
20
08
2Q
20
08
3Q
20
08
4Q
20
08
1Q
20
09
2Q
20
09
Search engines
Google MSN Yahoo other

ROMANIA
2.4. Screen resolutions
The most popular screen resolution in Romania is 1024x768, but it has consistently been
losing its share in recent years, while the popularity of other screen resolutions – 1280X800 and
1440x900 – has increased. The second most popular screen resolution in Romania is 1280x1024
which has been growing in popularity over the last two years. It is worth mentioning that the
800x600 screen display has also lost market share. This trend underlines the improvement of PC
hardware used by Romanians.
Chart 99 Screen resolutions in Romania by share of page views generated by Internet users who visit Romanian websites using gemiusTraffic (gemiusTraffic study 1Q 2007 – 2Q 2009)
0%
10%
20%
30%
40%
50%
60%
70%
1Q
20
07
2Q
20
07
3Q
20
07
4Q
20
07
1Q
20
08
2Q
20
08
3Q
20
08
4Q
20
08
1Q
20
09
2Q
20
09
Screen resolutions
1024 x 768 1280 x 1024 1280 x 8001440 x 900 800 x 600 other


RUSSIA
RUSSIA
1. MAIN PLAYERS
1.1. Top 10 websites
website's category
number of real users
number of page views
page views per user
average time
per user reach
1 yandex.ru horizontal
portal 22 085 144 3 929 923 898 178 05:12:01 73%
2 mail.ru horizontal
portal 20 801 435 6 815 547 981 328 05:41:42 69%
3 odnoklassniki.ru social
networking 13 406 992 5 961 636 943 445 04:34:42 44%
4 Google search engine
12 910 952 829 010 532 64 02:35:19 43%
5 rambler.ru horizontal
portal 12 750 523 2 117 594 763 166 03:24:34 42%
6 vkontakte.ru social
networking 12 359 319 31 824 873 114 2575 18:01:47 41%
7 microsoft.com corporate website
7 917 155 78 721 539 10 00:08:22 26%
8 wikipedia.org online
encyclopedia 7 625 932 102 907 040 13 00:16:18 25%
9 marketgid.com e-shop
catalogue 7 243 688 66 108 612 9 00:34:20 24%
10 Livejournal user generated content / blogs
6 238 661 208 042 739 33 00:50:11 21%
Table 33 Top 10 websites in Russia by reach level (gemiusAudience, January 2009)
Three groups of players might be observed on the Russian online market among the leading
ten websites. The first consists of two dominating services: yandex.ru and mail.ru. Yandex is by far
the most often used search engine in Russia, offering free e-mail accounts with unlimited storage
space and proprietary spam filtering. Moreover, it is an aggregator of current news, a provider of
local maps, including real-time traffic information and satellite images and offers a price comparison
service. Since September 2009 Yandex has been dominant on the Russian market and achieves a
reach level of 73 percent. The second important site is mail.ru, which for long took the top position
until it was overtaken by yandex.ru. Mail.ru is a horizontal portal that runs projects such as e-mail
services, search engine (service provided in partnership with Yandex, search traffic is 36 percent of
mail.ru monthly real users), directories, chats, job services, photo and video hosting, blogs, news,
role playing games, web-site hosting, messaging and others. In January 2009 it achieved a reach of 69
percent, a stable result observed throughout the year, so the change in the leading position was
caused mainly by an increase in the popularity of its competitor.

RUSSIA
The second group of players consists of four websites, whose reach fluctuate around 40
percent. Among these are Google, the dominant player worldwide, yet, on the Russian market only in
fourth position and outperformed by odnoklassniki.ru, a local social community website. Another
two of the top-ranking services are: rambler.ru, a horizontal portal and vkontakte.ru, the second
biggest social network. However, Rambler is the only site in that group which has ever reached
almost 60 percent of the audience, although now it is steadily losing its popularity. Google and
Odnoklassniki during the last year have remained more or less stable and growth could be observed
only for vkontakte.ru. Its success might be partly due to the fact that this service is highly inspired by
facebook.com, the worldwide leader in the community category.
The players gathered in the third group have a reach of around 20 percent and it is hard to
differentiate a leader among them, yet, for the last quarter of 2008, marketgid.com, a news
exchange service, virtual advertising centre, e-shop catalogue and price comparison service, was in
the first position in terms of reach. However, the latest leadership position is occupied by
wikipedia.org, the “user-generated” internet encyclopedia which, since August 2008, started to gain
popularity on the Russian online market. Microsoft’s service and Livejournal, the blog-platform
allowing comment on a variety of issues, are other services among this group.
The top ten ranking is more or less stable, with the few services sometimes exchanging their
places. Interesting trends can be observed regarding Yandex and Mail, which exchanged their
positions, as well as to Rambler, which has been balancing on the edge of survival for several years,
but is still spending money on promotion, which so far has done little to help.
1.2. Top portals
number of real users
number of page views
page views per user
average time per user
reach
1 yandex.ru 22 085 144 3 929 923 898 178 05:12:01 73%
2 mail.ru 20 801 435 6 815 547 981 328 05:41:42 69%
3 rambler.ru 12 750 523 2 117 594 763 166 03:24:34 42%
4 rbc.ru 4 266 202 201 297 655 47 02:49:26 14%
Table 34 Top 5 portals in Russia by reach level (gemiusAudience, January 2009)
On the Russian horizontal portal market there are four significant players, among which, two,
Yandex and Mail, are the unquestioned leaders on the whole Runet. Yandex.ru, was founded in 1997,
when the search algorithm was created. The search engine was part of CompTek until the year 2000
when Yandex became a privately owned company. However, from 2004 it is 100 percent owned by
Yandex Technologies Ltd. based in Cyprus. Today Yandex has over 20 services including Yandex
News aggregator, the second important news service in Russia, a blog search engine, Yandex Blogs, a
geo-location service,Yandex Maps, Yandex Traffic, a live traffic monitoring system, a price
comparison service, weather and many other. Moreover, this portal offers a large amount of free
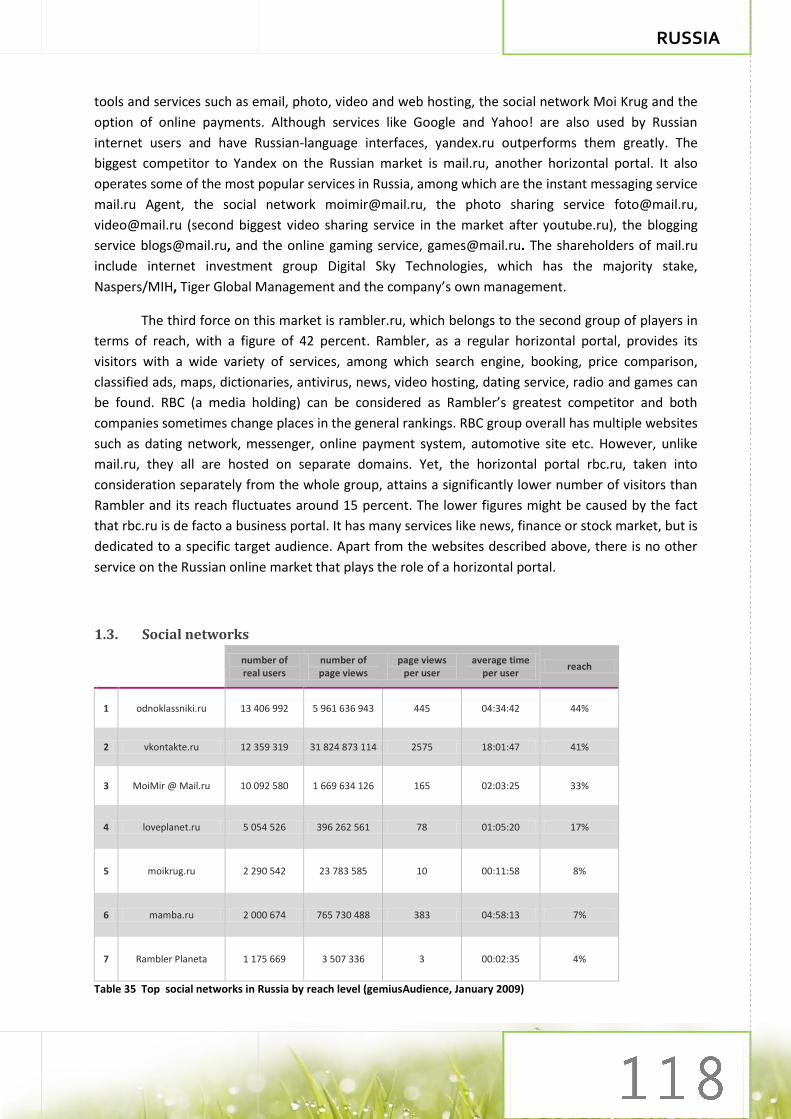
RUSSIA
tools and services such as email, photo, video and web hosting, the social network Moi Krug and the
option of online payments. Although services like Google and Yahoo! are also used by Russian
internet users and have Russian-language interfaces, yandex.ru outperforms them greatly. The
biggest competitor to Yandex on the Russian market is mail.ru, another horizontal portal. It also
operates some of the most popular services in Russia, among which are the instant messaging service
mail.ru Agent, the social network [email protected], the photo sharing service [email protected],
[email protected] (second biggest video sharing service in the market after youtube.ru), the blogging
service [email protected], and the online gaming service, [email protected]. The shareholders of mail.ru
include internet investment group Digital Sky Technologies, which has the majority stake,
Naspers/MIH, Tiger Global Management and the company’s own management.
The third force on this market is rambler.ru, which belongs to the second group of players in
terms of reach, with a figure of 42 percent. Rambler, as a regular horizontal portal, provides its
visitors with a wide variety of services, among which search engine, booking, price comparison,
classified ads, maps, dictionaries, antivirus, news, video hosting, dating service, radio and games can
be found. RBC (a media holding) can be considered as Rambler’s greatest competitor and both
companies sometimes change places in the general rankings. RBC group overall has multiple websites
such as dating network, messenger, online payment system, automotive site etc. However, unlike
mail.ru, they all are hosted on separate domains. Yet, the horizontal portal rbc.ru, taken into
consideration separately from the whole group, attains a significantly lower number of visitors than
Rambler and its reach fluctuates around 15 percent. The lower figures might be caused by the fact
that rbc.ru is de facto a business portal. It has many services like news, finance or stock market, but is
dedicated to a specific target audience. Apart from the websites described above, there is no other
service on the Russian online market that plays the role of a horizontal portal.
1.3. Social networks
number of real users
number of page views
page views per user
average time per user
reach
1 odnoklassniki.ru 13 406 992 5 961 636 943 445 04:34:42 44%
2 vkontakte.ru 12 359 319 31 824 873 114 2575 18:01:47 41%
3 MoiMir @ Mail.ru 10 092 580 1 669 634 126 165 02:03:25 33%
4 loveplanet.ru 5 054 526 396 262 561 78 01:05:20 17%
5 moikrug.ru 2 290 542 23 783 585 10 00:11:58 8%
6 mamba.ru 2 000 674 765 730 488 383 04:58:13 7%
7 Rambler Planeta 1 175 669 3 507 336 3 00:02:35 4%
Table 35 Top social networks in Russia by reach level (gemiusAudience, January 2009)

RUSSIA
In terms of social network communities, two local websites dominate the Russian online
market: Odnoklassniki and Vkontakte. The services have 44 and 41 percent reach respectively and
are listed among the top ten Russian websites. Odnoklassniki.ru started at the beginning of 2006 and
is considered to be a Russian version of the global service, classmates.com, and is widely used to
search for and correspond with former classmates and colleagues. However, apart from
communication, there are also the capabilities of uploading photos or creating special interest
groups. Initially, participation in this community was free, but after two years the company added
some paid services. Yet Odnoklassniki’s monopoly did not last long and in October 2006 a new
service was launched on the Russian online community market: vkontakte.ru. The service is thought
to have been created by a Sankt-Petersburg student Paul Durov, so the audience is mainly
concentrated in that city. Vkontakte gathers a younger audience than its competitor and is promoted
as a resource for active internet users. At the same time, odnoklassniki.ru is more egalitarian than its
competitor, partly due to that fact that from the beginning it has been out-reaching its rival.
Furthermore, Odnoklassniki was the first on the market to run offline ad campaigns, which attracted
older internet users. The service is also more often used by women, which account for 52 percent of
the audience. In contrast, Vkontakte is dominated by men (52 percent) and they are also much more
active (on average they spend around 6 hours per user monthly more than women and generate
over 7 million more page views).
Apart from the leaders, there is also a long list of less popular services, among which MoiMir
can be considered as the most significant player in terms of reach, with around 33 percent. However,
its popularity can be mainly ascribed to a connection with the mail.ru, the leading horizontal portal
on the Russian online market. The service has similar functionalities as Odnoklassniki, with additional
instant messaging built in. Another community website, which attains up to 17 percent of the
Russian audience, is loveplanet.ru, which offers an option for writing personal diaries plus various
competitions and quizzes. As far as dating sites are concerned, there is another significant player,
mamba.ru. This site provides its users with many services, including: horoscopes, diaries and, a new
option, games. On this market there is also a site dedicated to specific audience, moikrug.ru, which is
a business portal. It offers such possibilities as searching for classmates among job-searchers or
collating business contacts.
Contrary to the worldwide trend, globally significant operators still play a marginal role on
the online community market in Russia. According to the data for January 2009, myspace.com had
only 3 percent reach and the recent worldwide phenomenon, facebook.com, only 2 percent,
although its reach is increasing.

RUSSIA
2. ONLINE AUDIENCE
2.1. Socio-demographic profile
The gender structure of Russian internet users is quite balanced. In January 2009 there were
slightly more men, who accounted for over 53 percent of the whole online population. As with many
nations within the CEE region, young internet users are more active online, the dominant group
being in the 18-24 age group. Furthermore, individuals under 44 make up to 82 percent of the whole
online population in Russia. There has been a slight increase in the number of internet users aged 45-
54 years, which illustrates the fact that the internet in Russia is becoming a more developed and
domesticated medium. It is also very important to notice that today almost 77 percent of Russians
access the global network from their homes, which is more than a year ago.
Chart 100 Russian online population – age structure (gemiusAudience, January 2009)
It is hard to describe the educational structure of Russian internet users. The dominant
groups are individuals who graduated from vocational schools (39 percent), who finished higher
education (32 percent) or had any kind of a secondary schooling (18 percent in January 2009).
Unfortunately, the Russia market is quite opaque with no reliable information on individuals under
18 years of age. Therefore the educational structure of the Russian population as a whole, as well as
of internet users, cannot be fully revealed and judged. Hence, in the presentation below, the lack of
people with no education or those who finished only a primary school should be interpreted only as a
result of these conditions and not as a true market figure.
32%
30%
20%
14%
4%
Age
[18-24]
[25-34]
[35-44]
[45-54]
[55+]

RUSSIA
Chart 101 Russian online population – education (gemiusAudience, January 2009)
One of the most interesting characteristics describing the population of Russian internet
users is their occupational status. Even though the distribution of individuals working within different
branches of the economy is quite scattered, the group of internet users employed as managers,
specialists, office staff or those who own their own business accounts for over 42 percent of the total
(data for January 2009). Moreover, the reach of the unemployed, housewives or pensioners is
relatively low. One of the dominant groups is students, who account for over 12 percent of the whole
online population. That makes them the third biggest force within the Russian internet.
profession share
specialist/chief specialist 32%
student/pupil 8%
engineer/technical worker 7%
middle level manager/project manager 6%
specialist in governmental or subsidized institution 5%
top manager/director/owner 5%
office employee/assistant/trainee 5%
small business owner 4%
housewife 4%
unemployed 3%
pensioner 3%
other 2%
Table 36 Russian online population – occupation (gemiusAudience, January 2009)
1%
18%
39%
9%
33%
0%
5%
10%
15%
20%
25%
30%
35%
40%
Inco
mp
lete
seco
nd
ary
Seco
nd
ary
Vo
cati
on
al
Inco
mp
lete
h
igh H
igh
Education

RUSSIA
Chart 102 Russian online population – size of settlement (gemiusAudience, January 2009)
Russian internet users live mostly in cities smaller than 500,000 and up to one million
inhabitants (in January those two groups of users comprised over 60 percent of the totality). The
Russian market, however, is very divided. The country as a whole contains two distinct types of
settlement, the strongly urbanized cities with a high level of internet penetration and large, low
density rural areas for which such indicators as internet penetration can be omitted. That is why
most of statistics related to the geographical arrangement of Russian internet users focus only on
cities. The highest share of Russians surfing the global web live in Moscow and in January 2009
almost 17 percent of the whole online population were citizens of the capital.
2.2. Internet user activity
While analyzing Russian internet use in terms of online consumers, it is justifiable to say that in
general they are an active and engaged target group. According to the gemiusAudience study17, an
average internet user in the country generates monthly almost three thousand page views (2847 in
January 2009) and stays online for almost 37.5 an hour. Yet, Russian internet users (in comparison to
most CEE countries) are not very wealthy, with only 7 percent having a monthly personal income
higher than 45,000 rubles (about 1090 euro). However, when portraying the Russian online
consumer, it is very important to take into consideration the size of the market. The elite group of
active and high-earning internet users in Russia, for example, equals the whole population of internet
users in Slovakia. This fact makes the picture of online consumers more accurate and helps to
understand the potential of the whole Russian market.
17
In January 2009 gemiusAudience study in Russia covered 241 websites (number of software panelists – 4320, number of cookie panelists - 82543).
17%
7%
40%
21%
15%
0%
5%
10%
15%
20%
25%
30%
35%
40%
Mo
sco
w
St.P
ete
rsbu
rg
< 0
,5 m
ln c
itie
s
0,5
-1 m
ln c
itie
s
> 1
mln
cit
ies
Size of settlement

RUSSIA
3. TOOLS
3.1. Browsers
Although Microsoft Internet Explorer is the most popular browser in Russia, it has been
losing its share during recent years – the usage of MSIE decreased from 75 percent in 2007 to 49
percent in 2009. The second most popular browser in Russia is Opera, which gained popularity during
the last two years and presently holds 25 percent of the Russian market. Similarly, Firefox’s share
grew from 9 percent in 2007 to 22 percent in 2009. It is also worth mentioning that Chrome and
OperaMini have become more popular among Russian users with a share around 2 percent in 2009.
Chart 103 Top browsers in Russia by share of page views generated by internet users who visit the Russian web sites using gemiusTraffic (gemiusTraffic study 1Q 2008 – 2Q 2009)
3.2. Operating systems
Windows XP is the most popular operating system in Russia. Although it has been losing its
popularity, it still has over 82 percent of market share. The second OS in Russia is Windows Vista. Its
popularity increased from 7 percent in the first quarter of 2007 to 14 percent in 2009. Shares of
other Windows operating systems have decreased and it is worth underlining that Mac OS X and
Linux have been gradually gaining in popularity.
0%
10%
20%
30%
40%
50%
60%
70%
80%
1Q
20
08
2Q
20
08
3Q
20
08
4Q
20
08
1Q
20
09
2Q
20
09
Browsers
MSIE Opera Firefox other

RUSSIA
Chart 104 Top operating systems in Russia by share of page views generated by internet users who visit Russian web sites using gemiusTraffic (gemiusTraffic study 1Q 2008 – 2Q 2009)
3.3. Search engines
In contrast to other countries, the most popular search engine in Russia is a local one –
yandex.ru. Its popularity has been constantly growing and it now has over 63 percent of share of the
Russian market. The second most popular search engine in Russia is Google, whose share has been
gradually increasing in recent years, reaching 29 percent in the second quarter of 2009. Another
important fact is that even the second most significant local search engine, Rambler, leaves global
players behind. Despite a rapid decrease in share since the third quarter of 2008, Rambler still has a
bigger market share than MSN and Yahoo.
Chart 105 Top search engines in Russia by share of visits made by internet users who visit Russian web sites using gemiusTraffic (gemiusTraffic study 1Q 2008 – 2Q 2009)
0%
20%
40%
60%
80%
100%
1Q
20
08
2Q
20
08
3Q
20
08
4Q
20
08
1Q
20
09
2Q
20
09
Operating systems
Windows XP Windows Vista Windows 2000 other
0%
10%
20%
30%
40%
50%
60%
70%
1Q
20
08
2Q
20
08
3Q
20
08
4Q
20
08
1Q
20
09
2Q
20
09
Search engines
Yandex Google Rambler MSN other

RUSSIA
3.4. Screen resolutions
The most popular screen resolutions in Russia are 1024x768 and 1280x1024, yet the first
seems to be losing its share. At the same time, the less typical resolutions (1280x800, 1680x1050,
1440x900) have became more popular in recent years.
Chart 106 Screen resolutions in Russia by share of page views generated by internet users who visit Russian web sites using gemiusTraffic (gemiusTraffic study 1Q 2008 – 2Q 2009)
0%
10%
20%
30%
40%
50%1
Q 2
00
8
2Q
20
08
3Q
20
08
4Q
20
08
1Q
20
09
2Q
20
09
Screen resolutions
1024 x 768 1280 x 1024 1280 x 800 1440 x 9001680 x 1050 1152 x 864 other


SLOVAKIA
SLOVAKIA
1. MAIN PLAYERS
1.1. Top 10 websites
website's category
number of real users
number of page views
page views per user
average time per user
reach
1 azet.sk horizonal portal 1 333 765 3 069 017
865 2 301 20:18:24 64%
2 zoznam.sk horizontal portal 1 250 368 147 535 788 118 02:43:53 60%
3 atlas.sk horizonal portal 1 087 535 43 524 902 40 00:40:37 52%
4 sme.sk news service 983 036 54 498 846 55 01:25:13 47%
5 topky.sk news service 755 184 48 678 452 64 01:20:19 36%
6 aktuality.sk news service 673 721 25 011 303 37 00:54:35 32%
7 centrum.sk horizonal portal 672 065 84 982 426 126 02:14:40 32%
8 pravda.sk news service 491 547 22 328 354 45 00:57:18 24%
9 cas.sk news service 453 998 23 506 587 52 00:55:08 22%
10 markiza.sk news service 433 134 10 483 790 24 00:37:25 21%
Table 37 Top 10 websites in Slovakia by reach level (AIMmonitor – AIM – Mediaresearch & Gemius, January 2009)
Portals and news services account for the majority of the top ten Slovakian websites.
Comparing to last year, the structure remains stable and nine out of ten services are still present
among the top ten reach ranking. Cas.sk – a news service – is the only new entry, which has
appeared among top ten sites and now stands in ninth position, with a reach of 22 percent.
In August 2008, however, there was a change in the leading position, which for a long time
was held by zoznam.sk – a well known horizontal portal. Nowadays, azet.sk – a competitive portal –
holds first place on the Slovakian online market. Although both services have a reach exceeding 60
percent, azet.sk has increased its share dynamically, whereas in the in the case of Zoznam, after a
decrease, its position has stabilized. The other two significant websites are atlas.sk – a horizontal
portal, with a 52 percent reach, and sme.sk – a news service that during last few months has gained
popularity and now has a reach of 47 percent. Although the leading positions on the market belong

SLOVAKIA
mostly to the horizontal portals, offering web catalogues or search engines, Google – the global
player – dominates in terms of search on the Slovakian online market.18
1.2. Top portals/news services
number of real users
number of page views
page views per user
average time per user
reach
1 azet.sk 1 333 765 3 069 017 865 2301 20:18:24 64%
2 zoznam.sk 1 250 368 147 535 788 118 02:43:53 60%
3 atlas.sk 1 087 535 43 524 902 40 00:40:37 52%
4 sme.sk 983 036 54 498 846 55 01:25:13 47%
5 topky.sk 755 184 48 678 452 64 01:20:19 36%
Table 38 Top 5 portals in Slovakia by reach level (AIMmonitor – AIM – Mediaresearch & Gemius, January 2009)
The top five portals on the Slovakian online market also occupy the leading places in the
general rankings. At the moment, azet.sk – a well known directory, email provider and owner of
many thematic services such as: pokec.sk (chat and social community), zoznamka.sk (photo and
announcement service), fotoalbumy.sk (images hosting) and aktuality.sk (news service), occupies the
leading position. However, up to August 2008 the first place used to be held by zoznam.sk – a
horizontal portal belonging to Slovak Telekom. This change in leadership was due mainly to the
improvement of Azet’s products, particularly to its strongest operation – Pokec.sk. Nowadays,
Zoznam is trying to regain its leading position by developing products such as feminity.sk (service
dedicated for women) and taking iMHD.sk (public transportation in Bratislava) under its wing.
However, the current position reveals an increasing dominance by azet.sk and a further reduction of
Zoznam’s reach, which, in comparison to the period of its best performance, lost around 5
percentage points. Furthermore, on azet.sk users spent the greatest amount of time – around 20
hours – whereas on other sites the average was around 1-2 hours. The large number of subservices
available on the portal, including online games, video and social-networks websites, might be the
main cause of this discrepancy. A similar pattern applies to the average number of page views
generated on the portal, which account for over 75 percent of all page views measured in the study.
18
gemiusTraffic 01 2009

SLOVAKIA
Chart 107 Top portals present on Slovakian online market – reach trends (AIMmonitor – AIM – Mediaresearch & Gemius, January 2009)
A similar deterioration could be observed in another website belonging to Zoznam s.r.o.:
topky.sk, which is a standard news service. Previously known as Bleskovky, it was provided by
Zoznam s.r.o and the biggest publisher Ringier. However, in the year 2008 Ringier launched its own
news service, cas.sk (a name based on the biggest daily, newspaper Novy Cas) and the companies
separated, with Bleskovky becoming Topky. From that time, the portal’s share, which used to have a
reach of more than 40 percent, has started to decrease, with the lowest 33 percent, recorded in
December 2008. Now it is slowly rebuilding its position.
Among the most significant portals on the Slovakian market there are also two others worth
noting, atlas.sk and centrum.sk, which belong to the same owner – Centrum Holdings. The first is
more popular with a reach of 52 percent, whereas centrum.sk reaches 32 percent of the audience.
However, the latter dominates in terms of average time per visitor monthly with a figure exceeding
two hours, while on atlas.sk users spent on average around forty minutes. Considering that both
portals are owned by one company, it is justified to expect that one day the two services will
consolidate.
1.3. Social network
number of real users
number of page views
page views per user
average time per user
reach
1 azet.sk-pokec 1 011 145 2 439 536 868 2413 19:08:30 49%
2 booom.sk 139 137 255 508 186 1836 12:59:35 7%
Table 39 Top social networks in Slovakia by reach level (AIMmonitor – AIM – Mediaresearch & Gemius, January 2009)
In the area of social network services there are two leading players on the Slovakian online
market. The most popular one, with a reach of around 49 percent, is azet.sk-pokec, which is the most
0%
10%
20%
30%
40%
50%
60%
70%
12
00
8
22
00
8
32
00
8
42
00
8
52
00
8
62
00
8
72
00
8
82
00
8
92
00
8
10
20
08
11
20
08
12
20
08
12
00
9
Top portals
azet.sk zoznam.sk atlas.sk sme.sk topky.sk centrum.sk

SLOVAKIA
visited part of Azet´s portfolio. It is a simple chat site, where registered people can talk with each
other in predefined rooms or have the possibility of creating their own. However, the functionality
might change dramatically as Milan Dubec, the owner of Azet has said that it will evolve into a
Facebook-like service.
The second important player is booom.sk – a network dedicated mostly to the theme of
parties in the biggest cities in Slovakia as well as online matching. This portal has existed on the
market since the end of 2006 and its reach is around 7 percent. Access to this portal is payable. The
average monthly time spent per user on that service is more than 12 hours, which is the second
highest figure after azet.sk.
2. ONLINE AUDIENCE
2.1. Socio-demographic profile
Men constitute the majority of Slovakian internet users, accounting for 52.2 percent of the
online population. However, in terms of average number of page views and the time spent on the
web, there is hardly any difference between the genders. Among Slovakian internet users over the
age of 25, men can be found more often, yet in the youngest age group (15-24) women are slightly
more numerous.
Chart 108 Slovakian online population – gender structure (age intervals) (AIMmonitor – AIM – Mediaresearch & Gemius, January 2009)
Slovakian internet users are generally young – aged 15-24 and this group make up more than
37 percent of the online population, whereas the oldest group comprise only 6 percent. In this
country, similarly to many others in the CEE region, a linear trend might be observed as the share of
internet users decreases with an increase in age.
19%
12%
8%6%
2%
18%
14%
10%
7%4%
0%
5%
10%
15%
20%
25%
[15
-24
]
[25
-34
]
[35
-44
]
[45
-54
]
[55
+]
Gender (age intervals)
Female Male

SLOVAKIA
Chart 109 Slovakian online population – age structure – trends (AIMmonitor – AIM – Mediaresearch & Gemius January 2006, 2007, 2008 and 2009)
The greatest number of internet users live in cities between 20,000 and 99,999 inhabitants
and account for 30 percent of the market. The second important group are people living in towns
with a population of 1 000 – 4 999. Remaining groups comprise around 14-15 percent of the online
population.
Chart 110 Slovakian online population – size of settlement (AIMmonitor – AIM – Mediaresearch & Gemius, January 2009)
Most Slovakian internet users have a secondary education. This group not only comprises 43
percent of the online population but also generates 33 percent of all page views measured in the
study.19 However, also very active is the group of users with only a primary level of education, who
19
In January 2009 AIMmonitor – AIM – Mediaresearch & Gemius study in Slovakia covered 83 websites (number of panelists - 49039).
40%
27%
15%14%
5%
40%
26%
15%13%
5%
37%
25%
18%
14%
7%
37%
26%
17%13%
6%
0%5%
10%15%20%25%30%35%40%45%
[15
-24
]
[25
-34
]
[35
-44
]
[45
-54
]
[55
+]
Age
01. 2006 01. 2007 01. 2008 01. 2009
14%
25%
16%
30%
15%
0%
5%
10%
15%
20%
25%
30%
35%
Up
to
99
9
inh
abit
ants
10
00
-4
99
9 in
hab
itan
ts
50
00
-1
99
99
inh
abit
ants
20
00
0 -
99
999
inh
abit
ants
Ove
r 1
00
000
in
hab
itan
tsSize of settlement

SLOVAKIA
generate 32 percent of monitored page views but constitute only 17 percent of the internet
population.
Chart 111 Education level structure of Slovakian online population and share of page views by education level (AIMmonitor – AIM – Mediaresearch & Gemius, January 2009)
In terms of economic activity, employed people, including those working on an irregular
basis, constitute 52 percent of the online population, yet, according to the study, they devote the
lowest amount of average time per user to surfing the web. The second largest group consists of
non-working users (27 percent) and they are also the most active. This group leads in terms of
average time and number of page views per user.
2.2. Internet users activity
The Slovakian online market measured in the study is still developing in terms of average
number of page views per visitor and comparing to the year 2007, the figure has almost tripled.
Growth was most dynamic among the youngest users, aged 15-24, and decreased respectively for
the older groups of users. The lowest growth can be observed amongst the eldest users, yet the
numbers here have still grown more than 100 percent. As far as the average time per user is
concerned, a similar pattern can be observed. The average value has grown around 160 percent
compared to 2007, the change being most dynamic for the youngest users and decreasing linearly
with the increase of user age.
3%
17% 19%
43%
5%
13%
5%
32%
23%
33%
3% 4%
0%5%
10%15%20%25%30%35%40%45%50%
Un
fin
ish
ed
pri
mar
y
Fin
ish
ed
pri
mar
y
Seco
nd
ary
ed
uca
tio
nw
ith
ou
tle
avin
ge
xam
Seco
nd
ary
ed
uca
tio
nin
clu
din
ge
xte
nsi
on
stu
die
s
Bac
he
lor
de
gre
e
Un
ive
rsit
yd
egr
ee
Education / share of page views by education
share of education level group share of all page views

SLOVAKIA
Chart 112 Slovakian online population – average number of page views per user (age intervals) (AIMmonitor – AIM – Mediaresearch & Gemius, January 2007, 2008 and 2009)
Chart 113 Slovakian online population – average time spent per user (age intervals) (AIMmonitor – AIM – Mediaresearch & Gemius, January 2007, 2008 and 2009)
0
1000
2000
3000
4000
[15
-24
]
[25
-34
]
[35
-44
]
[45
-54
]
[55
+]
Average number of page viewsper user (age intervals)
01. 2007 01. 2008 01. 2009
0:00:00
5:00:00
10:00:00
15:00:00
20:00:00
25:00:00
30:00:00
35:00:00
[15
-24
]
[25
-34
]
[35
-44
]
[45
-54
]
[55
+]
Average time spent per user(age intervals)
2007 2008 2009

SLOVAKIA
3. TOOLS
3.1. Browsers
Contrary to the majority of the CEE markets, in Slovakia Firefox tends to be the most popular
browser. Its market share has been growing in recent years, increasing from 28 percent in 2007 to 46
percent in 2009. Correspondingly, Microsoft Internet Explorer has decreased from 64 percent in 2007
to 37 percent in 2009. Opera and Chrome have been gradually gaining new users in Slovakia in recent
years.
Chart 114 Top browsers in Slovakia by share of page views generated by internet users who visit Slovakian web sites using gemiusTraffic (gemiusTraffic study 1Q 2007 – 2Q 2009)
3.2. Operating systems
The most popular operating system in Slovakia is Windows XP with an 80 percent share.
Nevertheless, its popularity decreased from 91 percent in 2007. Windows Vista, meanwhile, has
gained in popularity with its share growing rapidly from 0.1 percent in 2007 to 17 percent in 2009.
0%
10%
20%
30%
40%
50%
60%
70%
1Q
20
07
2Q
20
07
3Q
20
07
4Q
20
07
1Q
20
08
2Q
20
08
3Q
20
08
4Q
20
08
1Q
20
09
2Q
20
09
Browsers
Firefox MSIE Opera Chrome other

SLOVAKIA
Chart 115 Top operating systems in Slovakia by share of page views generated by internet users who visit the Slovakian web sites using gemiusTraffic (gemiusTraffic study 1Q 2007 – 2Q 2009)
3.3. Search engines
Google is the undoubted leader amongst search engines in Slovakia (99 percent share in the
first quarter of 2009) and its popularity has continued to grow in recent years. In the two years since
the beginning of 2007, the Slovakian search engine Jyxo’s share decreased from 5 percent to 0.4
percent.
Chart 116 Top search engines in Slovakia by share of visits made by internet users who visit the Slovakian web sites using gemiusTraffic (gemiusTraffic study 1Q 2007 – 2Q 2009)
0%
20%
40%
60%
80%
100%
1Q
20
07
2Q
20
07
3Q
20
07
4Q
20
07
1Q
20
08
2Q
20
08
3Q
20
08
4Q
20
08
1Q
20
09
2Q
20
09
Operating systems
Windows XP Windows Vista other
0%
20%
40%
60%
80%
100%
1Q
20
07
2Q
20
07
3Q
20
07
4Q
20
07
1Q
20
08
2Q
20
08
3Q
20
08
4Q
20
08
1Q
20
09
2Q
20
09
Search engines
Google MSN Jyxo other

SLOVAKIA
3.4. Screen resolutions
The most popular screen resolution in Slovakia is 1024x768. However, its popularity decreased
from 61 percent in the first quarter of 2007 to 36 percent in 2009. The screen resolution used in
notebooks (1280x800) has become more popular in recent years, its share increasing from 5 percent
in 2007 to 21 percent in the first quarter in 2009. The 1280x1024 screen resolution is also quite
popular.
Chart 117 Screen resolutions in Slovakia by share of page views generated by internet users who visit Slovakian web sites using gemiusTraffic (gemiusTraffic study 1Q 2007 – 2Q 2009
0%
10%
20%
30%
40%
50%
60%
70%
1Q
20
07
2Q
20
07
3Q
20
07
4Q
20
07
1Q
20
08
2Q
20
08
3Q
20
08
4Q
20
08
1Q
20
09
2Q
20
09
Screen resolutions
1024 x 768 1280 x 800 1280 x 1024 1152 x 864
1280 x 960 800 x 600 other


SLOVENIA
SLOVENIA
1. MAIN PLAYERS
1.1. Top 10 websites
website's category
number of real users
number of page views
page views per user
average time spent per
user reach
1 najdi.si search engine/
horizontal portal 602 985 56 379 781 94 02:24:11 53%
2 24ur.com horizontal
portal 596 586 73 221 147 123 04:15:02 53%
3 siol.net horizontal
portal 481 044 38 844 861 81 02:34:25 43%
4 rtvslo.si horizontal
portal 436 420 28 992 356 66 01:56:07 39%
5 bolha.com classifieds/auctions 372 437 27 051 844 73 00:32:50 33%
6 tis.telekom.si phone number
catalogue 340 587 3 253 339 10 00:07:55 30%
7 avto.net classified
ads 291 494 59 143 842 203 02:01:23 26%
8 zurnal24.si horizontal
portal 284 730 19 090 060 67 00:31:35 25%
9 delo.si online newspaper 247 321 7 370 612 30 00:56:16 22%
10 mojvideo.com video directory 229 188 5 474 784 24 00:16:40 20%
Table 40 Top 10 websites in Slovenia by reach (Gemius/Valicon, gemiusAudience MOSS, April 2009)
The leadership within Slovenian online space belongs to portals. According to the study, this
type of internet service accounts for a significant segment of top websites operating on the local
market.
The most stable star of the Slovenian internet is najdi.si, the local search engine. According to
the study, in April 2009 this site had accumulated an audience of over 600, 000, which gave it a 53

SLOVENIA
percent reach. In the opinion of Gemius experts, the audience of najdi.si is probably the biggest on
the market, although seasonal changes can be observed.
The second most popular brand is 24ur.com, which in April 2009 gathered almost 600,000
visitors and attained a reach level of 53 percent. This is a multi-thematic portal focusing mostly on
multimedia content. 24ur.com was the leading website in Slovenia over the past year, overtaking
najdi.si. The main reason why this portal won the battle for first place on the Slovenian internet is
because of one, well conducted media campaign. The Pro Plus company, which runs 24ur.com, is also
an owner of the biggest TV stations in Slovenia. The media buzz related to its new broadcasting
projects, such as Big Brother, brought visible repercussions in the internet, increasing the popularity
of 24ur portal. Nowadays the competition between Najdi and 24ur is huge and it is hard to estimate
which will maintain the leadership in the longer term.
The key issue that should be noted during the analysis of the Slovenian internet is the fact
that the real power structure is imperceptible if just the specific websites are taken into
consideration. The strongest player is widely dispersed, being the state of Slovenia itself. It owns
three meaningful online operations: najdi.si (search engine), siol.net (portal) and tis.telekom.si
(internet phonebook database). All these websites belong to Telekom Slovenia, the enterprise
established and controlled by the Republic of Slovenia, which is still the main shareholder (53
percent in March 2009). Moreover, they co-operate with each other very closely, which makes them
not only the biggest, but also a self-propelling formation active on the market under scrutiny. Finally,
their case shows how the transfer and replication of existing business power constitutes the fabric of
the young Slovenian internet.
1.2. Top portals
number of real users
number of page views
page views per user
average time per user
reach
1 najdi.si 602 985 56 379 781 94 02:24:11 53%
2 24ur.com 596 586 73 221 147 123 04:15:02 53%
3 siol.net 481 044 38 844 861 81 02:34:25 43%
4 rtvslo.si 436 420 28 992 356 66 01:56:07 39%
5 zurnal24.si 284 730 19 090 060 67 00:31:35 25%
Table 41 Top 5 portals in Slovenia by reach (Gemius/Valicon, gemiusAudience MOSS, April 2009)
In Slovenia portals are among the biggest internet players. However, horizontal services are
quite rare. Websites such as 24ur.com, siol.net, rtvslo.si or zurnal24.si are good examples of this
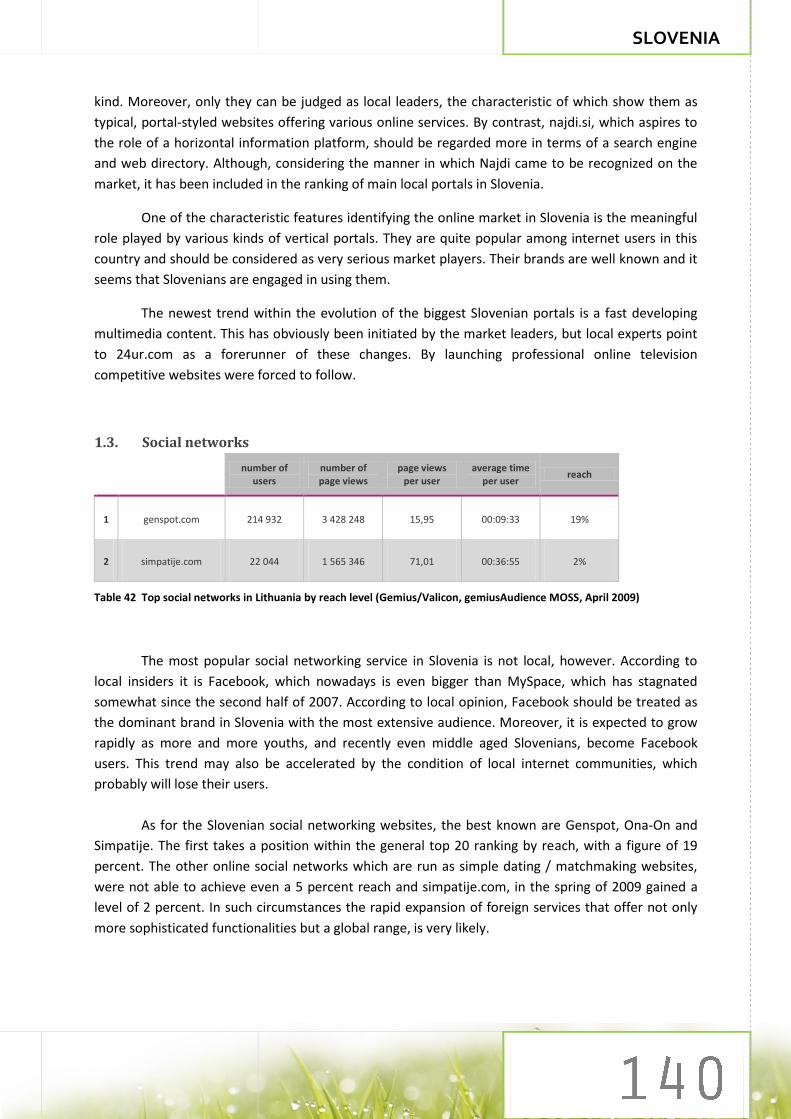
SLOVENIA
kind. Moreover, only they can be judged as local leaders, the characteristic of which show them as
typical, portal-styled websites offering various online services. By contrast, najdi.si, which aspires to
the role of a horizontal information platform, should be regarded more in terms of a search engine
and web directory. Although, considering the manner in which Najdi came to be recognized on the
market, it has been included in the ranking of main local portals in Slovenia.
One of the characteristic features identifying the online market in Slovenia is the meaningful
role played by various kinds of vertical portals. They are quite popular among internet users in this
country and should be considered as very serious market players. Their brands are well known and it
seems that Slovenians are engaged in using them.
The newest trend within the evolution of the biggest Slovenian portals is a fast developing
multimedia content. This has obviously been initiated by the market leaders, but local experts point
to 24ur.com as a forerunner of these changes. By launching professional online television
competitive websites were forced to follow.
1.3. Social networks
number of
users number of page views
page views per user
average time per user
reach
1 genspot.com 214 932 3 428 248 15,95 00:09:33 19%
2 simpatije.com 22 044 1 565 346 71,01 00:36:55 2%
Table 42 Top social networks in Lithuania by reach level (Gemius/Valicon, gemiusAudience MOSS, April 2009)
The most popular social networking service in Slovenia is not local, however. According to
local insiders it is Facebook, which nowadays is even bigger than MySpace, which has stagnated
somewhat since the second half of 2007. According to local opinion, Facebook should be treated as
the dominant brand in Slovenia with the most extensive audience. Moreover, it is expected to grow
rapidly as more and more youths, and recently even middle aged Slovenians, become Facebook
users. This trend may also be accelerated by the condition of local internet communities, which
probably will lose their users.
As for the Slovenian social networking websites, the best known are Genspot, Ona-On and
Simpatije. The first takes a position within the general top 20 ranking by reach, with a figure of 19
percent. The other online social networks which are run as simple dating / matchmaking websites,
were not able to achieve even a 5 percent reach and simpatije.com, in the spring of 2009 gained a
level of 2 percent. In such circumstances the rapid expansion of foreign services that offer not only
more sophisticated functionalities but a global range, is very likely.

SLOVENIA
2. ONLINE AUDIENCE
2.1. Socio-demographic profile
The gender structure of Slovenian internet users is quite balanced and does not differ from
typical models that are easy to observe on other markets. In April 2009 men accounted for 53
percent of the whole online population, while women comprised only 47 percent. Slovenian internet
users are also young. The dominant group is constituted of individuals aged 15-24 years (24 percent
of the whole population in April 2009), but there are also many people between 25 and 34 years old
(23 percent) and between 35 and 44 years old (19 percent). The situation of the age groups of
Slovenian internet users is quite stable and no significant changes within age composition have been
observed over the last couple of years.
The educational structure of Slovenian internet users might be perceived as interesting. The
proportion of individuals who still attend school is significant (over 30 percent of the whole
population in April 2009). This fact is related to the age structure of the online population within the
young group that plays the most meaningful role. It is also easy to see that individuals who have
finished three or four years of high school constitute a large part of the online population. Little more
than 20 percent of internet users in Slovenia have graduated from high school or university, but the
percentage of those who have finished their education with elementary school or earlier, as would
be expected, is not very high (less than 6 percent in April 2009).
Chart 118 Slovenian online population – education (Gemius/Valicon, gemiusAudience MOSS, April 2009)
5%
18%
27%
20%
30%
0%
5%
10%
15%
20%
25%
30%
35%
40%
ele
me
ntar
y sc
hool
or
less
thre
e y
ear
s o
f hig
h sc
ho
ol
fou
r ye
ars
of h
igh
sc
ho
ol
hig
h, h
igh
er s
cho
ol,
un
ive
rsit
y o
r mo
re
atte
nd
ing
sch
ool
Education

SLOVENIA
Chart 119 Slovenian online population – occupation (Gemius/Valicon, gemiusAudience MOSS, April 2009)
Most of Slovenian internet users are professionally active and work in private companies
(over 39 percent of the entire online population). The second force within the internet in Slovenia is
students and school children and the third, employees working in the public sector. It is clearly seen
that only these groups can be considered significant, with a large gap between them and the
numbers in the remaining groups of users. However, it is important to note that self-employed
individuals account for 7 percent of the population, which makes them a visible group of users. The
share of the unemployed and pensioners active on the internet is relatively small.
The spatial distribution of internet users in Slovenia is quite uneven; however it can be
observed that individuals from the biggest and the smallest settlements have the lowest share of the
online population. There are two exceptions to this rule. One of them is the capital city – almost one
in five users in Slovenia comes from Ljubljana, another is Maribor, the second largest city in Slovenia,
but home to only 7 percent of internet users in the country. At the same time, shares of individuals
from all other locations are balanced and fluctuate between 15 and 20 percent.
39%
21%
12%7% 5% 5%
2% 1%0%5%
10%15%20%25%30%35%40%45%50%
em
plo
yed
in a
co
mp
any
stu
de
nts
em
plo
yed
in
pu
bli
c se
cto
r
self
-e
mp
loye
d
pe
nsi
on
er
un
em
plo
yed
oth
er
ho
use
wif
e
Occupation

SLOVENIA
Chart 120 Slovenian online population – size of settlement (Gemius/Valicon, gemiusAudience MOSS, April 2009)
2.2. Internet user activity
Average internet user in Slovenia accesses the global network at home (almost 88 percent of
all individuals surf the web from home). The second significant location for internet access is the
office (25 percent use the internet at work). Except for schools and universities, all other places
offering internet access in Slovenia are as unpopular as in previous years and none have ever
reached more than a 2 percent share.
Chart 121 Slovenian online population – place of accessing internet (Gemius/Valicon, gemiusAudience MOSS, April 2009)
17%
7%
15%
20%18%
16%
7%
0%
5%
10%
15%
20%
25%
Lju
blj
ana
Mar
ibo
r
10
,00
0 t
0 1
00,0
00
inh
abit
ants
fro
m 2
,00
0 t
o 1
0,0
00
inh
abit
ants
fro
m 5
00
to
less
th
an 2
00
0
inh
abit
ants
less
th
an 5
00
in
hab
itan
ts
do
n't
kn
ow
Size of settlement
88%
25%
4% 2% 1% 1% 1%0%
10%
20%
30%
40%
50%
60%
70%
80%
90%
100%
ho
me
wo
rk
sch
oo
l/u
niv
ersi
ty
frie
nd
s, r
ela
tive
s an
d
acq
uai
nta
nce
s
clu
bs,
Cyb
erc
affe
s
lib
rary
oth
er
Place of accesing internet

SLOVENIA
Slovenians are also becoming ever more active internet users. Nowadays, according to the
study20, on average each person generates about 400 page views monthly (408 in April 2009).
Slovenians also are becoming more engaged users. Presently on average each Slovenian user surfs
the web for over 8.5 hours monthly.
Knowledge about Slovenian internet users, understood as online consumers, increases year
by year. They can be considered as active, quite affluent and well prepared buyers. The monthly
income of almost 39 percent of Slovenians is not less than 730 euro and for more than 17 percent of
them is more than 1100 euro. Slovenians are also very cautious and, in some manner, conservative
consumers. In January 2009 over 64 percent of them declared that they spend time browsing search
engines weekly or more frequently, or they work or educate themselves online (almost 23 percent
of all users). However, at the same time 39 percent of them have never shopped via the internet and
over 21 percent of them do it just a few times a year. Moreover, 64 percent of Slovenian internet
users have not bought anything using international e-commerce platforms.
3. TOOLS
3.1. Browsers
Since the third quarter of 2007, Microsoft Internet Explorer and Firefox have been the most
popular browsers in Slovenia – in 2009 MSIE had a 49 percent market share and Firefox 47 percent.
The popularity of a new browser, Google Chrome, has been growing systematically since its arrival in
September 2008 and currently has over 2 percent of market share. As it can be observed, Internet
Explorer and Mozilla Firefox periodically exchange their positions as market leaders.
Chart 122 Top browsers in Slovenia by share of page views generated by Internet users who visit Slovenian websites using (gemiusTraffic study 3Q 2007 – 2Q 2009)
20
In April 2009 Gemius/Valicon, gemiusAudience MOSS study in Slovenia covered 86 websites.
0%
10%
20%
30%
40%
50%
60%
3Q
20
07
4Q
20
07
1Q
20
08
2Q
20
08
3Q
20
08
4Q
20
08
1Q
20
09
2Q
20
09
Browsers
MSIE Firefox Chrome Opera Safari other
gemiusTraffic

SLOVENIA
3.2. Operating systems
Windows is undoubtedly the most popular operating system in Slovenia. Among all Windows
operating systems the biggest share is held by Windows XP (82 percent). However, Windows Vista
has been gaining popularity over recent years, its share increasing from 2 percent in 2007 to 14
percent in 2009. Also Mac OSX has became more popular during the same period but still it has just a
little over one percent of the market.
Chart 123 Top operating systems in Slovenia by share of page views generated by Internet users who visit Slovenian websites using (gemiusTraffic study 3Q 2007 – 2Q 2009)
3.3. Search engines
The most popular search engine in Slovenia is Google which since 2007 has been constantly
gaining new users. In the second quarter of 2009 it held a market share of over 83 percent. .
Slovenian search engine, Najdi.si, has been losing its popularity since 2007, its share decreasing from
over 32 percent in 2007 to 15 percent in 2009.
Chart 124 Top search engines in Slovenia by share of visits made by Internet users who visit Slovenian websites using (gemiusTraffic study 3Q 2007 – 2Q 2009)
0%
20%
40%
60%
80%
100%
3Q 2
007
4Q 2
007
1Q 2
008
2Q 2
008
3Q 2
008
4Q 2
008
1Q 2
009
2Q 2
009
Operating systems
Windows XP Windows Vista Windows 2000 other
0%10%20%30%40%50%60%70%80%90%
3Q
20
07
4Q
20
07
1Q
20
08
2Q
20
08
3Q
20
08
4Q
20
08
1Q
20
09
2Q
20
09
Search engines
Google Najdi.si MSN other
gemiusTraffic
gemiusTraffic

SLOVENIA
3.4. Screen resolutions
The most popular screen resolution in Slovenia is 1024x768. Nevertheless it has lost its share
since the third quarter of 2007. Currently it has 32 percent of the market (in the third quarter of 2007
it was 49 percent). The second most popular screen resolutions, 1280x1024 and 1280x800, have
been constantly gaining a share of the Slovenian market, increasing it from 5 percent in 2007 to 13
percent in 2009.
Chart 125 Screen resolutions in Slovenia by share of page views generated by Internet users who visit Slovenian websites using (gemiusTraffic study 1Q 2007 – 2Q 2009)
0%
10%
20%
30%
40%
50%
60%
3Q
20
07
4Q
20
07
1Q
20
08
2Q
20
08
3Q
20
08
4Q
20
08
1Q
20
09
2Q
20
09
Screen resolutions
1024 x 768 1280 x 1024 1280 x 8001680 x 1050 1440 x 900 other
gemiusTraffic


UKRAINE
UKRAINE
1. MAIN PLAYERS
1.1. Top 10 websites
website's category
number of real users
number of page views
page views per user
average time per user
reach
1 marketgid.com e-shop
catalogue 2 753 789 38 579 903 14 00:58:27 39%
2 meta.ua horizontal
portal 2 115 004 60 018 486 28 00:41:42 30%
3 i.ua horizontal
portal 1 812 069 81 158 350 45 00:50:18 26%
4 bigmir.net horizontal
portal 1 557 938 77 407 667 50 01:19:02 22%
5 redtram.com.ua news
service 1 231 132 11 206 327 9 00:45:29 18%
6 pravda.com.ua news
service 1 042 862 28 922 295 28 00:51:09 15%
7 liga.net horizontal
portal 1 014 993 8 748 272 9 00:14:32 14%
8 online.ua horizontal
portal 1 000 324 20 020 263 20 00:27:09 14%
9 unian.net news
service 916 424 10 390 732 11 00:21:26 13%
10 korrespondent.net news
service 877 874 26 640 024 30 01:00:49 12%
Table 43 Top 10 websites in Ukraine by reach level (gemiusAudience, January 2009)
According to the gemiusAudience study, marketgid.com takes the first place in the Ukrainian
ranking. The site belongs to the e-shop catalogue category and is useful for buyers, active readers
and e-commerce websites. The next three positions are taken by sites belonging to the horizontal
portal category: meta.ua, i.ua and bigmir.net. All of these services offer its users a wide range of
content and achieve a reach between twenty and thirty percent (meta.ua: 30 percent, i.ua: 26
percent and bigmir.net: 22 percent).
Also featuring in the Gemius top ten websites ranking is online.ua, a site belonging to the
portal category but gathering a smaller audience (its reach is 14 percent) than the services presented
above. The other high ranking services belong to the news service category. The most popular is
redtram.com – a news search engine, which achieves a 17 percent reach. Other services are:
pravda.com.ua – owned by Ukrainska Pravda Ltd, unian.net – a service of Information Agency
"UNIAN", which belongs to the media holding, Glavred-UNIAN; korrespondent.net – the internet
service of a Russian language weekly magazine published in Ukraine and liga.net – a Ukrainian
business information Network.

UKRAINE
A strong Russian influence can be observed on the Ukrainian online market and it is said that
the majority of top services are constituted of those coming directly from the Ru-Net. Among the
most significant players are horizontal portals mail.ru and yandex.ru, as well as social networks
Vkontakte and Odnoklassniki.
1.2. Top portals
number of real users
number of page views
page views per user
average time per user
reach
1 meta.ua 2 115 004 60 018 486 28 00:41:42 30%
2 i.ua 1 812 069 81 158 350 45 00:50:18 26%
3 bigmir.net 1 557 938 77 407 667 50 01:19:02 22%
4 liga.net 1 014 993 8 748 272 9 00:14:32 14%
5 online.ua 1 000 324 20 020 263 20 00:27:09 14%
Table 44 Top 5 portals in Ukraine by reach level (gemiusAudience, January 2009)
According to the gemiusAudience study, the leading portal on the Ukrainian online market is
meta.ua. Its domination can be partly explained by their good management, the team never
changing since foundation, and good developers. Moreover, the service is supported by strong
Russian players with the investment consortium of Russian Funds and Digital Sky Technologies
acquiring a 63% majority stake in META. In January 2009, the service achieved a reach of 30 percent,
which is 7 percentage points more than the previous year. Among basic portal services there are: a
website catalogue, an e-shops search and price-lists, a news monitoring system, a communication
block (mail, forum, blog, etc.), information services and others. Moreover, META is the number three
search engine in the Ukraine after Yandex and Google, which both have Ukrainian language versions.
The second force in terms of reach in the gemiusAudience study is i.ua, the horizontal portal
belonging to the internet agency MI[6] and UMH Publishing House. I.ua, as a normal horizontal portal
offers its users a wide variety of services, among which e-mail, website listings, classified
advertisements, video-streaming, job search, blogs and dating services can be found. The portal’s
reach in January 2009 was 26 percent, a 12 percentage point increase compared to January 2008.
Moreover, in terms of page views, i.ua is the market leader, exceeding 81 million monthly.
Bigmir.net comprises the next significant force on the market. It belongs to KP Media, the
number one media group in Ukraine, which has a 15 percent share of the country’s magazine market
and a 50 percent share of its internet market. Currently, the company is the owner of such internet
sites as bigmir.net, korrespondent.net, pink.com.ua, afisha.ua, ricardo.com.ua, and novynar.com.ua.
The service has 22 percent reach, which gives it the fourth position in the gemiusAudience ranking.
Moreover, among all measured sites the service takes second place in terms of page views and
average time spent per user monthly.

UKRAINE
Liga.net, the portal belonging to Information Corporation "LigaBusinessInform" is a business
information Network dedicated to the business audience. In January 2009 its reach was 14 percent
and during the previous year steady growth could be observed.
Online.ua is another significant player on the market and provides its users with the following
services: e-mail accounts, web site directory, internet search, online TV programmes, video content,
etc. From the beginning of 2007, the service’s reach has been increasing constantly and in October
2008 it gained its best result so far of 14 percent. However, its growth dynamic is not high and it
oscillates a few percentage points annually.
Also present among Ukrainian portals is ukr.net., a universal portal, both for Russian and
Ukrainian-speaking audiences. The site belongs to UkrNet – the telecommunication company that is
the internet provider for both organizations and private consumers in Ukraine. This company
continues to satisfy user demand with the launch of new projects and services. It is also one of the
biggest players on the Ukrainian internet-advertising market with a market share of 35 percent.
1.3. Social networks
number of real users
number of page views
page views per user
average time per user
reach
1 connect.ua 264 884 30 863 177 117 01:26:39 4%
2 tab.net.ua 51 362 2 817 056 55 00:51:23 1%
3 tuse.ua 46 569 828 952 18 00:45:37 1%
Table 45 Top social networks in Ukraine by reach level (gemiusAudience, January 2009)
The online community in Ukraine is dominated by the Russian websites: vkontakte.ru, and
odnoklasniki.ru, which also have Ukrainian interfaces. Both of the services are also leaders of the
Russian online community market and are generally designed to facilitate contacts with classmates
and acquaintances. These Russian services seem to fulfill the needs of the Ukrainian audience, while
the country’s local social network sites still are not well developed (there are a few but they have
low reach). The Ukrainian project, which has the highest popularity among community services is
connect.ua, although it is slowly losing users. However, during the first two months of its existence
100,000 Ukrainians registered on the website. Moreover, regarding the average time spent per user
monthly, connect.ua, at 1 hour 20 minutes, has the highest rate among all services measured in the
gemiusAudience study, This is mainly due to the high activity of young users, aged 16-24, who spent
the greatest amount of time on the portal and constitute over 55 percent of its audience.
Local players on the market, with smaller audiences, are Tab and Tuse, both with a reach
below 2 percent. Tab is a community service that provides its users with up to 5 web sites for each
account, personal e-mail, file archive, blog, photo gallery, messenger, dating site and auction
platform. It is the only Ukrainian social network (in the UA-IX network) that is dedicated solely to
Ukrainian speakers).
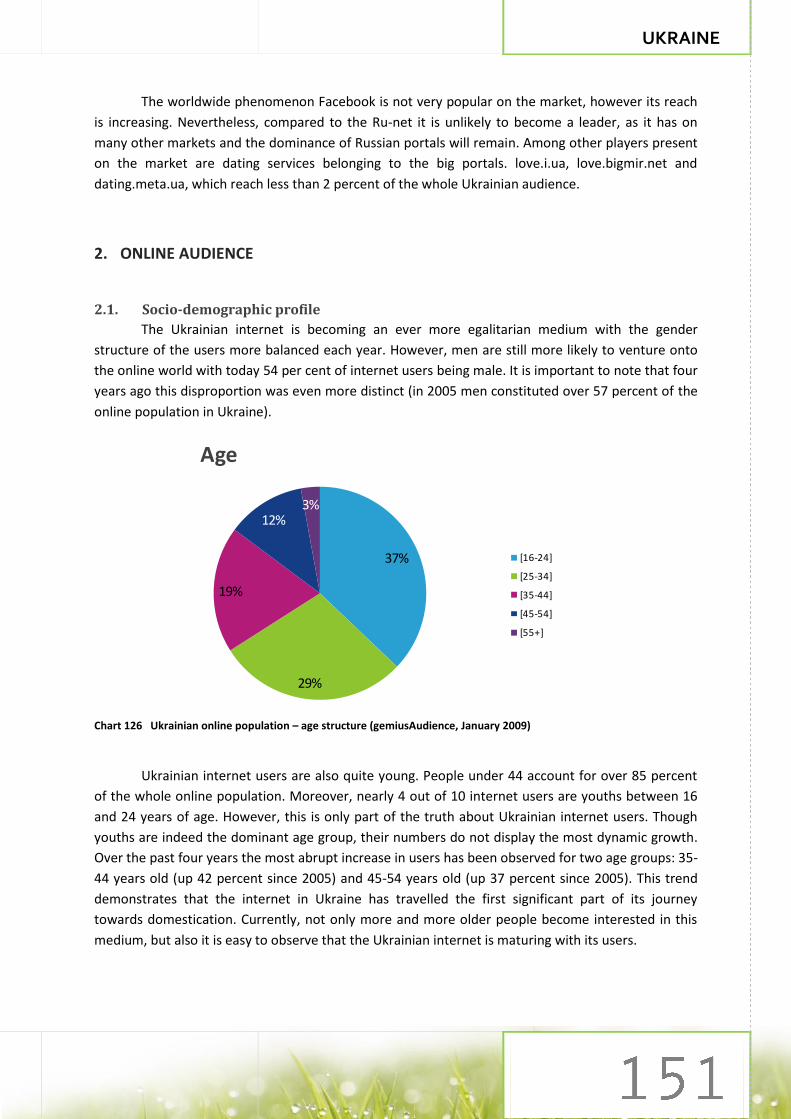
UKRAINE
The worldwide phenomenon Facebook is not very popular on the market, however its reach
is increasing. Nevertheless, compared to the Ru-net it is unlikely to become a leader, as it has on
many other markets and the dominance of Russian portals will remain. Among other players present
on the market are dating services belonging to the big portals. love.i.ua, love.bigmir.net and
dating.meta.ua, which reach less than 2 percent of the whole Ukrainian audience.
2. ONLINE AUDIENCE
2.1. Socio-demographic profile
The Ukrainian internet is becoming an ever more egalitarian medium with the gender
structure of the users more balanced each year. However, men are still more likely to venture onto
the online world with today 54 per cent of internet users being male. It is important to note that four
years ago this disproportion was even more distinct (in 2005 men constituted over 57 percent of the
online population in Ukraine).
Chart 126 Ukrainian online population – age structure (gemiusAudience, January 2009)
Ukrainian internet users are also quite young. People under 44 account for over 85 percent
of the whole online population. Moreover, nearly 4 out of 10 internet users are youths between 16
and 24 years of age. However, this is only part of the truth about Ukrainian internet users. Though
youths are indeed the dominant age group, their numbers do not display the most dynamic growth.
Over the past four years the most abrupt increase in users has been observed for two age groups: 35-
44 years old (up 42 percent since 2005) and 45-54 years old (up 37 percent since 2005). This trend
demonstrates that the internet in Ukraine has travelled the first significant part of its journey
towards domestication. Currently, not only more and more older people become interested in this
medium, but also it is easy to observe that the Ukrainian internet is maturing with its users.
37%
29%
19%
12%3%
Age
[16-24]
[25-34]
[35-44]
[45-54]
[55+]

UKRAINE
Chart 127 Ukrainian online population – place of accessing internet (gemiusAudience, January 2009)
Almost 84 percent of all Ukrainian internet users access the service from home and many of
them (46 percent) also at their workplace. From all points of internet access presented in the chart
above, only home access has become more popular since 2005. It seems that all other places are
gradually being discarded. Since 2005, internet access at school has dropped from ten percent to six
percent. However, the most interesting phenomena are internet cafes. Four years ago 16 percent of
Ukrainian internet users declared that they access the global network in the internet cafes whereas
today only seven percent of them visit those places.
Who are Ukraine’s internet users? Mostly they are well educated with almost 49 percent
having graduated from a college and 80 percent having started higher education. They also occupy
prominent social or business positions. Over 28 percent work as highly qualified specialists and 12
percent are employed within top management.
Chart 128 Ukrainian online population – education (gemiusAudience, January 2009)
67%
53%
10%16%
10% 6%
84%
46%
6% 7% 10%5%
0%
10%
20%
30%
40%
50%
60%
70%
80%
90%
at h
om
e
at w
ork
at s
cho
ol
at in
tern
et
café
at fr
ien
ds/
fam
ily
oth
er
pla
ces
Place of accessing internet
audience composition - 2005 audience composition - 2009
6%13%
32%
49%
0%
10%
20%
30%
40%
50%
60%
ele
me
ntar
y,in
com
ple
te
seco
nd
ary
seco
nd
ary
inco
mp
let
e h
igh
er
hig
he
r
Education

UKRAINE
profession share
highly qualified specialist 29%
top management 12%
working in the office 12%
other 11%
worker/technical worker 4%
not questioned 32%
Table 46 Ukrainian online population – occupation (gemiusAudience, January 2009)
Most Ukrainian internet users live in large agglomerations (58 percent in cities with 500,000
inhabitants and almost 19 percent in cities with 101-500,000 inhabitants). Only 6 percent of them are
in villages.
Table 47 Ukrainian online population – size of settlement (gemiusAudience, January 2009)
2.2. Internet users activity
An analysis of the behavioural profile of Ukrainian consumers active online can bring very
interesting results if their gender is taken into account. According to the gemiusAudience study21,
men generate about 60 percent of all page views in one month and the average male stays online
longer than a female. This is unquestionably valid information for advertisers and the e-commerce
sector, but it can be easily explained by the disproportion within online gender structure. And one of
the most interesting facts in drawing a behavioural portrait of Ukrainian online consumers is the
frequency of internet usage. Over eighty percent of all internet users in Ukraine access the global
network every day or almost every day. It is safe to presume that within this classification men
appear also to be more engaged in online space than are women.
21
In January 2009 gemiusAudience study in Ukraine covered 309 websites (number of panelists - 30959).
6%
17% 19%
58%
0%
10%
20%
30%
40%
50%
60%
70%
vill
age
city
up
to
10
0th
ou
san
ds
inh
abit
ants
city
10
1 -
50
0th
ou
san
ds
inh
abit
ants
city
ove
r 5
00th
ou
san
ds
inh
abit
ants
Size of settlement

UKRAINE
Chart 129 Gender structure of Ukrainian online population and frequency of internet usage
(gemiusAudience, January 2009)
3. TOOLS
3.1. Browsers
The Ukrainian browser market is quite unusual in comparison to the others in the CEE region.
As on many markets, the Microsoft Internet Explorer, whilst still the most popular, is losing its
popularity to two significant competitors, Opera and Firefox, among which Opera is the leader. In the
first quarter of 2009 Opera gained 30 percent of the market (an increase from 12 percent at the
beginning of 2007). Firefox is also becoming increasingly popular, yet, the change is less dynamic and
the share of page views generated in the gemiusTraffic study by Ukrainians using this browser grew
from 9 percent in 2007 to 23 percent in first quarter of 2009.
Chart 130 Top browsers in Ukraine by share of page views generated by internet users who visit Ukrainian web sites using gemiusTraffic (gemiusTraffic study 1Q 2007 – 2Q 2009)
38%
7%1%
45%
8%
2%
0%
10%
20%
30%
40%
50%
eve
ry d
ayo
r al
mo
ste
very
day
seve
ral
tim
es
a w
ee
k
less
fre
qu
en
tly
Frequency of internet usage / gender
female male
0%10%20%30%40%50%60%70%80%90%
1Q
20
07
2Q
20
07
3Q
20
07
4Q
20
07
1Q
20
08
2Q
20
08
3Q
20
08
4Q
20
08
1Q
20
09
2Q
20
09
Browsers
MSIE Opera Firefox other

UKRAINE
3.2. Operating systems
Although Windows Vista is gaining users among Ukrainians (its popularity growing from 0.2
percent in 2007 to 7 percent in 2009) Windows XP is still the most popular operating system on the
Ukrainian market (its share in the first quarter of 2009 was 89 percent). Other operating systems
have marginal market share.
Chart 131 Top operating systems in Ukraine by share of the page views generated by internet users who visit Ukrainian web sites using (gemiusTraffic study 1Q 2007 – 2Q 2009)
3.3. Search engines
The leading search engine in Ukraine is Google, its share having grown steadily, in the first
quarter of 2009, reaching 66 percent. Yandex is also quite popular in Ukraine. Its popularity grew
from 20 percent in 2007 to 27 percent two years later. In 2007 Meta.ua used to count among the
most important players on this market, reaching a high of 14 percentshare, however now it belongs
to the long tail with Rambler, MSN and some others.
0%
20%
40%
60%
80%
100%
1Q
20
07
2Q
20
07
3Q
20
07
4Q
20
07
1Q
20
08
2Q
20
08
3Q
20
08
4Q
20
08
1Q
20
09
2Q
20
09
Operating systems
Windows XP Windows Vista Windows 2000 other
gemiusTraffic

UKRAINE
Chart 132 Top search engines in Ukraine by share of visits made by internet users who visit Ukrainian web sites using (gemiusTraffic study 1Q 2007 – 2Q 2009)
3.4. Screen resolutions
The most popular screen resolution among Ukrainian users is still 1024 x 768. However, its
popularity decreased from 54 percent in 2007 to 31 percent in the first quarter of 2009. A large share
of the market now belongs to 1280 x 1024 screen resolution – 29 percent in the first quarter of 2009.
The 1280 x 800 screen resolution used in notebooks has become more popular in the last year with
its share of the Ukrainian market in 2009 reaching 15 percent.
Chart 133 Screen resolutions in Ukraine by share of the page views generated by internet users who visit Ukrainian web sites using gemiusTraffic (gemiusTraffic study 1Q 2007 – 2Q 2009)
0%
10%
20%
30%
40%
50%
60%
70%
1Q
20
07
2Q
20
07
3Q
20
07
4Q
20
07
1Q
20
08
2Q
20
08
3Q
20
08
4Q
20
08
1Q
20
09
2Q
20
09
Search engines
Google Yandex Meta Rambler MSN other
0%
10%
20%
30%
40%
50%
60%
1Q
20
07
2Q
20
07
3Q
20
07
4Q
20
07
1Q
20
08
2Q
20
08
3Q
20
08
4Q
20
08
1Q
20
09
2Q
20
09
Screen resolutions
1024 x 768 1280 x 1024 1280 x 800 1440 x 9001680 x 1050 1152 x 864 other
gemiusTraffic


BRANCH ORGANIZATIONS
BRANCH ORGANIZATIONS
CROATIA
IAB Croatia (INAMA)
www.inama.hr
Description: IAB Croatia is a local non-profit, non-governmental organization
dedicated to interactive marketing. It was founded with the objective of helping the
development of interactive marketing communication in Croatia by offering
stimulation and guidance for the industry. It was formerly known as INAMA or ‘ the
association for interactive marketing’. It received an IA license in 2008.
Members: publishers and agencies (e.g. net.hrl, tportal.hr, OMG)
CZECH REPUBLIC
SPIR
www.en.spir.cz
Description: SPIR is a professional association of companies and agencies working in
the area of internet advertising. It consists of two sections, each representing one
side of the advertising market – the internet media section (advertising space
providers) and the internet advertisers section (advertisers and media agencies).
SPIR’s primary function is the development of the internet and standardization of
internet advertising in the Czech Republic. SPIR is also the sponsor and guarantor of
two principal projects – NetMonitor and AdMonitoring. SPIR has a total of 57
members and it has been operating in the internet advertising market since 2000.
Members: Internet Media (e.g. ARBOinteractive, spol. s r.o.; Centrum Holdings; CET
21, spol. s r.o.; Internet Info, s.r.o.; MAFRA; Ringier ČR, a.s.; Sanoma Magazines
Praha, s.r.o.; Seznam.cz, a.s.), Internet Advertisers (e.g. Beyond Interactive, s.r.o.;
Mediaedge:cia Czech Republic, s.r.o.; MindShare, s.r.o.; OMD Czech, a.s.; Starcom
MediaVest Group, s.r.o.;)
APEK
www.apek.cz
Description: The Association for Electronic Commerce (APEK) is an association of
more than 150 companies, entrepreneurs and experts in electronic commerce.
APEK’s main goal is the analysis and study of electronic commerce. Members include
the largest internet shops, leading software companies and financial institutions.

BRANCH ORGANIZATIONS
The association was founded in 1998 as an independent organization that supports
the development of electronic commerce in the Czech Republic.
Members: the biggest internet retailers, e-marketplaces, IT service providers,
consultants, logistics companies, financial service providers (e.g. kasa.cz; invia.cz;
cedok.cz; Datart.cz; DHL.cz; InternetMall; Mironet; Retail Info; StudentAgency; Vltava
Stores)
Association of Internet Solutions Providers
www.asociace.biz
Description: Asociace.biz brings together IT and web agencies specializing in the
development of internet and intranet solutions. Asociace.BIZ organizes seminars and
conferences, publishes professional publications providing world news and internet
solutions. The aim of Asociace.BIZ is to deliver advertiser/companies inspiration and
ideas on how to use interactive media in e-commerce and marketing campaigns, to
streamline work through corporate intranets and systems built on modern web
technologies. The association was established in 2002.
Members: IT companies and internet agencies (e.g. AARON GROUP spol. s r.o.; AMI
Praha a.s.; ET NETERA a.s.; FG Forrest, a. s.; ILIKETHIS! s.r.o.; Internet Projekt a.s.;
Lundegaard spol. s r.o.; Mather Advertures, s.r.o.; MEDIA FACTORY ČR a.s.; Onlio,
a.s.; První multimediální, s.r.o.; SYMBIO Digital, s. r. o.; WDF - Web Design Factory,
spol. s r.o.)
UVDT Czech Publishers Association
www.uvdt.cz
Description: The Association is the sole representative association of entrepreneurs
and employers in the branch of periodicals and the provision of content via the
internet in the Czech Republic. The Association brings together most publishers of
national and regional newspapers and a large majority of relevant publishers of
magazines. It was founded in 1990 and has 43 members. The Association has a
special section dedicated to the internet – SVIT, which has run as an independent
operation since 2002. Its main mission is the creation and enforcement of standards
for the internet environment.
Members: members of SVIT section - Centrum Holdings, ECONOMIA, Epravo.cz,
Euronews, IDG Czech, MAFRA, Ringier ČR, Sanoma Magazines Praha, Trade & Leisure,
Publications, Vltava Labe Press

BRANCH ORGANIZATIONS
ESTONIA
Commerce Union
www.e-kaubanduseliit.ee
Description: E-Commerce Union’s mission is to help develop the e-commerce market
in Estonia as well as working on unifying standards and making the process of
shopping online easier and safer for customers. E- Commerce Union was established
in spring 2009 and currently has 10 members.
Members: all e- commerce Estonian websites - cdmarket.eu, e-poed24.ee,
farma24.ee, ilusamaks.ee, interbauen.com, kinder.ee, nodi.ee, on24.ee, ox.ee,
quum.ee
HUNGARY
IAB Hungary
www.iab.hu
Description: IAB Hungary was established in November 2008 as a division of The
Hungarian Advertising Association. There are 48 founder members. The
organization’s actions are concentrated on the aims of: increasing the awareness,
usage and recognition of digital marketing and advertising solutions; assisting in the
development of the digital marketing and digital media industries; performing
lobbying activities at national and international forums, for-profit, non-profit and
governmental organizations; creating a common view (platform) in the industry by
means of constant and credible communication with the market players, various
organizations, press and municipalities concerning the industry.
Members: agencies (e.g. Arcus Interactive Group, Carnation, Est Média Group, EURO
RSCG, Evomedia, Kirowski, MEC Interaction, Onlinemarketing.hu), publishers (e.g.
Adaptive Media, Axel Springer,Expressz, Google, M-RTL Televízió, Magyar Telekom,
MTM-SBS – TV2, Origo, Sanoma Budapest), research agencies (e.g. Adverticum, AGB
Nielsen Médiakutató, Gemius Hungary, GFK Hungária Piackutató Intézet, HVG Online,
Medián, NRC, Szonda Ipsos Piackutató), advertisers (CIB Bank, MOL, Vodafone)
Association of Hungarian Content Providers (MTE)
www.mte.hu
Description: MTE was established in 2001 and is a self-regulating body that was
founded by Hungarian internet content providers in order to participate in the
development of the business market on the Hungarian internet. It is a clearly defined
aim of MTE to achieve a position whereby the internet is regulated with the smallest
possible intervention. In order to realize this aim, MTE created a professional code
for internet content providers, and a code of ethics defining a generally accepted
system of ethical norms for Hungarian content provision.

BRANCH ORGANIZATIONS
Members: publishers (e.g. T-Online Magyarország Rt., Index.hu, Rt.Népszabadság
Online, www.Napi.hu, Online Kft., Kurt Lewin Alapítvány, Colorplus Kft.,
Menedzsment Fórum Kft.) service providers (e.g. Neumann János Digitális Könyvtár
és Multimédia Központ Kht., elintezzuk.hu)
Association of Advertising Agencies in Hungary (MAKSZ)
www.maksz.com
Description: The Association of Advertising Agencies in Hungary was established by
13 leading advertising agencies in May 1995. MAKSZ is an independent organization
representing the interests of the advertising agencies. It has two main fields of
activity. One is the representation of the interests of media and marketing research
companies and the other assumes support for the development of the Hungarian
marketing communication industry (e.g. educational courses, common research,
information databases, etc.). Members of MAKSZ handle 70-80 per cent of the
annual marketing communication budgets in Hungary.
Members: ATL agencies (e.g. Euro RSCG Budapest Zrt., LOWE GGK Reklám Kft,
McCann Erickson Budapest, Ogilvy&Mather Reklámügynökség Budapest Zrt., Young
& Rubicam Budapest), BTL agencies (e.g. Createam Promotion, HPS BTL Solutions,
Human Telex Kft., Lauritzen Marketing Kft., Special Event Budapest Kft.), online
agencies (e.g. Café Click! Kft., eMission) media agencies (e.g. Initiative Media
Hungary, Mediaedge:cia Hungary Kft., Media Planning Group Hungary Kft.)
LATVIA
Latvian Internet Association
www.lia.lv
Description: The Latvian Internet Association brings together companies linked to
internet and online services, informs members about important changes in
legislation, new public online projects, global case studies, etc. Its main aims are:
development of the Latvian internet market and educating market members about
various Internet issues. Founded in 2000 by 15 internet market players with the
intention of becoming the main internet association in Latvia. Since then LIKTA has
been playing a large role in Latvian internet market processes.
Members: internet providers, software developers, web design developers,
programming companies, internet research companies (e.g. Izzi SIA, Microsoft Latvia,
Latnet Serviss,Latvenergo , Euro Data, Lattelecom)

BRANCH ORGANIZATIONS
The Latvian Information Technology and Telecommunications Association
www.likta.lv
Description: LIKTA is a non-governmental association bringing together ITTE product
and service providers and educational institutions, as well as over 150 individual
professional members of the ITTE industry sector in Latvia. LIKTA is actively involved
in discussing legislation and in monitoring public procurement procedures for ITT
products and services. It was founded in 1998 by the major market players. At the
2002 annual meeting the members of LIKTA adopted a declaration on the need to
develop the ITTE sector, listing a number of concrete steps to be taken. The
declaration has been forwarded to top government officials, political parties and
other competent authorities. By 2007 almost all steps have been accomplished.
Members: Computer hardware and software developers, internet providers,
telecomunication infrastucture and service providers and developers, web
developers, electronics (e.g. Exigen Services Latvia , LATTELECOM SIA, Institute of
Mathematics and Computer Science of UL, RIX Technologies, Tieto Enator &Alise)
Association of Computer Technologies of Latvia (LDTA)
www.itnet.lv
Description: Founded in 1997, the Association of Computer Technologies of Latvia
(LDTA) is a non-profit organization and is the oldest association in the Latvian IT
industry. The founders and members are the biggest IT companies and juridical
individuals that deal with IT solution development and implementation as well as IT
wholesale product enterprises. At present members of LDTA are involved in
processes that support the creation of Information Society infrastructure and are
actively using and promoting New Economy principles. In order to provide a friendly
environment for the development of IT and telecommunication branch development,
in 2000 LDTA was one of the founders of ITTE ALLIANCE which unites professional
associations that represent Latvian based enterprises and scientific and educational
institutions whose work is connected with electronics and electrical engineering as
well as information technology and telecommunication.
Members: IT product sellers, computer hardware developers and sellers, IT
infrastructure developers (e.g. Capital Ltd, MicroLink Systems, Lursoft IT )

BRANCH ORGANIZATIONS
LITHUANIA
Association of Lithuanian Communication Agencies (KOMAA)
www.komaa.lt
Description: KOMAA brings together the biggest and the strongest creative, full
service and media agencies operating in Lithuania. Members of the association
accept the Lithuanian Advertising Ethics Code and follow its provisions, and have
established the "Lithuanian Advertising Bureau". KOMAA’s mission is uniting
advertising agencies, developing the advertising market, raising the prestige of the
industry and making decisions significant to the advertising market. KOMAA was
established in 2002 and now it has 24 members.
Members: creative agencies (e.g. Adell Taivas Ogilvy, ADVISION, Leo Burnett Vilnius,
TBWA\Vilnius, SAN Vilnius/JWT), full services agencies (e.g. Tarela, VRS grupė ) and
media agencies (e.g. Carat, Creative Media Services, Media Bridge Vilnius & Co,
Media House, Starcom)
Lithuanian Advertising Bureau
www.reklamosbiuras.lt
Description: The Lithuanian Advertising Bureau’s mission is to develop a respectable,
fair and honest advertising practice in Lithuania, basing on The Lithuanian Advertising
Ethics Code. The goal is to develop the advertising sector in Lithuania, to create and
improve legally operating ethical self-regulation controls in advertising, honest
competition, the insured protection of users and protection against the negative
influence of advertising for society in general. Lithuanian Advertising Bureau was
established in 2005.
Members: the arbitrage committee includes representatives of various fields:
advertising agencies, TV, press, consumer protection, equal opportunities, child
rights protection, psychology and, sexology.
Association of Internet Media
Description: The aim of the Association of Internet Media is to ensure the ethical and
professional work of internet media. It also wants to guarantee for readers ethical
expression of opinion in news portals. The Association of Internet Media was
established in April 2009 by the eight biggest Lithuanian news portals.
Members: The eight biggest news portals in Lithuania: Alfa.lt, Delfi.lt, Bernardinai.lt,
15min.lt, Balsas.lt, Lrt.lt, Lrytas.lt, portal group of “Diena Media”
(vilniausdiena.lt, kaunodiena.lt, klaipeda.diena.lt)

BRANCH ORGANIZATIONS
POLAND
IAB Poland
www.iabpolska.pl
Description: IAB Poland is an organization dedicated to interactive marketing in
Poland. Its main aim is a widely understood education of the internet market as for
the methods of the use of the internet. Members include internet portals and
advertising and interactive agencies. Internet Advertising Bureau Poland was
established in 2000 and has since been an important player in The Polish internet
market.
Members: internet portals, advertising agencies, interactive agencies, research
agencies (e.g. International Data Group Poland S.A., Onet.pl Group, nasza-klasa.pl,
Agora S.A.)
Polish Internet Research
www.pbi.org.pl
Description: PBI is an organization established by the main Polish internet publishers
and biggest portal owners. Its aim is to create standards for internet research in
Poland. PBI promotes solid and reliable research of the Polish internet as a vital tool
for companies that use on-line advertising. PBI’s mission is to develop the Polish
internet as a medium reliable for Polish advertisers, advertising agencies, investors
and other players whose activity is connected with the internet.
Members: leading Polish internet publishers, internet portals owners (Gazeta.pl,
Interia.pl, Onet.pl, Wirtualna Polska, Rzeczpospolita OnLine), PBI’s partners (Gemius
SA, IAB Polska ,Internet Standard, News Point, Grupa Cron, MB SMG/KRC, Transmisje
Online sp.z.o.o.)
SMB – Polish Direct Marketing Association
www.smb.pl
Description: SMB is an organization aiming at creation of favorable conditions for the
development of direct marketing in Poland in accordance with the regulations and
work ethics. Polish Direct Marketing Association gathers around 100 companies and
it is a member of Federation of European Direct and Interactive Marketing and
International Federation of Direct and Interactive Marketing. The company plays a
key role in identification, planning and finding solutions to problems concerning the
field of direct marketing in Poland. Its goal is to implement and sustain standards on
the market and protect actively companies and consumers.

BRANCH ORGANIZATIONS
Members: companies dealing with direct marketing, advertising and marketing communications agencies, data bases brokers, telemarketing companies, catalogue and mail-order firms, fulfillment companies, service and manufacturing enterprises and companies from the internet and new media branches; altogether about 100 member enterprises.
ROMANIA
BRAT
www.brat.ro
Description: The goal of BRAT association is to independently and objectively verify
the performance indicators of various media products based on conventional criteria,
standardized at national level and established by members of the association. The
information obtained is intended for the advertising industry. BRAT was established
on 20 February 1998 by 33 founding members. As a result of the total transparency
of BRAT policy the number of members had increased to 106 by December 2003.
Members: publishing houses, online publishing houses, advertising networks,
advertising agencies, advertising clients (e.g. AD evolution, Clir Media Group,
Netbridge Investments)
Asociatia IAB Romania
www.iab-romania.ro
Description: IAB Romania brings together the most important members of the media
and advertising industry in Romania. The goals of IAB are: promoting the interactive
advertising industry, imposing international standards, the development and
promotion of programs to educate advertisers and those who want to develop
projects or publishing online, production and support studies on the efficiency and
power of online advertising, publishing market data and analysis and formulating
and promoting a code of ethics for the online advertising industry in Romania. The
IAB association in Romania was found in 2006.
Members: online publishing houses, advertising networks, advertising agencies,
advertising clients (e.g. AdEvolution, ARBOmedia, Artmedia Insight Grup, MediaPro,
Interactiv, Netbridge, Ogilvy, Online Network Sanoma, Hearst Romania)

BRANCH ORGANIZATIONS
International Advertising Association
www.iaa.ro
Description: The International Advertising Association is a unique strategic
partnership which defends the common interests of all disciplines in the whole
spectrum of marketing communications - from advertisers to media companies,
agencies, direct marketing companies and individual practitioners. The main
objectives of IAA are to promote the role and benefits of advertising, to protect and
promote freedom of commercial speech and consumer choice, to encourage self-
regulation and practice of advertising and to offer a forum for discussion of new
topics related to marketing communications. IAA Romania was founded in 1993.
Members: advertisers, media companies, agencies, direct marketing firms (e.g.
ARBOmedia, Danone, McCann, Erickson, Graffiti /BBDO, Leo Burnett & Target,
Saatchi & Saatchi, Next Advertising, Vodafone)
Romanian Council for Advertising
www.rac.ro
Description: The Romanian Advertising Council (RAC), founded in 1999, is a
professional, non-governmental, non-profit and independent organization. The
activity of the Council is self-regulation in advertising. Currently the Romanian
Advertising Council is preparing to offer copy advice. The initiative for a union in
support of the advertising industry in Romania belonged to several companies and to
the International Advertising Association (IAA) organization. RAC has 48 members.
Members: companies, advertising agencies, media and associations (e.g. Brewery
Holding Ltd., Henkel Romania SRL, Procter & Gamble Marketing Romania SRL
Romania S.A. and Unilever)
RUSSIA
AIB
www.a-ib.ru
Description: The Association for International Broadcasting (AIB) provides
information, networking and insight for the international broadcasting industry -
cross media, cross border and cross cultural. It was established in 2006.
Members: portals, publishers, news agencies, providers of technology (e.g. Yandex,
Rambler, RBC, Softkey, Ozon, Ashmanov&Partners, ArtonConsulting, Adriver, Afisha,
Begun, Webmoney, Gazeta.ru, Google, Icontext, Microsoft, sup, newsru.com,
Headhunter, Smartus)
BRANCH ORGANIZATIONS
ROCIT
www.rocit.ru
Description: ROCIT is a public organization whose primary mission is to facilitate the
inclusion of Russia into the global internet community. It was created to make the
interaction between suppliers and consumers of information more effective and to
establish an independent advisory service. ROCIT was established in 1996.
Members: private members and public associations
ISDEF
www.isdef.ru
Description: ISDEF is an association of e-shops. The primary aims of the association
are: to support software development and promotion; to facilitate the growth and
development of the e-commerce industry in the area of software; and to strengthen
the position of Russian developers in the international software market. ISDEF was
established in 2002.
Members: e-shops (e.g.Softkey, Alawar, Umisoft, Elcomsoft, Bitrix)
SLOVAKIA
AIM – Association of Internet Media
www.aimsr.sk
Description: The Association of Internet Media is a partnership of Slovak companies
operating in the Slovak internet and advertising business. The formation of AIM came
from the need to create a platform for interaction of those operating in Slovak
Internet Advertising. The Association aims to provide standardization of ethical and
legal rules for internet advertising, support development of the internet as an
advertising medium, encourage internet professionalization.
Members: Slovakian portals (e.g. SME.sk (news service), Azet.sk (social network),
Atlas/Centrum (portals), pravda.sk (news service)
SLOVENIA
SOZ - Slovenian Advertising Chamber
www.soz.si
Description: The Slovenian Advertising Chamber is a non-governmental organization
which defends the interests of advertisers, advertising agencies and publishers. It is a
member of IAB Europe.
Members: publishers and agencies (e.g. 24ur.com, najdi.si, siol.net,rtvslo.si, httpool,
media pool, bolha.com, avto.net, genspot.com, zurnal24.si)

BRANCH ORGANIZATIONS
UKRAINE
Ukrainian Association Of Internet Advertising (UAIR)
http://uair.org.ua/
Description: The main purpose of the Ukrainian Association Of Internet Advertising is
to create conditions for the effective development of the advertising market in the
Ukraine to meet the needs of advertisers, consumers and users of internet resources
on a global level, as well as to increase the share of advertisers budgets. To achieve
this, UAIR has begun a full study of the Ukrainian internet. UAIR was established in
2007.
Members: portals, international marketing and advertisement networks
representatives (e.g. LigaBusinessInform, Bigmir Interet, META, Golden Mean,
GRUPEM, Inishieytiv, MMS Komyunikeyshns Ukraine


OPINIONS FROM THE CHOSEN CEE MARKETS
OPINIONS FROM THE CHOSEN CEE MARKETS
1. EXPECTED CHANGES IN ONLINE MARKET
BULGARIA
One of the most obvious trends expected in the future is that internet penetration in Bulgaria
will continue its growth and more and more people will get involved in the net, making it a strong
and powerful medium. Moreover, the current financial situation will positively influence the users’
attitude toward the internet, as people will have more time to entertain themselves online instead of
the more expensive option of going out. However, among all the other types of media, TV will remain
the internet’s strongest competitor in the fight for the user’s attention. Instead of following TV
information programmes, people will use a search tool to access any necessary information.
Furthermore, users will become more confident online, using the internet for shopping and
making online payments. This assumption can be substantiated by the recently observed increase in
online transactions compared to previous periods. This, in turn, will lead to changes in marketing
strategy, no doubt boosting online marketing budgets.
Elena Lazarova – Impulse.bg
The internet is constantly changing; however, the main transformations are expected in
terms of the development of broader news and entertainment content on the internet by
conventional media – TV, newspapers and magazines.
We also expect further development of e-commerce – with the internet used more actively
as a sales channel, with multimedia usage based on broadband development and mobile usage
based on gsm networks and appliances. In the communication sector, e-mail will lose share to instant
messaging and social networking. In terms of news services – a trend towards personalization will be
observed. Torrents will still be thriving.
Marina Jeglova – Dir.bg
ESTONIA
Clients of advertising networks in Estonia require repeatedly better and clearer results from
different providers of internet banners. Not so long ago the market for internet advertising could
have been described as an “oligarchy” of the biggest websites which controlled almost the whole
area. Now clients of advertising networks once again are gaining more power. This forces the biggest
websites and networks to be more innovative and flexible. Those who can manage this requirement
will survive and gain market share. In that light, we see that networks which have established
themselves only in the last 1-2 years on the Estonian market having a vital advantage. If in 2009 such

OPINIONS FROM THE CHOSEN CEE MARKETS
networks have approx 10 percent of market share, then this will definitely rise in the future. The
biggest question is when and if the local networks will reach a market share comparable to the best
worldwide examples, for instance the 30 percent figure seen in the USA.
We believe that this situation will arrive in 1-2 years from now. Main portals have to change
radically both their activities and their mentality and create competent “internet marketing agencies
or departments” which will separate internet portals more clearly from offline media sales.
Rando Rannus – SmartAD network
HUNGARY
Hungary is not a trendsetting country with regard to the internet. We rather follow the
Western trends, adding local variations. I do not see this situation changing in the future. But this
does not mean that there are no Hungarian specialities in this field. Recently the main changes are
coming from the economic situation with the crisis hitting the Hungarian economy more deeply than
within the EU in general. It is not yet clear whether this is good or bad for the Hungarian internet
industry and either scenario can evolve. Weak advertising activity of the main players, such as the car
industry or financial sector, can affect internet sites, but, in these hard times, online advertising can
be more cost effective than other media. So the internet can probably profit from the recession. My
personal view is that this situation bears some similarities to the 2001 dot-com crisis. We did not
have big internet companies and a strong internet culture then, hence there were not so many
bankruptcies or closed sites and services. But the whole economic environment and the hype around
internet have changed since 2001-2002. I feel that the economic situation around the internet is
changing again and I believe that this time the internet will be a winner, as it becomes a more
professional environment for both advertisers and users. Our aim at Ipsos is to support this change.
János Gulyás – Ipsos Media, Advertisement Market and Opinion Research Institute
At the end of last year, following the first signs of the financial crisis, everyone remained
hopeful that online activity would probably not suffer and the crisis may well have positive effects. It
would become the preferred medium and spendings withdrawn from other areas would be spent
online. However, this happened only to a certain degree. Online did actually become a preferred
medium, but only to the extent that people got more interested in this form of advertising. At the
same time, advertising lost from other media was not transferred online. The result being that the
online advertising market will not be able to keep the 40 percent annual increase it enjoyed before
the recession and probably it will not even reach the 20 percent which was hoped for by many
people.
It is likely that the growth rate of internet penetration will also decrease, probably stabilizing
at around 60-70 percent . However, people who already have an internet connection will use it more,
therefore the overall internet usage will increase spectacularly over the next few years. Broadband
and mobile in particular (on PC and mobile devices) will develop greatly.
Géza Ambruszter – ZenithOptimedia

OPINIONS FROM THE CHOSEN CEE MARKETS
Thanks to constantly growing bandwidth (dial-up connection has practically disappeared , its
share now below 2 percent , while almost 70 percent of users connect to the internet through ADSL
or cable tv), web technologies are continuously developing and video, flash applications and other
innovative solutions are expanding. Due to the increasing online 'advertising noise', marketers have
to find and develop special and ever more innovative solutions to get noticed. Moreover, ad-blocking
applications are another major challenge they have to face. Neither advertisers nor users have so far
used all the opportunities offered by Web 2.0 technologies. This segment is therefore likely to
experience significant changes in terms of both innovations and advertising revenues. In 2009 small
and medium-sized advertisers have started using online campaigns in great numbers. This growth
has not been reflected in overall market trends because some larger market players, who used to
spend heavily on online advertising, temporarily suspended their spending at the beginning of the
year due to the global financial crisis. However, we expect these larger advertisers to return to the
online advertising sector and therefore we believe that growth forecasts given at the beginning of
the year will not be too hard to meet.
Tamás Kocsis and Géza Palocsay – Sanoma Budapest Zrt.
I believe that, in contrast to other mediums, online adspending will grow from 2008 to 2009.
This will result in the internet becoming the 3rd most powerful mediumafter TV and the press. We
predicted that internet adspend would overtake outdoor in 2010, but the credit crunch has
accelerated this process and internet spending will most probably outrun outdoor in 2009 and not
return from the third position. Internet spending will probably get close to that of the press in 4-5
years but, as Hungary is very TV-orientated, that market still seems to be unreachable. I think that
with regard to the total adspending budget, there will be about a 15 percent cut this year that will
result in the internet reaching a 13-15 percent slice from the adspending cake. Moreover, the
position of sales houses and ad networks will be stronger in 2009, and probably affiliate networks
will also appear on the Hungarian market.
I do not think there will be a big change in popular content and search and social network
web sites will still remain very popular and most probably video solutions will be getting ever more
widespread on branded sites as well as in online advertising, thanks to the rapidly developing
technologies and the growing penetration of broadband connections. Furthermore, I predict that
mobile internet will become increasingly popular, not only on PCs but also on mobile devices.
Péter Novák –Kirowski and IAB
LATVIA
The increase in internet users will become slower with internet penetration maybe reaching
60-65 percent within the next few years. The advertising market during 2009 will record a decrease
in comparison to 2008. The beginning of any upward movement will depend upon the overall
economic situation, globally as well as locally. Advertisers will naturally be categorized according to

OPINIONS FROM THE CHOSEN CEE MARKETS
the formats they use. Display ads on the largest content media will be regarded as the premium
advertising type, as is already the case in Western Europe and the USA. Banner solutions will
continue to become more and more creative and at the same time less intrusive for visitors. From
the creative perspective they will be more visible because of their format and usage. Creative ideas
will be adapted to particular formats by their functional possibilities and the ideas behind them.
There will appear more CPC solutions, which will become the main product for small, niche
advertisers. Search will strengthen and improve its positions, but up to a certain limit, which will be
reached in the next few years. Its potential is very limited in small markets like Latvia.
Editorial video content on the internet will expand, become more saturated and higher
quality; however it seems that it will not reach a significant position in internet advertising during the
next few years.
After the economic situation has reached its lowest point, a positive impact on the
advertising industry will be seen and several brokers/networks will appear on the Latvian market,
which is currently a niche which has not reached its full potential.
Lauris Lietavietis – Delfi.lv
LITHUANIA
Trends in our country differ slightly from elsewhere in the world, partly because of a
particular backwardness caused by the small size of the market and also because of the language,
which sometimes limits the emergence of trends which dominate the English-speaking internet
world.
Contrary to original forecasts the internet advertising market has shrunk quite sizeably in
Lithuania and it is no surprise that only the strongest remain; the appearance, therefore, of
innovative and high profile campaigns or projects is not expected under such conditions. However,
the internet cannot be expected to stand still. The number of users increases and it is unlikely that
even the most difficult economic conditions will stop this trend. Users are becoming more
sophisticated and are using more of the services available on the internet.
Deividas Talijūnas – Ad.Net Lithuania
Who ten years ago could tell you what the internet was ? It was like a toy that is interesting
but strange and complex. And now? Using the internet has become as simple and commonplace as
picking up the phone and making a call. It is obvious today that a computer should be switched on.
However, sooner or later its operations will migrate to much more personalized devices such as
mobile phones.
The internet is fascinating because whatever happens on this media it undergoes constant
changes. One should not look at the internet as just a traditional media channel, which it has already
become, but as a technological platform, where it is possible to realize any and every fantasy

OPINIONS FROM THE CHOSEN CEE MARKETS
imagined by a creator. The printed word as well as TV and radio are intertwined here and I think that
an integration of all these media is what will ensure the dominance of the internet in the coming
years.
Ričardas Baltaduonis – Lrytas.lt
POLAND
The situation has been slow to improve, with the main obstacles remaining the same for
several years, with prices being one of the key issues. Despite the fact that they have been
decreasing over the last few years, and even months, online services in Poland are still among most
expensive in the world. The latest OECD report shows broadband connections on the Polish market
are among most costly in the 30 member countries, comparing prices of a 1 Mbit/s connection and
allowing for the purchasing power of local currencies. In late 2008, Polish internet cost over USD 32
(comparing to South Korea – USD 0.85, France – USD 3.3, Spain – USD 14.19). The internet speed in
Poland is not particularly impressive either. The average speed of Polish connections in 2008
amounted to 4,313 kb/s, while the OECD average is 17,412 kb/s. Only in Turkey and Mexico is the
mean connection speed slower than in Poland.
Accessibility is another problem. Although broadband connection is one of the most
dynamically developing segments of the telecommunications industry in Poland (according to Office
of Electronic Communications), it is still hardly satisfactory when compared with other EU states.
A recent and widely discussed social phenomenon is now gaining ground - the digital divide,
the partition of society into those who have access to the web and contemporary means of
communication and those who are devoid of such possibilities or the related skills. This has been
identified as a crucial barrier to development of the internet in Poland. Economic issues (the price of
internet connection, software, computer, etc.), level of education or age (decreasing online activity
with increasing age) are not the decisive factors here - it is an insufficient knowledge about the net. A
growing number of people claim that they do not know how to properly use the internet despite
having access to it.
Finally, a deficiency of legal and, in the case of e-commerce, logistic solutions, as well as the
high cost of courier services and the monopoly of the national postal services provider - Poczta
Polska - complete the list of obstacles to further advancement of the Polish internet.
Accelerating the development of the internet entails the systematic elimination of the above-
mentioned barriers. Improvement of the economic situation in Polish households and a reduction in
internet connection prices, together with technical infrastructure development, education,
amendment of legal acts and the adaptation of regulations to the changing market situation are basic
to successful development.
Michał Tober – Wirtualna Polska

OPINIONS FROM THE CHOSEN CEE MARKETS
The most important development ahead is likely to be a dramatic increase in the accessibility
and growing intensity of internet usage. Internet operators do realize that the new user market,
though considerable, is limited. Thus, they will put more pressure on greater bandwidth and
mobility. This means that the internet will become a popular, commonplace tool for most people –
readily accessible and eagerly used on an everyday basis. I think that success is likely for services
tailored to such a general market, designed to satisfy actual and popular needs in a comprehensible
and effective way. Being a natural optimist, I expect an imminent breakthrough will allow the
internet to manage all formal and official matters. Probably no other area of the net fails to maintain
the pace as much as this one, which, of course, is also a great opportunity. The current economic
situation will force many companies to look for new markets and business models. Today, the
consequences of the fact that we are an EU member state and also enjoy access to the internet are
not fully exploited. At the same time, searching for new clients and products across national borders
has never been easier. The same economic situation will have its bearing on customers, who will
actively look for suitable offers. Taken together, this constitutes a powerful stimulus to change the
everyday behaviour of both companies and consumers. Furthermore, I believe we will witness a
further breakaway of the internet from the regulatory limitations that hinder both economic and civil
progress. What people want is very cheap communication, unlimited access to knowledge and
culture, quick access to information and freedom of speech and publication. In many ways, today's
legal and organizational solutions do not keep track of these needs and the available technical
possibilities to fulfill them via the internet. The discussion concerning these issues will heat up and
maybe we will eventually see changes that will bring profound, positive and far-reaching
consequences.
Artur Waliszewski – Google
For a number of years, limited availability has been the key obstacle to development of the
internet in Poland. This entails both restricted accessibility and the high prices charged by providers.
There are still huge blanks on the map of Poland, by which I mean the small towns and rural areas.
These are places of enormous potential, but the people there experience huge difficulties accessing
the internet. The internet, at least in its rudimentary form, should be free. In our country, even the
basic monthly charges are too high.
Another barrier is the concern a potential user has about the possibility of fraud. I feel what
we lack is a nation-wide ‘information and enlightenment’ action, educating people about the benefits
of the internet, overcoming entry barriers and challenging stereotypes concerning the dangers
lurking for users. There have been some smaller-scale activities of this kind, though they went
somewhat unnoticed. Such undertakings should involve preparation of public authorities,
government and non-governmental bodies to organize online management of issues of concern to
citizens. This way the public would also be informed about the advantages and not just the negative
aspects of internet activity. Moreover, a parallel information campaign should be run in the
traditional media. Overall, social awareness is relatively low, excluding, of course, the young, the
educated and those who have been exposed to the internet since the cradle,. For them, the net and
access to it is something absolutely natural.
Artur Brzęczkowski – Allegro Group

OPINIONS FROM THE CHOSEN CEE MARKETS
176
UKRAINE
The internet in Ukraine is moving towards commercialization: more e-commerce technologies are adopted, and more and more users are involved in commercial activities over the internet. The fastest growing sites now are auctions, price comparison sites and e-shops. The main trend is the transfer of advertising activity from offline to online, and the use of ever more complex approaches to online ads A few years ago advertisers tended to use a single technology (only image ads, or minimal context ads), now they are using complex campaigns with different media. This trend, as well as the move of more advertisers from offline to online, will continue to dominate. Dmytro Sholomko – Google
2. DEVELOPING BRANCHES BULGARIA
The opportunities to earn money online will influence the number of blogs and bloggers as well as online shops. Some goods and services that were not previously present on the internet, will be offered online and in consequence an increase in the number of online transactions will be observed. The line between off and online will slowly start to blur, necessitating that offline businesses not only be present on the online market but also possess a professionally prepared service.
Elena Lazarova – Impulse.bg
ESTONIA
Estonians appreciate the advantages of the internet where exposure is unlimited and business options are much wider than in the traditional marketplace. The future of the Estonian internet is related to the development of e-learning platforms and web-based educational materials. E-commerce and e-learning are such strong directions for development, that it is possible that they will overshadow the social networking movement. The last significant trend is related to the growth of cloud computing projects, which are becoming more popular with business consumers. Aivar Ilves – Epl.ee

OPINIONS FROM THE CHOSEN CEE MARKETS
HUNGARY
Narrow-band internet has almost disappeared from the country and at the same time 23
percent of internet subscriptions in 2008 were for the mobile network (but used mainly with laptops
and PCs). Based on this data I think the narrow-band will completely disappear, meanwhile mobile
internet (especially using internet on mobile phones) will be a very important trend in Hungary over
the next few years.
Another important change is the timorous appearance of behavioral targeting, a new
phenomenon which it is hoped users will endorse. I think that the traditional media (mainly
televisions and print) should improve their internet presence and services in Hungary; some pioneers
are already there. The press, especially, can move towards the internet and it could help them
survive the economic crisis and renew their business model – but this is not a special Hungarian story
as we can see this challenge globally.
János Gulyás – Ipsos Media, Advertisement Market and Opinion Research Institute
Mobile marketing will become an ever more important tool, as will ads placed in and around
video content. Although we expected the latter development during the last couple of years, the real
breaktrough still has not happened. It will be an important step forward, that we will soon have
unified, IAB advice for video ads. An increasing number of publishers are producing video content
and televison has also started the delayed broadcasting of their programmes online, but the real
breaktrough from the advertising point of view still has not occured.
However, the real winner is the Search (SEM) sector. Its increase would have been huge even
without the credit crunch, but thanks to it, companies both small and big all turned to SEM. Yet,
because of the Hungarian language and the unusual structure of Hungarian media ownership
(Hungarian content is only produced in Hungary and on our market Index, Origo and Sanoma have
huge domination which has an effect on content production) I don’t think that the English or
American examples will become reality in Hungary. Despite the sudden growth of SEM market share ,
I do not believe this will go above 50 percent.
Géza Ambruszter – ZenithOptimedia
The broadband categorization that is now used by the Hungarian Central Statistical Office
(xdsl, cable TV) will be extended with others, which we still cannot classify, but are already
important. These are, for example, mobile internet (3G/HSDPA/HSUPA), other wireless (e.g. WLAN)
and optical internet solutions (LAN, Digi, Tvnetwork) or that used by Hungarian Telekom). This means
that dial-up may completely disappear and the usage and spread of ADSL can stop; indeed, it may
already be decreasing. The cable TV internet might well become even more widespread.
In wireless technology the mobile internet is currently the leading solution and most
probably this will not change in the foreseeable future. In my opinion, mobile telephone companies

OPINIONS FROM THE CHOSEN CEE MARKETS
have plentiful money and other resources available for development; therefore some other wireless
technology can predominate only where the mobile for some reason cannot.
A wired platform will be preferred, most probably, by clients who need a stable system with
a large demand for data and the wireless will be utilized by clients who cannot be reached by wired
platforms or who prefer high mobility. Therefore cable TV and the optical internet will have strong
positions and the mobile internet with, developments in the areas of speed and availability, will be
able to attract more clients.
Because of the credit crunch and other limitations, it is hard to believe that the increase will
be as fast as in previous years. We expect to see slower growth and re-organizing within the market.
But certainly if prices decrease faster, this process also may become more rapid. The number of
phone lines is decreasing from quarter to quarter, which does not help advertising, but does explain
why this sector is in so much trouble.
Balázs Tarnai – Hungarian Central Statistical Office
LITHUANIA
It is probable that the most dynamic changes will be observed in the area of social networks.
On the one hand Lithuanian users have discovered foreign social networks, some of which are
already available in Lithuanian language versions (Facebook.com), on the other, it will not be so
difficult for Lithuanian social networks operators to survive these hard times because of low
maintenance costs.
There is also some delay with the evolution of e-commerce in Lithuania. In several recent
years only the airline tickets sales sector is active but the trading of everyday goods accelerated last
year. Perhaps e-commerce will not yet attain a large reach this year but there is no doubt that we will
see more active players in this sector.
Unforgivably, the online tourism and travel Sector in Lithuania is largely forgotten. In a
majority of countries, web pages dedicated to this topic are among the most popular, along with
buying travel. In our market most travel operators do not see the possibilities or full value of selling
online.
Despite current economic problems, the prospects for internet marketing can be evaluated
quite optimistically. In the meantime in Lithuania very few funds are dedicated to advertising in the
search process (in Lithuania search is almost 100 percent by Google) and this branch undoubtedly
will grow. Currently, almost all advertising agencies have established departments of interactive
advertising and as these people will have to justify their existence it follows that more advertising
money will be dedicated to internet advertising. Contrary to developed markets, in our country not
much is said about mobile advertising, which is poorly exploited even though Lithuania is one of the
leading countries in Europe when it comes to the use of mobile communications.
Deividas Talijūnas – Ad.Net Lithuania

OPINIONS FROM THE CHOSEN CEE MARKETS
One of the most dynamically developing branches is video. Now we see the phenomenon of
Youtube, which has demonstrated that this kind of entertainment is of great interest for visitors to
internet websites, particularly as more professional content will appear. As to news, the internet has
taken prime position in the consciousness of users and has almost outrivalled radio in terms of
speed, with the implication that the next stage of evolution might be video news.
Ričardas Baltaduonis – Lrytas.lt
POLAND
In the Onet Group we believe there exist some fundamental truths about trends in the future
development of the internet:
First – media convergence. This process has already begun and will certainly gain
momentum.
Second – search tools. Faced with the vast amount of information available online, anything
that facilitates searching would seem to offer a positive basis for further development.
Third – video. The internet has long been something more than ‘text only’ and the role of still
images is giving way to multimedia content. In Poland the barrier is insufficient infrastructure, but I
hope that this will change with time.
Fourth – mobility and accessibility. The internet today can be found in our mobile phone and
game console and in no time it will also be widely available in our TV set and other devices. The
concept of using products and communicating via a PC connected to the stationary internet is
becoming outdated.
The internet and its content is an increasingly accurate reflection of our offline reality. It will
become more local in its content, advertising, targeting and search functions.
Maciej Kossowski – Onet Group
I believe that, as in any market, the Polish internet reflects the needs and expectations of the
customer. This is why successful internet solutions must satisfy the needs of the users. In my opinion,
content-based web sites will lose their range share in favour of services and applications facilitating
multi-channelled and multi-directed communication. These trends are already clearly visible. As
Polish internet users become more experienced, they find that simple informative sites fail to live up
to their expectations. They are looking for new tools to satisfy their needs. I believe that, beyond the
social networks, all forms of internet-based video communication and all kinds of application related
to time management, e-commerce, data storage and live streaming will be growing in importance.
Dominik Kaznowski – Nasza-Klasa

OPINIONS FROM THE CHOSEN CEE MARKETS
3. INTERNET AUDIENCE
BULGARIA
The online audience is becoming wider, more knowledgeable and acquiring better online
skills, and, consequently, is demanding a better quality web experience. Furthermore, Bulgarian
internet users are becoming more open and ready to share best practices and knowledge.
The needs of the audience that have the greatest potential to cause the changes in the
internet can be described as a need for: targeted information, user-friendly products, a shared
experience (asking or giving advice, recommendations, help) and also simplicity in online services
(e.g. Facebook or Twitter), as well as better online security. Moreover, it becomes increasingly more
popular for users to participate in “building” products literally and figuratively. They are no longer
satisfied with being simple observers, nor do they take it for granted that “professionals” know best
which features should be added to improve an online product. They want to express their opinions
loudly and openly.
Elena Lazarova – Impulse.bg
HUNGARY
Although the overall growth rate of internet penetration and visitor numbers have been
slowing, the online segment still has a strong growth potential. In Hungary men are slightly more
intense internet users (by around 2 percent ) than women, but this is likely to change within a couple
of years, and women are expected to represent a majority among internet users. The proportion of
female internet users is already higher in the population aged below 15 and above 45 – and these
groups are the main drivers of the growth of internet penetration.
Tamás Kocsis and Géza Palocsay – Sanoma Budapest Zrt.
When we analyze age groups we can see huge differences, and in the over 45 year olds there
is a huge difference in usage compared to the younger generation. There are some programmes that
support computer literacy amongst retired people (Hungarian Telekom, UPC), but obviously these
can only reach smaller groups. In the main, those who feel that they cannot keep contact with their
grandchildren without online skills. In the case of households, the presence of a child makes it more
likely for a family to go online.
Balázs Tarnai – Hungarian Central Statistical Office
LITHUANIA
The Lithuanian audience is still growing pretty quickly. In later years the number of
Lithuanian citizens using the internet grew by almost 10 percent and this growth is mostly influenced

OPINIONS FROM THE CHOSEN CEE MARKETS
by the emergence of an audience of older people, which also has higher a income. Such a change in
the market determines both an increased demand for serious content and better prospects for e-
commerce. The growing internet sophistication of this new audience makes it possible to believe that
both more and more varied services will be used on the internet. Earlier we had only one dominant
news web page (Delfi.lt) and one obvious leader in the category of social networks (One.lt), but the
situation is gradually changing as these leaders no longer grow and their competitors slowly but
steadily increase the number of their visitors, and we can expect that this trend will continue.
Deividas Talijūnas – Ad.Net Lithuania
UKRAINE
Considering the internet as Network and Infrastructure, it continues to change and develop.
The number of broadband connections is growing, although primarily in the capital. But dramatic changes should not be expected soon because of the present economic situation. However, the internet audience in Ukraine will increase due to regional users of all ages coming online. Now a significant number of young people and women use the internet. The basic needs of users are information search and communication. Users increasingly require active communication via the internet with e-shop assistants and service providers. Vladimir Chernyshov – Liga.net The main changes in the Ukrainian online landscape are connected with growth. The number of users will grow but more slowly, thanks to the difficult economic situation. However, penetration of the internet has not reached saturation and we shall observe significant growth in the number of users for a further five years at least. The number of advertisers and companies who use the advantages of the internet for their business, will also grow. Budgets for online advertisement are now about 2 percent of the general marketing-mix and this figure should grow several times in the next few years. The internet audience will also ‘grow younger’ and the percentage of women will increase. The main needs of internet users, communication and information search, will hardly change in the coming years, although the services satisfying these needs may change considerably. The share of multimedia content and video services will increase significantly.
Aleksey Chuksin – Meta.ua

OPINIONS FROM THE CHOSEN CEE MARKETS
4. PORTALS, NEWS SERVICES AND SOCIAL NETWORKS
BULGARIA
The recent competition between portals and news on one side and social networks on the
other will grow into mutual collaboration in order to bring more benefits to the users and thus to
gain their loyalty. Social networks are already the hottest thing happening in Bulgaria, whether we
are speaking about global or local ones. On social networks people are socializing, networking,
dating, communicating, and sharing. Having a profile on a community network is a must and is an
accepted part of a user’s online identity.
Social networks will become more mature and their popularity will boom. The potential of
community services is huge, not only for users but also for marketers and brands. Commonly, social
networks are being used by Bulgarians not only for keeping in touch with friends or classmates, but
also to build a personal brand or to help create brand awareness for the products users are
responsible for. Difficulties that marketers have on the offline market will lead them to use more
efficient ways of spending their budgets.
News services will not lose their popularity, but they will count a lot on traffic generated by
social networks. In order to maintain and increase their users interests, portals and news services are
likely to take a new direction by socializing their content. Therefore news sites and portals will
contain more elements and features of social networks. As we follow this route towards integration,
more resources and tools for presenting content will be utilized, including audio and video news,
fields for users comments and photo content as well as involving users in providing intellectual
content.
Elena Lazarova – Impulse.bg
HUNGARY
The market is stable and newcomers cannot easily become stronger or bigger. The failure last
year of a newly launched news portal (zoom.hu) showed that it is not simple to become a major
player. I do not think that the popularity of portals, news services or social networks will change in
the next few years, unless a site disappears because of the economic crisis, because Hungarian
internet users are conservative and have their internet habits and customs. Because of language
problems (only one third of the population speak a foreign language at all, which was the lowest rate
in EU25 in 2005), they mainly prefer local or localized services.
Some of the dominating trends now and for the next 1-2 years can be described briefly as: no
changes in terms of the big players, either international or local; the “tabloidization” of content; web
2.0 as the mainstream; consolidation of Facebook-like iWiW (the biggest Hungarian social networking
site); greater importance of the mobile internet; deeper involvement of users; more crisis related
economic content and stronger SEO and behavioural targeting. I think these trends will define the
development of the internet in Hungary during 2009-2010.
János Gulyás – Ipsos Media, Advertisement Market and Opinion Research Institute

OPINIONS FROM THE CHOSEN CEE MARKETS
LATVIA
Professional editorial content has still the most stable position in the internet. It is clear from
the statistics that during the previous year content projects with Delfi heading them have had a
steady increase in reach, which means that new internet users start by using them, while social
media have remained on the same stable reach level.
The rapid growth of social networks will slow down and stop. Having reached maximum
capacity, their market positions have stabilized. The main threat to local social networks are
international operators such as Facebook, while for the Russian speaking population, there are
Russian social networks (Odnoklasniki.ru) and the audience for local networks may switch to them. It
seems that this is already happening with the audience of One.lv, which has decreased significantly
during the last year. As to advertising, social networks will specialize more and more in special,
custom made projects and solutions as their format is appropriate for that.
Lauris Lietavietis – Delfi.lv
LITHUANIA
2008 was a boom year for news websites in Lithuania; amongst the twenty most popular
sites, nine are publishing news. Most of them, however, have concentrated only on news and do not
even pretend to become a true horizontal portal offering a set of services to its visitors, as is common
in more developed markets. It is probable that none of them operates profitably and only some will
survive the present economic crisis.
As globally, time spent by internet users on social networks will grow and it is worth
mentioning that Lithuanian internet users have discovered Facebook. Furthermore, only this year
they have started to use microblogging services more actively. Therefore, quite important changes
can be expected as users will migrate from local to international social networks.
We can also expect the second development stage of blogs. If earlier blogs were written only
by IT enthusiasts analyzing themes topical only to those with similar interests, and youths who did
not create any interesting content, a noticeable recentl trend is for more politicians, journalists and
active society players or specialists of particular fields to start writing their own blogs, the content of
which in most cases is more up-to-date and interesting than the professional news web pages.
Deividas Talijūnas – Ad.Net Lithuania
UKRAINE
In the Ukrainian segment of the internet, Russian portals and social networks are actively
utilized because of the widespread use of the Russian language. To a lesser extent, this relates to
news services, as primarily regional (Ukrainian) information is demanded. Social networks will evolve

OPINIONS FROM THE CHOSEN CEE MARKETS
in the direction of specialization, and news sites and other narrowly focused projects are likely to
integrate into portals and other sites that serve as starting page for users.
Vladimir Chernyshov – Liga.net, Company LigaBusinessInform
In the near future, portals, news services and social networks will continue to grow. Growth
of news services will be fed by the incessant political competition and high politicization of the
country. Social networks have not yet reached their peak in Ukraine and there are several more years
of growth ahead. Portals too will continue their growth due to their increased speed and their
experienced professional teams.
Aleksey Chuksin – Meta.ua
Portals are definitely deteriorating; news services are changing, with a lowering of the
quality (due to a major decrease in the financing of mass media, which is also an offline trend). Social
networks are booming, but names are changing as some big social networking players are being
replaced by others.
Dmytro Sholomko – Google


METHODOLOGICAL NOTE
METHODOLOGICAL NOTE
Data sources The general market descriptions provided in the report are based upon data acquired by the
gemiusAudience study. For each country, reach rankings of the top ten websites included in this
study are presented. Further, additional statistics from gemiusAudience study enrich the information
in the rankings. The only exception constitutes Romania, where the ranking according to traffic.ro
was presented.
Another type of data presented in the report comes from gemiusTraffic study. This concerns
information on browsers, operating systems, search engines and screen resolutions. Data for web
browsers and operating systems of low popularity is aggregated in group–sets consisting of all
versions of a particular browser or operating system.
The description of each market was supported with the experience and knowledge of Gemius’ local
representatives present in each of the countries included in the report.
The “Opinions from the market” section, which contains the forecasts concerning the future
of the internet in the given countries, consists of direct citations of the opinions of local market
experts.
source
date
number of websites included
age group
Bulgaria gemiusAudience January 2009 146 15+
Croatia Gemius/Valicon, gemiusAudience January 2009 229 12+
Czech Republic NetMonitor –
SPIR/Mediaresearch/Gemius January 2009 389 12+
Estonia gemiusAudience January 2009 42 15+
Hungary gemius/Ipsos Audience January 2009 1827 15+
Latvia gemiusAudience January 2009 129 15+
Lithuania gemiusAudience January 2009 113 15-74
Poland Megapanel PBI/Gemius January 2009 9200 7+
Romania trafic.ro April 2009 n/a 15+
Russia gemiusAudience January 2009 241 18+
Slovakia AIMmonitor – AIM – Mediaresearch
& Gemius January 2009 83 14+
Slovenia Gemius/Valicon, gemiusAudience
MOSS April 2009 86 10+
Ukraine gemiusAudience January 2009 309 16+
About gemiusAudience Gemius sets the standard for online audience and internet application measurement
(gemiusAudience) in almost half of all European countries. gemiusAudience study integrates offline
research, site-centric measurement, pop-up surveying and user-centric measurement to provide
media sellers, planners and buyers with online media planning data. More information on this study
can be found on the www.gemius.com and www.audyt.gemius.pl websites.
About gemiusTraffic The gemiusTraffic study provides information on the internet user’s web site behaviour and
the technical characteristics of their computers. The data is gathered with the use of counting scripts,
which are embedded in the code of sites included in the study. More information on this study can
be found on www.gemius.com and www.rankingcee.com websites.
Rankings concerning web browsers, operating systems and screen resolutions are calculated
based on the number of page views generated on the monitored sites.
Search engine ranking is calculated using the percentage of visits made from search engines
on a given country’s sites included in gemiusTraffic. The average from the percentage of visits made
on the measured websites is calculated for each search engine. The outcome is the position a search
engine takes in the ranking.
Glossary of metrics used in the report Real users – the number of individuals in a given month, who visited the selected web site at least
once. This number represents the reach of the web site and shows the actual number of people – not
computers or cookies, which are often understand as visitors – that visited the web site. It is possible
to determine the socio-demographic profile of these people.
Page View – loading of a WWW document of a given internet web site. When an internet user views
a web page, this generates a page view. The page view is recorded through a special tracking script
that has been placed in the code of the relevant web page.
Reach – the indicator is expressed as a percentage and constitutes the ratio of the number of visitors
(real users) who generated at least one page view on the selected web site within the given time
period, to the total number of Internet users within that time period.
Average Time Spent per real user – the total time spent by the average real user from the given
target group on the selected web site or web sites.
Average Number of Page Views per real user – the number of page views on the selected web site
generated by the average Visitor from the given target group within a given time period.

ABOUT GEMIUS
Gemius is the leading research company and a forerunner in the field of internet studies in
Central and Eastern Europe. Since 1999, it has been providing professional research, analytics and
consultancy services.
With a firm stand in Central and Eastern Europe, Gemius is now concentrating on the
development of its business activity in Western European countries, conducting measurement of
online audience in Denmark and setting up operations in Austria, Norway and the United Kingdom.
Being aware that professional customer service is essential, the company opens its regional
offices for each foreign market and offers full business and technical support in local languages. In
addition, Gemius cooperates with such partners as Ipsos in Hungary and the United Kingdom,
Mediaresearch in the Czech Republic and Slovakia as well as Valicon in Bosnia and Herzegovina,
Croatia and Slovenia. The company adheres strictly to the ESOMAR code of practice that governs the
way market research is conducted.
Gemius provides brand name clients throughout Europe with a wide range of internet
research products. The company offers data on internet user behaviour (gemiusTraffic), internet
audience profiles (gemiusProfile), online advertising campaign effectiveness (gemiusEffect) and much
more.
gemiusAudience research study is the online advertising currency across Central and Eastern
Europe. Gemius regularly publishes its results for: Bosnia and Herzegovina, Bulgaria, Croatia, the
Czech Republic, Denmark, Estonia, Lithuania, Latvia, Hungary, Poland, Russia, Slovakia, Slovenia, and
Ukraine.
An interdisciplinary team of highly qualified professionals is the most important asset of our
company. We pride ourselves on working with the most passionate and inquiring minds in the field.
We believe that the results of our measurements enable entrepreneurs and organisations to
optimise their e-marketing solutions. At the same time we bring the medium closer to its users,
providing information concerning the most popular web sites, their usage and other trends from the
internet industry.

ABOUT IAB
IAB Europe exists to support and promote the growth of the European digital and interactive
marketing industry.
Representing 21 country members across Europe and over 5000 companies, the Interactive
Advertising Bureau (IAB) Europe is the trade association of the European digital and interactive
marketing industry. Supported by every major advertiser, media group, agency, portal, technology
and service provider, the power of IAB Europe comes from its extensive membership.
IAB Europe exists to promote the growth of Europe’s interactive advertising markets, to
protect the interest of the industry, to regulate practices on the market and to educate the
stakeholders in the digital landscape. To achieve these goals, IAB Europe coordinates activities across
the region including public affairs, benchmarking, research, setting standards and best practices.
The member countries are Austria, Belgium, Croatia, Denmark, Finland, France, Germany,
Greece, Hungary, Italy, Netherlands, Norway, Poland, Portugal, Romania, Russia, Slovenia, Spain,
Sweden, Switzerland, Turkey and the UK. Our corporate members include Adobe, Alcatel-Lucent,
BBC.com, comScore Europe, Ernst & Young, Fox Interactive Media, Goldbach Media Group, Google,
Hi-Media-AdLink, InSites Consulting, Koan, Microsoft Europe, Netlog, News Corporation, Nugg.ad,
Nielsen Online, Orange Advertising Network, Publicitas Europe, Sonnenschein, Truvo, Turner/CNN
and United Internet Media and zanox.
For more information, please see www.iabeurope.eu