
Distribution of salt in butter and its effect on bacterial ...
125
Retrospective eses and Dissertations Iowa State University Capstones, eses and Dissertations 1941 Distribution of salt in buer and its effect on bacterial action Wesley Henry Hoecker Iowa State College Follow this and additional works at: hps://lib.dr.iastate.edu/rtd Part of the Agriculture Commons , Food Microbiology Commons , and the Microbiology Commons is Dissertation is brought to you for free and open access by the Iowa State University Capstones, eses and Dissertations at Iowa State University Digital Repository. It has been accepted for inclusion in Retrospective eses and Dissertations by an authorized administrator of Iowa State University Digital Repository. For more information, please contact [email protected]. Recommended Citation Hoecker, Wesley Henry, "Distribution of salt in buer and its effect on bacterial action " (1941). Retrospective eses and Dissertations. 13965. hps://lib.dr.iastate.edu/rtd/13965
Transcript of Distribution of salt in butter and its effect on bacterial ...

Retrospective Theses and Dissertations Iowa State University Capstones, Theses andDissertations
1941
Distribution of salt in butter and its effect onbacterial actionWesley Henry HoeckerIowa State College
Follow this and additional works at: https://lib.dr.iastate.edu/rtd
Part of the Agriculture Commons, Food Microbiology Commons, and the MicrobiologyCommons
This Dissertation is brought to you for free and open access by the Iowa State University Capstones, Theses and Dissertations at Iowa State UniversityDigital Repository. It has been accepted for inclusion in Retrospective Theses and Dissertations by an authorized administrator of Iowa State UniversityDigital Repository. For more information, please contact [email protected].
Recommended CitationHoecker, Wesley Henry, "Distribution of salt in butter and its effect on bacterial action " (1941). Retrospective Theses and Dissertations.13965.https://lib.dr.iastate.edu/rtd/13965

INFORMATION TO USERS
This manuscript has been reproduced from the microfilm master. UMI films
the text directly from the original or copy submitted. Thus, some thesis and
dissertation copies are in typewriter face, while others may be from any type of
computer printer.
The quality of this reproduction is dependent upon the quality of the
copy submitted. Broken or indistinct print, colored or poor quality illustrations
and photographs, print bleedthrough, substandard margins, and improper
alignment can adversely affect reproduction.
In the unlikely event that the author did not send UMI a complete manuscript
and there are missing pages, these will be noted. Also, if unauthorized
copyright material had to be removed, a note will indicate the deletion.
Oversize materials (e.g., maps, drawings, charts) are reproduced by
sectioning the original, beginning at the upper left-hand comer and continuing
from left to right in equal sections with small overiaps.
ProQuest Information and Learning 300 North Zeeb Road, Ann Arbor, Ml 48106-1346 USA
800-521-0000


NOTE TO USERS
This reproduction is the best copy available.
UMI'

DISTRIBUTION OF SAL^T IK BUTTER AND ITS EPPEGT OR BACl'ERIAL AOTIOH
Wesley Henry Hoeoker
A Thesis Subroitted to the Graduate Faculty for th© Degree of
DOCTOR OF PHILOSOPHY
Major Subject Dairy Bacteriology
Approved3
In charge of Major work
Head or Department
Dean of Graduate College
locia State College 1941
Signature was redacted for privacy.
Signature was redacted for privacy.
Signature was redacted for privacy.

UMI Number: DP12758
UMI UMI Microform DP12758
Copyright 2005 by ProQuest Information and Learning Company.
All rights reserved. This microform edition is protected against unauthorized copying under Title 17, United States Code.
ProQuest Information and Learning Company 300 North Zeeb Road
P.O. Box 1346 Ann Arbor, Ml 48106-1346

TABLE GF GOKTEITTS
Pag©
I H T R O D U G T I O K • • « • . • • • • • . . • • • . . . 4
EDCPERIMSKTAL •••••• • • • • » ^ # r * • # 6
Development of a micro method for determination of salt in isutter. • • • • • • • , • • • 6
General method »•••«••••«•*# 6
General considerations ••••••«•• 7
Apparatus and Reagents «««•.••*•• 12
Procediore. « • • « .• • • • • • • « • • . 13
Accuracy of titration* « « • » • « • • • 15
Salt distribution in butter • •>••••••• 17
Historical . • • « • • . • . . • . ... 17
Procedure. • • • « • • • • • • , * • « « 20
H e s u i t s * • » » • • • • » . • • • « » • « 2 1
Hormal commercial butter. . . , • , 21
lormal commercial butter before and after printing. * • « • . • . « 24
Butter worked various amoimts in a commercial churn» » « » • • • • « 27
Abnormal commercial butter* • • . • 30
Mottled commercial butter • . . « • 33
Distribution of salt and molstur»e in butter • • • . • « • • « • • * • 35
% Effect of salt distribution on bacterial action * • • « • • • • • • « • « « • • • • • 42
T72.M

3 -
Historical 42
P r o c e d u r e * • • • « • « ' • » « • • • • • « 4 4
Hesults* • • • • • • • • « • • • « * • • 45
Changes in numbers of organisms in butter# • • • • « » • • • • « • • • 45
Distribution of organisms in salted b u t t e r « « • # • • • • • • » • • » * 5 0
Changes in pH of butter serum • • • 53
Developiaont of defects- in butter, • 58
Organisms added, to cream » • • 59
Organisms added, to cream and . -wash water « » • •»••.«# 61
Organisms added to butter. • • 63
geifforkisig-of"butter. • . • » , 67
DISCUSSIOH OF RESU1S!S. . * . • • • , . . . . . . 69
SUMMARY AHD CONCLUSIONS. ««.••*••••• . » . 73
ACKHOWBEmiiJBHISi . . • • . 78
SEI^CTED BIBLIOGRAPHYr . . . » • • • . • . • • . . 79

DISTRIBUTION GP SALT IK BUTTER AKD ITS EFFECT OH
BACTERIAL ACTIOH
The distribution of salt in butter is of iirtportanoe from
the standpoints of coniposition, color, distribution of mois
ture and deterioration due to the action of micro-organisms#
Previous investigators studied the distribution of salt in
butter from the chemical angle, while the studies reported
herein were imdertaken chiefly to obtain information on the
effect of salt distribution on bacterial action in butter#
The retarding effect of salt on the activity of m^y
micro-organisms Is generally recognized, and various in
vestigators have presented evidence to show that the addition
of salt to butter Improves the keeping qualities. However,
aalted butter sometimes shows spoilage due to bacterial action*
Butter is not a homogeneous mass but consists of an
emulsion of water in fat, the moisture being present in drop
lets which vary from 3 microns to more than 100 microns in
diameter (5, 30)« The nutrients important for bacterial
"growth in butter, as well as the salt and bacterial cells,
are largely included in the serum, whereas the fat is rela
tively resistant to bacterial action# Growth of bacteria in
butter depends to a large extent on the chemical compositicai
of each infected water droplet so that the effectiveness of
- 5 -
salt In preventing bacterial action depends on the extent of
the distribution of salt to all infected water droplets.
Since the average concentration of salt in the serum of
a churning of butter often is sufficient to Inhibit growth
of most bacteria producing spoilage in the product, the
ability of micro-organisms to grow and produce defects in
salted butter suggests that possibly not all of the serum in
a churning contains the same concentration of salt« This
woiild permit growth of bacteria in micro porMms of butter
containing little or no salt, while in oi^r-^portions,
containing higher concentrations, growth would_ be inhibited*
Because of the spoilage of salted butter due to bacterial
action, studies on the distribution of salt in butter and its
effect on bacterial ctic» wor6 made, using a micro technique
for the salt determinations. , The investigation involved the
developmeiit of a micro metliod for determination of salt in
butter, studies on salt distribution in butter and studies
m the effect of salt distribution on bacterial action*

EXPERIMENTAL
DEVELOPMSHT OF A MICRO METHOD FOR DETEHaiNATIOH
SALT IS BUTTER
The mcro methods for the deteminatlon of salt In butter
are adequate for obtaining the average salt content of an
entire churning, but from the bacteriological standpoint such
general information is inadequate. Since butter is not a homo
geneous aaass and organisms coje not uniformly.-distributed through
it, the bacteriological changes in a lot of butter are the
combined results of the changes in nuiieroua aijiall portions#
Accordingly, in studying the effect of salt, distribution in
butter on bacterial action, salt contents of as small porti(His
as possible are desired, and, for this reason a micro pro
cedure for the determination of salt in butter was developed.
General Method
The micro method is carried out as follows^: an approxi-
•Rl'he method of titrating small amoimts of sodium chloride with a very dilute silver nitrate solution was developed by Mp. Clyde L. Ogg wTio used the method on a number of san5>les of butter. The prodedure followed by Mr* Ogg has been modified by reducing the alss of the sample analyzed, by picking the sample under a low power microscope and in other minor respects.

mately 0»2 iag» portion of butter is picked imder a low pot»er
microscope and "weighed on a mlcrobalance. The butter is then
ashed, and the ash and salt are taken up in a water-alcohol
solution and transferred to a spot plate. A knoTOi amount of
standard sodium chloride is added, and, the mixture is titrated
with a standard silver nitrate solution under a fluorescent
type laaap, using dichlorofluorescein as the indicator.
General Gonsiderationa
The butter to be studied was tempered and held at
approsiiaatoly 13°C* for aaiapling# This teH5>erature was low
enough so that the or|LginaX body and texture of the butter
were not changed and yet Mgh enough to alsroid" any great ten
dency for moisttire from the air to condense on the sample^'
A 0.15 mg# saiaple uas considered to be the sinallest sample that N.
could be analyzed without danger of the percentage error for
the analysis being excessive. To minimize the chanic;es of
vfeighing condensate from the air, a freshly exposed surface
was used for each micro san5)le, and the butter -was. broken in
stead of cut so that the original texture at the freshly
exposed surface not chsuaged* The weight of a sample was
determined to -within plus or minus 0.002 lag.
Each day during the weighing of the first, few sangples
of butter the zero point on the balance fluctuated considerably.
Upon Investigating the cause of this, the observation was made

that when tho balance was allowed to stand without use for a
Icmg porlody possibly over night, and then the zero point was
oheoked at frequent intervals» it remained constant as long
as the balance case door was not opened* However, opening
and closing the door of the balance case caused the zero
point to change considerably# The shifting of the zero point
apparently was caused by the differences in temperature and
humidity between the air inside and outside the balance case*
The difficxilty was elixnlnatod by leaving tho door open for
SO minutes before attexrptlng to weigh; tMs allowed the air
inside and outside the balance case to equalize and the balance
to coae to equilibrium under the new air conditions#
In macro analyses of butter, salt ia separated from the
fat by washing the butter with successive portions of warm
distilled water and recovering' the washings containing the
salt# ^his procedure ia not adapted to micro analyses since
it is impossible to transfer quantitatively such small amounts
of liquid as are necessary to avoid greatly reducing the
chloride concentration in the titrating solution; therefore,
a procedure was used in which the butter was ashed and the
ash and salt transferred to a spot plate depression. Blank
determinatioaas shewed that the salt was transferred quantita
tively by the rinsing process eniployed# Apparently the small
amount of salt present was readily dissolved in tho propor
tionally large volume of water used for the rinsing*

*» 9 ••
Potassiian cljropiote, tlie indicator commonly used for tho
argentoiiietric titration of aodiura chloride in macro satsiploa
of butter, is unsatisfactory for the analysis of very small
quantities of chlorides aince the color change at the end
point can not readily be detected* However, various ad
sorption indicators have been suggested for the determination
of halides.
In 1923, Pa Jans and" Haasel (9) published a method for
the argentometric titration of halidesj. using sodium fluorescein
and sodium e OS in as adsorption indicators. Other investiga
tors (10,4,20,21,1) confirmed the work of Fajans and Hassel
by obtaining accurate results jith sodium fluorescein; how
ever, the titration mast be carried out in a neutral, or slightly
alkaline solution, and the chloride concentration must be greater
than 0.005
Later, Solthoff, Lauer and Sunde (22) published a method
for the argentometric titration of chlorides using dichloro-
fluorescein as tho indicator# They stated that "dichlorofluor-
escein is a very suitable indicator for the argentometric titra
tion of chlorides in very dilute as ell as in weakly acid
solutions*** In a semi-micro method for the determination of
chlorides, HBlscher (14) obtained good results with dichloro-
fluoreacein as the indicator^ Baraback and Rider (2), using
this indicator, found that the analytical results on chlorides
were within the experimental error of the theoretical values
on pure chemlcala* Feldman and Powell (11) also reported

10 -
favoral5le results •when diohloroflxiorescein was used in the
determinations of halides in organic compounds#
Bryant (3)^ in 1937, used dichlorofluorescein for the
determination of salt in macro sai3:5>les of butter, Skelton
and Bryant (33) and Weckel (35) compared dichlorofluorescein
and potassiiim chromate as indicators in determining the salt
content of butter# Dichlorofluorescein was preferred as it
has the advantage of producing a distinct and sudden change
in color at the end-point#
Since various investigations show that dichlorofluorescein
is a suitable indicator for the argentometric titration of
chlorides, especially in very dilute as well as in slightly
acid solutions, this indicator was used for the micro deter
mination of salt in butter# It proved to be very satisfactory#
The color change at the equivalence point is due to the
adsorption of the indicator on the surface of the precipitate#
Accordingly, increasing the surface of the precipitate also
increases the intensity of the color (23)# The surface of
the silver chloride precipitate was increased in the deter
mination by adding a known amount of sodi\an chloride to the
solution before titrating vjith silver nitrate#. The amount cf
silver nitrate in excess of the amount necessstry to react with
the added sodium chloride was equivalent to the silver nitrate
which reacted with the sodium cM.oride from the butter#
With proper precautions, the color change of dichloro-
fluorescMn at the equivalence point was distinct# The color

11
cliange is from a yellowiah-brown or ishito to a plnk» The
addition of too large a quantity of indicator gave the solu
tion a rather pronounced brown color vihich persisted during
the entire titration, making the end-point difficult to de
tect# However^ with the proper amount of indicator only a
very slight yellovv color -oas present, and this disappeared as
the cloudy to iwhito silver chloride precipitate formed during
the titration* At this point a localized pink color could bo
developed at the tip of the burebte by discontinuing the
stirring* At the equivalence point the soluticaa turned a
light shade of pink throu^out, and this remained for a short
tixae* If the volume of the solution was allowed to become
too large, the pink color was very JLight and difficult to
detect*
ITien the aoluticai being titrated was allowed to stand
for a short tiiae after reaching the end-point, a dark purple
color developed, due to the decomposition of silver chloride
by light* This reaction is catalyzed by the indicator* The
purple color also xms observed if an excessively long period
elapsed during the titration* Titrating too slowly islth
insufficient stirring caused the silver chloride precipitate
to floculate and settle out, and since the color is pro
duced by the adsorption of the indicator to the precipitate,
a poor - end-point ^as obtained* .For satisfactory results
the solution should be stirred continuously and the titra
tion completed in a reascmable time*

12 -
Titrations woro raado at first with dayllr^ht as the only
aoupco of light, but this vaa not satisfactory since tho
intensity varied ocmsidorahly fron time to tlrao^i In an
effort to control tho intonoity of light, titrations nero
made in a dark room uain/; various sotircos of artificial li^ht,
Taoat of the lights wore not oatiofactoi'y oince thoy contained
too iraich yollow xjhich partially laasked the pink color at tho
end-point. However, the fluorescent light was very satis~
factory since the ll(rht was very nearly colorless and the
end-point in tho titrations was easily detected.
Apparatus and Reagents
Microscope: A Spencer, wide-field, low-power, binocular
Bdcroscqpe, having a ex mgniflcatlon, was used in picking
the portions of butter.
ItHcrobalanco: An Ainsworth raicrobalance (type FDJ) was
earoloyed*
Micro spoons; The micro spoons in which the butter
sauries were weighed and ashed were made by fusing pieces
of platinum foil about 7 mnu in diameter to 24 gauge pla
tinum wires 2,5 cm, in length* The centers of the spoons
wore made slightly concave, and the wires were bent So that
the spoons were level when hanging.
Spot platet The titrations were made in a white por
celain spot plate with depressions 20 ran. in diameter and
5 mm. deep.

- 13 -
Capillary burettes: Capillary burettes •were constructed
and calibrated as described by Johns (IJZ). The volumes con
tained in the burettes over a length of 1 cm, corresponded to
approximately 0,004 ml,, and the flow of the burettes was
controlled to within 1 mm. To eliminate difficulties en
countered in transferring liquids quantitatively due to the
surface tension, the tips of the capillary burettes were
immersed in the liquid being titrated. The titrations were
made under a 15 watt fluorescent Cenco Lablite,
Sodium chloride solution; A 0.01 K, sodium chloride
solution was prepared from reagent quality sodium chloride.
Silver nitrate solution: An approximately 0,01 N,
silver nitrate solution was prepared and standardissed against
the standard aodixim chloride solution, using the niicro titra
tion that was later employed for the analyses. The silver
nitrate solution was kept in a dark bottle covered with
aluminum foil and the concentration checked at frequent
intervals,
Dlchlorofluorescein solution: One-tenth gram of di-/
chlorofluorescfein was dissolved in 60 ml, of ethyl alcohol
(95 per cent) and the volume made up to 100 ml, with dis
tilled water« One ml^i of this solution was then diluted
with 9 ml, of 6thyl alcohol*
ProcedTjr©
From a freshly broken surface an approximately 0,2 mg.

- 14 -
(± 0*05 mg«) portion of butter was picked under the laicroBcope
with a dissecting needle and placed in a weighed micro spoon#
The spoon containing the butter was hung on the pan of the
microbalance and the weight determined to within 0«002 nig.
Ho difficulty "was experienced in weighing the micro samples
except on isarm, humid daysj on such days moisture condensed
on the cool sauiple, and then when the saH^jle was placed on a
relatively warm platinum spoon the temperature rather quickly
increased and the moisture slowly evaporated.
The micro spoon containing the sample of butter v;as
hung on a nichrome wire drawn across the top of a 15 ml;
porcelain crucible* As the crucible was heated slowly v?ith
a micro burner, the butter melted aiid spread in a thin film
over the entire surface of the spprai; no spattering of the
fat could be observed* After the butter had charred, the
heat was increased, the crucible being heated just to redness
until all the carbon had oxidized and only the ash and salt
remained^ With proper spacing of the spoon in the crucible,
the heating coxild bo completed in 5 minutes without loss of
sodium chloride*
The ash and salt were transferred to the spot plate in
which the titration was to be made by placing the spoon in a
drop of water in a depression and Irovering the spoon with
another drop of water. After several minutes the salt solu
tion was Tsashed from the spoon with 3 or 4 drops of water
followed by S or 4 drops of 95 per cent ethyl alcohol. The

addition of alcohol sharpened the end-point and facilitated
removal of the salt solution* The voltime of the solution
was approximately 0.5 ml« and v;as not alloued to become much
greater than this since t^,, color change in the titration «as
more distinct in a relatively concentrated solution.
k volume of 0.01 N. sodium cliloride solution equivalent
to 10 to 12 cm. on the burette scale was added from a capillary
burette. A small drop of dichlorofluoresoein -was added ^ith
a capillary pipette, and the solution was titrated with the
silver nitrate solution. The solution vjas stirred continuously
during the titration, and the first permanent color change was
taken as the end-point. The titrations ?iero made in a dark
room under a fluorescent light.
From the results c£ the titration and the weight of the
sainple, the percentage of salt in the saissjie vsas calculated.
Accuracy of Titration
The accuracy of the titration could not be determined
by analyses on duplicate sauries since butter is not a
homogeneous loass azid duplicate micro samples could not be
obtained# However, the accuracy of the titrations was
checked by titrating a 0.01 N. sodium chloride solution,
using the micro procedure, and expressing the volumes of
the solutions as centimeter divisions on the burette scale.
Table 1 gives the results of eight titrations on the
0.01 Hi sodium chloride solution. The titration values

- 16 -
Table 1. MICRO TITRATIONS ON 0.01 N. SODIUM CHLORIDB SOLUTION
•
Trial; Cm, divisions on burette scale corresponding to vol. of solu.
no* : NaOl solu. : A«5N03 solu.
1 U.O 14.1
2 14.0 14.2
3 14.0 14.1
4 14.0 14.1
5 14.0 14.1
6 14.0 14.2
7 13.0 13.1
8 13.0 13.1
- 17 -
checlced to 1 nmi. on tho "biiretto seal©; this represents
a volume of 0»0004355 ml. of an approximately 0,01 H. silver
nitrate solution. Since the water-alcohol solution of the
ash and salt v/as clear, it is probable that the titrations
made on the butter samples were as accurate as those made on
the salt solution#
SALT DISTRISUTIOI? 3UTTBR
Different investigators have studied the distribution
of salt in butter, using macro analytical methods, in
connection with controlling the con^ositlon of butter and
preventing certain color defects. While the information
obtained with the macro methods is very •usefiil from a number
of angles, it is not adequate from the bacteriological stand
point* In considering the effect of salt distribution on
bacterial changes in butter, the salt contents of as small
portions as possible are desired*
Historical
Guthi'ie and Ross (IS) and Guthrie (12) found that the
composition of butter from some chumings varied considerably
v»ith respect to moistiir©, salt and fat and concluded that
butter •which is thoroughly worked has a more -uniform cougDOsi-
tion than butter which is moderately worked# In connection
with studies on the variability in composition of butter-

- 18 -
from the same churning, Manhart (28) stated, "of the three
non-fatty constituents considered in this investigation, the
curd was the most, variable, the salt next, and the water
least*" A more even distribution of these constituents was
obtained as the working process was prolonged* McDowall
end MacDonald {26}, noted that the extent of salt variation
largely depends on the method of salting, the temperature
and time of working and the type of churn used# As a means
of helping control the composition of butter in a churning,
Mortensen et al. (29) recommended weighing the salt in two
or three lots and distributing each lot.;:,over one-half or
one-third, respectively, of the butter in the churn* Hood
and White (15) found that the salt contents of Canadian
butter from the same churning xraried as much as 0»90 per
cent:. The factors responsible for the lack of xaniformity
in composition were (a) type, slope and mechanical con
dition of the churn, (b) lack of uniform and standard
methods of mantafacture and (c) lack of attention to details.
Early investigators reported that mottles, a color
defect, occurred only in salted butter* As a means of pre
venting mottles in butter, Doane (8) recommended working the
butter sufficiently to thopoughly distribute the salt. McKay
and Larsen (27) found that salt could be present in butter in
an undissolved conditictti without causing mottles, provided
the water in the butter was saturated with salt and the salt
was evenly distributed in the butter.
- 19 -
Van Slyke and HsLPt (34) notod that Tbuttor, free of
iDUttermilk adhering to the outer siirfaces of the granules,
does not produce mottles when ssltod. Irrespective of the
salt distribution# They stated, "Mottles In butter are due,
prlraarlly, to the presence and uneven distribution of butter
milk adhering to the outer surface of the small granules;
and, secondarily, to the hardening and localizing effect of
salt brine upcm the proteld of the buttermilk thus retained
in butter# The light portions of mottled butter owe their
lighter color to the presence of localized proteld (usually
casein lactate)*" Working -with butterfat free of casein,
Samrnis and Lee (31) produced mottles when the salt Tsas
unevenly distributed in an emulsion obtained by churning the
butterfat and water# They entphasized the in^jortance of
thoroughly working butter,
Hunziker and Hosman (16) found that mottles appeared in
salted butter in -which the working was incoinplete and that
the opaque or light portions contained large numbers of very
minute water droplets, while the deeper yellow or clearer
portions contained fewer and larger water droplets. The
addition of salt to butter tended to redtice the number and
increase the size of water droplets; this was due to the
tendency of small moisture droplets to migrate .to moisture
droplets which contained i-elatlvely high concentrations of
salt#
•• 20 ••
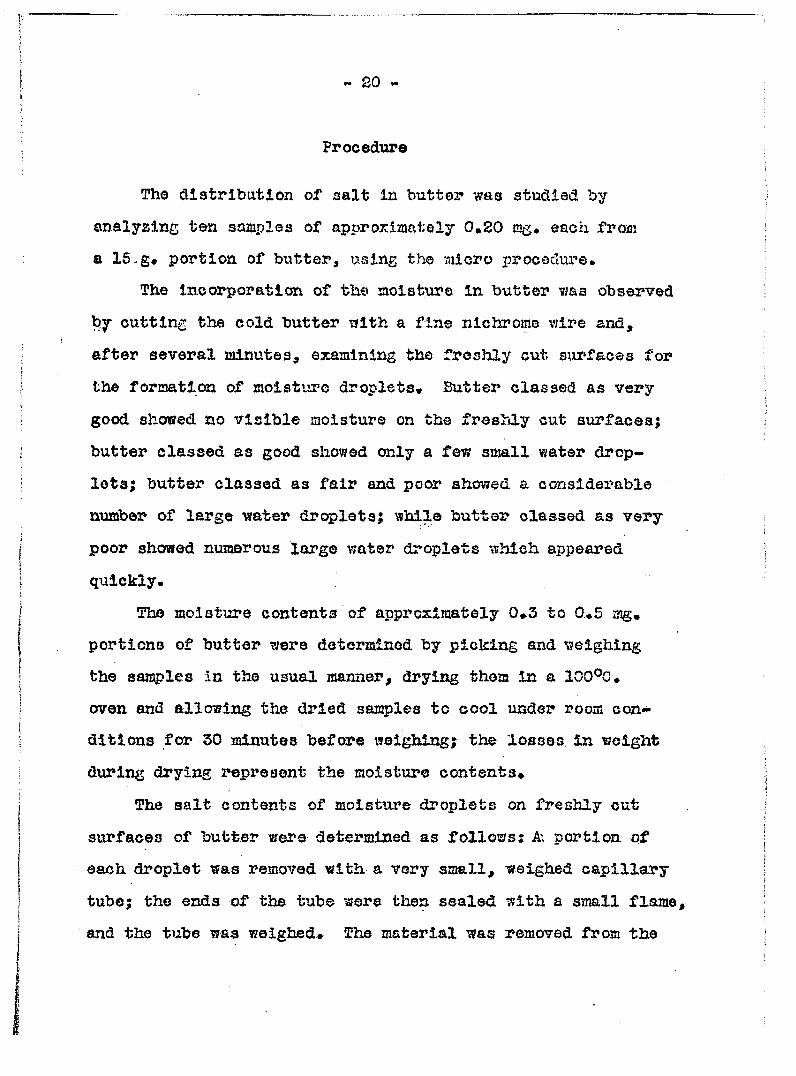
Procedure
The distribution of aalt In butter vfaa studied by
analyzing ten samples of approximately 0.20 mg, each from
a 15-g« portion of butter, using the micro procedure.
The incorporation of the sioisture in butter vma observed
cutting the cold butter with a fine nlchromo v/ire and,
after several minutes, examining the freshly cut s;irfaces for
the foraatlon of moisture droplets. Butter classed as very
good showed no visible moisture on the freshly cut surfaces;
butter classed as good showed only a few smll water drop
lets; butter classed as fair and poor showed a considerable
number of large vfater droplets; while butter classed as very-
poor showed numerous large water droplets whieh appeared
quickly.
The moisture contents of approximately 0»3 to 0.5 mg,
portions of butter 7;©re detormlnod by picking and vieighing
the saajples in the usual manner, drying thoia in a 100®C.
oven and allowing the dried samples to cool under room con
ditions for 50 minutes before weighing; the losses in weight
during drying I'epreaent the moisture contents*
The salt contents of moisture droplets on freshly cut
siirfaces of butter were determined as followsj A; portion of
each droplet isas removed «ith a very small, -weighed capillary
tube; the ends of the tube were then sealed 'with a small flame,
and the tube •ffas weighed^ The material ^as removed from the

- 21 -
capillary tube by crusMng it tslth a small stirring rod in
a spot plate depression containing five drops of water. The
salt concentration of the solution was high enough so that no
additional sodium chloride was necessary* The solution was
titrated with an approximately 0»025 N» silver nitrate solu
tion, using dichiorofluorescein as the indicator.
The sodium chloride contents of macro sanxples of butter
were determined by weighing 5 to 10 g. of butter in a 50 ml.
beaker; 20 ml# of hdt distilled water was added, cmd after
the butter had melted the mixture was transferred to a separa-
tory funnel* The mixture was shaken for several minutes and
allowed to stand until the fat and water had separated; the
water was then drained into an evaporating dish* The extraction
was repeated six times, using 20 ml» of hot water each time.
The salt solution was titrated with an approximately 0,1 H»
standard solution of silver nitrate, using dichiorofluorescein
as the indicator.
Results
Mormal Commercial Butter
The saraples used in studying the salt distribution in
normal commercial butter ware obtained from the usual run
of production of the Iowa State College butter laboratory
and from commercial creameries. They were kept cool so that
the original body and texture were not changed#

The results on thirteen churnings of butter are presented
in Table 2, The distribution of salt varied considerably in
the different sair^jles. Churnings 1 and 2, obtained from the
same creamery, showed the best incorporation of moisture of
any of those analyzed. Wo free moisture was observed on the
freshly cut surfaces, and the salt distribution was very
uniform. With, churning 1 the salt contents of the micro
sainples varied from 2*21 to 2.68 per cent emd with churning
2 from 2.30 to 2.68 per cent while the variances of the salt
contents were 0,0255 and 0.0176, respectively. Churnings
3 and 4 showed only a few small moisture droplets on the
cut surfaces, and with one exception the salt contents of (
the micro sainples were uniform. With churning 3 the salt
contents ranged from 1.77 to 2.50 per cent and with churning
4, except for one value of 4.11 per cent, they ranged from 1.77
to 2«22 per cent; the variances of the salt contents were
0.0461 and 0.4975, respectively. Churnings 5, 6 and 7 showed
numerous small water droplets, but the salt distribution was
fairly \miform, the salt ccmtents varying from 1.87 to 2.39
per cent, from 2.05 to 3«25 per cent and frran 1.47 to 2.47 par
cent, respectively. Th^ variances of the salt contents were
0.0346, 0.1206 and 0^1410, respectively. Churning 8 was
mottled and contained numerous small water droplets. The
salt contents of the micro san5)le8 ranged from 1.56 to 8.52
per cent and the variance of the salt contents was 3.8594»
Churnings 9, 10 and 11 showed large moisture droplets and

- 2 3
Table 2. SALT DISTRIBUTION IN NORMAL COMMSHOIAL BUTTER
:Condltlon of butter NaCl.: GhUTnlngtH20 die- : :xaaoro iL NaGl in mloro sample i
II
1 Tery good 2.53
E A
2.40
•
2.21
«L.
2.27
• —T.
2.48 2.53
E W
2.26
•
2
2 Tory good 2.55 2.48 2.63 2.36 2*30 2.42 2»40 2
3 good 2.35 2,50 1.77 2.18 1.83 2.14 2.17 2
U «ood 2.20 1.94 1.06 1.81 1.77
5* fair 1.93 2.09 2.27 2,27 2.06 2.39 1.89
6 fair BL. *%ottled 2.21 2.46 2.26 2.36 2.36 2.17 2.19
« fair ' 2.43 2^47 1.73 1.59 1.47 2.44 1.51 <1
8 fair mottled 2.81 J
2.7|6 1.07 __1.56 2,93 e.52 ?.?o S
9 poor 2.04 0.90 1.40 1.17 1.21 1.90 0.80
10 poor 2.18 2.54 2.62 1.74 2.37 2.02 2.1? / i
11 poo? 2.35 2.20 2.16 2.48 2.10 .2.79 3.26
12 •ery poor 1.7L 1.2L 1.^8 2.16 1.69 1^.32 1.86
13 •ery poor 2.10 3.49 . 2.07 4.05 1.87 2.77 2.32 4
* *» Printed butter. ** si. » slight*


DISTRIBPTION IN NORMAL GOMMEROIAL BUT!gER
iCl, I ------------------- ^ — • • : ro t' ^ NaGl In micro sample no. :Varlanoe LOd : i : 2 t 3 : 4 : 5:6: 7 : 8 ; 9 : Ty:
>3 2.40 2.21 2.27 2.48 2.-53 2.26 2.48 2.46 2.65 2.68 0.0255
>5 2.48 2.63 2.36 2.30 2.42 2.40 2.55 2.6? 2.53 2.68 0.0176
>5 2,5P 1.77 2.18 1.83 2.14 2.17 2.09 1.90 1.92 1.98 0.0461
^0 1.77 1,94 1.Q6 2.22 1.81 1.77 4.11 1.98 2.11 1.81 0.4975
>3 2,09 2.27 2,27 2.06 2,39 1.89 2.30 2.01 2.31 1.87 0.0346
a 2.46 2.26 2.36 2.36 2.17 2.19 3.26 2.05 2.06 2.28 0.1206
I,3' 2V47 1.73 1.59 1.47 2.44 1.51 2.13 1-80 2.16 2.19 0.1410
il 2.76 1.07 1.56 2.93 8.52 3.50 2.48 2.62 2.51 2.44 3.8?%
)4 0^90 1.40 1.17 1.21 1.90 0.80 1.53 1.64 0.70 1.22 0.1458
l8 2.54 2.62 1.74 2.37 2.02 2.1? 2.58 3.42 3.17 2.97 0.2690
J5 2.20-2.16 2.48 2.19 2.79 3.26 3.01 2.97 2.1> 1.68 0.2503
^4 1.24 1.48 2.16 1.69 4.32 1.86 2.82 1.99 1.82 2.16 0.7628
LO 3.49 2.07 4.05 1.87 2.77 2.32 3.80 2.64 3.46 2.44 0.5751
II.


- 24 -
the salt distribution vas not aa imiform as In the more
thoroughly worked butter. The percentage of salt In the
micro sainples varied from 0.70 to 1.90, from 1,74 to 3,42 and
from 1,68 to 3.26, 'espectlvely; the variances of the salt
contents were 0,1458, 0*2690 and 0«2503^ respectively.
Chumlngs 12 and 13 viere very leaky and niunerous large water
droplets quickly appeared Immediately on the cut surfaces;
the salt contents of the micro samples ranged from 1.24 to
4.32 per cent and from 1«87 to 4*05 per cent respectively.
The variances of the salt contents were 0.7628 and 0.5751, re^-
spectlvely*
Normal Coinmerclal Butter Before and After Printing
Studies on the salt distribution in butter both before
printing and after printing with a printer which tended to
rework the butter were made on normal commercial butter
obtained from creameries in Iowa* The moisture regularly was
more thoroughly incorporated in the butter before printing than
after printing*
Data on nine chuminga of butter are given in Table 3.
In churnings 3, 5, 8 and 9 there were practically no differences
in the distribution of salt in the butter before printing anl
after printing; befcxre printing the percentage of salt in
the micro sainplea varied from 2*04 to^-.09, from 2.00 tn
3.52, from 1.87 to 2.88 and from 1*92 to 3.69, respectively.

- 25 -
Table 3. SALT DISTRIBUTION IN NORMAL CORMBRCIAL BUTTER BEFORE ANI • «
Giluming: Sample :Moisture NaCl»: :distribution:macro : ^ NaCl in micro sample no.
no. : :in butter rxoethod : 1 : 2 : 3 : 4 : 6 : i
1 B* . A*
very godfl fair
l.e/f 1.77
1.71 1.96
2.02 2.15
1.90 1.71
2.15 2.50.
2.03 1.71
1.88 1.61
2. 2.
2 B A
r
good fair
2.6V 2.40
2.44 2.03
2.10 2.29
2.05 2.41
2.15 1.52
2.52 2.32
2.20 1.50
2, 2,
3 B A
good very poor
2.76 . 2.58
2.62 2.43
2.04 2-??
2.41 2.98
2.17. 2.49
2.18 2.68
2.21 ?.35
3. 2.
k B A
fair poor
2.09 2.28
1.90 2.02 2.60
2.35 3.04
1.99 2.32
1.80 2*??
1.90 2.05
1.
5 B A
fair poor
2.55 2.56
2.61 2.77
2.06 2^52
2.22 2.52
2.29 1.94
2.61 2.28
2.94 1.9?.
2. 3.
6 B A
fair T300r
2.65 2.58 .
:i.27 .2.49
3.50 2.??
2.57 2.89
3.86 2.63
2.20 2.50
2.25 2.80
2. 2.
7 B A
fair -poor
2.58 2.36
2.40 2.66
i2.62 2.44
2.64 2.41
2,72 2.00
2.56 1.89
1.53 2.??
4i 2,
8 B A
poor poor
2.41 2.21
1.87 1.63 .
2.08 2.46
2.30 1.74
1.88 1.65
2.88 1.89
1.91 l.?7
2. If
9
B A
poor very poor
2.53 2.39
2.48 2.40
1.92 2.53
2.48 2.38
2.58 2.20
2.52 2.37
2.64 1.98
2,
*B « Before printing; » After printing.


rTION IN NORMAL boMMERCIAL BUTTER BEFORE AM) AMTiK PRINTING Cl,: •0 : H NaCl in micro sample no. Variance lOd : 1 : 2 : 3 : 5 : 6 : 7 : 8 : 9 : 16
•4 7
1.71 1.96
2.02 2.1?
1.90 1.71
2.15 2.50.
2.03 1.71
1.88 1.61
2.08 2.26
1.88 1.88
1.82 1.96
1.88 2.81
0.0175 0.1449
4 .0
2.44 2.0?
2.10 2.29
2.05 2.41
2.15 1.52
2.52 2.32
2.20 1.50
2.66 2.29
2,32 2.02
2.25 1.79
2.36 2.07
0.0377 0.1071
'6 . :8
2.62 2. 04 2.??
2.41 2.98
2.17 2.49
2.18 2.68
2.21 3.09 2.89
2.44 2.21
2.26 2.83
2.37 2.87
0.0899 0.1069
>9 18
i.90 ?'?4
2.02 2.60
2.35 3.04
1.99 2.?2
1.80 2.55
1.90 2.05
1.98 3.30
2.09 2.54
2.02 3.80
2.27 2.4?
0.0283 0.3280
15 16
2.61 2.77
2.06 2^52
2.22 2.52
2.29 1.94
2.61 2.28
2.94 1.93-
2.45 3.76
3.52 2-5?
2.39 3.23
2.00 2.?9
0.2042 0.3081
>5 '} $ ,
i.27 ,2.49
3.50 2.?9
2.57 2.89
3.86 2.63
2.20 2.50
2.25 2.80
2.82 2.03
2.47 2.08
2.63 2.2?
3.58 2.?5
0.3516 0.0799
18 2.40 2.66
^.62 2.U
2.64 2.41
2.72. 2.00
2.56 1.89
1.53 2.5?
4.36 2.06
2.85 2.46
2.38 2.25
2.47 0.4889 0.0755
hi >1
1.87 1.63
2.08 2 • 46
2.30 1.74
1.88 1.65
2.88 1.89
1.91 1.?7
2.05 1,85
2.58 2.42
2.18 2.??
2.64 1.90
0.1255 0.1373
>3 2.48 2.40
1.92 2.53
2.48 2.38
2.58 2.20
2.52 2. 37
2.64 1.98
2,05 3.76
3.06 2.11
3.69 2.;j2
2.90 2.26
0.2535 0.2427
printing.


"• 26
while after printing the percentages varied from 2»21 to S«35,
from 1*93 to 3.76, from l,gl7 to 2.55 and from 1«98 to 3,76,
respectively* The variances of the salt contents of the butter
before printing were 0.0899, 0.2042, 0.1255 and 0.2535,
respectively, while after printing the variances were 0.1069,
0.3081, 0.1373 and 0.2427, respectively.
In churnlngs 1, 2 and 4 the salt distribution Tsaa slightly
more uniform in the butter before printing than after printing;
before printing the percentages of salt in the micro sajt^jles
ranged from 1.71 to 2.15, from 2.05 to 2.66 and from 1.80 to
2»35, respectively, while after printing the percentages ranged
from 1.61 to 2.81, from 1.50 to 2.41 and from 2,05 to 3.80,
respectively. The variances of the salt contents before print
ing were 0.0175, 0.0377 and 0.0283, respectively, and after
printing they vere 0.1449, 0.1071 and 0.3280, respectively.
In chtamings 6 and 7 the distribution of salt was less
unlfdnn In the butter before printing than after printing^ before
printing the salt contents of the micro sauries ranged from
2.20 to 3.86 per cent and from 1.53 to 4»36 per cent, respect
ively, while after printing the salt contents ranged from 2.03
to 2.89 per cent and from 1.89 to 2.66 per cent, respectively.
The variances of the salt contaits before printing were 0.3516
and 0.4889, respectively, and after printing the variances
were 0.0799 and 0.0755, respectively.
In all churnings except 4 and 5 the salt content, as
determined by the mcro n^ithod, -was higher in the butter

- 27 -
"before printing than after printing.
Butter Worked Various Amounts in a Coigsnercial Churn
Tti© relationship between the amount of isorking and the
salt distribution in butter was studied by removing sait^les
at intervals during the working of commercial-size churnings*
Three sauries were taken from each of churnlngs 1, 2 and 3;
sample 1 was removed early in the working process when the
moisture was very poorly incorporated; sample 2 was removed
when the butter was moderately worked and still contained
numerous large water dropletsj while saiaple 5 was taken after
the working was completed. With churning 3, the working
of the sample removed when butter was finished coimaercially
was continued by hand until the butter was dry and sticky.
In the finished butter from churning 1 the moisture was
poorly Incorporated, large moisture droplets being present,
while in the finished butter from churning 2 the moistiire
was fairly well incorporated. Two saaiples were removed
from each of churnings 4, 5 and 6. With churnlngs 4 and 5,
sample 1 was removed early in the working process when the
moisture was very poorly incorporated, while with churning
6 the first sair5)le was not removed until the moisture was
fairly well incorporated* Sample 2 from each churning was taken
after the working was craapleted. In the finished butter
frcan churnings 4 and 6 the moisture was well distributed.

- 28
while the finished butter from churning 5 was mottled and
contained large moisture droplets* All the samples were
held at 4*^0• for 2 to 6 days before analysis.
Data on the six churnings are presented in Table 4«
In saxople 1 from each of churnings 1, 2 and 5, the salt
•was very poorly distributed and the percentage of salt in
the micro aan^les varied from 0 to 2.53, from 1.65 to 4.61
and from 0.31 to 1.97, respectively. The variances of the
salt contents were 0.8626, 1.1661 and 0.3518, respectively.
In sample 2 from each of churnings 1, 2 and 3, the salt
ccmtents of the micro sauries still varied considerably;
the percentages of salt ranged from 0 to 1.65, from 1.49
to 5#83 and from 0.54 to 3.56, respectively. The variances
of the salt contents were 0.3150, 1.6218 and 0.6876, re-
spectively* In sas^le 3 from each of churnings 1 and 2 he
salt distribution was not very uniform, while In sample 3
from churning 3 the salt was vei»y unifozTnly distributed;
for the three churnings the percentages of salt in the micro
samples of butter ranged from 1.97 to 3.81, from 1.39 to
3.12 and from 1.79 to 2.22, respectively. The vfiLPianoes of
the salt contents were 0.3126, 0.2979 and 0.0180, respectively.
In sample 1 from each of churnings 4 and 5, conspicuous
differences occurred in the salt contents of the micro sao^le a,
the percentages of salt varying from 1.91 to 5.50 and from 0
to 5.25, respectively* The variances of the salt contents
were 1.3757 and 3.5885, respectively. SanQ>le 1 from chui»ning

' 29 -
Table L, SALT DISTRIBUTION IN BUTTER WORKED VARIOUS .AMOtttTTS IN • # : Condition of butter NaOl'; • •
Churning:SampletDegree of :H20 dis- : Color; :maoro • •
no. 2 no. ifworkina :tribution • V: : method : 1 \ ^
1 poor very poor Streaked 0.41 2,02 0.00 0.00 1 2 ' mod era toil, poor wQvy 0.86 1.47 1.65 -1.26
? finished* fair wQvy
2.30 3.25 2.11 3.81
1 poor very poor streaked 1.60 2.04 3; 61 3.74 2 2 moderate. poor 2.15 1.49 3.18 1.69
? finished fair 2.41 1.79 2i88 2.06
1 poor very poor streaked 1.24 1.97 0.34 0.98 3 2 finished fair 2.25 1.98 0.54 1.10
? thorouKh** very dry sticky 2.22 l.?7 2.06 2.12
1 poor very poor streaked 2.11 2.36 5.50 2.48 4 2 finished dry 2.30 2.42 1.46 2.90
• 1 ' poor very poor streaked 1.56 0.00 0.00 3.11 5 2 finished Taoor mottled 2.22 2.15 1.31 2.81
1 moderate fair 2.40 2.80 2.76 3.23 6 2 finished dry 2.40 2.68 2.2? 2.09
* » The working was considered complete from a ooinmeroial standpoint;


D^VABIOUS mo'mTS IN A COMMERCIAL CHURN
3 ••
« •
• « > NaCl In micro sample no • Variance
od • I • 2 • ^ • 4 : § : 6 ^ 7 : 8 • 9 '! 16
I S
2.02 1.47
0.00 1.65 2.11
0.00 1.26 3.81
0.17 1.47 2.73
0.24 0.59 2.79
0.00 0.67 2.76
1.41 1.12 2.89
0.35 0.00 1.97
2.53 0.31
0.41 0.53. 2.23 -
0.8625 0.3150 0.3126
D 5 L
2.04 1.49 1.79
3i6l 3.18 2.88
3.74 1.69 2.06
3.39 2.73 3.12
4.61 4.01 1.71
4.33 3.17 1.93
1.97 5.83 2.38
2.49 2.31 1.39
2.00 2.37 2.62
1.65 2.18 2.12
1.1661 1.6218 0.2979
5 1.97 1.98 i-97
0.34 0.54 2.06
0.98 1.10 2.12
0.31 2.22 1.9^
1.26 2.14 2.11
1.24 1.22 2.06
0.47 1.70 2.22
0.36 3.56 1.79
1.64 1.46 2.17
1.30 2.28 1.88 ,
0.3518 0.6876 0.0180
L D
2.^36 2.42
5.50 1.46
2.48 2.90
4.78 2.91
3.70 2.53
3.37 2.35
2.64 2.54
1.91 1.59
2.94 1.77
3.07 2.46
1.3757 0.2639
0.00 2.15
0.00 1.31
3.11 2.81
< 5.2:5 1.60
4.02 4.26
0.49 1.80
2.64 3.22
0,45 3.05
1,18 2.56
0.16 2.57
3.5885 0.7612
) )
2.80 2.68
.2.76 2.23
3.23 2.09
2.33 2.24
2.83 2.30
2.43 2.36
2.69 2./^l
2.63 2.79
2.38 2.42
2.38 2.23
0.0780 0.0462
Lai standpoint; ** « Working was continued by hand.


« 30 -
6 was removed very late In the working process and the
salt was fairly unlfonnly dlatr3!buted; the salt contents
of the micro saagiles ranged from 2*38 to 2,83 per cent and
the variance of the salt cbnt^ta tvas 0*0780« In saoiple
2 from each of churnlngs 4^ 5 and 6^ the salt was more
uniformly distributed than in sample 1 from each of the
churnlngs; the percentages of salt in the micro samples
of butter ranged from 1«46 to 2#91, from 1«31 to 4»26 and
from 2.09 to 2»79, respectively, and the variances of the
salt contents were 0»2639, and 0»7612 and 0»0462, respectively.
Abnormal Conanercial Butter
The distribution of salt in butter that had developed
abnormal flavors in commercial channels was investigated
with defective butter from different sources,: In many of
the churnlngs the variations In salt distribution were
greater than the usual variatlona encoimtered in normal
commercial "butter, while in other churnlngs the salt dis
tribution was fairly uniform, ,
Table 5 j)B0sonts data on fourteen churnlngs of putrid
butter and on one churning of canned butter which had
developed a gassy condition, Chvimings 1 and 2 showed the
greatest variations in salt distribution; the salt contents
of the micro sangjles ranging from 0.35 to 5,33 per cent and
from 0.52 to 3,82 per cent, respectively; the variances of
the salt contents v/ore l,,99^and 1,1150, respectively.

- 31 -
Table 5. SALT DISTRIBUTION IN ABNOHMAL COMMERCIAL BUT
Churning Defects in butter NaCl,
:macro
• • « ^ NaCl in mioro samTsle n
no. :in3tliod ; 1 : 2 ; 3 : 4 : 5 6 9 •
1 putrid 1.18 0.35 1.08 1.30 1.32 2.31 5.33
2 putrid 1.40 0.86 0.84 0.52 1.25 2.02 3.18
3 putrid 1.27 1.52 0.45 1.25 0.85 0.96 0.36 •
k - DUtrid. mottled 2.41 1.82 1.4^ 1.11 o.?o 0.00 2; 30 •
5 putrid, xaottled 1.76 0.34 1.16 1.35 0.47 1.58 1.12 (
6 putrid 1.61 0.30 0.87 1.14 0.44 3.10 1.29 •
7 1 ( 1 putrid 1.96 1.36 1.84 1.87 1.94 4.28 * t
8 putrid - 1.95 0.89 1.50 2.55 1.60 1.38
? putrid ,2.12 1.14 1.49 1.27 1.85 1.23 ]
10 putrid 1.73 1.19 3.17 1.15 2.39 1.69 J
11 putrid 3.25 2.04 1.69 2.45 1.97 1.73 f A
12 Dutrid 2.28 2.28 1-7? 1.82 2.17 1.60 r «
13 putrid 1.89 1.84 1.84 1.65 •1.34 2.59 1.57 ]
14 putrid, dark sr^as 0.65 0.46 0.42 0.53 0.57 1.06 0.44 C
15* unclean, gass^ 1.59 2.06 1.65 1.49 1.41 1.49 1.47 ]
* » Cazmed butter.
I

I •

3TRIBUTI0N IN ABNORMAL COMMERCIAL BOTTIffl
'i NaOl in mioro 8amvle i 3 I k I 6
no* T 9 : 16
Variance
0.35
0.86
1.52
1.82
1.08 1.30 1.32 2.31 5.33 2.24 1.00 0.70 2.16 1.9990
0.84 0.52 1.25 2.02 3.18 1.62 3.82 1.2? 1.57 1.1150
0.45 1.25 0.85 0.96 0.36 1.93 3.22 0.75 0.78 0.7272
1.45 1.11 0.50 0.00 2.30 1.21 0.34 0.30 1.97 0.6264
0.34
0.30
1.96
1.16
0.87
1.36
.0^81
1.35
1.14
1.84
1.50
0.47
0.44
1.'87
2.55
1.58
3.10
1.94
.1.60
1.12
1.29
4.28
1.38
0.23
1.82
2.31
3.26
0.38
0.90
1.44
1.42
1.08
1.55
2.68
0.15
0.65
2.00
0.3075
0.6547
0.6931
0-5174
2il2
1.73
3.25
2.28
1.14
1.19
2.04
2.28
1.49
3.17
1.69
JLiZL
1.27
1.15
2.45
1.82
1.85
2.39
1.97
2.17
1.23
1.69
1.73
1.60
1.51
1.57
2.19
2.05
1.99
1.95
1.39
1.96
1.75
1.97
1.87
1.80
1.92
1.86
1.89
0.1200
0.3444
0.2613
0.0561
1.84
0.46
2.06
1.84
0.42
1.65
1.65
0.53
1.49
1.34
0.57
1.41
2.59
1.06
1.49
1.57
0.44
1.47
1.93
0.51
1.34
1.60
0.37
1.43
1.76
0.76
1.46
1.31
0.66
1.73
Oil312
0.0423
0.0447

I I

32 •
Ch'urnings 3, 4, 5, 6 and 8 showed relatively large variations
in salt diatributirai^ and ^Jith eacJi cliuming one or more mioro
samples had salt contents of leas than 1 per cent. The per
centages of salt in the micro samples varied from 0,S6 to 3»22,
from 0 to 2»30, from 0.23 to 1»58^ from 0^30 to 3»10, and from
©•89 to 3»26, respectively, while the variances of the salt
contents -were 0.7272, 0.6264, 0.3075, 0.6547 and 0.5174,
respectively^ With churning 7 the salt contents of the micro
isamples were fairly xaiiform with the exception of caie high
value of 4.28 per cent. The salt contents of the remaining
nine samples ranged from 1.36 to 2.00 per cent, and the
variance of the salt contents,, as determined on the ton
micro samples, v?as 0,6931.
In chumings 9, 10, 11 and 13 the salt distribution
was fairly uniformj the percentages of salt in the micro
samples varied from 1.14 to 2»12, frcan 1.19 to 3*17, from
1.39 to 3^25 and fr<»n 1«31 to 2.59, respectively, Tshile the
variances of the salt contents were 0«1200, 0.3444, 0.2613
and 0*1312, respectively.
Churnings 12, 14 and 15 showed the smallest variations
in salt distribution^ The percentages of salt in the micro
samples ranged from 1.60 to 2.28, from 0.37 to 1»06 and
from 1^34 to 2.06, respectively, njhile the variances of
the salt contents were 0.0561, 0.0423 and 0.0447, respectively.
Churning 14 contained very little salt; as determined
with the macro method, the content was 0.65 per cent# Besides

- 33 -
tlie putrid dofoct, ths buttor oontainod dark aroaa cloao to
the aurfaoo due to the grorjth of a black pisnjont producing
organism which V/Mto (36) namod PaoudoTaonas nigrifaoians.
Churning 15 vjas paclcagod in 5 pound tins; gas produced in tho
"butter caused the cans to swell, and the flavor ?/a3 very un-
clean#
Mottled Gosmieroial Butter
Light and dark portions of mottled butter, obtained
from various coinmercial soxxpoes, were analyzed for salt.
Data on four churnings are presented in Table 6#
The light portions generally contained less salt than the
dark portions# Churnings 1 and 2 showed very pronounced
mottling. The percentages of salt in laicro samples picked
from the light portions ranged frcm 0 to 0»49 and from 0»38
to 2*92, respectively, and the average salt contents were
0*22 and 1»50 per cent, respectively; for the dark portions
the percentages of salt ranged from 1.18 to 5»25 and from 2.36
to 4»05, respectively, and the average salt contents were
3»24 and S#22 per cent, respectively.
In churnings 3 and 4 the color defect was much leas
pronounced than in churnings 1 and 2, the butter being
only slightly mottled# The percentages of salt in micro
samples picked from the light portions varied from 0 to
2»34 and from 1.21 to 2»16, respectively, the average salt

- 34 -
' / '
Table 6. ^ SALT DISTRIBUTION IN M0TTL5D COMMERCIAL BUTTER
:Degree NaCl, : -Light portions of butter Churning:of :maoro : % NaCl In micro sample no. : Average % NaC: no. •mottling zmethod : l: 2: 3: 4: 5: 1
1 pronouuoed 1.56 0.00 0.00 0.49 0.45 0.16 0.22 3.11 5
2 pronounced 3.12 0.38 2.21 1.66 2.92 1.35 1.50 2.36 3
3 slight 2.75 0.93 0.95 0.00 1.32 2.34 1.21 1.09 .2
4 Slight 3.03 2.16 1.92 1.91 1.21 1.44 2.2? -2


t '
rSTRIBtJTION IN MOTTLED OOMBilERGlAL BUTTER Light portions of butteF Paris portionB of butter
NaCl in mloro sample no« ;Average aCl in micro sample no. :AveraKe: 1 a ; 3 . 5 : : f T";
0.00 0.49 0.45 0.16 0.22
2.21 1.66 2.92 1.35 1.50
0.95 0.00 1.82 2.34 1.21
1.92 1.91 1.21 1.44
4.02 2.64 1.18 3.24
3.60 4.05 2.64 3.22
2.8? .2.06 2.47 .2.27
2.71 2.96 2.72


35 -
contents being 1*21 and 1»44 per cent, respectively; for the
dark portions the percentages of salt ranged from 1*09 to 2*92
and from 2,27 to 2.96, respectively, and the average salt con
tents Tiere 2*27 and 2*72 per cent, respectively* In churning
3 the micro saxnple containing no salt vas picked from a white
spot in the butter and presumably was a particle of c\ard«
A saxiQ>le of commercial butter that had a color defect
somewhat suggestive of mottles was studied for the salt distri
bution in it# The butter showed dark-colored portions that
appeared as streaks or spots throughout the mass of butter;
they suggested that at some time the butter had become soft
enough so that there was some fat separaticaa# The dark-cola? ed
portions of the buttei* made up only a relatively small part
of the entire volume of butter*
The light-colored portions generally contained more
salt than the dark-oolored portions which is in direct con
trast with the results on the typically mottled butter. The
salt contents of the micro samples picked fr<xa the light-
colored portions ranged from 2*31 to 3*75 per cent, the
average being 3.10 per cent, while for the dark-colored por
tions the salt contents ranged from 0*92 to 2*48 per cent,
the average being 1*70 per cent*
Dlstrlbutl<Mi of Salt and Moisture in Butter
The distribution of salt and moisture was studied on a mi
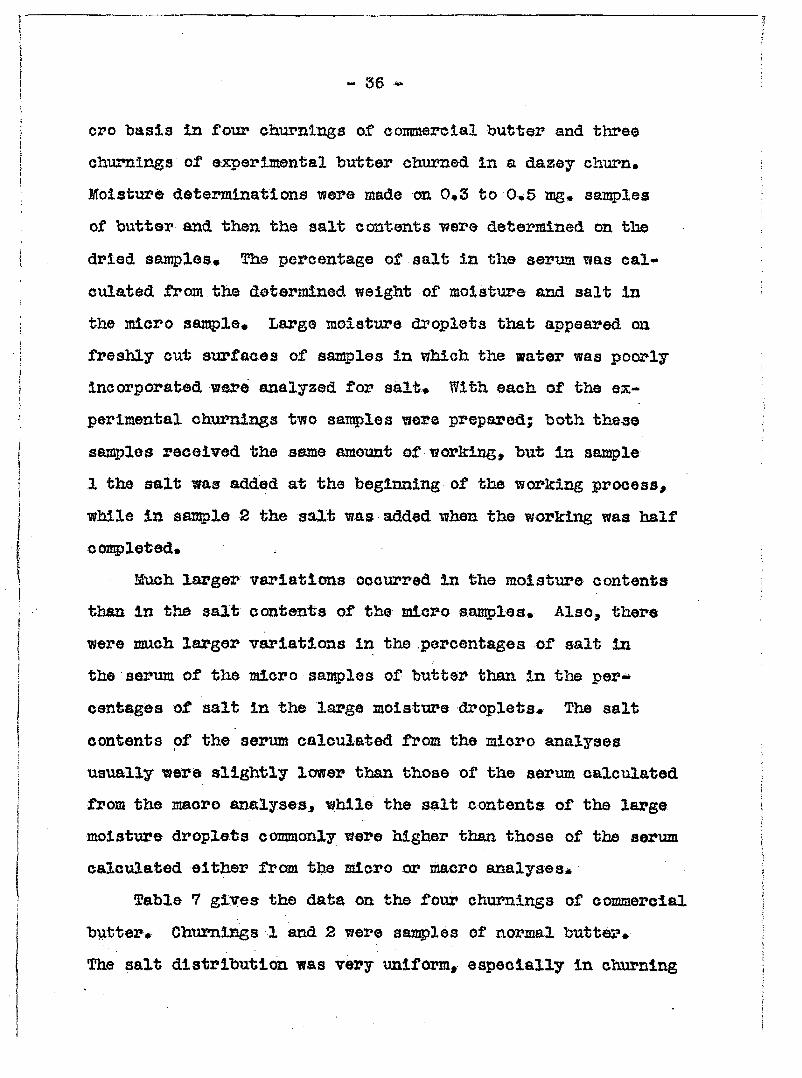
~ 36 ~
cro basis in four churnings of commercial butter and three
cburninga of experimental butter churned in a dazey churn.
Moisture determinations were made cai 0,3 to 0.5 mg, saa^jles
of butter and then the salt contents •were deteriained on the
dried samples. Ihe percentage of salt in the serum T»as cal
culated from the determined weight of moisture and salt in
the micro sample. Large moisture droplets that appeared on
freshly cut surfaces of samples in which the water was poorly
incorporated were analyzed for salt* With each of the ex
perimental chumings two saiEjjles were prepared; both these
saa^les receiwd the same amoTant of working» but in sao^le
1 the salt was added at the beginning of the isorking process,
while in sample 2 the salt was added when the working was half
con?}leted»
Stich larger variations occurred in the moisture contents
than in the salt contents of the micro saniplea. Also, there
were amich larger variations in the .percentages of salt in
the serum of the micro samples of butter than in the per-*
centages of salt in the large moisture droplets* The salt
contents of the serum calculated from the micro analyses
usually •were slightly lower than those of the serum calculated
from the macro analyses^ while the salt contents of the large
moisture droplets commonly were higher than those of the serum
calculated either from the micro or macro analyses*
Table 7 gives the data on the four churnings of commercial
b^utter# Chtimings 1 and 2 were saaiples of normal butter*
The salt distribution was very uniform, especially in churning

- 37 -
Table 7. SALT AND MOISTPRS DISTRIBUTION IN C0L1MERCIAL BUTTER
Cliumlng:Desorlptlon: Compounds :]ffiaoro I « • Mi( no. :of butter : determined :sample : 1 : 2 ; 3 ; 4 !
1 < 1 1
normal NaCl in butter* ^ •H^O in butter, % NaCl in serumir ^
2.53 16.25 15.55
2.65 16.5 16.1
2.64 29.8 8.7
2.96 16.8 17.6
2.70 14.5 18.0
2 _ normal NaCl in butter, H2O in butter, % NBCl in serum. %
2.82 16.40 17.20
2.85 18.4 15.5
2.83 16.6 17.0
2.84 24.4 11.6
2.95 19.7 14.9
3 putrid NaCl in butter, % H2O in butter, NaCl in serum.
0.65 16.49 3.95
0.46 19.4 2.3
0.42 23.8 1.7
0.53 23.1 2.2
0.57 19.6 2.9
4 canned, fisssy
NaCl in butter, H2O in butter, RaCl in serum^
1.59 14.53 10.93
2.06 25.4 8.1
1.65 15.4 10.7
1.49 24.2 • 6.2
1.41 17.8 7-9


J IN CORMERCIAL BUTTER
Micro sample no^ :Varla noe : 2 : 3 : 4 : 5 : 6 : 7 : 8 : Q • : 10 •
•
2.64 29.8 8.7
2.96 16.8 17.6
2.70 14.5 18.0
1 2.7d 15.2 17.7
2.56 17.2 14.9
2.26 18.6 12.1
2,27 23,4 9.73
2.93 16.9 . 17.5
2.51 17.4 14.5
0.0569 21.1979 11.8043
2.83 16.6 17.0
2.84 24.4 11.6
2.95 19.7 14.9
2.84 17.0 16.1
3.26 20.8 15.6
2.85 16.9 16.8
2.86 18.6 15.4
3.14 16.1 19.5
3.04 19.1 15.9
0.0230 6.1582 3.8845
0.42 23.8 1.7
0.53 23.1 2.2
0.57 19.6 2,9
1.06 16.8 6.2
0.44 15.9 2.7
0.51 15.6 3.2
0.37 19.0 1.9
0.76 16.9 4.4
0.66 15.0 4.3
0.0423 9.3765 1.9956
1.65 15.4 10.7
1.49 24.2 • 6.2
1.41 17.8 7-9
1.49 14.5 10.3
1.47 18.7 7.9
1.34 12.8 10.4
1.43 21.8 6.6
1.46 13.4 10.9
1.73 21.3 8.1
0.6447 20.3S45 2.9943


2. The salt contents of the micro samples ranged from 2*26
to 2»96 per cent for cimrning 1 and from 2»83 to 3,26 per
cent for churning 2, and the variances of th® salt contenta
were 0.0569 and 0.0230, respectively. With chumlns 1 larger
variations occtirred In the percentages of moisture In the butter
and In the percentages of salt in the aeriaa than islth churn
ing 2. The moisture contents of the micro sainplea ranged
from 14.5 to 29.8 per cent for churning 1 and from 16.1 to
24.4 per cent for churning 2, the variances of the moisture
contents being 21.1979 and 6.1582, respectively. The salt
contents of the serum ranged from 8.7 to 18.0 per cent for
churning 1 and from 11.6 to 19.5 per cent for churning 2j
th.e variances of the salt contents were 11.8043 and 3.8845,
respectively.
Chumings 3 and 4 were samples of coiamercial butter thiat
developed abnormal flavors? part of the data on these churn-
ings also are included in Table 5. The salt distribution in
the butter -was fairly unlforraj the salt contenta of the micro
samples varied from 0.37 to 1.06 per cent and from 1«34 to
2.06 per cent, respectively, and the variances of the salt
contents were 0.0423 and 0.0447, respectively. The variations
in the moisture contenta of the chumings ware v?lthin the
range of the variations occurring in the nOTmal commercial
butter. The moisture contents of the micro samples of
butter ranged from 15.0 to 23#8 per cent \aith chiirning 3 and
from 12.8 to 25.4 per cent -with chorning 4; the variances of

- S9
the moisture contents were 9*3765 and 20*3845, respectively.
The salt contents of the serum In the micro samples vore
relatively uniform for both ohumings; the values ranged
from 1*7 to 6«2 per cent with churning 3 and from 6*8 to
10«9 per cent -with churning 4 and the variances of the salt
contents tvere 1*9956 and 2*9945> respectively*
Table 8 contains the data on the three churnings of
experimental butter* The salt distribution vas fairly uni
form in san^le 1 from each of churnings 1, 2 and S; the per
centages of salt in the micro samples ranged from 1*54 to
2*25, fX^om 1«21 to 2*34 and from 1*48 to 2*19, respectively,
the variances of the salt contents being 0*0443, 0*1075 and
0*0422, respectively* In sample 2 from each of churnings 1,
2 3 the salt tias poorly distributed; the percentages
of salt in the micro sanities of butter varied from 0*62 to 2*12,
from 0*65 to 3*89 and from 0*70 to 3*18, respectively, and
the variances of the salt contents were 0*2385, 0*7547 and
0*6999, respectively*
The moisture contents of the micro san^jles from churning
1 varied more vhen the salt was veil distributed (Sairrale 1)
than when it was poorly distributed (Sasqple 2)* With
churning 2 the largest variations in the moisture ccaitents
of the micro sauries occurred when the salt was poorly dis
tributed (Sample 2), the moisture content of one saiaple being
only 2*5 per cent* With churning 3 no appreciable difference
was noted between the moisture distribution in samples 1 and

. Table 8, SALT AMD MOISTURE DISTRIBUTION IN EXiPERIMBMTAL BlTTTgR • • { Salt •
« • •
t «
Churning:Sample:distribution t GompoundB :Maoro •
: 3 : no. : no* ; in butter : deterained :sample : 1 : 2 : 3 :
• t ' , NaCl in butter, io 1.70 1.86 9>4
1.54 1.74 1 good HgO in butter, ^ 13.58
1.86 9>4 18.6 26.2 ;
NaCl in serum, 5^ 12.52 19.7 ^8.3 6i6 NaOl in butter, 1.47 1.69 1.12 0;65
2 poor H2O in butter, 10.82 16*4 14.3 16-. 8 ; poor NaCl In serum, 13*58 10.3 7.9 3*8 ; NaCl in HoO dxooLefte 20.9 21.2 19.4 :
NeCl in butter, % 1.43 1.54 2.34 1.64 . 1 good H2O in butter, it 13.75 15.7 26.2^ 19*0 :
NaCl in serum, io 10.40 10.0 8.9 8.6 ; 2 . NaCl la butter, 5S» 1.33 T:g6 1.21
2 poor H2O in butter, $ 11.48 22.5 18.8 22.3 poor NaCl in serum, % ^11.59 17.6 9.9 5^5 ' NaCl in Hp'b droplets 20.3 19.7 17.6
UaCl in butter, ii 1.66 2.19 1.84 1.48 1 good S2O 111 butter, ^ ; 14.82 14.1 20.0 22.1 good
NaCl in serum. % 11.20 15.5 9.3 . 6.7 3 NaCl in butter, > 1.79 2.94 3.18 1.23
2 poor H2O in butter, 13.45 18.2 11.8 18.0 poor NaCl in serum, % 16.1 26,B 6.7

I I

IMEKTAL BUTTER
1 Mioro sample no. i : r : 6 T ± icr
tVarianoe
1.54 1»74 1.60, , 1.69 1.75 1.89 1.83 1.54 18.6 26.2 10.3 13.3 27.7 23U 12.8 I6i3 •;8.3 6;6 9;3 12;7 6;3 8.1 14.3 9.4
2.25 33.3 6.8
, 0.044: 66.382: 18*0538
1.12 0;65 1;50 04 62 1.29 2,12 1.18 14.3 16.8 10.0 10.9 12.7 11»1 20.5 7.9 3v8 15;0 5.6 10.2 ' 19.0. 5.8
21.-2 19-.4 21i7 21kl 19*0 20.1 20.8
1.74 0.90 0.2385 13.0 9.8 12.0294 13.4 11.8 22.2218 18.8 19.9 0.9966
2V34 26.22 8.9
18.8 9.9 19.7
1»64 19*0 8*6
22*3 5i5 17.6
1.3^ 130 10. 3
2.5 71.4 19*0
1*55 16.4
1*35 18.3 :
1.99 14.6 12.'
1% • 2.2/ 0.65
1.74 26.0 6.7
24*5 10.1 18.3
1.21 16.1
1.41 23.7
0.1075 22.3646 .11/
"4d(5—kli I?;!? 12.4 20.9 45*6284 14.7 12.0 378.5268 17.5 18.5 2;9010
12.7 10.7 15.7
12.4 18.9 16*5
07i 13.2 4.9 15.0
1.84 1.48 li55 1*90 1.70 20.0 22.1 17.7 15.6 19*5 9.3 . 6.7 8.7 12.2 8.7 3.1^ 1*23 1.00 T7IB 1.79
11.8 18,0 13.7 . 12.9 16.5 26.8 6.7 7.2 '9.1 6.2
1,94 15*4 12*6 "T
1.86 16*5 11*3 "iffr 15*7 12.9
i.90 13*6 14*0
1.93 0.0422 14*6 -8*0188 13*2 7*7396
—d M h 16.0 5*3699 4.4 43*6401
15.1 8*2
1*09 12.0

41
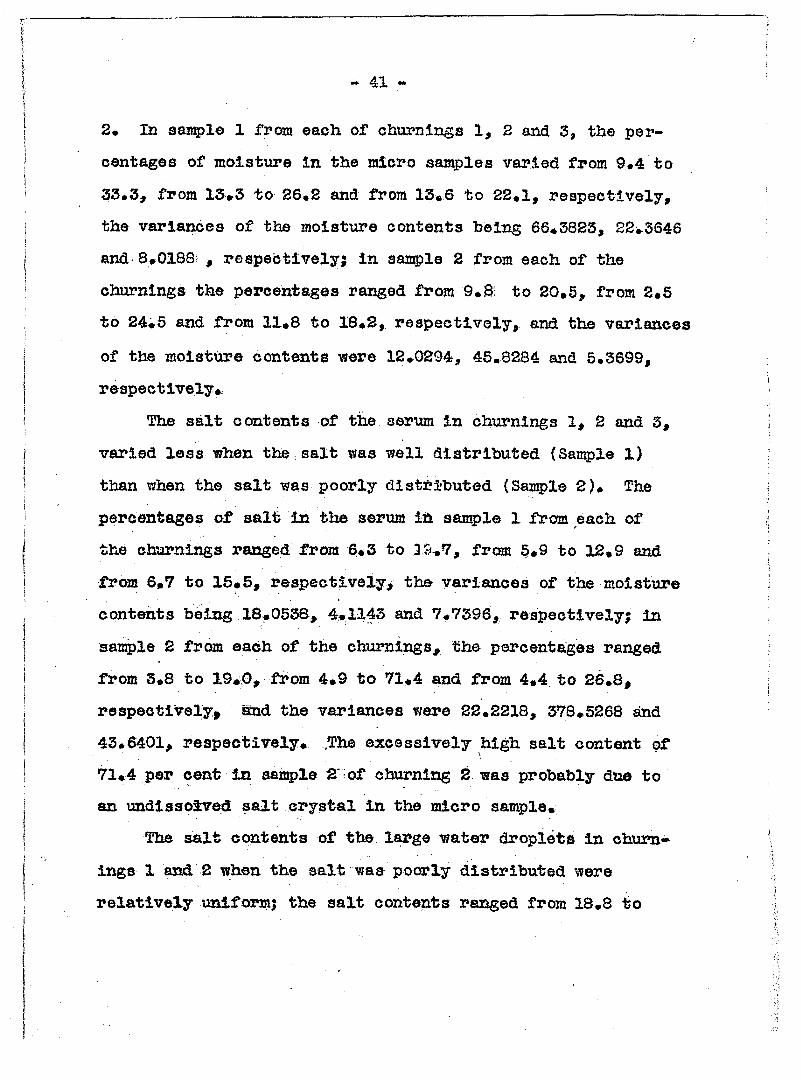
2. In sample 1 from ©aoh of churnlngs 1, 2 and 3, the per
centages of moisture In the micro samples varied from 9.4 to
35»5f from 13»3 to 26«2 and from 13«6 to 22«1, respectively,
the variances of the moisture contents being 66«3823, 22»3S46
and 8»0188i , respectively; in saa^le 2 from each of the
churnings the percentages ranged from 9.8: to 20»5, from 2^5
to 24*5 and from 11*8 to 18*2, respectively, and the variances
of the moisture contents were 12•0294, 45.8284 and 5.3699,
respectively.
The salt contents of the serum in chtzmings 1, 2 and 3,
varied less when the,salt was well distributed (Sample 1)
than when the salt was poorly diatf?i*buted {Sample 2). The
percentages of salt in the serum ill sample 1 from each of
the churnings ranged from 6«3 to 19-.7, from 5.9 to 12.9 and
from 6*7 to 15.5, respectively^ the variances of the moisture
contents being 18*0538, 4*1143 and 7*7396, respectively! in
sample 2 from each of the churnings, the percentages ranged
from 3*8 to 19^0,. from 4*9 to 71*4 and from 4*4 to 26.8,
respectivelyJ Snd the variances were 22.2218, 378*5268 d
43.6401, respectively* .The excessively high salt content of
71*4 per cent in sample 2' of churning 2 -was probably due to
an undissoived salt crystal in the micro sample*
The salt contents of the large isater droplets in churn
ings 1 and 2 when the salt was poorly distributed were
relatively uniform} the salt contents ranged from 18*8 to

- 42 -
21.7 per cent with chiarning 1 and from 15.0 to 20.3 per cent
with churning 2, and the variances of the salt contents •were
0«9966 and 2,9010, respectively,
SFFECT SALT DISTRIBUTION m BACTERIAL ACTIQH
Salt is known to have an inhihitory effect on the growth
of bacteria in butter and to improve the keeping qualities cf
the product. However, bacteriological defects develop in
salted butter in which the average salt content presiamably
is high enough to inhibit the growth of bacteria. This sug
gests that possibly the salt may not be uniformly distributed
in butter showing defects due to bacterial action, and that
sufficient growth of organisms to produce a defect may occur
at points having relatively low salt contents#
Historical
Scharp (32) and Long and Hammer (24) investigated the
growth of bacteria in unsalted butter worked various amounts
and concluded that the growth was influenced by the extent of
the working. They attributed the comparatively low bacterial
activity in the thoroughly worked butter to the finer dis-
porsi<m of the moisture# Other investigators (18, 19) found
that butter containing many small water droplets did not
deteriorate as rapidly as butter containing large water drop
lets and suggested that the additicm of salt may be respon-

- 43 -
alble for tbe formation of larger -water droplets and thus, in
some instancesmay in5>alr the keeping qualities of the butter#
Hmiziker and Hoaman (16) and Boysen (5) presented evi
dence showing that the addition of salt tends to free the
moisture in butter. The Tk»ine solution must be incorporated
during the viorking of the butter. The extent to which the brine
is distributed throughout the butter may greatly influence liie
activity of micro-organisms.
Gulllty and Griffin (7) studied samples of Australian
salted butter in which rabbito, or surface taint, had
developed# They noted that in some defective sanrples the
texture of the butter -was poca? and later found by investiga
ting the manufacturing records that butter from 70 per cent
of the chumings developing rabblto «as poorly worked.
They tentatively concluded that a high salt content and
thoroughly -sorklng of the butter retard the development of
the defect.
Working -with experimental butter churned from cream
inoculated -with Pa. putrefaoiens. Claydon and Hammer (6)
showed that, although salt tended to inhibit the defect,
it was not con^jletely effective unless combined with thorough
working. They suggested that with an irregular distribu
tion of salt the organism can grow sufficiently at the points
having relatively low salt contents to produce the defect.

- 44 -
Procedure
Tho effect of salt distribution on bacterial action
in butter Y;as studied with small laboratory churnings*
Pasteurized, sveet,cream was obtained from the butter
laboratory, held over night at 5^C« and churned in a
dazey chum that had been chemically sterilized* A cul
ture of an organisra capable of producing a change in butter
was added either to the cream immediately before churning,
to the wash water or to the butter# The cream was churned
cold enough so that the butter granules were firm. The
butter was washed with cold, sterile water and worked in
sterile equipments it was worked in one lot until the
free moisture was drained^ after which the butter was
divided and treated as described*
Since various investigations show that the dispersion
of moist\are is an in^jortant factor in the growth of organ
isms in butter, an effort was made to control the moisture
distribution by working all sasplos in a churning the same
length of time, except the sample of poorly worked tmsalted
butter* The extent of the distribution of Bait was deter
mined by the time at which the salt was added to the butter
during the workjjig process* In butter hawing the salt well
distributed the salt was added at the beginning of the
working process and the working continued until the butter
was dry, while in butter having the salt poorly distributed

- 45 -
the salt via.3 added vihen the working process was half completed
and the hutter then worked to dryness. In all salted satipies
1,5 per cent salt was added*
Results
Chanpiea in Nuiabers of OrRsnisms in Butter
The effect of salt and moisture distribution on the
changes in numbers of organisms in butter was studied by
making plate counts, using beef infusion agar and an in-
cubatitaa of 4 days at 21°C* Counts were made on six
churnings of butter. Pasteurized cream was inoculated
immediately before churning with 0#3 per cent of various
milk cultures as follma: With churning 1, Pseudomonaa
fragi; vi?ith churning 2, an unidentified Micrococcus; with
churiiiTCLg Achrcanobaoter lipolyticmn} with choming 4,
Myeotorula lipolyticai and with churnings 5 and 6, Pseu~
domonas putrefaciens* Churnings 1, 2, S, 6 and 6 each
contained two salted and two imsa^ted sauries of butter,
while churning 4 contained three salted and one unsalted sam
ple. The saiig)les of buttOT were held at 15»5°C. and plate
counts were made at intervals of 4 days over a period of
16 days#
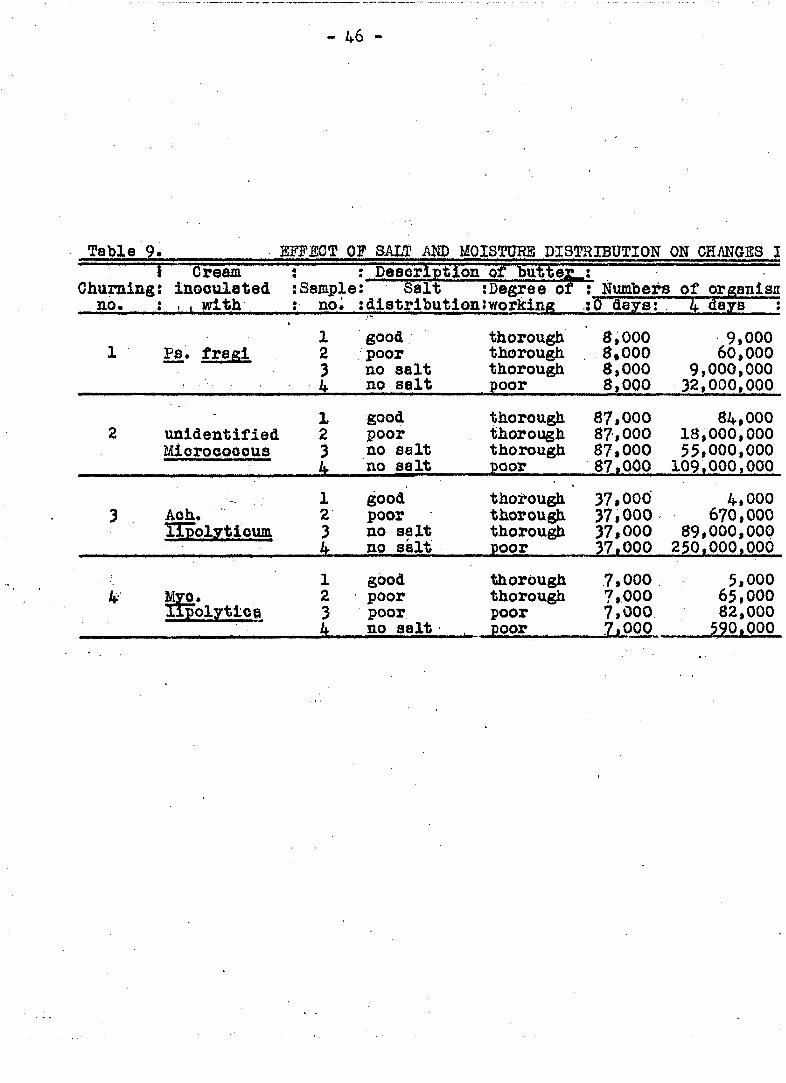
The results on four of the churnings are presented in
Tahle 9« In general, salt retarded the growth of organisms
in the butter, the counts being consistently higher in the
- /4.6 -
Table 9. BFFBGT OF SALT AMD MOISTURE DISTRIBUTION ON CHMGSS 3 i Cream « • : Description of butter •
Churning no.
: inoculated : . , with
:Sample : no^
: Salt ;Degree of :distributionJworkin«
: Numbei^ of organlsn :0 days: 4 days ;
1 Ps. fraal 1 2 3 k
good poor no salt no salt
thorough thorough thorough poor
8,000 8,000 8,000 8,000
9,000 60,000
9,000,000 32,000,000
2 unidentified Miorocooous
1 2 3 4
good poor no salt no salt
thorough thorough thorough poor
87,000 87,000 87,000 87,000
84,000 18,000,000 55,000,000 109,000.000
3 Aoh, llpolytloum
1 2 3 4
good poor no salt no salt
thorough thorough thorough poor
37,000 37,000 37,000 37,000
4,000 670,000
89,000,000 250,000.000
4 Myo. lipolytics
1 2 3 4
good poor poor no salt
thorough thorough poor POOP
7,000 7,000 7,000 7,000
5,000 65,000 82,000 590,000


3TURE DISTRIBUTION ON CHMGS3 IN NDMBSRS OF ORGANISMS IN BUTTER Of butter Degree of t Numbers of organisms per ml. In butter held at 15.5®C. for working :Q days: 4 days : 8 days : 12 days : 16 days
thorough thorou^ thorough poor
8,000 8,000 8,000 8,000
9,000 60,000
9,000,000 32.000,000
2,000 32,000
8,700,000 68,000,000
800 8,000
8,900,000 149.000,000
less than 100 1,000
10,300,000 136.000.000
thorough thorough thorough poor
87,000 87,000 87.000 87,000
84,000 18,000,000 55,000,000 109.000.000
85,000 26,000,000 73,000,000 116,000.000
120,000 21,000,000 65,000,000 79.000,000
150,000 21,000,000 61,000,000 84.000.000
thoirough thorough thorough poor
37.000 37,000 37,000 37.000
4,000 670,000
89,000,000 250.000.000
12,000 1,700,000
118,000,000 134.000.000
14.000 1,700,000
,92,000,000 140.000.000
11,000 1,700,000
103,000,000 131.000.000
thorough thorough poor poor
7,000 7,000 7,000 7.000
5,000 65,000 82,000 590.000
3,000 54,000 86,000
1.600.000
4,000 132,000 144.000
3.400.000
7.000 88,000 250,000
1.300.000


4?7 -
saisiples of •onsalted butter than in the samples of salted
butter.
With churning 1 the butter having the salt well distrib
uted showed a decrease in numbers of organisms during holding,
while the butter having the salt poorly distributed showed a
small Increase in numbers of organisms at 4 days folio-sod by
a decrease during the remainder of the holding# In the sam
ples of unaalted butter there 'aere large increases in numbers
of organisms at 4 days followed by small increases during
the remainder of the holding; the largest increases occurred
in the poorly worked butter. The data on churning 1 are
also presented in Graph 1.
With ohurniiig 2 the butter having the salt well dis
tributed increased in numbers of organisms at 12 and 16 days,
T»hlle the butter having the salt poorly distributed showed
a large increase in numbers of organisms at 4 days with little
change during the remainder of the holding# The sait^jles of
unsalted butter showed large increases in numbers of organisms
at 4 days, a smaller increase at 8 days and little change
during the remainder of the holding, the largest increases
occurring in the poorly worked butter.
With fcharning 3 the butter in which the salt v/as -well
distributed decreased in numbers of organisms during holding,
•while the butter in which the salt was poorly distributed in
creased in numbers of organisms at 4 and 8 days with no fur
ther Chang© dm'ing the remainder of the holding. In the

CO -
D 0 7 U
1 01 & uJ H U
^5
Ii- • -'• O
tn 4
r HJ;.;-:
5 o.
o o J
1
. V/ WOBVlt£_
_yass.3S-£ls®
UNSALTLD, THORC DUGHiy W0T2KED / J
// / /
4/ # Sogtv r.
\ - ' - • ' ' " • "
---dSjD. , ^ _
\
•-m
I€?
Graph 1.
O 4 © \ Z DAY^ DVTTt^ HLLD AT eO'K
EFFECT OF SAIT AND MOISTURE DISTRIBUTION ON CHMGES IN NU1®ERS OF ORGANISMS IN BUTTER

- 49 ~
vjoll worlced, ^msalted butter increases in ntuabers of organisms
occiirred at 4 and 8 days, followed by little or no change dur
ing tho remainder of the holding period; in the poorly worked,
unsalted butter a large increase in numbers of organisms
occurred followed by a decrease, the raaxiiaum count being
obtained at 4 days.
With chxirning 4 three samples of salted bxitter and one
sample of iinaalted butter were prepared# In sample 1 tho
salt was ^vell distributed, in sample 2 the salt ^as added as
usual v!hen the working process was half completed end the
butter then worked to dryness, while in saHQDle 3 the salt was
added at the beginning of the working process and the
working discontinued when the moisture was still poorly in
corporated. T/ith butter having the salt well distributed
no significant change in^numbers of organisms occurred durirg
holding, while with both saiE5)les of butter having the salt
poorly distributed, imcreases in numbers of organisms
occurred, the largest increase occurring in sample 3, In
sample 2 increases in numbers of organisms wore noted at
4, 8 and 12 days followed by a decrease at 16 days, while
in saaiple 3 increases in numbers of cxrganisms occurred dur
ing the entire holding period. In the poorly worked, un
salted butter large increases in the numbers of organisms were
noted at 4, 8 and 12 days, followed by a decrease at 16 days*
Data on chupnings 5 and 6, in which the cream was
inoculated with cultures of putrefaciens are not in
cluded in Table 9* Most investigators that have worked with

- 50 -
this organism appreciate the difficulties encountered in
determining the numbers of organisms by the plate method or
any other procedure, and since the counts that were obtained -
may be misleading the data are not given^ However, the
data indicate that in the salted butter only a very few
organisms were present while the unsalted butter contained
very large numbers of organisms# The maximum counts on
unsalted butter were obtained at 4 or 8 days, after -which
there was a rapid decrease in numbers*
Diatrlbutlon of Organisms in Salted Butter
The effect of the distribution of salt on the numbers
and distribution of organisms in butter was studied with an
adapticm of the Burri smear ciilture technique (25) in which
20 portions of butter from each saa^le were smeared on dry,
beef infusion agar slopes. Also, the numbers of organisms were
studied in large moisture droplets appearing on the freshly
cut surfaces of butter in which the moisture was poorly lh«
corporated, one portion from each of ten moisture droplets
from a san^le of butter being smeared on an agar slope*
The slopes were incubated at 21°C* for 4 days*
3?he distribution of organisms was studied in six ex«
perimental churnlngs and in one commercial churning of butter.
From each of the experimental churnlngs two saitrples of salted
butter were prepared; sample 1 had the salt well distributed

- 51
and sample 2 had the salt poorly distributed. In churninga
1, 2, 4, 5 and § the slopes vsere prepared after the flaVor
defects had developed in one of. the samples from each churn
ing, and in churning 3 the slopes were prepared after the
butter had been held for 5 days at 15*5®C» In chixrnings
1 and 2 milk cultures of Ach* linol3rtlcutn and Ps. putre-
faciens, respectively, veve added to the paateurized cream
iiiffiiediately before churningj in churning 3 a milk culture of
Pa. putrefaclena Tsas added to the Tsator used to v/aah the
butter5 vihile in churninga 4, 5 and 6 milk cultures of Ps^
putrefaciena were added to the butter during the working
process* Sau^le 1 from each experimental chiuming and sam
ple 2 from churning 3 did not develop abnormal flavors.
Sample 2 from chumings 1 and 2 developed off flavors, while
sainple 2 from each of churnings 4, 5 and S developed a
putrid flavor. Churning 7 -was commercial butter, containing
0»65 per cent salt, which developed a putrid flavor.
Data on the seven churnings are presented in Table 10»
In general, the slopes prepared from butter vfith the salt
well distributed contained fewer colonies tlian the slopes
prepared from butter with the salt poorly distributed* With
churnings 1, 2 and 3, both the butter having the salt well
distributed and that hav3jig the salt poorly distributed yielded
very fe-w colonies on the slopes prepared •with portions of
the butter and a large percentage of the slopes showing no
colonies; only one slope contained more than four colonies.

- 52 •
Table 10.
„ i.Qbw.niPfl>MBs urees laooujuitea wixn i j. TT Cream ittooulated with
: Aoh. lipolytleum :SBlt well : ' ' tdiatrlbuted: diatributed
Slope t Portions :Fortions : B2O
TTT Pa. t)titrefaliens
Salt poorly :SBlt well r^eYt poorly :dlstributed: distributed roTttom :Portions
ITeSB £a.
'siialt well :dlstrlbut Portions
1 0 2 0 0 0 0 '0 2 0 0 0 0 0 0 0 3 0 0 0 0 0 0 0 4 0 0 0 0 0 0 0
5 0 3 0 0 0 0 0 6 0 0 0 1 0 0 0 7 0 0 0 0 0 0 1 8 0 0 0 0 0 0 0
9 0 1 0 0 0 0 0 10 0 0 0 0 0 0 0 11 1 0 0 1 0 12 0 1 0 1 0
13 0 1 0 0 0 14 1 0 0 0 0 15 1 3 0 33 0 16 2 0 1 0 0
17 0 1 0 4 0 16 0 0 0 0 0
19 0 3 0 1 1 20 0 0 0 0 0
o*g« over grown.


'mm TSGHaiQUE ON SJU.TI5D SUTTSH
"^ry. 'Hash H2(i Inoculated with • i)** iiiutter inooui^tea witu : 1 I 5. Butter : Ea. treraoiens • Fs. putrefaoiens V: - ' • • • I • Pa. put sSalt w«ll ; 8eIt poorly vSelt well i Salt poorly^ ? :$alt well : :distributed : distributed : distributed : distributed : :distributed: ; Portions .•Portions ; HoQ : Portions :Fortlons ; HgO. Slope : Portions : B: of butter :of butter:droplo ts : of butter :of butter: droplets: no. : of butter :
0 1 0 1 50 0 1 0-0 0 0 3 7 o.fe.*
0, 2 0
0 0 0 2 24 o.fe.*
0, 3 0 0 ?. 0 1 70 .0 4 0
0 1 0 0 19 7 5 0 0 1 0 1 7 o.g. 6 0 1 0 0 3 }0 7 7 0 0 0 0 1 0 4 8 0
0 0 0 2 .1 0 9 2 0 0 0 1 3 125 10 1 0 1 6 31 11 1 0 1 4 0 12 3
0 1 5 8 13 7 0 2 2 22 14 1 0 0 5 2 15 2 0 0 . 2 1 l6 2
0 0 3 12 17 3 0 0 0 4 IS 0 1 0 2 0 19 0 0 1 3 17" 20 3


Churning no« • l}utt«r InoGUlatad wXtJb : 6. Butter^laoouiated «ntli : 7* Putrid
Pa. putref oiena . gs. putrefaolena oomnaroiol It well : Salt! poorly :Salt well i Salt poorly : butter atributedt diatributed tdiatributed: distributed :?ortlona? ortlona f butter
:Fortion8 : R2O : :of buttersdroDletB!
Portions of butter
:i^ortion3 ; tot butter:
M2O ' droclets
: of abutter ^ 2? • :dronlet8
0 11 0 0 0 10 0 V o.g. , 0 30 0 0 0 3 153 o.g. 0 3 0 0 1 4 201 93 0 2 26 0 6 1 0. gi o.g.
0 18 0 4 27 0 o.g. o.g. 0 0 0 0 0 2 o.g* o.g. 0 23 2 0 0 o.gl 142 o.g. 0 6 0 0 U 0
2 0 0 11 0 11 70 o.g. 1 77 0 5 12 o.g. o.g. so 1 0 3 10 27
... 3 5 1 5 167
7 0 2 50 o.g. 1 1 1 o.g. 0. g. 2 0 0 21 151 2 5 0 20 87
3 0 1 16 o.g. 0 e.g. 0 11 o.g. 0 150 0 7 o.g.
3 0 1 6 o.g.


~ 55 -
Thfi slopes prepared from the moisti-ire droplets shotred no
growth of organisms*
Yilitb, oTaurnings 4, 5 and 6, slopes prepared from "bTittor
with the salt -well distributed showed very few colonies, and
a large peroentage of the slopes showing no colonies; only
one slop© showed mOre than seven colonies. Slopes prepared,
from butter isfith the salt poorly distributod showed much
larger mAmbera of organisms and the distribution of the
organisms was irregular; a fe^ slopes contained no colonies
vjhilo t7;o slopes contained so many oolonies that the num
bers could not bo estimated. The slopes prepared from the
moistiire droplets showed a very irregular distribution of
organisms; some slopes contained no colonies while on other
slopes the numbers of colonies were too large to estimate*
In churning 7, the slopes prepared from the butter and
moisture droplets indicated that extensive growth of or
ganisms had occurred in the butter* Growth developed on
all the slopes prepared from both the butter and the mois-
ttu?s droplets, with a large percentage of the slopes con
taining numbers of colonies that vjer© too large to estimate.
Changes in pH of Buttor Serum
The effect of salt and moisture distribution on changes
in pH of butter serum •was studied with butter made from
pasteiarized cream inoculated «ith lactic acid-producing
streptococci just before churning. In cburnings 1, 2, 3 and

•" 54 •"
4 the cream was Inoculated with a butter culture> while In
churning: 5 the cream "was inoculated with a milk culture
of Streptoooccua dlacotllactl3» Chui'nings 1, 3, 4 and 5
each contained two salted and two unsalted samples of butter,
while churning 2 contained three salted samples and one
unsaltod sample. The saa^ples of butter were held at 15*5*^•
pH determinations wore made on the butter serum at intervals
of 4 days, the serum being recovered by centrlfuginG the
melted butter and drawing off the fat; the pH was determined
electrometrlcally, using a qulnhydrone electrode.
Data on the five chumings are given In Table 11. The
addition of salt to butter tended to lower the pH of the
serum. With churning 1 there i»ere no significant differences
in pH of the sertam between butter with good and with poor
salt distribution; a slight increase in pH occurred In both
saaQsles; the pH values increasing from 6.00 to 6»19 and
from 6.00 to 6.14, respectively. In the unsalted butter
large decreases in pH of the serum occirrred, the largest
decrease being in the poorly wOTked butter. Tho pH of the
serum decreased frcan 6.31 to 5.70 in the thoroughly worked
butter and from 6.31 to 5.18 in the poorly worked butter.
With churning 2 small decreases occurred in the pH of tb.e
serum from salted butter, the largest decrease occurring in
the sample with the salt poorly distributed. In the samples
of butter having a good, fair and poor distribution of salt
the pH of the serum decreased from 6.36 to 6»25, from 6.36 to

Table 11. EFFECT OF SALT AMD MOISTURB DISTRIBUTION ON GHAK5ES IN pH OF • • Cream •
• Description of butter • • Churning: Inoculated :Saiaple Salt : Degree of ; pH of serum of no. •
• with : no. distribution : workin#? : 0 days t 4 days
1 %
b;utter oulture H-l
1 2 3 4
good, poor no salt , no salt
thorough thorough thorou^ poor
6.00 6.00 6,31 6.31
6.05 6.06 6.15 5.88
2 1$
hiUtter culture asA
1 2 3 4
good fair poor no salt
thorough thorough thorough thorough
6.36 6.36 6.35 6.90
6.35 6.33 6.30 6.80
3 5^
butter oulture H-l
1 2 3 4
good poor no salt no salt
thorougi; thorough thorough poor
6.16 6.08 6.57, 6.55\
6.12 5.91 6i01 5.45
4 5?5
flutter culture H-2
1 . 2 3 4
good poor no salt no salt
thorough thorou^ thorou^ poor
5«66 5.59 5.57 5.88
5.65 5.56 5.45 5.70
5
5# mllkioulture
of S, cLi50.=.tilactls
1 .2 . 3 4
good poor no salt no salt
thorough thorough thorough poor
5.98 5.88 6.25 6.19
5.96 5.75 5.82 5.09


DISTURB DISTRIBUTION ON CHAmES IN pH OF BUTTER SERUM Description of butter • Salt : Degree of ; pH of serum of butter held et 15«5®Ci for
distribution : workiuK : 0 days t k days : 8 days : 12 days : 16 days
Sood poor 10 salt 1 10 salt
thorough, thorough thorou^ poor
6.00 6.00 6.31 6.31 '
6.05 6.06 6.15 5.88
6.05 6.05 5.95 5.63
6.10 6.10 5.73 5.26
6.19 :6U4 5.70 5.18
500d rair 300r lo salt
thorough thorough thorough thorough
6.36 6.36 6; 35 6.90
6.35 6.33 6.30 6.80
6.25 6.30 6.25 6.75
6.26 6.23 6.09 6.63
jood )oor lo salt, i6 salt
thorougl^ thorough thorough poor
6.16 6.08 6.57^ 6i55\
6.12 5.91 6iGl 5.45
6.16 5.89 5.83, 4i99
6»10 5.82 5.71 4.83
5qod )6or 10 salt lo salt
thorough thorou^ thorou^ poor
5.66 , 5.59 5.57 . 5.88
5.65 5.56 5.45 5.70
5.65 i.58 . 5.41 5.71
5.65 5.55 5.43 5.73
;ood >oor lo salt lo salt
thorough thorough thorough poor
5.98 5.88 6.25 6.19
5.96 . 5.75 5.82 5.09
5.86 5.67 5.12 4.91
5.86 5.61 5.70 5.20
5.85 5.53 5.70 5.16


~ 56 -
6,23 and from 6.35 to 6,09, I'ospectively, in the iinsalted
buttor only a small decrease in pH occurred, tho values
docreasing frciji 6»90 to 6,63.
With chui^ning 3, no significant change occurred in the
pH of serum of butter with the salt well distributed* How
ever, with the isalt poorly distributed there t/as a small
decrease in pH, the values decreasing from 6^08 to 5»a2,
In both the thoroughly v/orked and poorly worked sas^les of
unaalted butter, large decreases occurred in the pH of the
serum, the largest decrease occurring in the poorly r/orked
butter; the pH values decreased from 6.57 to 5.71 and from
6*55 to 4»83, respectively.. The data on churn5.ng 3 are also
presented in Graph 2,
With churning 4, there were no significant changes in
the pH of the serum from the salted sar^-sles of butter, \i?hile
small decreases occurreci in the serums. from th© unsalted
saniples. The pH values decreased from 5.57 to 5.43 in the
thoroughly -worked imsalted butter and from 5.88 to 5.73
in the poorly -worked unsalted butter#
With churning 5, in which the cream was inoculated with
a milk cultTxre of S^, diacetilactis, a small decrease occurred
in the pH of the serum IProm the butter iwith the salt well
distributed, the pH value decreasing from 5«S8 to 5.85j
in butter V7ith the salt poorly distributed larger decreases
occurred in pH, the pH values decreasing from 5.88 to 5.53.

4.75
Dv POOTZLY WOKl<IE.D
(D S.SO
WORKED UN SALT ED,
SALT ADDEP, POORLY D15TK15UTED. g6.00
^1^7' SALT ADDED, WELL; DISTRIBUTED
e.bo
An -v3
p»
6.T5
Graph 2.
- a . : . . . • \ z ' 60'F:
EFFECT OF SALT MD MOISTURE DrSTRIBUTION ON CHMGES IN pH OF BUTTER SERUlVl
J--,:.: .-i• V--.1- r.---V^

- 58 -
In saBiploa of vaiaalted butter large decreases^ follovjod
by IncrdQsos, occurred in tlie pH of the serum# In the
tlioroiiglily "Korked unsclted butter tlio pH values decreaaod
from 6»25 to 5»12 at 8 days and then increaaed to 5«70 at
12 days u'ith no further daange at 16 days, while for the
X^oorly v;orked unsalted butter the pH va3.UGs decreased from
6.19 to 4»91 at 8 days and then increased to 5.20 at 12 days
*ivith no significant cliange at 16 days.
Microscopic examinations were 2iade an the serum of
butter from a number of the churnings# In butter having the
salt -Hell distributed very fats bacterial cells -sere observed,
and the cells appeared singly or in pairs, -ejhile in butter
having the salt pooz^'ly distributed somewhat larger numbers
of cells and a fe'S short chains sere observed. In the san-
ples of unsalted butter large ntmbers of bacterial cells
were present and they often appeared in very long chains,
the largest ntunbers of cells and longest chains occurring
in the poorly -worlsied butter.
Develoment of Defects in Butter
The effect of salt and moisture distribution on the devel«
opment. of defects in butter was studied by holdijig san^ples
of experimental butter at 15.«<5®C*j the sasmles -were examined
at frequent intervals for the defect expected on the basis cf
the organism.;; ;inoculat©d into the pasteurized cream^ the
wash water or the butter*

Qt^fianisms Atlded to Cream,
Kleven churnings of butter were made from pastourlzod
creaia Inoculatcd. inanodlately bcfoi'c chui'jiins v;itli a milk
culture of an orgaiiiam capable of produclJig a defect in
butter; oxcepfc In clim'ninc V YJith which only 0,06 per
cent inoculum vjaa used, 0.3 por cent of the cultiire ivas
added* The organisms inoculatcd were: In churning 1, Pa*
fragi; in churnings 2, 3 and 7, Myc« lipolytica; in churning
6, Ach. lipolyticun; in churainGs 4, 5, 3 and 9, putre-
facions: in chui'ning 10, p£. putrefaciena and Aerobacter
aerogenes; and in churning 11, putrofaciene and Escher
ichia ccli. B'roffi each churning tt;o salted and two unaalted
saB5)leo of butter were prepared.
Results on the eleven churnings are presented in Table
12m In butter with the salt well distributed flavor defects
developed in only two churnings, while in butter with the
salt poorly distributed defects developed in eight churn-
ings* In the unsalted butter all except one churning
developed defects in flavor, the defects developing sooner
in the poca:»ly worked butter tlian in the thoroughly -ft'orked
butter. Usually the flatsor defects wore more pronounced
in the unsalted butter than in the salted butter*
In churnings 2 and 3 all the samples of butter were
very rancid 1 day after churning. In churnings 4 and 11
about the same time was required for the development of
the flavor defects in the salted butter with the salt poorly

Table 12. EFFECT OF SALT AND MOISTURE DISTRIBUTION ON DEVBLOPMliNT OF DEFECTS IN BUTTER
Causative Organisms Added to Cream t • ' • •
Days required for production held at 15.5'C.
of defect in butter
• Salted butter Unsalted butter Churning: no.
• 4
Cream inoculated with: Salt well distributed
: Salt poorly : ; distributed ;
Thoroughly worked
: • •
Poorly worked
1 Ps. frsRi - 6 3
2 Myc. lipolytica 1 1 1 1
3 Myc. lipolytica 1 1 1 1
4 Ps. putrefBciens _ 3 3 2
5 Ps* putrefaciens 4 2 1
6 Ach. lipolyticum • - 4 3 2
7 Myo. lipolytica - 10 8 5
8 Ps. putrefaciens — 4 2
9 PSi putrefaciens - 3 - 1
10 Ps. putrefaciens and A. aeroRenes - - 5 2
11 Ps. putrefaciens and E. coli - 3 3 2
« Indicates no defect developed in the butter during holding period.
61
distributed tlian in. unsalted butter that luas thoroughly vforked.
In churning 9 salted butter with the salt poorly distributed
and the unsalted butter that was poorly worked developed
abnormal flavors while the salted butter with the salt well
distributed and the \3nsalted butter that was thoroughly
worked did not develop abnormal flavors*
OrganisBis Added to Cream and VJash Water•
In twelve churnings of butter comparisons were made on
the effect of salt and moisture distributicai on development
of defects in flavor between butter in which cultures of
Ps« putrefaciens were added to the cream and butter in which
the cultures of putrefaciens were added to the wash water*
The lots of cream were divided in two parts; to one part
0#3 per cent of a milk culture of Ps, putrefaciens was added
to the cream immediately before churning and to the other
part 10 ml# of the milk culture was added to 1 liter of wash
water* Two salted and two unsalted samples of butter were
I>r©pared from each churning*
Table 13 presents data on the twelve churnings* In
butter with the salt well distributed no defects developed
during holding in either the butter madte tram the inoculated
cream or the butter washed with the inoculated water* In
birtter with the salt poorly distributed defects devolved
in three saniJles of butter in which the organisms were added
to the cream, whereas no defects developed in butter in which.

Table I3. EFFECT OF SALT DISTRIBUTION ON DEVELOPMENT OF DEFECTS IN BUTTER
Cultures of Ps. putrefaciens Added to Cream and Wash HoO SSSBSSS9ESflSB9BSBS33SS33SSB8^S99bsCS3^^S^3EE^9S^^S^5ESS^^9&SSSSCS3S!S8SEBSSSSStS3SSGSSS3CSSfiS8CSS958SS3SSSSSBS8E^
Days required for production of defect in butter : held at 15.5®C. : Salted Butter 9 Unsalted butter
Churning: no. : Orj^anisms added to
: Salt well : distributed
; Salt poorly : : distributed- :
Thoroughly worked
: Poorly : worked
1 la
cream wash H9O
- * 5 •M
5 2 2
2 2a
cream wash
- 3 9 5
2 2
3 -1?-
cream wash HoO
- - - 5 5
4 4a
cream wash H9O
- 5 5
2 2
5 5a
cream wash H^O
- - 3 3
2 2
6 6'a
cream wash HoO f
3 k 2 2
- Indicates no defect developed in the butter during holding period.

- 63 -
the cxrgfinlsme were added to the wash water* In the unsalted
butter apparently there was no difference In the development
of defects between the butter made from the inoculated cream
or the butter washed with the inoctxlated water* In the
thoroughly worked unaalted butter defects developed in eight
churnings while in the poorly worked imsalted butter defects
developed in all the churnings; the defects appeared aconer
in tha poorly worked butter than in the thoroughly worked
' butter* In the unsalted butter the defects which occtirred
were more typically putrid than in the salted butter.
In churnings 2 and 6 defects occtirred in the salted
butter with the salt poorly distributed before defects
occurred in the unsalted butter that was thoroughly worked*
In churning 1 salted butter with the salt poorly distributed
and the unaalted butter that was poorly worked developed
defects in flavor, whereas in the xmsalted butter that was
thoroughly worked no defects developed*
Organisms Added to Butter.
Various amounts of inoculum were added to butter saiaples
prepared from ten churnings of pasteiarized cream* Churnings
1 and 2 each contained eight sax!?)les of butter, while the
remaining churnings each contained siz samples* San^le 1
in each chumixig was butter having the salt well distributed
and to which no organisms were added* Sample 2 in each
churning was unsalted butter to which 0*5 ml* of a milk cul
ture of an organism was added* The remaining samples from

- 64 -
each churning were salted and were divided into pairs; in
one sample from each pair the salt Tsas "vjell distributed,
while in the other sample the salt -was poorly distributed#
^o each sample of a pair an equal amount of a milk culture
of an organism was added to the butter early in the working
process# All samples of butter wore thoroughly Tsorked and
at the completion of working the moisttare appeared to be
well incorporated. Except in chiiming 3, In which a
milk culture of an unidentified proteolytic, gram-negative
rod was used, a milk culture of Pa, putrefaciens was added
to the butter.
The data on the ten churninga of butter are presented
in Table 14« In the butter to which no organisms were
iadded, flavor defects did hot appear in any of the chtaraings,
while in the unsalted butter from each chiaming, to which
0#5 ml» of a milk culture of an organism was added, a putrid
defect developed# In churning 2 none of the samples of
salted butter, to which a culture of an organism was added,
developed a putrid defect during holding*
In chumings 3, 6 and 8 the samples of butter with the
salt well distributed developed no defects, whereas in the
butter with the salt poorly distributed defects appe8u?ed only
in the sauries frcaa each churning containing the largest
amounts of inoculum*
In chumings 1, 5 and 7 the samples of butter with the
salt well distributed developed no defects during holding.

- 65 -
Table 14. EFFECT OF SALT DISTRIBUTION ON DSmOPMMT OF DEF?XTS IN BUTTER
Causative Organisms Added to the Butter and Half of the Butter Reworked after Zt aava
:M1. milk oul-: Salt ;ture added :distribution!
; in : Defects
no- inoculated wltJb.2 no. :butter ; butter JButter nc
1 none good none 2 0.5 no salt putrid at 3 0.5 good none
1 Ps. putrefaoiens 4 0.5 poor slightly 1 Ps. putrefaoiens 5 1.0 good none 6 1.0 poor putrid at 7 3.0 good none 8 • 3.0 poor off at 4
1 none good none 2 0.5 no salt putrid at 3 0.5 good none
2 Ps. putrefaciens 4 0.5 poor none 2 Ps. putrefaciens 5 1.0 good none 6 1.0 poor none 7 3.0 good none 8 3.0 poor none
1 none good none 2 0.5 no salt putrid at 3 1.0 good none
3 Unidentified gram- 4 1.0 poor none negative rod 5 5.0 good none negative rod
6 5.0 poor sliffhtly
1 none good none 2 0.5 no salt putrid at
4 Ps. putrefaciens 3 1.0 good none 4 Ps. putrefaciens 4 1.0 poor none 5 3.0 good of 6 3.0 poor putrid at
1 none good none 2 0.5 no salt putrid at
5 Ps. putrefaciens 3 1.0 good none 5 Ps. putrefaciens 4 1.0 poor putrid at 5 3.0 good none 6 3.0 poor putrid at


nSTRIBUTION ON DEVELOPMENT OF DEF3CTS IN HOTTER
Lams Added to the Butter and Half of the Butter
• • :M1« milk oul bait " • I* • • :ture added :distribution? Defects in butter held at 15.5®C. :Sample:to 130 a. : in • • • •
with2 no. :butter ; butter :Butter not reworked ;Butter reworked
1 none good none 2 0.5 no salt putrid at 2 days 3 0.5 good none slightly rancid 4 0.5 poor slightly off at 8 days slightly rancid 5 1.0 good none 6 1.0 poor putrid at 2 days 7 3.0 good none slightly putrid 8 3.0 poor off at 4 days putrid
1 none good none 2 0.5 no salt putrid at 2 days 3 0.5 good none 4 0.5 poor none 5 1.0 good none 6 1.0 poor none 7 3.0 good none 8 }'0 poor none
1 none good none 2 0.5 no salt putrid at 2 days 3 1.0 good none none 4 1.0 poor none slightly off 5 5.0 good none none 6 5.0 poor sliffhtly off putrid 7-1 none good none 2 0.5 no salt putrid at 2 days 3 1.0 good none slightly off 4 1.0 poor none putrid 5 3.0 good sH^itJy off at 9 days slightly off 6 3.0 poor putrid at 6 days putrid
1 none good none 2 0.5 no salt putrid at 2 days 3 1.0 good none none
4 1.0 poor putrid at 7 days slightly off 5 3.0 good none none 6 3.0 poor putrid at 4 days putrid


- 66 -
Table I4. (oontd.) EFFECT OF SALT DISTRIBUTION ON DEV3L0PMINT OF DSFEd
Causative Organisms Added to the Butter and Half of Reworked after 4 Bays
« :M1. millc oul- Salt « •
: :ture added :distribution : Defect Churning ;Sample:to 130 g. : in •
•
no. Butter inoculated withj no. :butter : butter :Butter
1 none good none
6 2 0.5 no salt putrid
6 Ps. putrefaciens 3 1.0 good none . . 4 1.0 poor none
5 3.0 good none 6 3.0 poor putrid
1 none good none 2 0.5 no salt ' putrid
7 ?s. putrefaciens 3 1.0 good none 4 1.0 poor putrid 5 3.0 good none 6 3.0 poor putrid
1 none good none 2 0.5 no salt putrid
8 Ps. putrefaciens 3 1.0 good none 4 1.0 poor none
• 5 3.0 good none 6 3.0 poor putrid
1 none good none 2 0.5 no salt putrid
9 PS'. putrefaciens 3 1.0 good none putrefaciens 4 1.0 poor off at 5 3.0 good off at 6 3.0 poor putrid
1 none good none 2 0.5 no salt putrid
10 Ps. putrefaciens 3 1.0 • good none putrefaciens 4 1.0 poor ' putrid 5 3.0 good putrid 6 ?.o poor putrid

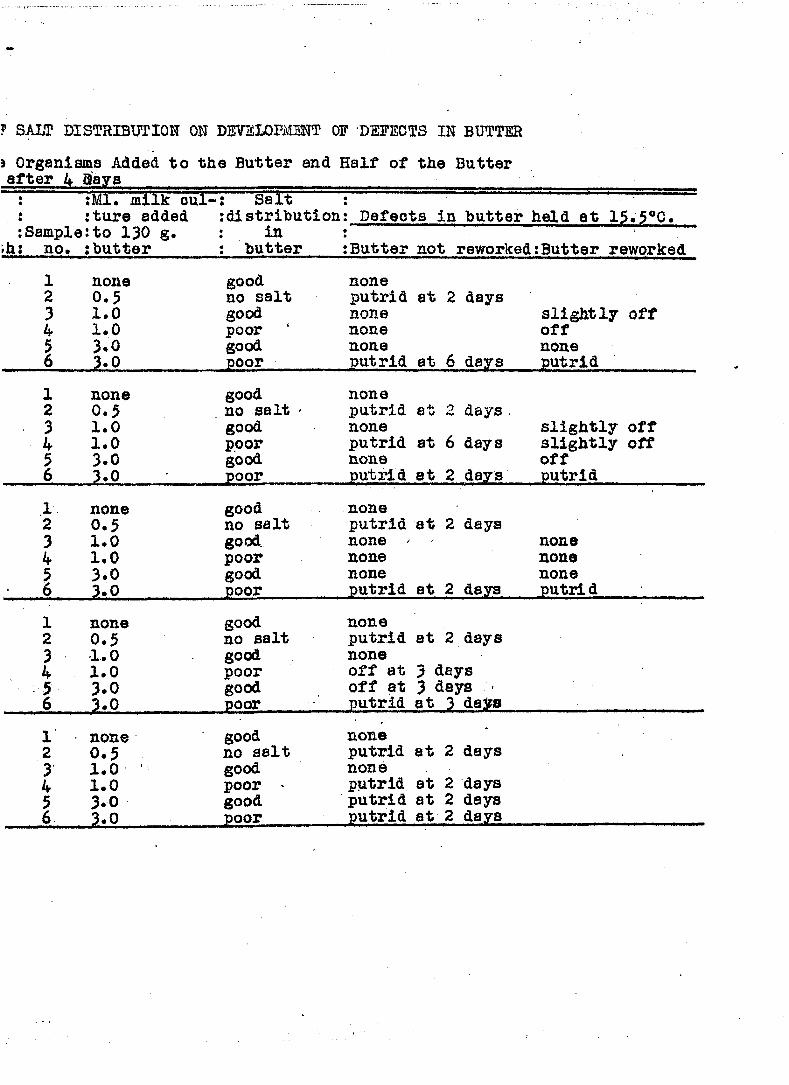
? SALT DISTRIBUTIOH ON DEVELOPMENT OF DEFECTS IN BUTTER
J Organisms Added to the Butter and Half of the Butter after 4 Qays
« :Mi* millc oul-: Salt • •
• • :ture added : distribution : Defeots in butter held at 15.5®C. ;Sample:to 130 g. ; in •
•
>h: no. :butter : butter :Butter not reworked:Butter reworked
1 none good none 2 0.5 no salt putrid at 2 days 3 1.0 good none slightly off 4 1.0 poor none off 5 3.0 good none none 6 3.0 poor putrid at 6 days putrid
1 none good none 2 0.5 no salt ' putrid at 2 days. 3 1.0 good none slightly off 4 1.0 poor putrid at 6 days slightly off 5 3.0 good none off 6 3.0 poor putrid at 2 days putrid
1 none good none 2 0.5 no salt putrid at 2 days 3 1.0 good. none ^ none 4 1.0 poor none none 5 3.0 good none none
• 6 3.0 Door putrid at 2 days putri d
1 none good none 2 0.5 no salt putrid at 2 days 3 1,0 good none 4 1.0 poor off at 3 days 5 3.0 good off at 3 days -6 3.0 BOOT putrid at 3 daSs
1 none good none 2 0.5 no salt putrid at 2 days 3 1.0 ' good none 4 1.0 poor > putrid at 2 days 5 3.0 good putrid at 2 days 6 3.0 poor putrid at 2 days


« 67 -
while in the saiEplea of butter with the salt poorly distri
buted flavor defeots ^lere produced# For churning 1, in
butter containing 1 ml» of inoculum the flavor defect
appeared sooner and the defect was more intense than in
butter containing 3 inl» of inoculum. In butter containing
1 ml* of inoctilum the defect was only slight. For churnings
5 and 7 the putrid defect appeared first in the samples
of butter containing the largest amounts of inoculum*
In churning 4 the butter with the salt well distributed
showed no defect in the sample to which 1 ml» of inoculum
was added, whereas a slight defect developed in 9 days in
the sample to which 3 ml. of inoculum was added. In the
butter with the salt poorly distributed no defect developed
in the saiiQ)le to which 1 ml* of inoculum was added, while
a putrid flavor developed in 6 days la the butter to whiclj.
3 ml* of inoculum was added*
For churnings 9 and 10, in butter with the salt well
distributed defects appeared only in the san^iles of butter
containing 3 ml* of inoculum. In butter with the salt
poorly distributed defects developed in both san^jles of
butter from each churning, the defect being more intense
in the samples containing 3 ml« of inoculum than saii^les
containing 1 ml* of inoculum*
Reworking of Butter*
Four samples were reworked from each of churnings 1,
3, 4, 5, 6^ 7 and 8 described in Table 14* The butter was

•» 68 ••
ooolod to approximately 4®C. and half of oaoh sample reworked
by passing it through a small Universal food chopper two
tlm®8» Before reworking each aairple the food chopper was
placed in boiling v»ator for a f&vt minutes and then cooled
by pouring cold, sterile water over it# The butter was
again held at 15*5%«
The data on the reworking of the butter are also pre
sented in Table 14» With some sanroles of butter reworking
seemed to have no effect on the keeping quality, with other
saqples reworking tended to increase or produce defects,
while with still other samples reworking tended to decrease
the intensity of the defect* In churning 8 the reworking
of the butter did not affect the keeping quality#
In san^les of butter with .the salt well distributed,
in chumings 3, 5 and 6 little or no differences occurred
between the butter reworked and not reworked; whereas in
chumings 1, 4 and 7 the reworked butter developed defects
during holding, while in butter not reworked no defects
developed*
With samples of butter with the salt poorly distributed,
in chumings 1^ 3, 4 and 6 the reworking of the butter tended
to favor the development of defects, while in chumings 5 and
7 the reworking of the butter containing 1 ml. of inoculum
tended to inhibit the development of defects*

-• 69 "•
DISGUSSIOU OF RBSUL^DS
A reasonable degree of accuracy imdoubtedly can be
obtained in deterai3.ning the aodixan chloride content of an
approximately 0#2 mg» sample of butter. However, the
salt content of such a micro sample may not be representative
of an entire churning of butter* The value of the method
is in connection with the study of the salt contents of very
small portiona of butter^ and it is particularly useftil
in the study of the effect of salt distribution on bacterial
action in butter.
On the basis of micro analyses, considerable variation
in the distribution of salt in different saa^les of commercial
butter is to be expected because of the large variations
which occur in the incorporation of the moisture in different
aaa^lea* Since the salt is largely dissolved in the water,
the distribution of the salt depends to a great extent cai
the incorpca?ation of the bi^ine during the working process^
Actually, the distribution of the salt and the in
corporation of the moisture are very closely rela|ed*;v.'a^ t
salt is added to butter it apparently first Is largely
dissolved in a relatively small portion of the moisture, the
remaining moisture being more or less distinct from the
loosely held moisture In which the salt is dissolved# As the

70 -
wca?ki33g of the butter progresses, the brino solutloai la
divided into smaller and smaller droplets# Presumably there
ia a laixing of these droplets containing a relatively high
salt content with other droplets containing little or no
salt, and in this way the salt contents of the various vjater
droplets tend to eqmlize# During holding of butter having
the salt poorly dispersed through the moisture there may be
a movement of water droplets containing little or no salt
to other droplets containing relatively large amounts* With
butter having the brine thoroughly incorporated, a relatively
ccsnplete mixing of the brine and water phases will have occurred,
and there 111 be coiDparatlvely little tendency for moisture
to migrate, -shereas •with butter having the brine poorly in
corporated, the salt will be dissolved, in a relatively smll
pto'titm of the moisture and there will be a greater tendency
for the moisture to laigrate and foy*m large water droplet a •
With butter having the salt very poorly distributed the
colOT may be uneven as a result of the irregular dispersion
of salt and water.
Very probably salted butter can contain water droplets
that have little or no salt in them. Approximately 0.2
sample of butter contains so many water droplets that
some droplets containing no salt may be included without
the salt content of the entire sai^ple being appreciably
reduced. The ideal type of analysis for various bacterio

- 71 -
logical studies isould "be one permitting tlie determination
of the salt contents of individual small water droplets.
It is logical to assume tliat any moisture that is free of
salt consists of droplets that ere included in .the butter
granules during the churning process, I'ather than the
moisture added to the butter later* This relationship is
suggested by the fact tliat when organisms causing defects
in butter were added to the wash water no defects were
produced in the bi tter in which the salt was either well
distributed or poorly distributed, whereas wlien oi'gaiilsias
isere added to the cream defects often appeared, especially
in the butter in isihich tiie salt was poorly distributed.
Although the incorporation of moisture in salted
butter undoubtedly has an effect on the bacterial action,
it is somewhat different, than the effect in unsalted
butt or % Usually the l€irge moisture di»oplets in salted
butter contain enough salt to prevent the growth of most
bacteria. However, if the salt is poorly distributed, the
butter probably can contain relatively large moisture drop
lets having little or no salt and in these sufficient growth
of bacteria may occur to produce a defect in the butter.
As, in unsalted butter, increased working tends to prevent
bacterial action due to the finer dispersion of moisture
and there is also a better distribution of salt*
While the methods of manufacturing butter shouidbb©
such that the harmful bacteria in cream are killed and any

- 72 -
s6i»ioua contaiaination of the pastourlaod cream or buttar
prevented, the thorough dlstrlbuticm of salt and moisture
in the laantifaotiare of butter should b© regarded as a pre
cautionary measure against defects caused by bacterial action*

73 -
SmiMAEY MD COKCLUSIOHS
1, A micro proced-uro -was developed for the determina
tion of salt in samples of butter of approximately 0,2 mg«
each. The method is especially applicable to the study of
the effect of salt distribution on bacterial action in
butter* Results obtained with the method on both commercial
and experimental churningsled to the following conclusions:
a« In some samples of normal commercial butter the
salt was very uniformly distributed, while in other san^jles
the salt was not uniformly distributed. With most samples
a correlation was noted between salt distribution and incor-
poraticai of i^ie moisture.
b. With normal cGmmercial churning no significant
differences in salt distribution were noted between the butter
before and after printing with equipment which tended to
rework the butter#
c. With commercial churninge it was evident that as
the working process continued, the salt became more uniformly
distributed.
d. In some samples of putrid commercial butter the
salt was very unevenly distributed, while in other samples
the salt was very uniformly distributed.
e. In mottled commercial butter the light-colored por
tions usually contained less salt than the dark-colored

74 -
portions. In a sangple of commercial butter liaving a con
spicuous color defect that was not typical mottling, the
light-colored portions generally contained more salt than
the dark-colored portions#
f• Much larger variations occurred in the moistupe
contents than in the salt contents of the micro samples of
butter• Also, much larger variations occurred in the salt
contents of the serum in the micro samples than in those
of the large moisture droplets. The salt contents of the
serum calculated from the micro analyses vrere slightly
lower than the value calcxilated from the macro analyses,
The salt contents of the large moisture droplets usually
mere higher than those of the serum calculated either from
the micro or the macro analyses^
2i The addition of 1»5 per cent salt greatly inhibited
bacterial action in butter held at 15«5^C« The greatest
bacterial inhibition usually occurred in the butter having
the salt well distributed# The greatest activity of micro
organisms occurred in the poai»ly worked iinsalted butter.
3» The growth of various arganisms in butter churned
from inoculated pasteurized cream and held at 15.5®C, was
influenced by the distribution of salt in the butter, the
lowest bacterial counts being obtained on the butter having
the salt well distributed* In the unsalted butter, growth
was most rapid and the numbers of organisms were the highest

- 75
In the poca*ly worked butter*
4« As determined by an adaption of the Burri amear
culture technique^ the numbers of organisms nere lower
and the organisms were more uniformly distributed in butter
in which the salt was well distributed than in butter in
which the salt was poorly distributed* Many of the agar
slopes prepared by smearing portions of the large moisture
droplets appearing on the freshly cut surfaces of butter
contained no growth, while on a few slopes the colonies were
too numerous to count*
5« In some oootparisons the pn of the serum of butter
churned from crecun inoculated with laotio acid-producing
streptococci and held at 15»5^« decreased more in butter
with the salt poca*ly distributed than in butter with the salt
well distributed, but in other coa^arisons there were no
significant differences* In the unsalted butter the largest
decreases in the pH of the serum usually occurred in the
poorly worked butter*
6« When lots of pasteurized cream, each inoculated
with an organism capable of producing a defect in butter,
were churned and the butter held at 15*5°C*, the butter
having the salt well distributed usually did not develop
defects, while butter having the salt poorly distributed
frequently developed defects. Both the thoroxaghly and

- 76
poorly worked samples of unsalted butter developed defects,
the defect coimnonly appearing earlier In the poorly worked
butter*
7« When butter was churned from lots of pasteurized
cream and culttu?es of Pa» putrefaciens added either to
the cream or to the wash water, the butter having the salt
well distributed did not develop defects, whereas the butter
having the salt poorly distributed developed defects in
some sac^les in which the organisms were added to the cream,
but not in the samples in which the organisms were added to
the wash water• The unsalted butter usually develqped a
putrid flavor regardless of whether the organisms were
added to the cream or to the wash water; no significant
differences were noted between the two methods of inoculaticm*
8« When organisms capable of producing defects were added
to butter churned from pasteurized cream, a greater inhibition
of the activity of micro-organisms occurred in the butter
having the salt well distributed than in the butter having
the salt poorly distributed*
9. In some samples the reworking of salted butter con
taining organisms capable of producing-defects tended to
favor the development of the defects, while in other samples
the reworkizig had no effect on the deterioration of the
butter or even tended to inhibit the bacterial action*

- 712 -
10. The distribution of salt in butter on a micro basis
should be considered a factca? that definitely influences
the action of micro-organisms in butter; the mcsre thoroughly
the salt la distributed the greater is the irihibitory effect
of the salt*

- 78 -
ACKKOWLEDGMTS
The author viishes to express his sincere appreciation
to rir* W, Hanmjer for his wise comsel in planning and
directing the work herein reported and In the preparation
of the manuscript/ and to HP, I. B* Johns for his help
ful suggestions in connection iwith the micro analyses.

- 79 -
SELECTED BIBLIOGRAPHY
AklyaiQAy T« and Yabo, S* Adsorption Indicators* I. Con^aratlve investigation of the Indlcatotrs ufled for the titration of ohlorlde with sliver. Jm Pharm* Soo* Japan, 55:71-77• 1935* Gri-glnal not seen* Abstracted In C. A«> 31:6994. 1937.
Boinbach., Karl and Rider, T. E* Volumetric determinations of halldes« Use of dlchlorofluoresceln as an adsorption Indloator. Ind* Eng, Chem*, Anal. Ed*, 7:165«166* 1935*
Bryant, L* R* A modified test for salt In butter* Can* Dairy and loe Cream. J* 16: Ko« 6, 19-20* 1937*
Bottger, W* and Sohmitt, K* 0* fiber die Titration von Silber- imd Halogenionen mit organischen Forbindi-katoren* Z* An<»:>g* Allgem* Chem*, 137:246-248* 1924*
Boysen, Hans* Die Wasserverteilung in der Butter* Milchw* Forsch*, 4x221-248* 1927*
Claydon, T* J. and Hammer, B* W* Bacteriology of butter* VIII, Relationship of Achromobacter putrefaciens to the putrid defeot of butter* la* Agr* Esq)* Sta*, Res« Bia* 267* 1939*
Cullity, M* and Griffin, D* 0* Rabbit o or surface taint in butter* J* Dept* of Agr*, West Australia* Ser* 2., 15:137-147* 1938*
Doane, Charles F* A study of the cause of mottled butter. 1^* Agr* £zp* Sta., Bui* 64* 1900.
Fajans, K* and Hassel, 0* Bine neue Methode zur titration von Silver- und Halogenionen mit organischen Forbstoffindikatoren* Z* Elektrochem*, 29:495-500* 1923*
Fajans, K. xand Wolff, H* fiber die Titration von Silber-und Halogenionen mit organischen Forbstoffindikatoren* Z* Anorg* Allgem* Chem., 137:221-245* 1924.

- s o
11, Feldman, Harry B» and Powell, Arnet L, Determination of halogens in organic c0n?)0imds. Ind. Eng. Chem,, Anal, M., 11;89-90, 1939,
12, Guthrie, E, S, Coa^osition and body of butter, K, Y, (Cornell) Agr, Exp, Sta,, Bui. 477, 1929,
13, Guthrie, E, S# and Roaa^ H, Distributictti of moisture and salt in butter, K, Y, (Cornell) Agr, Exp. Sta,., Bui, 336* 1913.
14, HBlsoher, Priederich. Argentometriache Halmikro-Beatiimaung von Ghlor und Brom in organiachen Substanzen^ Z, Anal, Chem*, 96s308-314. 1934.
16. Hood, E, G. and Whit©, A, H. Studies on the distribution of moisture and salt in creamery butter. Can, Dairy and Ice Cream J,, 17: Kos, 5 and 6. . . 19S8.
16, Htanziker, 0, F, and Hosman, D« Fay, Mottles in butter— their causes and prevention. J. Ijairy Sci., 3: 77-106. 1920.
17, Johns, I, B, Laboratory nianua:i of microchemistry. Burgess Publishing Co., Minneapolis, Minn, pp. 39-41, 1941,
18, Knudsen, S, and Jensen, M. Kogle TTnders^gelaer over Sra^frrets Holdbarhed, Maelkeritidende, 43:1016-1039, 1930.
19, Sciudsen, S, and Jensen, M. Quelques recherches sur Ifi conservation du beurre. Lait, 13:885-904, 1933,
20, Kolthoff, J, M. tjber die argentometrischs Clilorid- imd Jodidtitration mit Adsorptionsindikatoren. III. Z. Anal. Chem., 71:235-243» 1927.
21, Kolthoff, J. M* and van Berk, L, H, Die Genauigkeit der Halogteid- und Rhodanidtitration nach Pajans und nach den gewBhnlichen methoden in Vergleichimg mit den Re suit at en der potentiometrischen. BestiMKungen. Z. Anal, Chem,, 70:369-394. 1927.
22, Kolthoff, J. M., Lauer, M, and Sunde, C, J. The use of dichlorofluorescein as an adsorption indicator for the argentometric titration of chlorides. J. Am, Chem. Soc,, 51:3273^3277, 1929^
23, Kolthoff, J. M. Adsorption indicators. Chem. Rev., 16:87-98. ,1935.

•• 81 ••
24* Long, H. F, and Hammer, B, W* Bacteriology of "butter^ VI» Effect of moisture dispersion in "butter on groifbti of bacteria. la. Agr. Bxp, Sta., Res. Bui,
. 246. 1938.
25* Long, H. P. and Efeiinmer, B, Examination of butter with tlie Burri smear culture technic. Iowa Stat© Col. J. Scl*, 12:441-450. 1938.
26# McDowall, P. H. and MacDonald, C. L» The estimation of salt in butter# New Zealand J. Sci. and Tech., 17}417-419. 1935*
27. McKay, G. L» and Larsen, C, Report of the Iowa educational butter contest# la. Agr# Bbcp. Sta., Bui. 80, 1904.
28# Manhart, V. G. Variability in C0ja5)03itl0n of butter from the same churning in relation to working. J. Dairy Sci#, 11:52-65. 1928#
29. Mortensen, M#,. Breazeale, D. P., Meyer, C. H# and Michaelian, M# B# Standardization of Iowa butter, la# Agr# Bxp# Sta#, Buli. 358# 1937#
30# Rahn, Otto and Boysen, !• H. Distribution and growth of bacteria in butter# J# Dairy Sci#, 11:446-470. 1928.
31# Sainmis, J# L# and Lee, C» B» Mottles in butter# Wis# Agr. Exp# Sta#, 29th Ann# Rpt#, pp. 31-32# 1912#
32# Scharp, L« R» Bacteriological infection of butter. Off# Rept# Vict# By# Fact# I%rs# and Sec. Assoc., Melbourne, Australia# 4Srd Ann# Conf#. pp. 50-52#
33* Skelton, F# M#. and Bryant, L# R# Dichl or ©fluoresce in to estimate the salt content of butter# Nat# Butter and Cheese J#, 30: No. 4, 16-17. 1939,
34# Van Slyke, L# L# and Hart_, S# B. The proteids of butter in relation to mottled, butter# H# Y# (Geneva) Agr# Exp# Sta#, Bui# 263# 1905#.
35# Weckel', K# G# Diohlorofluorescein and potassium chromato as indicators in the argentometric estimation of salt in butter# J# Dairy Sci#, 22:163-168# 1939.
36# White, A. H# A bacteriological discoloratltm of print butter# Sci#. Agr#, 20:658-645# 1940#