Distribution of patient-day-weighted mean POC-BG … · 1 c Distribution of patient-day-weighted...
22
1 c Distribution of patient-day-weighted mean POC-BG values for ICU & non-ICU settings Swanson et al. Endocrine Practice, October 2011 DATA from ~49 million POC-BG testing (12 M ICU; 37 M non-ICU) from 3.5 million patients (653,359 ICU; 2,831,436 non-ICU). The mean POC-BG was 167 mg/dL for ICU patients and 166 mg/dL for non-ICU patients.
Transcript of Distribution of patient-day-weighted mean POC-BG … · 1 c Distribution of patient-day-weighted...

1
c
Distribution of patient-day-weighted mean POC-BG values for ICU & non-ICU settings
Swanson et al. Endocrine Practice, October 2011
DATA from ~49 million POC-BG testing (12 M ICU; 37 M non-ICU) from 3.5 million patients (653,359 ICU; 2,831,436 non-ICU). The mean POC-BG was 167 mg/dL for ICU patients and 166 mg/dL for non-ICU patients.
2
Distribution of patient-day-weighted mean POC-BG values for ICU & non-ICU settings
DATA from ~49 million POC-BG testing (12 M ICU; 37 M non-ICU) from 3.5 million patients (653,359 ICU; 2,831,436 non-ICU). The mean POC-BG was 167 mg/dL for ICU patients and 166 mg/dL for non-ICU patients.
Swanson et al. Endocrine Practice, Pub Ahead of Print, October 2011
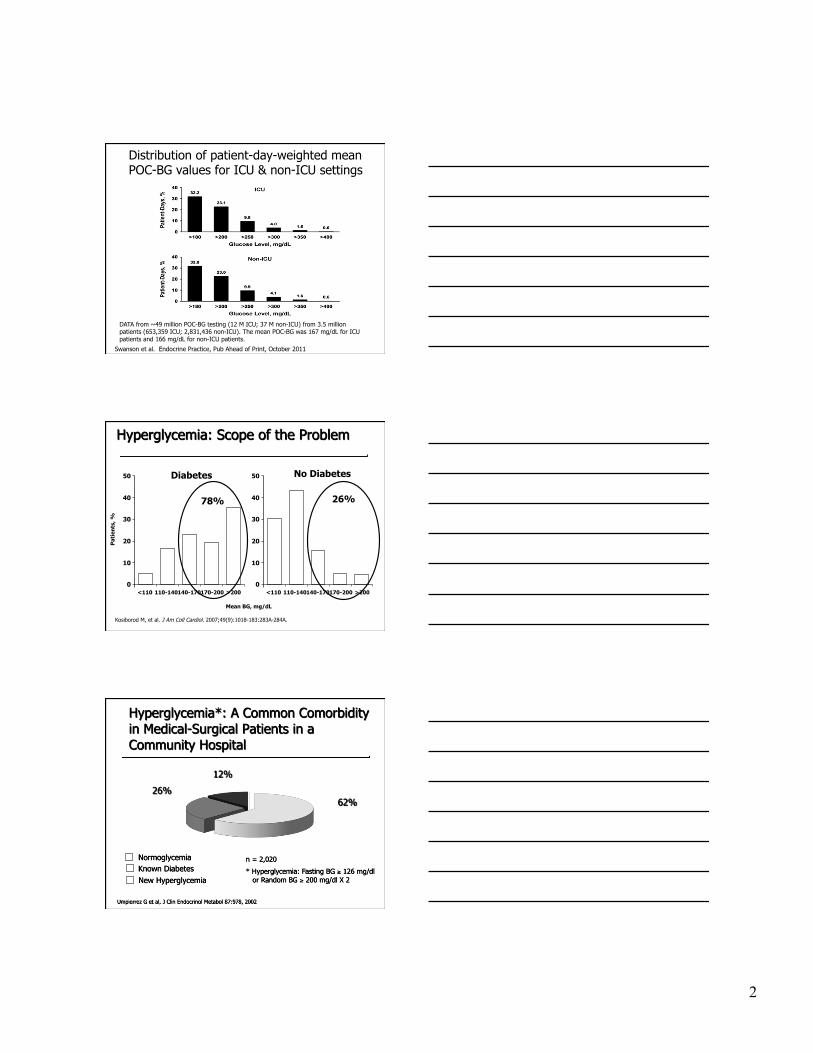
Kosiborod M, et al. J Am Coll Cardiol. 2007;49(9):1018-183:283A-284A.
No Diabetes
26%
Diabetes 50
40
30
20
10
0 <110 110-140
50
40
30
20
10
0 <110 110-140 140-170 170-200 >200
78%
140-170 170-200 >200
Mean BG, mg/dL
Pat
ient
s, %

3
Comparison of sensi-vity and specificity achieved for the diagnosis of diabetes based on FPG, at various levels of HbA1c, from NHANES III and 1999–2004 NHANES
J Clin Endocrinol Metab, July 2008, 93(7):2447–2453

4
Norhammar A, et al. Lancet 2002;359:2140-4. Matz K, et al. Diabetes Care 2006;792-7.
2-hour OGTT
70
60
50
40
30
20
10
0
Norhammar (n=181)
Matz (n=238)
Pati
ents
(%)
66
39
Myocardial infarction
Stroke
IGT Undiagnosed T2DM
35 23
31
16

5
~2x
Mor
talit
y R
ate
(%)
Mean Glucose Value (mg/dL)
Krinsley JS. Mayo Clin Proc. 2003;78:1471-1478.
N=1826 ICU patients.
0
5
10
15
20
25
30
35
40
45
80-99 100-119 120-139 140-159 160-179 180-199 200-249 250-299 >300 0
5
10
15
20
25
30
35
40
45
0
5
10
15
20
25
30
35
40
45
~4x ~3x
Day of surgery: 241 mg/dL POD #1: 206 mg/dL POD #2: 195 mg/dL POD#3: 188 mg/dl
Day of surgery: 199 mg/dL POD #1: 176 mg/dL POD #3: 185 mg/dL POD#3: 181 mg/dl
DSWI, deep sternal wound infection; SCI, subcutaneous insulin; CII, continuous insulin infusion.
4.0
3.0
2.0
1.0
0.0
DSWI (%)
87 88 89 90 91 92 93 94 95 96 97 Year
Patients with diabetes
Patients without diabetes
Furnary AP, et al. Ann Thorac Surg. 1999;67:352–362.
CII (N=3554) SCI

6
Blood Glucose (mg/dL)
<150 150- 175
200- 225
175- 200
>250 225- 250
P<0.0001
*P<0.001
Postop Mortality
BG <200 n=662
1.8%
BG >200
n=1369
5.0% * P
osto
p M
orta
lity
(%)
Adjusted for 19 clinical and operation variables
Furnary AP et al. Circulation. 1999:100 (Suppl I): I-591.
1.4 1.7 2.1
3.8
5.8
8.6
0
2
4
6
8
10
CABG, coronary artery bypass graft.
First Postop Glucose >200
• 2x LOS • 3x Vent duration • 7x mortality !!!
*P<0.01 Van den Berghe et al. N Engl J Med. 2001;345:1359-1367. Relative Risk Reduction (%)
Intensive Glucose Management in RCT
Trial N Setting Primary
Outcome ARR RRR Odds Ratio
(95% CI) P-value
Van den Berghe 2006
1200 MICU Hospital mortality
2.7% 7.0% 0.94* (0.84-1.06)
N.S.
Glucontrol 2007
1101 ICU ICU mortality
-1.5% -10% 1.10* (0.84-1.44)
N.S.
Ghandi 2007
399 OR Composite 2% 4.3% 1.0* (0.8-1.2)
N.S.
VISEP 2008
537 ICU 28-d mortality
1.3% 5.0% 0.89* (0.58-1.38)
N.S.
De La Rosa 2008
504 SICU MICU
28-d mortality
-4.2% * -13%* NR N.S.
NICE-SUGAR 2009
6104 ICU 3-mo mortality
-2.6% -10.6 1.14 (1.02-1.28)
< 0.05
*not significant
7
Favors IIT Favors Control Mixed ICU
Medical ICU
Surgical ICU
ALL ICU
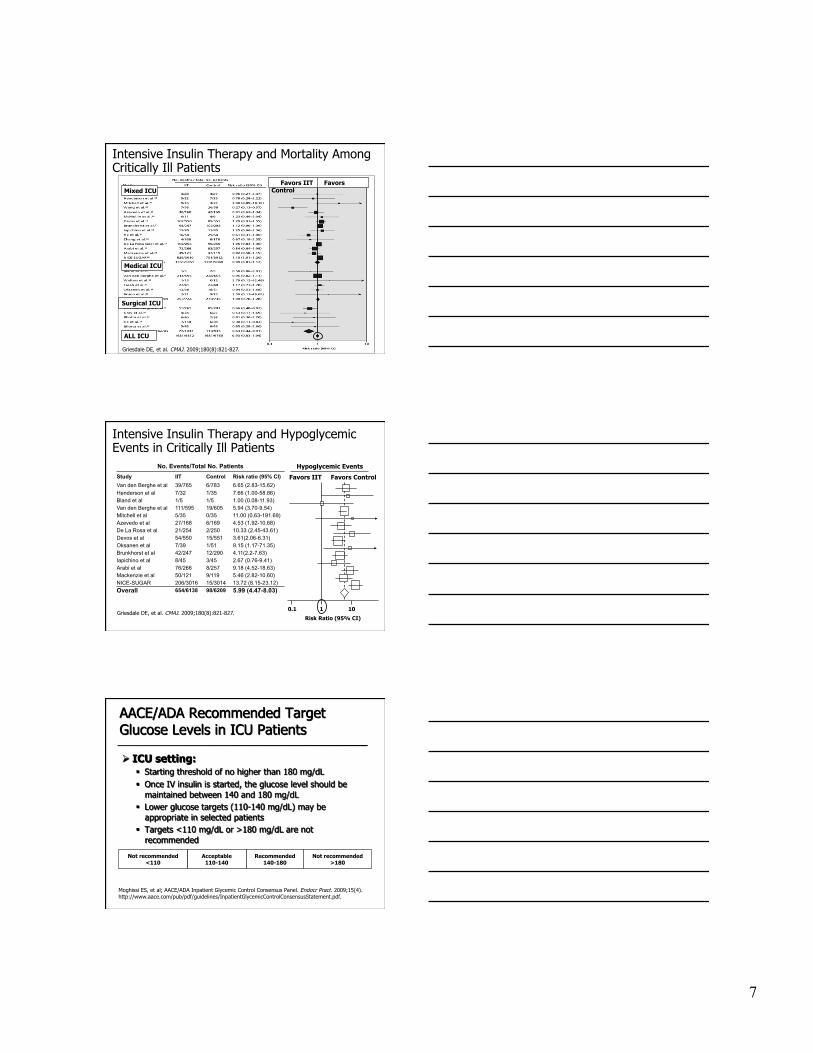
Intensive Insulin Therapy and Mortality Among Critically Ill Patients
Griesdale DE, et al. CMAJ. 2009;180(8):821-827.
Griesdale DE, et al. CMAJ. 2009;180(8):821-827.
Favors IIT Favors Control
Hypoglycemic Events
Intensive Insulin Therapy and Hypoglycemic Events in Critically Ill Patients
No. Events/Total No. Patients Study IIT Control Risk ratio (95% CI) Van den Berghe et al 39/765 6/783 6.65 (2.83-15.62) Henderson et al 7/32 1/35 7.66 (1.00-58.86) Bland et al 1/5 1/5 1.00 (0.08-11.93) Van den Berghe et al 111/595 19/605 5.94 (3.70-9.54) Mitchell et al 5/35 0/35 11.00 (0.63-191.69) Azevedo et al 27/168 6/169 4.53 (1.92-10.68) De La Rosa et al 21/254 2/250 10.33 (2.45-43.61) Devos et al 54/550 15/551 3.61(2.06-6.31) Oksanen et al 7/39 1/51 9.15 (1.17-71.35) Brunkhorst et al 42/247 12/290 4.11(2.2-7.63) Iapichino et al 8/45 3/45 2.67 (0.76-9.41) Arabi et al 76/266 8/257 9.18 (4.52-18.63) Mackenzie et al 50/121 9/119 5.46 (2.82-10.60) NICE-SUGAR 206/3016 15/3014 13.72 (8.15-23.12) Overall 654/6138 98/6209 5.99 (4.47-8.03)
0.1 1 10
Risk Ratio (95% CI)
Moghissi ES, et al; AACE/ADA Inpatient Glycemic Control Consensus Panel. Endocr Pract. 2009;15(4). http://www.aace.com/pub/pdf/guidelines/InpatientGlycemicControlConsensusStatement.pdf.
Recommended 140-180
Acceptable 110-140
Not recommended <110
Not recommended >180

8
Leuven SICU Study1 Yale Insulin Infusion Protocol2
MICU Insulin Infusion Protocol
0
50
100
150
200
250
300
350
400
450
0 12 24 36 48 60 72
Hours
Blo
od G
luco
se (
mg/
dL)
Glucommander3
0 50
100 150
200 250
300 350
400 450
0 2 4 6 8 10 12 14 16 18 20 22 24
Hours
Glu
cose
(m
g/dL
)
1. Van den Berghe et al. N Engl J Med. 2001;345:1359-1367. 2. Goldberg PA et al. Diabetes Care. 2004;27:461-467. 3. Davidson et al. Diabetes Care. 2005;28:2418-2423. 4. Finfer S, et al. N Engl J Med. 2009;360(13):1283-1297.
Admission Day 1 Day 5 Day 15
Blo
od G
luco
se (
mm
ol/L
) Intensive - Mean BG 103 mg/dL
Conventional - Mean BG 153 mg/dL
0
2
4
6
8
10
12
14
Last day
Strategies for Achieving Glycemic Targets in the ICU
NICE-SUGAR4
Van Den Berghe G, et al. N Engl J Med. 2001; Van Den Berghe G, et al. N Engl J Med. 2006;De la Rosa,et al, Crit Care 2008; Brunkhorst et al. N Engl J Med. 2008; Preiser JC, SCCM, 2007; Nice Sugar, NEJM 2009
Glycemic Values Achieved with IV Insulin Protocols
IIT: Intensive insulin therapy CIT: Control, conventional insulin therapy Results are expressed as mean BG during hospital stay, mg/dL

9
8.6%
1. Van Den Berghe G, et al. N Engl J Med. 2001:345:1359; 2. Van Den Berghe G, et al. N Engl J Med. 2006;354:449-461; 3. Brunkhorst FM et al. N Engl J Med. 2008; 358:125-139; 4. Preiser JC, SCCM, 2007; 5. Finfer S, et al. N Engl J Med. 2009;360(13):1283-1297.
Hypoglycemia Rates in Intensive IV Insulin Protocols
Algorithm 1 Algorithm 2 Algorithm 3 Algorithm 4
BG (mg/dL) Units/hr BG (mg/dL) Units/hr BG
(mg/dL) Units/hr BG (mg/dL) Units/hr
<60 = Hypoglycemia (See below for treatment)
<70 Off <70 Off <70 Off <70 Off
70 - 109 0.2 70 - 109 0.5 70 - 109 1 70 - 109 1.5
110 - 119 0.5 110 - 119 1 110 - 119 2 110 - 119 3
120 - 149 1 120 - 149 1.5 120 - 149 3 120 - 149 5
150 - 179 1.5 150 - 179 2 150 - 179 4 150 - 179 7
180 - 209 2 180 - 209 3 180 - 209 5 180 - 209 9
210 - 239 2 210 - 239 4 210 - 239 6 210 - 239 12
240 - 269 3 240 - 269 5 240 - 269 8 240 - 269 16
270 - 299 3 270 - 299 6 270 - 299 10 270 - 299 20
300 - 329 4 300 - 329 7 300 - 329 12
330 - 359 4 330 - 359 8 330 - 359 14 >330 28
>360 6 >360 12 >360 16
24 300-329
Reduce insulin rate or hold insulin
infusion at a higher BG
concentration
Newton CA et al. ADA Scientific Meeting. June 2008; J Hospital Med, in press
Protocols
10
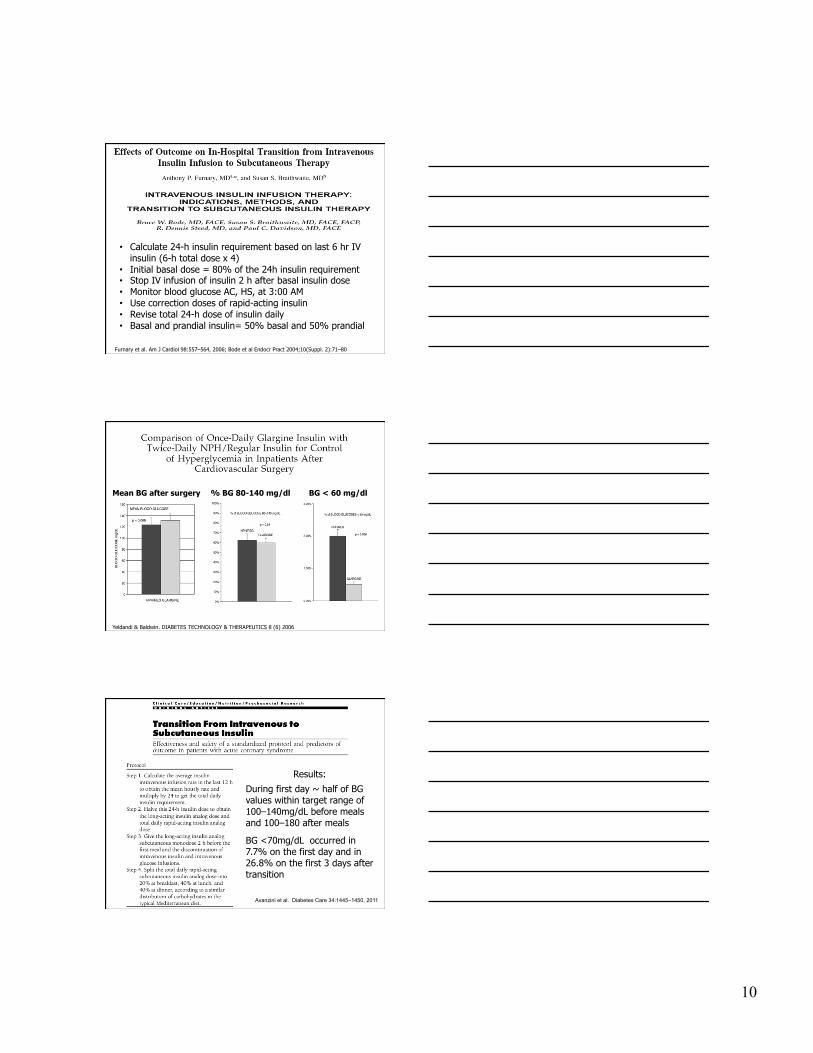
Furnary et al. Am J Cardiol 98:557–564, 2006; Bode et al Endocr Pract 2004;10(Suppl. 2):71–80
• Calculate 24-h insulin requirement based on last 6 hr IV insulin (6-h total dose x 4)
• Initial basal dose = 80% of the 24h insulin requirement • Stop IV infusion of insulin 2 h after basal insulin dose • Monitor blood glucose AC, HS, at 3:00 AM • Use correction doses of rapid-acting insulin • Revise total 24-h dose of insulin daily • Basal and prandial insulin= 50% basal and 50% prandial
Yeldandi & Baldwin. DIABETES TECHNOLOGY & THERAPEUTICS 8 (6) 2006
BG < 60 mg/dl % BG 80-140 mg/dl Mean BG after surgery
Results:
During first day ~ half of BG values within target range of 100–140mg/dL before meals and 100–180 after meals
BG <70mg/dL occurred in 7.7% on the first day and in 26.8% on the first 3 days after transition
Avanzini et al. Diabetes Care 34:1445–1450, 2011

11
Grady / Emory Protocol. Smiley & Umpierrez, Ann. N.Y. Acad. Sci 1212:1-11, 2010
Grady / Emory Protocol. Smiley & Umpierrez, Ann. N.Y. Acad. Sci 1212:1-11, 2010

12
1. ACE/ADA Task Force on Inpatient Diabetes. Diabetes Care. 2006 & 2009 2. Diabetes Care. 2009;31(suppl 1):S1-S110..
Antihyperglycemic Therapy
SC Insulin Recommended for
most medical-surgical patients
OADs Not Generally Recommended
Recommendations for Managing Patients With Diabetes in Non-ICU Setting
Moghissi ES, et al; AACE/ADA Inpatient Glycemic Control Consensus Panel. Endocr Pract. 2009
13
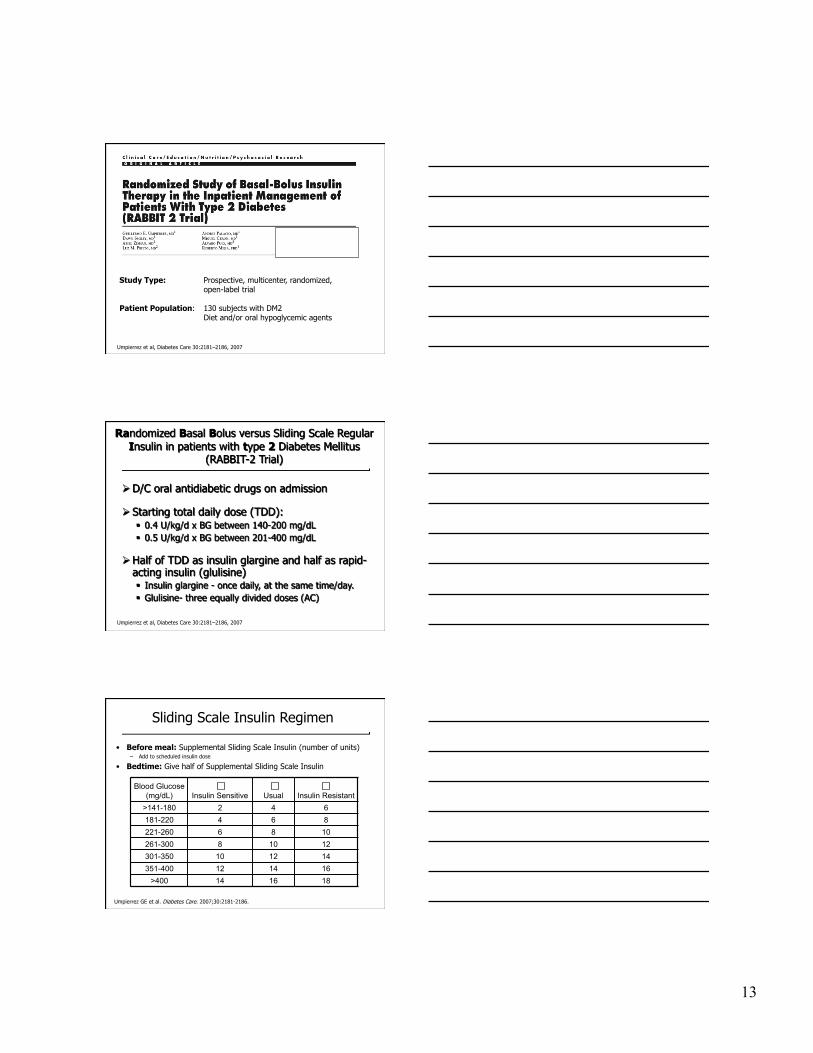
Study Type: Prospective, multicenter, randomized, open-label trial
Patient Population: 130 subjects with DM2 Diet and/or oral hypoglycemic agents
Umpierrez et al, Diabetes Care 30:2181–2186, 2007
Umpierrez et al, Diabetes Care 30:2181–2186, 2007
Umpierrez GE et al. Diabetes Care. 2007;30:2181-2186.
• Before meal: Supplemental Sliding Scale Insulin (number of units) – Add to scheduled insulin dose
• Bedtime: Give half of Supplemental Sliding Scale Insulin
Blood Glucose (mg/dL) Insulin Sensitive Usual Insulin Resistant
>141-180 2 4 6 181-220 4 6 8 221-260 6 8 10 261-300 8 10 12 301-350 10 12 14 351-400 12 14 16
>400 14 16 18
Sliding Scale Insulin Regimen

14
Umpierrez GE, et al. Diabetes Care. 2007;30(9):2181-2186.
Days of Therapy
BG
, mg/
dL
100
120
140
160
180
200
220
240
Admit 1
Sliding-scale
Basal-bolus
bP<.05.
a a a
b b b
b
2 3 4 5 6 7 8 9 10 aP<.05.
• Sliding scale regular insulin (SSRI) was given 4 times daily • Basal-bolus regimen: glargine was given once daily; glulisine was given before meals. 0.4 U/kg/d x BG between 140-200 mg/dL 0.5 U/kg/d x BG between 201-400 mg/dL
Days of Therapy
BG
, mg/
dL
100 120 140 160 180 200 220 240
Admit 1
Sliding-scale
Basal-bolus
260 280 300
3 3 4 5 6 7 2 4 2 1
Rabbit 2 Trial: Treatment Success With Basal-Bolus vs. Sliding Scale Insulin
Basal Bolus Group: BG < 60 mg/dL: 3% BG < 40 mg/dL: none
SSRI: BG < 60 mg/dL: 3% BG < 40 mg/dL: none
Umpierrez GE, et al. Diabetes Care. 2007;30(9):2181-2186.
Umpierrez GE et al. Diabetes Care 2007;30:2181-2186.

15
Study Type: Prospective, randomized, open-label trial
Patient Population: 130 subjects with DM2 Oral hypoglycemic agents or insulin therapy
Study Sites: Grady Memorial Hospital, Atlanta, GA Rush University Medical Center, Chicago, IL
Umpierrez et al, J Clin Endocrinol Metab 94: 564–569, 2009
BG
, mg/
dL
Duration of Therapy, d
Data are means ±SEM.
Detemir + aspart NPH + regular
Basal-bolus regimen: detemir was given once daily; aspart was given before meals. NPH/regular regimen: NPH and regular insulin were given twice daily, two thirds in AM, one third in PM.
Umpierrez GE, et al. J Clin Endocrinol Metab. 2009;94(2):564-569.
P=NS
100
120
140
160
180
200
220
240
Pre-Rx BG
0 1 2 3 4 5 6-10
NPH/Regular BG < 40 mg/dl: 1.6% BG < 60 mg/dl: 25.4%
Detemir/Aspart BG < 40 mg/dl: 4.5% BG < 40 mg/dl: 32.8%
Umpierrez et al, J Clin Endocrinol Metab 94: 564–569, 2009
DEAN Trial: Hypoglycemia
To determine risk factors for
hypoglycemic events during SC insulin
therapy

16
p-value*
variable BG < 60 mg/dl BG < 70 mg/dl
AGE 0.036 0.001
wt 0.027 0.001 A1C 0.521 0.658
Creatinine 0.011 0.002 Enrollment BG 0.166 0.319
Previous treatment 0.005 <.001 Previous insulin Rx <0.001 <.001
Treatment group <0.001 <.001 *p-values are from Wilcoxon Two-Sample Test
Summary of Univariate Analyses
Umpierrez et al, ADA Scientific Meeting, Poster #516, 2009
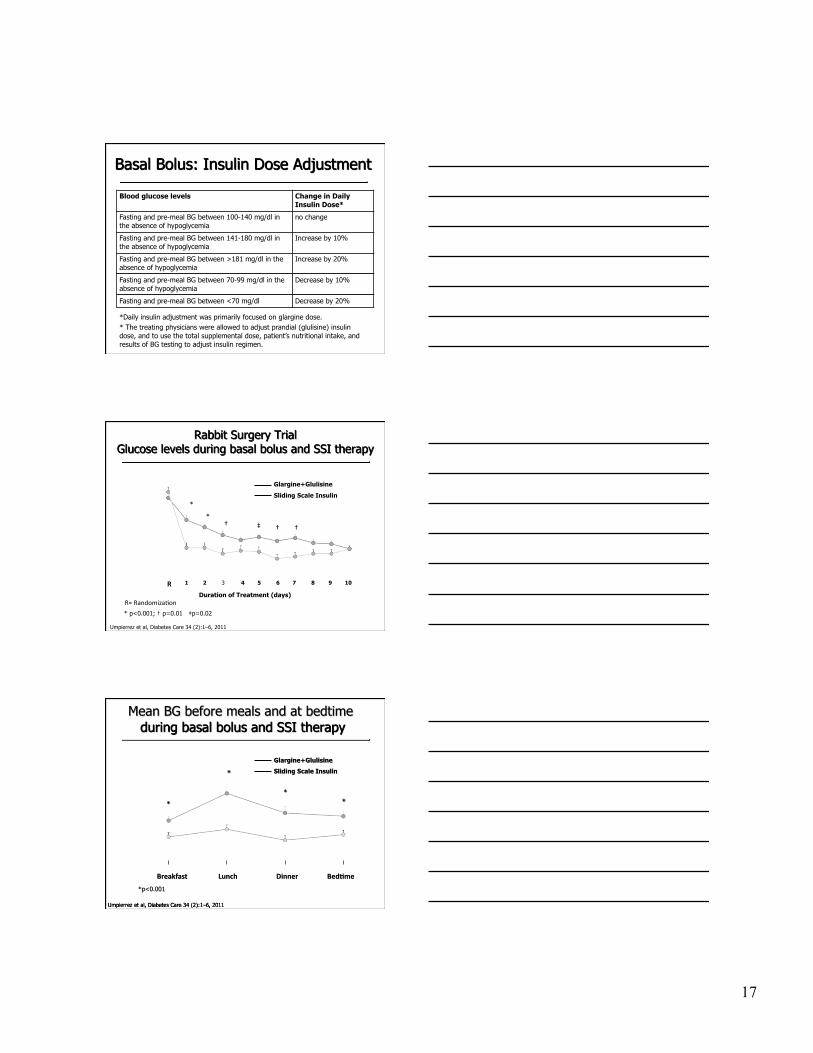
Umpierrez et al, Diabetes Care, Diabetes Care 34 (2):1–6, 2011
Study Type: Prospective, multicenter, randomized, open-label trial in general surgery (non-ICU)
Patient Population: 211 subjects with DM2 Diet and/or oral hypoglycemic agents or low dose insulin <0.4 U/kg/day
Primary outcome: Differences between groups in mean daily BG concentration
• Composite of hospital complications: wound infection, pneumonia, respiratory failure, acute renal failure, and bacteremia.
Basal Bolus Insulin Regimen
D/C oral antidiabetic drugs on admission
Starting total daily dose (TDD): 0.5 U/kg/day
TDD reduced to 0.3 U/kg/day in patients ≥ 70 years of age or with a serum creatinine ≥ 2.0 mg/dL
The goal of insulin therapy was to maintain fasting and pre-meal glucose concentration between 100 mg/dl and 140 mg/dl.
*If a patient was not able to eat, insulin glargine was given but, insulin glulisine was held until meals were resumed.
Half of TDD as insulin glargine and half as insulin glulisine* – Glargine - once daily, at the same time of the day – Glulisine- three equally divided doses (AC)
17
Blood glucose levels Change in Daily Insulin Dose*
Fasting and pre-meal BG between 100-140 mg/dl in the absence of hypoglycemia
no change
Fasting and pre-meal BG between 141-180 mg/dl in the absence of hypoglycemia
Increase by 10%
Fasting and pre-meal BG between >181 mg/dl in the absence of hypoglycemia
Increase by 20%
Fasting and pre-meal BG between 70-99 mg/dl in the absence of hypoglycemia
Decrease by 10%
Fasting and pre-meal BG between <70 mg/dl Decrease by 20%
*Daily insulin adjustment was primarily focused on glargine dose. * The treating physicians were allowed to adjust prandial (glulisine) insulin dose, and to use the total supplemental dose, patient’s nutritional intake, and results of BG testing to adjust insulin regimen.
*
† ‡ *
Duration of Treatment (days)
† †
R 1 3 2 4
Glargine+Glulisine
Sliding Scale Insulin
5 6 7 8 9 10
* p<0.001; † p=0.01 ‡p=0.02
R= Randomiza-on
Umpierrez et al, Diabetes Care 34 (2):1–6, 2011

18
P=0.003
P=NS
P=0.05 P=0.10
P=0.24
Glargine+Glulisine
Sliding Scale Insulin
Umpierrez et al, Diabetes Care 34 (2):1–6, 2011
* Composite of hospital complications: wound infection, pneumonia, respiratory failure, acute renal failure, and bacteremia.
P=0.16
P=0.003
SSI = sliding scale insulin ICU=intensive care unit
Postsurgical ICU Admission ICU Length of Stay
23
5 0
5
10
15
20
25
Insulin Glargine + Insulin Glulisine
SSI
P <0.001
4 0 0
5
10
15
20
25
Insulin Glargine + Insulin Glulisine
SSI
P =0.057
BG <70 mg/dL BG <60 mg/dL BG <40 mg/dL
There were no differences in hypoglycemia between patients treated with insulin prior to admission compared to insulin-naïve patients.
Umpierrez et al, Diabetes Care 34 (2):1–6, 2011
12
2 0
5
10
15
20
25
Insulin Glargine + Insulin Glulisine
SSI
P <0.001

19
SSI: range of daily regular insulin= 9.7 to 14.4 units after 24hr treatment 88.5% of patients received <20 units and 39.4% <10 units per day.
Basal Bolus versus SSRI – non-ICU

20
Hospital Complications: Primary outcome
• Sliding scale regular insulin (SSRI) was given 4 times daily • Basal-bolus regimen: glargine was given once daily; glulisine was given before meals. TDD: 0.5 U/kg/d x BG Elderly (>70 yrs) and with serum creatinine > 2.0 mg/dl: TDD reduced to 0.3 U/kg/d
p-value*
variable BG < 60 mg/dl BG < 70 mg/dl
AGE 0.036 0.001
wt 0.027 0.001 A1C 0.521 0.658
Creatinine 0.011 0.002 Enrollment BG 0.166 0.319
Previous treatment 0.005 <.001 Previous insulin Rx <0.001 <.001
Treatment group <0.001 <.001 *p-values are from Wilcoxon Two-Sample Test
Hypoglycemia: Univariate Analyses
Umpierrez et al, ADA Scientific Meeting, Poster #516, 2009
Umpierrez et al, Diabetes Care 2007; JCEM 2009; Diabetes Care 2011

21
Initial Insulin Treatment in Medical and Surgical in Non-ICU
BG Target: fasting and pre-meal glucose concentration between 100 mg/dl and 140 mg/dl. * Reduced TDD to 0.15 U/kg/day if age ≥ 70 yr or creatinine ≥ 2.0 mg/dL
T2DM with BG > 140 mg/dl (7.7 mmol/l)
Basal insulin - Start at 0.2-0.25 U/Kg/day* - Correction doses with rapid
acting insulin AC - Adjust basal as needed
NPO Uncertain oral intake
Adequate Oral intake
Basal Bolus TDD: 0.4-0.5 U/Kg/day - ½ basal, ½ bolus - - adjust as needed
Glargine once daily
0.25 U/kg Insu
lin
Act
ion
Leahy J. In: Leahy J, Cefalu W, eds. Insulin Therapy. New York: Marcel Dekker; 2002:87; Nathan DM. N Engl J Med. 2002;347:1342
Glulisine before meals per sliding scale (correction)
Preliminary results: Basal bolus 51 patients, basal-plus: 49 patients
Umpierrez et al, not for reproduction
Basal Plus: glargine once daily 0.25 U/kg plus glulisine supplements
Basal Bolus: TDD: 0.5 U/kg/d Glargine 50% glulisine 50%
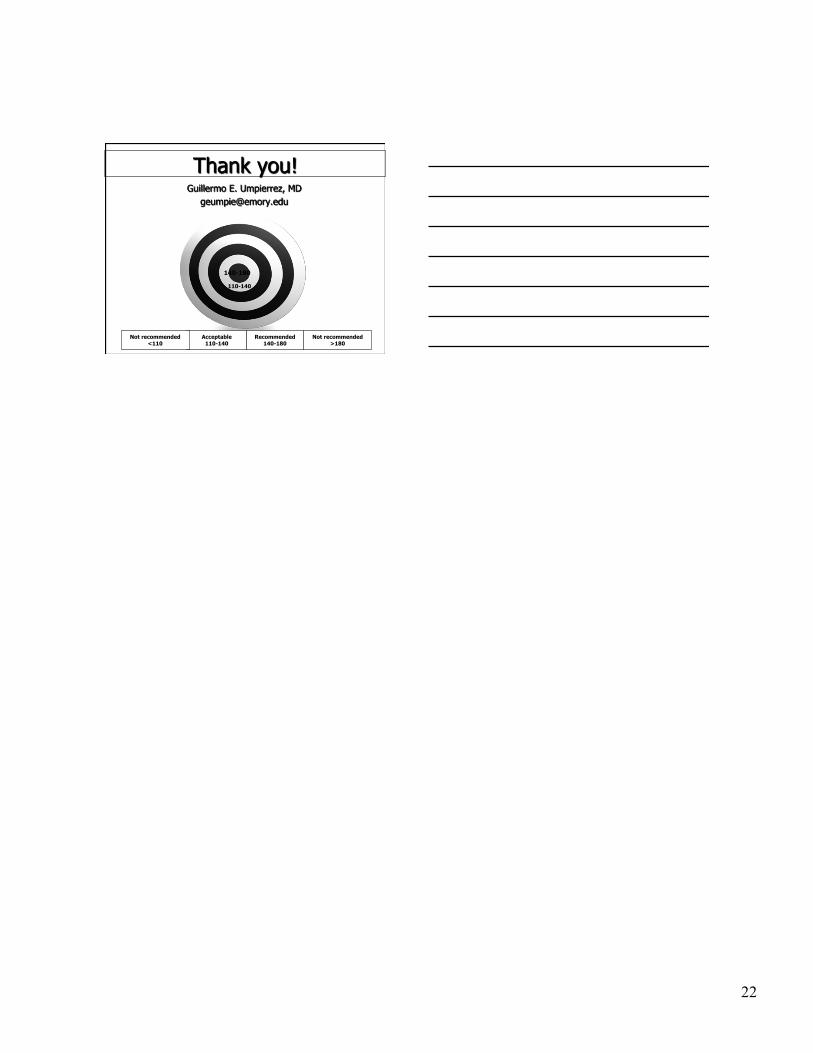
22
140-180
Recommended 140-180
Acceptable 110-140
Not recommended >180
Not recommended <110
110-140