Disclosures Diffusion and Perfusion Imaging in the Head ...€¦ · MRI ² diffusion weighted...
12
Ashok Srinivasan, MD Associate Professor Director of Neuroradiology University of Michigan Health System Diffusion and Perfusion Imaging in the Head and Neck Disclosures No relevant financial disclosures Learning objectives Review technical aspects and challenges of diffusion and perfusion imaging Discuss clinical applications in the head and neck 43 y/o M status post parotidectomy ??? CT Perfusion MRI – diffusion weighted imaging MRI – Perfusion imaging Imaging of diffusion of water molecules Strong gradients in 3 orthogonal directions ADC (Apparent diffusion coefficient) Expressed in mm 2 /s Higher the ADC, more is the degree of motion (and vice versa)
Transcript of Disclosures Diffusion and Perfusion Imaging in the Head ...€¦ · MRI ² diffusion weighted...
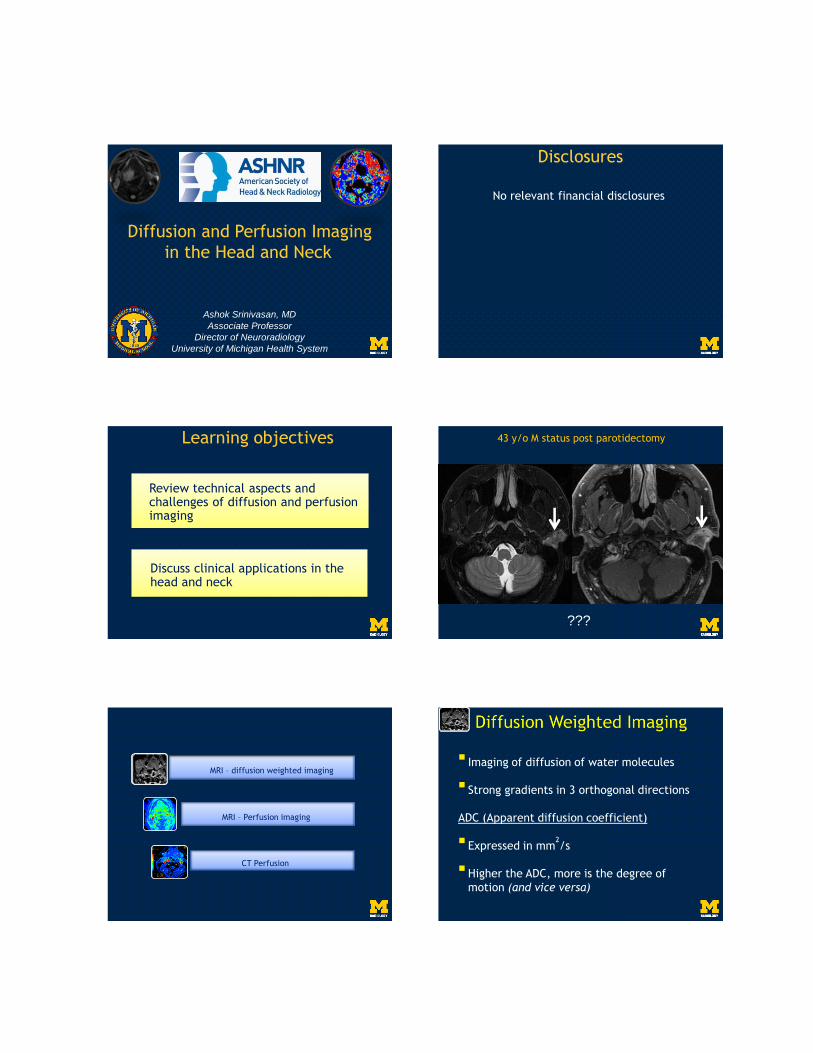
Ashok Srinivasan, MD
Associate Professor
Director of Neuroradiology
University of Michigan Health System
Diffusion and Perfusion Imaging
in the Head and Neck
Disclosures
No relevant financial disclosures
Learning objectives
Review technical aspects and challenges of diffusion and perfusion imaging
Discuss clinical applications in the head and neck
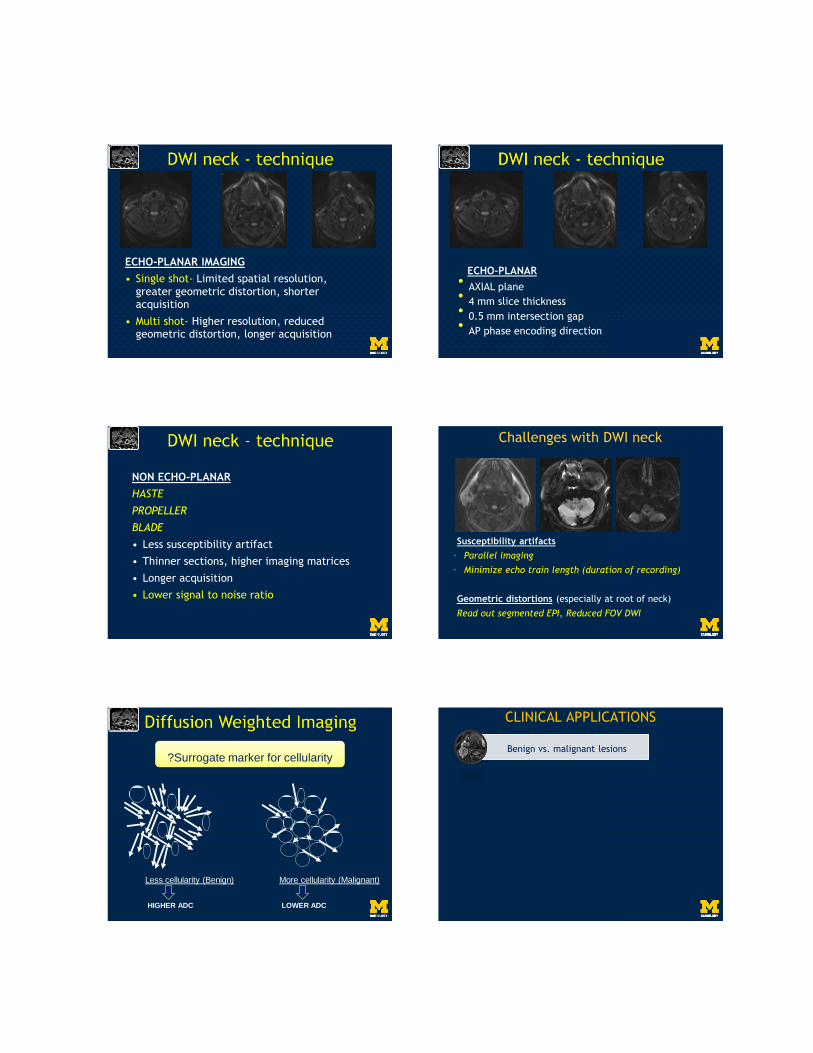
43 y/o M status post parotidectomy
???
CT Perfusion
MRI – diffusion weighted imaging
MRI – Perfusion imaging
Imaging of diffusion of water molecules
Strong gradients in 3 orthogonal directions
ADC (Apparent diffusion coefficient)
Expressed in mm2/s
Higher the ADC, more is the degree of
motion (and vice versa)
ECHO-PLANAR IMAGING
• Single shot- Limited spatial resolution, greater geometric distortion, shorter acquisition
• Multi shot- Higher resolution, reduced geometric distortion, longer acquisition
ECHO-PLANAR• AXIAL plane• 4 mm slice thickness• 0.5 mm intersection gap• AP phase encoding direction
NON ECHO-PLANAR
HASTE
PROPELLER
BLADE
• Less susceptibility artifact
• Thinner sections, higher imaging matrices
• Longer acquisition
• Lower signal to noise ratio
Challenges with DWI neck
Susceptibility artifacts
• Parallel imaging
• Minimize echo train length (duration of recording)
Geometric distortions (especially at root of neck)
Read out segmented EPI, Reduced FOV DWI
Less cellularity (Benign)
HIGHER ADC
?Surrogate marker for cellularity
More cellularity (Malignant)
LOWER ADC
CLINICAL APPLICATIONS
Benign vs. malignant lesions
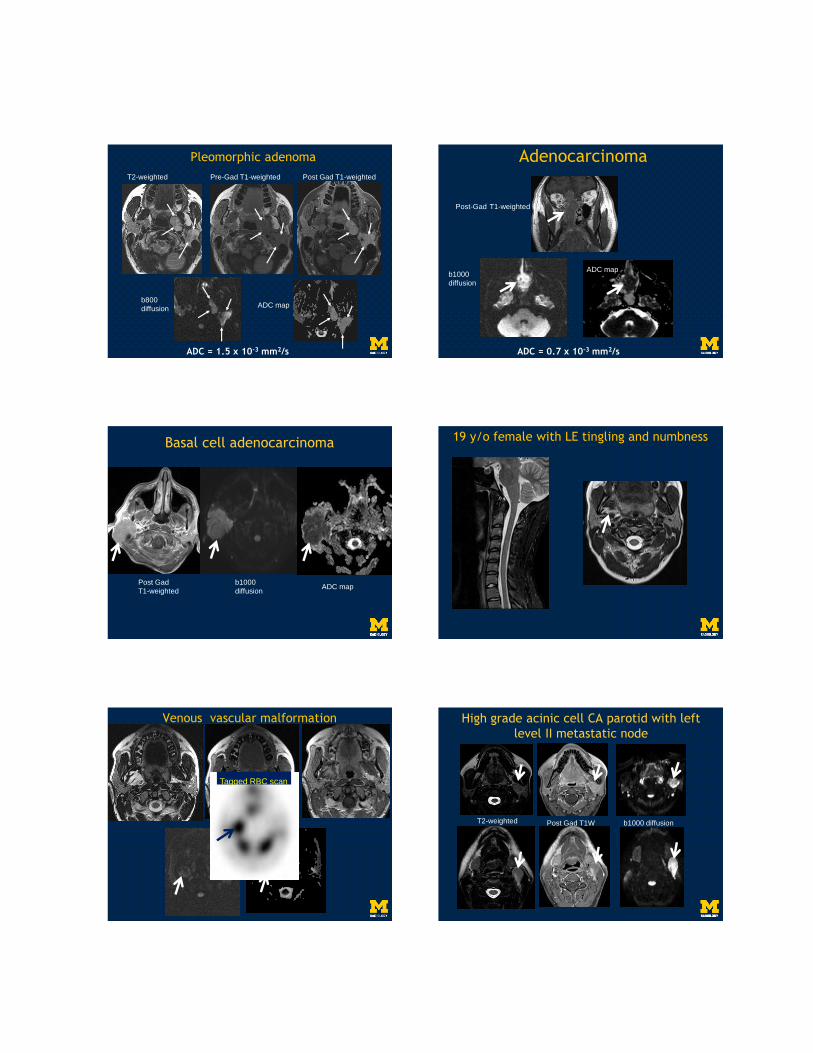
Pleomorphic adenoma
T2-weighted Pre-Gad T1-weighted Post Gad T1-weighted
b800
diffusionADC map
ADC = 1.5 x 10⁻³ mm2/s
Adenocarcinoma
ADC = 0.7 x 10⁻³ mm2/s
Post-Gad T1-weighted
b1000
diffusion
ADC map
Basal cell adenocarcinoma
Post Gad
T1-weighted
b1000
diffusionADC map
19 y/o female with LE tingling and numbness
Venous vascular malformation
Tagged RBC scan
High grade acinic cell CA parotid with left
level II metastatic node
T2-weighted Post Gad T1W b1000 diffusion
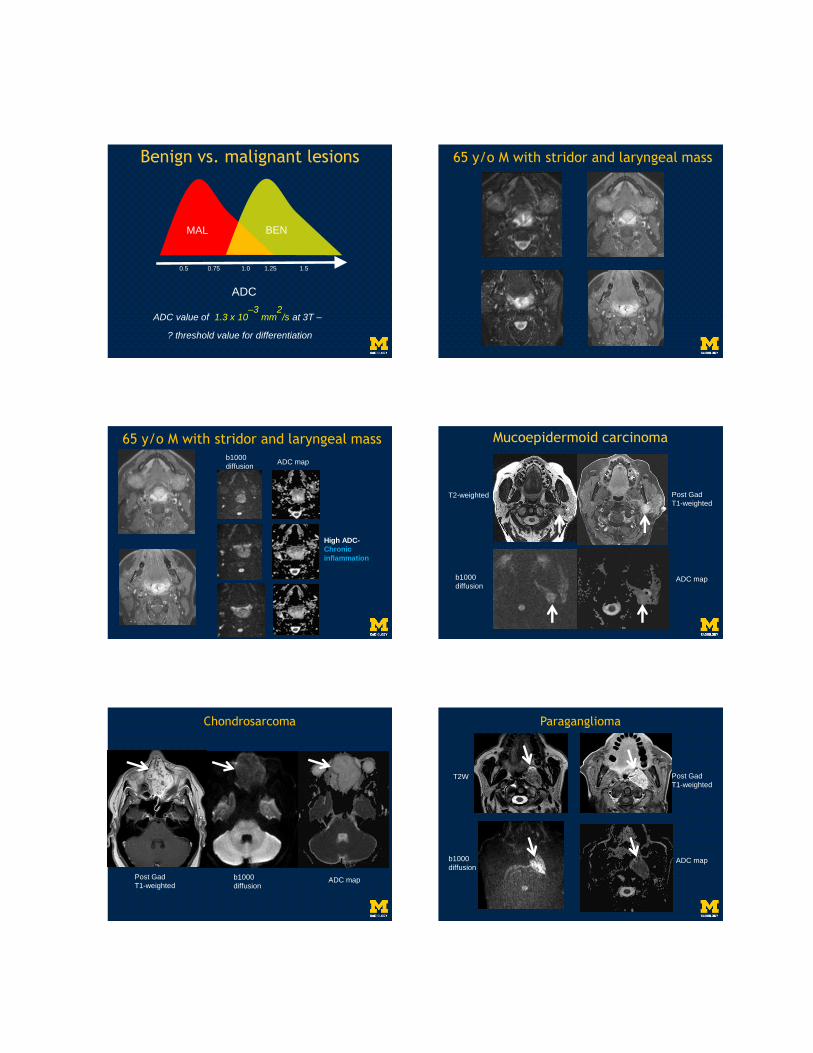
Benign vs. malignant lesions
ADC
0.5 0.75 1.0 1.25 1.5
MAL BEN
ADC value of 1.3 x 10⁻³
mm2
/s at 3T –
? threshold value for differentiation
65 y/o M with stridor and laryngeal mass
65 y/o M with stridor and laryngeal massb1000
diffusionADC map
High ADC-
Chronic
inflammation
Mucoepidermoid carcinoma
T2-weighted Post Gad
T1-weighted
b1000
diffusionADC map
Post Gad
T1-weightedb1000
diffusionADC map
Chondrosarcoma Paraganglioma
T2W Post Gad
T1-weighted
b1000
diffusionADC map
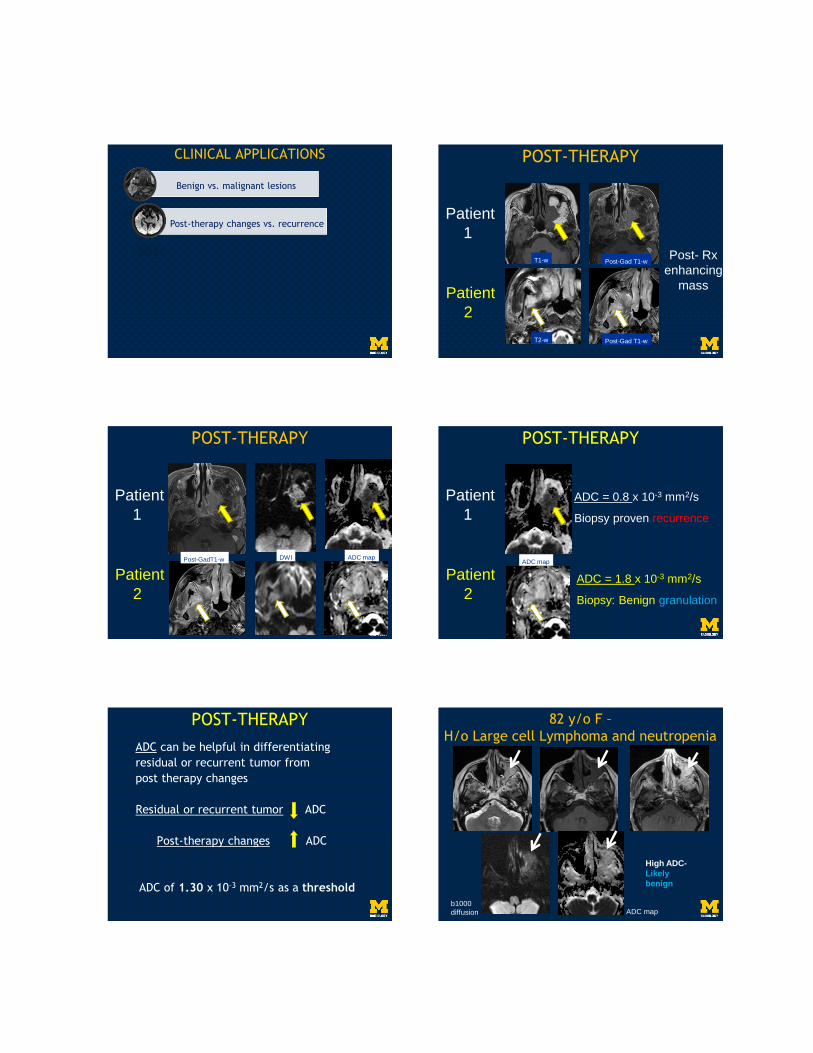
CLINICAL APPLICATIONS
Benign vs. malignant lesions
Post-therapy changes vs. recurrence
T1-w Post-Gad T1-w
T2-w Post-Gad T1-w
Post- Rx
enhancing
mass
Patient
1
Patient
2
POST-THERAPY
Patient
1
Patient
2
Post-GadT1-w DWI ADC map
POST-THERAPY
Patient
1
Patient
2
ADC = 0.8 x 10⁻³ mm2/s
Biopsy proven recurrence
ADC = 1.8 x 10⁻³ mm2/s
Biopsy: Benign granulation
ADC map
POST-THERAPY
ADC can be helpful in differentiating
residual or recurrent tumor from
post therapy changes
Residual or recurrent tumor ADC
Post-therapy changes ADC
ADC of 1.30 x 10⁻³ mm2/s as a threshold
POST-THERAPY 82 y/o F –
H/o Large cell Lymphoma and neutropenia
High ADC-
Likely
benign
b1000
diffusion ADC map
High ADC-
No malignancy on
path
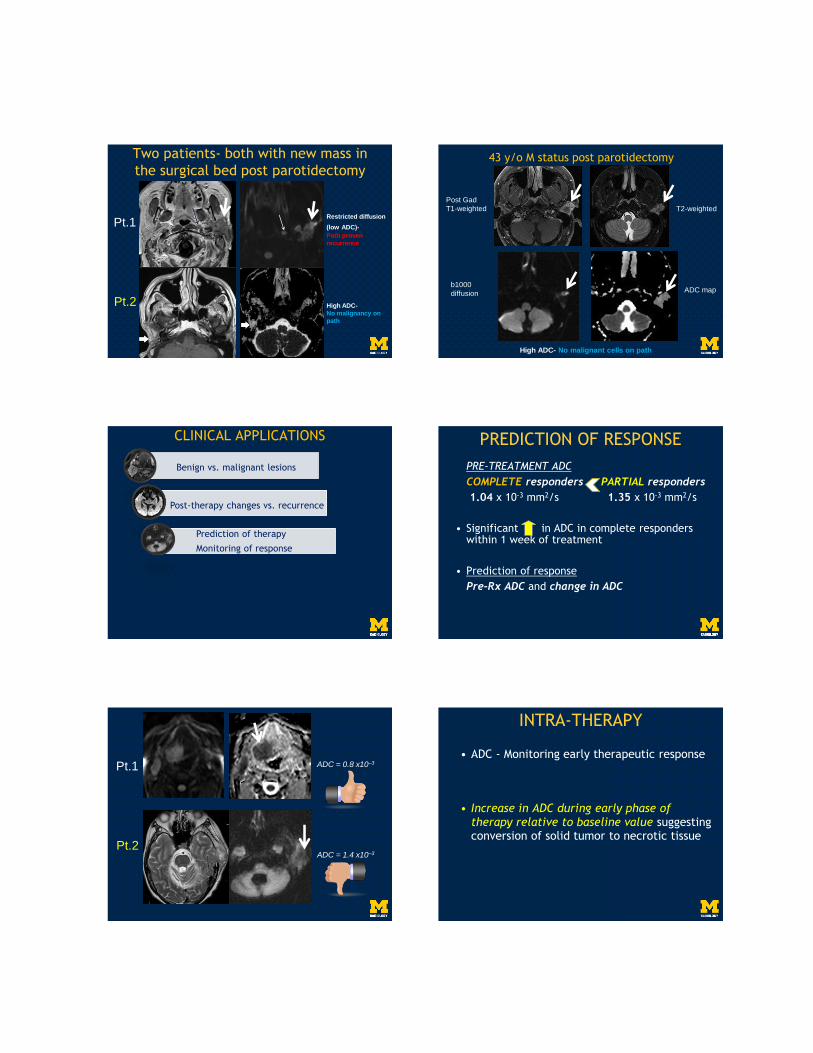
Two patients- both with new mass in
the surgical bed post parotidectomy
Restricted diffusion
(low ADC)-
Path proven
recurrence
Pt.1
Pt.2
T2-weighted
Post Gad
T1-weighted
b1000
diffusionADC map
43 y/o M status post parotidectomy
High ADC- No malignant cells on path
CLINICAL APPLICATIONS
Benign vs. malignant lesions
Post-therapy changes vs. recurrence
Prediction of therapy
Monitoring of response
PRE-TREATMENT ADC
COMPLETE responders PARTIAL responders
1.04 x 10⁻³ mm2/s 1.35 x 10⁻³ mm2/s
• Significant in ADC in complete responders within 1 week of treatment
• Prediction of response
Pre-Rx ADC and change in ADC
PREDICTION OF RESPONSE
ADC = 0.8 x10⁻³
ADC = 1.4 x10⁻³
Pt.1
Pt.2
• ADC - Monitoring early therapeutic response
• Increase in ADC during early phase of
therapy relative to baseline value suggesting conversion of solid tumor to necrotic tissue
INTRA-THERAPY
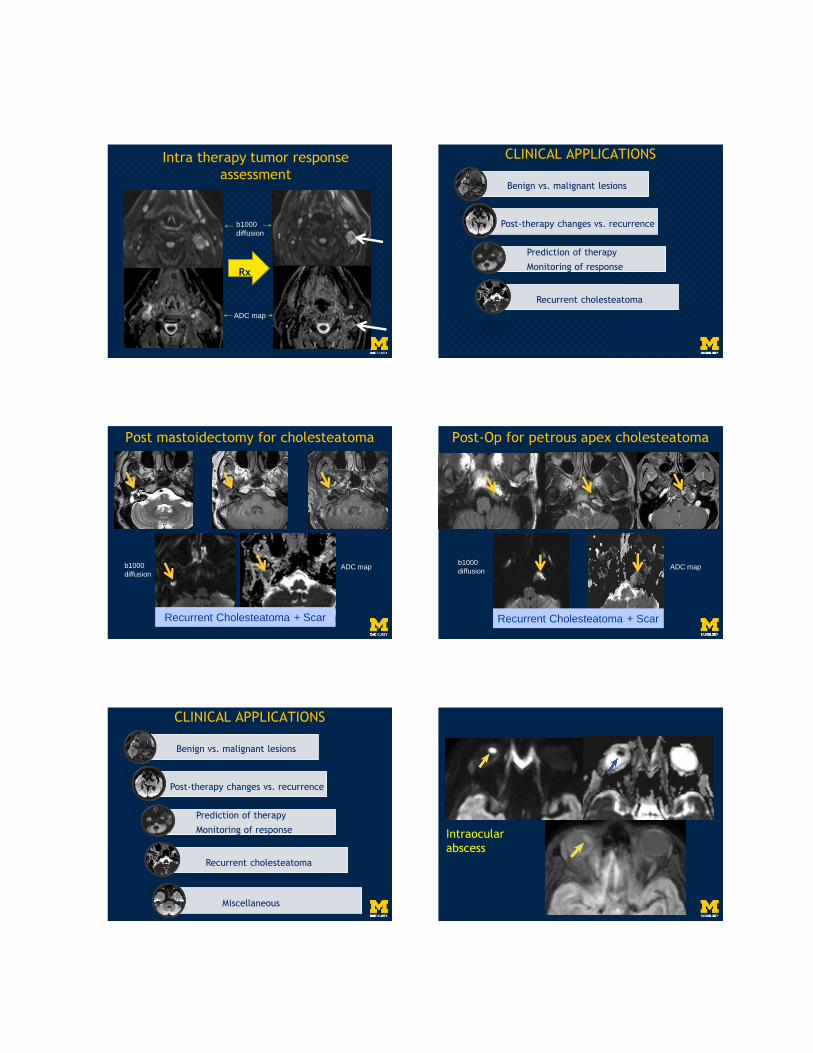
Intra therapy tumor response
assessment
Rx
b1000
diffusion
ADC map
CLINICAL APPLICATIONS
Benign vs. malignant lesions
Post-therapy changes vs. recurrence
Prediction of therapy
Monitoring of response
Recurrent cholesteatoma
Recurrent Cholesteatoma + Scar
b1000
diffusionADC map
Post mastoidectomy for cholesteatoma
Recurrent Cholesteatoma + Scar
b1000
diffusionADC map
Post-Op for petrous apex cholesteatoma
CLINICAL APPLICATIONS
Benign vs. malignant lesions
Post-therapy changes vs. recurrence
Prediction of therapy
Monitoring of response
Miscellaneous
Recurrent cholesteatoma
Intraocular
abscess
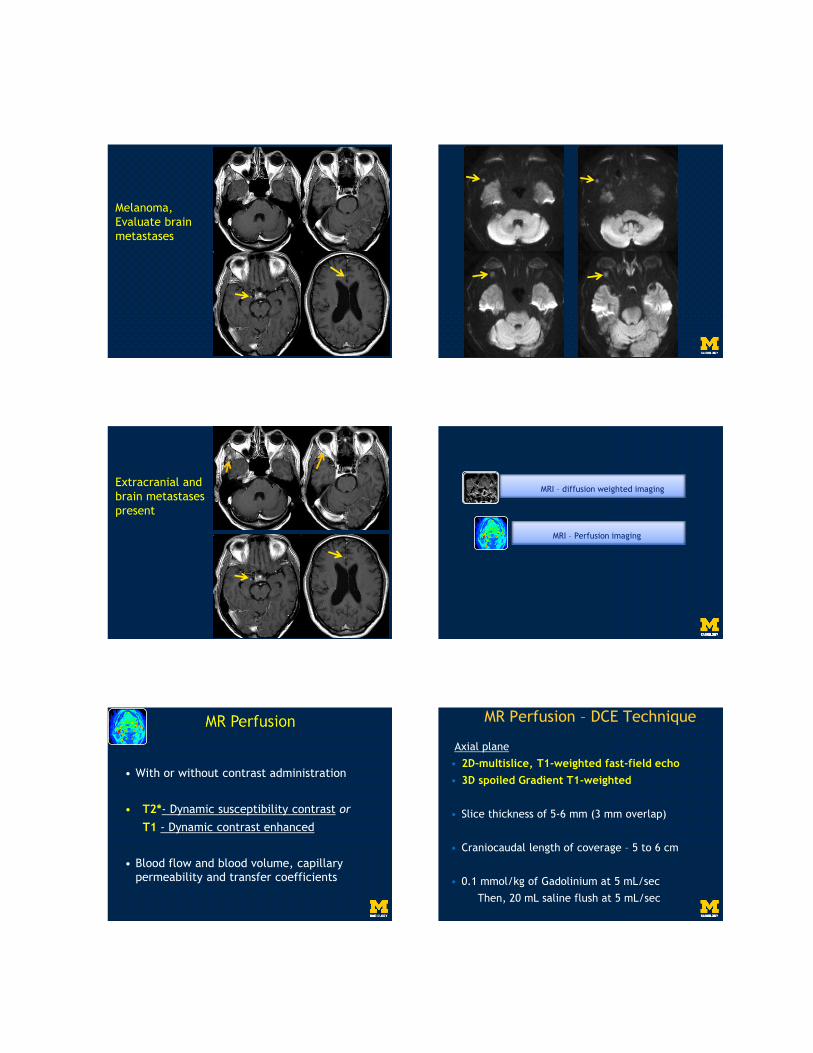
Melanoma,
Evaluate brain
metastases
Extracranial and
brain metastases
present
MRI – diffusion weighted imaging
MRI – Perfusion imaging
• With or without contrast administration
• T2*- Dynamic susceptibility contrast or
T1 - Dynamic contrast enhanced
• Blood flow and blood volume, capillary permeability and transfer coefficients
Axial plane
• 2D-multislice, T1-weighted fast-field echo
• 3D spoiled Gradient T1-weighted
• Slice thickness of 5-6 mm (3 mm overlap)
• Craniocaudal length of coverage – 5 to 6 cm
• 0.1 mmol/kg of Gadolinium at 5 mL/sec
Then, 20 mL saline flush at 5 mL/sec
MR Perfusion – DCE Technique
• Patient motion
• Skull base susceptibility artifacts
• Good cardiovascular function
• Good renal function
• Values are relative, so semi-quantitative
MR Perfusion - Challenges
Benign vs. malignant
MRI – Perfusion imaging
Razek AA et al. Eur J Radiol. 2011;77:73-79. Razek AA et al. JCAT 2011;35:21-25.
DSC % threshold value
Could be helpful for differentiating
malignant from benign nodes and
metastatic from lymphomatous nodes
Mean DSC% of malignant tumor >>
Mean DSC% of benign lesions
Ve WIR
Benign vs. malignant
Prediction of outcome
MRI – Perfusion imaging
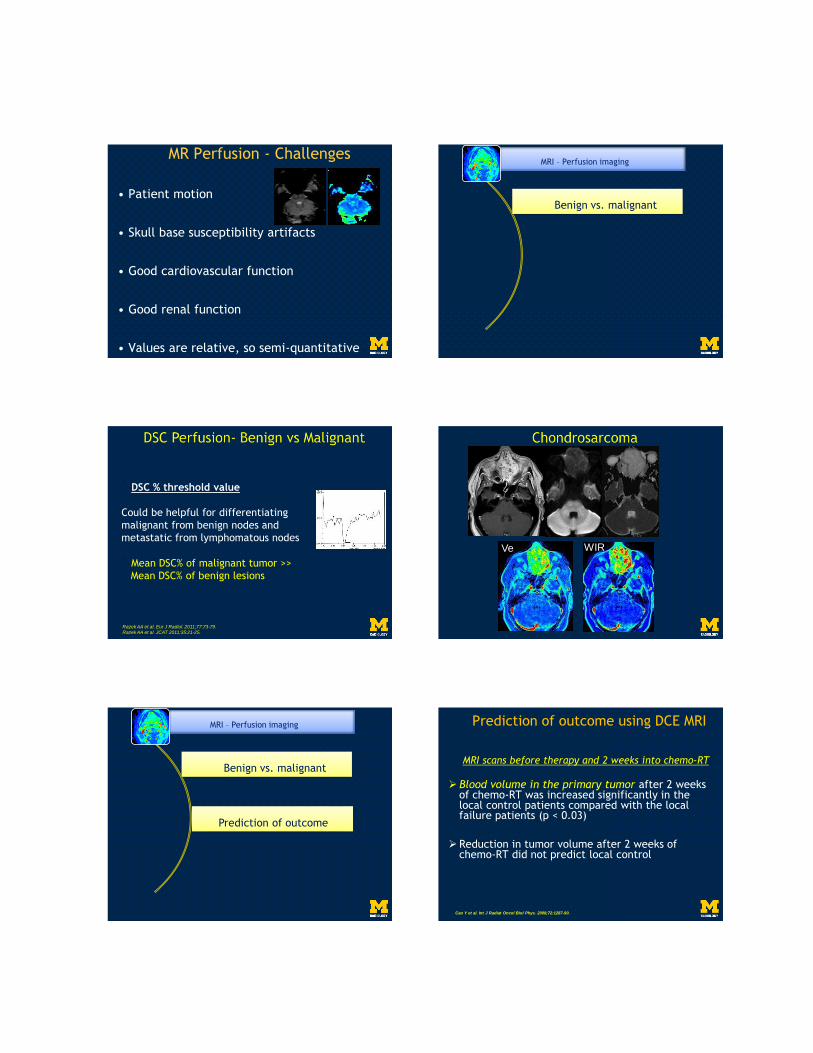
MRI scans before therapy and 2 weeks into chemo-RT
Blood volume in the primary tumor after 2 weeks of chemo-RT was increased significantly in the local control patients compared with the local failure patients (p < 0.03)
Reduction in tumor volume after 2 weeks of chemo-RT did not predict local control
Prediction of outcome using DCE MRI
Cao Y et al. Int J Radiat Oncol Biol Phys. 2008;72:1287-90.
Pre-Tx During Tx Post-Tx
(Courtesy: Srinivasan et al. Biologic imaging of head and neck cancer. AJNR 2012;33:586-94)
Blood volume Blood volume Blood volume
Kim S et al. AJNR 2010;31:262-8.
Pre-Rx
HIGH
K(TRANS)
Pre-Rx
LOW
K (TRANS)
COMPLETE RESPONSE
PARTIAL RESPONSE
0
0.1
0.2
0.3
0.4
0.5
0.6
0.7
0.8
0.9
1
Benign vs. malignant
Recurrent tumor
MRI – Perfusion imaging
Prediction of outcome
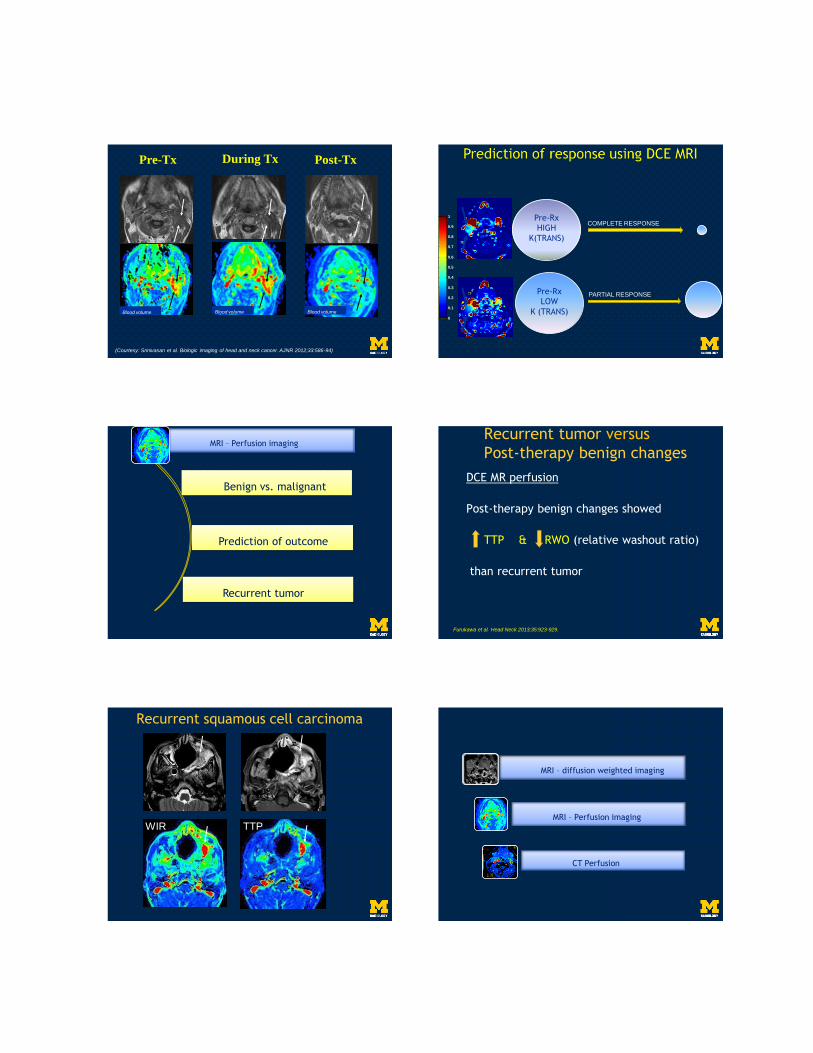
Recurrent tumor versus
Post-therapy benign changes
DCE MR perfusion
Post-therapy benign changes showed
TTP & RWO (relative washout ratio)
than recurrent tumor
Furukawa et al. Head Neck 2013;35:923-929.
Recurrent squamous cell carcinoma
WIR TTP
CT Perfusion
MRI – diffusion weighted imaging
MRI – Perfusion imaging
CT Perfusion
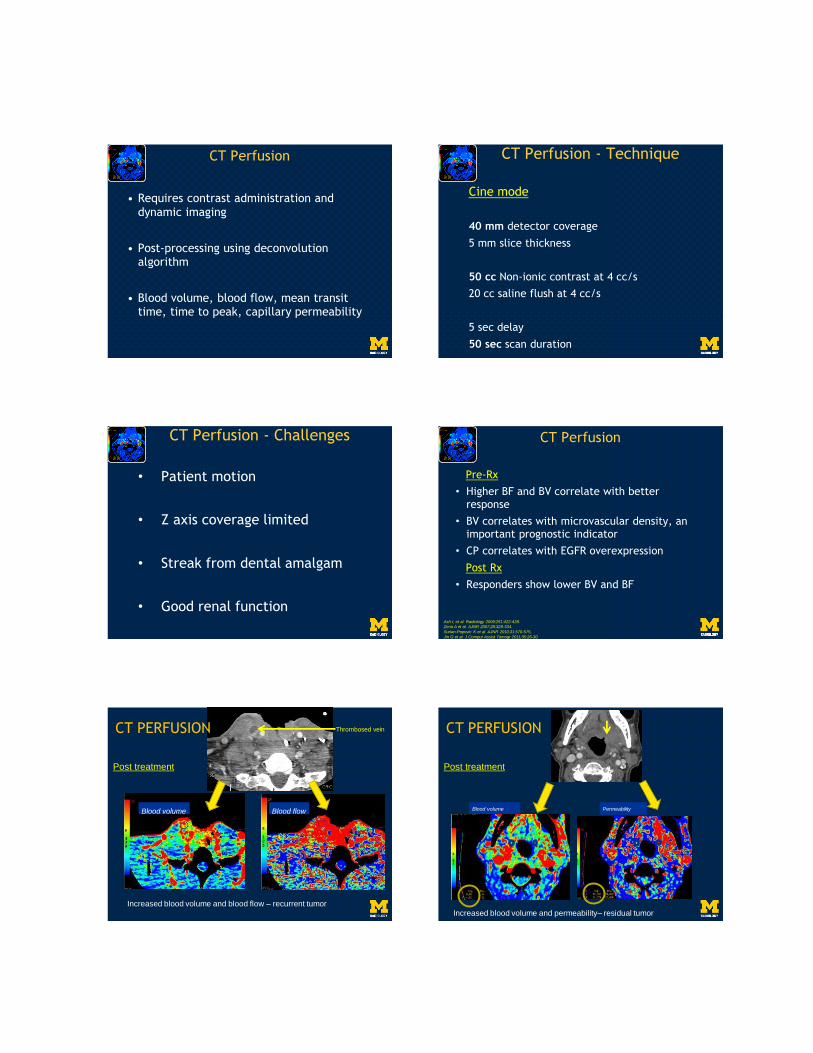
• Requires contrast administration and dynamic imaging
• Post-processing using deconvolutionalgorithm
• Blood volume, blood flow, mean transit time, time to peak, capillary permeability
Cine mode
40 mm detector coverage
5 mm slice thickness
50 cc Non-ionic contrast at 4 cc/s
20 cc saline flush at 4 cc/s
5 sec delay
50 sec scan duration
CT Perfusion - Technique
• Patient motion
• Z axis coverage limited
• Streak from dental amalgam
• Good renal function
CT Perfusion - Challenges
Pre-Rx
• Higher BF and BV correlate with better response
• BV correlates with microvascular density, an important prognostic indicator
• CP correlates with EGFR overexpression
Post Rx
• Responders show lower BV and BF
Ash L et al. Radiology 2009;251:422-428.
Zima A et al. AJNR 2007;28:328-334.
Surlan-Popovic K et al. AJNR 2010;31:570-575.
Jin G et al. J Comput Assist Tomogr 2011;35:26-30.
CT Perfusion
CT PERFUSION
Post treatment
Increased blood volume and blood flow – recurrent tumor
Blood volume Blood flow
Thrombosed vein CT PERFUSION
Post treatment
Increased blood volume and permeability– residual tumor
Blood volume Permeability
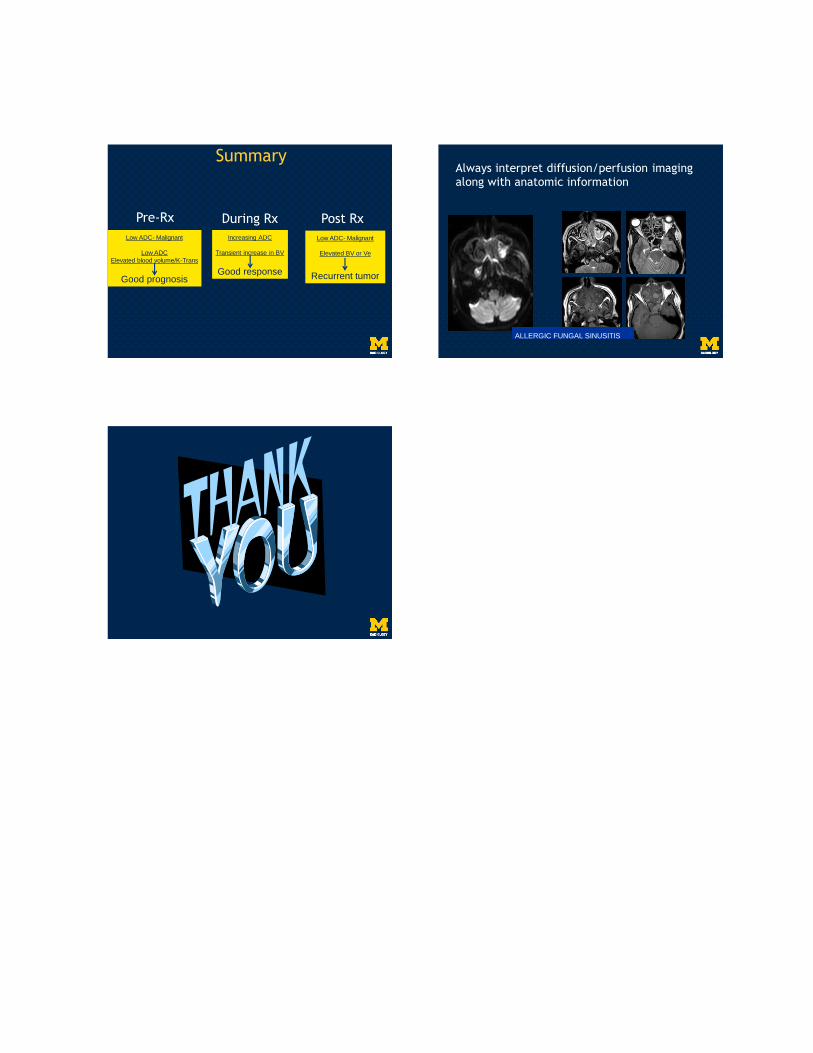
Summary
Pre-Rx During Rx Post Rx
Low ADC- Malignant
Low ADC
Elevated blood volume/K-Trans
Good prognosis
Increasing ADC
Transient increase in BV
Good response
Low ADC- Malignant
Elevated BV or Ve
Recurrent tumor
Always interpret diffusion/perfusion imaging along with anatomic information
ALLERGIC FUNGAL SINUSITIS