1 DIFFUSION & PERFUSION MRI IMAGING Dr. Wael Darwish.
75
1 DIFFUSION & PERFUSION DIFFUSION & PERFUSION MRI IMAGING MRI IMAGING Dr. Wael Darwish Dr. Wael Darwish
-
Upload
sherilyn-berry -
Category
Documents
-
view
224 -
download
4
Transcript of 1 DIFFUSION & PERFUSION MRI IMAGING Dr. Wael Darwish.

1
DIFFUSION & PERFUSIONDIFFUSION & PERFUSIONMRI IMAGINGMRI IMAGING
Dr. Wael DarwishDr. Wael Darwish
2
DIFFUSION MRI IMAGING

3
- History -
• The feasibility of diffusion images was demonstrated in the middle 1980s
• Demonstration on clinical studies is more recent ; it corresponds with the availability of EPI on MR system
• A single shot EPI sequence can freeze the macroscopic pulsating motion of the brain or motion of the patient’s head

4
Diffusion Weighted Image • Core of infarct = irreversible damage• Surrounding ischemic area may be salvaged• DWI: open a window of opportunity during which ttt is
beneficial • DWI: images the random motion of water molecules as
they diffuse through the extra-cellular space• Regions of high mobility “rapid diffusion” dark• Regions of low mobility “slow diffusion” bright• Difficulty: DWI is highly sensitive to all of types of
motion (blood flow, pulsatility, bulk patient motion,……).

Diffusion gradients sensitize MR Image to Diffusion gradients sensitize MR Image to motion of water moleculesmotion of water molecules
More motion = Darker image More motion = Darker image
Freely Diffusing Water = DarkFreely Diffusing Water = Dark Restricted Diffusion = BrightRestricted Diffusion = Bright
- Diffusion contrast -

6
- Principles -Velocities and methods of
measurementFast Flow Arteries ~1000mm/ s “Phase Contrast”
Slow Flow Veins ~100mm/ s “Phase Contrast”
Perfusion Capillaries ~1mm/ s Contrast Wash out
Diffusion Intercellular space
~ 0,001mm/ s Diffusion weighting

7
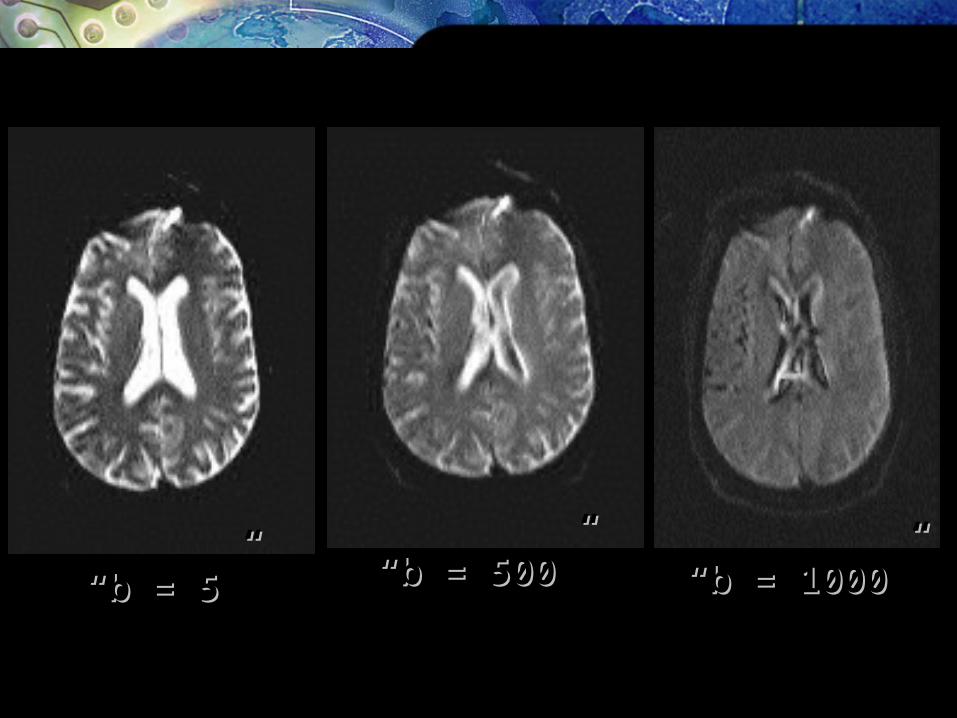
- Principles -About the b factor
• b is a value that include all gradients effect
(imaging gradients + diffusion gradients)
• The b value can be regarded as analogous to the TE for the T2 weighting
Low Medium
High
““b = 5”b = 5” ““b = 500”b = 500” ““b = 1000”b = 1000”

9
- Principles -About ADC
The ADC value does not depend on the field strength of the magnet or on the pulse sequence used (which is different for T1 or T2)
The ADC obtained at different times in a given patient or in different patients or in different hospitals can be compared

10
- Principles -Isotropic and Anisotropic diffusion
• Diffusion is a three dimensional process, but molecular mobility may not be the same in all directions
• In brain white matter, diffusion’s value depends on the orientation of the myelin fiber tracts and on the gradient direction*

X Diffusion - WeightingX Diffusion - Weighting Y Diffusion - WeightingY Diffusion - Weighting Z Diffusion - WeightingZ Diffusion - Weighting
Anisotropic diffusion : Individual Anisotropic diffusion : Individual direction weighteddirection weighted

Individual DiffusionIndividual DiffusionDirectionsDirections
Mathematical CombinationMathematical Combination(Sorensen et al., MGH)(Sorensen et al., MGH)
Isotropic Diffusion-Isotropic Diffusion-Weighted ImageWeighted Image
- + x /- + x /
Isotropic diffusionIsotropic diffusion

13
Diffusion weighted image

TE=100msTE=100msSR 120SR 120
TE=75msTE=75msSR150SR150
b = 1000 s/mmb = 1000 s/mm22
Short TE DWI gives more SNRShort TE DWI gives more SNR
Characteristics of diffusion’s contrastCharacteristics of diffusion’s contrast

Higher b value increases sensitivityHigher b value increases sensitivity
b = 1000 b= 3000
MS
Stroke
TumorVasogenic edema
Cytotoxic Edema
Higher CNR helpsdistinguish active lesions
Higher CNR
Vasogenic edema
Characteristics of diffusion’s contrastCharacteristics of diffusion’s contrast
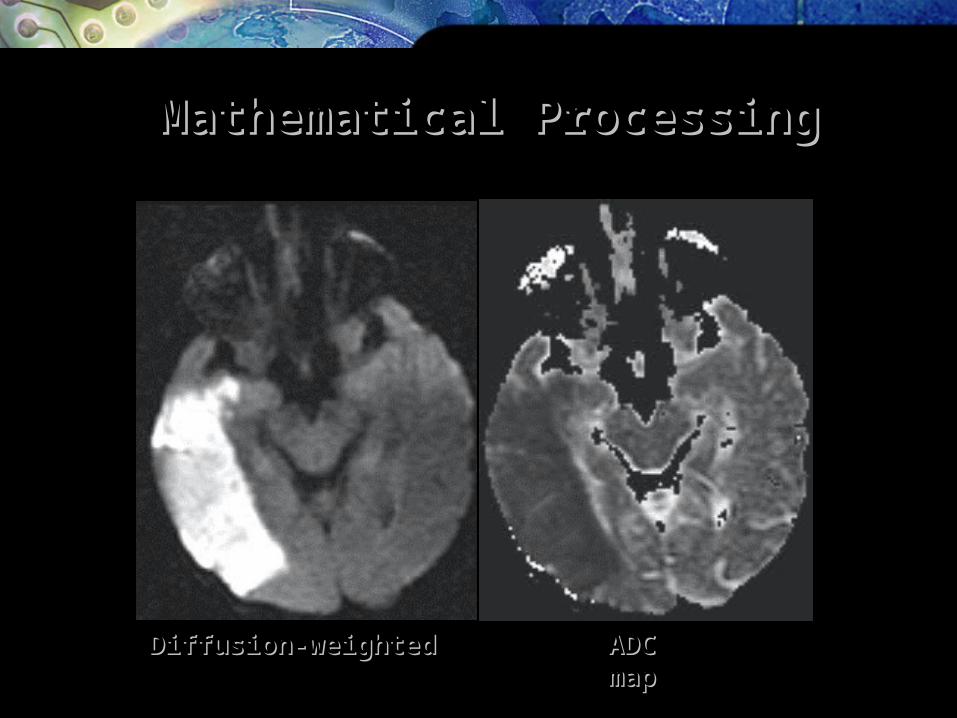
Diffusion-weighted Diffusion-weighted ADCADC
mapmap
Mathematical ProcessingMathematical Processing

Diffusion-weightedDiffusion-weighted ADCADCmapmap
Exponential ADCExponential ADC
Mathematical ProcessingMathematical Processing
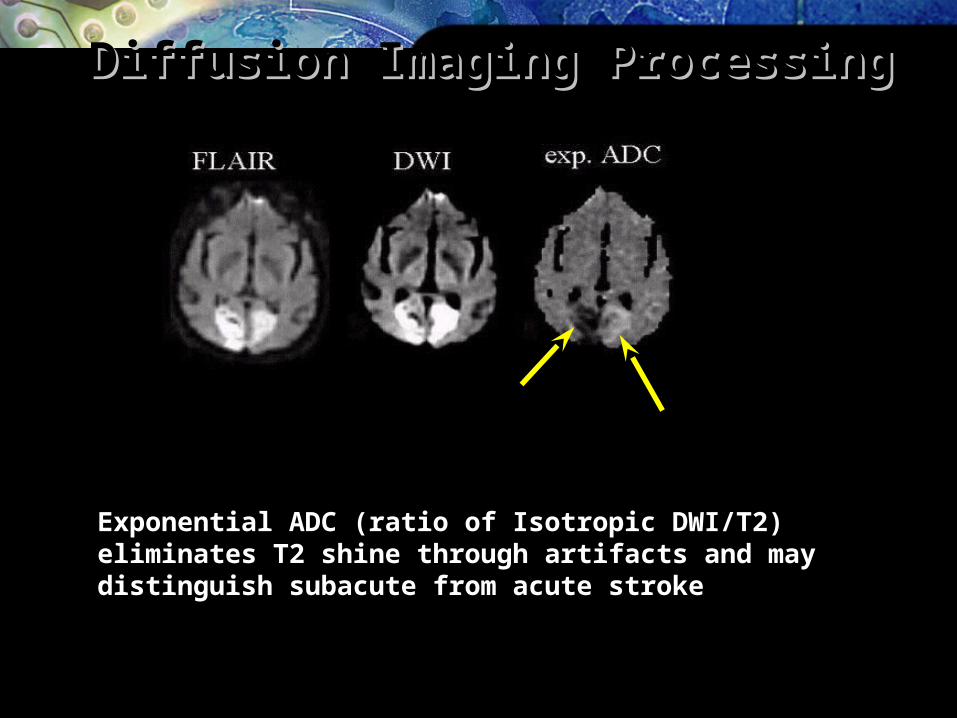
Exponential ADC (ratio of Isotropic DWI/T2)Exponential ADC (ratio of Isotropic DWI/T2)eliminates T2 shine through artifacts and may eliminates T2 shine through artifacts and may distinguish subacute from acute strokedistinguish subacute from acute stroke
Diffusion Imaging ProcessingDiffusion Imaging Processing

b=0b=0
eADCeADCADCADC
b=1000b=1000
Arachnoid CystArachnoid Cyst

20
Clinical Clinical Application Application

21
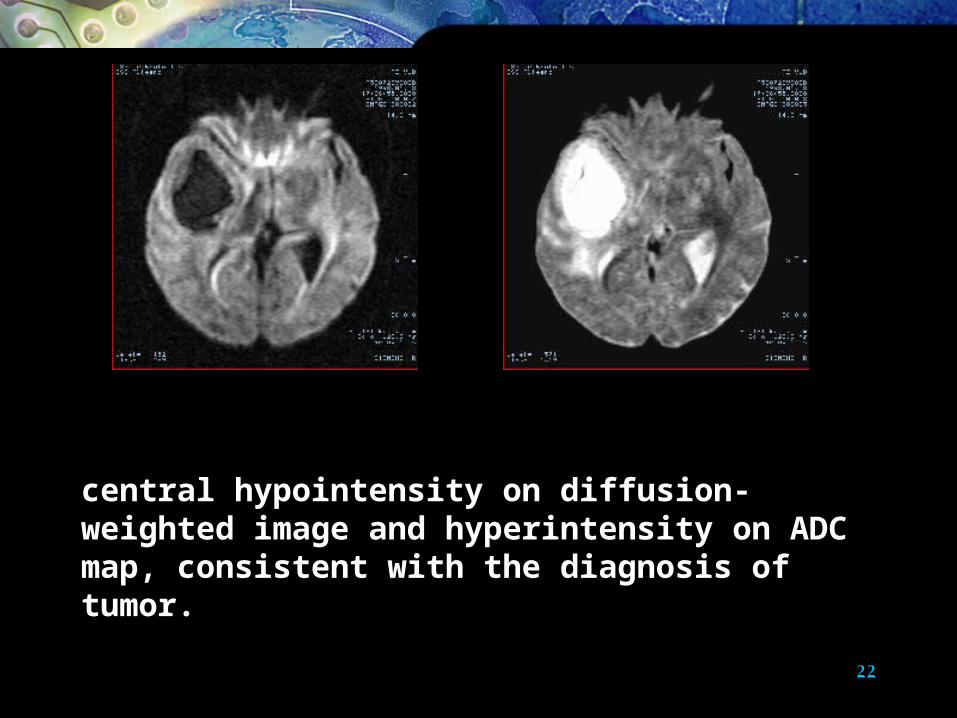
MR Images of 60-Year-Old Man with Glioblastoma
Multiforme.
2. Figures 1, 2. On (1) T2-weighted fast spin-echo and (2) contrast-enhanced T1-weighted spin-echo images, the differential diagnosis between glioblastoma and abscess is impossible.
22
.
3. 4. central hypointensity on diffusion-weighted image and hyperintensity on ADC map, consistent with the diagnosis of tumor.

23
MR Images of 57-Year-Old Woman with Cerebral
Metastasis
5. 6.

24
7. 8. central hypointensity on diffusion-weighted image and hyperintensity on ADC map, consistent with the diagnosis of tumor.

25
1.
2. MR Images of 70-Year-Old Man with History of Recent Vertigo and Disequilibrium

26
3. 4. A brain abscess with Streptococcus anginosus was found at surgery.

27
5.
6. the differential diagnosis between metastasis and abscess is impossible.
MR Images of 57-Year-Old Woman with Cerebral Metastasis

28
7.
8 . Central hypointensity is seen on the diffusion-weighted image and hyperintensity on the ADC map, consistent with the diagnosis of tumor.

29
APPLICATIONS
SPINE

30
BENIGN VERSUS MALIGNANT FRACTURE

31
• This finding indicates that the lack of signal reduction in malignant vertebral fractures is caused by tumor cell infiltration
• Different diffusion effect is caused by more restriction or hindrance in densely packed tumor cells compared with more mobile water in extracellular volume fractions in fractures

32
• diffusion-weighted spin-echo sequences could differentiate benign fracture edemas and fractures caused by tumor infiltration due to higher restriction of water mobility in tumor cells.
33
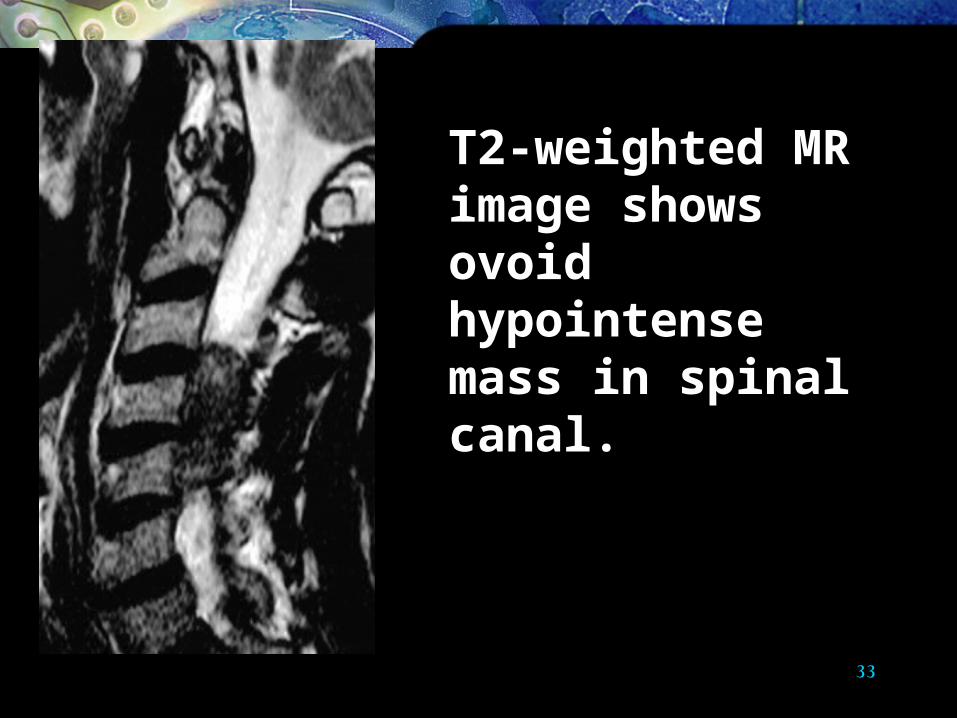
T2-weighted MR image shows ovoid hypointense mass in spinal canal.

34
T1-weighted sagittal MR image after infusion of gadolinium contrast material shows diffuse signal enhancement of mass.

35
T1-weighted transverse MR image after infusion of contrast material shows extent of tumor in spinal canal and C4-C5 neural foramen
36
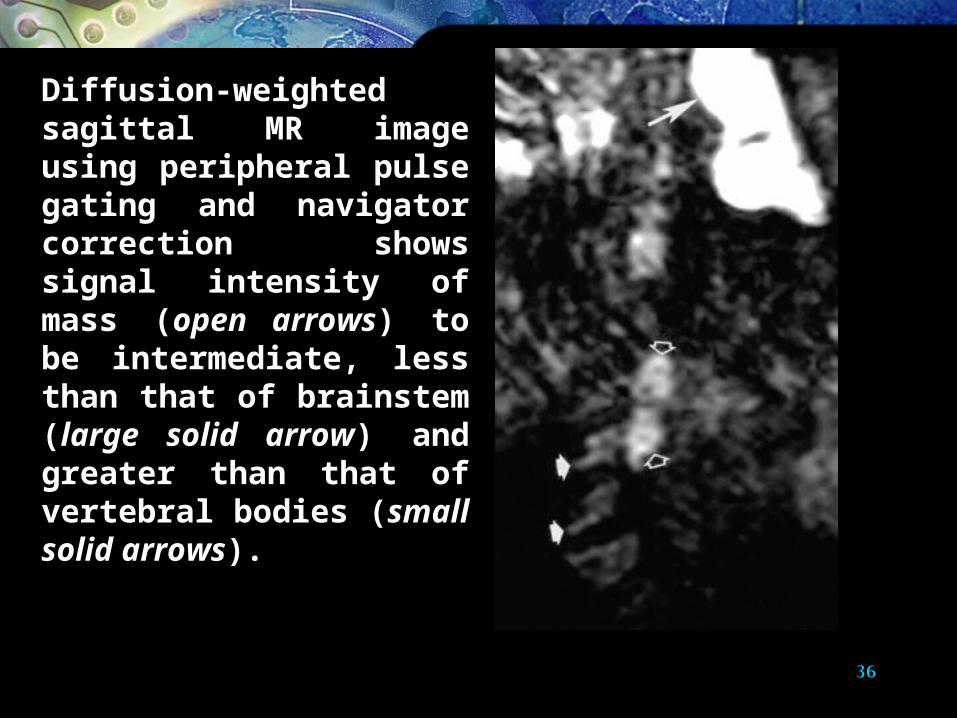
Diffusion-weighted sagittal MR image using peripheral pulse gating and navigator correction shows signal intensity of mass (open arrows) to be intermediate, less than that of brainstem (large solid arrow) and greater than that of vertebral bodies (small solid arrows).

37
ADC map shows mass (arrows) as structure of intermediate intensity.

38
• In that study, tumors with high cellularity had low mean ADC values, and tumors with low cellularity had high mean ADC values.
• In addition, the relatively high ADC value seen in our patient corresponded to a low degree of cellularity, such as has been reported in cerebral gliomas.

39
Perfusion imagingPerfusion imaging
• DefinitionsDefinitions
• PrinciplesPrinciples
• Some more definitionsSome more definitions
• Perfusion techniquePerfusion technique
• ApplicationsApplications
• FutureFuture

40
DefinitionsDefinitions
• Perfusion is refer to the delivery of oxygen Perfusion is refer to the delivery of oxygen and nutrients to the cells via capillaries and nutrients to the cells via capillaries
• Perfusion is identified with blood flowPerfusion is identified with blood flow which is measured in milliliters per minute which is measured in milliliters per minute per 100 g of tissue per 100 g of tissue

41
PrinciplesPrinciples
After injection of a contrast agentAfter injection of a contrast agent
• In normal brainIn normal brain, the paramagnetic contrast agent , the paramagnetic contrast agent remains enclosed within the cerebral vasculature remains enclosed within the cerebral vasculature because of the blood brain barrier because of the blood brain barrier
• The difference in The difference in magnetic susceptibilitymagnetic susceptibility between the between the tissue and the blood results in local magnetic field tissue and the blood results in local magnetic field finally to large signal lossfinally to large signal loss

42
Some more DefinitionsSome more Definitions• rCBF “ the rate of supply of Gd chelate to a specified mass ” rCBF “ the rate of supply of Gd chelate to a specified mass ”
( ml / 100g / min)( ml / 100g / min)
• rCBV - “ the volume of distribution of the Gd chelate during its rCBV - “ the volume of distribution of the Gd chelate during its first passage through the brain ” first passage through the brain ” ( % or ml / 100g )( % or ml / 100g )
• MTT - “ the average time required for any given particle to pass MTT - “ the average time required for any given particle to pass through the tissue, following an idealised input function ” through the tissue, following an idealised input function ” (min (min or s)or s) MTT = rCBV / rCBF MTT = rCBV / rCBF

43
► Passage of Gd. can be followed by the Passage of Gd. can be followed by the changes in the relaxation rates changes in the relaxation rates concentration of local contrast. concentration of local contrast.
► Linear relation bet. concentration and rates Linear relation bet. concentration and rates of signal changes can be expressed as of signal changes can be expressed as curve. curve.
► Tissue contrast concentration time curve Tissue contrast concentration time curve can be used to determine tissue micro can be used to determine tissue micro vascularity, volume and flow.vascularity, volume and flow.

slice n
time
intensity
~ ‘mean transit time’
Integral:=cerebral blood volume
At each voxel we observe :At each voxel we observe :
time
45
PrinciplesPrinciples
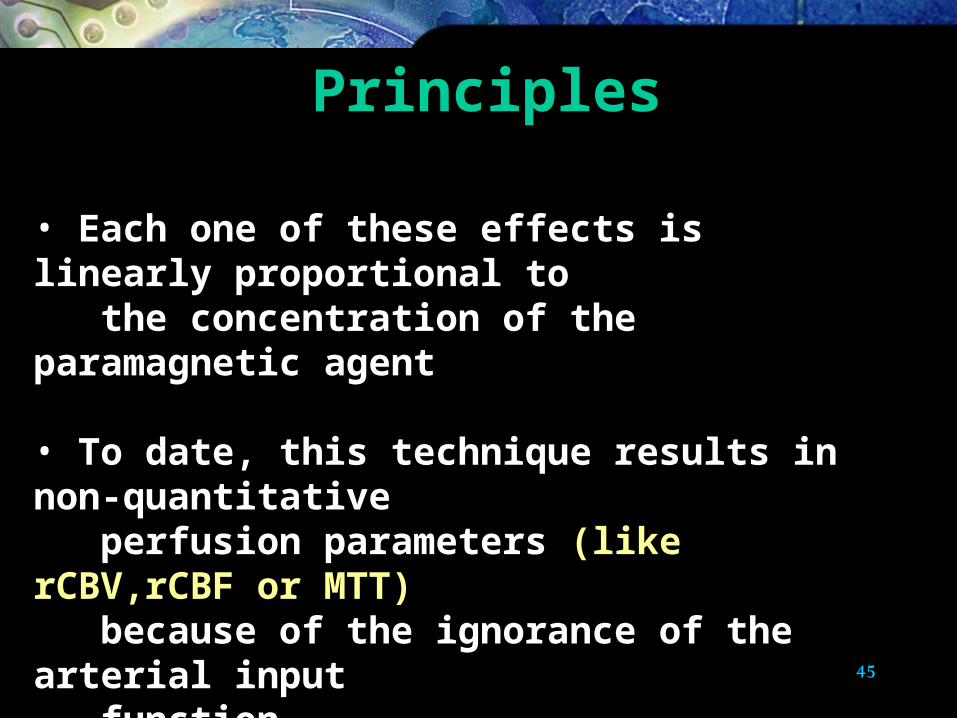
• Each one of these effects is linearly proportional toEach one of these effects is linearly proportional to the concentration of the paramagnetic agent the concentration of the paramagnetic agent
• To date, this technique results in non-quantitative To date, this technique results in non-quantitative perfusion parameters perfusion parameters (like rCBV,rCBF or MTT)(like rCBV,rCBF or MTT) because of the ignorance of the arterial input because of the ignorance of the arterial input function function

PrinciplesPrinciples
Extract time-intensity Extract time-intensity curvescurves
Perform mathematicalPerform mathematicalmanipulationmanipulation
Generate functional Generate functional mapsmaps++ ++
- + x /- + x /
Negative Enhancement Negative Enhancement Integral Map(NEI)Integral Map(NEI)
Qualitative rCBV mapQualitative rCBV mapFirst PassFirst PassContrast bolusContrast bolus
Mean Time toMean Time toEnhance (MTE)MapEnhance (MTE)MapIschaemic PenumbraIschaemic Penumbra
MTEMTE
NEINEI
Dynamic Susceptibility Contrast ImagingDynamic Susceptibility Contrast Imaging

47
• Hemodynamics Bl. volume Bl. flow
• Aim 1. Diagnosis 2. Monitoring management 3. Understanding intracranial lesions
Dynamic MR perfusion

rCBVrCBV
rCBV, processed with “Negative Enhancement Integral”(NEI)rCBV, processed with “Negative Enhancement Integral”(NEI)is related to area under curveis related to area under curve

MTTMTT
MTT is related to the time to peak and to the width of the peak ; it MTT is related to the time to peak and to the width of the peak ; it is processed with “Mean Time to Enhance“(MTE)is processed with “Mean Time to Enhance“(MTE)

Cerebral blood perfusion by bolus Cerebral blood perfusion by bolus trackingtracking
power injector - Gadolium 5ml/sec
Procedure :Procedure :
1 - Start Imaging1 - Start Imaging2 - Inject Contrast*2 - Inject Contrast*3 - Continue Imaging3 - Continue Imaging
Requires very high speed imaging
10 slices - 50 images of each slice - TOTAL time 1:34 min10 slices - 50 images of each slice - TOTAL time 1:34 min
** Push Gadolinium with 20 cc of saline flushPush Gadolinium with 20 cc of saline flush

51
Applications of Perfusion MRIApplications of Perfusion MRI
• Neurology • Gerontology• Neuro-oncology• Neurophysiology• Neuropharmacology

Perfusion Imaging: Findings in InfarctionPerfusion Imaging: Findings in Infarction
• CBVCBV– regional perfusion deficitregional perfusion deficit– compensatory increased volumecompensatory increased volume
• MTTMTT– regional prolongation of transit timeregional prolongation of transit time
StrokeStroke

Head TraumaHead Trauma
T2 image showing T2 image showing bifrontal volume lossbifrontal volume loss
FLAIR image showing FLAIR image showing bifrontal gliosis and bifrontal gliosis and encephalomalaciaencephalomalacia

Head trauma:Hypo-perfusionHead trauma:Hypo-perfusion
rCBV MAPrCBV MAPTc-HMPAO SPECTTc-HMPAO SPECT
Hypo-perfusionHypo-perfusion

E.g. 1 : Left hemisphere stroke, 4.5 E.g. 1 : Left hemisphere stroke, 4.5 hrs after onset of symptomshrs after onset of symptoms
3D-TOF Vascular3D-TOF Vascular FSE-T2WFSE-T2W FSE-FLAIRFSE-FLAIR

Same patient with DWI and FLAIRSame patient with DWI and FLAIR
EPIEPI FLAIRFLAIR
4.5 hrs4.5 hrs 24 hrs24 hrs
Diffusion imaging shows Diffusion imaging shows lesion early.lesion early.
b=0b=0 b=800b=800
FLAIR shows enhanced FLAIR shows enhanced changes after 24 hrs.changes after 24 hrs.
4.5 hrs4.5 hrs

Isotropic diffusion imageIsotropic diffusion image
b=800b=800
ADC mapADC map
Apparent diffusion coefficient ADCApparent diffusion coefficient ADC

Contrast enhanced perfusion imagingContrast enhanced perfusion imaging
24 slices24 slices
3 seconds/acquisition3 seconds/acquisition
Time/intensity graphTime/intensity graph

Mean Time To EnhanceMean Time To Enhance
delayeddelayedcompensatory compensatory hyperhyperperfusionperfusion
delayed delayed hypohypoperfusionperfusion

EPI PerfusionEPI Perfusion
MTTMTTMean Time To EnhanceMean Time To Enhance
CBVCBVNegative EnhancementNegative Enhancement
IntegralIntegral
ADCDiffusion Coefficient*
EPI Diffusion and Perfusion mappingEPI Diffusion and Perfusion mapping
EPI DiffusionEPI Diffusion

Findings with Perfusion Findings with Perfusion Imaging for InfarctionImaging for Infarction
• Changes seen almost immediately after the induction of ischemiaChanges seen almost immediately after the induction of ischemia
– more sensitive than conventional MRImore sensitive than conventional MRI
• Perfusion findings often more extensive than those on DW-EPI in Perfusion findings often more extensive than those on DW-EPI in early strokeearly stroke
– more accurately reflects the amount of tissue under ischemic more accurately reflects the amount of tissue under ischemic conditions in the hyperacute period than DW EPIconditions in the hyperacute period than DW EPI
– Abnormal results correlate with an increased risk of stroke Abnormal results correlate with an increased risk of stroke
– PerfEPI - DWEPI = tissue at riskPerfEPI - DWEPI = tissue at risk

Alzheimer’s diseaseAlzheimer’s disease
• FDG PET– marked temporo-parietal
hypometabolism• Tc-HMPAO SPECT
– marked temporo-parietal hypoperfusion• DSC MRI
– correlates well with SPECT
Findings with Perfusion imaging Findings with Perfusion imaging for Gerontologyfor Gerontology

Findings with Perfusion imaging for Findings with Perfusion imaging for Neurophysiology and pharmacologyNeurophysiology and pharmacology
• Traumatic brain injuryTraumatic brain injury– focal rCBV deficits that correlate with cognitive focal rCBV deficits that correlate with cognitive
impairmentimpairment• SchizophreniaSchizophrenia
– decreased frontal lobe rCBVdecreased frontal lobe rCBV• HIV/ AIDSHIV/ AIDS
– multiple discrete foci of decreased CBVmultiple discrete foci of decreased CBV• Polysubstance abusePolysubstance abuse
– multiple discrete foci of decreased CBVmultiple discrete foci of decreased CBV
New Jersey Neuroscience InstituteNew Jersey Neuroscience Institute
Findings with Perfusion imaging Findings with Perfusion imaging for Neuro-oncologyfor Neuro-oncology
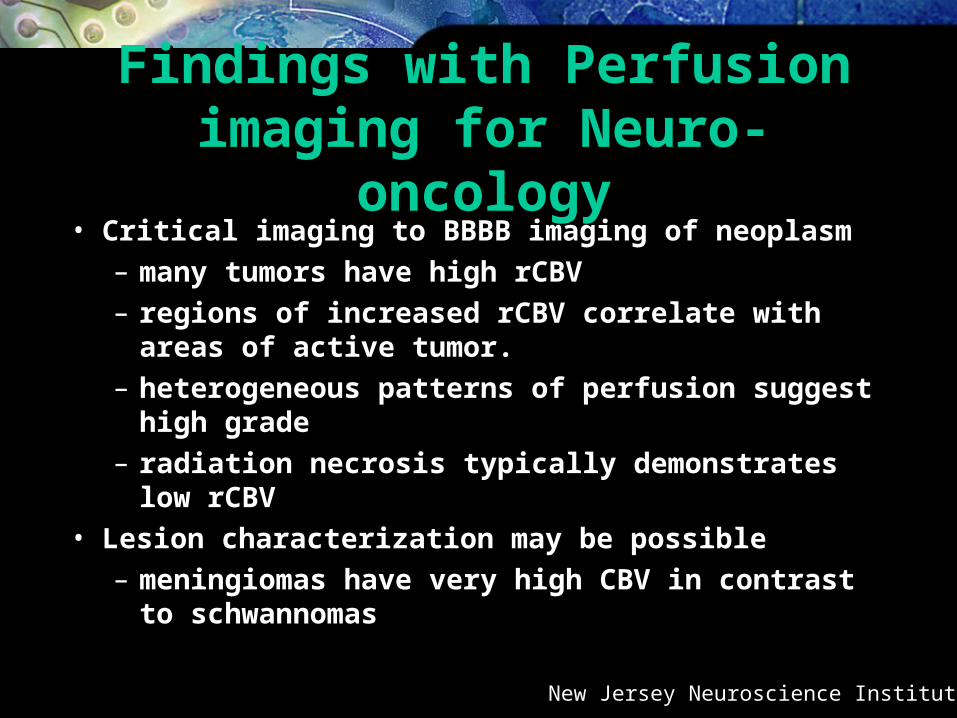
• Critical imaging to BBBB imaging of neoplasmCritical imaging to BBBB imaging of neoplasm
– many tumors have high rCBVmany tumors have high rCBV
– regions of increased rCBV correlate with areas of regions of increased rCBV correlate with areas of active tumor.active tumor.
– heterogeneous patterns of perfusion suggest high heterogeneous patterns of perfusion suggest high gradegrade
– radiation necrosis typically demonstrates low rCBVradiation necrosis typically demonstrates low rCBV
• Lesion characterization may be possibleLesion characterization may be possible
– meningiomas have very high CBV in contrast to meningiomas have very high CBV in contrast to schwannomasschwannomas
New Jersey Neuroscience InstituteNew Jersey Neuroscience Institute

65
Clinical applications:-
• Intracranial neoplasm
N.B angiogenesis usually = aggressiveness Exceptions:- 1. Meningioma 2.Choroid plexus papilloma
1.Glioma Grading Biopsy
D.D recurrence from radiation necrosis
Dynamic MR perfusion

66
2.Metastasis
Can differentiate solitary metastasis from 1ry brain neoplasm (glioma) by measuring the peritumoral relative blood volume.
3.1ry cerebral lymphoma
Can help in differentiating lymphoma from glioma as lymphoma is much less vascular
67
4. Meningioma4. Meningioma
Hypervascular Extra axial Hypervascular Extra axial
Has leaky and permeable capillaries Has leaky and permeable capillaries causing no recovery of T2* signal to causing no recovery of T2* signal to basline.basline.
5. Tumor mimicking lesions e.g.5. Tumor mimicking lesions e.g.
cerebral infectionscerebral infections
tumefactive demyelinating tumefactive demyelinating lesionslesions
less commonly infarcts less commonly infarcts

68
6.Tumefactive demyelinating lesions6.Tumefactive demyelinating lesions
No neo-vascularization in demyelinating No neo-vascularization in demyelinating lesionslesions
To concludeTo conclude
MR perfusion should be included in routine MR perfusion should be included in routine evaluation of brain tumor as it improve evaluation of brain tumor as it improve diagnostic accuracy.diagnostic accuracy.

69

70

71

72
73
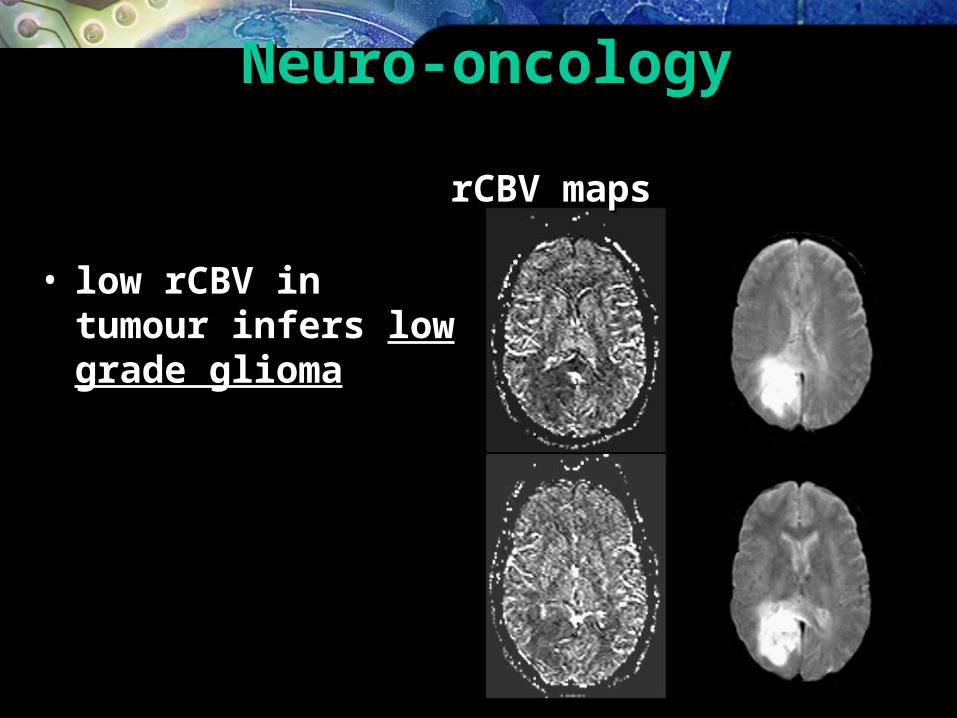
Neuro-oncologyNeuro-oncology
• low rCBV in tumour low rCBV in tumour infers infers low grade gliomalow grade glioma
rCBV mapsrCBV maps
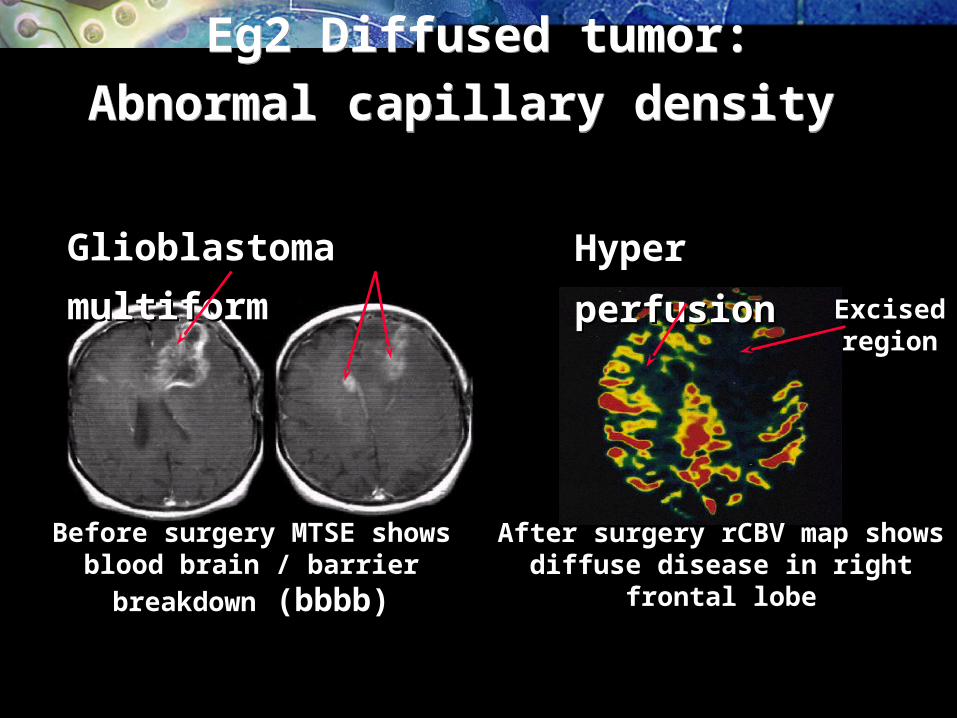
Eg2 Diffused tumor:
Abnormal capillary density Eg2 Diffused tumor:
Abnormal capillary density
Glioblastoma multiformGlioblastoma multiform Hyper perfusionHyper perfusion
Excised Excised regionregion
Before surgery MTSE shows blood brain / Before surgery MTSE shows blood brain /
barrier breakdownbarrier breakdown (bbbb) (bbbb)After surgery rCBV map shows diffuse After surgery rCBV map shows diffuse
disease in right frontal lobedisease in right frontal lobe
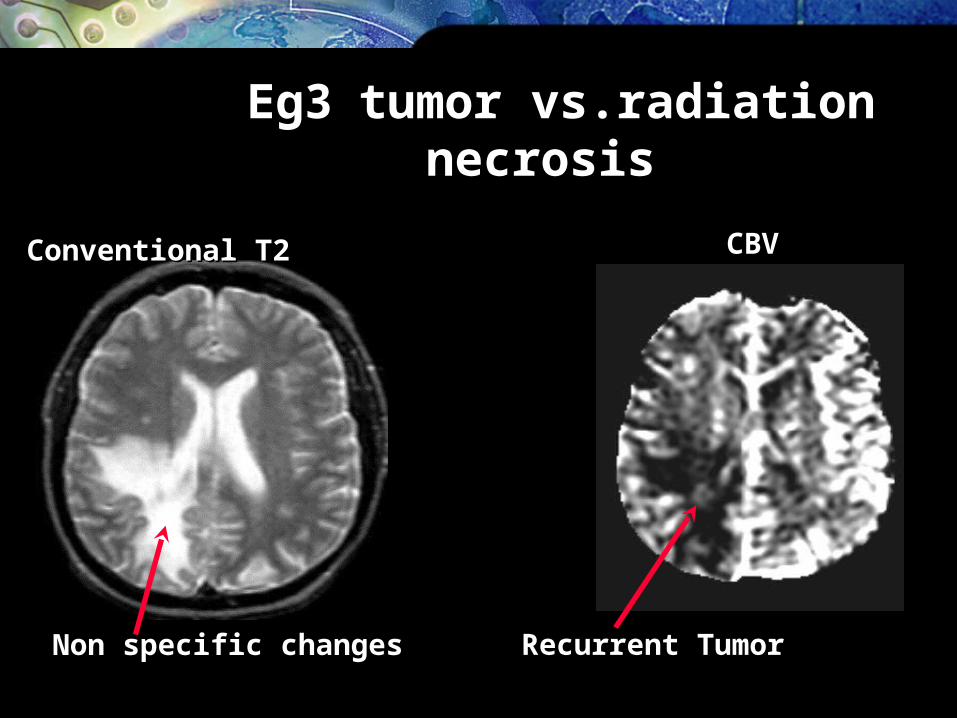
Recurrent TumorRecurrent Tumor
Eg3Eg3 tumor vs.radiation necrosistumor vs.radiation necrosis
Conventional T2Conventional T2 CBVCBV
Non specific changesNon specific changes


![NAME : MOHAMED DARWISH MOHAMED DARWISH TELEPHONE … · 2017-09-11 · [Mohamed Darwish-CV] HIJJA4R2017 Page 5 of 14 Client Relationship • Develop and maintain good working relationship](https://static.fdocuments.us/doc/165x107/5ed8355c0fa3e705ec0e0970/name-mohamed-darwish-mohamed-darwish-telephone-2017-09-11-mohamed-darwish-cv.jpg)