Dietary fiber for pregnant sows: Influence on sow ...prairieswine.com/pdf/36407.pdf · Dietary...
14
Dourmad and M.-C. Père H. Quesnel, M.-C. Meunier-Salaün, A. Hamard, R. Guillemet, M. Etienne, C. Farmer, J.-Y. lactation Dietary fiber for pregnant sows: Influence on sow physiology and performance during doi: 10.2527/jas.2008-1231 originally published online Oct 10, 2008; 2009.87:532-543. J Anim Sci http://jas.fass.org/cgi/content/full/87/2/532 the World Wide Web at: The online version of this article, along with updated information and services, is located on www.asas.org at Serials/Acq. Dept., Library on May 1, 2009. jas.fass.org Downloaded from
-
Upload
duonghuong -
Category
Documents
-
view
216 -
download
0
Transcript of Dietary fiber for pregnant sows: Influence on sow ...prairieswine.com/pdf/36407.pdf · Dietary...

Dourmad and M.-C. Père H. Quesnel, M.-C. Meunier-Salaün, A. Hamard, R. Guillemet, M. Etienne, C. Farmer, J.-Y.
lactationDietary fiber for pregnant sows: Influence on sow physiology and performance during
doi: 10.2527/jas.2008-1231 originally published online Oct 10, 2008; 2009.87:532-543. J Anim Sci
http://jas.fass.org/cgi/content/full/87/2/532the World Wide Web at:
The online version of this article, along with updated information and services, is located on
www.asas.org
at Serials/Acq. Dept., Library on May 1, 2009. jas.fass.orgDownloaded from

ABSTRACT: This study was conducted to investi-gate the effects of feeding sows a bulky diet during ges-tation on their physiological and metabolic adaptations during the peripartum period, and to determine how these effects may relate to sow and piglet performances. From d 26 of gestation until farrowing, gilts were fed di-ets that contained 2.8 or 11.0% crude fiber (control and high-fiber diets, respectively, n = 9/group). Daily feed allowance provided the same amount of DE daily (33 MJ of DE/d). Throughout lactation, sows were allowed to consume a standard lactating sow diet ad libitum. Litters were standardized to 12 piglets beyond 48 h af-ter birth. On d 105 of gestation, a jugular catheter was surgically implanted. Preprandial blood samples were collected from d 109 of gestation to the day after far-rowing and on d 4, 18, and 26 of lactation. Meal tests and glucose tolerance tests were performed on d 109 of gestation and d 4 and 18 of lactation. During gestation, BW and backfat gain did not differ between treatment groups. During lactation, sows fed the high-fiber diet ate an average of 0.94 kg/d more than control sows (P < 0.02). Piglets born from sows fed the high-fiber diet grew faster than piglets from control sows (P = 0.03). Body weight and backfat losses did not differ
between the 2 treatment groups. Sows fed the high-fiber diet during gestation had lesser concentrations of leptin before farrowing than control sows (P < 0.01). Leptin concentrations were negatively correlated with feed intake during lactation (P < 0.05). The prepar-tal increase in prolactin concentrations tended to be greater in sows fed the high-fiber diet than in control sows (P < 0.1). Preprandial concentrations of glucose, NEFA, lactate, and IGF-I fluctuated over time with-out significant treatment effect. Glucose half-life was shorter in late gestation than during both stages of lac-tation, but did not differ between sows in the 2 groups. In late gestation, the postprandial increases in glucose and insulin were delayed, and smaller, after a high-fiber meal than after a control meal. During lactation, glu-cose and insulin profiles after a standard meal did not differ between sows from treatment groups. In conclu-sion, the greater appetite of lactating sows fed a high-fiber diet during gestation does not seem related to changes in glucose and insulin metabolism and may be partly due to decreased secretion of leptin. The greater feed consumption was accompanied by a faster growth rate of piglets without sparing effect on maternal body reserves.
Key words: endocrinology, fiber, gestation, lactation, metabolism, sow
©2009 American Society of Animal Science. All rights reserved. J. Anim. Sci. 2009. 87:532–543 doi:10.2527/jas.2008-1231
INTRODUCTION
The transition from pregnancy to lactation is char-acterized by physiological changes. In pig herds, this period is also accompanied by important changes in feeding. Sows are restrictively fed during gestation to prevent excessive BW gain and, in contrast, are al-lowed to consume feed ad libitum during lactation to cover nutrient requirements for milk production and limit mobilization of sow body reserves (Dourmad et al., 1996). Nevertheless, voluntary feed intake of highly prolific sows is generally insufficient to cover the nutri-ent demands for milk production and maintain body
Dietary fiber for pregnant sows: Influence on sow physiology and performance during lactation1
H. Quesnel,*2 M.-C. Meunier-Salaün,* A. Hamard,* R. Guillemet,* M. Etienne,* C. Farmer,† J.-Y. Dourmad,* and M.-C. Père*
*Institut National de la Recherche Agronomique (INRA), UMR 1079, F-35000 Rennes, France, and Agrocampus Rennes, UMR 1079, F-35000 Rennes, France; and †Agriculture and Agri-Food Canada,
Dairy and Swine R & D Centre, Sherbrooke, Québec, Canada J1M 1Z3
1 We thank Y. Lebreton, H. Renoult, and M. Lefebvre (INRA, Saint-Gilles, France) for surgical assistance, animal care, and help for collection of blood samples. We are grateful to C. David and B. Trépier (INRA, Saint-Gilles, France) for their expert technical assistance and L. Thibault (Agriculture and Agri-Food Canada, Sherbrooke, Québec) for performing prolactin assays. We also thank I. Louveau (Institut National de la Recherche Agronomique, Saint-Gilles, France) and U. Weiler (University of Hohenheim, Germany) for providing antiserum against IGF-I.
2 Corresponding author: [email protected] June 13, 2008.Accepted September 29, 2008.
532
at Serials/Acq. Dept., Library on May 1, 2009. jas.fass.orgDownloaded from

condition (Boulot et al., 2008). According to animal welfare legislation in the European Union (council di-rective 2001/88/EC), all pregnant, dry sows and gilts have to be provided with sufficient quantities of bulky or high-fiber feed to alleviate feeding frustration during gestation and to prepare females for ad libitum feed supply during lactation. Indeed, incorporation of di-etary fiber in gestation diets without altering the daily energy supply was shown to decrease stereotyped ac-tivities associated with restricted feeding level during gestation (Meunier-Salaün et al., 2001) and to increase voluntary feed intake during lactation (Matte et al., 1994; Farmer et al., 1996; Vestergaard and Danielsen, 1998; Courboulay and Gaudré, 2002). The mechanisms underlying the effect of bulky diets on the appetites of sows during lactation have not yet been fully elucidat-ed. Increased digestive capacity (Vestergaard and Dan-ielsen, 1998) and changes in feeding strategies (Guil-lemet et al., 2006) have been put forward to explain this carry-over effect. Feed intake during lactation is also influenced by metabolic and physiological factors, such as insulin resistance (Weldon et al., 1994; Le Co-zler et al., 1998). We hypothesized that bulky diets, which have been shown to alter the hormonal responses of sows to meals (Rushen et al., 1999; Ramonet et al., 2000; Farmer et al., 2002), could influence the appetite of sows during lactation through physiological or meta-bolic adaptations. The present study aimed to investi-gate this hypothesis.
MATERIALS AND METHODS
The experimental animals were reared in compliance with French regulations for the humane care and use of animals in research.
Animals and Experimental Design
The experiment was conducted with 18 Large White × Landrace crossbred gilts, in 3 replicates of 6 females. Average BW of gilts 4 wk after insemination was 171 ± 7 kg (mean ± SD). Gilts were housed individually during the first 5 wk of gestation and then in groups of 4 (4.45 × 2.4 m) on a concrete floor without straw. The group-housing room was equipped with individual feeding stalls. Gilts were moved from the gestation to the farrowing rooms on d 105 ± 1 of gestation and were kept in individual farrowing crates (2 × 2.5 m) there-after. Parturition was not induced. During the first 48 h postpartum, the original litter was kept with the sow. Beyond 48 h, litters were standardized to 12 piglets by crossfostering within treatment groups. Throughout lactation, the piglets had no access to creep feed. They were weaned between 0830 and 0930 h at 26.5 ± 1.5 d of age. Water was freely available to sows and piglets throughout the experimental period. Ambient tempera-ture in the farrowing room was maintained between 22 and 25°C.
During gestation, all sows received a daily meal at 0900 h. From d 1 to 25 of gestation, they were fed 2.5 kg daily of a conventional gestation diet containing 13.2 MJ of DE/kg, 13.3% CP, and 0.5% lysine. There-after, and until the day of farrowing, they were fed the experimental diets, which contained 2.8 or 11.0% crude fiber (control and high-fiber diets, respectively). Compositions of these diets are shown in Table 1. The high-fiber diet contained approximately 60% of fibrous ingredients, which increased the content of both soluble and insoluble fibers. The choice of high-fiber diet com-position was based on previous studies conducted in our laboratory on similar diets on which the DE con-tent had been measured (Ramonet et al., 1999). Sows were individually fed; daily feed allowance (2.4 and 2.8 kg/d for control and high-fiber diets, respectively) was calculated to provide the same amount of DE (33 MJ of DE/d). From the day after farrowing and through-out lactation, all sows were fed a conventional diet for lactating sows providing 13.5 MJ of DE/kg, 17.5% CP, and 4.3% crude fiber (Table 1). The diet was provided for ad libitum consumption from the first day of lac-tation until weaning. During gestation and lactation, feed refusals were weighed daily and actual feed intakes calculated.
Sows were weighed on the second and the 105th day of gestation (the day of the second insemination being considered as the first day of gestation), on the day after farrowing, on d 15 of lactation, and on the day of weaning. Backfat thickness of each sow was measured ultrasonically (Sonolayer SAL-32B, Toshiba, Tokyo, Japan) at the level of the 10th rib on each side 6.5 mm from the midline, on these same days. Farrowings were attended and piglets were weighed at birth; at 24 and 48 h postpartum; at 7, 14, and 21 d of age; and at weaning on d 26.
Surgical Procedure and Sampling
At 105 ± 1 d of gestation, an indwelling Tygon cath-eter (Tygon Tubing, Cole-Parmer Instrument Co., Ver-non Hills, IL; 2.29 mm o.d., 1.27 mm i.d.) was sur-gically implanted in the carotid of all sows. Surgery was performed under general anesthesia induced with i.v. sodium thiopental (10 mg/kg of BW) and main-tained with 2 to 5% halothane (Fluothane, Pitman-Moore, Meaux, France) in oxygen (2 to 3 L/min). The catheters were flushed 3 times weekly with 10 mL of a saline solution (154 mM NaCl) containing 250 IU/mL of heparin. Catheters were kept functional until d 18 of lactation.
Fasting Blood Sampling. Blood samples were collected daily before feeding (at 0830 h) from d 109 of gestation until the day after farrowing, on d 4 ± 1 and 18 ± 2 of lactation, and on the day of weaning (d 26.5 ± 1.5, referred to as d 26). On the day of wean-ing, blood was obtained by puncture of a jugular vein.
Dietary fiber for pregnant sows 533
at Serials/Acq. Dept., Library on May 1, 2009. jas.fass.orgDownloaded from

During lactation, troughs were emptied at 2000 h the day before blood sampling. The day of sampling was calculated relative to the day of farrowing a posteriori. Blood samples were collected in heparinized tubes (10 mL), which were immediately centrifuged for 3 min at 8,500 × g at 4°C for separation of plasma, and in tubes without anticoagulant (5 mL), which were kept 1 h at ambient temperature and then centrifuged for 10 min at 2,600 × g at 4°C to collect serum. Plasma and serum samples were stored at −20°C until analysis.
Meal Tests. Meal tests and glucose tolerance tests were performed in late gestation (d 109) and in early and midlactation (4 ± 1 d and 18 ± 2 d). In each group of sows, d 109 occurred between 4 and 9 d before far-rowing (−6.5 ± 1.5 d). Sows were deprived of feed from 2000 h the previous evening and were fed at 0830 h the following day. The duration of the meal was recorded, and feed refusals were weighed. Blood samples were col-lected at −15, −2, 15, 30, 45, 60, 75, 90, 120, 150, 180, and 240 min, with time 0 corresponding to the meal de-livery. On d 109 of gestation, control sows received 1.2 kg of the control diet, whereas sows fed the high-fiber diet received 1.4 kg of the high-fiber diet. These meals provided 16.3 and 16.5 MJ of DE for control sows and
sows fed the high-fiber diet, respectively. During lacta-tion, all sows were provided 1.5 kg of the same lactation diet (20.2 MJ of DE).
Glucose Tolerance. Glucose tolerance tests were performed on the same days as meal tests, in the after-noon. A bolus of glucose was infused via the catheter (0.5 g/kg of BW, 1.665 M sterile glucose, Braun, Bou-logne, France). The injection lasted about 5 min, after which 20 mL of a saline solution was injected to rinse the catheter. The first blood sample (considered as time 0) was taken immediately after rinsing. Blood samples were also collected at 3 and 6 min, and then at 5-min intervals from 10 to 40 min and at 10-min intervals un-til 70 min after time 0. All blood samples were collected into heparinized tubes, placed on ice, and immediately centrifuged for 3 min at 8,500 × g at 4°C. Plasma was stored at −20°C until subsequent analyses.
Colostrum and Milk Sampling. Colostrum was collected 1 h after birth of the last piglet. Milk was collected at d 5 ± 1 and d 19 ± 1 of lactation after an injection of oxytocin (1 mL i.m.; Ocytovem, CEVA, Santé Animale, Libourne, France). Colostrum and milk samples were immediately filtered through gauze, ali-quoted, and stored at −20°C.
Table 1. Composition of the experimental diets fed during gestation (control and fi-ber) and lactation
Item
Diet
LactationControl Fiber
Ingredient, % (as-fed basis) Barley 16.70 16.70 25.50 Yellow corn — — 12.00 Wheat 65.70 16.42 22.70 Soybean meal 11.25 2.82 21.00 Sunflower meal — 9.75 — Wheat bran — 9.75 10.00 Sugar beet pulp — 19.50 — Soybean hulls — 9.75 — Corn gluten feed — 9.75 — Sugar beet molasses 3.00 3.00 3.00 Sunflower oil — — 2.00 Calcium carbonate 1.30 0.82 0.95 Dicalcium phosphate 1.10 0.80 1.90 Salt 0.45 0.45 0.45 Vitamin and mineral premix1 0.50 0.50 0.50Chemical analysis, % of DM Crude fiber 3.2 12.4 4.3 NDF 17.2 30.7 17.2 ADF 3.3 11.0 3.8 ADL 0.6 1.4 0.5 CP 16.5 15.7 19.9 Starch 57.7 34.5 44.5 Ash 5.9 7.3 6.9 DM, % as fed 88.0 88.3 88.0DE,2 MJ/kg of DM 15.4 13.4 15.3Daily allowance, kg 2.4 2.8 Ad libitum
1Supplied the following amounts per kilogram of diet: vitamin A, 10,000 IU; vitamin D3, 1,500 IU; vitamin E, 45 mg; vitamin K3, 2 mg; thiamine, 2 mg; riboflavin, 4 mg; nicotinic acid, 15 mg; d-pantothenic acid, 10 mg; pyridoxine, 3 mg; d-biotin, 0.2 mg; folic acid, 3 mg; vitamin B12, 0.02 mg; choline, 500 mg; Fe, 80 mg; Cu, 10 mg; Mn, 40 mg; Zn, 100 mg; Co, 0.1 mg; I, 0.6 mg; and Se, 0.25 mg.
2Calculated from INRA-AFZ (2004) tables and Ramonet et al. (1999).
Quesnel et al.534
at Serials/Acq. Dept., Library on May 1, 2009. jas.fass.orgDownloaded from

Analyses
Metabolite Assays. Fasting blood samplings were used to analyze plasma concentrations of glucose, lac-tate, NEFA, urea, and α-amino nitrogen between the end of gestation and the end of lactation. Concentra-tions were measured on d −4, 0 (before parturition), 4, 18, and 26 of lactation. Glucose and NEFA concentra-tions were also measured during the meal tests and glucose tolerance tests. Glucose concentrations were measured on all samples obtained during the meal tests and glucose tolerance tests, whereas plasma NEFA were analyzed at −15, 15, 30, 45, 60, and 90 min during the meal tests and at 0, 10, 20, and 40 min during glucose tolerance tests. Automated enzymatic methods using a Cobas Mira multichannel analyzer (Hoffman Laroche, Basel, Switzerland) were used to determine plasma con-centrations of glucose (kit ref 61272, bio-Mérieux, Mar-cy l’Etoile, France; Trinder, 1969), lactate (Noll, 1984), NEFA (Wako Chemical NEFA C, Neuss, Germany), urea (Urea Unimate 5, ref.07-3685-6, Roche, Neuilly-sur-Seine, France), and α-amino nitrogen (Chacornac et al., 1993). The sensitivities were 180, 30, 14, 200, and 30 µmol/L for glucose, lactate, NEFA, urea, and α-amino nitrogen, respectively. All analyses were per-formed in duplicate.
Hormone Assays in Blood. Prolactin, IGF-I, and leptin were measured on single blood samples and insulin on samples from the meal tests and glucose tol-erance tests. Prolactin was assayed in serum; IGF-I, insulin, and leptin were assayed in plasma. Concentra-tions of all hormones were determined in duplicate us-ing validated double-antibody RIA. The prolactin in-traassay CV was 3.5% and average sensitivity was 1.8 ng/mL (Robert et al., 1989). Plasma concentrations of IGF-I were determined after an acid-ethanol extraction (Louveau and Bonneau, 1996). The intraassay CV was 7.4% and average sensitivity was 7.5 ng/mL. Leptin concentrations were determined with a multispecies double-antibody kit assay (Ma et al., 1996; Linco Re-search Inc., St. Louis, MO). The average sensitivity of the assay was 1 ng of human equivalent/mL. Because plasma concentrations of leptin can be small in lactat-ing sows (around 2 ng/mL), the volume of plasma as-sayed was doubled. The leptin intraassay CV was 4.3%. The insulin intraassay CV was 7.1% and average sensi-tivity was 3 µIU/mL. Insulin was analyzed on 12 sows only (replicates 2 and 3) because of a deep-freeze break-down. All other measurements were done on 18 sows.
Hormone Assays in Colostrum. Colostrum samples were centrifuged twice for 30 min at 14,000 × g and 4°C to remove lipids. Leptin and IGF-I assays were thereafter performed as in plasma. The intraassay CV were 4.6 and 4.5% for leptin and IGF-I, respectively.
Calculations and Statistical Analyses
Colostrum production was estimated during 24 h, beginning at the onset of parturition, using BW gains
of piglets between birth and 24 h of age, as described previously (Devillers et al., 2007). Mean daily DM out-put in milk between farrowing and 21 d of lactation was estimated using piglet ADG according to Noblet and Etienne (1989).
For each glucose tolerance test, the fasting concen-trations of glucose and insulin were calculated as the means of the values at −15 and −2 min before the meal test in the morning. Glucose half-life was estimated from individual regression equations as described pre-viously (Père and Etienne, 2007). The area under the insulin curve (AUC) was determined by linear interpo-lation of insulin concentrations between the measure-ments with the fasting insulin level as the base line. It was estimated between time 0 and the time at which insulin concentration returned to the fasting concentra-tion. The time to reach 50 or 75% of AUC was also determined by interpolation.
Results were analyzed by ANOVA using the GLM procedure (SAS Inst. Inc., Cary, NC). For sows and litter performances, the model included the effects of treatment and replicate, and their interaction (model 1). For hormones and metabolites measured on fasting blood samples from d −4 to d 26, the model included the effects of treatment and replicate, and their interac-tion and repeated measures analyses were done (model 2), except for prolactin profiles due to missing data at weaning. Variations of glucose, insulin, and NEFA con-centrations during the meal test and the tolerance test were analyzed by ANOVA using the procedure for re-peated measurements of SAS. The model included the effects of treatment, physiological stage and replicate, and the interactions (model 3). The model used to test glucose half-life, insulin AUC, and time to reach 50 or 75% AUC in the tolerance tests included treatment, physiological stage, replicate, and the interactions (model 4). Differences between treatment, replicate, and treatment × replicate were tested with the error term for sow nested within treatment × replicate, and physiological stage and the treatment × physiological stage interaction were tested with the residual error. When an interaction was significant, this was specified in the text. Pearson correlations were used to determine the relationships between performance and hormone or metabolite levels.
RESULTS
Sow Performance During Gestation
Between d 26 of gestation and farrowing, actual feed intake averaged 2.39 kg/d in the control group and 2.76 kg/d in the group of sows fed the high-fiber diet. Aver-age daily intakes were 32.4 and 32.6 MJ of DE and 347 and 383 g of CP for sows fed the control and the high-fiber diet, respectively.
At insemination, sow BW and backfat thickness aver-aged 142.0 ± 6.5 kg and 13.3 ± 0.4 mm, respectively. Body weight and backfat gain during gestation did not
Dietary fiber for pregnant sows 535
at Serials/Acq. Dept., Library on May 1, 2009. jas.fass.orgDownloaded from

differ between control sows and sows fed the high-fiber diet (P > 0.1; Table 2).
Sow Performance During Lactation
During lactation, there were feed refusals in the troughs each morning, indicating that sows were indeed allowed to consume feed ad libitum. Daily voluntary feed intake of sows varied during lactation (P < 0.001; Figure 1). Over the entire lactation, sows fed the high-fiber diet during gestation consumed on average 0.94 kg/d more feed than control sows (P = 0.01). The dif-ference in feed intake was significant during the first, second, and third weeks of lactation (Figure 1). Mean BW after farrowing and at weaning were similar in the 2 groups (P > 0.1; Table 3), and sows lost an average of 16 kg during lactation, which represented about 8% of their BW after farrowing. Sows from the 2 groups lost the same amount of backfat (−1.8 mm on average). At weaning, backfat thickness was 1.5 mm less in sows fed the high-fiber diet during gestation than in control sows (P = 0.006; Table 3).
Estimated colostrum production did not differ (P > 0.1) between treatment groups, averaging 3.42 ± 0.18
and 2.96 ± 0.38 kg for sows fed the high-fiber diet and control sows, respectively. No differences (P > 0.1) were observed in colostrum composition (Table 4). On d 5 of lactation, milk composition did not differ between treatment groups, yet, on d 19, milk from control sows contained more protein (P = 0.03) and tended to have less lactose (P = 0.07; Table 4) than milk from sows fed the high-fiber diet. Estimated mean DM output in milk between farrowing and 21 d of lactation tended to be greater in sows fed the high-fiber diet during gestation than in control sows (1,876 ± 96 vs. 1,702 ± 80 g/d; P = 0.07).
Piglet Performance
Litter size at birth averaged 13.4 ± 0.5 total piglets and 13.1 ± 0.4 piglets born alive. One litter in the con-trol group and 5 litters in the high-fiber diet group had 1 stillborn piglet (P = 0.07). Mean litter size at birth and during the 48-h period postpartum did not differ between groups (Table 5). Mean piglet BW at birth and at 24 and 48 h of age, and BW gain during the first 48 h after birth, also did not differ between the 2 groups of sows (Table 5). From standardization of litter size (48 h postpartum) to weaning, litter size averaged 11.7 ± 0.2 (Table 6). Piglets born from sows fed the high-fiber diet during gestation grew faster than piglets from control sows (P = 0.02). Litters from sows fed the high-fiber diet tended to be heavier by 8.2 kg at wean-ing (P = 0.08; Table 6).
Sow Endocrine and Metabolic Status
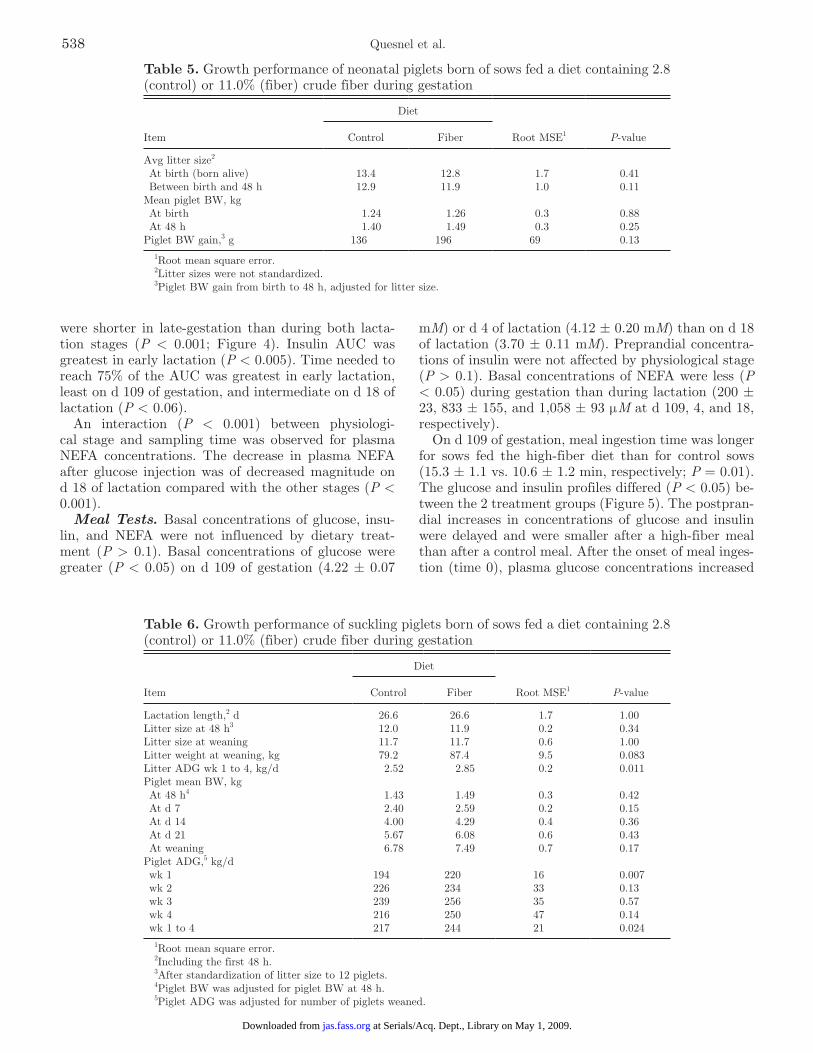
Prolactin. Plasma concentrations of prolactin in-creased (P < 0.05) during the 2 d that preceded far-rowing and decreased thereafter (Figure 2). The pre-partal increase in prolactin concentrations tended to be greater in sows fed the high-fiber diet than in control sows (P = 0.05). Positive correlations were found be-tween prolactin concentrations 1 d after farrowing and litter weight at 48 h postpartum (r = 0.51, P = 0.03), 7 d of lactation (r = 0.56, P = 0.02), and at weaning (r = 0.48, P = 0.06).
Table 2. Variations in BW and backfat thickness of sows fed a diet containing 2.8 (control) or 11.0% (fiber) crude fiber during gestation
Item
Diet
Root MSE1 P-valueControl Fiber
No. of sows 9 9BW, kg At insemination 140.5 143.4 7.0 0.39 At d 105 of gestation 204.1 207.8 9.5 0.43 Gain 63.6 64.4 5.1 0.77Backfat thickness, mm At insemination 13.4 13.2 1.8 0.85 At d 105 of gestation 17.2 15.8 2.5 0.29 Gain 3.8 2.6 1.6 0.15
1Root mean square error.
Figure 1. Daily voluntary feed intake of lactating sows fed a diet containing 2.8 (control) or 11.0% (fiber) crude fiber during gestation (means ± SEM). Average feed intake was greater in the fiber group than in the control group (7.19 ± 0.39 vs. 6.25 ± 0.32 kg/d; P < 0.02).
Quesnel et al.536
at Serials/Acq. Dept., Library on May 1, 2009. jas.fass.orgDownloaded from
IGF-I. There were time-related changes in concen-trations of plasma IGF-I (Figure 2). They increased (P < 0.001) between the day preceding and the day after parturition and remained great throughout lactation. Plasma concentrations and time-related variations were not influenced by treatment. During lactation, concen-trations were highly variable among sows. Concentra-tions of IGF-I in colostrum averaged 299 ± 19 ng/mL and did not differ between groups (P > 0.1).
Leptin. There was a treatment × sampling day in-teraction (P < 0.03) for plasma leptin concentrations. Sows fed the high-fiber diet during gestation had less leptin concentrations than control sows before farrowing (Figure 2), whereas concentrations during lactation did not differ (P > 0.1) between the 2 groups. The treat-ment effect on leptin concentrations before farrowing remained significant when backfat thickness in late ges-tation or backfat gain during gestation was introduced as a covariate in the model (P = 0.01 and P = 0.009, respectively). Average feed intake throughout lactation and during the first week of lactation was negatively correlated with plasma leptin concentrations measured on the day before farrowing (r = −0.51, P = 0.04 for each period). Leptin concentrations in colostrum aver-aged 31.2 ± 1.8 ng/mL and did not differ (P > 0.1) between the 2 groups of sows. Leptin concentrations in colostrum were correlated with plasma leptin measured
6 and 1 d before farrowing (r = 0.66, P = 0.003 and r = 0.49, P = 0.04, respectively).
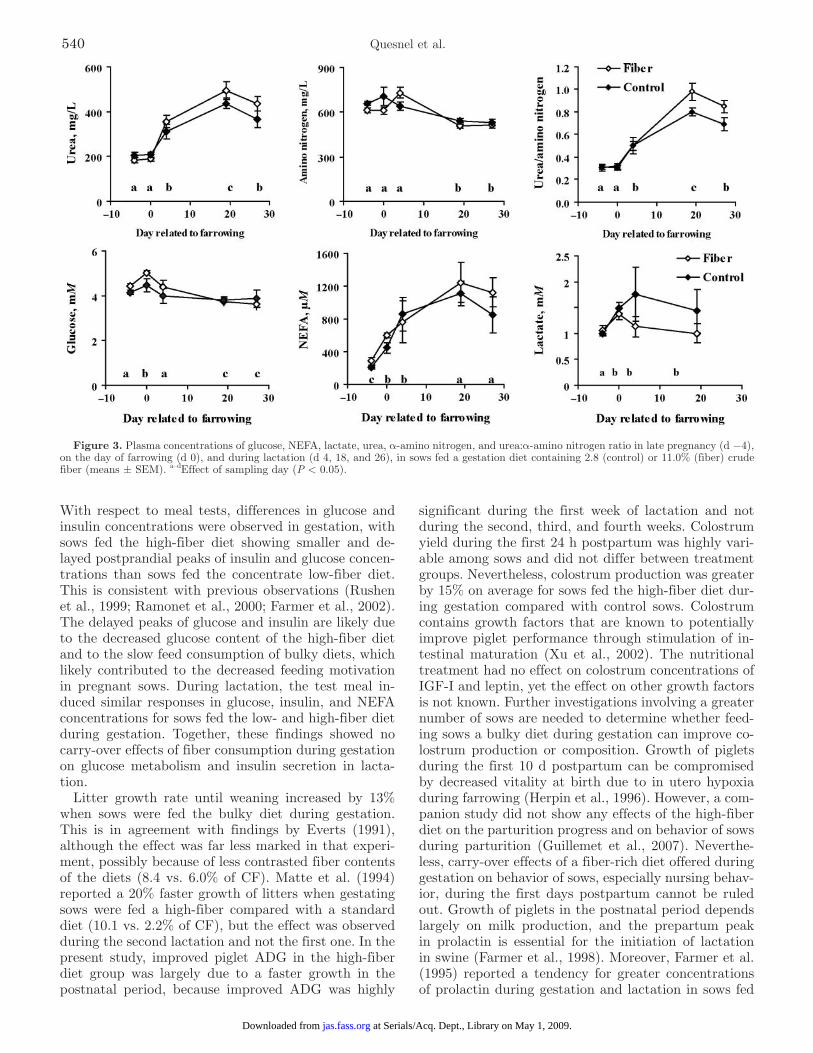
Metabolites. Preprandial concentrations of metab-olites (Figure 3) fluctuated over time without treat-ment effects for glucose, NEFA, urea, and lactate. Pre-prandial concentrations of glucose were greater (P < 0.05) on the day of farrowing than 4 d pre- or postfar-rowing and were lowest in late lactation. Plasma con-centrations of NEFA increased (P < 0.05) between the end of gestation and midlactation. Urea concentrations were lesser (P < 0.05) in late gestation than during lactation. An interaction (P < 0.05) between treatment and sampling time was observed for α-amino nitrogen and the urea:amino nitrogen ratio: sows fed the high-fiber diet during gestation had lesser mean plasma con-centrations of α-amino nitrogen in late gestation than control sows, but had greater concentrations 4 d after farrowing (P < 0.05). The urea:amino nitrogen ratio was greater during lactation than during gestation. It was also greater in sows fed the high-fiber diet than in control sows on d 19 (P = 0.003) and 27 of lactation (P = 0.07).
Glucose Tolerance Tests. Profiles of plasma glu-cose, insulin, and NEFA were not influenced by dietary treatment (P > 0.1) but were affected by physiologi-cal stage of the sow (Figure 4). Glucose half-life and time needed for glucose to reach basal concentrations
Table 3. Variations in BW and backfat thickness of lactating sows fed a diet contain-ing 2.8 (control) or 11.0% (fiber) crude fiber during gestation
Item
Diet
Root MSE1 P-valueControl Fiber
No. of sows 9 9BW, kg The day after farrowing 194.0 196.2 11.9 0.70 At weaning 176.6 180.1 15.2 0.53 Loss −15.7 −16.1 12.1 0.98Backfat thickness, mm The day after farrowing 16.2 15.1 2.2 0.30 At weaning 14.6 13.1 0.9 0.006 Loss −1.8 −1.9 1.9 0.84
1Root mean square error.
Table 4. Composition of colostrum (d 0 of lactation) and milk (d 5 and 19 of lactation) from sows fed a diet con-taining 2.8 (control) or 11.0% (fiber) crude fiber during gestation
Item
d 0 d 5 d 19
Control Fiber Root MSE1 Control Fiber Root MSE Control Fiber Root MSE
DM, % 26.9 24.3 3.0 19.4 19.5 0.9 20.8 19.2 2.3Ash, % 0.68 0.70 0.1 0.76 0.76 0.1 0.84 0.76 0.1Lipid, % 7.60 7.20 2.1 8.14 8.37 0.7 9.40 8.16 1.2Protein, % 14.53 12.83 2.2 5.29 5.18 0.4 5.33b 4.94a 0.3Lactose, % 2.62 2.67 0.4 4.82 4.95 0.4 4.69 4.97† 0.3Energy, MJ/kg 6.98 6.20 0.9 5.03 5.10 0.3 5.69 4.98 0.9
a,bWithin a row and within a day of lactation, effect of dietary treatment (P < 0.05).1Root mean square error.†Within a day of lactation, effect of dietary treatment (P < 0.10).
Dietary fiber for pregnant sows 537
at Serials/Acq. Dept., Library on May 1, 2009. jas.fass.orgDownloaded from
were shorter in late-gestation than during both lacta-tion stages (P < 0.001; Figure 4). Insulin AUC was greatest in early lactation (P < 0.005). Time needed to reach 75% of the AUC was greatest in early lactation, least on d 109 of gestation, and intermediate on d 18 of lactation (P < 0.06).
An interaction (P < 0.001) between physiologi-cal stage and sampling time was observed for plasma NEFA concentrations. The decrease in plasma NEFA after glucose injection was of decreased magnitude on d 18 of lactation compared with the other stages (P < 0.001).
Meal Tests. Basal concentrations of glucose, insu-lin, and NEFA were not influenced by dietary treat-ment (P > 0.1). Basal concentrations of glucose were greater (P < 0.05) on d 109 of gestation (4.22 ± 0.07
mM) or d 4 of lactation (4.12 ± 0.20 mM) than on d 18 of lactation (3.70 ± 0.11 mM). Preprandial concentra-tions of insulin were not affected by physiological stage (P > 0.1). Basal concentrations of NEFA were less (P < 0.05) during gestation than during lactation (200 ± 23, 833 ± 155, and 1,058 ± 93 µM at d 109, 4, and 18, respectively).
On d 109 of gestation, meal ingestion time was longer for sows fed the high-fiber diet than for control sows (15.3 ± 1.1 vs. 10.6 ± 1.2 min, respectively; P = 0.01). The glucose and insulin profiles differed (P < 0.05) be-tween the 2 treatment groups (Figure 5). The postpran-dial increases in concentrations of glucose and insulin were delayed and were smaller after a high-fiber meal than after a control meal. After the onset of meal inges-tion (time 0), plasma glucose concentrations increased
Table 6. Growth performance of suckling piglets born of sows fed a diet containing 2.8 (control) or 11.0% (fiber) crude fiber during gestation
Item
Diet
Root MSE1 P-valueControl Fiber
Lactation length,2 d 26.6 26.6 1.7 1.00Litter size at 48 h3 12.0 11.9 0.2 0.34Litter size at weaning 11.7 11.7 0.6 1.00Litter weight at weaning, kg 79.2 87.4 9.5 0.083Litter ADG wk 1 to 4, kg/d 2.52 2.85 0.2 0.011Piglet mean BW, kg At 48 h4 1.43 1.49 0.3 0.42 At d 7 2.40 2.59 0.2 0.15 At d 14 4.00 4.29 0.4 0.36 At d 21 5.67 6.08 0.6 0.43 At weaning 6.78 7.49 0.7 0.17Piglet ADG,5 kg/d wk 1 194 220 16 0.007 wk 2 226 234 33 0.13 wk 3 239 256 35 0.57 wk 4 216 250 47 0.14 wk 1 to 4 217 244 21 0.024
1Root mean square error.2Including the first 48 h.3After standardization of litter size to 12 piglets.4Piglet BW was adjusted for piglet BW at 48 h.5Piglet ADG was adjusted for number of piglets weaned.
Table 5. Growth performance of neonatal piglets born of sows fed a diet containing 2.8 (control) or 11.0% (fiber) crude fiber during gestation
Item
Diet
Root MSE1 P-valueControl Fiber
Avg litter size2
At birth (born alive) 13.4 12.8 1.7 0.41 Between birth and 48 h 12.9 11.9 1.0 0.11Mean piglet BW, kg At birth 1.24 1.26 0.3 0.88 At 48 h 1.40 1.49 0.3 0.25Piglet BW gain,3 g 136 196 69 0.13
1Root mean square error.2Litter sizes were not standardized.3Piglet BW gain from birth to 48 h, adjusted for litter size.
Quesnel et al.538
at Serials/Acq. Dept., Library on May 1, 2009. jas.fass.orgDownloaded from
from basal to peak concentrations of 5.86 ± 0.27 mM at 60 min in sows fed the high-fiber diet vs. 6.65 ± 0.41 mM at 45 min in control sows, and were greater at 15, 30 (P < 0.01), and 45 min (P < 0.07) in control than in sows fed the high-fiber diet. Plasma insulin increased after meal ingestion to reach peak concentrations at 60 min in both groups (81 ± 17 and 183 ± 31 µU/mL in sows fed the high-fiber diet and control sows, respec-tively). Insulin concentrations were greater (P < 0.02) in control than in sows fed the high-fiber diet between 15 and 75 min. During lactation, glucose, insulin, and NEFA profiles did not differ between the 2 groups of sows.
DISCUSSION
Feeding sows a bulky diet during gestation resulted in a greater feed intake during lactation, which is in agree-ment with previous findings (Matte et al., 1994; Vester-gaard and Danielsen, 1998; Courboulay and Gaudré, 2002). The 15% increase in feed intake observed in the present experiment, however, was greater than reported in previous studies. An increase of approximately 5% was reported for sows fed a high-fiber diet containing either oat hulls and oats (20.4% of crude fiber; Matte et al., 1994) or sugar-beet pulp (11.3% of crude fiber; Vestergaard and Danielsen, 1998), compared with sows fed a control diet containing between 2 and 4% crude fi-ber. The feeding behavior of the sows could have played a role in this increase in feed intake. Indeed, in a com-panion trial designed to investigate sow behavior, sows fed the high-fiber diet during gestation consumed more, although smaller, meals during lactation than those fed a control diet (Guillemet et al., 2006). In the present experiment, overall feed intake during lactation was negatively correlated with leptin concentrations before farrowing. Leptin, which is secreted by adipose tissue, is known to decrease feed intake in many mammalian species, including swine (Barb, 1999). Therefore, de-creased circulating concentrations of leptin at the end of gestation may be partly responsible for the improved feed intake of sows fed the high-fiber diet. In a com-panion study involving a greater number of sows (n = 42), Guillemet et al. (2007) reported that sows fed the high-fiber diet gained less backfat during gestation than sows fed the control diet, inducing a 1.5-mm difference of backfat thickness before farrowing. The most likely explanation for this effect was that diets were formu-lated to provide the same daily amount of DE, and the decreased fat deposition in sows fed the high-fiber diet may have been related to the decreased NE:DE ratio in this fiber-rich diet. Indeed, by using equations based on diet composition (Noblet et al., 2003), the estimated NE intakes were 21.8 and 23.3 MJ of NE/d for sows fed the high-fiber diet and control sows, respectively. In the present experiment, sow backfat thickness at the end of gestation did not differ between treatment groups. Moreover, leptin concentrations were not correlated with backfat thickness in late gestation or backfat gain during gestation. Mechanisms by which feeding sows a bulky diet induced a reduction in leptin concentrations need to be investigated.
An increased insulin resistance and a decreased glu-cose tolerance were also proposed as potential causes of postpartum hypophagia in fat sows (Weldon et al., 1994; Le Cozler et al., 1998). In the present experi-ment, there were no differences in glucose tolerance af-ter a glucose tolerance test between sows fed the low- or high-fiber diet during gestation. Only variations in glu-cose tolerance related to the physiological stage of the sows were observed, with glucose half-life being shorter in late gestation than during lactation, as previously re-ported (Le Cozler et al., 1998; Père and Etienne, 2007).
Figure 2. Plasma concentrations of prolactin, IGF-I, and leptin in late pregnancy and during lactation, in sows fed a gestation diet containing 2.8 (control) or 11.0% (fiber) crude fiber (means ± SEM). a–dEffect of sampling day (P < 0.05). †Effect of dietary treatment (P < 0.10). **Effect of dietary treatment (P < 0.01).
Dietary fiber for pregnant sows 539
at Serials/Acq. Dept., Library on May 1, 2009. jas.fass.orgDownloaded from
With respect to meal tests, differences in glucose and insulin concentrations were observed in gestation, with sows fed the high-fiber diet showing smaller and de-layed postprandial peaks of insulin and glucose concen-trations than sows fed the concentrate low-fiber diet. This is consistent with previous observations (Rushen et al., 1999; Ramonet et al., 2000; Farmer et al., 2002). The delayed peaks of glucose and insulin are likely due to the decreased glucose content of the high-fiber diet and to the slow feed consumption of bulky diets, which likely contributed to the decreased feeding motivation in pregnant sows. During lactation, the test meal in-duced similar responses in glucose, insulin, and NEFA concentrations for sows fed the low- and high-fiber diet during gestation. Together, these findings showed no carry-over effects of fiber consumption during gestation on glucose metabolism and insulin secretion in lacta-tion.
Litter growth rate until weaning increased by 13% when sows were fed the bulky diet during gestation. This is in agreement with findings by Everts (1991), although the effect was far less marked in that experi-ment, possibly because of less contrasted fiber contents of the diets (8.4 vs. 6.0% of CF). Matte et al. (1994) reported a 20% faster growth of litters when gestating sows were fed a high-fiber compared with a standard diet (10.1 vs. 2.2% of CF), but the effect was observed during the second lactation and not the first one. In the present study, improved piglet ADG in the high-fiber diet group was largely due to a faster growth in the postnatal period, because improved ADG was highly
significant during the first week of lactation and not during the second, third, and fourth weeks. Colostrum yield during the first 24 h postpartum was highly vari-able among sows and did not differ between treatment groups. Nevertheless, colostrum production was greater by 15% on average for sows fed the high-fiber diet dur-ing gestation compared with control sows. Colostrum contains growth factors that are known to potentially improve piglet performance through stimulation of in-testinal maturation (Xu et al., 2002). The nutritional treatment had no effect on colostrum concentrations of IGF-I and leptin, yet the effect on other growth factors is not known. Further investigations involving a greater number of sows are needed to determine whether feed-ing sows a bulky diet during gestation can improve co-lostrum production or composition. Growth of piglets during the first 10 d postpartum can be compromised by decreased vitality at birth due to in utero hypoxia during farrowing (Herpin et al., 1996). However, a com-panion study did not show any effects of the high-fiber diet on the parturition progress and on behavior of sows during parturition (Guillemet et al., 2007). Neverthe-less, carry-over effects of a fiber-rich diet offered during gestation on behavior of sows, especially nursing behav-ior, during the first days postpartum cannot be ruled out. Growth of piglets in the postnatal period depends largely on milk production, and the prepartum peak in prolactin is essential for the initiation of lactation in swine (Farmer et al., 1998). Moreover, Farmer et al. (1995) reported a tendency for greater concentrations of prolactin during gestation and lactation in sows fed
Figure 3. Plasma concentrations of glucose, NEFA, lactate, urea, α-amino nitrogen, and urea:α-amino nitrogen ratio in late pregnancy (d −4), on the day of farrowing (d 0), and during lactation (d 4, 18, and 26), in sows fed a gestation diet containing 2.8 (control) or 11.0% (fiber) crude fiber (means ± SEM). a–dEffect of sampling day (P < 0.05).
Quesnel et al.540
at Serials/Acq. Dept., Library on May 1, 2009. jas.fass.orgDownloaded from

a diet containing wheat bran and corn cobs compared with a standard diet (10 vs. 2.2% crude fiber). In the present experiment, overall prolactin concentrations in the peripartum period did not differ between sows from
Figure 4. Plasma glucose (A), insulin (B), and NEFA (C) concen-trations during the glucose tolerance test according to the physiologi-cal stage of the sows (G109: d 109 of pregnancy; L4: d 4 of lactation; L18: d 18 of lactation). Sows were fed a gestation diet containing 2.8 (control) or 11.0% (fiber) crude fiber. Glucose half-life was 15.3 ± 0.6, 21.2 ± 1.2, and 20.8 ± 0.9 min; time needed for glucose to reach basal concentration was 41.1 ± 1.6, 53.1 ± 2.9, and 55.0 ± 2.0; and insulin area under the curve was 2.85 ± 0.30, 3.93 ± 0.54, and 2.07 ± 0.29 mIU·mL−1·min at G109, L4, and L18, respectively.
Figure 5. Plasma glucose and insulin concentrations during a meal test on d 109 of gestation (G109, A), d 4 (L4, B), and d 18 (L18, C) of lactation (mean ± SEM). On d 109, sows were fed a gestation diet containing 2.8 (control) or 11.0% (fiber) crude fiber. Fiber and control sows received 1.4 and 1.2 kg of their respective diet at time 0. Mean concentrations of glucose were greater in control than in fiber sows between 15 and 45 min after meal (time 15 and 30 min, P < 0.01; time 45 min, P < 0.07), and those of insulin were between 15 and 75 min (P < 0.02). On d 4 and 18 of lactation, all sows were fed 1.5 kg of the lactation diet. Profiles of glucose and insulin concentrations did not differ significantly between sows in the 2 groups.
Dietary fiber for pregnant sows 541
at Serials/Acq. Dept., Library on May 1, 2009. jas.fass.orgDownloaded from
the 2 groups; prolactin concentrations only tended to be greater on the day of farrowing in sows fed the high-fiber diet. Furthermore, the correlation between prolac-tin concentrations in sows at 1 d after farrowing and litter weight in early lactation was weak. It is unlikely that improved piglet growth resulted from greater pro-lactin concentrations.
Despite their greater feed intake and because of the improved growth rate of their piglets, sows from the high-fiber diet group mobilized as much body reserves as control sows, as indicated by similar changes in BW and backfat during lactation. Consistently, sows across treatment groups had similar preprandial profiles of IGF-I and metabolites, except for the urea:amino nitro-gen ratio. Decreased concentrations of glucose and in-creased concentrations of NEFA, as lactation progress-es, can be related to increased uptake of glucose by the udder (Dourmad et al., 2000) and mobilization of lipids from fatty tissues (Etienne et al., 1985). Greater circu-lating concentrations of urea in sows during lactation than during gestation are likely related to the greater protein consumption, and may partly result from an increased catabolism of endogenous proteins linked to the high-energy demand for milk production.
To summarize, the greater appetite of lactating sows fed a high-fiber diet during gestation may be partly explained by decreased secretion of leptin, and does not seem related to changes in glucose and insulin metab-olism. The mechanisms underlying the positive effect of feeding high-fiber diets to pregnant sows on piglet growth need to be further investigated.
LITERATURE CITED
Barb, C. R. 1999. The brain-pituitary-adipocyte axis: Role of leptin in modulating neuroendocrine function. J. Anim. Sci. 77:1249–1257.
Boulot, S., H. Quesnel, and N. Quiniou. 2008. Management of high prolificacy in French herds; can we alleviate side effects on pig-let survival? Pages 213–220 in Advances in Pork Production. Proc. 2008 Banff Pork Seminar, Banff, Canada. University of Alberta, Edmonton, Canada.
Chacornac, J. P., J. Barnouin, and M. L. Houlier. 1993. Micro-dos-age automatisé sur analyseur à transfert de l’azote alpha-aminé circulant. Reprod. Nutr. Dev. 33:99–108.
Courboulay, V., and D. Gaudré. 2002. Is it necessary to give fibrous diets to group-housed sows? J. Rech. Porcine 34:225–232.
Devillers, N., C. Farmer, J. Le Dividich, and A. Prunier. 2007. Vari-ability of colostrum yield and colostrum intake in pigs. Animal 1:1033–1041.
Dourmad, J. Y., M. Etienne, and J. Noblet. 1996. Reconstitution of body reserves in multiparous sows during pregnancy: Effect of energy intake during pregnancy and mobilisation during the previous lactation. J. Anim. Sci. 74:2211–2219.
Dourmad, J. Y., J. J. Matte, Y. Lebreton, and M. L. Fortin. 2000. Effect of the meal on the utilisation of some nutrient and vi-tamins by the mammary gland of the lactating sow. J. Rech. Porcine Fr. 32:265–273.
Etienne, M., J. Noblet, and B. Desmoulin. 1985. Mobilization of body stores in the lactating primiparous sow. Reprod. Nutr. Dev. 25:341–343.
Everts, H. 1991. The effect of feeding different sources of crude fi-bre during pregnancy on the reproductive performance of sows. Anim. Prod. 52:175–184.
Farmer, C., M. C. Meunier-Salaün, R. Bergeron, and S. Robert. 2002. Hormonal response of pregnant gilts fed a high-fiber or a concentrate diet once or twice daily. Can. J. Anim. Sci. 82:159–164.
Farmer, C., S. Robert, and J. J. Matte. 1996. Lactation perfor-mance of sows fed a bulky diet during gestation and receiving growth hormone-releasing factor during lactation. J. Anim. Sci. 74:1298–1306.
Farmer, C., S. Robert, J. J. Matte, C. L. Girard, and G. P. Mar-tineau. 1995. Endocrine and peripartum behavioral responses of sows fed high-fiber diets during gestation. Can. J. Anim. Sci. 75:531–536.
Farmer, C., S. Robert, and J. Rushen. 1998. Bromocriptine given orally to periparturient or lactating sows inhibits milk produc-tion. J. Anim. Sci. 76:750–757.
Guillemet, R., J.-Y. Dourmad, and M. C. Meunier-Salaün. 2006. Feeding behavior in primiparous sows: Impact of a high-fiber diet during pregnancy. J. Anim. Sci. 84:2474–2481.
Guillemet, R., A. Hamard, H. Quesnel, M.-C. Père, M. Etienne, J.-Y. Dourmad, and M. C. Meunier-Salaün. 2007. Dietary fibre for gestating sows: Effects on parturition progress, behaviour, litter and sow performance. Animal 1:872–880.
Herpin, P., J. Le Dividich, J.-C. Hulin, M. Fillaut, F. De Marco, and R. Bertin. 1996. Effects of the level of asphyxia during delivery on viability at birth and early postnatal vitality of newborn pigs. J. Anim. Sci. 74:2067–2075.
Institut National de la Recherche Agronomique – Association Fran-çaise de Zootechnie. 2004. Tables of composition and nutrition-al value of feed materials. Pigs, poultry, cattle, sheep, goats, rabbits, horses, fish. D. Sauvant, J. M. Perez, and G. Tran, ed. INRA-AFZ, Paris, France.
Le Cozler, Y., C. David, V. Beaumal, S. Johansen, and J. Y. Dour-mad. 1998. Effect of the feeding level during rearing on perfor-mance of Large White gilts. Part 2: Effect on metabolite pro-files during gestation and lactation, and on glucose tolerance. Reprod. Nutr. Dev. 38:377–390.
Louveau, I., and M. Bonneau. 1996. Effect of a growth hormone infusion on plasma insulin-like growth factor-I in Meishan and Large White pigs. Reprod. Nutr. Dev. 36:301–310.
Ma, Z. M., R. L. Gingerich, J. V. Santiago, S. Klein, C. H. Smith, and M. Landt. 1996. Radioimmunoassay of leptin in human plasma. Clin. Chem. 42:942–946.
Matte, J. J., S. Robert, C. L. Girard, C. Farmer, and G. P. Mar-tineau. 1994. Effect of bulky diets based on wheat bran or oat hulls on reproductive performance of sows during their first two parities. J. Anim. Sci. 72:1754–1760.
Meunier-Salaün, M. C., S. A. Edwards, and S. Robert. 2001. Effect of dietary fibre on the behaviour and health of the restricted fed sow. Anim. Feed Sci. Technol. 90:53–69.
Noblet, J., V. Bontems, and G. Tran. 2003. Estimation of the en-ergy value of compounds feeds for pigs. INRA Prod. Anim. 16:197–210.
Noblet, J., and M. Etienne. 1989. Estimation of sow milk nutrient output. J. Anim. Sci. 67:3352–3359.
Noll, F. 1984. L-(+)-Lactate. Page 582 in Methods of Enzymatic Analysis. 3rd ed. Vol. VI. Metabolites 1: Carbohydrates. H. U. Bergmeyer, J. Bergmeyer, and M. Grassl, ed. Verlag Chemie, Weinheim, Germany.
Père, M.-C., and M. Etienne. 2007. Insulin sensitivity during preg-nancy, lactation, and postweaning in primiparous gilts. J. Anim. Sci. 85:101–110.
Ramonet, Y., M. C. Meunier-Salaün, and J. Y. Dourmad. 1999. High-fiber diets in pregnant sows: Digestive utilization and ef-fects on the behaviour of the animals. J. Anim. Sci. 77:591–599.
Ramonet, Y., S. Robert, A. Aumaître, J.-Y. Dourmad, and M. C. Meunier-Salaün. 2000. Influence of the nature of dietary fibre on digestive utilization, some metabolite and hormone profiles and the behaviour of pregnant sows. Anim. Sci. 70:275–286.
Robert, S., A. M. B. de Passillé, N. St-Pierre, P. Dubreuil, G. Pel-letier, D. Petitclerc, and P. Brazeau. 1989. Effect of the stress
Quesnel et al.542
at Serials/Acq. Dept., Library on May 1, 2009. jas.fass.orgDownloaded from

of injections on the serum concentration of cortisol, prolactin and growth hormone in gilts and lactating sows. Can. J. Anim. Sci. 69:663–672.
Rushen, J., S. Robert, and C. Farmer. 1999. Effects of an oat-based high-fibre diet on insulin, glucose, cortisol and free fatty acid concentrations in gilts. Anim. Sci. 69:395–401.
Trinder, P. 1969. Determination of glucose in blood using glucose oxidase with an alternative oxygen acceptor. Ann. Clin. Bio-chem. 6:24–27.
Vestergaard, E. M., and V. Danielsen. 1998. Dietary fibre for sows: Effects of large amounts of soluble and insoluble fibres in the pregnancy period on the performance of sows during three re-productive cycles. Anim. Sci. 68:355–362.
Weldon, W. C., A. J. Lewis, G. F. Louis, J. L. Kovar, and P. S. Miller. 1994. Postpartum hypophagia in primiparous sows. II. Effects of feeding level during gestation and exogenous insulin on lactation feed intake, glucose tolerance, and epinephrine-stimulated release of nonesterified fatty acids and glucose. J. Anim. Sci. 72:395–403.
Xu, R. J., P. T. Sangild, Y. Q. Zhang, and S. H. Zhang. 2002. Bio-active compounds in porcine colostrum and milk and their ef-fects on intestinal development in neonatal pigs. Pages 169–192 in Biology of the Intestine in Growing Animals. R. Zabielski, P. C. Gregory, and B. Weström, ed. Elsevier, Amsterdam, the Netherlands.
Dietary fiber for pregnant sows 543
at Serials/Acq. Dept., Library on May 1, 2009. jas.fass.orgDownloaded from

References http://jas.fass.org/cgi/content/full/87/2/532#BIBL
This article cites 30 articles, 12 of which you can access for free at:
at Serials/Acq. Dept., Library on May 1, 2009. jas.fass.orgDownloaded from