Diet and Feeding Habitats of Camargue Dabbling Ducks: What...
22
Diet and Feeding Habitats of Camargue Dabbling Ducks: What Has Changed Since the 1960s? ANNE-LAURE BROCHET 1,2.* , JEAN-BAPTISTE MOURONVAL 1 , PHILIPPE AUBRY 3 , MICHEL GAUTHIER-CLERC 2 , ANDY J. GREEN 4 , HERVÉ FRITZ 5 AND MATTHIEU GUILLEMAIN 1 1 Office National de la Chasse et de la Faune Sauvage, CNERA Avifaune Migratrice, La Tour du Valat, Le Sambuc, 13200 Arles, France 2 Centre de Recherche de la Tour du Valat, Le Sambuc, 13200 Arles, France. 3 Office National de la Chasse et de la Faune Sauvage, Direction des Études et de la Recherche, BP 20, 78612 Le Perray-en-Yvelines Cedex, France 4 Department of Wetland Ecology, Estación Biológica de Doñana, EBD-CSIC, C/ Américo Vespucio s/n, 41092, Sevilla, Spain 5 Université Claude Bernard Lyon 1, CNRS UMR 5558 Biométrie et Biologie Évolutive, Bâtiment 711, 43 Bd du 11 novembre 1918, 69622 Villeurbanne Cedex, France * Corresponding author; E-mail: [email protected] Abstract.—In the Camargue (southern France), drastic changes in wetlands have occurred (notably extension of agriculture and salt extraction) since the 1960s, which affect the resources available to migratory waterbirds. Winter diets of Mallard (Anas platyrhynchos) and Teal (A. crecca) in 2006-2008 were assessed by analyses of gullet contents. Using PCA-based methods, duck diets were described and the main feeding habitats used by each duck species were then determined with a typology analysis. The same four food items were most important (in terms of occurrence and average dry weight) in the diet of Mallard and Teal: Oryza sativa (rice), Echinochloa sp., Scirpus maritimus and Potamogeton pusillus seeds. However, Teal diet was more diversified, with eleven feeding habitat types, compared to only five in Mallard. Both species were found to be dependent on ricefields and ricefield-like habitats. Compared to previous studies in the same area between 1964 and 1981, permanent freshwater habitats now appear to be used more intensively by Mallard and Teal, while temporary marshes are used to a lesser extent. Since the 1960s, temporary marshes have been partially replaced by permanent freshwater in order to attract more ducks, mostly for hunting. The flexibility of duck diet in response to changing food availability may explain why duck populations have not decreased in the Camargue or in Europe despite changes in land use. Received 14 February Key words.—Diet comparison, feeding habitat, habitat use, land use, Mallard, Teal. Habitat loss and land use change are important threats to wetlands. Wetland destruction and degradation are gener- ally linked with human activities, especially through extension of agricultural, indus- trial and urban zones (Gibbs 2000; MWO 2012). At the same time, qualitative changes have occurred in wetlands, e.g. fish farm- ing leading to eutrophication (Heathwaite 2010). In brackish waters, wetland manage- ment for hunting often involves inputs of freshwater, altering the natural water cycle (Tamisier and Grillas 1994) and poten- tially causing eutrophication and introduc- tion of non-native species (MWO 2012). Wetland loss or changes in land use have important consequences for water- birds. Both processes alter distribution of food items and suitable habitat for ducks (Rendòn et al. 2008). For instance, agricul- tural practices can cause duck population declines at the local scale (e.g. Duncan et al. 1999). Wetland loss or land use changes may lead to a change in waterbird habitat selec- tion and diet choice (Kloskowski et al. 2009). The Camargue is a Mediterranean wet- land in southern France of great impor- tance to wintering waterbirds (Tamisier and Dehorter 1999). Since the 1950s, drastic habitat modifications have occurred owing to anthropogenic causes in the area. The loss of natural wetlands has been related to the extension of agriculture, salt extraction and industry (Tamisier and Dehorter 1999; MWO 2012). On most of the remaining wet- lands (many being private hunting estates),
-
Upload
hoangnguyet -
Category
Documents
-
view
215 -
download
0
Transcript of Diet and Feeding Habitats of Camargue Dabbling Ducks: What...

Diet and Feeding Habitats of Camargue Dabbling Ducks: What Has Changed Since the 1960s?
ANNE-LAURE BROCHET1,2.*, JEAN-BAPTISTE MOURONVAL1, PHILIPPE AUBRY3, MICHEL GAUTHIER-CLERC2, ANDY J. GREEN4, HERVÉ FRITZ5 AND MATTHIEU GUILLEMAIN1
1Office National de la Chasse et de la Faune Sauvage, CNERA Avifaune Migratrice, La Tour du Valat, Le Sambuc, 13200 Arles, France
2Centre de Recherche de la Tour du Valat, Le Sambuc, 13200 Arles, France.
3Office National de la Chasse et de la Faune Sauvage, Direction des Études et de la Recherche, BP 20, 78612 Le Perray-en-Yvelines Cedex, France
4Department of Wetland Ecology, Estación Biológica de Doñana, EBD-CSIC, C/ Américo Vespucio s/n, 41092, Sevilla, Spain
5Université Claude Bernard Lyon 1, CNRS UMR 5558 Biométrie et Biologie Évolutive, Bâtiment 711, 43 Bd du 11 novembre 1918, 69622 Villeurbanne Cedex, France
* Corresponding author; E-mail: [email protected]
Abstract.—In the Camargue (southern France), drastic changes in wetlands have occurred (notably extension of agriculture and salt extraction) since the 1960s, which affect the resources available to migratory waterbirds. Winter diets of Mallard (Anas platyrhynchos) and Teal (A. crecca) in 2006-2008 were assessed by analyses of gullet contents. Using PCA-based methods, duck diets were described and the main feeding habitats used by each duck species were then determined with a typology analysis. The same four food items were most important (in terms of occurrence and average dry weight) in the diet of Mallard and Teal: Oryza sativa (rice), Echinochloa sp., Scirpus maritimus and Potamogeton pusillus seeds. However, Teal diet was more diversified, with eleven feeding habitat types, compared to only five in Mallard. Both species were found to be dependent on ricefields and ricefield-like habitats. Compared to previous studies in the same area between 1964 and 1981, permanent freshwater habitats now appear to be used more intensively by Mallard and Teal, while temporary marshes are used to a lesser extent. Since the 1960s, temporary marshes have been partially replaced by permanent freshwater in order to attract more ducks, mostly for hunting. The flexibility of duck diet in response to changing food availability may explain why duck populations have not decreased in the Camargue or in Europe despite changes in land use. Received 14 February
Key words.—Diet comparison, feeding habitat, habitat use, land use, Mallard, Teal.
Habitat loss and land use change are important threats to wetlands. Wetland destruction and degradation are gener-ally linked with human activities, especially through extension of agricultural, indus-trial and urban zones (Gibbs 2000; MWO 2012). At the same time, qualitative changes have occurred in wetlands, e.g. fish farm-ing leading to eutrophication (Heathwaite 2010). In brackish waters, wetland manage-ment for hunting often involves inputs of freshwater, altering the natural water cycle (Tamisier and Grillas 1994) and poten-tially causing eutrophication and introduc-tion of non-native species (MWO 2012).
Wetland loss or changes in land use have important consequences for water-birds. Both processes alter distribution of
food items and suitable habitat for ducks (Rendòn et al. 2008). For instance, agricul-tural practices can cause duck population declines at the local scale (e.g. Duncan et al. 1999). Wetland loss or land use changes may lead to a change in waterbird habitat selec-tion and diet choice (Kloskowski et al. 2009).
The Camargue is a Mediterranean wet-land in southern France of great impor-tance to wintering waterbirds (Tamisier and Dehorter 1999). Since the 1950s, drastic habitat modifications have occurred owing to anthropogenic causes in the area. The loss of natural wetlands has been related to the extension of agriculture, salt extraction and industry (Tamisier and Dehorter 1999; MWO 2012). On most of the remaining wet-lands (many being private hunting estates),

management has involved dividing marshes into smaller units and inputs of freshwater, resulting in a decrease in water salinity and a lengthening of flooding duration (Tamisier and Grillas 1994). Increased area and perma-nence of marshes led to increases in biomass and changes in species composition of aquat-ic vegetation (Aznar et al. 2003), making the Camargue more attractive to waterbirds, de-spite changes in water management having a negative impact on the diversity of plants and invertebrates (Tamisier and Grillas 1994).
A better understanding of the relation-ship between ducks and their habitat will facilitate wetland management and allow prediction of the effects of future global change (Perry et al. 2007). In this study, we identified the current diet of the two most common wintering dabbling ducks in the Camargue, Mallard (Anas platyrhynchos) and Common Teal (A. crecca, hereafter Teal), by analyzing gullet contents. Owing to their nocturnal foraging, it was not practical to determine habitat use by direct monitor-ing of duck distribution over the Camargue. Therefore, we used the gullet contents to identify the feeding habitat types used by the ducks. Finally, we compared current diet descriptions with previous studies in 1979-81 (hereafter c.1980) for Mallard and in 1964-66 (hereafter c.1965) for Teal (Pirot 1981 and Tamisier 1971, respectively). The aim of this comparison was to assess how land use change in the Camargue has resulted in changes in the diet of these two species.
METHODS
Study Area and Species
The Camargue encompasses approximately 145,000 ha, with 60,000 ha of natural wetlands and 85,000 ha of artificial habitats (Tamisier 1990). The surface area of the main types of habitats in the Camargue has changed since the 1940s, with expansion of salt pans, agricultur-al areas and industrial/urban areas at the expense of natural wetlands. Rice (Oryza sativa) is the primary crop of the Camargue. Protected areas represent 14% of the whole Camargue and 24% of the wetland area, salt pans included (Tamisier and Dehorter 1999). Hunting is permitted in all other wetland areas.
Tens of thousands of Mallard and Teal winter in the Camargue from August to March (annual peak counts ranging from 30,000 to 60,000 for each of the two spe-
cies; Kayser et al. 2008). These species represent 20 to 30% of the total Camargue wintering duck population (Tamisier and Dehorter 1999). Because they are highly regarded as game, these ducks are among the principal drivers of wetland management for private hunting es-tates and nature reserves.
Sample Collection and Analysis
To avoid food items being subjected to physical breakdown in the gizzard, diet was inferred only from the contents of the esophagus and proventriculus (hereafter ‘gullet’), as recommended by Swanson and Bartonek (1970).
Mallard and Teal gullets were collected from hunt-ers at eight sites (Fig. 1) during the hunting seasons 2006-7 and 2007-8 (Table 1). Most ducks were shot in the early morning, when flying out of wetland feeding sites towards roosting sites, so that their gullet would likely contain food items consumed during the night (Tamisier and Dehorter 1999). In most cases (86%), the gullet was removed 1-7 h after the duck was shot (the remaining 13% were removed the day after, with the duck kept in the fridge meanwhile). Gullet samples were then frozen in a plastic bag until examination. After excluding those empty of food items (57 Mallard and 69 Teal gullets), a total of 119 Mallard and 302 Teal gullets were analysed in the laboratory, where samples were washed through a 63-μm sieve. The retained ma-terial was sorted under a binocular microscope. The content of each gullet was separated into invertebrates, ‘seeds’ (i.e. achenes, oogonia and proper seeds) and plant vegetative parts. As the latter represented less than 0.2% of the average relative dry weight of the gul-let contents in both duck species (Table 2), they were discarded from the statistical analyses. Invertebrates were identified using Tachet et al. (2000) or local spe-cialists, to the family level in most cases. Seeds were mostly identified to genus or species using Campredon et al. (1982), Cappers et al. (2006), and a local reference collection. Invertebrates and seeds (hereafter “food items”) in small numbers were counted individually, whereas the number of abundant food items was esti-
Figure 1. The Camargue showing the eight collection sites for gullet samples (black symbols) and the five main protected areas.
mated by subsampling. Seed specific dry weights were taken from Arzel et al. (2007), complemented by our own measurements for those species not given by these authors, following the same method they used. We also used the protocol of Arzel et al. (2007) to measure the dry weight of invertebrates.
Statistical Analyses
We assumed that the hunting of ducks in Camargue is equivalent to random sampling in a large population. Data were presented as two distinct matrices in each species for the number and the dry weight of each food item type, respectively. Let O = [oij] be the n m matrix for one duck species with oij the number of occurrences of the jth food item (columns, 1 j m, with m the total number of food items) in the ith gullet (rows, 1 i n) and W = [wij] the n m matrix for one duck species with wij the dry weight of the jth food item (columns, 1 j m) in the ith gullet (rows, 1 i n). Two statistics were used to summarize the contribution of food items to the diet of each duck species: (i) Roj the relative frequency of occurrence of the jth food item (1 j m,) in gullets,
i.e. the mean number of occurrences of the jth food item among gullets, expressed as percent-
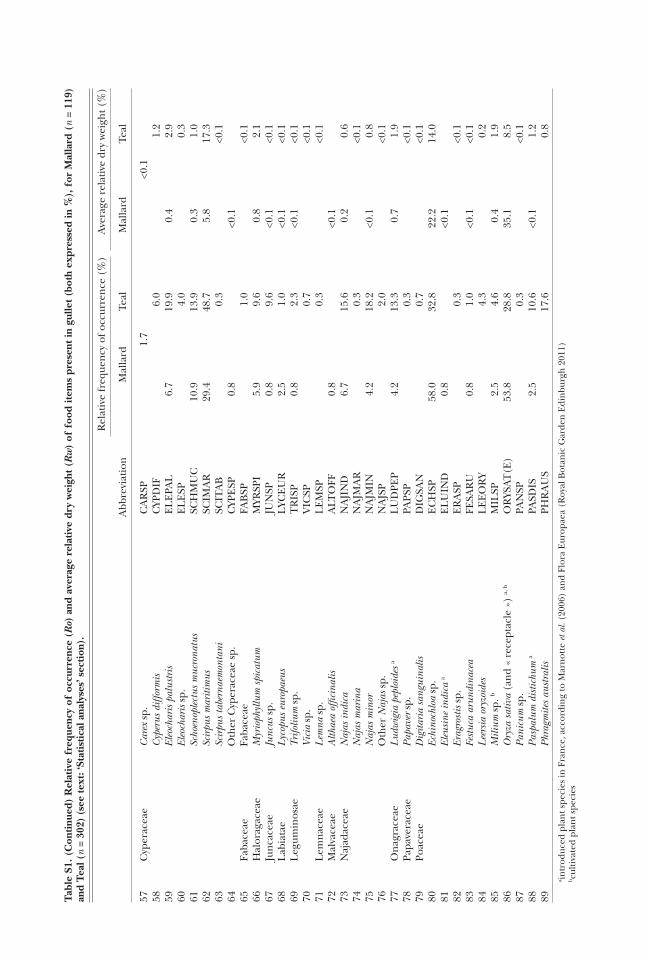
age (see Table S1); (ii) Rwj the average relative dry weight of the jth food item (1 j m) among gullets
n
i = 1(Rwj = n-1 pij with
m
j = 1pij = wij / wij), i.e. calculated by di-
viding the dry weight of each food item in each gullet by the total dry weight of all food items in the same gullet, then taking the average over all individuals, expressed as percentage (see Table S1 and S2).
PCA-based analyses
Let P = [pij] be the n m matrix of row profiles for one duck species with
m
j = 1pij = wij / wij the proportion (0
pij 1) of the jth food item (columns, 1 j m) in the ith gullet (rows, 1 i n). For both duck species, the matri-ces P were analyzed by performing a column-centered principal component analysis (%PCA, sensu de Crespin de Billy et al. 2000). We analyzed diet composition by examining the first two principal components of the column-centered PCA on distance biplots (see Storms et al. 2008 for details). Specific interpretation rules arise from the compositional nature of the P matrix (see de Crespin de Billy et al. 2000; Storms et al. 2008).
We performed separate %PCAs for Mallard and Teal. We tested for a winter (i.e. year) effect on diet composition using a between-class %PCA and its as-sociated randomization test (see Storms et al. 2008 for details), and found no biologically relevant effect for Mallard (between-class inertia to total inertia ratio R = 0.0073, P = 0.5) nor for Teal (R = 0.0068, P = 0.022). We therefore decided to pool data from both winters for each duck species for subsequent analyses.
We tested for a seasonal effect (early winter: Sep-tember and October; late winter: November to January) on diet composition. These two periods correspond to the first two periods (out of three) of the duck “winter-ing strategy” in the Camargue (restoring, pairing and fattening periods) during which feeding time budgets differ (Tamisier et al. 1995). We found some statistical evidence for a seasonal effect in both species, with com-parable effect sizes (P = 0.033 and 0.000001, R = 0.020 and 0.025 for Mallard and Teal, respectively). Although the size of the effect was small, we decided to perform separate %PCAs for early and late winter for both spe-cies, as feeding times and habitat selection may change between these two periods of the winter (Tamisier et al. 1995), hence potentially influencing duck diet and feeding habitats. Computations and graphical displays were performed using the ‘ade4’ package for R (Ches-sel et al. 2004).
Food item typology analysis
For establishing stable typologies, we had to make the matrices W less sparse (a sparse matrix contains a high proportion of zeros) than they were initially. Hence, in a first step, for each species we derived a n
m matrix Z = [zij] from W = [wij], where zij=1 if wij > 0, and zij=0 otherwise. We sorted the columns (food items) by decreasing order of proportion of 1s (by referring to the total number of 1s in the matrix), and we kept the columns until we reached a cumulative sum of 85%. We thus obtained a n m’ matrix Z’ (m’ < m). We fol-lowed the same procedure for the rows (gullets) of Z’,
n
i = 1(Roj = n-1 oij)
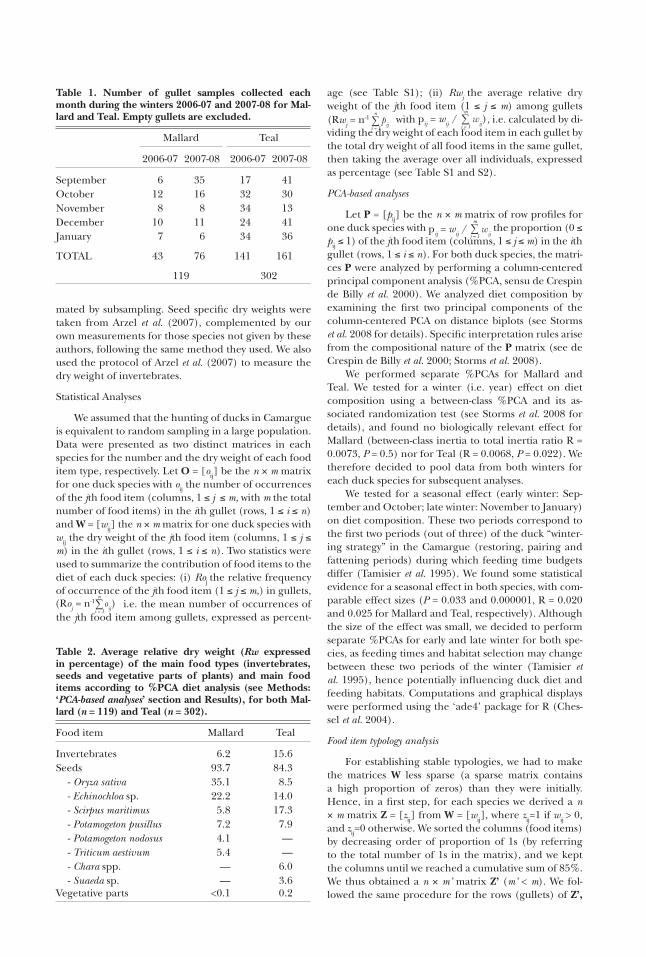
Table 1. Number of gullet samples collected each month during the winters 2006-07 and 2007-08 for Mal-lard and Teal. Empty gullets are excluded.
Mallard Teal
2006-07 2007-08 2006-07 2007-08
September 6 35 17 41October 12 16 32 30November 8 8 34 13December 10 11 24 41January 7 6 34 36
TOTAL 43 76 141 161
119 302
Table 2. Average relative dry weight (Rw expressed in percentage) of the main food types (invertebrates, seeds and vegetative parts of plants) and main food items according to %PCA diet analysis (see Methods: ‘PCA-based analyses’ section and Results), for both Mal-lard (n = 119) and Teal (n = 302).
Food item Mallard Teal
Invertebrates 6.2 15.6Seeds 93.7 84.3
- Oryza sativa 35.1 8.5- Echinochloa sp. 22.2 14.0- Scirpus maritimus 5.8 17.3- Potamogeton pusillus 7.2 7.9- Potamogeton nodosus 4.1 —- Triticum aestivum 5.4 —- Chara spp. — 6.0- Suaeda sp. — 3.6
Vegetative parts <0.1 0.2

for a cumulative sum up to 95%, removing gullets that contained 1 food item, i.e. 12% and 15% of Mallard and Teal gullets, respectively. Except for four Mallards and two Teal that specialised on one food item (mean seed number per gullets: 142 and 123 for Mallard and Teal respectively), all other gullets contained less than 18 seeds. We obtained an n’ m’ matrix W’ (n’ < n, m’ < m), maintaining about 80% of the values wij > 0 (81% for Mallard and 82% for Teal) and increasing consider-ably the filling rate of the matrices (from 2% to 16% for Mallard, and from 5% to 19% for Teal). In a second step, we used hierarchical agglomerative clustering, with chi-squared distance between the column profiles (e.g. Lebart et al. 2000) as the underlying distance func-tion, and the Ward method (e.g. Legendre and Legen-dre 1998) to determine distances between clusters. In calculating the Ward criterion, we employed its general-ized formula (e.g. Lebart et al. 2000), using the weights of the column profiles (i.e. the 1 j m’). We obtained a dendrogram for each species, which was truncated (the level of truncation was chosen visually), leading to a partition of the food items into k clusters (or classes). In a third step, we computed (i) the cen-troids of the classes (the food items were weighted as previously), (ii) the chi-square distances between the centroids of the classes, and (iii) the chi-square dis-tance between each food item and the centroid of its class (which allows identification of the food items most characteristic of each class). To improve visibility, all the chi-square distances hereafter mentioned were multi-plied by 10,000.
Relative importance of the food item classes
After the typology was built and characterized, we were interested in identifying the classes involving the most individuals (i.e. most gullets). For the ith individu-al (1 i n’), we calculated the total dry weight for the jth class of food items, which was then divided by the to-tal dry weight of the k classes, leading to the proportion p’ij (0 p’ij 1). By repeating for 1 j k we obtained
the row profile {si = [p’i1, p’i 2,..., p’ik ].k columns
In the hypotheti-
cal case where a gullet i was full of the food items of one unique class j (j = 1,2, …,k), then the correspond-ing row profile would be, respectively:
Hence, we computed the chi-square distances between
the ith row profile si (1 i n’) and the hypothetical row profiles t1, t2, …, tk, and the ith individual was assigned to the closest class j. Finally, we calculated the percent-ages of individuals assigned to each of the k classes.
Diet diversity
Diet diversity was measured by calculating Simp-son’s index of diversity for each gullet as, S'i = 1 - Si, with Simpson’s index
m
j = 1Si = p2ij (see Storms et al. 2008 for
interpretation). For each species (Mallard / Teal) and each period (early winter / late winter), we estimated the sampling distribution of the mean diet diversity by
bootstrapping (e.g. Efron and Tibshirani 1993). We used 106 bootstrap samples to accurately estimate the sam-pling distributions in each of the four groups (Mallard / early winter, Mallard / late winter, Teal / early win-ter, Teal / late winter). The four sampling distributions were plotted together (Fig. 2).
RESULTS
Mallard Diet
A total of 69 food item types were re-corded in Mallard diet (see Table S1). %PCA diet analysis (based on Rw) was based on the examination of the first two axes, accumulating 51% and 59% of total inertia in early and late winter, respectively, and showed food items and gullets simul-taneously (distance biplot on Fig. 3). Ac-cording to Fig. 3, Mallard diet was mainly composed, in decreasing order of impor-tance, of O. sativa, Echinochloa sp., Potamoge-ton pusillus, Scirpus maritimus and Potamoge-ton nodosus in early winter (Fig. 3a), and by O. sativa, Echinochloa sp., Triticum aestivum (wheat) and S. maritimus in late winter (Fig. 3b). For clarity, only the most important food items were labelled on the distance biplots. The six most consumed items rep-resented almost 80% of diet by Rw over the whole winter period (Table 2). The sum of
Rw'j/ Rw'j,m
j = 1
{k columns
t1 = [1,0,...0], {k columns
t2 = [1,0,...0], {k columns
tk = [0,0,...0].
Figure 2. Sampling distributions of the mean diet diver-sity (Simpson’s index of diversity) estimated by boot-strapping for the four groups: Mallard / early winter, Mallard / late winter, Teal / early winter, Teal / late win-ter (see Methods: ‘Diet diversity’ section and Results).
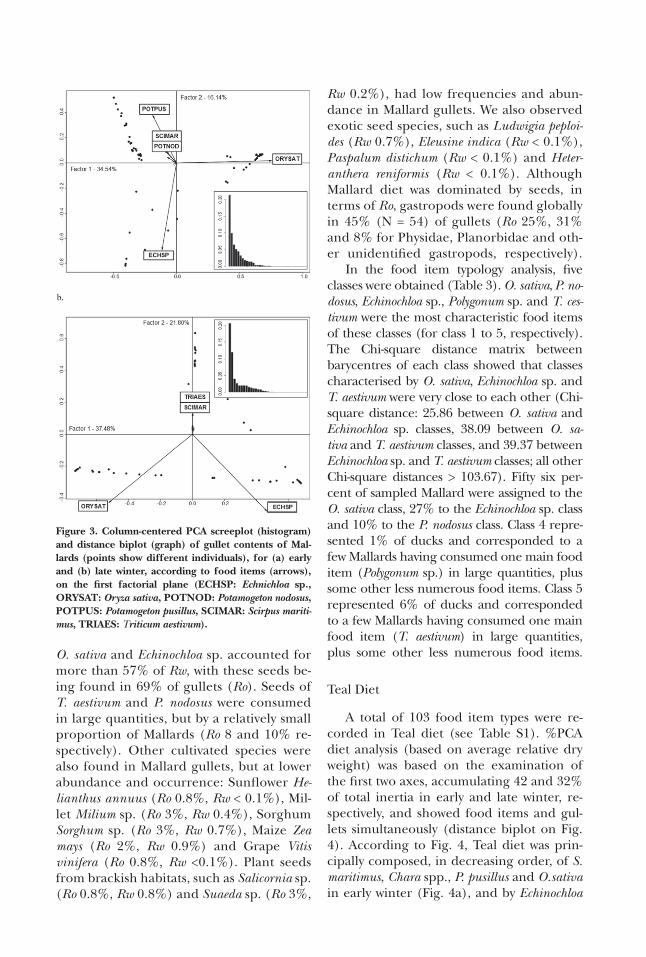
O. sativa and Echinochloa sp. accounted for more than 57% of Rw, with these seeds be-ing found in 69% of gullets (Ro). Seeds of T. aestivum and P. nodosus were consumed in large quantities, but by a relatively small proportion of Mallards (Ro 8 and 10% re-spectively). Other cultivated species were also found in Mallard gullets, but at lower abundance and occurrence: Sunflower He-lianthus annuus (Ro 0.8%, Rw < 0.1%), Mil-let Milium sp. (Ro 3%, Rw 0.4%), Sorghum Sorghum sp. (Ro 3%, Rw 0.7%), Maize Zea mays (Ro 2%, Rw 0.9%) and Grape Vitis vinifera (Ro 0.8%, Rw <0.1%). Plant seeds from brackish habitats, such as Salicornia sp. (Ro 0.8%, Rw 0.8%) and Suaeda sp. (Ro 3%,
Rw 0.2%), had low frequencies and abun-dance in Mallard gullets. We also observed exotic seed species, such as Ludwigia peploi-des (Rw 0.7%), Eleusine indica (Rw < 0.1%), Paspalum distichum (Rw < 0.1%) and Heter-anthera reniformis (Rw < 0.1%). Although Mallard diet was dominated by seeds, in terms of Ro, gastropods were found globally in 45% (N = 54) of gullets (Ro 25%, 31% and 8% for Physidae, Planorbidae and oth-er unidentified gastropods, respectively).
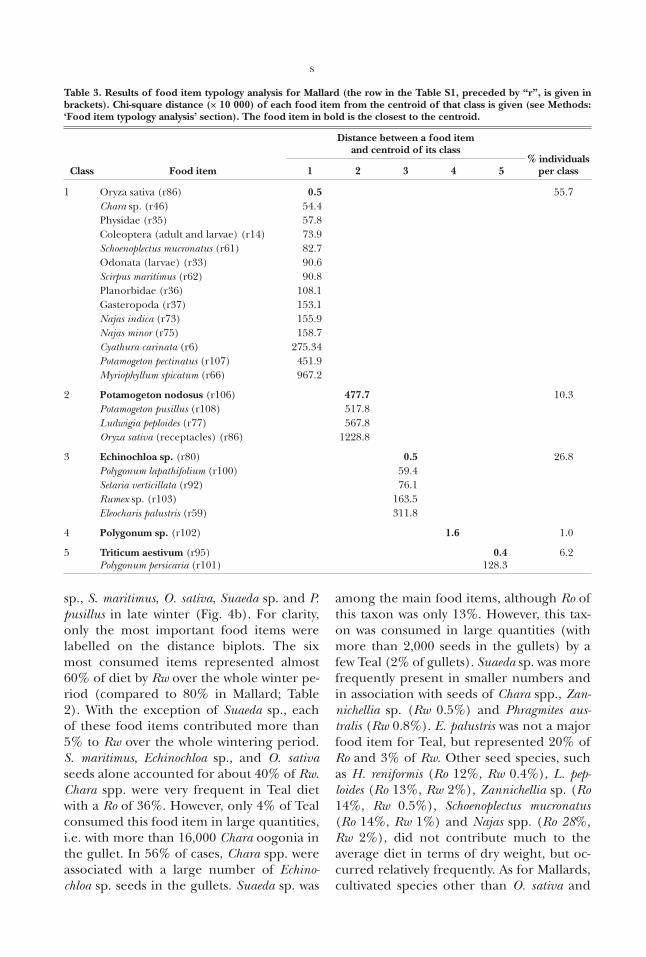
In the food item typology analysis, five classes were obtained (Table 3). O. sativa, P. no-dosus, Echinochloa sp., Polygonum sp. and T. ces-tivum were the most characteristic food items of these classes (for class 1 to 5, respectively). The Chi-square distance matrix between barycentres of each class showed that classes characterised by O. sativa, Echinochloa sp. and T. aestivum were very close to each other (Chi-square distance: 25.86 between O. sativa and Echinochloa sp. classes, 38.09 between O. sa-tiva and T. aestivum classes, and 39.37 between Echinochloa sp. and T. aestivum classes; all other Chi-square distances > 103.67). Fifty six per-cent of sampled Mallard were assigned to the O. sativa class, 27% to the Echinochloa sp. class and 10% to the P. nodosus class. Class 4 repre-sented 1% of ducks and corresponded to a few Mallards having consumed one main food item (Polygonum sp.) in large quantities, plus some other less numerous food items. Class 5 represented 6% of ducks and corresponded to a few Mallards having consumed one main food item (T. aestivum) in large quantities, plus some other less numerous food items.
Teal Diet
A total of 103 food item types were re-corded in Teal diet (see Table S1). %PCA diet analysis (based on average relative dry weight) was based on the examination of the first two axes, accumulating 42 and 32% of total inertia in early and late winter, re-spectively, and showed food items and gul-lets simultaneously (distance biplot on Fig. 4). According to Fig. 4, Teal diet was prin-cipally composed, in decreasing order, of S. maritimus, Chara spp., P. pusillus and O.sativa in early winter (Fig. 4a), and by Echinochloa
Figure 3. Column-centered PCA screeplot (histogram) and distance biplot (graph) of gullet contents of Mal-lards (points show different individuals), for (a) early and (b) late winter, according to food items (arrows), on the first factorial plane (ECHSP: Echnichloa sp., ORYSAT: Oryza sativa, POTNOD: Potamogeton nodosus, POTPUS: Potamogeton pusillus, SCIMAR: Scirpus mariti-mus, TRIAES: Triticum aestivum).
S
sp., S. maritimus, O. sativa, Suaeda sp. and P. pusillus in late winter (Fig. 4b). For clarity, only the most important food items were labelled on the distance biplots. The six most consumed items represented almost 60% of diet by Rw over the whole winter pe-riod (compared to 80% in Mallard; Table 2). With the exception of Suaeda sp., each of these food items contributed more than 5% to Rw over the whole wintering period. S. maritimus, Echinochloa sp., and O. sativa seeds alone accounted for about 40% of Rw. Chara spp. were very frequent in Teal diet with a Ro of 36%. However, only 4% of Teal consumed this food item in large quantities, i.e. with more than 16,000 Chara oogonia in the gullet. In 56% of cases, Chara spp. were associated with a large number of Echino-chloa sp. seeds in the gullets. Suaeda sp. was
among the main food items, although Ro of this taxon was only 13%. However, this tax-on was consumed in large quantities (with more than 2,000 seeds in the gullets) by a few Teal (2% of gullets). Suaeda sp. was more frequently present in smaller numbers and in association with seeds of Chara spp., Zan-nichellia sp. (Rw 0.5%) and Phragmites aus-tralis (Rw 0.8%). E. palustris was not a major food item for Teal, but represented 20% of Ro and 3% of Rw. Other seed species, such as H. reniformis (Ro 12%, Rw 0.4%), L. pep-loides (Ro 13%, Rw 2%), Zannichellia sp. (Ro 14%, Rw 0.5%), Schoenoplectus mucronatus (Ro 14%, Rw 1%) and Najas spp. (Ro 28%, Rw 2%), did not contribute much to the average diet in terms of dry weight, but oc-curred relatively frequently. As for Mallards, cultivated species other than O. sativa and
Table 3. Results of food item typology analysis for Mallard (the row in the Table S1, preceded by “r”, is given in brackets). Chi-square distance ( 10 000) of each food item from the centroid of that class is given (see Methods: ‘Food item typology analysis’ section). The food item in bold is the closest to the centroid.
Class Food item
Distance between a food item and centroid of its class
% individualsper class 1 2 3 4 5
1 Oryza sativa (r86) 0.5 55.7Chara sp. (r46) 54.4Physidae (r35) 57.8Coleoptera (adult and larvae) (r14) 73.9Schoenoplectus mucronatus (r61) 82.7Odonata (larvae) (r33) 90.6Scirpus maritimus (r62) 90.8Planorbidae (r36) 108.1Gasteropoda (r37) 153.1Najas indica (r73) 155.9Najas minor (r75) 158.7Cyathura carinata (r6) 275.34Potamogeton pectinatus (r107) 451.9Myriophyllum spicatum (r66) 967.2
2 Potamogeton nodosus (r106) 477.7 10.3Potamogeton pusillus (r108) 517.8Ludwigia peploides (r77) 567.8Oryza sativa (receptacles) (r86) 1228.8
3 Echinochloa sp. (r80) 0.5 26.8Polygonum lapathifolium (r100) 59.4Setaria verticillata (r92) 76.1Rumex sp. (r103) 163.5Eleocharis palustris (r59) 311.8
4 Polygonum sp. (r102) 1.6 1.0
5 Triticum aestivum (r95) 0.4 6.2Polygonum persicaria (r101) 128.3
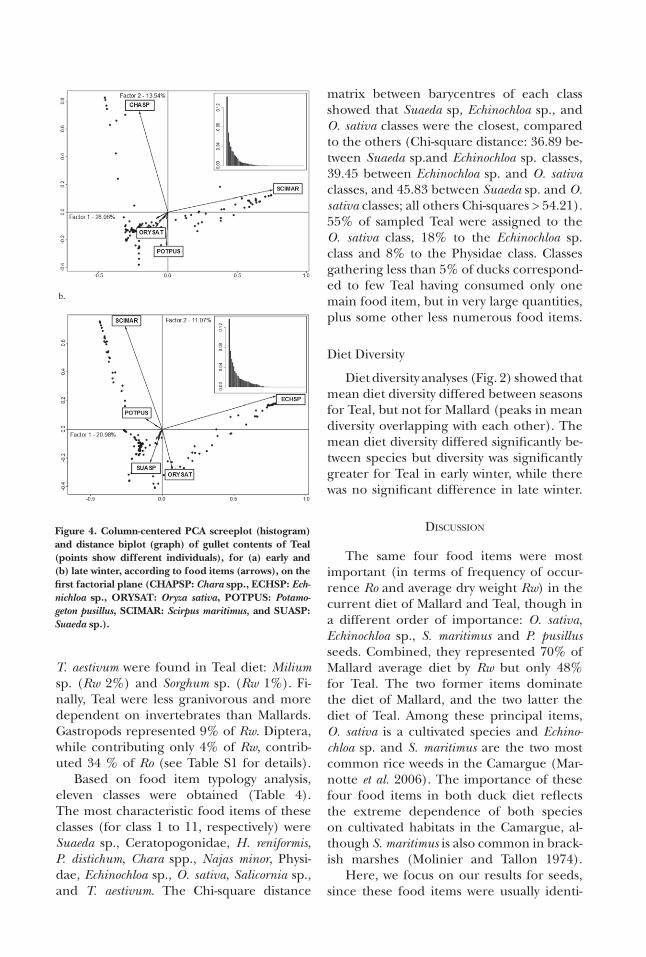
T. aestivum were found in Teal diet: Milium sp. (Rw 2%) and Sorghum sp. (Rw 1%). Fi-nally, Teal were less granivorous and more dependent on invertebrates than Mallards. Gastropods represented 9% of Rw. Diptera, while contributing only 4% of Rw, contrib-uted 34 % of Ro (see Table S1 for details).
Based on food item typology analysis, eleven classes were obtained (Table 4). The most characteristic food items of these classes (for class 1 to 11, respectively) were Suaeda sp., Ceratopogonidae, H. reniformis, P. distichum, Chara spp., Najas minor, Physi-dae, Echinochloa sp., O. sativa, Salicornia sp., and T. aestivum. The Chi-square distance
matrix between barycentres of each class showed that Suaeda sp, Echinochloa sp., and O. sativa classes were the closest, compared to the others (Chi-square distance: 36.89 be-tween Suaeda sp.and Echinochloa sp. classes, 39.45 between Echinochloa sp. and O. sativa classes, and 45.83 between Suaeda sp. and O. sativa classes; all others Chi-squares > 54.21). 55% of sampled Teal were assigned to the O. sativa class, 18% to the Echinochloa sp. class and 8% to the Physidae class. Classes gathering less than 5% of ducks correspond-ed to few Teal having consumed only one main food item, but in very large quantities, plus some other less numerous food items.
Diet Diversity
Diet diversity analyses (Fig. 2) showed that mean diet diversity differed between seasons for Teal, but not for Mallard (peaks in mean diversity overlapping with each other). The mean diet diversity differed significantly be-tween species but diversity was significantly greater for Teal in early winter, while there was no significant difference in late winter.
DISCUSSION
The same four food items were most important (in terms of frequency of occur-rence Ro and average dry weight Rw) in the current diet of Mallard and Teal, though in a different order of importance: O. sativa, Echinochloa sp., S. maritimus and P. pusillus seeds. Combined, they represented 70% of Mallard average diet by Rw but only 48% for Teal. The two former items dominate the diet of Mallard, and the two latter the diet of Teal. Among these principal items, O. sativa is a cultivated species and Echino-chloa sp. and S. maritimus are the two most common rice weeds in the Camargue (Mar-notte et al. 2006). The importance of these four food items in both duck diet reflects the extreme dependence of both species on cultivated habitats in the Camargue, al-though S. maritimus is also common in brack-ish marshes (Molinier and Tallon 1974).
Here, we focus on our results for seeds, since these food items were usually identi-
Figure 4. Column-centered PCA screeplot (histogram) and distance biplot (graph) of gullet contents of Teal (points show different individuals), for (a) early and (b) late winter, according to food items (arrows), on the first factorial plane (CHAPSP: Chara spp., ECHSP: Ech-nichloa sp., ORYSAT: Oryza sativa, POTPUS: Potamo-geton pusillus, SCIMAR: Scirpus maritimus, and SUASP: Suaeda sp.).

T
able
4. R
esul
ts o
f fo
od it
em ty
polo
gy a
naly
sis
for
Tea
l (th
e ro
w in
the
Tab
le S
1, p
rece
ded
by “
r”, i
s gi
ven
in b
rack
ets)
. Chi
-squ
are
dist
ance
( 1
0 00
0) o
f ea
ch f
ood
item
fro
m th
e ce
ntro
id o
f th
at c
lass
is g
iven
(se
e M
etho
ds: ‘
Food
item
typo
logy
ana
lysi
s’ s
ecti
on).
The
foo
d it
em in
bol
d is
the
clos
est t
o th
e ce
ntro
id.
Cla
ss
Foo
d it
ems
Dis
tanc
e be
twee
n a
food
item
and
cen
troi
d of
its
clas
s%
indi
vidu
als
per
cla
ss1
23
45
67
89
1011
1Su
aeda
sp.
(r5
3)0.
13.
7Ps
ych
odid
ae (
larv
ae)
(r18
)45
.4Ph
ragm
ites
aust
ralis
(r8
9)48
.4
2C
erat
opog
onid
ae (
larv
ae)
(r15
)13
.92.
9O
stra
coda
(r9
)10
4.2
3H
eter
anth
era
reni
form
is (
r105
)5.
40.
4
4Pa
spal
um d
istic
hum
(r8
8)19
.72.
0
5C
hara
sp.
(r4
6)4.
32.
9C
lado
cera
(ep
hip
pia)
(r5
)12
1.6
Junc
us s
p. (
r67)
194.
9
6N
ajas
min
or (
r75)
21.1
0.4
7P
hysi
dae
(r35
)16
.08.
0Po
lygo
num
lapa
thifo
lium
(r1
00)
184.
6L
udw
igia
pep
loid
es (
r77)
229.
3In
ula
sp. (
r55)
266.
0
8E
chin
ochl
oa s
p. (
r80)
1.00
18.3
Hyd
rach
nel
lae
(r1)
57.1
Scho
enop
lect
us m
ucro
natu
s (r
61)
63.7
Poly
gonu
m p
ersi
cari
a (r
101)
68.7
Dip
tera
(ad
ult,
nym
ph a
nd
larv
ae)
(r24
)94
.7G
aste
ropo
da (
r37)
100.
0A
nis
opte
ra (
larv
ae)
(r31
)19
9.9
Ory
za s
ativ
a (e
mba
ses)
(r8
6)21
6.8
Col
eopt
era
(adu
lt a
nd
larv
ae)
(r14
)22
6.4
9O
ryza
sat
iva
(r86
)6.
654
.5Pl
anor
bida
e (r
36)
58.2
Naj
as in
dica
(r7
3)77
.1O
don
ata
(lar
vae)
(r3
3)86
.3

fied to the species level, permitting identifi-cation of more precise feeding habitat, con-trary to invertebrate taxa which could mostly be identified at the family level. The pres-ence in duck diets of rice and typical rice weeds (e.g. E. palustris, Polygonum lapathifo-lium, Polygonum persicaria, Cyperus difformis, and S. mucronatus; Marnotte et al. 2006) ei-ther in isolation, mixed together, or some-times also mixed with hydrophyte seeds, which are typical of permanent (Potamogeton pectinatus, Myriophyllum spicatum) and semi-permanent (P. nodosus, P. pusillus) freshwa-ter marshes, may also result from different hunting management strategies. Baiting is a common strategy used by hunters in the Ca-margue. Bait can be composed of rice, rice weeds or both, depending on whether bait comes from unsorted or sorted harvest or from harvest waste. The presence of P. pec-tinatus in Mallard diet and P. pusillus in Teal diet, mixed with other species characteristic of ricefield habitat, may result from rice bait being spread in pondweed marshes (au-thors’ personal observation). Alternatively, the presence of rice in duck diet could also reflect the exploitation of post-harvest rice-fields by ducks during winter, either when these are naturally flooded by rain or specifi-cally managed as freshwater habitat in order to attract waterfowl (Elphick and Oring 1998; Tourenq et al. 2001). These two management strategies (i.e. bait or ricefield management) are both practiced in the Camargue and rep-resent part of the habitat change there, but they could not be differentiated by duck diet analysis alone. Wheat in duck diet was also likely to be from hunting bait, since this spe-cies is not cultivated during winter in the Ca-margue, and wheat seeds rot rapidly when moist (authors’ personal observation). The association of wheat with other plant species from a different habitat (P. persicaria and Za-nichellia sp. for Mallard and Teal, respective-ly) in the same typology class may result from the use of wheat bait in freshwater marshes.
Besides the four common most numer-ous food items, important differences were observed between the current diets of the two duck species, such as the heavy con-sumption of Chara oogonia by Teal and
Tab
le 4
. (C
onti
nued
) R
esul
ts o
f fo
od it
em ty
polo
gy a
naly
sis
for
Tea
l (th
e ro
w in
the
Tab
le S
1, p
rece
ded
by “
r”, i
s gi
ven
in b
rack
ets)
. Chi
-squ
are
dist
ance
(10
000
) of
eac
h fo
od
item
fro
m th
e ce
ntro
id o
f th
at c
lass
is g
iven
(se
e M
etho
ds: ‘
Food
item
typo
logy
ana
lysi
s’ s
ecti
on).
The
foo
d it
em in
bol
d is
the
clos
est t
o th
e ce
ntro
id.
Cla
ss
Foo
d it
ems
Dis
tanc
e be
twee
n a
food
item
and
cen
troi
d of
its
clas
s%
indi
vidu
als
per
cla
ss1
23
45
67
89
1011
Scir
pus
mar
itim
us (
r62)
95.5
Ch
iron
omid
ae (
larv
ae)
(r16
)14
4.7
Pota
mog
eton
pus
illus
(r1
08)
211.
8El
eoch
aris
pal
ustr
is (
r59)
223.
89H
ydro
phili
dae
(lar
vae)
(r1
2)22
4.1
Cyp
erus
diff
orm
is (
r58)
418.
7M
yrio
phyl
lum
spi
catu
m (
r66)
699.
9R
anun
culu
s sp
. (r1
0976
5.1
10Sa
licor
nia
sp. (
r51)
8.7
1.2
11T
ritic
um a
estiv
um (
r95)
2.8
5.7
Zann
iche
llia
sp. (
r116
)13
9.3

of P. nodosus seeds by Mallard. Overall, a greater diversity of food items was observed in Teal. Mallard are known to select larger food items on average than Teal, although both use a broad range of seed sizes (Guil-lemain et al. 2002; Brochet et al. 2012). Pöysä (1987) suggested the diverse use made by Teal of habitats in the horizontal dimension was associated with a varied diet. Conversely, the restricted use of shorelines by Mallards was associated with a less variable diet (see also Nummi 1993). Furthermore, in our study Teal also seemed to be less depen-dent on ricefields than Mallard, but more dependent on semi-permanent freshwater marshes. Mallard appeared to largely spe-cialize on rice and associated plant species (57% of the average Mallard diet by Rw is composed by O. sativa and Echinochloa sp.). In the Ebro delta, northern Spain, rice was also found to be more frequent in the diet of Mallard than of Teal (Mateo et al. 2000).
Brackish habitats were represented in Teal diet by only one class characterized by Suaeda sp., a typical species of shallow, brack-ish habitats. Characteristic seed species of temporary freshwater or brackish habitats (e.g. Ruppia sp., Chara sp. or Zannichellia sp.), or coastal lagoon habitat (e.g. Zostera noltii) may have been slightly underesti-mated in our duck diet study. These habi-tats in the Camargue correspond mainly to protected areas where management is less intensive, and marshes are more salty due to natural marine influence (most protected areas are in the South of Camargue, near the Mediterranean Sea) and some brackish and/or annual plants are more abundant there than in permanent freshwater habitats (Tamisier and Dehorter 1999). Ducks using protected areas for both feeding and resting were not represented in our analysis, as they escape hunting pressure. These individuals however likely represent a minor part of the duck population, since Camargue winter-ing ducks generally commute twice daily between a day-roost and a distinct nocturnal foraging area (Tamisier and Dehorter 1999).
Mallard and Teal diets were previously studied in c.1980 by Pirot (1981) and in c.1965 by Tamisier (1971), respectively. The
methods used were similar to ours (diet from hunted ducks; relative dry weight of food items), except that Tamisier (1971) also used a combination of gullet and gizzard contents.
In c.1980, Pirot (1981) found that Mal-lard diet in the Camargue was made up by Rw of 46% Poaceae (O. sativa and Echnino-chloa sp.), 17% Cyperaceae, 17% Cheno-podiaceae, 14% Characeae, and 6% Pota-mogetonaceae (see also Green et al. 2002 for a detailed summary in English of this French reference). The equivalent propor-tions of these food items in our results were Rw 57%, 7%, 1%, <0.1% and 13% respec-tively. According to Pirot (1981), in c. 1980, Characeae were principally consumed at the beginning of winter and Cyperaceae at the end. O. sativa, Echinochloa sp., S. maritimus and P. pectinatus made up the main diet of Mallard throughout the period, the latter two being less abundant than the former two species. In c. 1980, the animal part was less than 1% of the average Mallard diet by Rw, whereas this part represented 6% in our results. Therefore, compared to c.1980, Mallard diet has not changed a great deal, rice and rice weeds still being the main food items. However we did notice a shift from P. pectinatus to P. nodosus, the former chang-ing from a Ro of 33% in c. 1980 to 7% cur-rently, and the latter from 0% to 10%. We also observed a lower consumption of Cha-ra spp. in our study, Rw <1%, compared to 14% in Pirot (1981). In both studies, Mal-lard was dependent on ricefield habitats. O. sativa and Echninochloa sp. represented 46% by Rw in Pirot (1981) and 57% in our study, but ricefield surface area has increased over time (from c. 6,000 ha in 1980 to c. 20,000 ha from 2000-2010; Marnotte et al. 2006).
In c.1965, Tamisier (1971) found that Teal diet in the Camargue was made up, by Rw, of 25% Characeae, 25% Cyperaceae seeds and 25% seeds of O. sativa and Echinochloa sp. The last 25% consisted of Chenopodiaceae, Potamogetonacae, Ruppiacae and Myriophyl-lum sp. seeds. The equivalent proportions of these food items in our results were Rw 6%, 23%, 23%, and 17% respectively. Hence, Teal diet has not changed a great deal ei-ther since c.1965. However, the proportions

D
of Echinochloa sp. and S. maritimus have in-creased over time (from 7% to 14% and from 4% to 17% respectively by Rw), where-as the proportions of Characeae and Ruppi-aceae have decreased (from 23% to 6% and from 4% to 0.4%, respectively, by Rw). Teal now seem to exploit brackish and temporary freshwater habitats to a lesser extent than they did in the 1960s: Suaeda sp., Chara spp. and Ruppia sp. represented 27% of Teal diet by Rw in Tamisier (1971), and 10% in this study. The surface area of temporary brack-ish marshes has greatly decreased, most be-ing replaced by permanent and semi-perma-nent freshwater marshes artificially flooded (Tamisier and Grillas 1994). Conversely Teal now seem to rely more on freshwater habi-tats (natural or cultivated): Poaceae, Pota-mogetonaceae and Haloragaceae represent-ed 29% of Teal diet by Rw in Tamisier (1971) and 41% in this study. Ricefield surface area reached a peak of 32,500 ha in 1962 (29,500 ha in 1965, Marnotte et al. 2006), but there were also more temporary freshwater habi-tats then than nowadays. The surface area of temporary freshwater marshes declined by 60% from 1942 to 1984, and this trend continues (Tamisier and Dehorter 1999).
We also observed new food items that appeared in the diet of both ducks since c. 1965. First, we observed seeds of the exotic plants H. reniformis and L. peploides, native to the Americas, which colonized the Camar-gue 15 and 30 years ago, respectively (Mar-notte et al. 2006). H. reniformis had a particu-larly high abundance in some Teal in this study, with up to 148,000 seeds in one gullet. Ducks are likely to play a role in the spread and colonization of new habitats by these plant species (Brochet et al. 2009, 2010). Secondly, we observed the appearance of in-digenous plants such as P. nodosus, which was absent from previous diet studies, whereas this species was abundant and frequent in ours. P. nodosus was rare in the Camargue in the 1960s and known only from canals and ditches (Molinier and Tallon 1974). In the 1980s P. nodosus was not found in freshwater marshes (Britton and Podlejski 1981; Grillas 1990), but was still frequent in canals. P. no-dosus was eventually found in year 2000 in
freshwater Camargue marshes (Aznar et al. 2003), where this species is now widespread. There may be a parallel between the decline of P. pectinatus and the increase in both P. nodosus and P. pusillus. This switch may be due to a change in frequency of drought or drawdown (short and regular nowadays, long and irregular in the 1960s). More in-tensive water management developed for hunting activity (Tamisier and Dehorter 1999) may have favoured the latter two Pota-mogeton species. Conversely, we observed the disappearance of Scirpus littoralis, which was no longer recorded in the current Teal diet. S. littoralis was widespread at the beginning of the 1960s (Molinier and Tallon 1974; Brit-ton and Podlejski 1981). Today the species is declining, with few known localities in the Camargue, likely due to intensification of marsh management, leading to eutrophi-cation and frequent mechanical destruc-tion of helophytes (P. Grillas, pers.comm.).
Our results indicate that the current diet of both Mallard and Teal rely essen-tially on cultivated species and associated plants. Most marshes of the Camargue are managed in order to attract the maximum number of waterbirds, mostly for hunting, but also partly for conservation and tourism purposes. Our results suggest that this in-tensive marsh management does not reach its goal, since ducks still principally exploit cultivated habitat. However, the switch from temporary to more permanent marshes has resulted in profound changes in plant spe-cies composition over the last decades, with an overall loss in plant biodiversity across the Camargue (Tamisier and Grillas 1994). This loss of natural wetland habitat does not seem to have affected Mallard and Teal abundance, since the size of their popula-tions did not undergo a significant reduc-tion since the 1970s, neither in the Camar-gue (Kayser et al. 2008) nor at wider scales across Europe (Delany and Scott 2006).
ACKNOWLEDGMENTS
We are grateful to hunting managers who autho-rised us to take samples from ducks. We thank J. Fuster for help collecting gullet samples and L. Cosneau, M. Droulin and V. Pavési for help analysing gullet contents.
E. Coulet and A. Waterkeyn identified invertebrates. P. Grillas commented on the manuscript. A.-L. Brochet was funded by a Doctoral grant from Office National de la Chasse et de la Faune Sauvage, with further fund-ing from a research agreement between ONCFS, the Tour du Valat, Laboratoire de Biométrie et de Biolo-gie Evolutive (UMR 5558 CNRS Université Lyon 1) and the Doñana Biological Station (EBD-CSIC). Additional funding was received from Agence Interorganismes pour la Recherche et le Développement (AIRD) and MAVA Foundation.
LITERATURE CITED
Arzel, C., J. Elmberg, M. Guillemain, P. Legagneux, F. Bosca, M. Chambouleyron, M. Lepley, C. Pin, A. Ar-naud and V. Schricke. 2007. Average mass of seeds encountered by foraging dabbling ducks in Western Europe. Wildlife Biology 13: 328-336.
Aznar, J. C., A. Dervieux and P. Grillas. 2003. Associa-tion between aquatic vegetation and landscape in-dicators of human pressure. Wetlands 23: 149-160.
Britton, R. H. and V. D. Podlejski. 1981. Inventory and classification of the wetlands of the Camargue (France). Aquatic Botany 10: 195-228.
Brochet, A. L., L. Dessborn, P. Legagneux, J. Elmberg, M. Gauthier-Clerc, H. Fritz and M. Guillemain. 2012. Is diet segregation between dabbling ducks due to food partitioning? A review of seasonal pat-terns in the Western Palearctic. Journal of Zoology 286: 171–178.
Brochet, A. L., M. Guillemain, H. Fritz, M. Gauthier-Clerc and A. J. Green. 2009. The role of migratory ducks in the long-distance dispersal of native plants and the spread of exotic plants in Europe. Ecogra-phy 32: 919-928.
Brochet, A. L., M. Guillemain, H. Fritz M. Gauthier-Clerc and A. J. Green. 2010. Plant dispersal by teal (Anas crecca) in the Camargue: Duck guts are more important than their feet. Freshwater Biology 55: 1262−1273.
Campredon, S., P. Campredon, J. Y. Pirot and A. Tamisi-er. 1982. Manuel d’Analyse des Contenus Stomacaux de Canards et de Foulques. ONC, Paris, France.
Cappers, R. T. J., R. M. Bekker and J. E. A. Jans. 2006. Digital Seed Atlas of the Netherlands. Barkhuis Pub-lishing, Eelde, Holland.
Chessel, D., A. B. Dufour and J. Thioulouse. 2004. The ade4 package - I: One-table methods. R news 4: 5-10.
de Crespin de Billy, V., S. Dolédec and D. Chessel. 2000 Biplot presentation of diet composition data: An al-ternative for fish stomach contents analysis. Journal of Fish Biology 56: 961-973.
Delany S. and D. Scott. 2006. Waterbird Population Estimates, 4th Edition. Wetlands International, Wa-geningen, Holland.
Duncan, P., A. J. M. Hewison, S. Houte, R. Rosoux, T. Tournebize, F. Dubs, F. Burel and V. Bretagnolle. 1999. Long-term changes in agricultural practices and wildfowling in an internationally important
wetland, and their effects on the guild of wintering ducks. Journal of Applied Ecology 36: 11-23.
Efron, B. and R. J. Tibshirani. 1993. An introduction to the bootstrap. Chapman & Hall, New York, New York.
Elphick C. S. and L. W. Oring. 1998. Winter manage-ment of Californian rice fields for waterbirds. Jour-nal of Applied Ecology 35: 95-108.
Gibbs, J. P. 2000. Wetland destruction and degradation are generally linked with human activities. Conser-vation Biology 14: 314-317.
Green, A. J., J. Figuerola and M. I. Sanchez. 2002. Im-plications of waterbird ecology for the dispersal of aquatic organisms. Acta Oecologica 23: 177-189.
Grillas P. 1990. Distribution of submerged macrophytes in the Camargue in relation to environmental fac-tors. Journal of Vegetation Science 1: 393-402.
Guillemain, M., H. Fritz, N. Guillon and G. Simon. 2002. Ecomorphology and coexistence in dabbling ducks: the role of lamellar density and body length in winter. Oikos 98: 547-551.
Heathwaite A. L. 2010. Multiple stressors on water avail-ability at global to catchment scales: understanding human impact on nutrient cycles to protect water quality and water availability in the long term. Fresh-water Biology 55: 241-257.
Kayser, Y., M. Gauthier-Clerc, A. Béchet, B. Poulin, G. Massez, Y. Chérain, J. Paoli, N. Sadoul, E. Vialet, G. Paulus, N. Vincent-Martin, P. Pilard and P. Isen-mann. 2008. Compte-rendu ornithologique camar-guais pour les années 2001-2006. Revue d’Ecologie (Terre Vie) 63: 299-349.
Kloskowski, J., A. J. Green, M. Polak, J. Bustamante and J. Krogulec. 2009. Complementary use of natural and artificial wetlands by waterbirds wintering in Doñana, south-west Spain. Aquatic Conservation: Marine and Freshwater Ecosystems 19: 815-826.
Lebart, L., A. Morineau and M. Piron. 2000. Statistique Exploratoire Multidimensionnelle, 3e Edition. Du-nod, Paris, France.
Legendre, P. and L. Legendre. 1998. Numerical Ecol-ogy, 2nd English Edition. Elsevier, Amsterdam, Hol-land.
Marnotte, P., A. Carrara, E. Dominati and F. Girardot. 2006. Plantes des Rizières de Camargue. Cirad-CFR-PNRC, Montpellier, France.
Mateo, R., R. Guitart and A. J. Green. 2000. Determi-nants of lead shot, rice, and grit ingestion in ducks and coots. Journal of Wildlife Management 64: 939-947.
Molinier, R. and G. Talon. 1974. Documents pour in-ventaire des plantes vasculaires de la Camargue. Bul-letin de la société d’Histoire Naturelle de Marseille 30: 5-110.
MWO (2012) Mediterranean Wetlands: Outlook. First Mediterranean Wetlands Observatory report - Tech-nical report. Tour du Valat, France. Available at: http://medwetlands-obs.org, accessed May 2012.
Nummi, P. 1993. Food-niche relationships of sympatric Mallards and Green-winged Teals. Canadian Journal of Zoology 71: 49-55.

Perry, M. C., A. Welles-Berlin, D. M. Kidwell and P. C. Osenton. 2007. Temporal changes of populations and trophic relationships of wintering diving ducks. Waterbirds 30: 4-16.
Pirot, J. Y. 1981. Partage alimentaire et spatial des zones humides camarguaises par cinq espèces de canards en hivernage et en transit. Unpublished Ph.D. Thesis, Pierre et Marie Curie University, Paris, France.
Pöysä, H. 1987. Ecology of foraging behaviour in dab-bling ducks (Anas sp.). Publications Sciences No. 10, University of Joensuu, Joensuu, Finland.
Rendòn, M. A., A. J. Green, E. Aquilera and P. Almaraz. 2008. Status, distribution and long-term changes in the waterbird community wintering in Doñana, south-west Spain. Biological Conservation 141: 371-1388.
Royal Botanic Garden Edinburgh, 2011. Flora Euro-paea. http://rbg-eb2.rbge.org.uk/FE/fe.html, ac-cessed April 2011.
Storms, D., P. Aubry, J. L. Hammann, S. Saïd, H. Fritz, C. Saint-Andrieux and F. Klein. 2008. Seasonal varia-tion in diet composition and similarity of sympatric Red Deer Cervus elaphus and Roe Deer Capreolus cap-reolus. Wildlife Biology 14: 237-250.
Swanson, G. A. and J. C. Bartonek. 1970. Bias associated with food analysis in gizzards of Blue-winged Teal. Journal of Wildlife Management 34: 739-746.
Tachet H., P. Richoux, M. Bournaud and P. Usseglio-Polera. 2000. Invertébrés d’Eau Douce : Systéma-tique, Biologie, Ecologie. CNRS Editions, Paris, France.
Tamisier, A. 1971. Régime alimentaire des Sarcelles d’Hiver Anas crecca L. en Camargue. Alauda 39: 261-311.
Tamisier, A. 1990. Camargue, Milieu et Paysage : Evolu-tion de 1942 à 1984. Arcane, Arles, France.
Tamisier, A., L. Allouche, F. Aubrey and O. Dehorter. 1995. Wintering strategies and breeding success: hy-pothesis for a trade-off in some waterfowl species. Wildfowl 46: 76-88.
Tamisier, A. and O. Dehorter. 1999. Camargue, Canards et Foulques. Fonctionnement et Devenir d’un Pres-tigieux Quartier d’Hiver. Centre Ornithologique du Gard, Nîmes, France.
Tamisier, A. and P. Grillas. 1994. A review of habitat changes in the Camargue an assessment of the ef-fects of the loss of biological diversity on the winter-ing waterfowl community. Biological Conservation 70: 39-47.
Tourenq, C., R. E. Bennetts, H. Kowalski, E. Vialet, J. L. Lucchesi, Y. Kayser and P. Isenmann. 2001. Are ricefields a good alternative to natural marshes for waterbird communities in the Camargue, southern France? Biological Conservation 100: 335-343.

SU
PPL
EM
EN
TA
RY
INFO
RM
AT
ION
Tab
le S
1. R
elat
ive
freq
uenc
y of
occ
urre
nce
(Ro)
and
ave
rage
rel
ativ
e dr
y w
eigh
t (R
w)
of f
ood
item
s pr
esen
t in
gul
let
(bot
h ex
pres
sed
in %
), f
or M
alla
rd (
n =
119)
and
Tea
l (n
= 30
2) (
see
text
: ‘St
atis
tica
l ana
lyse
s’ s
ecti
on).
Abb
revi
atio
n
Rel
ativ
e fr
eque
ncy
of o
ccur
ren
ce (
%)
Ave
rage
rel
ativ
e dr
y w
eigh
t (%
)
Mal
lard
Teal
Mal
lard
Teal
Inve
rteb
rate
1A
rach
nid
aH
ydra
chn
ella
eH
YDR
A6.
3<0
.12
Bry
ozoa
Bry
ozoa
(st
atob
last
)B
RY(
S)0.
82.
7<0
.1<0
.1
Cru
stac
ea3
- Am
phip
oda
Cor
oph
iidae
CO
RO
1.7
1.3
0.1
<0.1
4G
amm
arid
aeG
AM
M1.
3<0
.15
- Cla
doce
raC
lado
cera
(ep
hip
pia)
CL
A(E
)0.
812
.6<0
.1<0
.16
- Iso
poda
Cya
thur
a ca
rina
ta
CYA
CA
R5.
01.
57
Idot
ea s
p.ID
ESP
0.3
<0.1
8Sp
haer
oma
hock
erii
SPH
HO
O1.
70.
71.
50.
39
Ost
raco
daO
stra
coda
OST
R0.
825
.5<0
.11.
4
Inse
cta
10- C
oleo
pter
aD
ytis
cida
e (a
dult
)D
YS(A
)0.
8<0
.111
Hal
iplid
ae (
larv
ae)
HA
L(L
)2.
0<0
. 112
Hyd
roph
ilida
e (l
arva
e)H
YD(L
)7.
60.
313
Not
erid
ae (
larv
ae)
NO
T(L
)0.
7<0
.114
Oth
er C
oleo
pter
a (a
dult
an
d la
rvae
)C
OL
(A, L
)6.
79.
60.
10.
215
- Dip
tera
Cer
atop
ogon
idae
(la
rvae
)C
ER
(L)
12.3
1.0
16C
hir
onom
idae
(la
rvae
)C
HI(
L)
17.6
1.8
17E
phyd
rida
e (l
arva
e)E
PH(L
)0.
82.
3<0
.10.
318
Psyc
hod
idae
(la
rvae
)PS
Y(L
)5.
6<0
.119
Rh
agio
nid
ae (
larv
ae)
RH
A(L
)0.
7<0
.120
Stra
tiom
yida
e (l
arva
e)ST
R(L
)2.
3<0
.121
Syrp
hid
ae (
larv
ae)
SYR
(L)
2.3
0.2
22Ta
ban
idae
(la
rvae
)T
AB
(L)
1.0
<0.1
23T
ipul
idae
(la
rvae
)T
IP(L
)0.
80.
3<0
.1<0
.124
Oth
er D
ipte
ra (
adul
t, n
ymph
an
d la
rvae
)D
IP(A
, N, L
)1.
712
.9<0
.10.
225
- Het
erop
tera
Cor
ixid
ae (
adul
t)C
OR
(A)
2.5
4.6
<0.1
<0.1
26M
icro
velia
sp.
(ad
ult)
MIC
(A)
0.7
<0.1
a intr
oduc
ed p
lan
t spe
cies
in F
ran
ce, a
ccor
din
g to
Mar
not
te e
t al.
(200
6) a
nd
Flor
a E
urop
aea
(Roy
al B
otan
ic G
arde
n E
din
burg
h 2
011)
b cul
tiva
ted
plan
t spe
cies

T
able
S1.
(C
onti
nued
) R
elat
ive
freq
uenc
y of
occ
urre
nce
(Ro)
and
ave
rage
rel
ativ
e dr
y w
eigh
t (R
w)
of f
ood
item
s pr
esen
t in
gul
let
(bot
h ex
pres
sed
in %
), f
or M
alla
rd (
n =
119)
an
d T
eal (
n =
302)
(se
e te
xt: ‘
Stat
isti
cal a
naly
ses’
sec
tion
).
Abb
revi
atio
n
Rel
ativ
e fr
eque
ncy
of o
ccur
ren
ce (
%)
Ave
rage
rel
ativ
e dr
y w
eigh
t (%
)
Mal
lard
Teal
Mal
lard
Teal
27N
auco
rida
e (a
dult
)N
AU
C(A
)0.
8<0
.128
Plei
dae
(adu
lt)
PLE
(A)
0.3
<0.1
29O
ther
Het
erop
tera
(ad
ult)
HE
TE
(A)
0.3
<0.1
30- M
egal
opte
raM
egal
opte
ra (
larv
ae)
ME
G(L
)0.
80.
3<0
.1<0
.131
- Odo
nat
aA
nis
opte
ra (
larv
ae)
AN
I(L
)6.
60.
432
Zyg
opte
ra (
larv
ae)
ZYG
(L)
0.7
0.2
33O
ther
Odo
nat
a (l
arva
e)O
DO
(L)
7.6
7.0
<0.1
0.2
Mol
lusc
a34
- Bilv
alvi
aC
eras
tode
rma
edul
eC
ER
ED
U0.
80.
835
- Gas
tero
poda
Phys
idae
PHYS
25.2
34.8
0.2
5.1
36Pl
anor
bida
ePL
AN
31.1
34.8
1.1
3.8
37O
ther
Gas
tero
poda
GA
ST8.
47.
60.
9<0
.138
Plat
yhel
min
thes
Turb
elar
iaT
UR
BE
4.6
<0.1
39Pr
otoz
oaFo
ram
inif
era
FOR
A0.
3<0
.140
Un
dete
rmin
edU
nde
term
ined
inve
rteb
rate
IND
I1.
73.
6<0
.1<0
.1Se
eds
41A
lism
atac
eae
Alis
ma
plan
tago
-aqu
atic
aA
LIP
LA
0.7
<0.1
42A
mar
anth
acea
eA
mar
anth
us d
eflex
us a
AM
AD
EF
0.3
<0.1
43A
ster
acea
eA
ster
acea
e sp
.A
STE
SP0.
8<0
.144
Cal
litri
chac
eae
Cal
litri
che
sp.
CA
LSP
0.3
<0.1
45C
aryo
phyl
lace
aeSp
ergu
lari
a m
arin
aSP
EM
AR
0.3
<0.1
46C
har
acea
eC
hara
sp.
CH
ASP
4.2
36.4
<0.1
6.0
47C
hen
opod
iace
aeA
rthr
ocne
mum
gla
ucum
AR
TG
LA
1.7
<0.1
48A
trip
lex
pros
trat
aA
TR
PRO
0.8
<0.1
49C
heno
podi
um s
p.C
HE
SP0.
7<0
.150
Koc
hia
hirs
uta
KO
CH
IR0.
3<0
.151
Salic
orni
a sp
.SA
LSP
0.8
6.0
0.8
2.2
52Sa
lsol
a so
daSA
LSO
D1.
0<0
.153
Suae
da s
p.SU
ASP
2.5
12.9
0.2
3.6
54C
ompo
sita
eH
elia
nthu
s an
nuus
bH
EL
AN
U0.
8<0
.155
Inul
a sp
.IN
USP
11.6
0.8
56C
ruci
fera
eB
rass
ica
sp.
BR
ASP
0.3
<0.1
a intr
oduc
ed p
lan
t spe
cies
in F
ran
ce, a
ccor
din
g to
Mar
not
te e
t al.
(200
6) a
nd
Flor
a E
urop
aea
(Roy
al B
otan
ic G
arde
n E
din
burg
h 2
011)
b cul
tiva
ted
plan
t spe
cies
Tab
le S
1. (
Con
tinu
ed)
Rel
ativ
e fr
eque
ncy
of o
ccur
renc
e (R
o) a
nd a
vera
ge r
elat
ive
dry
wei
ght
(Rw
) of
foo
d it
ems
pres
ent
in g
ulle
t (b
oth
expr
esse
d in
%),
for
Mal
lard
(n
= 11
9)
and
Tea
l (n
= 30
2) (
see
text
: ‘St
atis
tica
l ana
lyse
s’ s
ecti
on).
Abb
revi
atio
n
Rel
ativ
e fr
eque
ncy
of o
ccur
ren
ce (
%)
Ave
rage
rel
ativ
e dr
y w
eigh
t (%
)
Mal
lard
Teal
Mal
lard
Teal
57C
yper
acea
eC
arex
sp.
CA
RSP
1.7
<0.1
58C
yper
us d
iffor
mis
CYP
DIF
6.0
1.2
59El
eoch
aris
pal
ustr
isE
LE
PAL
6.7
19.9
0.4
2.9
60El
eoch
aris
sp.
EL
ESP
4.0
0.3
61Sc
hoen
ople
ctus
muc
rona
tus
SCH
MU
C10
.913
.90.
31.
062
Scir
pus
mar
itim
usSC
IMA
R29
.448
.75.
817
.363
Scir
pus
tabe
rnae
mon
tani
SCIT
AB
0.3
<0.1
64O
ther
Cyp
erac
eae
sp.
CYP
ESP
0.8
<0.1
65Fa
bace
aeFa
bace
aeFA
BSP
1.0
<0.1
66H
alor
agac
eae
Myr
ioph
yllu
m s
pica
tum
MYR
SPI
5.9
9.6
0.8
2.1
67Ju
nca
ceae
Junc
us s
p.JU
NSP
0.8
9.6
<0.1
<0.1
68L
abia
tae
Lyc
opus
eur
opae
usL
YCE
UR
2.5
1.0
<0.1
<0.1
69L
egum
inos
aeTr
ifoliu
m s
p.T
RIS
P0.
82.
3<0
.1<0
.170
Vici
a sp
.V
ICSP
0.7
<0.1
71L
emn
acea
eL
emna
sp.
LE
MSP
0.3
<0.1
72M
alva
ceae
Alth
aea
offic
inal
isA
LTO
FF0.
8<0
.173
Naj
adac
eae
Naj
as in
dica
NA
JIN
D6.
715
.60.
20.
674
Naj
as m
arin
aN
AJM
AR
0.3
<0.1
75N
ajas
min
orN
AJM
IN4.
218
.2<0
.10.
876
Oth
er N
ajas
sp.
NA
JSP
2.0
<0.1
77O
nag
race
aeL
udw
igia
pep
loid
es a
LU
DPE
P4.
213
.30.
71.
978
Papa
vera
ceae
Papa
ver
sp.
PAPS
P0.
3<0
.179
Poac
eae
Dig
itari
a sa
ngui
nalis
DIG
SAN
0.7
<0.1
80Ec
hino
chlo
a sp
.E
CH
SP58
.032
.822
.214
.081
Eleu
sine
indi
ca a
EL
UIN
D0.
8<0
.182
Erag
rost
is s
p.E
RA
SP0.
3<0
.183
Fest
uca
arun
dina
cea
FESA
RU
0.8
1.0
<0.1
<0.1
84L
eers
ia o
ryzo
ides
LE
EO
RY
4.3
0.2
85M
ilium
sp.
bM
ILSP
2.5
4.6
0.4
1.9
86O
ryza
sat
iva
(an
d «
rece
ptac
le »
) a,
bO
RYS
AT
(E)
53.8
28.8
35.1
8.5
87Pa
nicu
m s
p.PA
NSP
0.3
<0.1
88Pa
spal
um d
istic
hum
aPA
SDIS
2.5
10.6
<0.1
1.2
89Ph
ragm
ites
aust
ralis
PHR
AU
S17
.60.
8a in
trod
uced
pla
nt s
peci
es in
Fra
nce
, acc
ordi
ng
to M
arn
otte
et a
l. (2
006)
an
d Fl
ora
Eur
opae
a (R
oyal
Bot
anic
Gar
den
Edi
nbu
rgh
201
1)b c
ulti
vate
d pl
ant s
peci
es

T
able
S1.
(C
onti
nued
) R
elat
ive
freq
uenc
y of
occ
urre
nce
(Ro)
and
ave
rage
rel
ativ
e dr
y w
eigh
t (R
w)
of f
ood
item
s pr
esen
t in
gul
let
(bot
h ex
pres
sed
in %
), f
or M
alla
rd (
n =
119)
an
d T
eal (
n =
302)
(se
e te
xt: ‘
Stat
isti
cal a
naly
ses’
sec
tion
).
Abb
revi
atio
n
Rel
ativ
e fr
eque
ncy
of o
ccur
ren
ce (
%)
Ave
rage
rel
ativ
e dr
y w
eigh
t (%
)
Mal
lard
Teal
Mal
lard
Teal
90Po
lypo
gon
sp.
POL
YSP
1.7
0.3
91Se
tari
a pu
mila
SET
PUM
0.3
<0.1
92Se
tari
a ve
rtic
illat
aSE
TV
ER
4.2
2.0
<0.1
<0.1
93Se
tari
a vi
ridi
sSE
TV
IR0.
81.
7<0
.1<0
.194
Sorg
hum
sp.
a, b
SOR
SP2.
52.
70.
71.
195
Triti
cum
aes
tivum
bT
RIA
ES
7.6
5.0
5.4
2.8
96Ze
a m
ays
a, b
ZE
AM
AY
1.7
0.9
97O
ther
Poa
ceae
sp.
POA
SP2.
50.
7<0
.1<0
.198
Poly
gon
acea
eFa
llopi
a co
nvol
vulu
sFA
LC
ON
0.8
0.7
<0.1
<0.1
99Po
lygo
num
avi
cula
rePO
LA
VI
3.0
<0.1
100
Poly
gonu
m la
path
ifoliu
mPO
LL
AP
8.4
9.0
<0.1
0.9
101
Poly
gonu
m p
ersi
cari
aPO
LPE
R4.
25.
00.
10.
310
2O
ther
Pol
ygon
um s
p.PO
LSP
7.6
1.7
103
Rum
ex s
p.R
UM
SP5.
00.
7<0
.1<0
.110
4Po
nte
deri
acea
eH
eter
anth
era
limos
a a
HE
TL
IM1.
7<0
.110
5H
eter
anth
era
reni
form
is a
HE
TR
EN
2.5
12.0
<0.1
0.4
106
Pota
mog
eton
acea
ePo
tam
oget
on n
odos
usPO
TN
OD
10.1
3.6
4.1
0.2
107
Pota
mog
eton
pec
tinat
usPO
TPE
C6.
73.
61.
80.
410
8Po
tam
oget
on p
usill
usPO
TPU
S24
.441
.47.
27.
910
9R
anun
cula
ceae
Ran
uncu
lus
sp.
RA
NSP
0.8
12.9
<0.1
0.2
110
Ros
acea
eR
ubus
sp.
RU
BSP
2.5
4.0
0.3
0.6
111
Rub
iace
aeG
aliu
m s
p.G
AL
ISP
0.8
<0.1
112
Rup
piac
eae
Rup
pia
cirr
hosa
RU
PCIR
0.7
<0.1
113
Rup
pia
mar
itim
aR
UPM
AR
0.8
2.3
0.5
0.4
114
Sola
nac
eae
Sola
num
sp.
SOL
SP0.
81.
0<0
.1<0
.111
5V
itac
eae
Vitis
vin
ifera
b V
ITV
IN0.
8<0
.111
6Z
ann
ich
ellia
ceae
Zann
iche
llia
sp.
ZA
NSP
2.5
13.6
1.3
0.5
117
Zos
tera
ceae
Zost
era
nolti
i Z
OSN
OL
2.5
0.7
1.7
0.3
118
Un
dete
rmin
edU
nide
ntifi
ed s
eed
IND
S3.
42.
00.
7<0
.1Ve
geta
tive
par
t
119
Pota
mog
eton
acea
ePo
tam
oget
on p
ectin
atus
POT
PEC
(V)
0.7
<0.1
120
Un
dete
rmin
edU
ndet
erm
ined
IN
DV
1.7
0.3
<0.1
<0.1
a intr
oduc
ed p
lan
t spe
cies
in F
ran
ce, a
ccor
din
g to
Mar
not
te e
t al.
(200
6) a
nd
Flor
a E
urop
aea
(Roy
al B
otan
ic G
arde
n E
din
burg
h 2
011)
b cul
tiva
ted
plan
t spe
cies
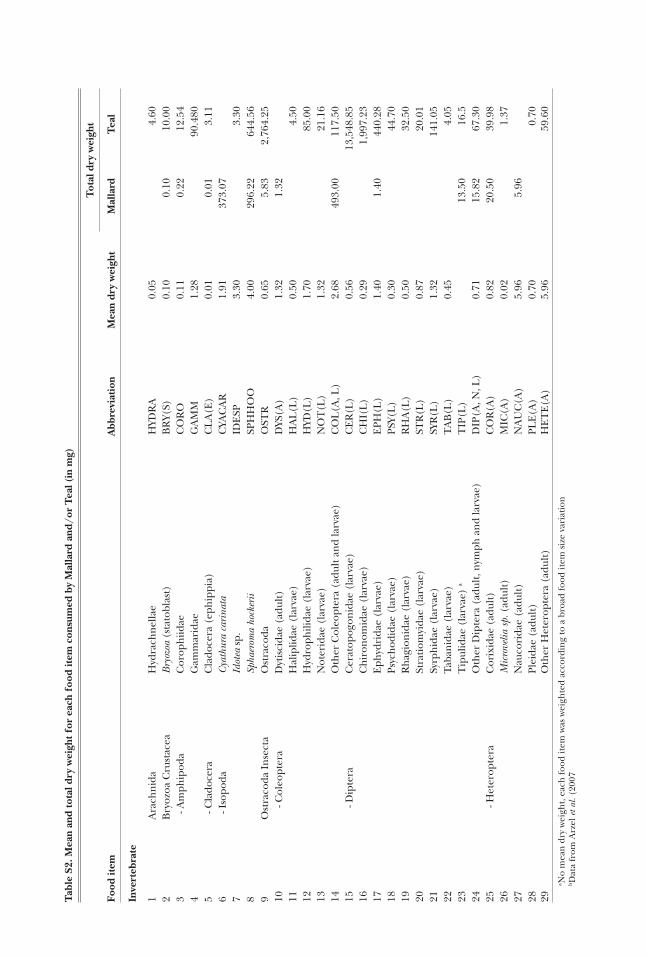
T
able
S2.
Mea
n an
d to
tal d
ry w
eigh
t for
eac
h fo
od it
em c
onsu
med
by
Mal
lard
and
/or
Tea
l (in
mg)
Food
item
Abb
revi
atio
nM
ean
dry
wei
ght
Tot
al d
ry w
eigh
t
Mal
lard
Tea
l
Inve
rteb
rate
1A
rach
nid
aH
ydra
chn
ella
eH
YDR
A0.
054.
602
Bry
ozoa
Cru
stac
eaB
ryoz
oa (
stat
obla
st)
BR
Y(S)
0.10
0.10
10.0
03
- Am
phip
oda
Cor
oph
iidae
CO
RO
0.11
0.22
12.5
44
Gam
mar
idae
GA
MM
1.28
90.4
805
- Cla
doce
raC
lado
cera
(ep
hip
pia)
CL
A(E
)0.
010.
013.
116
- Iso
poda
Cya
thur
a ca
rina
ta
CYA
CA
R1.
9137
3.07
7Id
otea
sp.
IDE
SP3.
303.
308
Spha
erom
a ho
cker
iiSP
HH
OO
4.00
296.
2264
4.56
9O
stra
coda
In
sect
aO
stra
coda
OST
R0.
655.
832,
764.
2510
- Col
eopt
era
Dyt
isci
dae
(adu
lt)
DYS
(A)
1.32
1.32
11H
alip
lidae
(la
rvae
)H
AL
(L)
0.50
4.50
12H
ydro
phili
dae
(lar
vae)
HYD
(L)
1.70
85.0
013
Not
erid
ae (
larv
ae)
NO
T(L
)1.
3221
.16
14O
ther
Col
eopt
era
(adu
lt a
nd
larv
ae)
CO
L(A
, L)
2.68
493.
0011
7.50
15- D
ipte
raC
erat
opog
onid
ae (
larv
ae)
CE
R(L
)0.
5613
,548
.85
16C
hir
onom
idae
(la
rvae
)C
HI(
L)
0.29
1,99
7.23
17E
phyd
rida
e (l
arva
e)E
PH(L
)1.
401.
4044
0.28
18Ps
ych
odid
ae (
larv
ae)
PSY(
L)
0.30
44.7
019
Rh
agio
nid
ae (
larv
ae)
RH
A(L
)0.
5032
.50
20St
rati
omyi
dae
(lar
vae)
STR
(L)
0.87
20.0
121
Syrp
hid
ae (
larv
ae)
SYR
(L)
1.32
141.
0522
Taba
nid
ae (
larv
ae)
TA
B(L
)0.
454.
0523
Tip
ulid
ae (
larv
ae)
aT
IP(L
)13
.50
16.5
24O
ther
Dip
tera
(ad
ult,
nym
ph a
nd
larv
ae)
DIP
(A, N
, L)
0.71
15.8
267
.30
25- H
eter
opte
raC
orix
idae
(ad
ult)
CO
R(A
)0.
8220
.50
39.9
826
Mic
rove
lia s
p. (
adul
t)M
IC(A
)0.
021.
3727
Nau
cori
dae
(adu
lt)
NA
UC
(A)
5.96
5.96
28Pl
eida
e (a
dult
)PL
E(A
)0.
700.
7029
Oth
er H
eter
opte
ra (
adul
t)H
ET
E(A
)5.
9659
.60
a No
mea
n d
ry w
eigh
t, ea
ch fo
od it
em w
as w
eigh
ted
acco
rdin
g to
a b
road
food
item
siz
e va
riat
ion
b Dat
a fr
om A
rzel
et a
l. (2
007
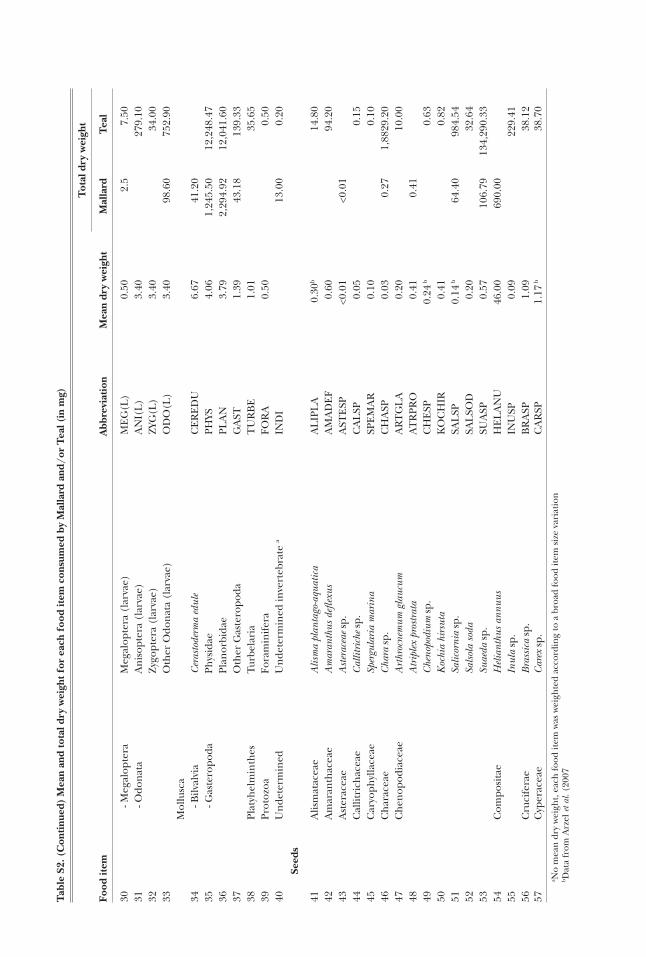
T
able
S2.
(C
onti
nued
) M
ean
and
tota
l dry
wei
ght f
or e
ach
food
item
con
sum
ed b
y M
alla
rd a
nd/o
r T
eal (
in m
g)
Food
item
Abb
revi
atio
nM
ean
dry
wei
ght
Tot
al d
ry w
eigh
t
Mal
lard
Tea
l
30- M
egal
opte
raM
egal
opte
ra (
larv
ae)
ME
G(L
)0.
502.
57.
5031
- Odo
nat
aA
nis
opte
ra (
larv
ae)
AN
I(L
)3.
4027
9.10
32Z
ygop
tera
(la
rvae
)Z
YG(L
)3.
4034
.00
33O
ther
Odo
nat
a (l
arva
e)O
DO
(L)
3.40
98.6
075
2.90
Mol
lusc
a34
- Bilv
alvi
aC
eras
tode
rma
edul
eC
ER
ED
U6.
6741
.20
35- G
aste
ropo
daPh
ysid
aePH
YS4.
061,
245.
5012
,248
.47
36Pl
anor
bida
ePL
AN
3.79
2,29
4.92
12,0
41.6
037
Oth
er G
aste
ropo
daG
AST
1.39
43.1
813
9.33
38Pl
atyh
elm
inth
esTu
rbel
aria
TU
RB
E1.
0135
.65
39Pr
otoz
oaFo
ram
inif
era
FOR
A0.
500.
5040
Un
dete
rmin
edU
nde
term
ined
inve
rteb
rate
aIN
DI
13.0
00.
20Se
eds
41A
lism
atac
eae
Alis
ma
plan
tago
-aqu
atic
aA
LIP
LA
0.30
b14
.80
42A
mar
anth
acea
eA
mar
anth
us d
eflex
usA
MA
DE
F0.
6094
.20
43A
ster
acea
eA
ster
acea
e sp
.A
STE
SP<0
.01
<0.0
144
Cal
litri
chac
eae
Cal
litri
che
sp.
CA
LSP
0.05
0.15
45C
aryo
phyl
lace
aeSp
ergu
lari
a m
arin
aSP
EM
AR
0.10
0.10
46C
har
acea
eC
hara
sp.
CH
ASP
0.03
0.27
1,88
29.2
047
Ch
enop
odia
ceae
Art
hroc
nem
um g
lauc
umA
RT
GL
A0.
2010
.00
48A
trip
lex
pros
trat
aA
TR
PRO
0.41
0.41
49C
heno
podi
um s
p.C
HE
SP0.
24 b
0.63
50K
ochi
a hi
rsut
aK
OC
HIR
0.41
0.82
51Sa
licor
nia
sp.
SAL
SP0.
14 b
64.4
098
4.54
52Sa
lsol
a so
daSA
LSO
D0.
2032
.64
53Su
aeda
sp.
SUA
SP0.
5710
6.79
134,
290.
3354
Com
posi
tae
Hel
iant
hus
annu
usH
EL
AN
U46
.00
690.
0055
Inul
a sp
.IN
USP
0.09
229.
4156
Cru
cife
rae
Bra
ssic
a sp
.B
RA
SP1.
0938
.12
57C
yper
acea
eC
arex
sp.
CA
RSP
1.17
b38
.70
a No
mea
n d
ry w
eigh
t, ea
ch fo
od it
em w
as w
eigh
ted
acco
rdin
g to
a b
road
food
item
siz
e va
riat
ion
b Dat
a fr
om A
rzel
et a
l. (2
007

Tab
le S
2. (
Con
tinu
ed)
Mea
n an
d to
tal d
ry w
eigh
t for
eac
h fo
od it
em c
onsu
med
by
Mal
lard
and
/or
Tea
l (in
mg)
Food
item
Abb
revi
atio
nM
ean
dry
wei
ght
Tot
al d
ry w
eigh
t
Mal
lard
Tea
l
58C
yper
us d
iffor
mis
CYP
DIF
0.04
269.
1459
Eleo
char
is p
alus
tris
EL
EPA
L0.
57 b
196.
9760
1.51
60El
eoch
aris
sp.
EL
ESP
0.27
143,
604.
6961
Scho
enop
lect
us m
ucro
natu
sSC
HM
UC
1.00
209.
4741
5.00
62Sc
irpu
s m
ariti
mus
SCIM
AR
3.29
b1,
026.
035,
038.
2963
Scir
pus
tabe
rnae
mon
tani
SCIT
AB
0.30
b0.
3064
Oth
er C
yper
acea
e sp
.C
YPE
SP0.
800.
8065
Faba
ceae
Faba
ceae
aFA
BSP
85.7
066
Hal
orag
acea
eM
yrio
phyl
lum
spi
catu
mM
YRSP
I0.
9720
.39
62.0
867
Jun
cace
aeJu
ncus
sp.
JUN
SP0.
03 b
0.03
89.8
868
Lab
iata
eL
ycop
us e
urop
aeus
LYC
EU
R0.
16 b
7.41
33.8
169
Leg
umin
osae
Trifo
lium
sp.
TR
ISP
0.38
238.
877.
5270
Vici
a sp
.V
ICSP
2.10
4.20
71L
emn
acea
eL
emna
sp.
LE
MSP
0.20
56.0
072
Mal
vace
aeA
lthae
a of
ficin
alis
ALT
OFF
0.60
1.80
73N
ajad
acea
eN
ajas
indi
caN
AJI
ND
0.40
929.
121,
744.
0074
Naj
as m
arin
aN
AJM
AR
7.79
7.79
75N
ajas
min
orN
AJM
IN0.
1510
7.09
1,19
8.35
76O
ther
Naj
as s
p.N
AJS
P0.
032.
3777
On
agra
ceae
Lud
wig
ia p
eplo
ides
LU
DPE
P0.
4511
9.71
690.
6178
Papa
vera
ceae
Papa
ver
sp.
PAPS
P0.
050.
0579
Poac
eae
Dig
itari
a sa
ngui
nalis
DIG
SAN
6.30
18.9
080
Echi
noch
loa
sp.
EC
HSP
4.38
197,
526.
9214
3,60
4.69
81El
eusi
ne in
dica
EL
UIN
D0.
162.
5082
Erag
rost
is s
p.E
RA
SP0.
150.
4583
Fest
uca
arun
dina
cea
FESA
RU
1.55
4.65
7.75
84L
eers
ia o
ryzo
ides
LE
EO
RY
0.89
b17
6.12
85M
ilium
sp.
MIL
SP3.
74 b
2,05
4.25
18,3
05.2
486
Ory
za s
ativ
a O
RYS
AT
(E)
15.0
027
3,85
5.00
59,5
20.9
087
Pani
cum
sp.
PAN
SP4.
909.
80a N
o m
ean
dry
wei
ght,
each
food
item
was
wei
ghte
d ac
cord
ing
to a
bro
ad fo
od it
em s
ize
vari
atio
nb D
ata
from
Arz
el e
t al.
(200
7
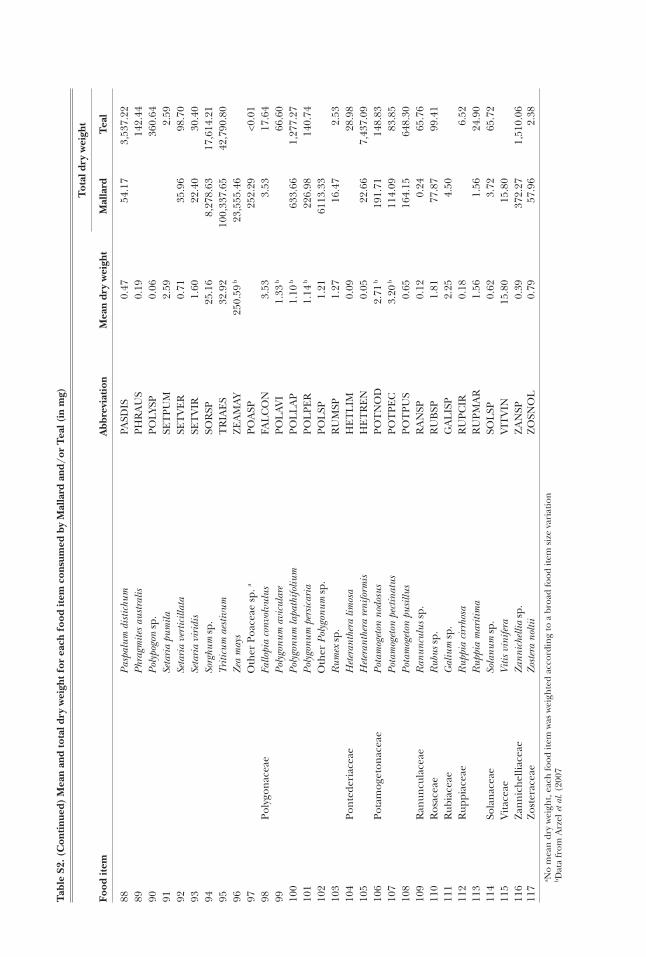
T
able
S2.
(C
onti
nued
) M
ean
and
tota
l dry
wei
ght f
or e
ach
food
item
con
sum
ed b
y M
alla
rd a
nd/o
r T
eal (
in m
g)
Food
item
Abb
revi
atio
nM
ean
dry
wei
ght
Tot
al d
ry w
eigh
t
Mal
lard
Tea
l
88Pa
spal
um d
istic
hum
PASD
IS0.
4754
.17
3,53
7.22
89Ph
ragm
ites
aust
ralis
PHR
AU
S0.
1914
2.44
90Po
lypo
gon
sp.
POL
YSP
0.06
360.
6491
Seta
ria
pum
ilaSE
TPU
M2.
592.
5992
Seta
ria
vert
icill
ata
SET
VE
R0.
7135
.96
98.7
093
Seta
ria
viri
dis
SET
VIR
1.60
22.4
030
.40
94So
rghu
m s
p.
SOR
SP25
.16
8,27
8.63
17,6
14.2
195
Triti
cum
aes
tivum
T
RIA
ES
32.9
210
0,33
7.65
42,7
90.8
096
Zea
may
s Z
EA
MA
Y25
0.59
b23
,555
.46
97O
ther
Poa
ceae
sp.
aPO
ASP
252.
29<0
.01
98Po
lygo
nac
eae
Fallo
pia
conv
olvu
lus
FAL
CO
N3.
533.
5317
.64
99Po
lygo
num
avi
cula
rePO
LA
VI
1.33
b66
.60
100
Poly
gonu
m la
path
ifoliu
mPO
LL
AP
1.10
b63
3.66
1,27
7.27
101
Poly
gonu
m p
ersi
cari
aPO
LPE
R1.
14 b
226.
9814
0.74
102
Oth
er P
olyg
onum
sp.
POL
SP1.
2161
13.3
310
3R
umex
sp.
RU
MSP
1.27
16.4
72.
5310
4Po
nte
deri
acea
eH
eter
anth
era
limos
a H
ET
LIM
0.09
28.9
810
5H
eter
anth
era
reni
form
is
HE
TR
EN
0.05
22.6
67,
437.
0910
6Po
tam
oget
onac
eae
Pota
mog
eton
nod
osus
POT
NO
D2.
71 b
191.
7114
8.83
107
Pota
mog
eton
pec
tinat
usPO
TPE
C3.
20 b
114.
0983
.85
108
Pota
mog
eton
pus
illus
POT
PUS
0.65
164.
1564
8.30
109
Ran
uncu
lace
aeR
anun
culu
s sp
.R
AN
SP0.
120.
2465
.76
110
Ros
acea
eR
ubus
sp.
RU
BSP
1.81
77.8
799
.41
111
Rub
iace
aeG
aliu
m s
p.G
AL
ISP
2.25
4.50
112
Rup
piac
eae
Rup
pia
cirr
hosa
RU
PCIR
0.18
6.52
113
Rup
pia
mar
itim
aR
UPM
AR
1.56
1.56
24.9
011
4So
lan
acea
eSo
lanu
m s
p.SO
LSP
0.62
3.72
65.7
211
5V
itac
eae
Vitis
vin
ifera
V
ITV
IN15
.80
15.8
011
6Z
ann
ich
ellia
ceae
Zann
iche
llia
sp.
ZA
NSP
0.39
372.
271,
510.
0611
7Z
oste
race
aeZo
ster
a no
ltii
ZO
SNO
L0.
7957
.96
2.38
a No
mea
n d
ry w
eigh
t, ea
ch fo
od it
em w
as w
eigh
ted
acco
rdin
g to
a b
road
food
item
siz
e va
riat
ion
b Dat
a fr
om A
rzel
et a
l. (2
007

Tab
le S
2. (
Con
tinu
ed)
Mea
n an
d to
tal d
ry w
eigh
t for
eac
h fo
od it
em c
onsu
med
by
Mal
lard
and
/or
Tea
l (in
mg)
Food
item
Abb
revi
atio
nM
ean
dry
wei
ght
Tot
al d
ry w
eigh
t
Mal
lard
Tea
l
118
Un
dete
rmin
edU
nide
ntifi
ed s
eed a
IND
S14
4.25
31.8
6Ve
geta
tive
par
t
119
Pota
mog
eton
acea
ePo
tam
oget
on p
ectin
atus
aPO
TPE
C(V
)18
1.44
120
Un
dete
rmin
edU
ndet
erm
ined
aIN
DV
196.
321,
504.
90a N
o m
ean
dry
wei
ght,
each
food
item
was
wei
ghte
d ac
cord
ing
to a
bro
ad fo
od it
em s
ize
vari
atio
nb D
ata
from
Arz
el e
t al.
(200
7